
James Madison University Financial Statements for the year ...contracts on the Duke Hall Renovation,...
42
AUDITED FINANCIAL REPORT FOR THE YEAR ENDED JUNE 30, 2012
Transcript of James Madison University Financial Statements for the year ...contracts on the Duke Hall Renovation,...
AUDITED FINANCIAL REPORT
FOR THE YEAR ENDED
JUNE 30, 2012
JAMES MADISON UNIVERSITY
AUDITED FINANCIAL REPORT 2011 - 2012
TABLE OF CONTENTS
Pages
MANAGEMENT’S DISCUSSION AND ANALYSIS 1-8 FINANCIAL STATEMENTS: Statement of Net Assets 10-11 Statement of Revenues, Expenses, and Changes in Net Assets 13 Statement of Cash Flows 14-15 Notes to Financial Statements 18-37 INDEPENDENT AUDITOR’S REPORT 38-39 UNIVERSITY OFFICIALS 40
(Unaudited) MANAGEMENT’S DISCUSSION AND ANALYSIS
Overview
This Management’s Discussion and Analysis (MD&A) is required supplemental information under the Governmental Accounting Standards Board (GASB) reporting model. It is designed to assist readers in understanding the accompanying financial statements and provides an objective, easily read analysis of James Madison University’s (University) financial activities based on currently known facts, decisions, and conditions. This discussion includes an analysis of the University’s financial condition and results of operations for the fiscal year ended June 30, 2012. Comparative numbers, where presented, are for the fiscal year ending June 30, 2011. Since this presentation includes highly summarized data, it should be read in conjunction with the accompanying financial statements, and notes to financial statements. University management is responsible for all of the financial information presented, including this discussion and analysis.
The financial statements referred to above were prepared in accordance with GASB Statement Number 34, Basic Financial Statements–and Management’s Discussion and Analysis–for State and Local Governments, and GASB Statement Number 35, Basic Financial Statements–and Management’s Discussion and Analysis–for Public Colleges and Universities, as amended by subsequent GASB Statement Numbers 37, 38, and 39. GASB Statement Number 39, Determining Whether Certain Organizations are Component Units addresses which fund-raising, research, or other foundations should be included as component units and how these component units should be displayed in the financial statements. Under Statement Number 39’s standards, the James Madison University Foundation, Inc. (Foundation) meets the criteria and is included as a component unit. The Foundation is presented in a separate column on the University’s financial statements; however, inter-company transactions between the University and the Foundation have not been eliminated. The remainder of this discussion and analysis excludes the Foundation’s financial condition and activities.
The three basic financial statements are the Statement of Net Assets (balance sheet), the Statement of
Revenues, Expenses, and Changes in Net Assets (operating statement), and the Statement of Cash Flows. The following analysis discusses elements from each of these statements, as well as an overview of the University’s activities.
Statement of Net Assets
The Statement of Net Assets (SNA) presents the University’s assets, liabilities, and net assets as of the end of the fiscal year. The purpose of this statement is to present to the financial statement readers a snapshot of the University’s financial position at June 30, 2012. The data presented in the SNA aids in determining the assets available to continue the University’s operations. It also allows readers to determine how much the University owes to vendors and creditors. Finally, the SNA provides a picture of net assets and their availability for expenditure by the University. Sustained increases in net assets are one indicator of an organization’s financial health.
Net assets are divided into three major categories. The first category, “Invested in capital assets, net of related debt,” represents the University’s total investment in capital assets, net of accumulated depreciation and outstanding debt obligations related to those capital assets. Debt incurred, but not yet expended for capital assets, is not included as a component of invested in capital assets, net of related debt. The next category is “restricted net assets,” which is divided into two categories, expendable and non-expendable. Expendable restricted assets include resources the University is legally or contractually obligated to expend in accordance with restrictions imposed by external third parties. Non-expendable restricted net assets consist of
1

endowments and similar type funds where donors or other outside sources have stipulated that, as a condition of the gift instrument, the principal is to be maintained inviolate and in perpetuity, and invested for the purpose of producing present and future income to be expended or added to the principal. Unrestricted net assets represent resources used for the University’s general operations. They may be used at the discretion of the University’s Board of Visitors to meet current expenses for any lawful purpose in support of educational, general, and auxiliary activities.
(In thousands) Statement of Net Assets
Increase (Decrease) 2012 2011 Amount Percent Current assets $ 136,471 $ 143,219 $ (6,748) (4.7%) Noncurrent assets Capital assets, net 795,869 751,407 44,462 5.9% Other noncurrent assets 7,969 25,495 (17,526) (68.7%) Total assets 940,309 920,121 20,188 2.2% Current liabilities 76,327 83,788 (7,461) (8.9%) Noncurrent liabilities 212,811 225,982 (13,171) (5.8%) Total liabilities 289,138 309,770 (20,632) (6.7%) Net assets Invested in capital assets, net of related debt 578,596 528,703 49,893 9.4% Restricted - expendable 3,417 6,255 (2,838) (4.5%) Restricted - nonexpendable - 321 (321) (100%) Unrestricted 69,158 75,072 (5,914) (7.9%) Total net assets $ 651,171 $ 610,351 $ 40,820 6.7%
In 2012, the University’s total assets increased by $20.2 million, mostly attributable to the $44.5 million net increase in capital assets. Significant additions included continuing and completed projects capitalized during the year, including the A3B Biotech building ($18.9 million) and the Bridgeforth Stadium Renovation/Expansion ($4.7 million). Further, increases in construction-in-progress include University Park ($14.9 million). The increase in capital assets is further discussed in the next section of this analysis.
The $6.7 million decrease in current assets primarily relates to the current amounts due from the
Commonwealth, which decreased $7.0 million, mostly due to the completion of the Steam Plant Expansion and various maintenance reserve projects, which were funded via the 21st Century Bond Program. Other non-current assets decreased by $17.5 million, largely due to an $18.3 million decrease in unspent bond proceeds held as restricted cash equivalents, which were used primarily for the University Park project. Current liabilities decreased $7.5 million, including a decrease of $7.7 million for accounts payable and accrued expenses. The decrease in accounts payable and accrued expenses is largely attributable to the timing of construction payments related to the Bridgeforth Stadium Renovation/Expansion, University Park, and the A3B Biotech building.
2
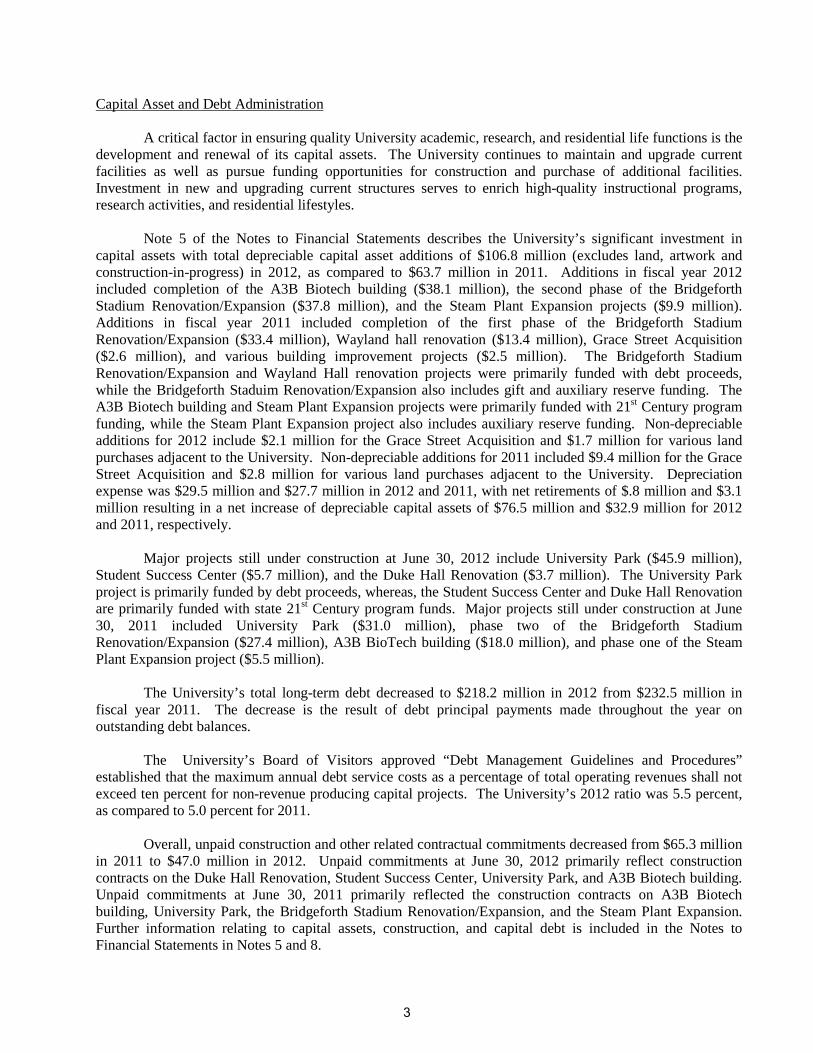
Capital Asset and Debt Administration
A critical factor in ensuring quality University academic, research, and residential life functions is the development and renewal of its capital assets. The University continues to maintain and upgrade current facilities as well as pursue funding opportunities for construction and purchase of additional facilities. Investment in new and upgrading current structures serves to enrich high-quality instructional programs, research activities, and residential lifestyles.
Note 5 of the Notes to Financial Statements describes the University’s significant investment in
capital assets with total depreciable capital asset additions of $106.8 million (excludes land, artwork and construction-in-progress) in 2012, as compared to $63.7 million in 2011. Additions in fiscal year 2012 included completion of the A3B Biotech building ($38.1 million), the second phase of the Bridgeforth Stadium Renovation/Expansion ($37.8 million), and the Steam Plant Expansion projects ($9.9 million). Additions in fiscal year 2011 included completion of the first phase of the Bridgeforth Stadium Renovation/Expansion ($33.4 million), Wayland hall renovation ($13.4 million), Grace Street Acquisition ($2.6 million), and various building improvement projects ($2.5 million). The Bridgeforth Stadium Renovation/Expansion and Wayland Hall renovation projects were primarily funded with debt proceeds, while the Bridgeforth Staduim Renovation/Expansion also includes gift and auxiliary reserve funding. The A3B Biotech building and Steam Plant Expansion projects were primarily funded with 21st Century program funding, while the Steam Plant Expansion project also includes auxiliary reserve funding. Non-depreciable additions for 2012 include $2.1 million for the Grace Street Acquisition and $1.7 million for various land purchases adjacent to the University. Non-depreciable additions for 2011 included $9.4 million for the Grace Street Acquisition and $2.8 million for various land purchases adjacent to the University. Depreciation expense was $29.5 million and $27.7 million in 2012 and 2011, with net retirements of $.8 million and $3.1 million resulting in a net increase of depreciable capital assets of $76.5 million and $32.9 million for 2012 and 2011, respectively.
Major projects still under construction at June 30, 2012 include University Park ($45.9 million),
Student Success Center ($5.7 million), and the Duke Hall Renovation ($3.7 million). The University Park project is primarily funded by debt proceeds, whereas, the Student Success Center and Duke Hall Renovation are primarily funded with state 21st Century program funds. Major projects still under construction at June 30, 2011 included University Park ($31.0 million), phase two of the Bridgeforth Stadium Renovation/Expansion ($27.4 million), A3B BioTech building ($18.0 million), and phase one of the Steam Plant Expansion project ($5.5 million).
The University’s total long-term debt decreased to $218.2 million in 2012 from $232.5 million in fiscal year 2011. The decrease is the result of debt principal payments made throughout the year on outstanding debt balances.
The University’s Board of Visitors approved “Debt Management Guidelines and Procedures”
established that the maximum annual debt service costs as a percentage of total operating revenues shall not exceed ten percent for non-revenue producing capital projects. The University’s 2012 ratio was 5.5 percent, as compared to 5.0 percent for 2011.
Overall, unpaid construction and other related contractual commitments decreased from $65.3 million in 2011 to $47.0 million in 2012. Unpaid commitments at June 30, 2012 primarily reflect construction contracts on the Duke Hall Renovation, Student Success Center, University Park, and A3B Biotech building. Unpaid commitments at June 30, 2011 primarily reflected the construction contracts on A3B Biotech building, University Park, the Bridgeforth Stadium Renovation/Expansion, and the Steam Plant Expansion. Further information relating to capital assets, construction, and capital debt is included in the Notes to Financial Statements in Notes 5 and 8.
3
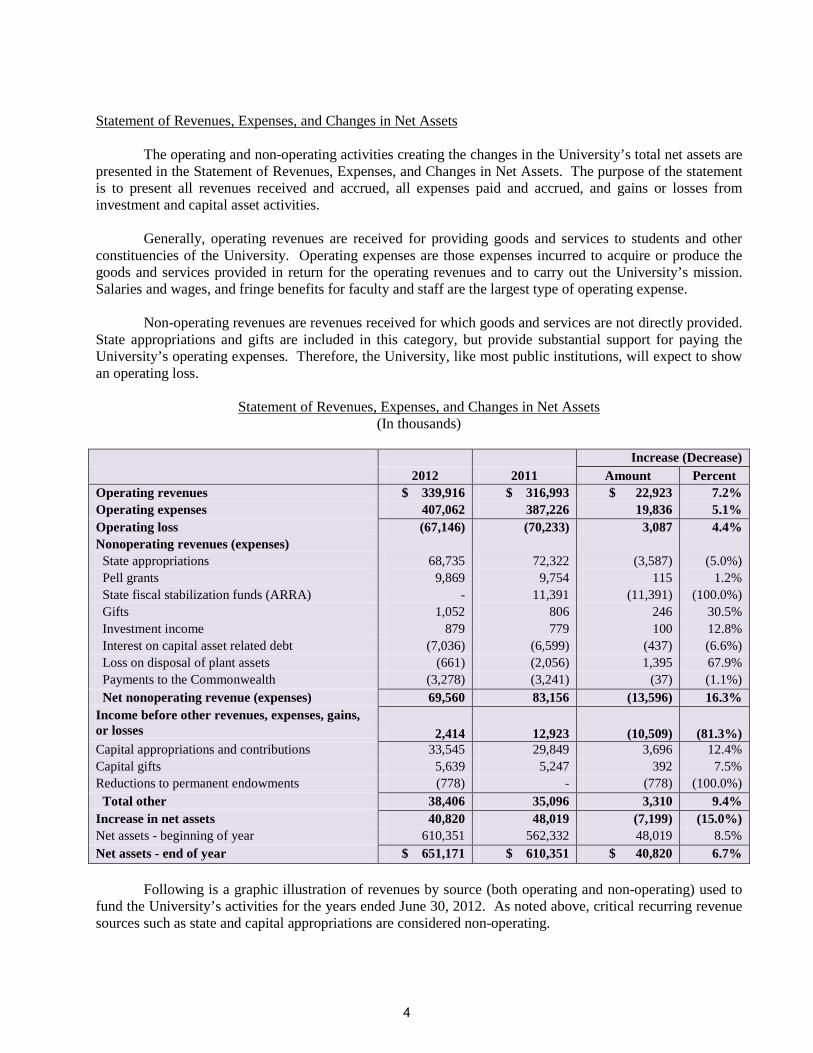
Statement of Revenues, Expenses, and Changes in Net Assets
The operating and non-operating activities creating the changes in the University’s total net assets are presented in the Statement of Revenues, Expenses, and Changes in Net Assets. The purpose of the statement is to present all revenues received and accrued, all expenses paid and accrued, and gains or losses from investment and capital asset activities.
Generally, operating revenues are received for providing goods and services to students and other
constituencies of the University. Operating expenses are those expenses incurred to acquire or produce the goods and services provided in return for the operating revenues and to carry out the University’s mission. Salaries and wages, and fringe benefits for faculty and staff are the largest type of operating expense.
Non-operating revenues are revenues received for which goods and services are not directly provided. State appropriations and gifts are included in this category, but provide substantial support for paying the University’s operating expenses. Therefore, the University, like most public institutions, will expect to show an operating loss.
(In thousands) Statement of Revenues, Expenses, and Changes in Net Assets
Increase (Decrease) 2012 2011 Amount Percent Operating revenues $ 339,916 $ 316,993 $ 22,923 7.2% Operating expenses 407,062 387,226 19,836 5.1% Operating loss (67,146) (70,233) 3,087 4.4% Nonoperating revenues (expenses) State appropriations 68,735 72,322 (3,587) (5.0%) Pell grants 9,869 9,754 115 1.2% State fiscal stabilization funds (ARRA) - 11,391 (11,391) (100.0%) Gifts 1,052 806 246 30.5% Investment income 879 779 100 12.8% Interest on capital asset related debt (7,036) (6,599) (437) (6.6%) Loss on disposal of plant assets (661) (2,056) 1,395 67.9% Payments to the Commonwealth (3,278) (3,241) (37) (1.1%) Net nonoperating revenue (expenses) 69,560 83,156 (13,596) 16.3% Income before other revenues, expenses, gains, or losses 2,414 12,923 (10,509) (81.3%) Capital appropriations and contributions 33,545 29,849 3,696 12.4% Capital gifts 5,639 5,247 392 7.5% Reductions to permanent endowments (778) - (778) (100.0%) Total other 38,406 35,096 3,310 9.4% Increase in net assets 40,820 48,019 (7,199) (15.0%) Net assets - beginning of year 610,351 562,332 48,019 8.5% Net assets - end of year $ 651,171 $ 610,351 $ 40,820 6.7%
Following is a graphic illustration of revenues by source (both operating and non-operating) used to fund the University’s activities for the years ended June 30, 2012. As noted above, critical recurring revenue sources such as state and capital appropriations are considered non-operating.
4
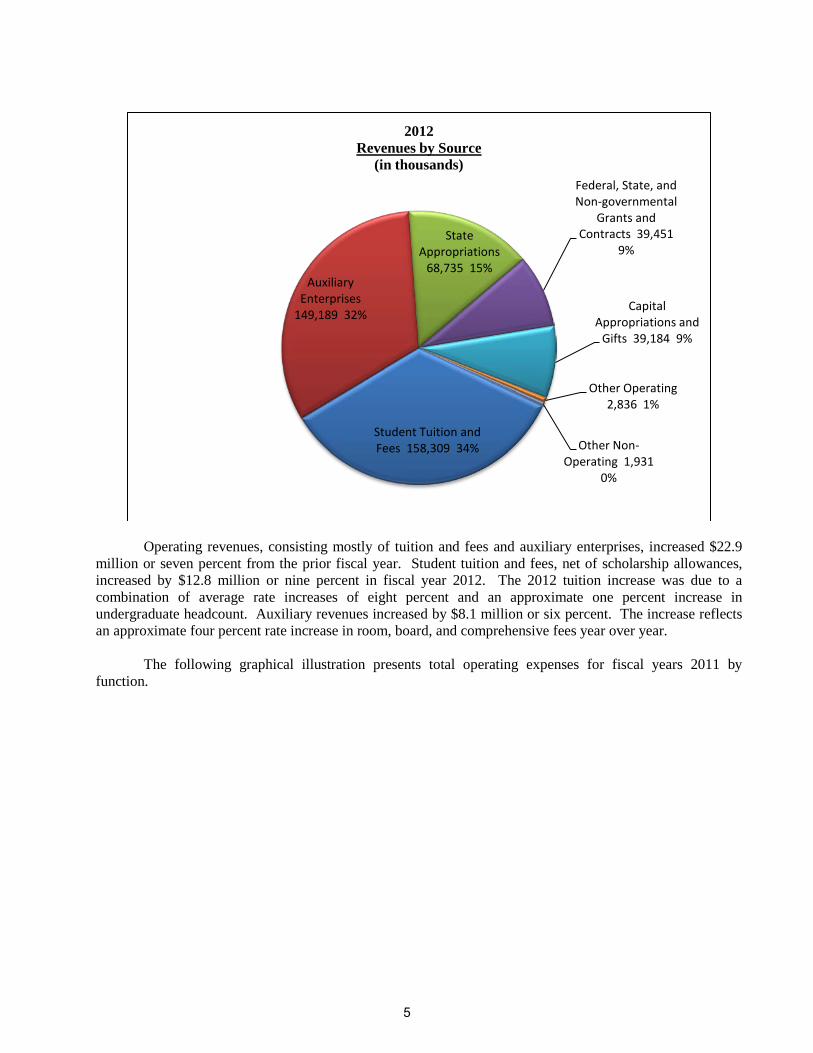
Operating revenues, consisting mostly of tuition and fees and auxiliary enterprises, increased $22.9 million or seven percent from the prior fiscal year. Student tuition and fees, net of scholarship allowances, increased by $12.8 million or nine percent in fiscal year 2012. The 2012 tuition increase was due to a combination of average rate increases of eight percent and an approximate one percent increase in undergraduate headcount. Auxiliary revenues increased by $8.1 million or six percent. The increase reflects an approximate four percent rate increase in room, board, and comprehensive fees year over year.
The following graphical illustration presents total operating expenses for fiscal years 2011 by
function.
Student Tuition and Fees 158,309 34%
Auxiliary Enterprises
149,189 32%
State Appropriations
68,735 15%
Federal, State, and Non-governmental
Grants and Contracts 39,451
9%
Capital Appropriations and
Gifts 39,184 9%
Other Operating 2,836 1%
Other Non-Operating 1,931
0%
2012 Revenues by Source
(in thousands)
5
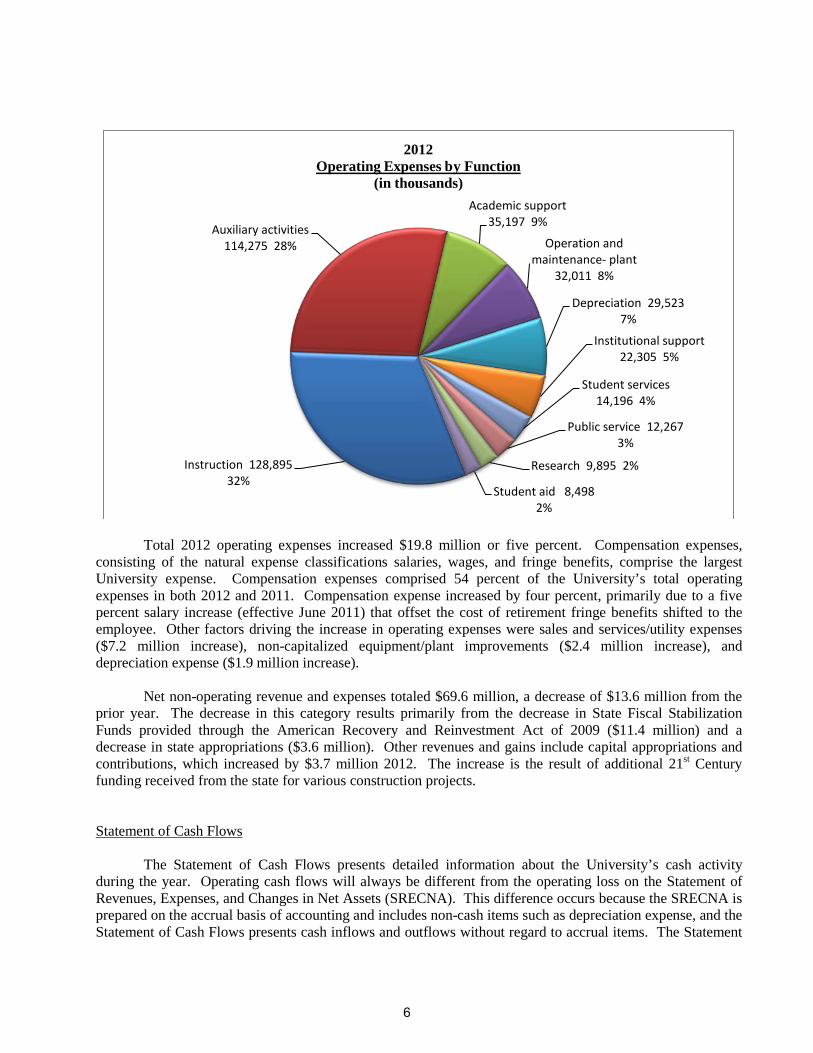
Total 2012 operating expenses increased $19.8 million or five percent. Compensation expenses, consisting of the natural expense classifications salaries, wages, and fringe benefits, comprise the largest University expense. Compensation expenses comprised 54 percent of the University’s total operating expenses in both 2012 and 2011. Compensation expense increased by four percent, primarily due to a five percent salary increase (effective June 2011) that offset the cost of retirement fringe benefits shifted to the employee. Other factors driving the increase in operating expenses were sales and services/utility expenses ($7.2 million increase), non-capitalized equipment/plant improvements ($2.4 million increase), and depreciation expense ($1.9 million increase).
Net non-operating revenue and expenses totaled $69.6 million, a decrease of $13.6 million from the prior year. The decrease in this category results primarily from the decrease in State Fiscal Stabilization Funds provided through the American Recovery and Reinvestment Act of 2009 ($11.4 million) and a decrease in state appropriations ($3.6 million). Other revenues and gains include capital appropriations and contributions, which increased by $3.7 million 2012. The increase is the result of additional 21st Century funding received from the state for various construction projects.
Statement of Cash Flows
The Statement of Cash Flows presents detailed information about the University’s cash activity during the year. Operating cash flows will always be different from the operating loss on the Statement of Revenues, Expenses, and Changes in Net Assets (SRECNA). This difference occurs because the SRECNA is prepared on the accrual basis of accounting and includes non-cash items such as depreciation expense, and the Statement of Cash Flows presents cash inflows and outflows without regard to accrual items. The Statement
Instruction 128,895 32%
Auxiliary activities 114,275 28%
Academic support 35,197 9%
Operation and maintenance- plant
32,011 8%
Depreciation 29,523 7%
Institutional support 22,305 5%
Student services 14,196 4%
Public service 12,267 3%
Research 9,895 2%
Student aid 8,498 2%
2012 Operating Expenses by Function
(in thousands)
6
of Cash Flows assists readers in assessing the ability of an institution to generate future cash flows necessary to meet obligations and evaluate its potential for additional financing.
The statement is divided into five sections. The first section shows the net cash used by the University’s operating activities. The next section reflects the cash flows from non-capital financing activities and includes state appropriations for the University’s educational and general programs and financial aid. This section reflects the cash received and spent for items other than operating, investing, and capital financing purposes. Cash flows from capital financing activities present cash used for the acquisition and construction of capital and related items. The next section shows cash flows related to purchases, proceeds, and interest received from investing activities. The last section reconciles the net cash used by operating activities to the operating loss reflected on the SRECNA.
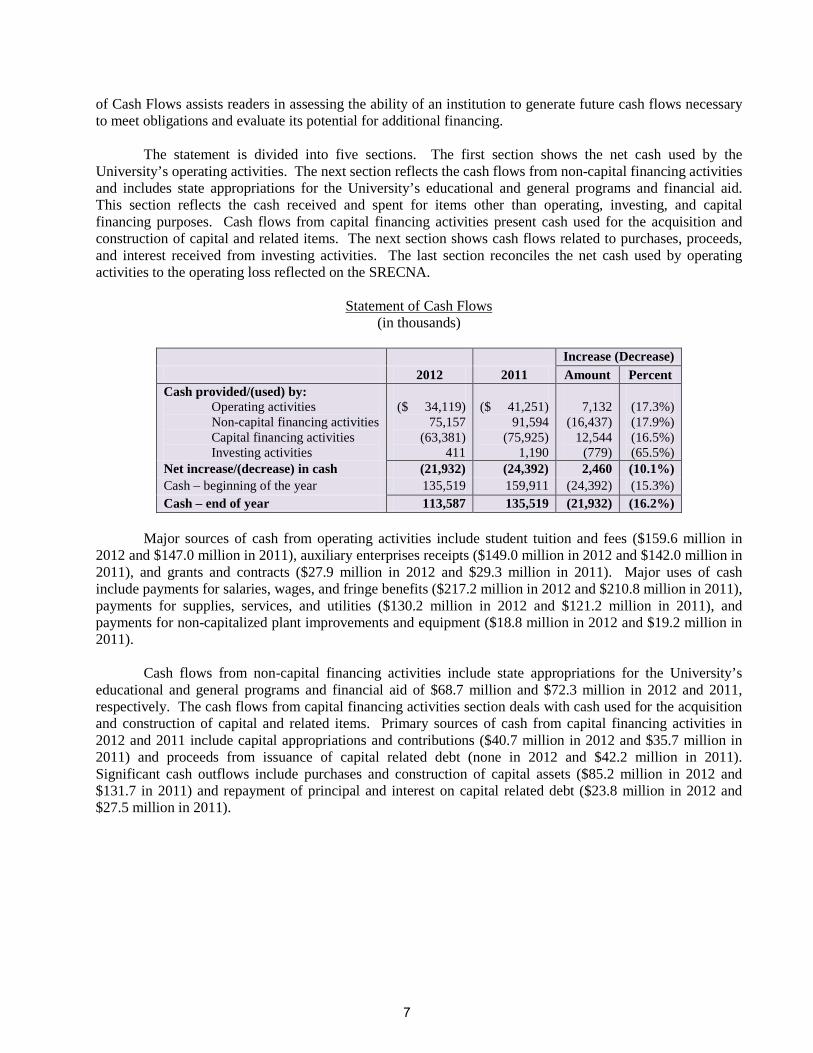
Statement of Cash Flows (in thousands)
Increase (Decrease) 2012 2011 Amount Percent Cash provided/(used) by:
Operating activities Non-capital financing activities Capital financing activities Investing activities
($ 34,119)
75,157 (63,381)
411
($ 41,251)
91,594 (75,925)
1,190
7,132
(16,437) 12,544
(779)
(17.3%) (17.9%) (16.5%) (65.5%)
Net increase/(decrease) in cash (21,932) (24,392) 2,460 (10.1%) Cash – beginning of the year 135,519 159,911 (24,392) (15.3%) Cash – end of year 113,587 135,519 (21,932) (16.2%)
Major sources of cash from operating activities include student tuition and fees ($159.6 million in
2012 and $147.0 million in 2011), auxiliary enterprises receipts ($149.0 million in 2012 and $142.0 million in 2011), and grants and contracts ($27.9 million in 2012 and $29.3 million in 2011). Major uses of cash include payments for salaries, wages, and fringe benefits ($217.2 million in 2012 and $210.8 million in 2011), payments for supplies, services, and utilities ($130.2 million in 2012 and $121.2 million in 2011), and payments for non-capitalized plant improvements and equipment ($18.8 million in 2012 and $19.2 million in 2011).
Cash flows from non-capital financing activities include state appropriations for the University’s educational and general programs and financial aid of $68.7 million and $72.3 million in 2012 and 2011, respectively. The cash flows from capital financing activities section deals with cash used for the acquisition and construction of capital and related items. Primary sources of cash from capital financing activities in 2012 and 2011 include capital appropriations and contributions ($40.7 million in 2012 and $35.7 million in 2011) and proceeds from issuance of capital related debt (none in 2012 and $42.2 million in 2011). Significant cash outflows include purchases and construction of capital assets ($85.2 million in 2012 and $131.7 in 2011) and repayment of principal and interest on capital related debt ($23.8 million in 2012 and $27.5 million in 2011).
7

Economic Outlook
The University, as a public institution, is subject to many of the economic conditions impacting the Commonwealth of Virginia. Economic factors related to the Commonwealth can be found in the Commonwealth’s Comprehensive Annual Financial Report (CAFR). As a public institution, the University receives significant Commonwealth support from operating and capital appropriations. State operating appropriations currently cover 26 percent of operating expenses, excluding auxiliary activities and depreciation. Building on the Virginia Higher Education Opportunity Act passed in 2011, the 2012 Legislative Session continued reinvestment into higher education for the 2012-2013 biennuim. While the Commonwealth of Virginia maintained the university’s board of visitors’ authority to establish tuition and fee rates, significant emphasis was placed on slowing the rate of increase in the tuition rate for Virginia undergraduate students. The governor has indicated an interest in further investment in higher education, but the university anticipates there will be continued pressure on general fund support from the state given the demands on the state budget and constrained state revenues.
The University is working with a new Higher Education Advisory Commission to enact the Virginia
Higher Education Opportunity Act of 2011. The six year academic, enrollment, and financial planning process defined by this legislation has potential implications for future state support and tuition rates. The commonwealth has moved to an environment that seeks to incentivize certain activities in support of state goals such as increased STEM-H (science, technology, engineering, mathematics, and health) degree completion.
The Higher Education Restructuring Act (Act) provides a framework for the University to potentially
gain additional decentralized authority from the Commonwealth in financial and administrative operations. In exchange for meeting 11 state goals listed in the Act, the University will be eligible for the immediate benefits of level one autonomy. Benefits include additional flexibility and authority with regard to disposing of property, entering into capital lease agreements, continuing existing memorandums of understanding for decentralized activities, and procurement flexibility. As required by the Act, the University’s Board of Visitors passed a resolution committing to these goals in June 2005. In September 2008, the University’s Board of Visitors approved management’s request to move to level two autonomy under the Higher Education Restructuring Act in the areas of Procurement and Information Technology. The University received this delegated restructuring authority during 2009.
The University’s overall financial position remains strong. As in fiscal year 2011, the University generated an overall increase in net assets during 2012. These increases are indicators of the University’s sound and prudent uses of financial resources. Management continues to maintain a close watch over resources and the U.S. economy as a whole to react to unknown internal and external issues and sustain the University’s current sound financial position.
8

FINANCIAL STATEMENTS
9

JAMES MADISON UNIVERSITYSTATEMENT OF NET ASSETSAs of June 30, 2012 (with comparative information as of June 30, 2011)
James Madison University Component Unit
James Madison University Component Unit
ASSETSCurrent assets:
Cash and cash equivalents (Note 2) 109,851,701$ 1,905,315$ 113,487,070$ 2,712,877$ Securities lending - Cash and cash equivalents (Note 2) 2,471,191 - 1,639,450 - Short-term investments (Note 2) 76,404 - 502,722 - Accounts receivable (Net of allowance for doubtful accounts
of $588,685 and $602,043 for 2012 and 2011, respectively) (Note 3) 9,754,578 56,645 6,712,839 43,825 Contributions receivable (Net of allowance for doubtful contributions
of $26,738 and $94,566 for 2012 and 2011, respectively) (Note 3) - 1,310,156 - 4,633,753 Due from the Commonwealth (Note 4) 5,256,036 - 12,284,061 - Prepaid expenses 7,693,841 49,383 7,229,407 44,442 Inventory 1,022,374 - 985,630 - Notes receivable (Net of allowance for doubtful accounts of
$47,427 and $52,112 for 2012 and 2011, respectively) 344,920 - 377,486 -
Total current assets 136,471,045 3,321,499 143,218,665 7,434,897
Non-current assets:Restricted cash and cash equivalents (Note 2) 3,735,644 - 22,031,885 - Endowment investments (Note 2) - 45,783,663 243,171 42,709,038 Other long-term investments (Note 2) 1,974,476 25,749,859 1,008,411 29,298,343 Land held for future use - 4,860,348 2,485,348 Contributions receivable (Net of allowance for doubtful contributions
of $730,175 and $76,181 for 2012 and 2011, respectively) (Note 3) - 2,617,236 - 3,732,846 Prepaid expenses 294,794 - 300,730 - Notes receivable (Net of allowance for doubtful accounts of
$228,560 and $226,218 for 2012 and 2011, respectively) 1,964,382 - 1,910,917 - Capital assets, net: (Note 5)
Non-depreciable 129,045,282 4,594,991 161,092,550 4,594,991 Depreciable 666,823,876 2,627,296 590,314,390 2,706,087
Other assets - 2,145 - 2,145
Total non-current assets 803,838,454 86,235,538 776,902,054 85,528,798
Total assets 940,309,499 89,557,037 920,120,719 92,963,695
LIABILITIESCurrent liabilities:
Accounts payable and accrued expenses (Note 6) 36,959,109 167,472 44,667,478 183,661 Deferred revenue 15,763,333 - 14,969,452 - Obligations under securities lending 2,547,595 - 2,142,172 - Deposits held in custody for others 4,139,216 - 4,455,603 - Long-term liabilities - current portion (Note 7) 16,868,097 287,996 17,503,790 279,722 Advance from the Treasurer of Virginia 50,000 - 50,000 -
Total current liabilities 76,327,350 455,468 83,788,495 463,383
Non-current liabilities (Note 7) 212,811,493 5,803,089 225,980,822 6,039,372
Total liabilities 289,138,843 6,258,557 309,769,317 6,502,755
2012 2011
10
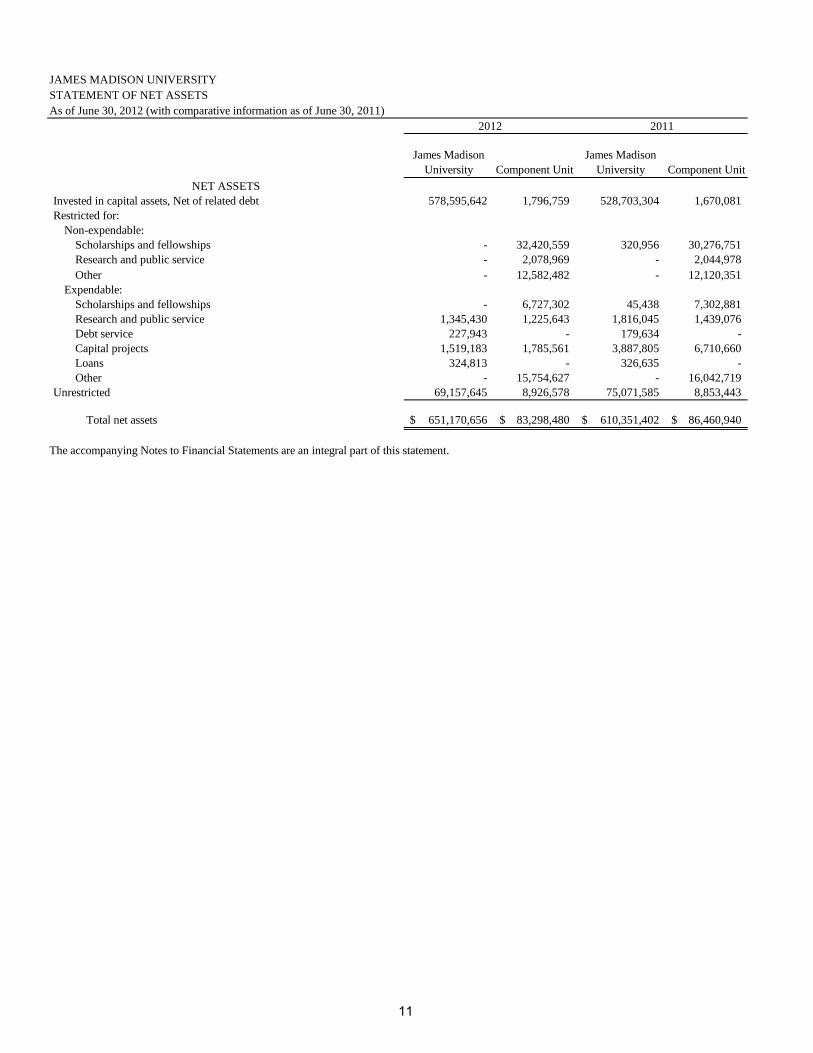
JAMES MADISON UNIVERSITYSTATEMENT OF NET ASSETSAs of June 30, 2012 (with comparative information as of June 30, 2011)
James Madison University Component Unit
James Madison University Component Unit
2012 2011
NET ASSETSInvested in capital assets, Net of related debt 578,595,642 1,796,759 528,703,304 1,670,081 Restricted for:
Non-expendable: Scholarships and fellowships - 32,420,559 320,956 30,276,751 Research and public service - 2,078,969 - 2,044,978 Other - 12,582,482 - 12,120,351
Expendable:Scholarships and fellowships - 6,727,302 45,438 7,302,881 Research and public service 1,345,430 1,225,643 1,816,045 1,439,076 Debt service 227,943 - 179,634 - Capital projects 1,519,183 1,785,561 3,887,805 6,710,660 Loans 324,813 - 326,635 - Other - 15,754,627 - 16,042,719
Unrestricted 69,157,645 8,926,578 75,071,585 8,853,443
Total net assets 651,170,656$ 83,298,480$ 610,351,402$ 86,460,940$
The accompanying Notes to Financial Statements are an integral part of this statement.
11

Page Left Intentionally Blank
12

JAMES MADISON UNIVERSITYSTATEMENT OF REVENUES, EXPENSES, AND CHANGES IN NET ASSETSFor the year ended June 30, 2012 (with comparative information for the year ended June 30, 2011)
James Madison University Component Unit
James Madison University* Component Unit
Operating revenues:Student tuition and fees (Net of scholarship allowances of $11,563,763 and $11,110,513 for 2012 and 2011, respectively) 158,308,773$ -$ 145,491,037$ -$ Gifts and contributions - 4,832,050 - 6,854,901 Federal grants and contracts 18,275,281 - 17,960,405 - State grants and contracts 6,814,347 - 6,229,495 - Non-governmental grants and contracts 4,492,879 - 3,996,861 - Auxiliary enterprises (Net of scholarship allowances of $8,924,459 and $8,530,021 for 2012 and 2011, respectively) (Note 10) 149,188,562 - 141,124,616 - Sales and Services of Education and General Activities 1,481,005 - 1,250,622 - Other operating revenues 1,355,110 736,057 939,760 661,340
Total operating revenues 339,915,957 5,568,107 316,992,796 7,516,241
Operating expenses (Note 11):Instruction 128,895,008 708,468 121,430,309 367,799 Research 9,895,117 7,448 8,063,261 9,415 Public service 12,266,948 285,137 11,830,754 166,561 Academic support 35,196,693 753,069 34,985,759 664,758 Student services 14,195,985 106,379 13,493,912 86,180 Institutional support 22,305,428 4,570,074 24,395,341 4,030,069 Operation and maintenance - plant 32,010,975 4,864,147 28,556,265 5,314,958 Depreciation 29,522,591 80,223 27,665,431 76,352 Student aid 8,497,679 2,416,034 9,091,548 1,946,776 Auxiliary activities (Note 10) 114,275,290 585,199 107,713,126 555,876
Total operating expenses 407,061,714 14,376,178 387,225,706 13,218,744
Operating loss (67,145,757) (8,808,071) (70,232,910) (5,702,503)
Non-operating revenues/(expenses):State appropriations (Note 12) 68,734,632 - 72,321,820 - Grants and contracts (Note 1 L.) 9,868,959 - 21,144,336 - Gifts 1,051,653 - 806,014 - Investment income (Net of investment expense of $18,619 and
$15,992 for the University and $327,849 and $353,627 for the Foundation for 2012 and 2011, respectively) 878,884 890,662 778,922 9,641,547
In-Kind support from James Madison University - 2,624,254 - 2,580,583 Interest on capital asset - related debt (7,035,788) (204,303) (6,598,830) (207,890) Loss on disposal of plant assets (661,332) - (2,055,532) - Payment to the Commonwealth (3,278,112) - (3,241,071) -
Net non-operating revenues/(expenses) 69,558,896 3,310,613 83,155,659 12,014,240
Income/(loss) before other revenues, expenses, gains or losses 2,413,139 (5,497,458) 12,922,749 6,311,737
Capital appropriations and contributions (Note 13) 33,545,316 - 29,849,092 - Capital gifts 5,639,024 - 5,247,607 - Additions/(reductions) to permanent endowments (778,225) 2,334,998 - 2,122,869
Net other revenues 38,406,115 2,334,998 35,096,699 2,122,869
Increase/(decrease) in net assets 40,819,254 (3,162,460) 48,019,448 8,434,606
Net assets - beginning of year 610,351,402 86,460,940 562,331,954 78,026,334
Net assets - end of year 651,170,656$ 83,298,480$ 610,351,402$ 86,460,940$
The accompanying Notes to Financial Statements are an integral part of this statement.*Certain prior year amounts were restated to agree to current year classifications.
2012 2011
13
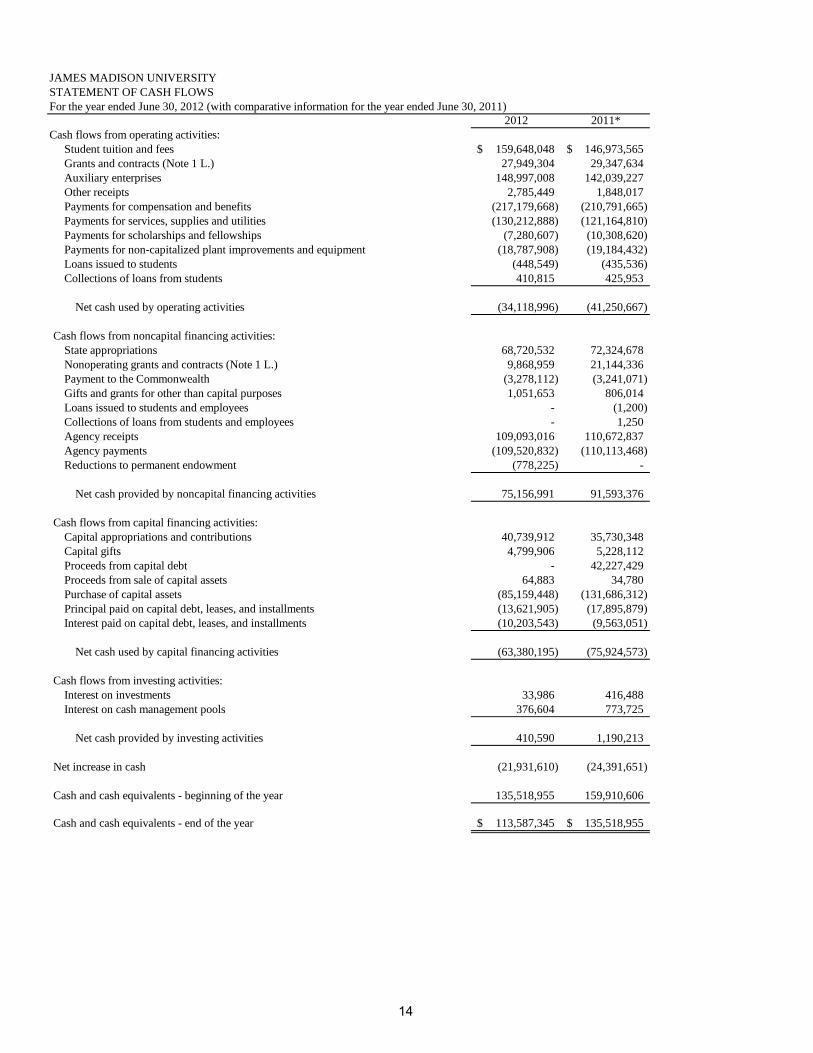
JAMES MADISON UNIVERSITYSTATEMENT OF CASH FLOWSFor the year ended June 30, 2012 (with comparative information for the year ended June 30, 2011)
2012 2011*Cash flows from operating activities:
Student tuition and fees 159,648,048$ 146,973,565$ Grants and contracts (Note 1 L.) 27,949,304 29,347,634 Auxiliary enterprises 148,997,008 142,039,227 Other receipts 2,785,449 1,848,017 Payments for compensation and benefits (217,179,668) (210,791,665) Payments for services, supplies and utilities (130,212,888) (121,164,810) Payments for scholarships and fellowships (7,280,607) (10,308,620) Payments for non-capitalized plant improvements and equipment (18,787,908) (19,184,432) Loans issued to students (448,549) (435,536) Collections of loans from students 410,815 425,953
Net cash used by operating activities (34,118,996) (41,250,667)
Cash flows from noncapital financing activities:State appropriations 68,720,532 72,324,678 Nonoperating grants and contracts (Note 1 L.) 9,868,959 21,144,336 Payment to the Commonwealth (3,278,112) (3,241,071) Gifts and grants for other than capital purposes 1,051,653 806,014 Loans issued to students and employees - (1,200) Collections of loans from students and employees - 1,250 Agency receipts 109,093,016 110,672,837 Agency payments (109,520,832) (110,113,468) Reductions to permanent endowment (778,225) -
Net cash provided by noncapital financing activities 75,156,991 91,593,376
Cash flows from capital financing activities:Capital appropriations and contributions 40,739,912 35,730,348 Capital gifts 4,799,906 5,228,112 Proceeds from capital debt - 42,227,429 Proceeds from sale of capital assets 64,883 34,780 Purchase of capital assets (85,159,448) (131,686,312) Principal paid on capital debt, leases, and installments (13,621,905) (17,895,879) Interest paid on capital debt, leases, and installments (10,203,543) (9,563,051)
Net cash used by capital financing activities (63,380,195) (75,924,573)
Cash flows from investing activities:Interest on investments 33,986 416,488 Interest on cash management pools 376,604 773,725
Net cash provided by investing activities 410,590 1,190,213
Net increase in cash (21,931,610) (24,391,651)
Cash and cash equivalents - beginning of the year 135,518,955 159,910,606
Cash and cash equivalents - end of the year 113,587,345$ 135,518,955$
14
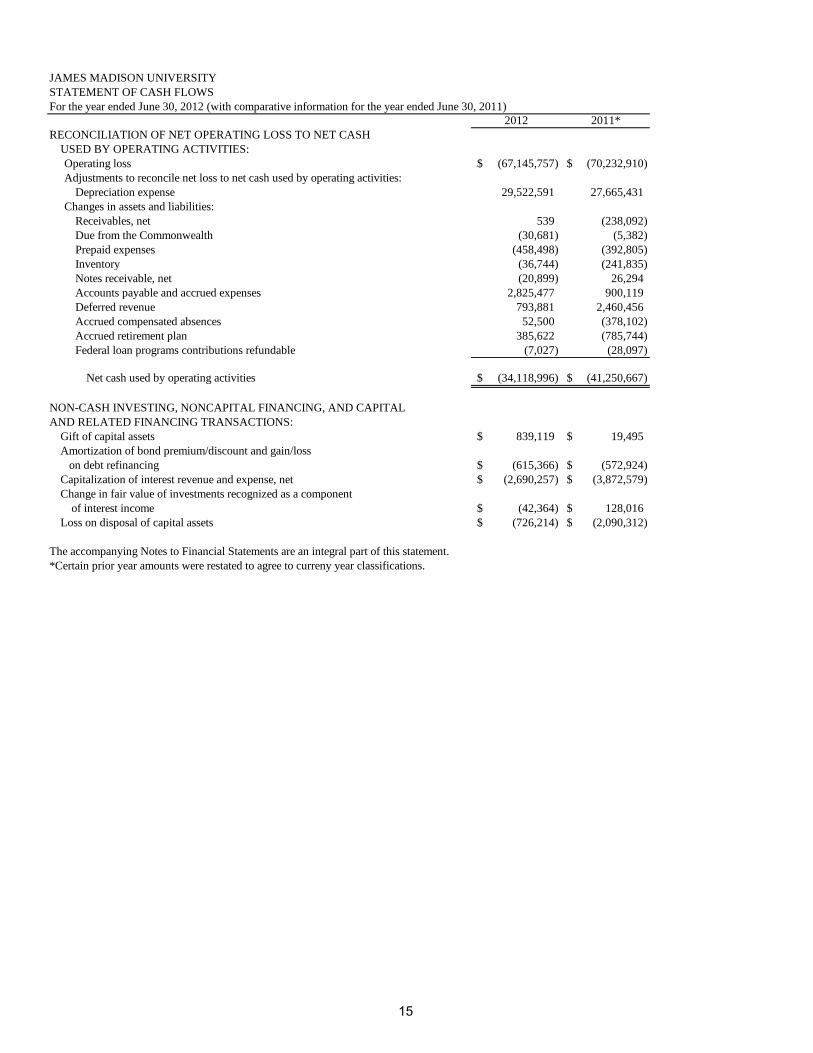
JAMES MADISON UNIVERSITYSTATEMENT OF CASH FLOWSFor the year ended June 30, 2012 (with comparative information for the year ended June 30, 2011)
2012 2011*RECONCILIATION OF NET OPERATING LOSS TO NET CASH
USED BY OPERATING ACTIVITIES:Operating loss (67,145,757)$ (70,232,910)$ Adjustments to reconcile net loss to net cash used by operating activities:
Depreciation expense 29,522,591 27,665,431 Changes in assets and liabilities:
Receivables, net 539 (238,092) Due from the Commonwealth (30,681) (5,382) Prepaid expenses (458,498) (392,805) Inventory (36,744) (241,835) Notes receivable, net (20,899) 26,294 Accounts payable and accrued expenses 2,825,477 900,119 Deferred revenue 793,881 2,460,456 Accrued compensated absences 52,500 (378,102) Accrued retirement plan 385,622 (785,744) Federal loan programs contributions refundable (7,027) (28,097)
Net cash used by operating activities (34,118,996)$ (41,250,667)$
NON-CASH INVESTING, NONCAPITAL FINANCING, AND CAPITALAND RELATED FINANCING TRANSACTIONS:
Gift of capital assets 839,119$ 19,495$ Amortization of bond premium/discount and gain/loss on debt refinancing (615,366)$ (572,924)$ Capitalization of interest revenue and expense, net (2,690,257)$ (3,872,579)$ Change in fair value of investments recognized as a component
of interest income (42,364)$ 128,016$ Loss on disposal of capital assets (726,214)$ (2,090,312)$
The accompanying Notes to Financial Statements are an integral part of this statement.*Certain prior year amounts were restated to agree to curreny year classifications.
15
Page Left Intentionally Blank
16
NOTES TO FINANCIAL STATEMENTS
17
JAMES MADISON UNIVERSITY
NOTES TO FINANCIAL STATEMENTS
FOR THE YEAR ENDED JUNE 30, 2012 1. SUMMARY OF SIGNIFICANT ACCOUNTING POLICIES
A. Reporting Entity
The University is a comprehensive university that is part of the Commonwealth’s statewide system of public higher education. The University’s Board of Visitors, appointed by the Governor, is responsible for overseeing governance of the University. A separate report is prepared for the Commonwealth, which includes all agencies, higher education institutions, boards, commissions, and authorities over which the Commonwealth exercises or has the ability to exercise oversight authority. The University is a component unit of the Commonwealth and is included in the basic financial statements of the Commonwealth.
In accordance with Governmental Accounting Standards Board (GASB) Statement
39, Determining Whether Certain Organizations are Component Units, an amendment of GASB Statement 14, The Financial Reporting Entity, the James Madison University Foundation, Inc. meets the criteria which qualify it as a component unit of the University. The Foundation is a legally separate, tax-exempt organization formed to promote the achievements and further the aims and purposes of the University. The Foundation accomplishes its purposes through fundraising and funds management efforts that benefit the University and its programs. The 20-member board of the Foundation is self-perpetuating and consists of friends and supporters of the University. Although the University does not control the timing or amount of receipts from the Foundation, the majority of resources or income thereon that the Foundation holds and invests are restricted to the activities of the University by the donors. Because these restricted resources held by the Foundation can only be used by, or for the benefit of the University, the Foundation is considered a component unit of the University and is discretely presented in the financial statements.
During the year ended June 30, 2012, the Foundation distributed $9,624,599 to the University for both restricted and unrestricted purposes. Separate financial statements for the Foundation can be obtained by writing the Chief Financial Officer, JMU Foundation, Inc., MSC 8501, Harrisonburg, Virginia 22807.
B. Financial Statement Presentation
The financial statements have been prepared in accordance with GASB Statement 34, Basic Financial Statements – and Management’s Discussion and Analysis – for State and Local Governments, and GASB Statement 35, Basic Financial Statements and Management’s Discussion and Analysis of Public College and Universities.
GASB Statements 34 and 35 standards are designed to provide financial information that responds to the needs of three groups of primary users of general-purpose external financial reports: the citizenry, legislative and oversight bodies, and investors and creditors. Under this guidance, the University is required to include a management’s discussion and analysis (MD&A), basic financial statements, and notes to the financial statements.
18
The Foundation is a private, non-profit organization that reports under Financial Accounting Standards Board (FASB) standards, including FASB Statement 117, Financial Reporting for Not-for-Profit Organizations. As such, certain revenue recognition criteria and presentation features are different from GASB revenue recognition and presentation features. No modifications have been made to the Foundation’s financial information in the University’s financial reporting entity for these differences.
C. Basis of Accounting The University follows GASB Statement 34 requirements for reporting by special-
purpose governments engaged only in business-type activities. Accordingly, the financial statements have been prepared using the economic resources measurement focus and the accrual basis of accounting. Under the accrual basis, revenues are recognized when earned and expenses are recorded when a liability is incurred, regardless of the timing of related cash flows. All significant intra-agency transactions have been eliminated.
The University’s accounting policies conform with generally accepted accounting principles as prescribed by the GASB, including all applicable GASB pronouncements, as well as applicable FASB statements and interpretations, Accounting Principles Board opinions, and Accounting Research Bulletins of the Committee on Accounting Procedure issued on or before November 30, 1989, unless those pronouncements conflict with or contradict GASB pronouncements. The University has the option to apply all FASB pronouncements issued after November 30, 1989, unless FASB conflicts with GASB. The University has elected not to apply the FASB pronouncements issued after the applicable date.
D. Cash Equivalents and Investments
In accordance with GASB Statement 9, Reporting Cash Flows of Proprietary and Non-expendable Trust Funds and Governmental Entities That Use Proprietary Fund Accounting, the University considers all highly liquid investments with an original maturity of 90 days or less to be cash equivalents.
In accordance with GASB Statement 31, Accounting and Financial Reporting for
Certain Investments and for External Investment Pools, purchased investments, interest-bearing temporary investments classified with cash, and investments received as gifts are recorded at fair value. All investment income, including changes in the fair value of investments (unrealized gains and losses), is reported as non-operating revenue in the Statement of Revenues, Expenses, and Changes in Net Assets.
E. Capital Assets Capital assets consisting of land, buildings, infrastructure, computer software and
equipment are stated at cost at date of acquisition, or fair market value at date of donation for gifts. Library materials are valued using published average prices for library acquisitions. The University capitalizes construction costs that have a value or cost in excess of $200,000 at the date of acquisition. Renovation costs are capitalized when expenses total more than $200,000, the asset value significantly increases, or the useful life is significantly extended. Routine repairs and maintenance are charged to operating expense.
19
Equipment is capitalized when the unit acquisition cost is $5,000 or greater and the
estimated useful life is more than two years. Computer software is capitalized when the unit acquisition or development costs are $100,000 or greater and the estimated useful life is more than two years. Expenses related to construction are capitalized at actual cost as they are incurred (construction-in-progress).
Construction period interest cost in excess of earning associated with related debt
proceeds is capitalized as a component of the final asset. The University incurred and capitalized net interest expense related to the construction of capital assets totaling $2,663,493 for this fiscal year.
Collections of works of art and historical treasures are capitalized at cost or fair
market value at the date of donation. These collections are considered inexhaustible and therefore are not depreciated.
Depreciation is computed using the straight-line method over the estimated useful life of the asset and is not allocated to the functional expense categories. Useful lives by asset categories are listed below:
Buildings 25-50 years Other improvements and infrastructure 20 years Equipment 5-20 years Computer software 5 years Library material 5 years
GASB Statement 51, Accounting and Financial Reporting for Intangible Assets,
became effective on July 1, 2009. Prior to implementation of this standard, computer software was reported as equipment in accordance with SOP 98-1, Accounting for the Costs of Computer Software Developed or Obtained for Internal Use.
F. Inventories
Inventories are valued at the lower of cost (generally determined on the first-in, first-
out method) or market and consist primarily of expendable supplies held for consumption.
G. Non-current Cash and Investments Cash and investments that are externally restricted to make debt service payments,
maintain sinking or reserve funds, or to purchase or construct capital and other non-current assets are classified as non-current assets in the Statement of Net Assets. Assets that will be used to liquidate current liabilities, including capital project liabilities that are expected to be paid within one year, are classified as current assets.
H. Deferred Revenue
Deferred revenue represents revenues collected but not earned as of June 30. This
consists primarily of revenue for student tuition and certain auxiliary activities accrued in advance of the semester, and advance payments on grants and contracts.
20
I. Accrued Compensated Absences The amount of leave earned, but not taken by non-faculty salaried employees is
recorded as a liability on the Statement of Net Assets. The amount reflects, as of June 30, all unused vacation leave, sabbatical leave, and the amount payable upon termination under the Commonwealth’s sick leave payout policy. The applicable share of employer-related taxes payable on the eventual termination payments is also included.
J. Federal Financial Assistance Programs
The University participates in federally funded Pell Grants, Supplemental
Educational Opportunity Grants, and federal work-study and Perkins loans programs. Federal programs are audited in accordance with the Single Audit Act Amendments of 1996, the Office of Management and Budget Revised Circular A-133, Audit of States, Local Governments and Non-Profit Organizations, and the Compliance Supplement.
K. Net Assets
GASB Statement 34 requires that the Statement of Net Assets report the difference
between assets and liabilities as net assets, not fund balances. Net assets are classified as invested in capital assets, net of related debt, restricted, and unrestricted. “Invested in capital assets, net of related debt” consists of capital assets, net of accumulated depreciation and reduced by outstanding debt that is attributable to the acquisition, construction, or improvement of those assets. Net assets are reported as restricted when constraints on the net asset use are either externally imposed by creditors, grantors, or contributors or imposed by law. Unrestricted net assets consist of net assets that do not meet the definitions above. When an expense is incurred that can be paid using either restricted or unrestricted resources, the University’s policy is to use restricted resources first, then unrestricted resources as needed.
L. Revenue and Expense Classifications Operating revenues include activities that have the characteristics of exchange
transactions, such as: (1) student tuition and fees, net of scholarship discounts and allowances; (2) sales and services of auxiliary enterprises, net of scholarship allowances; and (3) federal, state, and non-governmental grants and contracts.
Non-operating revenues include activities that have the characteristics of non-exchange transactions, such as gifts, and other revenue sources that are defined as non-operating revenues by GASB Statement 9 and GASB Statement 34, such as state appropriations and investment and interest income. Federal Pell grant receipts are reported on the line item “non-operating grants and contracts” on the Statement of Revenues, Expenses, and Changes in Net Assets. Pell grants are considered as non-operating because the University’s administrative involvement with the grant requirements have the characteristics of a non-exchange transaction. Non-operating grants and contracts also include federal American Reinvestment and Recovery Act funds passed through the state Department of Education to the University.
Non-operating expenses include interest on debt related to the purchase of capital assets, losses on the disposal of capital assets, and nongeneral fund transfer payments to the Commonwealth. All other expenses are classified as operating expenses.
21
M. Scholarship Discounts and Allowances
Student tuition and fees revenues, and certain other revenues from students, are
reported net of scholarship discounts and allowances in the Statements of Revenue, Expenses, and Changes in Net Assets. Scholarship discounts and allowances are the difference between the stated charge for goods and services provided by the University and the amount that is paid by students and/or third parties making payments on the student’s behalf. Financial aid to students is reported in the financial statements under the alternative method as prescribed by the National Association of College and University Business Officers (NACUBO). The alternative method proportionately calculates scholarship discounts and allowances on a University-wide basis by allocating cash payments to students, excluding payments for services, on the ratio of total aid to aid not considered to be third party aid.
N. Commonwealth Equipment and Capital Project Reimbursement Programs
The Commonwealth has established several programs to provide state-supported
institutions of higher education with bond proceeds for financing the acquisition and replacement of instructional and research equipment and facilities. During fiscal year 2012, funding has been provided to the University from three programs; general obligation bonds 9(b), and two programs (21st Century and Equipment Trust Fund) managed by the Virginia College Building Authority (VCBA). The VCBA issues bonds and uses the proceeds to reimburse the University and other institutions of higher education for expenses incurred in the acquisition of equipment and facilities.
The Statement of Net Assets line item “Due from the Commonwealth” includes
pending reimbursements at year-end from these programs, as further described in Note 4. The Statement of Revenue, Expenses, and Changes in Net Assets line item “Capital appropriations and contributions” includes reimbursements during the year for the acquisition of equipment and facilities under these programs, as further described in Note 13.
O. Comparative Data
The University presents its financial information on a comparative basis. The basic
financial statements include certain prior year summarized information in total, but not at the level of detail required for a presentation in conformity with generally accepted accounting principles. Accordingly, the prior year information should be read in conjunction with the University’s financial statements for the year ended June 30, 2011, from which the summarized information was derived.
2. CASH AND CASH EQUIVALENTS AND INVESTMENTS
GASB Statement 40, Deposit and Investment Risk Disclosures, became effective for the fiscal year ending June 30, 2005. It amends GASB Statement 3, Deposits with Financial Institutions, Investments (including Repurchase Agreements), and Reverse Repurchase Agreements. GASB Statement 40 eliminates the custodial credit risk disclosures for Category 1 and 2 deposits and investments. However, this statement does not change the disclosure requirements for Category 3 deposits and investments. The University has no Category 3 deposits or investments for 2012. The following risk disclosures are required by GASB Statement 40:
22
• Credit Risk – The risk that an issuer or other counterparty to an investment will not fulfill its obligations. This statement requires the disclosure of the credit quality ratings on any investments subject to credit risk.
• Concentration of Credit Risk – The risk of loss attributed to the
magnitude of a government’s investment in a single issuer. This statement requires disclosure of investments with any one issuer with more than five percent of total investments. However, investments issued or explicitly guaranteed by the U.S. government and investments in mutual funds, external investment pools, and other pooled investments are excluded from this requirement.
• Interest Rate Risk – The risk that interest rate changes will adversely
affect the fair value of an investment. This statement requires disclosure of maturities for any investments subject to interest rate risk. The University does not have an interest rate risk policy.
• Foreign Currency Risk – The risk that changes in exchange rates will
adversely affect the fair value of an investment or deposit. The University had foreign deposits of $2,578,756 in 2012.
A. Cash and Cash Equivalents Pursuant to Section 2.2-1800, et seq., Code of Virginia, all state funds of the
University are maintained by the Treasurer of Virginia, who is responsible for the collection, disbursement, custody, and investment of state funds. Except for cash held in foreign banks, cash deposits held by the University are maintained in accounts that are collateralized in accordance with the Virginia Security for Public Deposits Act, Section 2.2-4400, et seq., Code of Virginia. These amounts are insured in accordance with the banking regulations of the respective countries where the funds are maintained. In accordance with the GASB Statement 9’s definition of cash and cash equivalents, cash represents cash with the Treasurer of Virginia, cash on hand, cash deposits, including certificates of deposits and temporary investments with original maturities of 90 days or less, and cash equivalents under the Commonwealth’s securities lending and state non-arbitrage programs.
B. Investments
The Board of Visitors established the University’s investment policy. Authorized
investments are set forth in the Investment of Public Funds Act, Section 2.2-4500 through 2.2-4517, et seq., Code of Virginia. Investments fall into two groups: short-term and long-term. Short-term investments have an original maturity of over 90 days but less than or equal to one year. Long-term investments have an original maturity greater than one year.
23
Cash and cash equivalents: Cash with the Treasurer of Virginia $ 92,450,245 Cash on hand and deposits with financial institutions (including money market and certificates of deposit) 15,701,000 Collateral held for securities lending 2,471,191 Cash equivalents with the Treasurer of Virginia 4 Cash equivalents with the Bank of New York 5,436,096 Total $116,058,536 Investments: Collateral held for securities lending (short-term) $ 76,404 Investments not with the Treasurer of Virginia 1,974,476 Total $ 2,050,880
For 2012, investments not with Treasurer of Virginia include $474,476 in unrated mutual funds with maturity less than one year.
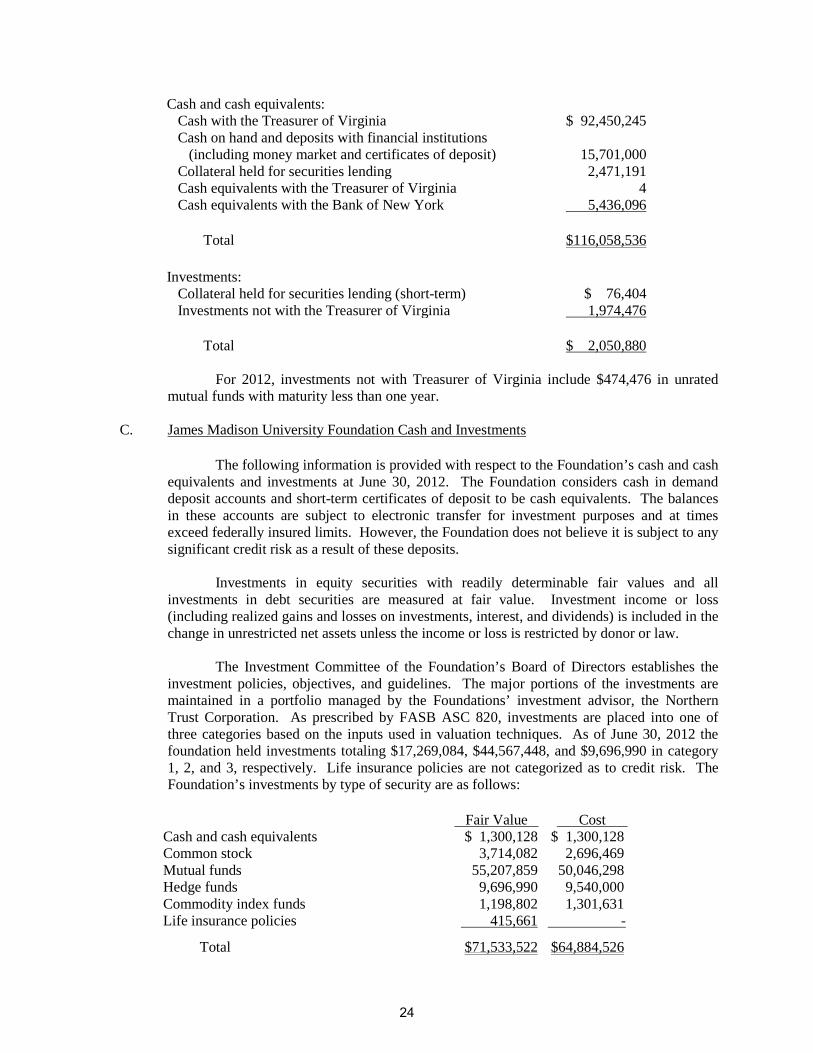
C. James Madison University Foundation Cash and Investments
The following information is provided with respect to the Foundation’s cash and cash
equivalents and investments at June 30, 2012. The Foundation considers cash in demand deposit accounts and short-term certificates of deposit to be cash equivalents. The balances in these accounts are subject to electronic transfer for investment purposes and at times exceed federally insured limits. However, the Foundation does not believe it is subject to any significant credit risk as a result of these deposits.
Investments in equity securities with readily determinable fair values and all investments in debt securities are measured at fair value. Investment income or loss (including realized gains and losses on investments, interest, and dividends) is included in the change in unrestricted net assets unless the income or loss is restricted by donor or law.
The Investment Committee of the Foundation’s Board of Directors establishes the investment policies, objectives, and guidelines. The major portions of the investments are maintained in a portfolio managed by the Foundations’ investment advisor, the Northern Trust Corporation. As prescribed by FASB ASC 820, investments are placed into one of three categories based on the inputs used in valuation techniques. As of June 30, 2012 the foundation held investments totaling $17,269,084, $44,567,448, and $9,696,990 in category 1, 2, and 3, respectively. Life insurance policies are not categorized as to credit risk. The Foundation’s investments by type of security are as follows:
Fair Value Cost Cash and cash equivalents $ 1,300,128 $ 1,300,128 Common stock 3,714,082 2,696,469 Mutual funds 55,207,859 50,046,298 Hedge funds 9,696,990 9,540,000 Commodity index funds 1,198,802 1,301,631 Life insurance policies 415,661 - Total $71,533,522 $64,884,526
24

D. Securities Lending Transactions
GASB Statement 28, Accounting and Financial Reporting for Securities Lending Transactions, establishes accounting and financial reporting standards for security lending transactions. In these transactions, governmental entities transfer securities to broker-dealers and other entities for collateral and simultaneously agree to return the collateral for the same securities in the future. The investments under securities lending (reported as either “cash equivalents” or “short-term investments”) and the securities lending transactions reported on the financial statements represent the University’s allocated share of securities received for securities lending transactions held in the General Account of the Commonwealth. The Commonwealth’s policy is to record unrealized gains and losses in the General Fund in the Commonwealth’s basic financial statements. When gains and losses are realized, the actual gains and losses are recorded by the affected agencies. Information related to the credit risk of these investments and securities lending transactions held in the General Account is available on a statewide basis in the Commonwealth of Virginia’s CAFR.
3. ACCOUNTS AND CONTRIBUTIONS RECEIVABLE
Accounts receivable consisted of the following at June 30, 2012:
Student tuition and fees $ 1,511,772 Auxiliary enterprises 1,115,438 Federal, state, and non-governmental grants and contracts 4,246,659 Unreimbursed capital/Equipment Trust Fund expenses 3,127,280 Other activities 342,114 Total 10,343,263 Less: allowance for doubtful accounts 588,685 Net accounts receivable $9,754,578
The Foundation’s contributions receivable at June 30, 2012 is summarized below:
Due in less than one year $1,336,894 Due between one and five years 2,444,856 Due in more than five years 1,276,249 Total 5,057,999 Less: present value discount (one percent - six percent) 373,694 Less: allowance for doubtful accounts 756,913 Net contributions receivable $3,927,392
25
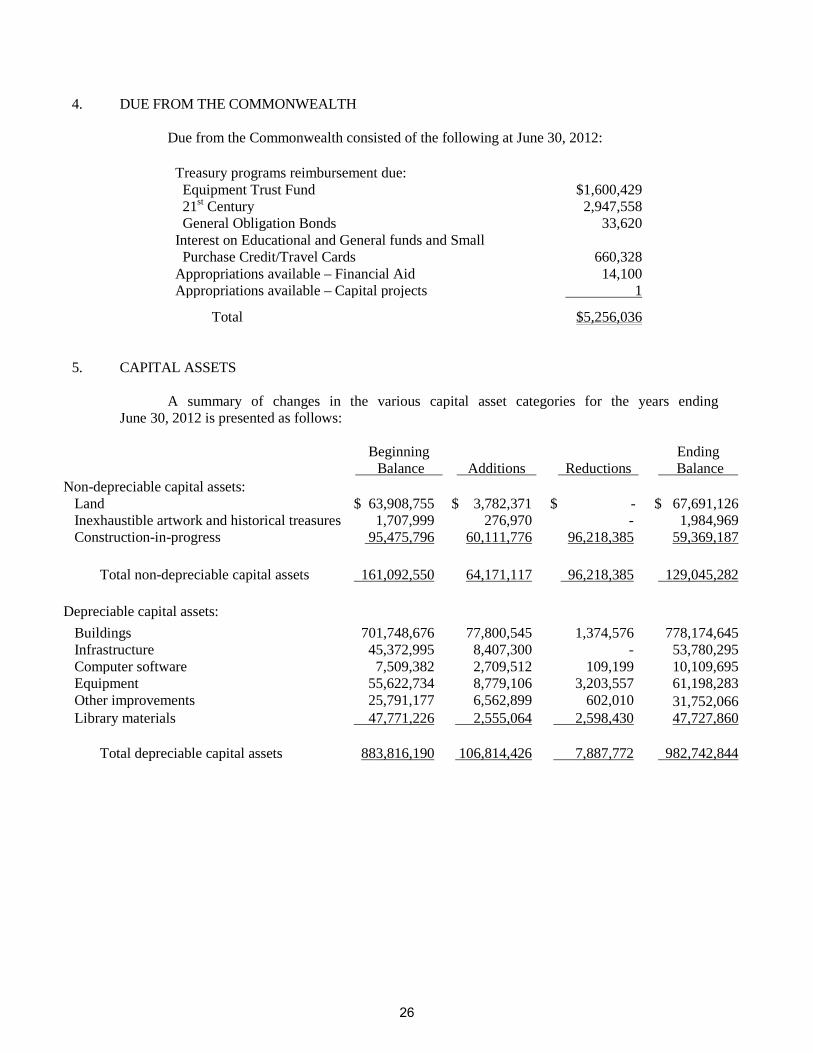
4. DUE FROM THE COMMONWEALTH
Due from the Commonwealth consisted of the following at June 30, 2012:
Treasury programs reimbursement due: Equipment Trust Fund $1,600,429 21st Century 2,947,558 General Obligation Bonds 33,620 Interest on Educational and General funds and Small Purchase Credit/Travel Cards 660,328 Appropriations available – Financial Aid 14,100 Appropriations available – Capital projects 1 Total $5,256,036
5. CAPITAL ASSETS
A summary of changes in the various capital asset categories for the years ending June 30, 2012 is presented as follows:
Beginning
Balance Additions Reductions Ending
Balance Non-depreciable capital assets: Land $ 63,908,755 $ 3,782,371 $ - $ 67,691,126 Inexhaustible artwork and historical treasures 1,707,999 276,970 - 1,984,969 Construction-in-progress 95,475,796 60,111,776 96,218,385 59,369,187 Total non-depreciable capital assets 161,092,550 64,171,117 96,218,385 129,045,282 Depreciable capital assets: Buildings 701,748,676 77,800,545 1,374,576 778,174,645 Infrastructure 45,372,995 8,407,300 - 53,780,295 Computer software 7,509,382 2,709,512 109,199 10,109,695 Equipment 55,622,734 8,779,106 3,203,557 61,198,283 Other improvements 25,791,177 6,562,899 602,010 31,752,066
47,727,860 Library materials 47,771,226 2,555,064 2,598,430 Total depreciable capital assets 883,816,190 106,814,426 7,887,772 982,742,844
26

Beginning
Balance Additions Reductions Ending
Balance Less accumulated depreciation for: Buildings 183,139,073 17,558,469 1,080,870 199,616,672 Infrastructure 23,641,412 2,361,079 - 26,002,491 Computer software 4,898,656 777,660 67,339 5,608,977 Equipment 32,724,893 4,301,689 3,059,373 33,967,209 Other improvements 9,330,727 1,533,944 299,410 10,565,261 Library materials 39,767,039 2,989,750 2,598,431 40,158,358 Total accumulated depreciation 293,501,800 29,522,591 7,105,423 315,918,968 Depreciable capital assets, net 590,314,390 77,291,835 782,349 666,823,876 Total capital assets, net $751,406,940 $141,462,952 $97,000,734 $795,869,158
The Foundation’s net capital assets consist of $7,121,696 in property and equipment, and $100,591 in collections of historical artifacts for the year ending June 30, 2012.
6. ACCOUNTS PAYABLE AND ACCRUED EXPENSES
Accounts payable and accrued expenses consisted of the following at June 30, 2012:
Employee salaries, wages, and fringe benefits payable $26,549,398 Vendors and suppliers accounts payable 4,569,729 Capital projects accounts and retainage payable 3,342,430 Accrued interest payable on bond debt 2,497,552
Total accounts payable and accrued expenses $36,959,109
27
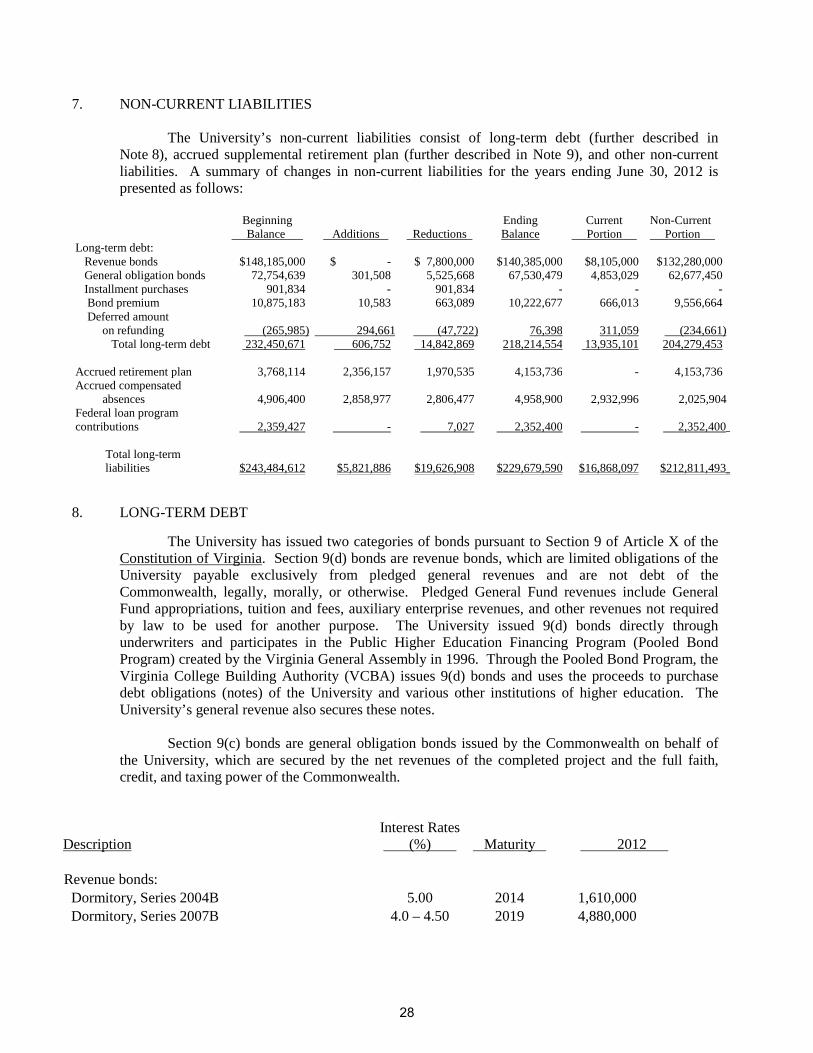
7. NON-CURRENT LIABILITIES
The University’s non-current liabilities consist of long-term debt (further described in Note 8), accrued supplemental retirement plan (further described in Note 9), and other non-current liabilities. A summary of changes in non-current liabilities for the years ending June 30, 2012 is presented as follows:
Beginning
Balance Additions Reductions Ending Balance
Current Portion
Non-Current Portion
Long-term debt: Revenue bonds $148,185,000 $ - $ 7,800,000 $140,385,000 $8,105,000 $132,280,000 General obligation bonds 72,754,639 301,508 5,525,668 67,530,479 4,853,029 62,677,450 Installment purchases 901,834 - 901,834 - - -
Bond premium 10,875,183 10,583 663,089 10,222,677 666,013 9,556,664 Deferred amount
on refunding (265,985) 294,661 (47,722) 76,398 311,059 (234,661) Total long-term debt 232,450,671 606,752 14,842,869 218,214,554 13,935,101 204,279,453
Accrued retirement plan 3,768,114 2,356,157 1,970,535 4,153,736 - 4,153,736 Accrued compensated absences 4,906,400 2,858,977 2,806,477 4,958,900 2,932,996
2,025,904
Federal loan program contributions 2,359,427 - 7,027 2,352,400 - 2,352,400_ Total long-term liabilities $243,484,612 $5,821,886 $19,626,908 $229,679,590 $16,868,097 $212,811,493_ 8. LONG-TERM DEBT
The University has issued two categories of bonds pursuant to Section 9 of Article X of the Constitution of Virginia. Section 9(d) bonds are revenue bonds, which are limited obligations of the University payable exclusively from pledged general revenues and are not debt of the Commonwealth, legally, morally, or otherwise. Pledged General Fund revenues include General Fund appropriations, tuition and fees, auxiliary enterprise revenues, and other revenues not required by law to be used for another purpose. The University issued 9(d) bonds directly through underwriters and participates in the Public Higher Education Financing Program (Pooled Bond Program) created by the Virginia General Assembly in 1996. Through the Pooled Bond Program, the Virginia College Building Authority (VCBA) issues 9(d) bonds and uses the proceeds to purchase debt obligations (notes) of the University and various other institutions of higher education. The University’s general revenue also secures these notes.
Section 9(c) bonds are general obligation bonds issued by the Commonwealth on behalf of
the University, which are secured by the net revenues of the completed project and the full faith, credit, and taxing power of the Commonwealth.
Description Interest Rates (%) Maturity 2012
Revenue bonds: Dormitory, Series 2004B 5.00 2014 1,610,000 Dormitory, Series 2007B 4.0 – 4.50 2019 4,880,000
28

Description Interest Rates (%) Maturity 2012
Revenue bonds: Parking, Series 2004B 4.00 – 5.00 2020 3,475,000 Parking, Series 2006A 3.50 – 5.00 2027 7,150,000 Student center, Series 2004B 4.00 – 5.00 2020 5,340,000 Recreation, Series 2003A 2.92 2013 1,320,000 Recreation, Series, 2006A 3.50 – 5.00 2027 3,300,000 Property acquisition, Series 2002A 5.00 2013 260,000 Athletics, Series 2003A 5.00 2014 450,000 Property acquisition, Series 2007A 4.5 – 5.0 2028 9,175,000 Grace St. acquisition, Series 2010A 2.00 – 5.50 2031 8,405,000 Multipurpose Recreation Fields, Series 2009A 2.10– 5.0 2029 6,180,000 Softball/Baseball Complex, Series 2009A 2.10– 5.0 2029 5,965,000 Renov/Expand Athletics/Recreation 2009B 2.0 – 5.0 2030 25,740,000 Renov/Expand Athletics/Recreation 2010A 2.00 – 5.50 2031 9,315,000 Renov/Expand Bridgeforth Stadium 2009B 2.00 – 5.00 2030 40,345,000 RMH property acquisitions, Series 2010A 2.00 – 5.50 2031 7,475,000 Total revenue bonds 140,385,000
General obligation revenue bonds: Dormitory and dining hall: Series 2004B 4.00 – 5.00 2020 9,634,020 Series 2006B 4.0 – 5.0 2026 3,090,000 Series 2007B 4.0 – 5.0 2027 1,850,000 Series 2007B 4.0 – 5.0 2027 16,925,000 Series 2008B 5.00 2028 16,870,000 Series 2009C 3.0 – 4.0 2021 457,624 Series 2009C 3.0 – 4.0 2022 2,137,175 Series 2009D 2.5 – 5.0 2022 1,750,000 Series 2010A 2.00 – 5.00 2030 13,955,000 Series 2012A 3.0 2013 301,508 Student center: Series 1998R 5.00 2013 283,514 Series 2008B 3.0 2013 276,638 Total general obligation revenue bonds 67,530,479 Total bonds payable $207,915,479
29
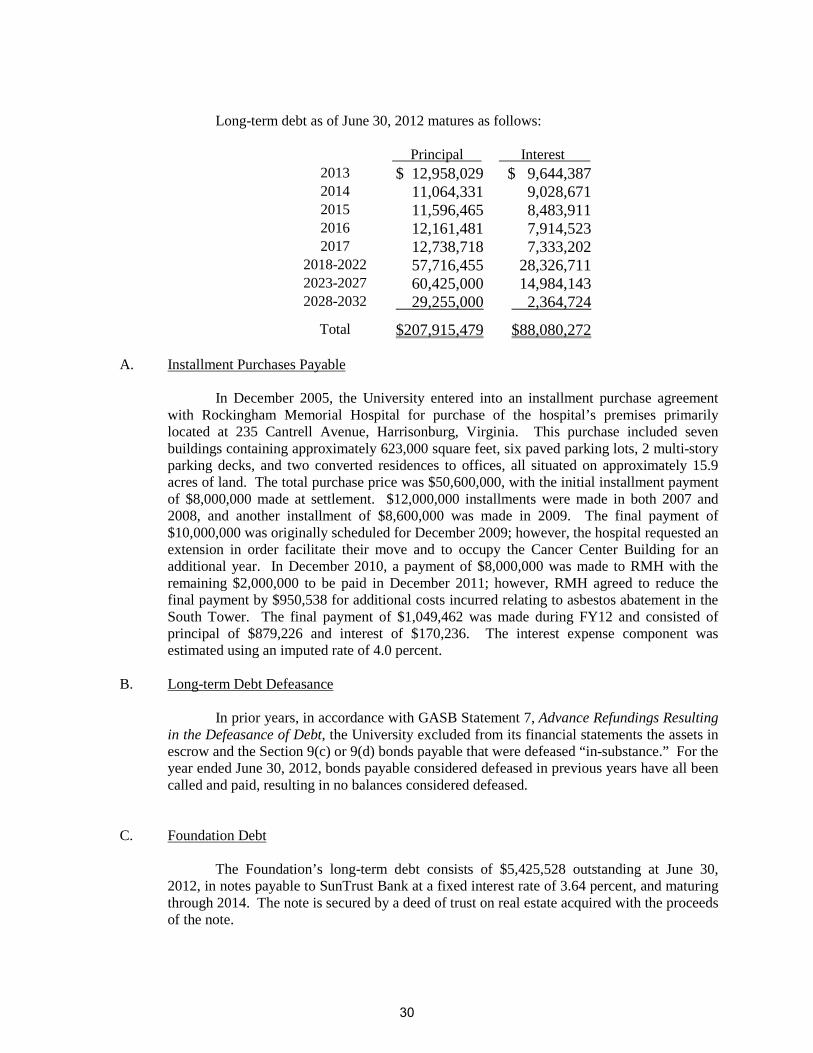
Long-term debt as of June 30, 2012 matures as follows:
Principal Interest
2013 $ 12,958,029 $ 9,644,387 2014 11,064,331 9,028,671 2015 11,596,465 8,483,911 2016 12,161,481 7,914,523 2017 12,738,718 7,333,202
2018-2022 57,716,455 28,326,711 2023-2027 60,425,000 14,984,143 2028-2032 29,255,000 2,364,724
Total $207,915,479 $88,080,272
A. Installment Purchases Payable
In December 2005, the University entered into an installment purchase agreement with Rockingham Memorial Hospital for purchase of the hospital’s premises primarily located at 235 Cantrell Avenue, Harrisonburg, Virginia. This purchase included seven buildings containing approximately 623,000 square feet, six paved parking lots, 2 multi-story parking decks, and two converted residences to offices, all situated on approximately 15.9 acres of land. The total purchase price was $50,600,000, with the initial installment payment of $8,000,000 made at settlement. $12,000,000 installments were made in both 2007 and 2008, and another installment of $8,600,000 was made in 2009. The final payment of $10,000,000 was originally scheduled for December 2009; however, the hospital requested an extension in order facilitate their move and to occupy the Cancer Center Building for an additional year. In December 2010, a payment of $8,000,000 was made to RMH with the remaining $2,000,000 to be paid in December 2011; however, RMH agreed to reduce the final payment by $950,538 for additional costs incurred relating to asbestos abatement in the South Tower. The final payment of $1,049,462 was made during FY12 and consisted of principal of $879,226 and interest of $170,236. The interest expense component was estimated using an imputed rate of 4.0 percent.
B. Long-term Debt Defeasance
In prior years, in accordance with GASB Statement 7, Advance Refundings Resulting
in the Defeasance of Debt, the University excluded from its financial statements the assets in escrow and the Section 9(c) or 9(d) bonds payable that were defeased “in-substance.” For the year ended June 30, 2012, bonds payable considered defeased in previous years have all been called and paid, resulting in no balances considered defeased.
C. Foundation Debt
The Foundation’s long-term debt consists of $5,425,528 outstanding at June 30, 2012, in notes payable to SunTrust Bank at a fixed interest rate of 3.64 percent, and maturing through 2014. The note is secured by a deed of trust on real estate acquired with the proceeds of the note.
30
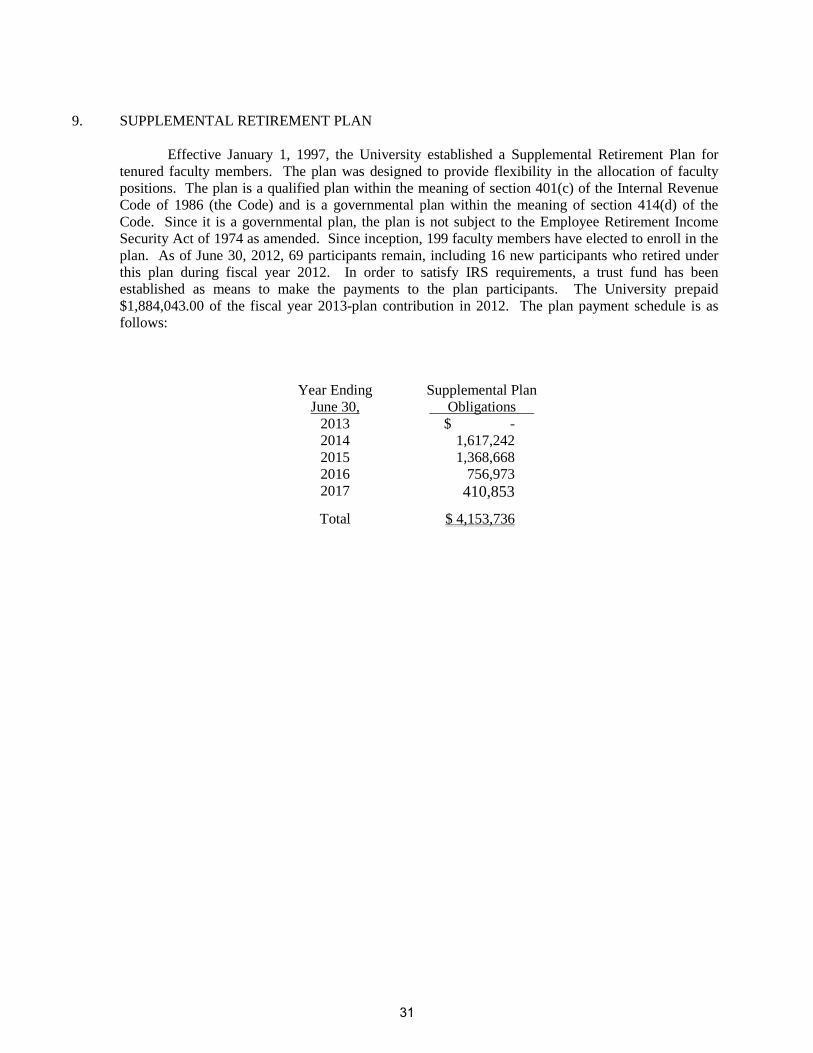
9. SUPPLEMENTAL RETIREMENT PLAN
Effective January 1, 1997, the University established a Supplemental Retirement Plan for
tenured faculty members. The plan was designed to provide flexibility in the allocation of faculty positions. The plan is a qualified plan within the meaning of section 401(c) of the Internal Revenue Code of 1986 (the Code) and is a governmental plan within the meaning of section 414(d) of the Code. Since it is a governmental plan, the plan is not subject to the Employee Retirement Income Security Act of 1974 as amended. Since inception, 199 faculty members have elected to enroll in the plan. As of June 30, 2012, 69 participants remain, including 16 new participants who retired under this plan during fiscal year 2012. In order to satisfy IRS requirements, a trust fund has been established as means to make the payments to the plan participants. The University prepaid $1,884,043.00 of the fiscal year 2013-plan contribution in 2012. The plan payment schedule is as follows:
Year Ending June 30,
Supplemental Plan Obligations
2013 $ - 2014 1,617,242 2015 1,368,668 2016 756,973 2017 410,853
Total $ 4,153,736
31
10. AUXILIARY ACTIVITIES
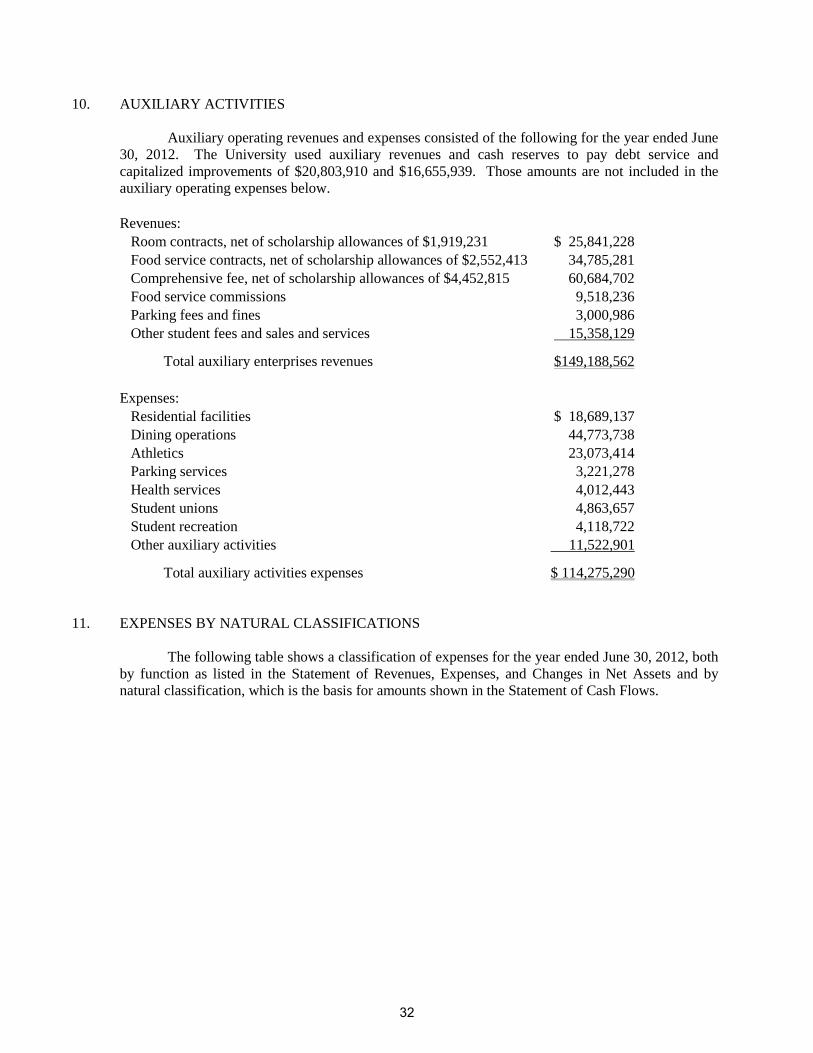
Auxiliary operating revenues and expenses consisted of the following for the year ended June 30, 2012. The University used auxiliary revenues and cash reserves to pay debt service and capitalized improvements of $20,803,910 and $16,655,939. Those amounts are not included in the auxiliary operating expenses below.
Revenues: Room contracts, net of scholarship allowances of $1,919,231 $ 25,841,228 Food service contracts, net of scholarship allowances of $2,552,413 34,785,281 Comprehensive fee, net of scholarship allowances of $4,452,815 60,684,702 Food service commissions 9,518,236 Parking fees and fines 3,000,986 Other student fees and sales and services 15,358,129 Total auxiliary enterprises revenues $149,188,562
Expenses: Residential facilities $ 18,689,137 Dining operations 44,773,738 Athletics 23,073,414 Parking services 3,221,278 Health services 4,012,443 Student unions 4,863,657 Student recreation 4,118,722 Other auxiliary activities 11,522,901 Total auxiliary activities expenses $ 114,275,290
11. EXPENSES BY NATURAL CLASSIFICATIONS
The following table shows a classification of expenses for the year ended June 30, 2012, both by function as listed in the Statement of Revenues, Expenses, and Changes in Net Assets and by natural classification, which is the basis for amounts shown in the Statement of Cash Flows.
32

Compensation and Benefits
Services, Supplies and
Utilities
Scholarships and
Fellowships
Non-capitalized equipment,
property and plant improvements Depreciation Total
Instruction $ 110,950,035 $ 15,272,339 $ - $ 2,672,634 $ - $128,895,008 Research 3,845,157 5,750,221 - 299,739 - 9,895,117 Public service 8,054,009 4,006,788 - 206,151 - 12,266,948 Academic support 22,712,824 4,263,381 - 8,220,488 - 35,196,693 Student services 9,972,938 3,980,407 - 242,640 - 14,195,985 Institutional support 15,392,467 5,745,616 - 1,167,345 - 22,305,428 Operation and maint- tenance – plant 12,879,433 14,195,121 - 4,936,421 - 32,010,975 Depreciation - - - - 29,522,591 29,522,591 Student aid - - 8,497,679 - - 8,497,679 Auxiliary activities 34,040,241 75,999,397 - 4,235,652 - 114,275,290 Total $217,847,104 $129,213,270 $8,497,679 $21,981,070 $29,522,591 $407,061,714 12. STATE APPROPRIATIONS
The University receives state appropriations from the General Fund of the Commonwealth.
The Appropriation Act specifies that such unexpended appropriations that remain on the last day of the current year, ending June 30, 2012, shall be re-appropriated for expenditure in the first month of the next year, beginning on July 1, 2012, except as may be specifically provided otherwise by the General Assembly. The Governor may, at his discretion, unallot funds from the re-appropriated balances that relate to unexpended appropriations.
During the year ending June 30, 2012 the following adjustments were made to the
University’s original appropriations:
Original legislative appropriation: Educational and general programs $61,715,667 Student financial assistance 7,129,893 Supplemental adjustments: Central Fund appropriation transfers: Reversal of delayed retirement contribution payments 803,534 Health insurance premium 253,321 Cost of salary increase 196,134 Changes in contribution rates for retirement and benefits 92,352 Changes in retirement benefits of new and future employees (188,622) Other financial aid transfers 248,128 Other 24,457 Reversion to the General Fund of the Commonwealth (1,540,232) Adjusted appropriation $68,734,632
33
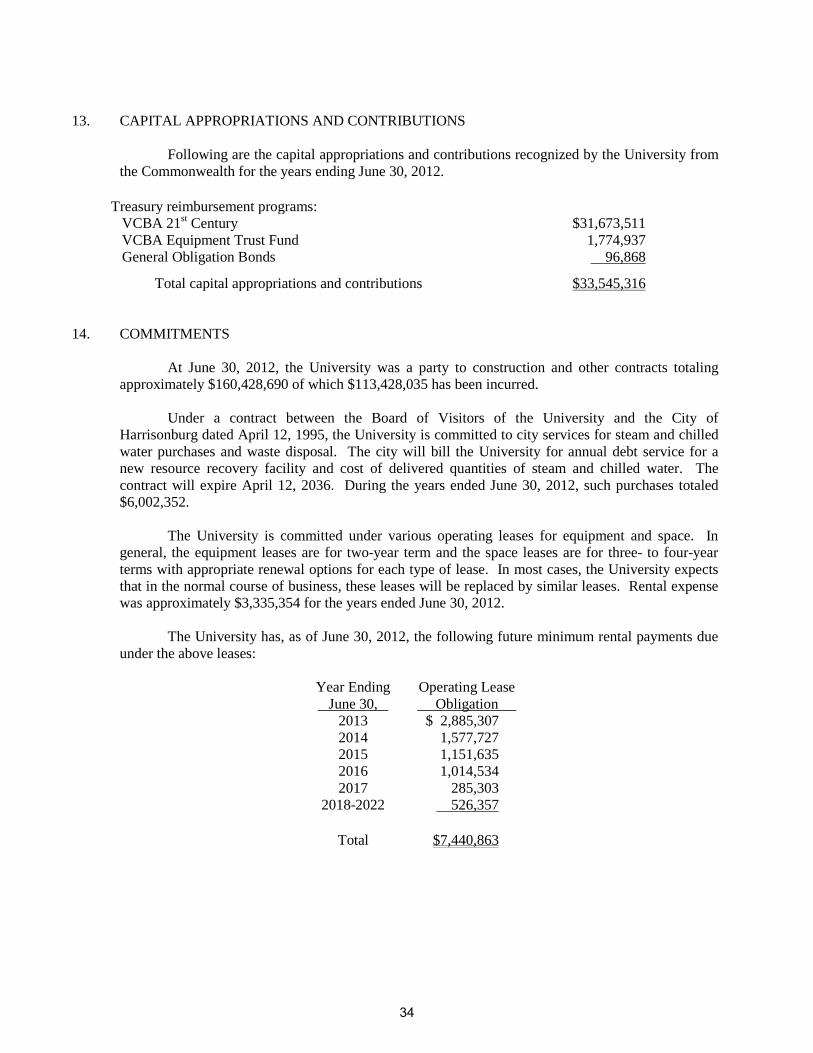
13. CAPITAL APPROPRIATIONS AND CONTRIBUTIONS
Following are the capital appropriations and contributions recognized by the University from
the Commonwealth for the years ending June 30, 2012.
Treasury reimbursement programs: VCBA 21st Century $31,673,511 VCBA Equipment Trust Fund 1,774,937 General Obligation Bonds 96,868 Total capital appropriations and contributions $33,545,316
14. COMMITMENTS
At June 30, 2012, the University was a party to construction and other contracts totaling
approximately $160,428,690 of which $113,428,035 has been incurred.
Under a contract between the Board of Visitors of the University and the City of Harrisonburg dated April 12, 1995, the University is committed to city services for steam and chilled water purchases and waste disposal. The city will bill the University for annual debt service for a new resource recovery facility and cost of delivered quantities of steam and chilled water. The contract will expire April 12, 2036. During the years ended June 30, 2012, such purchases totaled $6,002,352.
The University is committed under various operating leases for equipment and space. In general, the equipment leases are for two-year term and the space leases are for three- to four-year terms with appropriate renewal options for each type of lease. In most cases, the University expects that in the normal course of business, these leases will be replaced by similar leases. Rental expense was approximately $3,335,354 for the years ended June 30, 2012.
The University has, as of June 30, 2012, the following future minimum rental payments due
under the above leases:
Year Ending June 30,
Operating Lease Obligation
2013 $ 2,885,307 2014 1,577,727 2015 1,151,635 2016 1,014,534 2017 285,303
2018-2022 526,357
Total $7,440,863
34
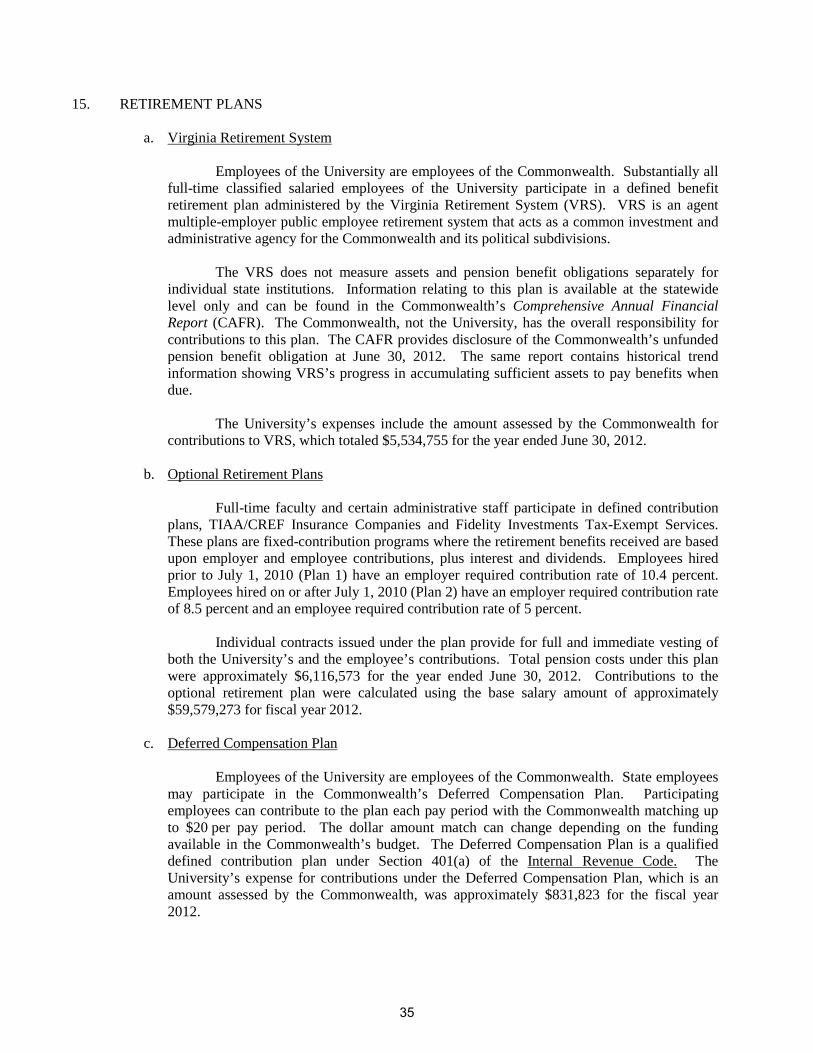
15. RETIREMENT PLANS
a. Virginia Retirement System
Employees of the University are employees of the Commonwealth. Substantially all full-time classified salaried employees of the University participate in a defined benefit retirement plan administered by the Virginia Retirement System (VRS). VRS is an agent multiple-employer public employee retirement system that acts as a common investment and administrative agency for the Commonwealth and its political subdivisions.
The VRS does not measure assets and pension benefit obligations separately for
individual state institutions. Information relating to this plan is available at the statewide level only and can be found in the Commonwealth’s Comprehensive Annual Financial Report (CAFR). The Commonwealth, not the University, has the overall responsibility for contributions to this plan. The CAFR provides disclosure of the Commonwealth’s unfunded pension benefit obligation at June 30, 2012. The same report contains historical trend information showing VRS’s progress in accumulating sufficient assets to pay benefits when due.
The University’s expenses include the amount assessed by the Commonwealth for
contributions to VRS, which totaled $5,534,755 for the year ended June 30, 2012.
b. Optional Retirement Plans
Full-time faculty and certain administrative staff participate in defined contribution plans, TIAA/CREF Insurance Companies and Fidelity Investments Tax-Exempt Services. These plans are fixed-contribution programs where the retirement benefits received are based upon employer and employee contributions, plus interest and dividends. Employees hired prior to July 1, 2010 (Plan 1) have an employer required contribution rate of 10.4 percent. Employees hired on or after July 1, 2010 (Plan 2) have an employer required contribution rate of 8.5 percent and an employee required contribution rate of 5 percent.
Individual contracts issued under the plan provide for full and immediate vesting of
both the University’s and the employee’s contributions. Total pension costs under this plan were approximately $6,116,573 for the year ended June 30, 2012. Contributions to the optional retirement plan were calculated using the base salary amount of approximately $59,579,273 for fiscal year 2012.
c. Deferred Compensation Plan
Employees of the University are employees of the Commonwealth. State employees
may participate in the Commonwealth’s Deferred Compensation Plan. Participating employees can contribute to the plan each pay period with the Commonwealth matching up to $20 per pay period. The dollar amount match can change depending on the funding available in the Commonwealth’s budget. The Deferred Compensation Plan is a qualified defined contribution plan under Section 401(a) of the Internal Revenue Code. The University’s expense for contributions under the Deferred Compensation Plan, which is an amount assessed by the Commonwealth, was approximately $831,823 for the fiscal year 2012.
35
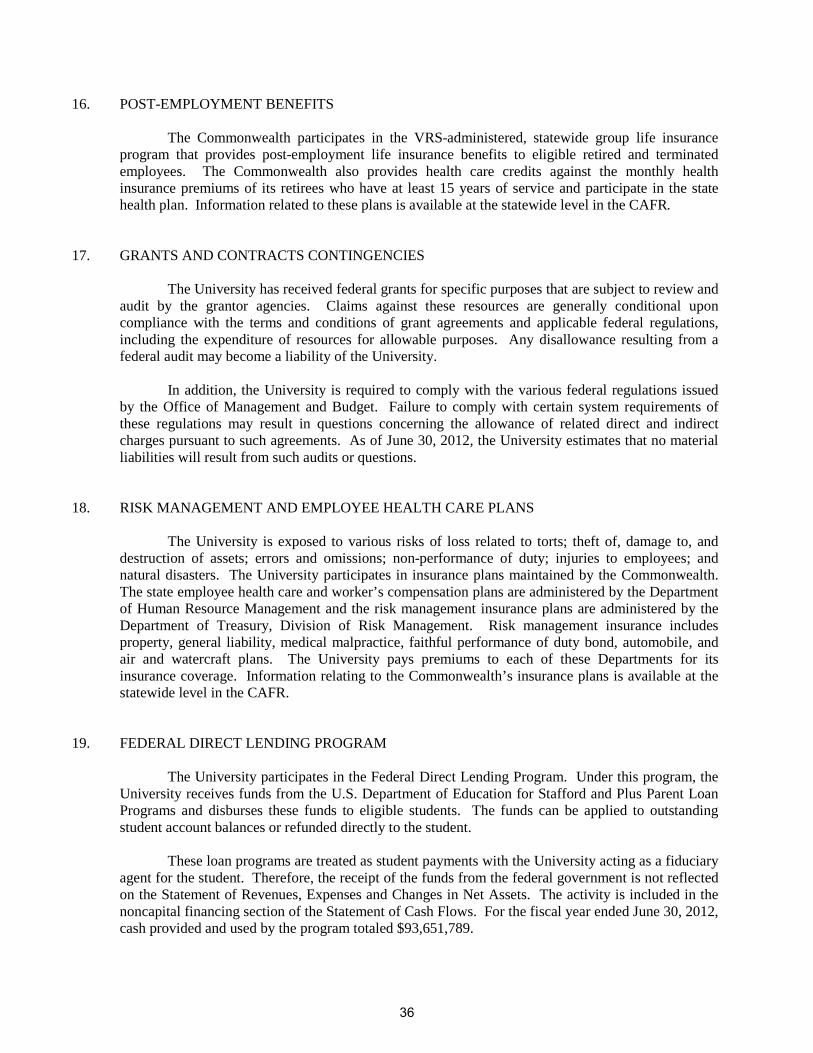
16. POST-EMPLOYMENT BENEFITS
The Commonwealth participates in the VRS-administered, statewide group life insurance program that provides post-employment life insurance benefits to eligible retired and terminated employees. The Commonwealth also provides health care credits against the monthly health insurance premiums of its retirees who have at least 15 years of service and participate in the state health plan. Information related to these plans is available at the statewide level in the CAFR.
17. GRANTS AND CONTRACTS CONTINGENCIES
The University has received federal grants for specific purposes that are subject to review and audit by the grantor agencies. Claims against these resources are generally conditional upon compliance with the terms and conditions of grant agreements and applicable federal regulations, including the expenditure of resources for allowable purposes. Any disallowance resulting from a federal audit may become a liability of the University.
In addition, the University is required to comply with the various federal regulations issued
by the Office of Management and Budget. Failure to comply with certain system requirements of these regulations may result in questions concerning the allowance of related direct and indirect charges pursuant to such agreements. As of June 30, 2012, the University estimates that no material liabilities will result from such audits or questions.
18. RISK MANAGEMENT AND EMPLOYEE HEALTH CARE PLANS
The University is exposed to various risks of loss related to torts; theft of, damage to, and destruction of assets; errors and omissions; non-performance of duty; injuries to employees; and natural disasters. The University participates in insurance plans maintained by the Commonwealth. The state employee health care and worker’s compensation plans are administered by the Department of Human Resource Management and the risk management insurance plans are administered by the Department of Treasury, Division of Risk Management. Risk management insurance includes property, general liability, medical malpractice, faithful performance of duty bond, automobile, and air and watercraft plans. The University pays premiums to each of these Departments for its insurance coverage. Information relating to the Commonwealth’s insurance plans is available at the statewide level in the CAFR.
19. FEDERAL DIRECT LENDING PROGRAM
The University participates in the Federal Direct Lending Program. Under this program, the University receives funds from the U.S. Department of Education for Stafford and Plus Parent Loan Programs and disburses these funds to eligible students. The funds can be applied to outstanding student account balances or refunded directly to the student.
These loan programs are treated as student payments with the University acting as a fiduciary
agent for the student. Therefore, the receipt of the funds from the federal government is not reflected on the Statement of Revenues, Expenses and Changes in Net Assets. The activity is included in the noncapital financing section of the Statement of Cash Flows. For the fiscal year ended June 30, 2012, cash provided and used by the program totaled $93,651,789.
36
20. SUBSEQUENT EVENTS
In October 2012, the University entered into two promissory notes with the Virginia College Building Authority (VCBA) to participate in the Educational Facilities Revenue Bonds Series 2012B, issued by the VCBA under its Pooled Bond Program. The total principal amount of these bonds is $17,900,000. The University will use the proceeds for construction and renovation at the previously purchased Rockingham Memorial Hospital property. The projects include classrooms, faculty offices, student support spaces, and a new student health center. Payment on the notes will be made semi-annually, with an interest rate ranging from 2.0 to 5.5 percent. The final payment will be due in 2033.
37
December 10, 2012 The Honorable Robert F. McDonnell Governor of Virginia The Honorable John M. O’Bannon, III Chairman, Joint Legislative Audit and Review Commission Board of Visitors James Madison University
INDEPENDENT AUDITOR’S REPORT ON FINANCIAL STATEMENTS
We have audited the accompanying financial statements of the business-type activities and the discretely presented component unit of James Madison University, a component unit of the Commonwealth of Virginia, as of and for the year ended June 30, 2012, which collectively comprise the University’s basic financial statements as listed in the table of contents. These financial statements are the responsibility of University management. Our responsibility is to express opinions on these financial statements based on our audit. We did not audit the financial statements of the component unit of James Madison University, which is discussed in Note 1. Those financial statements were audited by other auditors whose report thereon has been furnished to us, and our opinion, insofar as it relates to the amounts included for the component unit of the University is based on the report of the other auditors. The prior year summarized comparative information has been derived from James Madison University’s 2011 financial statements, and in our report dated March 28, 2012, we expressed an unqualified opinion on the respective financial statements of the University.
We conducted our audit in accordance with auditing standards generally accepted in the United States
of America and the standards applicable to financial audits contained in Government Auditing Standards, issued by the Comptroller General of the United States. Those standards require that we plan and perform the audit to obtain reasonable assurance about whether the financial statements are free of material misstatement. The financial statements of the component unit of the University that was audited by other auditors upon whose report we are relying was audited in accordance with auditing standards generally accepted in the United States of America, but not in accordance with Government Auditing Standards. An audit includes examining, on a test basis, evidence supporting the amounts and disclosures in the financial statements. An audit also includes assessing the accounting principles used and significant estimates made by management, as well as evaluating the overall financial statement presentation. We believe that our audit and the report of other auditors provide a reasonable basis for our opinions.
38

In our opinion, based on our audit and the report of other auditors, the financial statements referred to previously present fairly, in all material respects, the financial position of the business-type activities and discretely presented component unit of James Madison University as of June 30, 2012, and the respective changes in financial position and cash flows, where applicable, thereof for the year then ended, in conformity with accounting principles generally accepted in the United States of America.
Accounting principles generally accepted in the United States of America require that the Management’s Discussion and Analysis on pages 1 through 8 be presented to supplement the basic financial statements. Such information, although not a part of the basic financial statements, is required by the Governmental Accounting Standards Board who considers it to be an essential part of the financial reporting for placing the basic financial statements in an appropriate operational, economic, or historical context. We have applied certain limited procedures to the required supplementary information in accordance with auditing standards generally accepted in the United States of America, which consisted of inquiries of management about the methods of preparing the information and comparing the information for consistency with management’s responses to our inquiries, the basic financial statements, and other knowledge we obtained during our audit of the basic financial statements. We do not express an opinion or provide any assurance on the information because the limited procedures do not provide us with sufficient evidence to express an opinion or provide any assurance.
In accordance with Government Auditing Standards, we have also issued our report dated
December 10, 2012, on our consideration of the University’s internal control over financial reporting and on our tests of its compliance with certain provisions of laws, regulations, contracts and grant agreements and other matters. The purpose of that report is to describe the scope of our testing of internal control over financial reporting and compliance and the results of that testing, and not to provide an opinion on the internal control over financial reporting or on compliance. That report is an integral part of an audit performed in accordance with Government Auditing Standards and should be considered in assessing the results of our audit. AUDITOR OF PUBLIC ACCOUNTS
39
JAMES MADISON UNIVERSITY
BOARD OF VISITORS As of June 30, 2012
Mr. James E. Hartman Rector
Mr. Joseph K. Funkhouser, II
Vice Rector
Susan Allen Leslie Gilliam Kenneth Bartee Don Rainey Pablo Cuevas Larry M. Rogers Ronald C. Devine Steve Smith Barry DuVal Judith S. Strickler Vanessa M. Evans Fred Thompson Lois J. Forbes
Jacob Mosser, Student Representative
Donna L. Harper Secretary to the Board of Visitors
OFFICERS
Linwood H. Rose President
Charles W. King, Jr. Senior Vice President for Administration and Finance
John F. Knight Assistant Vice President for Finance
40


