Jakarta Market Report 2010 - Colliers
29
COLLIERS INTERNATIONAL | JAKARTA Property Market Overview www.colliers.co.id MARKET OVERVIEW | MARCH | 2010 Our Knowledge is your Property INDONESIAN ECONOMIC INDICATOR 2005 2006 2007 2008 2009 Economic Growth (% YoY) 5.70 5.50 6.30 6.10 4.50 Inflation Rate (%) 17.11 6.60 6.59 11.06 2.78 1 Exchange Rate (Rp/US$) 9,695 8,980 9,124 9,672 10,325 1 Interest Rate - Central Bank Rate (%) 12.75 9.75 8.00 9.25 6.50 2 ECONOMIC INDICATORS Source: Statistics Indonesia, Finance Department, Bank Indonesia Notes: 1 January - December 2009 2 December 2009
-
Upload
endrohierarki -
Category
Documents
-
view
550 -
download
8
Transcript of Jakarta Market Report 2010 - Colliers

c o l l i e r s i n t e r n at i o n a l | J a K a rta
Property Market overview
www.colliers.co.id
M a r K e t oV e rV i e W | M a r c H | 2 0 1 0
Our Knowledge is your Property
INDONESIAN ECONOMIC INDICATOR
2005 2006 2007 2008 2009
economic Growth (% YoY) 5.70 5.50 6.30 6.10 4.50
inflation rate (%) 17.11 6.60 6.59 11.06 2.781
exchange rate (rp/Us$) 9,695 8,980 9,124 9,672 10,3251
interest rate - central Bank rate (%) 12.75 9.75 8.00 9.25 6.502
econoMic inDicators
Source: Statistics Indonesia, Finance Department, Bank Indonesia
Notes:1 January - December 2009 2 December 2009

colliers international2
The Knowledge Report | March | 2010 | Quarterly Research Report
BUilDinG naMe location eXPecteD coMPletion
in the CBD area
Bakrie tower rasuna said 2010
Menara Bidakara 2 Gatot subroto 2010
Graha 18 scBD 2010
equity tower scBD 2010
the oval (the office @Kuningan city) satrio 2011
sentral senayan 3 asia afrika 2011
eighty8 Kasablanka 2011
Menara allianz Kuningan 2011
tempo scan tower rasuna said 2011
ciputra office tower satrio 2012
office 8 senopati 2012
Wtc 2 sudirman 2012
in the outside CBD area
Grand Kebon sirih Kebon sirih 2010
Menara MtH Mt Haryono 2010
Kem tower Kemayoran 2010
central office Park s. Parman 2011
Gandaria 8 Gandaria 2011
Menara 165 tB simatupang 2011
Mt Haryono square cawang 2011
sovereign Plaza tB simatupang 2012
total space 782,830 sq m
list oF oFFice BUilDinGs UnDer constrUction
Source: Colliers International Indonesia - Research Department
Of all new buildings projected for the whole of 2009, only Bakrie Tower postponed opera-tion and will likely enter around March 2010; while Equity Tower, which was previously expected to finish in 2011, made speedy con-struction progress and will likely start operat-ing in May 2010. Therefore, the projection of office space in 2010, previously only two buildings (Menara Bidakara 2 dan Graha 18) is now four buildings (including the above-mentioned), adjusting the total supply from 64,000 to 210,800 sq m.
Thus, during 4Q2009, only Cyber 2 (located on Jalan HR Rasuna Said) was officially in op-eration. Cyber 2 was partly offered as strata-title office for sale and office space for lease.
Adding around 53,600 sq m, Cyber 2 brought 2009 annual supply to 281,140 sq m, or 53% higher than the total annual supply of 2008. All in all, the CBD now has a total of around 4.05 million sq m of office space.
Outside the CBD area, the office market did not register any new buildings. With no addi-tional stock within the area, cumulative sup-ply in this area hovered at around 1.66 mil-lion sq m. This year we shall see several office buildings placed in the market. Unlike supply in 2009, where only two buildings, totaling around 23,800 sq m, were the only supply, supply projection for 2010 would be around 121,000 sq m from six buildings.
oFFice sector
sUPPlY

colliers international 3
The Knowledge Report | March | 2010 | Quarterly Research Report
With around 281,140 sq m of office space entering during the whole of 2009, the YoY occupancy rate from 2008 to 2009 fell some-what, from 90.3% to 87.1% in the CBD area. The determinant factor in declining oc-cupancy level was not just significant supply but also the financial crisis early in the year, which impacted the pace of inquiries for office space. However, as mentioned in our previous report, the office market had begun to move forward from the third quarter of 2009. De-spite the slow growth, signs of recovery have become clear and will likely continue during 2010. Other than a sound economic perfor-mance, a smaller supply projection for the whole of 2010 could be the catalyst to balance supply and demand.
Meanwhile, the QoQ occupancy level moved only marginally, from 87.2% to 87.1%.
During the last quarter 2009, Cyber 2 has secured big tenants, such as Northstar Pa-cific, Marquee Executive Offices and Danone, totalling almost 25,000 sq m (not including other smaller tenants). With all the early pre-commitments, the commitment level of this building has reached more than 80%. Other buildings which were projected to complete this year have also registered high pre-com-mitment levels; in The Plaza, for example, a new building coming into operation during the “financial crisis” has secured significant transactions of around 5,000 sq m each by BMW and Sime Darby. During the reviewed
quarter itself, The Plaza has handed over more than 12,000 sq m to several companies. The resurrection of the office market was further seen in the acquisition of three major deals in Sental Senayan II. Other smaller transactions also emphasized that this sector is beginning to move forward.
With offices for sale, new strata-title office buildings have shown a sound performance. Bakrie Tower will be mostly occupied by tenants from their own group, while Equity Tower has secured a high pre-commitment level before really in operation.
From a business line perspective, the quarter’s active lessees include industries like banking, insurance and others. Our records show that most transactions were predominantly small- to medium-sized deals.
A similar trend was also seen in the outer CBD area, where occupancy levels shifted up moderately, by less than 1%, to 87.8%. Compared to the occupancy level at the year’s end, the YoY occupancy rate posed a posi-tive trend, moving from 86% in 2008. In this quarter, transactions in the non-CBD area were mostly due to the expansion of existing tenants. We also noticed the continuing relo-cation of big tenants, who decided to consoli-date their several office locations. In general, we did not notice a significant movement of tenants during the quarter and this helped maintain the current occupancy level.
DeManD
70%
75%
80%
85%
90%
95%
100%
0
1,000,000
2,000,000
3,000,000
4,000,000
5,000,000
6,000,000
2002 2003 2004 2005 2006 2007 2008 2009P 2010P 2011P 2012P
Demand Supply Occupancy Rate
cBD oFFice: cUMUlatiVe sUPPlY, DeManD anD occUPancY rate
Source: Colliers International Indonesia - Research Department

colliers international4
The Knowledge Report | March | 2010 | Quarterly Research Report
Source: Colliers International Indonesia - Research Department
While occupancy trends slightly declined, ask-ing rental rates by contrast posed a strength-ening YoY trend of 7%, while the QoQ trend recorded a 3% increase from Rp92,988/sq m/month previously to Rp95,611/sq m/month. The upward trend was mostly triggered by buildings which had just finished renovations and wanted to compete with newer build-ings in the neighbourhood. Most of the cases where rental rates were adjusted were due to management policy. Further, the influx of new buildings with high occupancy levels has also contributed to the increase in overall asking rental rates.
In the U.S. dollar-denominated buildings, the average asking rental rate remained the same as in the previous quarter. All buildings with US$ rents continued to maintain prices at the same level from quarter to quarter.
In the outer CBD area, no significant changes were made during the reviewed quarter and the average asking rental rates remained rela-tively flat, at Rp67,895/sq m/month. Likewise, average asking rental rates for U.S. dollar-de-nominated buildings did not change substan-tially, staying at US$11.94/sq m/month.
asKinG rental rates
serVice cHarGesAverage service charge for building in the CBD has increased only slightly, from Rp49,523 to Rp50,057/sq m/month. For some landlords who applied service charges adjustment in the quarter, the main reason was largely major refurbishment work, such as upgrading public equipment and facili-ties. On the other hand, buildings with U.S. dollar charges registered no change in the
maintenance tariff and maintained at around US$5.98/sq m/month.
The overall service charge tariff in the outer CBD area rose to Rp35,024, up by 2% com-pared to the previous quarter. Likewise, the average service charge cost in this area hov-ered at around US$4.66/sq m/month.
$10.37 $11.37 $12.37 $13.37 $14.37 $15.37 $16.37 $17.37 $18.37 $19.37 $20.37 $21.37 $22.37 $23.37
Rp0Rp10,000Rp20,000Rp30,000Rp40,000Rp50,000Rp60,000Rp70,000Rp80,000Rp90,000
Rp100,000Rp110,000Rp120,000Rp130,000Rp140,000
2004 2005 2006 2007 2008 2009
Rupiah US$
aVeraGe Gross rent annUallY

colliers international 5
The Knowledge Report | March | 2010 | Quarterly Research Report
The office sector will move forward, largely due to expectations of positive economic growth. For some periods we have found that economic growth has shown very strong cor-relation with the growth of the office sector, particularly in the rental and occupancy rates. This has been further emphasized by some indications such as continued higher office space absorption and controlled rental level resulting from space inquiries. Further to that, the relatively “in control” supply projection for 2010 will help regulate the balance be-tween supply and demand.
We anticipate that the pattern of office oc-cupiers will be similar to those in the previous period, when office leasing was dominated by small to medium transactions. In 2010 we still expect more companies to vacate older build-ings and relocate to newer buildings. This pat-tern would help buildings under construction or even those at the planning stage to secure pre-commitment level before being actually in operation.
In the period ahead, it is likely that asking rental rates would continue a positive trend. This will largely be contributed by relatively new buildings with decreasing vacancy rates.
oUtlooK

colliers international6
The Knowledge Report | March | 2010 | Quarterly Research Report
Shadowed by the global economic crisis, the apartment market experienced slowing activi-ties in early 2009. Supply grew by only 1.2% in the first three months of the year as most property players held a ‘wait and see’ view. Nevertheless, the relatively stable country’s economic indicators warmed up the develop-ers’ machine to continue developing their property in the remaining quarter of 2009. Tougher and tighter condition during the
year made apartment stock grow modestly by 13.4% y-o-y, with around 9,028 new ad-ditional units from a total of 14 projects, as compared to the previous year, when around 9,900 units entered the market from a total of 20 projects. One rusunami project of Me-nara Cawang, providing 3,000 units and a large-scale project of Thamrin Residence with 1,100 units, contributed the most to 2009’s annual supply.
aPartMent sector
aPartMent strata-title For sale
sUPPlY
DeVeloPMent location reGion
Kuningan Place (infinia and Ultima tower) Jalan Kuningan Madya 2010
Permata Hijau residence Jalan letjen. supeno 2010
the Boulevard Jalan Fachrudin 2010
sahid sudirman residence Jalan Jend. sudirman 2010
Grand surya Pegadungan, Kalideres 2011
Maple Park Golf View (tower a) Jalan Danau sunter Barat 2011
regatta (3 tower) Jalan Pantai Mutiara 2011
thamrin residence (tower c, D, e) Jalan Hr rasuna said 2011
Keraton Hyatt residence Jalan MH thamrin 2011
Menara cawang Jalan sMa 14, cawang 2012
Kebagusan city (tower a) Jalan Baung 2012
Gardenia Boulevard Warung Buncit 2012
the lavande Jalan supomo 2010
Best Western Mangga Dua Jalan Mangga Dua abdad 2010
total 9,028 unit
list oF ProJects enterinG tHe MarKet in 2009
Source: Colliers International Indonesia - Research Department
The East Jakarta area received the largest an-nual supply in 2009 from the completion of the Menara Cawang (rusunami project) with total of around 3,000 units. The CBD and
South Jakarta also had significant additional units, with 2,234 and 1,984 units, respec-tively.

colliers international 7
The Knowledge Report | March | 2010 | Quarterly Research Report
cUMUlatiVe aPartMent sUPPlY
Source: Colliers International Indonesia - Research Department
In the last quarter of 2009 around 1,418 ad-ditional units were recorded from three newly completed projects, bringing cumulative supply to 76,338 units as at the end of 2009. Around 9% of total supply was classified as rusunami units (the abbreviation of rumah
susun milik or low-cost multi-family residence subsidized by the government). Based on mar-ket segmentation, middle-low class apartment units dominated the market by 46%. These classes are found largely in West, North and Central Jakarta area.
DistriBUtion oF aPartMent For strata-title sale BaseD on MarKet seGMentation
Source: Colliers International Indonesia - Research Department
Low24.1%
Middle Low45.5%
Middle Upper19.3%
Upper7.9%
Luxury3.2%
Unlike the previous year, when it dominated market activities, during 2009 rusunami devel-opment was sluggish. Many ambiguous factors related to government support on rusunami-subsidized schemes and its regulation had re-strained the acceleration of development pro-cess and thus rescheduled completion targets. With changes in the projection we anticipate that future supply would include quite a few
from rusunami projects and other apartment projects. If all projects meet their schedule, there will be around 27,795 new units project-ed to enter the market in 2010, with 55% of them classified as rusunami units. Further, in 2011, the market anticipates another 18,400 new units, 25% of them rusunami. Supply pro-jection in 2012 will ease, with only 959 new units and with no rusunami projects.
-
2,000
4,000
6,000
8,000
10,000
12,000
14,000
16,000
18,000
20,000
CBD Central Jakarta South Jakarta North Jakarta East Jakarta West Jakarta
Tot
al U
nit
Existing 2008 Annual 2009

colliers international8
0
20,000
40,000
60,000
80,000
100,000
120,000
140,000
2005 2006 2007 2008 2009 2010(p) 2011(p) 2012(p)
Tot
al U
nit
The Knowledge Report | March | 2010 | Quarterly Research Report
Source: Colliers International Indonesia - Research Department
FUtUre aPartMent For strata-title sale ProJects BY MarKet seGMentation
cUMUlatiVe sUPPlY oF aPartMents For strata-title sale UP to 2012(P)
Source: Colliers International Indonesia - Research Department
If we remove rusunami units from the future supply list, a total of 27,331 units are predicted to enter the market up to 2012. Middle-upper and middle-lower classes will be dominating the composition of future units, with 39%
and 35%, respectively, followed by upper-class units, with 20%. Luxury and low-class units will be in the minority, with 4% and 2% of the total additional units.
WitH rUsUnaMi Units WitHoUt rUsUnaMi Units
Demand for apartment units in Jakarta is still dominated by the investor type of buyers, as this sector continues to offer interesting returns. A relatively increasing capital gain becomes a major attraction for investor buy-
ers. However, given the fact that only selected projects are considered to have potential investment return, the overall market still indicated a downturn in the take-up rate.
DeManD
0
1,000
2,000
3,000
4,000
5,000
6,000
CBD Central Jakarta
South Jakarta
North Jakarta
East Jakarta
West Jakarta
Tot
al U
nit
Low Middle-Low Middle-Up Upper Luxury
0
1,000
2,000
3,000
4,000
5,000
CBD Central Jakarta
South Jakarta
North Jakarta
East Jakarta
West Jakarta
Tot
al U
nit
Low Middle-Low Middle-Up Upper Luxury

colliers international 9
The Knowledge Report | March | 2010 | Quarterly Research Report
Source: Colliers International Indonesia - Research Department
Source: Colliers International Indonesia - Research Department
Low class apartment units continued to be the most absorbed segment in the market in 2009. These kinds of units are easily found in West, North, Central and East Jakarta, where take-up rate achieved 76.7%. Upper-class
units that are mostly found in the CBD and South Jakarta area also managed to record a high take-up rate of 76.0%. Other apartment classes, except for middle-upper class, reported healthy take-up rates of above 70.0%.
cUMUlatiVe sUPPlY anD taKe-UP rate oF aPartMent For strata-title sale
Our survey revealed that the average take-up rate as at the end of 2009 had minor incre-ments, to 71.6%, from the average of 69.9% in the previous year. This translates into the market having a total of 21,702 unsold units. As shown in the chart, take-up rate is predict-ed to decline to around 62% in 2010 in antici-pation of upcoming completion of more than 25,000 new apartment units in the market.
The CBD area remained the favorite location in the market for apartments and this has re-sulted in a high take-up rate of 78.6%. Sound take-up rate performance was also recorded in the area of South, North and West Jakarta, while other areas in Jakarta managed to see a take-up rate of around 60%.
taKe-UP rate oF aPartMents For strata-title sale
0%
10%
20%
30%
40%
50%
60%
70%
80%
90%
100%
0
20,000
40,000
60,000
80,000
100,000
120,000
2005 2006 2007 2008 2009 2010(p)
Tak
e U
p R
ate
Tot
al U
nit
Cumulative Supply Take-Up Rate
0
2,000
4,000
6,000
8,000
10,000
12,000
14,000
16,000
18,000
20,000
CBD Central Jakarta South Jakarta North Jakarta East Jakarta West Jakarta
Num
ber
of U
nit
Total Unit Sold Unit

colliers international10
The Knowledge Report | March | 2010 | Quarterly Research Report
Source: Colliers International Indonesia - Research Department
aVeraGe Price Per sQUare Meter oF JaKarta aPartMents For strata-title sale
taKe-UP rate BaseD on MarKet seGMentations
Source: Colliers International Indonesia - Research Department
The apartment asking price experienced a slight increment of 4.8% YoY, to an average of Rp11.6 million/sq m, from Rp11.0 million/sq m in 2008.
Adding to its image as a high-end area, South Jakarta area, which comprised projects target-
ing middle-upper to luxury class, managed to achieve a 1.4% increment YoY, to an average of Rp11.5 million/sq m. Apartments in the non-CBD area also registered an increase of 1.3% YoY, to Rp8.6 million/sq m in 2009, while those in the CBD area were stable at Rp15.9 million/sq m.
During the year, developers continue to use marketing gimmicks as effective tools to sell their projects. Regardless of lowering unit prices, developers prefer to provide flexible payment schemes for potential buyers. It is now very common for many developers to lengthen the instalment period and offer low interest rates to win in the competitive market. Further, with such a flexible scheme, transacted prices could be discounted up to 35% from the published price.
The range of offering price in the market was very wide. Low-class units were offered at an average price of Rp5 million/sq m, while mid-dle-class units were offered at an average price of Rp8.7 million/sq m for middle-low class and Rp12.7 million/sq m for middle-upper class. Higher prices were offered by upper-class projects with an average of Rp18.4 million/sq m and luxury class at an average of Rp23.4 million/sq m.
0%
10%
20%
30%
40%
50%
60%
70%
80%
90%
100%
Low Middle Low Middle Up Upper Luxury
Tak
e U
p R
ate
Market Segmentation
asKinG Price
Rp0
Rp2,000,000
Rp4,000,000
Rp6,000,000
Rp8,000,000
Rp10,000,000
Rp12,000,000
Rp14,000,000
Rp16,000,000
Rp18,000,000
2006 2007 2008 2009
Pri
ce/s
q m
CBD South Jakarta Non CBD Average

colliers international 11
The Knowledge Report | March | 2010 | Quarterly Research Report
In 2009, apartments for lease in Jakarta grew slowly. With the trend of leasing units from secondary strata title units, developing a new purely leased apartment became a non-favor-ite option. Concentrating demand on leasing apartments only in certain areas has limited new leased apartment projects.
Apartments for lease only saw one new proj-ect in 2009, from the operation of the third tower of Golf Pondok Indah Apartment in the first half of the year. This apartment proj-ect offered 166 units for lease (non-service) in Pondok Indah, South Jakarta’s elite area. Within the same period, the market also wit-nessed the transformation of Puri Denpasar
apartments into a hotel scheme, thus reducing the cumulative supply by 36 units. Also, with-out additional units in the second half of the year, the market grew by 1.7% YoY, providing a total of 7,835 leasing units up to the end of 2009. Only 52% of these were leasing units with service.
Our survey up to the end of the year noted two new leasing apartments to enter the market in 2010, and probably another three develop-ments in 2011. These projects would provide a total of 381 serviced apartment units. And, for the first time since 1998, West Jakarta area would have new units, at around 55% of the above future units.
Source: Colliers International Indonesia - Research Department
ranGe Price BaseD on MarKet seGMentations
aPartMent For lease sUPPlY
Source: Colliers International Indonesia - Research Department
Rp0
Rp5,000,000
Rp10,000,000
Rp15,000,000
Rp20,000,000
Rp25,000,000
Rp30,000,000
Low Middle Low Middle Up Upper Luxury
Pric
e/ s
q m
Market Segmentation
aPartMent For lease (serViceD anD non serViceD)
sUPPlY
0
500
1,000
1,500
2,000
2,500
3,000
3,500
4,000
4,500
5,000
2005 2006 2007 2008 3Q09 2009(p) 2010(p) 2011(p)
Serviced Apartment Non-Serviced Apartment

colliers international12
The Knowledge Report | March | 2010 | Quarterly Research Report
Location-wise, the CBD and South Jakarta area continue to dominate, providing 45% and 35% of the units, respectively. With dy-
namic business activities, apartments for lease with service were largely available in the CBD area, most classified as middle-upper class.
Source: Colliers International Indonesia - Research Department
sUPPlY oF aPartMents For lease BY location
serViceD aPartMent non serViceD aPartMent
CBD 35%
Central Jakarta
5%
South Jakarta50%
North Jakarta
2%
East Jakarta
1%
West Jakarta
7%
CBD 55%Central
Jakarta10%
South Jakarta20%
North Jakarta
9%
West Jakarta
6%
The demand for apartments for lease in 2009 was largely influenced by the global economic crisis. Tightened accommodation budgets applied by some multinational companies restrained business expansion plans, including expatriate allocations in the country. Thus, apartments at lower rates, or those providing flexible leasing terms, were in high demand. Benefiting from long-stay occupiers, apart-ments for lease (non-service) posted stable
occupancy rates and continued to show grad-ual improvement. In line with the fluctuating number of expatriates in the country, the apartments for lease with service also showed fluctuating occupancy levels during the year. All in all, however, the average occupancy rate of apartments for lease (both non-service and serviced) achieved 69.4%, down from 71.6% in the previous year.
DeManD
Source: Colliers International Indonesia - Research Department
aVeraGe occUPancY rate oF JaKarta aPartMents For lease
0%
10%
20%
30%
40%
50%
60%
70%
80%
90%
100%
2005 2006 2007 2008 2009
Serviced Apartment Non-Serviced Apartment Average
At the end of the year, the South Jakarta area managed to achieve the highest occupancy level, with an average of 70.6%, leaving around 3,239 units vacant. The CBD and Non-CBD areas recorded a similar occupancy
rate, of 68.9%, in the reviewed year. With limited supply available, there were only 1,100 vacant units in the CBD area, with about 16,000 in the non-CBD area.

colliers international 13
The Knowledge Report | March | 2010 | Quarterly Research Report
During 2009, the average asking rental rate of apartments for lease was relatively stable. The minor QoQ discrepancy was more influenced by exchange rate volatility in the calculation process. In general, the average offering rental rate per square metre in 2009 was approxi-mately the same as the year before. Our survey
noted that the average rental rate stayed at an average of US$13.30/sq m/month. However, the average rent per unit registered a 6.4% YoY increment, to an average of US$2,121/unit/month, compared to the previous year’s US$1.994/unit/month.
asKinG rental rate
Source: Colliers International Indonesia - Research Department
Unit occUPieD oF aPartMent For lease (serViceD anD non-serViceD aPartMent)
0
10,000
20,000
30,000
40,000
50,000
60,000
CBD South Jakarta Non CBD
Tot
al U
nit
Total Unit Unit Occupied
$0.00
$2.00
$4.00
$6.00
$8.00
$10.00
$12.00
$14.00
$16.00
$18.00
$20.00
1Q07 2Q07 3Q07 4Q07 1Q08 2Q08 3Q08 4Q08 1Q09 2Q09 3Q09 4Q09
Ren
tal R
ate
(US$
/sqm
/mon
th)
CBD SJ Non CBD Average
aVeraGe occUPancY rate oF JaKarta aPartMents For lease
Source: Colliers International Indonesia - Research Department
In terms of rental/unit/month, apartments for lease (non-service) recorded an average rent of US$1,830/unit/month. In the market, the range was from US$309/unit/month in the non-CBD area to US$8,000/unit/month in the CBD area. Meanwhile, serviced apart-
ments registered an average of US$2,920/unit/month. The lowest rent of this type of apartment was US$1,800/unit/ month, while the highest could reach US$7,000/unit/month.

colliers international14
The Knowledge Report | March | 2010 | Quarterly Research Report
asKinG rental/Unit/MontH
serViceD aPartMent non serViceD aPartMent
Source: Colliers International Indonesia - Research Department
Developers are very much waiting in the hope that new foreign ownership regulation will be released to further trigger apartment sales. In principle, the new regulation will only prolong ownership rights up-front, instead of periodic extension. However, such regulation would be the appetizer for apartment market to grow further against the threat of upcoming supply over the next two years.
Lower interest rates would also give hope for the apartment market to perform better, from the perspective of both buyers and developers. However, again the market should anticipate abundant future supply, which will put pres-sure on price growth. If this happens, develop-ers will continue to offer atractive package prices, such as longer term payment terms, reduced down payment amounts and more subsidies given to the mortgate rate.
oUtlooK
0
1,000
2,000
3,000
4,000
5,000
6,000
7,000
8,000
9,000
CBD South Jakarta Non CBD
Ren
tal (
US$
/uni
t/m
onth
)
0
1,000
2,000
3,000
4,000
5,000
6,000
7,000
8,000
9,000
CBD South Jakarta Non CBD
Ren
tal (
US$
/uni
t/m
onth
)

colliers international 15
The Knowledge Report | March | 2010 | Quarterly Research Report
The average asking rental for expatriate hous-ing was relatively stable in the second half of 2009. During this period, the market saw small new houses being built, scattered in such areas as Kebayoran Baru, Pondok Indah, Cilandak and Cipete, which increased the maximum asking rental slightly. In 2H2009, houses available on the market were offered at the lowest rate of US$2,700 per month all the way up to the highest at US$4,400 per month. Large houses are commonly found in such areas as Menteng, Kuningan, Kebayoran Baru and Pondok Indah, and rental rates can reach above US$10,000 per month. For several
periods, landlords have continued to ask for a minimum leasing period of two years, with payment in advance.
In terms of location, expatriate housing con-tinued to be concentrated in South Jakarta, particularly in the areas of Pondok Indah, Ke-mang, Cilandak and Cipete. These areas pro-vide houses with an average asking rent rang-ing from US$2,800 to US$3,700 per month. Higher asking rents of around US$4,000 per month are seen in such areas as Menteng and Kebayoran Baru, which benefit from their vi-cinity to the CBD.
eXPatriate HoUsinG rental rates (1H2009)
Source: Colliers International Indonesia - Residential/Tenant/Investor Representation Services
In 2H2009, the expatriate housing market benefited from the recovery of the Indonesian economy following the global financial crisis that started in the same period. Nevertheless, as frequently occurs, the market at year-end was challenged with slowing leasing activity.
Meanwhile, the active demand in the market continued to be dominated by expatriates and their families looking for housing in the areas of Pondok Indah, Cilandak, Cipete and Kemang, with a budget of between US$3,000
and US$4,000 per month. The proximity to complete entertainment and education fa-cilities with good infrastructure and security within the area become key factors in location preference.
During the second half of the year, housing requests came from banking, oil and gas com-panies. In addition, demand for expat quality housing also came from the pharmaceutical sector.
eXPatriate HoUsinG anD aPartMents
eXPatriate HoUsinG
sUPPlY anD rental rates
DeManD
areaasKinG rates (Us$/Unit/MontH)* aVeraGe size (sQ M)
loW HiGH aVeraGe BUilDinG lanD
Menteng $2,000 $12,000 $4,148 762 960
Kuningan $2,000 $10,000 $3,563 475 758
Kebayoran Baru $2,000 $15,000 $4,413 574 658
Kemang $1,500 $8,000 $2,882 520 858
Pondok indah $2,000 $12,500 $3,707 539 645
Permata Hijau $2,000 $6,000 $3,413 629 757
lebak Bulus $1,500 $5,000 $2,700 580 1,158
Pejaten $1,500 $7,000 $3,106 534 1,000
cilandak $1,500 $7,500 $2,986 496 849
cipete $1,500 $5,500 $2,984 464 777
* Majority are Unfurnished

colliers international16
The Knowledge Report | March | 2010 | Quarterly Research Report
Several companies with limited budgets for their expatriate staff accommodation caused demand for apartments with reasonable rentals to rise. This trend among affordable accommodation triggered some projects to in-crease their asking rental rate, particularly for three-bedroom apartments. Thus, the asking rental rate for selected expatriate apartments recorded a moderate increase in 2H2009.
Individual owners commonly asked for a one year minimum lease period, with payment in advance. Shorter leasing periods could be obtained from apartments managed by deve-lopers.
Source: Colliers International Indonesia - Research Department
selecteD eXPatriate aPartMents
In general, the leasing apartment market saw a decrease in the occupancy rate in the second half of the year. The year-end period is usually the time when contracts expire/are terminated as short-term workers fly back to their home countries. The Jakarta market recorded an average occupancy rate of 69.4% in 2H2009, down from 71.3% in the previous half.
In the midst of this downward trend in oc-cupancy rate, selected expatriate apartments experienced only a minor decrease, with the average occupancy rate at 83.6%, down from 83.9% in the previous half.
Demand for apartments in this half of the year continued to come from individuals or couples with a need for efficiency and flex-ibility. These tenants mostly had a budget of between US$2,000 and US$3,500 per month for a three-bedroom apartment.
Similar to the previous half, The Pakubuwono Residence, which provides the most compre-hensive facilities in Jakarta, remained the most preferred option for expatriates. High demand was also seen for the new tower of Pondok In-dah Golf in South Jakarta.
aPartMentaVeraGe Us$ asKinG rent/MontH aVeraGe
occUPancY2Br 3Br 4Br
Dharmawangsa, sailendra na 3,500 - 5,000 3,500 - 6,500 80.00%
Four seasonsPlaza senayan, the Plaza residence
na2,200 - 4,500 3,500 - 5,000 5,000 - 6,500 88.33%
the residence, Golf Pondok indah, Bukit Golf, ascott, Menteng executive
2,200 - 3,500 2,500 - 4,000 4,600 - 5,000 85.00%
aston, Batavia, Pavillion Park, Permata Hijau, Puri casablanca, casablanca
1,200 - 3,000 1,500 - 3,500 2,500 - 4,000 75.00%
taman rasuna, semanggi, slipi, Kintamani, taman Pasadenia, Puri imperium
500 - 1,500 700 - 2,600 2,500 - 3,500 75.00%
all 500 - 4,500 700 - 5,000 2,500 - 6,500 83.60%
eXPatriates aPartMents
rental rates
occUPancY
DeManD

colliers international 17
The Knowledge Report | March | 2010 | Quarterly Research Report
selecteD aPartMents MarKeteD For sale
naMe location Price ranGe/Unit coMPletion Year
Kempinski residence cBD Us$300,000 - Us$700,000 2008
Kraton Grand Hyatt residence cBD Us$160,000 - Us$200,000 2009
the Pakubuwono View south Jakarta Us$290,000 - Us$420,000 2010
one at cik Ditiro central Jakarta Us$80,000 - Us$250,000 2010
Source: Colliers International Indonesia - Research Department
Note: US$1 is around Rp 10,000
With an optimistic projection for the economy in 2010, the expatriate house and apartment market is also expected to rise. Further, the soon-to-be-effective China Asian Free Trade Area (CAFTA) will cause the expatriate
residential market to increase as more expatri-ates move to Indonesia, particularly Jakarta. Given this, suppliers should prepare carefully in anticipation of the accommodation needed to meet this possible new demand.
oUtlooK

colliers international18
The Knowledge Report | March | 2010 | Quarterly Research Report
Although the country’s economy was af-fected by the impact of the global economic crisis during 2009, Jakarta’s retail market still recorded 8.9% YoY growth, well below the previous year’s growth of 16.7%. As listed in the table, 2009’s annual supply was mainly from North and Central Jakarta, entering the
market in the first and third quarters. Almost all centers, except for Koja Trade Mall, were developed by major retail players, e.g. Agung Podomoro Group, Summarecon Group, Plaza Indonesia Realty, Jaya Real Property and Lippo Group.
retail sector
sUPPlY
retail center naMe location MarKetinG scHeMe
DeVeloPer
central Park central Jakarta for lease agung Podomoro Group
emporium Pluit north Jakarta for lease agung Podomoro Group
Kelapa Gading Mall Phase V north Jakarta for lease Pt summarecon agung
Koja trade Mall north Jakarta for strata title sale Pt Maju sentosa cemerlang
Plaza indonesia extension central Jakarta for lease Pt Plaza indonesia realty
Pusat Grosir senen Jaya central Jakarta for strata title sale Pt Jaya real Property
PX Pavillion st Moritz West Jakarta for strata title sale lippo Group
season city West Jakarta for strata title sale agung Podomoro Group
total : 309,681 sq m
neW retail centers in 2009
Source: Colliers International Indonesia - Research Department
The operation of six new retail centers plus two mall extensions increased the cumula-tive retail space by 309,681 sq m, to a total of 3.77 million sq m, at end-2009. Around 65% of this is classified as retail center for lease, with most located in the non-CBD area, par-ticularly in the southern and northern areas. Central Jakarta, as the center of trading and business area, has the largest retail space for strata title sale.
By retail grade, the retail centers in Jakarta are predominantly Grade B centers, at around 48%. Generally, grade B centers were found in all Jakarta areas but most were concentrated in Central Jakarta. Premium centers were mostly found in the CBD area, while a few were also found in North, South and West Jakarta.
retail center DistriBUtion
BY MarKetinG scHeMe BY GraDe
Source: Colliers International Indonesia - Research Department
0
200,000
400,000
600,000
800,000
CBD Central Jakarta
South Jakarta
North Jakarta
East Jakarta
West Jakarta
Tot
al S
pace
(sq
m)
For Lease For Strata Title Sale
0
200,000
400,000
600,000
800,000
North Jakarta
East Jakarta
Central Jakarta
South Jakarta
West Jakarta
Ret
ail S
pace
(sq
m)
Premium Grade A Grade B Grade C

colliers international 19
The Knowledge Report | March | 2010 | Quarterly Research Report
retail sPace sUPPlY anD GroWtH
Source: Colliers International Indonesia - Research Department
A slowing supply trend also occurred in the Greater Jakarta area. Our survey recorded only two retail centers - Taman Topi Square in Bogor and Teraskota in Tangerang - operat-ing in the first half of 2009, with total space of 34,000 sq m. With no additional space in the second half of the year, the Greater Jakarta market grew 2.0% YoY. Stock was around 1.8 million sq m at end-2009. About 59% of total
stock was classified as retail space for lease. Located in populated areas and zoned as in-dustrial areas, Bekasi and Tangerang provided the largest retail space in Greater Jakarta area for both lease and strata title sale, with 33% and 32%, respectively, of total stock. In the south, on the other hand, intended mainly as a water conservation area, the total retail space is relatively small.
0%
2%
4%
6%
8%
10%
12%
14%
16%
18%
0
1,000,000
2,000,000
3,000,000
4,000,000
5,000,000
2007 2008 2009 2010F 2011F 2012F
Ret
ail S
pace
(sq
m)
Existing Supply Annual Supply Average Growth
Ave
rage
Gro
wth
(%)
Slowing supply trend is projected to occur in 2010, with only two retail centers, such as Grand Paragon in Central Jakarta and Gan-daria Main Street in South Jakarta, prepared for operation. The last project will be part of
an integrated development consisting of office tower, apartment and hotel. Over the next two years, supply for retail space is projected to increase by from 4 to 6%, to achieve a total of 4.3 million sq m by the end of 2012.
Greater JaKarta retail sPace sUPPlY
BY MarKetinG scHeMe BY location
0
50,000
100,000
150,000
200,000
250,000
300,000
350,000
400,000
Bekasi Bogor Depok Tangerang
Tot
al S
pace
(sq
m)
For Lease For Strata Title Sale
For Strata Title Sale
41%
For Lease59%
Source: Colliers International Indonesia - Research Department
All in all, we still expect supply to shrink over the next two years. The market registers growth of only 1.1% in 2010, from the com-pletion of Plaza Dua Raja in Bogor, and will
see no new supply in 2011. However, cumula-tive supply is projected to escalate by around 260,000 sq m in 2012 if six retail centers meet their schedules.

colliers international20
The retail market in Jakarta is still challenged. Consumers are more prudent in spending their money. A survey by a market research consultant showed that people are now more selective in buying their needs and focus on primary merchandise. Nevertheless, people in Jakarta still need a mall atmosphere as an al-ternative place in which to relax and socialize and this has become part of Jakarta’s lifestyle. Accordingly, food and beverage businesses continued to be the crowd pullers for a mall/shopping center. During the year, retail market was flooded by the opening of F&B outlets.
Several international restaurants opened their outlets in last quarter of 2009. In West Jakarta, May Star in Central Park and Dian Xiao Er in Taman Anggrek Mall were opened to serve Chinese food. Kemiri restaurant opened its 1,400-sq m open kitchen space at Pejaten Vil-lage South Jakarta. MOF Japanese sweets and coffee opened at Plaza Indonesia Extension, and J’Co and Bread Talk at Tamini Square were also seen to open in the period.
Besides F&B retailers, in the last quarter of the year Japanese retailer, Mujirushi Ryohin (muji), officially opened in Plaza Indonesia, offering a variety of food, fashion and acces-sories. Sophie Paris expanded its business in Plaza Semanggi, following previous outlets at Citraland and Tamini Square. Ace Hardware also started to open its 1,500-sq m space in Grand Indonesia. Pacific Place Mall added its F&B outlets with the opening of K-box res-taurant, Tutti Frutti Yogurt and Raffel’s Sand-wich. The mall also introduced the fashion outlets of Biyan and Lamborghini Boutique, as well as other tenants like Watch Time, Book Story, Kenko Reflexology, Grand Living Inte-rior and Erha Apothecary.
The retail occupancy rate showed a decreasing trend YoY. Our survey revealed that in 2009 the average occupancy rate of the Jakarta re-tail market hovered around 82% and achieved 82.6% in the last quarter of the year. This per-centage is 2% down from 2008 but overall the market is still performing well.
DeManD
Greater JaKarta retail sUPPlY anD GroWtH
-10%
0%
10%
20%
30%
0
500,000
1,000,000
1,500,000
2,000,000
2,500,000
2007 2008 2009 2010F 2011F 2012F
Annual Supply Existing Supply Growth
Source: Colliers International Indonesia - Research Department
The Knowledge Report | March | 2010 | Quarterly Research Report

colliers international 21
JaKarta retail center PerForMance
cUMUlatiVe sUPPlY anD DeManD occUPancY rate
Source: Colliers International Indonesia - Research Department
Premium malls continue to perform best, with a 98.6% average occupancy rate. Surprisingly, the middle to low market also recorded a great occupancy rate of 93.9%, higher than middle to upper malls.
A decreasing trend was also experienced by retail centers in the greater Jakarta area. The occupancy rate was recorded at 95% in 2007 and gradually fell to only 82.6% at end-2009. However, volatility remained healthy and
stabilized at between 80% and 90%. Retail centers in Tangerang and Bogor showed high average occupancy rates of 92% and 91%, respectively. However, in these two areas some shopping centers were still partially unoc-cupied, with vacancy rates of above 50%. In Bekasi, with large supply available, the occu-pancy rate was recorded lower at 78%, leaving more than 130,000 sq m of retail space vacant. Meanwhile, occupancy for retail market in Depok area stabilized at 86%.
Greater JaKarta retail center PerForMance
0
200,000
400,000
600,000
800,000
1,000,000
CBD Central Jakarta
South Jakarta
North Jakarta
East Jakarta
West Jakarta
Ret
ail S
pace
(sq
m)
cumulative supply cumulative demand
0%
20%
40%
60%
80%
100%
2005 2006 2007 2008 2009
Occ
upan
cy R
ate
0
100,000
200,000
300,000
400,000
500,000
600,000
700,000
Depok Bogor Tangerang Bekasi
Ret
ail S
pace
(Sq
m)
cumulative supply cumulative demand
0%
20%
40%
60%
80%
100%
2005 2006 2007 2008 2009
Occ
upan
cy R
ate
cUMUlatiVe sUPPlY anD DeManD occUPancY rate
Source: Colliers International Indonesia - Research Department
Transactions in Greater Jakarta area include Read Bean and Mega Indo Electronic in Teraskota Tangerang, NAV Karaoke and TFY Yoghurt in Margo City Depok. Meanwhile,
the Ekalokasari mall in Bogor repositioned itself by reconfiguring their tenants to become a center for IT products.
The Knowledge Report | March | 2010 | Quarterly Research Report

colliers international22
With moderate retail performance within the year, the asking rental rate shown a minor increment of 0.6% YoY, to an average of Rp 343,355/sq m/month, from Rp341,143/sq m/month previously. Comprising several upper class retail centers, the average asking rental
rates of retail centers in the South, Central and North Jakarta areas indicated an incre-ment trend, while those in West and East Ja-karta were relatively stable, as quite a few cen-ters in the area target a middle-class market.
asKinG rental rate oF retail center in JaKarta
Rp0
Rp50,000
Rp100,000
Rp150,000
Rp200,000
Rp250,000
Rp300,000
Rp350,000
Rp400,000
Rp450,000
Rp500,000
2005 2006 2007 2008 2009
Ask
ing
rent
al R
ate/
sq m
/mon
th
Central Jakarta South Jakarta North Jakarta East Jakarta West Jakarta Average
Source: Colliers International Indonesia - Research Department
Based on class, premium retail centers were applying high asking rentals far above other classes. With only a few retail centers op-erating this kind of shopping centers, this indicated an increasing rental trend. Average rental rates for premium retail centers were of-
fered at an average of Rp683,000/sq m/month. At end-2009, middle- to upper-class centers were offered at Rp314,500/sq m/month, while middle- to lower- class were offered for Rp204,400/sq m/month.
Rp0
Rp100,000
Rp200,000
Rp300,000
Rp400,000
Rp500,000
Rp600,000
Rp700,000
Rp800,000
2005 2006 2007 2008 2009
Premium Middle Up Middle low
Source: Colliers International Indonesia - Research Department
asKinG rental rates anD serVice cHarGes
asKinG rental rates
The Knowledge Report | March | 2010 | Quarterly Research Report

colliers international 23
There were lower asking rental rates offered for retail centers in the greater Jakarta area. The average rent indicated an increasing trend from 2005 and experienced minor falls in 2008 and 2009. Our survey recorded that the aver-
age asking rental rate in Greater Jakarta area was Rp246,000/sq m/month. Stabilizing the rental rate was one of the strategies applied in the last two years to retain tenants.
Rp-
Rp50,000
Rp100,000
Rp150,000
Rp200,000
Rp250,000
Rp300,000
2005 2006 2007 2008 2009
Ask
ing
Ren
tal R
ate/
sq m
/mon
th
Source: Colliers International Indonesia - Research Department
The average service charge for retail centers in Jakarta was relatively stable within the first three quarters and posted a minor increment in the last quarter, due to new shopping cen-ters entering. In Jakarta, the service charge registered a modest decrease by 0.13% YoY, to Rp62,538/sq m/month, from Rp62,618/sq m/month previously.
Categorized by class, our survey revealed that premium and middle to low retail centers con-tinued to apply similar rates to the previous year, at Rp93,400/sq m/month and Rp51,750/sq m/month, respectively. Middle to upper centers posted a 6% increase, to Rp66,385/sq m/month, following the operation of some retail centers within the year.
serVice cHarGes
retail center serVice cHarGe BY class in JaKarta
Source: Colliers International Indonesia - Research Department
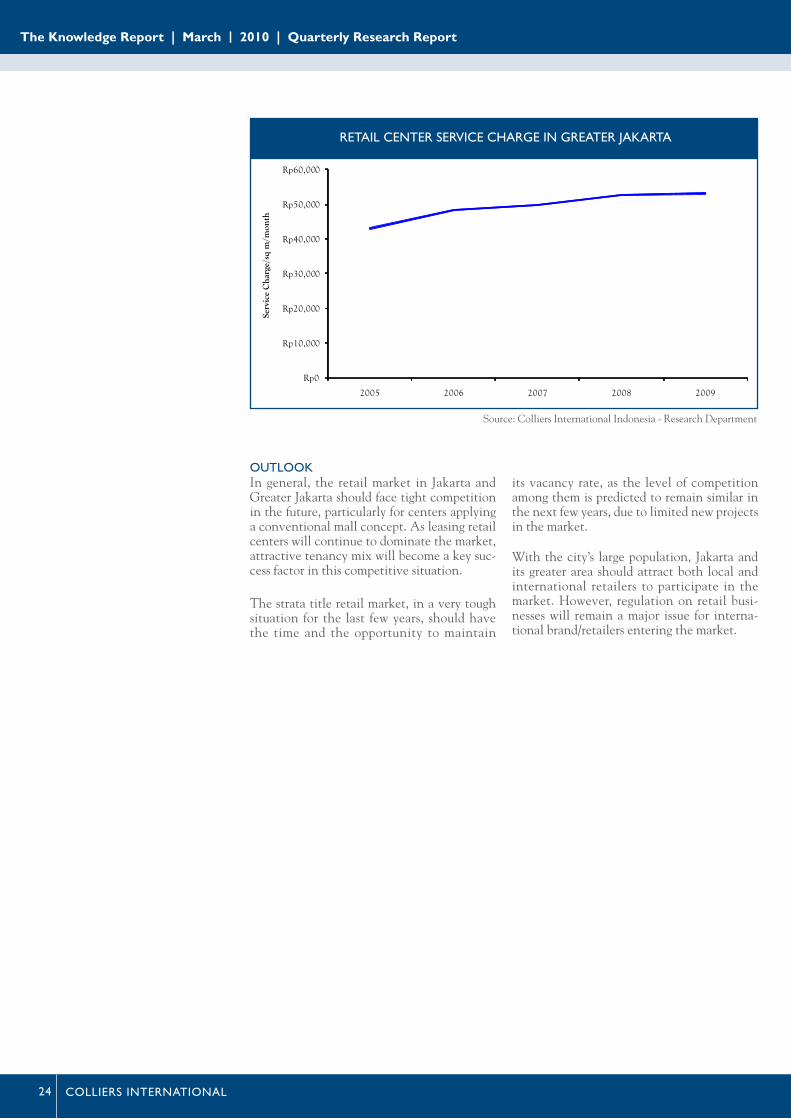
In greater Jakarta the average service charge recorded a minor increment of 0.8% YoY, to Rp53,071/sq m/month, compared to the previ-
ous year’s Rp52,651/sq m/month, due to the adjusted rate applied by some centers in the second half of the year.
Rp0
Rp10,000
Rp20,000
Rp30,000
Rp40,000
Rp50,000
Rp60,000
Rp70,000
Rp80,000
Rp90,000
Rp100,000
2005 2006 2007 2008 2009
Serv
ice
Cha
rge/
sq m
/mon
th
Premium Middle Up Middle low
The Knowledge Report | March | 2010 | Quarterly Research Report
colliers international24
retail center serVice cHarGe in Greater JaKarta
Rp0
Rp10,000
Rp20,000
Rp30,000
Rp40,000
Rp50,000
Rp60,000
2005 2006 2007 2008 2009
Serv
ice
Cha
rge/
sq m
/mon
th
Source: Colliers International Indonesia - Research Department
In general, the retail market in Jakarta and Greater Jakarta should face tight competition in the future, particularly for centers applying a conventional mall concept. As leasing retail centers will continue to dominate the market, attractive tenancy mix will become a key suc-cess factor in this competitive situation. The strata title retail market, in a very tough situation for the last few years, should have the time and the opportunity to maintain
its vacancy rate, as the level of competition among them is predicted to remain similar in the next few years, due to limited new projects in the market. With the city’s large population, Jakarta and its greater area should attract both local and international retailers to participate in the market. However, regulation on retail busi-nesses will remain a major issue for interna-tional brand/retailers entering the market.
oUtlooK
The Knowledge Report | March | 2010 | Quarterly Research Report

colliers international 25
During the reviewed quarter, neither of the existing industrial estates came with expan-sion plans, nor were future industrial estates openings announces . For some time, and likely for several periods ahead, the industrial estate market will not see any new industrial land, but expansion plans could possibly come from operating industrial estates with con-tinuing sales.
To date, we have heard no confirmation of the expansion of around 80 hectares land in Serang, nor the plan from prominent estates
in the Bekasi area. 2009 was seemingly the year of consolidation, wherein many industrial estates were working hard to focus on selling unsold units. Thus, during 2009 the industrial market registered no additional land, which helped take-up rate rise steadily.
As at the end of the year and up to the first quarter this year, supply of industrial land in the six different regions (Jakarta and greater Jakarta areas) did not change, remaining at 8,662 hectares.
inDUstrial estate sector
sUPPlY
Beyond expectations, the industrial market performed better, amidst the fear of a weak-ening economy in early 2009. At the begin-ning of the year quite a few of the industrial landlords we interviewed had moderate sales target during the year; but in fact, after one year under review, sales of industrial land were more than expected. Expansion activities from operating industrialists were dominant during the year and only a few new investments were seen during the year. However, we noted that the new investments acquiring industrial land were companies whose owners had long his-torical experience with the business environ-ment in Indonesia.
The number of total transactions during the quarter exceeded transactions during the pre-vious period. We recorded around 52 hectares of land being transacted in the quarter. Also, as mentioned earlier, total transactions dur-ing 2009 exceeded our expectations, and total industrial land sales in 2009 were recorded at around 214 hectares, which was slightly up compared to 2008’s total transactions, and this was much better than total transactions in 2006 and 2007.
Total sales recorded during the fourth quarter were registered by Modern Cikande, with a total of around 14.7 hectares; however, total sales recorded for the full year 2009 were registered by BFIE at a total of around 47.2 hectares. For the last four years, this was a his-torical high so far for total transactions made by one industrial estate in one year.
Delta Silikon ranked second after Modern Cikande in the total number of land and SFB sales during the quarter, with around 11.2 hectares, followed by Bekasi Fajar (BFIE) with a total of around 10.2 hectares. Modern Cikande, as the biggest contributor to the whole sales this quarter, received the biggest transaction from Mitsuba, Japanese automo-tive component makers, of around 7.3 hect-ares. This transaction was for the expansion of an existing factory, occupying four hectares of land. The second biggest transaction during the quarter also came from the same industry, in KIIC, which registered land transactions of around five hectares. Other significant trans-actions occurred during the quarter, including 4.9 hectares of land acquired by Taiwanese genuine leather tannery in Modern Cikande; PT. Kayaba Indonesia (automotive spare parts) in BFIE of 4 hectares; PT. Komatsu Indonesia (heavy equipment) in MM2100 taking around 3 hectares; a local steel-related industry taking around 3 hectares in KIEC; PT. Oh Sung E.I. (electronic components) from Korea in BFIE with transactions of around 2.6 hectares; a local aluminum manufacturer in Modern Ci-kande, with around 2.5 hectares; 2.4 hectares from a pharmaceutical company with transac-tions in Indotaisei and land transactions from PT. East Hope Agriculture Indonesia, a feed mill from China, taking around 2.4 hectares in Suryacipta.
DeManD
The Knowledge Report | March | 2010 | Quarterly Research Report

colliers international26
Source: Colliers International Indonesia - Research Department
annUal inDUstrial lanD sales
Source: Colliers International Indonesia - Research Department
cUMUlatiVe sUPPlY, DeManD anD taKe-UP rates
Source: Colliers International Indonesia - Research Department
inDUstrial lanD sales recorDeD in 4Q09
0
50
100
150
200
250
300
2004 2005 2006 2007 2008 2009
hect
are
0%
10%
20%
30%
40%
50%
60%
70%
80%
90%
100%
0
1,000
2,000
3,000
4,000
5,000
6,000
7,000
8,000
9,000
10,000
2004 2005 2006 2007 2008 1Q09 2Q09 3Q09 4Q09
hect
ares
Cumulative Supply (ha) Cumulative Demand (ha) Take-up Rate (%)
0 5 10 15 20 25 30 35 40 45 50
Sentul Industrial Estate
KBN
Kota Bukit Indah Intotaisei
Suryacipta
MM2100 Industrial Town
Jababeka Industrial Estate
KIIC
KIEC
Delta Silicon
Greenland (Kota Delta Mas)
Modern Cikande
Bekasi Fajar Industrial Estate
hectare
The Knowledge Report | March | 2010 | Quarterly Research Report

colliers international 27
inDUstrial lanD Prices anD Maintenance costOverall, prices are relatively stable but we have noted that some industrial estates have escalated their asking price. Continued in-quiries for one industrial estate have been the main reason for the developer to increase the offering price. Apart from that, the increas-ing Sale Value of the Tax Object (NJOP) was also a factor triggering the price hike. Besides, in anticipation of responding to the market, some developers tried to adjust their asking price to levels close to the market average.
One industrial estate in Bekasi has introduced a new price for their land in response to con-tinued demand and the land shortage. The new price was quite significant and beyond the market average.
In Serang one prominent industrial estate has come with a new quite significant offering price (up by 20%). Their confidence in con-tinued transactions, and the comprehensive facilities offered, have been the reasons behind the new price. Further, the price escalation was set to anticipate future plans to increase their own power plant capacity.
To equalize the market price, one industrial estate in Karawang has introduced new land prices during the reviewed quarter. This measure was taken in anticipation of growing demand.
Greater JaKarta inDUstrial lanD Prices
Source: Colliers International Indonesia - Research Department
Maintenance adjustment only occurred in Serang areas, with two prominent industrial estates introducing new maintenance tariff, rising by 13 to 18%. However, the mainte-nance tariff for Serang area was considered the
lowest compared to the other regions. It was registered that the climb in maintenance tariff ranged only from Rp30 to Rp50/sq m/month.
$0
$10
$20
$30
$40
$50
$60
$70
$80
$90
$100
1Q07 2Q07 3Q07 4Q07 1Q08 2Q08 3Q08 4Q08 1Q09 2Q09 3Q09 4Q09
Bogor Tangerang Karawang Bekasi Serang
The Knowledge Report | March | 2010 | Quarterly Research Report

colliers international28
Greater JaKarta aVeraGe Maintenance costs
Source: Colliers International Indonesia - Research Department
$0.00
$0.01
$0.02
$0.03
$0.04
$0.05
$0.06
$0.07
$0.08
$0.09
1Q07 2Q07 3Q07 4Q07 1Q08 2Q08 3Q08 4Q08 1Q09 2Q09 3Q09 4Q09
Bogor Tangerang Karawang Bekasi Serang
Source: Colliers International Indonesia - Research Department
reGionlanD Price (/sQ M) Maintenance cost (/sQ M/MontH)
loWest HiGHest aVeraGe (rp)
loWest HiGHest aVeraGe (rp)
Bekasi rp 500,000 Us$ 85.00 rp 637,225 Us$ 0.05 Us$ 0.07 rp 601
Karawang rp 300,000 Us$ 50.00 rp 391,779 Us$ 0.05 Us$ 0.06 rp 496
Bogor Us$ 45.00 rp 750,000 rp 653,105 Us$ 0.065 Us$ 0.1 rp 686
serang rp 350,000 rp 650,000 rp 551,776 rp 250 rp 330 rp 299
tangerang Us$ 60.00 rp 1.26 mill rp 616,322 Us$ 0.04 rp 1,000 rp 535
inDUstrial lanD Prices anD Maintenance cost
Starting 2010 with an historically good per-formance in 2009, the industrial market is expected to perform much better in 2010. With global financial crisis still evident at the beginning of the year, the industrial market was anticipated to dilute the hope of perform-ing better than the previous year. On the contrary, however, total sales recorded during 2009 even exceeded the totals of the preced-ing year. With plenty of ammunition for 2010, such as stabilized political conditions and the expectation of a growing economy, the indus-trial market in 2010 has met the requirement to perform even better.
We expect that the type of industries that acquire industrial land in the future will be the usual industries of auto spare parts, steel, ware-housing, packaging, food-related industries, printing, plastic moulding or pharmaceutical.
oUtlooK
The Knowledge Report | March | 2010 | Quarterly Research Report
colliers international 29
The Knowledge Report | March | 2010 | Quarterly Research Report
contact inForMation
this report and other research materials may be found on our website at www.colliers.com. Questions related to information herein should be directed to the research Department at the number indicated above. this document has been prepared by colliers international for advertising and general information only. colliers international makes no guarantees, representations or warranties of any kind, expressed or implied, regarding the information including, but not limited to, warranties of content, accuracy and reliability. any interested party should undertake their own inquiries as to the accuracy of the information. colliers international excludes unequivocally all inferred or implied terms, conditions and warranties arising out of this document and excludes all liability for loss and damages arising there from. colliers international is a worldwide affiliation of independently owned and operated companies.
Our Knowledge is your Property
Colliers International IndonesiaWorld Trade Centre 10th floorJalan Jenderal Sudirman Kav 29 - 31Jakarta 12920Tel : 62 21 521 1400Fax : 62 21 521 1411
Mike BroomellManaging DirectorTel : 62 21 521 1400Fax : 62 21 521 1411Email : [email protected]
Ferry SalantoDivision Manager, Research ServicesTel : 62 21 521 1400Fax : 62 21 521 1411Email : [email protected]
293 oFFices in 61 coUntries on 6 continents
Usa 99 canada 19latin america 18 asia Pacific 62 eMea 95
$2.0 billion in annual revenue 868 million square feet under management
15,573 Professionals
www.colliers.co.id Our Knowledge is your Property