Jabalpur City
227
Jabalpur Transport Sector CMP Under JNNURM Municipal Corporation, Jabalpur R-1 1 Jabalpur City Comprehensive Mobility Plan FOR MUNICIPAL CORPORATION JABALPUR, (M.P.) Under ----- Submitted by ----- An ISO 9001:2000 Certified Company Regd Office : 5/259 Vikas Nagar, Lucknow Lab : 5/256 Vikas Nagar, Lucknow Ph.No. (O)0522–4047624 , 2768132 Tele fax: 0522–4012278, Mob. No. 9415001208 E–Mail: [email protected] website: www.snowfountain.co.in JNNURM Consultants: Lucknow, Kanpur, Allahabad, Varanasi, Jabalpur, Ujjain, Bhopal,Kolkata Projects: U.P., M.P., Bihar, Jharkhand, Uttaranchal, West Bengal, Maharashtra, Rajasthan JAWAHARLAL NEHRU NATIONAL URBAN RENEWAL MISSION Revised As Per Development Plan 2011 Guidelines and Toolkits for Urban Transport Development
Transcript of Jabalpur City

Jabalpur Transport Sector CMP Under JNNURM
Municipal Corporation, Jabalpur R-1
1
Jabalpur City Comprehensive Mobility Plan
FOR
MUNICIPAL CORPORATION JABALPUR, (M.P.)
Under
----- Submitted by -----
An ISO 9001:2000 Certified Company
Regd Office : 5/259 Vikas Nagar, Lucknow Lab : 5/256 Vikas Nagar, Lucknow
Ph.No. (O)0522–4047624 , 2768132 Tele fax: 0522–4012278, Mob. No. 9415001208
E–Mail: [email protected] website: www.snowfountain.co.in
JNNURM Consultants: Lucknow, Kanpur, Allahabad, Varanasi, Jabalpur, Ujjain, Bhopal,Kolkata
Projects: U.P., M.P., Bihar, Jharkhand, Uttaranchal, West Bengal, Maharashtra, Rajasthan
JAWAHARLAL NEHRU
NATIONAL URBAN RENEWAL MISSION
Revised As Per Development Plan 2011 Guidelines and Toolkits for
Urban Transport Development

Jabalpur Transport Sector CMP Under JNNURM
Municipal Corporation, Jabalpur R-1
2
PREFACE
Jabalpur is an important city in the Narmada region. The transport scenario of Jabalpur is in jeopardy as a
natural outcome. This one may not realize apparently, as the problems are currently concentrated in a sparse
manner. The potential and beauty of the city is getting lost amidst increasing traffic problems. The crisis chaps
and risk of commuting as prevalent in other major urban centers of India, do exist in Jabalpur. The situation is
likely to be further grim in the coming years. There is urgent need to address the issue of urban transport as
an important Component to shape urban development and provide quality transport service to the community
in the city.
Effective Public Transport is the need of every metropolitan city. For cities that are growing at a rapid pace .It
becomes most essential vehicle for pace of growth. The most important feature missing In Jabalpur is a good
public transport service. It had become really important for the city administration to provide the people of the
city with a safe and reliable mode of transportation at an affordable price.
Cities with population of more than 1 million should have urban Bus Transport Corporation that owns 30
Percent of its own buses and contracts 70 percent of buses from private contractors and operators. Motivated
by this World Bank recommendation note of India's transport sector, ‘The challenges Ahead (2007)’, a
financial model of public transport system through private partnership was conceptualized where in every
player whether Government, the Company, local administration, operators and people are mutually benefited.
Looking to the high potential for development of competitive bus transport market through Contracting or
franchising arrangements a Special Purpose Vehicle as a public limited Company was formed, which
specifies the role of the market and government. It was felt that Cities like Jabalpur should develop their own
regulatory and enforcement capabilities to promote city service competition and put in place a mechanism that
will ensure financial viability of such operations.
Jabalpur City Transport Services Ltd. (JCTSL) has been incorporated to provide a dependable solution for the
need identified above. It aims at establishing a public transport backbone to facilitate the rapid growth of the
city. The private- public partnership model has been designed to benefit the company, operators, government
and general public. The company will invest the income generated from the service in development of
infrastructure and aims at setting up a bus rapid transport system in the near future.
In the context of rapid growth of the city, increasing mobility, high travel demand, increasing Intensity of traffic,
congestion, delays, accidents and other such problems, public mass transport system of the city stands out as
the most critical issue The intra-city public transport system is essentially road based with private minibuses,
tempos and auto rickshaws Since there was no specialized and effective regulatory agency to monitor the
system a special purpose vehicle in the form of public limited company Jabalpur City Transport Services Ltd.
was set up to operate and manage the public transport system in Jabalpur with private sector participation to
overcome financial constraints.
As the Jawaharlal Lal Nehru Urban Renewal Mission (JNNURM) is launched and Jabalpur has been
selected under it. A comprehensive study has been conducted and Detail Project Report has been made for
Implementation of various projects in phased manner.

Jabalpur Transport Sector CMP Under JNNURM
Municipal Corporation, Jabalpur R-1
3
Project Head
(Mayor, MCJ) ,
(Collector, Jabalpur)
(Commissioner, MCJ)
Project Advisors
Transportation Research and Injury Prevention Programme (TRIPP) Indian Institute of Technology (lIT)
Delhi
Prof. (MS) Geetam Tiwari
Prof. Dinesh Mohan
Er. Sandeep Gandhi
Project Consultants
* Snow Fountain Consultants, Lucknow
i. Sri Janardan Singh, lIT, Roorkee
ii. Sri Mahabir Prasad Sachan, lIT, Roorkee
iii. Sri Gajendra Tripathi, lIT, Delhi

Jabalpur Transport Sector CMP Under JNNURM
Municipal Corporation, Jabalpur R-1
4
PART - I
EXISTING SITUATION

Jabalpur Transport Sector CMP Under JNNURM
Municipal Corporation, Jabalpur R-1
5
CHAPTER-1
1.0 INTRODUCTION
Jabalpur an important city in the Narmada (eastern) region of Madhya Pradesh is one of the fastest
growing cities in the country. As per 2011 censes the population of Jabalpur district is 24.61 lakhs out
of which 10.54 lakhs live in Jabalpur city, in 60 wards, covering a gross area of 224.47 sq. km.
The city is located on the banks of Narmada River and sprawls over the plains of its tributaries (23°
10' North latitude and 79°57' East longitude). National Highway 12 (Jaipur - Jabalpur road), links the
city to many important cities in the northwest and National Highway No 7 connect the city to Varanasi
and Nagpur The broad gauge railway line to Mumbai and Kolkata (via Allahabad) connect the city to
Mumbai and Kolkata. The city is served by only one-flight air services to Delhi.
1.1 HISTORICAL BACKGROUND
Jabalpur city is part of the Jabalpur congregration comprising of Jabalpur city, Jabalpur Cantonment
and Khamaria Township. This ancient city traditionally also known as "Mahakoshal" is located in
central India, in the state of Madhya Pradesh.
Jabalpur city owes its cultural heritage to the Kalchuri dynasty. It is said that Jabalpur assumed its
name from "Jaballi Patnam" dedicated to sage Jaballi, who had made Jabalpur his base and had his
ashram here. However, the derivation of Jabalpur from the Arabic word "Jabal" meaning hill or
mountain appears more convincing, as the city is dotted and surrounded with hillocks and rock
formations.
Early history reveals that "Tripuri" village located about 6 miles from Jabalpur city enjoyed the status
of capital during the Kalchuri Dynasty, which was at its zenith in 300 BC Subsequently, during the
Gond refume Garha, which now forms part of the city, attained- the status of capital. Later, the city of
Jabalpur became capital.
During the early British rule, the city assumed the status of Divisional Headquarter of the Central
Provinces. Jabalpur cantonment was established in the latter part of the 19th century. This was
followed by the establishment of Jabalpur, Municipal Corporation in 1951. Gradually, with the
establishment of the post & telegraph workshop, the High Court, defence establishments and several
educational institutions, the city attained the status of regional center of the Mahakoshal region.
Today, the city is prominent for the Government of India's defence and military establishments that
are located in and around the city. The College of Defence Management (formerly, Army Officers'
School) and large factories like the Gun Carriage Factory, Ordinance Factory, Vehicle Factory, Grey
Iron Foundry, EME workshop, Central Ordinance Depot, Signal's Central and Army Head Quarters
are located here. Jabalpur also has the seat of the Madhya Pradesh High Court and is home to the
Madhya Pradesh Electricity State Board's headquarters, the home guards other State and Central
government departments, including the post and Telegraph Department's Workshop. The city is also
significant educational center with two Universities, i.e. Rani Durgavati University and Jawaharlal
Nehru Agriculture University.
The city is the district headquarters of Jabalpur district (third largest district of the state), and accounts
for almost 44 per cent of the total district population (24,61 Lakh). It is also the divisional headquarters
of Jabalpur division, which includes the districts of Jabalpur, Katni, Mandla, Narsinghpur, Chhindwara,
Seoni and Balaghat, Center and Army Area Headquarters are located here. Besides these, there is a

Jabalpur Transport Sector CMP Under JNNURM
Municipal Corporation, Jabalpur R-1
6
large cantonment area within the municipal corporation limits. The population within the cantonment
area and the premises of the three major defense establishments and around the Jabalpur city limits
is 1,08,269 and population within the municipal corporation limits is 10.54 lacs as per the 2011
census.
1.2 GEOGRAPHICAL CHARACTERISTICS
1.2.1 Location:
Jabalpur lies on the banks of the Narmada River and sprawls over the plains of its tributaries Hiran,
Gaur, Ken & Sone. Geographically, the city is located at 23°10' North latitude and 79°57' East
longitude, at an altitude of 393 meters above mean sea level (MSL).
1.2.2 Climate
The climate of Jabalpur can be divided into three distinct seasons, viz.
• Monsoon lasting from mid-June to September.
• Winter from November to February; and
• Summer from March to mid-June.
The month of October witnesses the transition from monsoon to winter. The city experiences hot
summers and cold winters, with temperatures ranging from an average low of around 9.8° Celsius to
an average high of about 41.7° Celsius. Temperature during the peak summer month of May can
soar to 47 degrees Celsius, while the lowest temperature recorded was 0° Celsius on 2nd
December
1905.
The rains usually break in the month of June, with the maximum number of rainy days experienced
during the months of July and August. The average number of rainy days is 69, during which the city
receives an average rainfall of 1,386 mm.
1.2.3 Physical Setting
The topography of Jabalpur is unique. It is located on the banks of the perennial Narmada River, with
rich forest in the vicinity, and a scenic landform dotted with low rise hills. The city is surrounded by low
rocky and barren hillocks - Karia Pather hills on the northeast, Sita Pahad and Khandari hills, towards
the east, and Madan Mahal hills and rock outcrops towards the southwest. The entire area of the city
is hilly, with slopes differing in grade from 2 to 30 per cent.
The low hillocks, however, form a barrier for continuous development of urban form and, restrict inter-
links between various parts of the city. The lowlands stretch over the west and, northwest of the city,
with gradual slopes towards the northwest.
The city is almost bifurcated by central ridge running parallel to the railway line that girds the city in a
horseshoe ("Π") shape. The ridge begins, from the hills in the east and runs to the western side of
the city. The plain on the northern side of the ridge gradually slopes from east to northwest, while the
southern part slopes towards the south. This ridge has a significant influence on the urban sprawl of
the town.
1.3 OBJECTIVE OF THE CMP
The study area include the Jabalpur planning area comprising the city corporation, Ordinance Factory,
Vehicle Factory, Cantonment areas and surrounding 53 villages. The study will cover all inner city
movement to and from the study area. The study includes preparation of short, medium and long
terms improvement plans for the city travels need in the horizon year. The main aim of the study area
is to match the transport demand with supply in terms of transport infrastructure, system control and

Jabalpur Transport Sector CMP Under JNNURM
Municipal Corporation, Jabalpur R-1
7
management with optimal utilization of the existing infrastructure.
The main objective of the study are as below:
* Study the existing traffic and travels characteristics of the study area.
* Project the transport demand up to 2033.
* Identify short term improvement measures, including preparation of rapid action plans to meet
the immediate requirements.
* Prepare the medium and long term plans
* Asses feasibility for development of integrated mass transport system (IMTS), including the
economic and financial evaluation.
* Recommend optimal implementation mechanism and organizational structure.
1.4 SCOPE OF WORK (CMP)
The scope of work are given below:
* Study of existing land use pattern, Proposed land use plan / Master plans, if any, by local
authority, Study of available reports / plans on traffic and transport situation and related
matters and related data collection from different offices.
* Carry out Preliminary survey such as traffic volume count at mid block and intersection, outer
cordon survey, origin destination survey, speed and delay study for selecting important
corridors for public transport survey. A sample size of minimum 3% shall be covered for the
household surveys. The result of household travel survey will be used to estimate the present
transport demand, movement pattern, model split, trip purpose etc. The survey will be carried-
out in all area in Jabalpur based on a traffic zone System.
* Collection of Primary road inventory data and identification of primary network. Right of way
(ROW) information will be supplied by the clients and consultants have to collect the data on
parking and utilities.
* Analysis and interpretation of above data to elicit the traffic and travel characteristics of study
area.
* Develop four-stage transport demand model, calibrate and validate the transport demand
model for intra city travel.
* Project the transport demand up to design year 2033 based on calibrated models and
proposed land use patterns.
* Indicate problems with priority areas and priority junctions and carryout traffic
estimates/projections on major travel corridors.
* Identify the major transport corridors on the basis of transport demand.
* Suggest alternative transport strategies – short, medium and long term, strengthening
transport infrastructure, public transport system.
Short Terms Improvement Measures
* Prepare junction improvement plans of priority junction.
The work will also include signal design, wherever necessary. The detailed design for junction
improvement shall be submitted after approval of the draft report of short terms measures and
identification of junctions to be improved by client.
* Prepare traffic management scheme for priority areas.
* Prepare the improvement plan for pedestrian facilities both for along and across movements.

Jabalpur Transport Sector CMP Under JNNURM
Municipal Corporation, Jabalpur R-1
8
* Suggest the on and off-street parking locations and prepare plans for critical areas.
* Suggest the location and specifications for street furniture i.e. road marking and traffic signals.
etc.
* Work out preliminary cost estimate of improvement measure and suggest phasing of
implementation.
* Development of terminal facilities.
Medium and Long Terms Improvement Plans
* Suggest improvement (Widening and strengthening) of existing road network based on the
forecasted transport demand.
* Indicate new road links for intra city movement based on the transport demand and
improvement pattern.
* Identify the need for urban bypass for through/intercity traffic.
Facility study for development of Integrated Mass Transport System:
* Development of alternative mass transport networks and assessment of traffic for forecasted
demand on the alternatives:
i) Road Network
ii) Road and Rail based mass transport network
* Evaluation of alternatives integrated mass transport network and selection of the best.
* Undertaking engineering facilities surveys for the alignment, location of stations, interchange
Point and maintenance and identification of land reserve requirements.
* System selection and system design for the proposed system on the basis of projected
transport and other technical consideration.
* Identification of measures for integration of various modes and plans a multi model system.
* Estimation of cost for capital and operating expenditure of the system.
* Economic and financial appraisal of the proposed system and suggest a plan for financing the
capital expenditure of the proposed system. This will also consider private sector,
participation not only in implementation / financing of the systems but also in management
and operation of the systems.
* Development of planning and implementation mechanism in accordance with the proposed
financial plan.

Jabalpur Transport Sector CMP Under JNNURM
Municipal Corporation, Jabalpur R-1
9
CHAPTER-2
CITY PROFILE
2.0 STUDY AREA CHARACTERISTICS
2.1 REGIONAL CHARACTERISTICS
2.1.1 State Level
The state of Madhaya Pradesh comprises of 9 administrative divisions and was spread over 308.25
thousands Sqkm. The 2011 census reveals that the state (over nine divisions) recorded a population
of 603.85 lacs with a population density of 240 Person per Sqkm. The administrative division includes
Bhopal, Chambal, Gwalior, Hoshangabad, Indore, Jabalpur, Rewa, Sagar and Ujjain. The State
presently comprises of 45 districts.
2.1.2 Jabalpur
Jabalpur an important city in the Narmada (eastern) region of Madhya Pradesh is one of the fastest
growing cities in the country. As per 2011 census the population of Jabalpur district is 24.60 lakhs out
of which 10.54 lakhs live in Jabalpur city, in 60 wards, covering a gross area of 224.47 sq. km. The
city is located on the banks of Narmada River and sprawls over the plans of its tributaries (23° 10'
North latitude and 79°57' East longitudinal). National Highway 12 (Jaipur - Jabalpur road), links the
city to many large cities in the northwest and National Highway No 7 connect the city to Varanasi and
Nagpur. The broad gauge railway line to Mumbai and Kolkata (via Allahabad) connect the city to
Mumbai and Kolkata. The city is served by only one-flight air services to Delhi. Jabalpur is connected
to the national transport network through road, rail and air transport. Amongst them, road and rail
plays a major role in providing transport linkage with the rest of the country.
Being most important city in the region there is significant interaction between Jabalpur and the
surrounding towns through the road and rail networks. Regional road network connecting Jabalpur
with the rest of the country comprises of the following.
• Nagpur -Jabalpur- Varanasi/Allahabad Road ( NH-7 I NH-7 & NH-27)
• Jabalpur-Bhopal Road (NH-12A)
• Jabalpur- Damoh - Tikamgarh - Jhansi (NH-12A)
• Jabalpur - Kumdam Road (SH-22)
• Jabalpur - Patan Road (MDR)
The area is also served by broad gauge and meter gauge rail lines, which connect Jabalpur with other
cities like Gwalior, Mumbai, Bhopal, Allahabad, Delhi and Howrah. Besides, the city is also connected
by meter gauge rail line to Gondia.
2.2 DEMOGRAPHIC CHARACTERISTICS
2.2.1 Regional Setting
The Consultants have collected various secondary statistical documents in order to appreciate the
study for demographic characteristics. These comprise the Census Abstract (National Informatics
Center), District Statistical Handbooks (Collectorate Office), Jabalpur Development Plans (Town &
Country Planning, Jabalpur) and the revised area under 60 wards in the Corporation area (Jabalpur
Nagar Nigam). A number of discrepancies were observed in the figures related to zonal area,
population in years 1981 & 1991 census years etc. In such cases, zonal area for the corporation

Jabalpur Transport Sector CMP Under JNNURM
Municipal Corporation, Jabalpur R-1
10
provided by Jabalpur Nagar Nigam and area for urban agglomerates provided by Census documents
has been considered as correct and adopted. Similarly, population figures provided in the District
Statistical Handbooks have been adopted.
The salient demographic characteristics for the study area are presented below in Table 2.1. The
study area spread over an area of 313.95 sq. km, which recorded a population size of about 8.17 lakhs
& 9.19 lakhs in the years 1981 & 1991 respectively.
Table 2.1 Demographic Characteristics – Regional Setting
Study Area
Constituents
Population Population
Growth (% per
annum)
Density (1991)
(persons/sq
km) 1981 1991
Jabalpur Nagar 649085 764586 1.65 4954
� Jabalpur 63571 741927 1.57 5533
� Manegaon 3874 5507 3.58 2929
� Suhagi 2345 4648 7.08 1781
� Maharajpur 3142 4633 3.96 1130
� Karmeta 1478 3042 7.49 737
� Amkhera 1544 2330 4.20 798
� Kairi 693 1210 5.73 712
� Rengwa 541 843 4.54 303
� Pipariya 297 446 4.15 3717
Jabalpur Cantonment 61026 56124 -0.83 1976
Khamaria 47192 26731 -5.53 940
GCF 16851 17961 0.64 2566
Bilpura 5591 10168 6.16 3987
Vehicle Factory 15279 13346 -1.34 3549
Remaining 44 Villages 22041 29861 3.08 334
Total 817065 918777 1.18 2926
*Source CDP Jabalpur*
Population growth for the study area during 1981-91 was 1.18 percent per annum. Jabalpur Nagar
observed population growth of 1.65 percent, with the Corporation recording a growth of about 1.57
percent per annum. The urban agglomerates included within the Jabalpur-Nagar witnessed a much
higher population growth in the range of 3.5 to 7.5 percent. On the contrary, Jabalpur Cantonment,
Khamaria and the Vehicle Factory Zones witnessed a fall in population in comparison to 1981 figures.
The surrounding villages, which are significantly less developed, however recorded a growth of about
3.08 percent per annum.
The study area recorded population density of about 2926-persons/ sq.km. The Jabalpur Nagar
recorded population density of about 4954 persons, comprising 5533 persons within the Corporation
and relatively less dense urban agglomerates. Amongst the other locations included in the study area,
the Vehicle factory and Bilpura area recorded population density of over 3500-persons/ sq.km.
The current (2007) projected population of MCJ is approx. 12.83 Lacs. The city has experienced
relatively moderate growth rates in population during the last two decades- 1981-91 & 1991-2001
(46.83) and 17.87 per cent, respectively, compared to the 45 per cent decadal growth rates during
1951 to 1981.
The sudden increase in population from 1951 may be attributed to the fact that the corporation was
upgraded from the status of municipality and more area was added to its jurisdiction. In subsequent

Jabalpur Transport Sector CMP Under JNNURM
Municipal Corporation, Jabalpur R-1
11
decades, there was a spurt in economic activity with the establishment of defense establishments and
state government administrative establishments in Jabalpur, which led to significant in-migration to
Jabalpur.
2.2.2 Jabalpur Tehsil
The Jabalpur and Panagarh Development blocks forming the rural area within Jabalpur Tehsil are
spread over 751 Sqkm. and 421.43 Sqkm, respectively. The urban aggiomerates within Jabalpur
tehsil spread over 246.03 Sqkm.
2.2.3 Sex Ratio
As per Census 2011 the sex ratio (female population per 1000 male population) in Jabalpur is 915,
which is higher than the state urban average of 899 and national urban average 901. The positive
factor is that, while the state and national average sex ratio has been declining, the sex ratio in MCJ
has increased steadily from 853 in 1971 to 898 in 1991 and to 915 in 2011.
2.2.4 Literacy
As per Census 2011 the literacy rate (percentage of literate population to the total population above 6
years of age) in MCJ is 84.72 percent (male literacy rate of 60 percent and female literacy rate of
78.93 percent) higher than the state urban average of 79.67 percent and national urban average of
80.30 %. This high literacy rate could be attributed to the fact that a significant proportion of the city’s
population belongs to the salaried class (Governant Servants) and also the fact that the city is home
of two universities and several schools. The literacy rate in MCJ has been on the rise having
increased remarkably from 54 % in 1971 to 78.21 % in 1991 and to 84.72 % in 2001.
The total numbers of household, in MCJ as per the 2001 census is 165,400. The average household
size in Jabalpur works out to 5.75, which is quite high. The household size has been on the rise since
1971, when it was 5.17, Discussion with local authorities and councilors reveal that this due to few
higher household sizes in the slums - the average household size in slums is about 6.76 - where
family planning has been poor.
2.2.5 Work Force Participation
The current work force participation rate percentage of main and marginal workers to the total
population in MCJ is about 32.66 percent (including 2.9 to 6 per cent of marginal workers) - up by
5.64 per cent compared to 27.02 percent (including 0.49 per cent of marginal workers) in 1991. In the
absence of a detailed breakup of sector/category-wise workers for 2001, the figures for 1991 are
used to examine the composition of the workforce.
It may be noted that of the total workforce of 196,763 in 1991, about 25% were employed in non-
household manufacturing and processing industry, a sector comprising primarily of defense
establishments. Almost 22 percent were employed in trade and commerce activities, while 38 percent
were employed in other services, including transport, storage and communication. Four percent of
the workforce involved in household -based manufacturing and processing activities primarily
included bidi (local cigarette) rolling business. However, this traditional industry has been on the
decline over the last few years, and is being replaced by local garment manufacturing /stitching
activity, which has been growing in a rather unorganized manner.
2.2.6 Density
As per Census 2011 the gross population density in MCJ is 8,960 persons per sq. km. (or 90 persons
per Ha), up by 62 per cent from 5,533 (55 persons per Ha) in 1991. This increase is primarily due to

Jabalpur Transport Sector CMP Under JNNURM
Municipal Corporation, Jabalpur R-1
12
the reduction in the area of the corporation resulting from the demerger of eight settlements from the
Municipal Corporation limits in 1994. Though at the city level, the gross density is quite low. The core
inner areas of the city and some of the older areas are more densely populated than the ridge and
hilly areas of the city. In general, the area south of the central ridge/broad-gauge railway line is very
sparsely populated.
2.2.7 Population growth -
The population growth trends in Jabalpur do not depict any particular trend - the compound annual
growth rate (CAGR) during 1951 to 1981 was more or less stable at 3.7 to 3.8 per cent, while it
dipped by almost half to 1.91 per cent during 1981-91. The average growth registered during 1991-
2001 was 2.52 per cent per annum.
The reduced growth rates in population during the last two decades are attributed to the slow-down in
the local economy, especially between 1981 and 1991. This is evident from the fact that the total
workforce participation rate (main workers and marginal workers as a percentage of the total
population) was stagnant at 27 per cent during 1981 and 1991. There appears to have been an
upturn in economic activity between 1991 and 2001, when the workforce participation rate has risen to
over 32.5 per cent.
2.2.8 Spatial Pattern of Growth:
Due to recent changes in the ward boundaries in MCJ, a time-series analysis of the variation in ward
population has not been possible. However, the spatial growth trends in MCJ have been traced
based on relevant literature and graphic representations made available by the MCJ.
Development of Jabalpur as a city commenced from three nodes prior to 1901, with the areas
currently represented by Garha Ward (Ward 49) in the northwest, Cherital Ward (Ward 12) in the
north, and parts of the cantonment area adjoining wards 46 and 54 in the south-central part of
Jabalpur. The area of Jabalpur municipality in 1901 was about 18.13 sq. km.
Between 1909 and 1915 Jabalpur municipality developed about 490 acres of its own land for
residential and commercial uses and leased them to the citizens of Jabalpur Gol Bazar (Ward 9) area
in 1910 and Napier Town area (Ward 4) in 1911, which now form the core area of the city.
Wright Town area (Ward 9) was developed in 1923, while the Madan Mahal Station area (Ward 47)
was developed in 1934-35. Between 1921 and 1940, the city experienced a rapid growth in
population, and significant development took place in the northern areas beginning from Cheritaal
Ward (Ward 12), converging towards the central areas, and the eastern areas around Ranjhi (Wards
31 and 41). Subsequently, the central areas of the city in and around Gol Bazar, Napier Town, Wright
Town and Madan Mahal station areas and the areas between the central part and the eastern (Ranjhi)
areas experienced further densification.
2.3 Socio Economy Characteristics
2.3.1 Economy
Jabalpur, which is a regional centre and has good linkages by way of road and railway, has grown to
become a trading and industrial center in the region. The city had a vibrant industrial economy during
1950 to 1980, when production in the defense establishments located here was at its peak. However,
this industrial character has been reducing during the last two decades, reportedly due to reduced
production at the defense establishments and the lack of scope for ancillary industries to the defense
factories, which do not out-source production.

Jabalpur Transport Sector CMP Under JNNURM
Municipal Corporation, Jabalpur R-1
13
Jabalpur houses the offices of the headquarters of several state and national level government
departments, including the -State High Court, State Electricity Board, Post and Telegraph Workshop,
etc., offices of the district and divisional headquarters, and two large universities. A very large
proportion of the city's workforce is engaged in these establishments, whereas a significant
population is also involved in trade and commerce, which is primarily dependent on the service-class
population employed in various offices in the city. This is clearly evident from the workforce
participation structure of the city. The primary drivers of the economy of Jabalpur are the service
sector (mainly public sector establishments) and trade and commerce. Manufacturing and processing
industries, especially household and small-scale engineering industries, also contribute to the city's
economy, though marginally.
2.3.1.1 Industrial Activities
Jabalpur has a reasonable industrial base, constituted primarily by defense establishments. There
have been efforts by the state government to promote industrial development in and around Jabalpur.
The Madhya Pradesh Industrial Development Corporation (MPIDC) promoted an industrial estate in
the Adhartal area, where an area of about 106.67 acres was developed with 64 plots and 54 ready-
made industrial sheds. All of these plots and sheds have been occupied by small-scale industries.
Another industrial area - the Richai industrial area was developed by MPIDC over an area of 460.27
acres near the Adhartal Railway station. Of the 135 plots developed, only about 35 have been
occupied.
The significant industries in and around Jabalpur city include:
(a) Large-scale Industries
• Telecommunication Factory, (Gol)
• Gun Carriage Factory (Defense, Gol)
• Ordinance Factory (Defense, Gol)
• Vehicle Factory (Defense, Gol)
• Gray Iron Foundry (Gol)
(b) Medium-scale, Factories
• Shah Wallace Gillettin Factory
• S.A India Ltd.,
Devri
(c) Small-scale Industries
There are sizeable numbers of small-scale industries, in and around Jabalpur, which are engaged in
the manufacture of various products, including automobile parts, electrical spare parts and
equipments, air Compressors, garments, soaps. And detergents, stone crushers, RCC Hume pipe,
asbestos cement and PVC pipes, footwear, herbal cosmetic products, rolled steel, truck and bus
bodies, flour, etc. Other prominent industries include three cement plants, several fireclay
refractoriness and limestone kilns in and around the city. The region is rich in limestone, refractory
clay, bauxite, iron ore, manganese and other mineral deposits.
A large proportion of the city's population thrives on wholesale and retail trade and commerce. The
city serves as a regional wholesale market for food grains and other commodities. It also serves as a
market center for agricultural produce such as green peas, wheat, rice, pulses, oilseeds, maize, etc.,
which are cultivated in the rural hinterland. Jabalpur also functions as a distributing center for

Jabalpur Transport Sector CMP Under JNNURM
Municipal Corporation, Jabalpur R-1
14
agriculture implements, fertilizers, drugs and medicines, iron and steel, cement and minerals,
petroleum products and forest produces such as timber, etc. and ready made garments and textiles.
2.3.2 Regional Transport Scenario
Jabalpur is connected to the national transport network through road, rail and air transport. Amongst
them, road and rail play a major role in providing transport linkage with the rest of the country.
Being most important city in the region there is significant interaction between Jabalpur and the
surrounding towns through the road and rail networks. Regional road network connecting Jabalpur
with the rest of the country comprises of the following.
• Nagpur -Jabalpur- Varanasi/Allahabad Road (NH-7 I NH-7 & NH-27)
• Jabalpur-Bhopal Road (NH-12A)
• Jabalpur- Damoh - Tikamgarh - Jhansi (NH-12A)
• Jabalpur - Kumdam Road (SH-22)
• Jabalpur - Patan Road (MDR)
The area is also served by broad gauge and meter gauge rail lines, which connect Jabalpur with other
cities like Gwalior, Mumbai, Bhopal, Allahabad, Delhi and Howrah. Besides, the city is also connected
by meter gauge rail line to Gondia.
2.3.3 Road Network System
Major arterial roads within the study area are formed by Nagpur-Jabalpur-Allahabad Road (NH7),
JabalpurBhopal Road (NH-42), Kundam Road (SH-22), Damoh-Jabalpur-Mandla Road (SH37) and
Patan Road (MDR). These roads, along with the western bypass form the radial road network pattern
within the study area.
The Jabalpur Urban Area comprises multiple activity centers, which act as major traffic generators.
Within the central area, the Civic Centre and Favvara Chowk act as the major focal centers with
significant activity concentration. Predominant work centers generating various types of vehicular
traffic over the city road network system are given below:
Passenger Traffic City core, Gorakpur Ghamapur, High Court, Collectorate, Bus Stand,
Railway Station, Educational Institutions
Goods Traffic Niwarganj, Gurandi, Fawara, Mandan Mahal, Galgala, Mukadamganj
(Damoh' Road and Mandla Road)
Mixed Traffic Ghamapur, Gurandi Factory area, Madan Mahal Factory area,
Defence area (road to GCF, Khamaria etc.)
Some of the important roads in the central area are: Nehru Marg, Shastri Marg, Rani Lakshmibai
Marg, Gadhaphatak Marg, Jayaprakash Narayan Marg, Seth Vallabhdas Marg, Purana Mirzapur
Marg, High Court Road (Collectorate Road), Prabhat Chandra Marg, Madan Mahal Road and Gopal
Das Marg.
Outside the central area, regional roads provide major linkages to the city. Apart from the regional
roads, other important roads providing connectivity outside the central area are: Sadar Bazar Road,
Narmada Road, Adhartal Main Road (Vehicle Factory Road), MPEB Link Road, Western Bypass,
Mall Road, Ridge Road, Residency Road and Garha Road.

Jabalpur Transport Sector CMP Under JNNURM
Municipal Corporation, Jabalpur R-1
15
CHAPTER -3
REVIEW OF LAND USE SYSTEM
3.1 Existing Jabalpur Development Plan
The development plan projected a population size of about 7.0 lacs and 11.00 lacs for the Jabalpur
city. For the year 1981 and 1991 respectively. In addition, the population estimates for these cardinal
years for defense and catchments area were about 1.23 and 1.67 lacs respectively.
However, in reality, the population census for 1981 and 1991 reveal that the city witnessed a
population size of about 6.49 lacs and 7.64 lacs respectively. On the other hand, the defense and
catchments area (Including GCF & Vehicle Factory zones) witnessed population of about 1.4 lacs and
1.14 lacs by the year 1981 and 1991 respectively. The city thus recorded a population growth 3.9
percent per annum over 1971-81 and the growth rate reduced to 1.65 percent per annum over the
next decade indicating that population estimates in the development plan were significantly on a
higher side.
3.1.1 Existing Land Use
The general land use in Jabalpur Development plan was derived from the following considerations
* Integrated and continuous growth of important land uses so that the city attains a complete
entity during all phases of its development.
* Mixed land use zoning particularly in the city census and planning unit census to minimize
need to service and movement.
* Interrelationship to highest order activities with planning unit activities.
* Decentralization of work centers.
* Work place and living area relationship.
* Commercial corridors to inter link parent city and new development.
* Major commercial activities such as Mandi and wholesale markets, their relationship with
industrial area, other markets and regional roads
* Minimum dislocation of present land use pattern.
* Comprehensive transportation system.
Land allocation for various uses and the implementation status achieved prior to preparation of the
later development Plan 2011 is given below.
Table 3.1 Land use Analysis (1975-2005) (Area in ha.)
Land use
type
Land use
(1975)
Land use
(Dev. Plan
1991)
Achieved
Land use
in 1994
Proposed
Land use
(Dev. Plan
2005)
Achieved
Land Used Till
2005
Proposed
Development Plan
2021
Area % Area % Area % Area % Area % Area %
1. Residential 1503 49.6 3635 42.1 2328 51.5 3807 51.97 3215 58.28 4734 49.67
2. Commercial 68 2.2 512 5.9 124 2.7 445 6.07 209 3.79 4670 7.06
3. Industrial 263 8.7 707 8.2 368 8.1 551 7.52 368 6.67 621 6.51

Jabalpur Transport Sector CMP Under JNNURM
Municipal Corporation, Jabalpur R-1
16
Public/Semi 511 16.9 1124 13.0 714 15.8 846 11.55 730 13.23 1379 14.47
5. Recreation 39 1.3 886 10.2 139 3.1 540 7.37 142 2.57 702 7.36
6. Transport 645 21.3 1785 20.6 847 18.8 1107 15.11 852 15.45 1423 14.93
Total 3029 100.0 8649 100.0 4520 100.0 7326 100 5516 100 9529 100
Source: Jabalpur Development Plan2021
Transport system proposals in the Development Plan-1991 were evolved at two levels viz.
Regional & City level. The major programs included in the Development Plan were:
* The meter gauge railway link between Jabalpur and Gondia was recommended to be converted into
broad gauge in order to develop efficient transport linkage between Allahabad, Hyderabad, Jabalpur
and Raipur. In addition, the Development Plan also suggested modification of rail alignment between
Gwarighat and Howbagh stations. Two alternate alignments were also suggested
* In order to facilitate movement of regional traffic and to meet the growing traffic demand, the NH-7
and other regional roads were proposed to be strengthened/widened.
* In view of expanding industrial, commercial and administrative activities and the inherent tourist
potential, the Development Plan stressed upon the need for development of air linkage with major
cities and tourist destinations. Accordingly, new airport site along SH-22 was identified in the
Development Plan. An area of about 300 acres was proposed for the airport near village Tewar and
partly in village Sagra.
* In order to improve the city circulation pattern, a network of north-south and east-west road alignment
was proposed to provide direct access between the existing and proposed activity centers. The
network includes major north-south axis of NH-7 in the form of MR-4 along with the Ring Road, which
were proposed to be linked by east-west axial roads.
* In order to eliminate vehicular traffic jams at level crossings of roads and rails, grade separators were
proposed at eight locations within the city, besides the then existing four underpasses, two over
bridges and two level crossings.
* Besides the Railway Goods yards at Madan Mahal and main Railway stations, Kachpura railway
siding and Adhartal railway yard were proposed to meet the additional freight demand.
* Truck stations were proposed along Damoh Road, NH-7 near Maharajpur and along Ring Road.
* Local commuter rail service was proposed from Kachpura to panagarh with passenger stations at
Madan Mahal, main City station, Howbagh and Adhartal.
* Regional Bus stand and Depot for intercity bus system was proposed at Madhotal since the existing
bus stand was inadequate from functional point of view. Pickup stations for intercity traffic were
proposed at the existing bus stand, Maharajpur, near Empire Talkies and Ranital.
* Intra city bus terminals were proposed at the existing bus stand (which will function as main city bus
terminus), Gorakhpur, Ranjhi, Maharajpur, Khiriya Kalan, Karmeta (on Patan Road) and near •
Dhanwantari Nagar
* Off-street parking spaces were recommended at Tilakbhumi Talaiya, Shrinath-Ki-Talaiya, Sabzi
Mandi and behind Lordganj Thana.

Jabalpur Transport Sector CMP Under JNNURM
Municipal Corporation, Jabalpur R-1
17
3.2 Proposed Development Plan for Jabalpur:
3.2.1 Population Estimation
On the basis of Censes population available for Jabalpur Municipal Corporation, the census
population of last six decades of Jabalpur Municipal Corporation, are given here as under: -
Table 3.2 Population of Jabalpur city
Year Population of Jabalpur city (Lakh)
1951 2.04
1961 2.95
1971 4.42
1981 6.49
1991 7.62
2001 9.32
2011 10.54
Thus, forecast of population is adopted are as follows.
Year Population
2021 13.54
2031 17.39
2033 18.28
The current (2011) population of MCJ is 10.54 Lacs. The sudden increase in population from 1951
may be attributed to the fact that the corporation was upgraded from the status of municipality and
more area was added to its jurisdiction. In subsequent decades, there was a spurt in economic
activity with the establishment of defense establishments and state government administrative
establishments in Jabalpur, which led to significant in-migration to Jabalpur. The salient demographic
characteristics for the study area are presented below in Table 3.3 the study area spread over an
area of 245.17 sq. km. The study area recorded a population size of about 8.17 lakhs & 9.91 lakhs in
the years 1991 & 2001 respectively.
The Development Plan could however not achieve its planned targets in the
stipulated period primarily on account of the following factors:
I. Lack of coordination amongst various agencies
II. Lack of adequate resources
III. Lack of encouragement to private sector
IV. Absence of monitoring to check development pattern
The DP-1991 had targeted land utilization rate of 7.86 hectares per 1000 persons by 1991. However,
in reality, the city witnessed utilization of only about 5.32 hectares per 1000 persons by 1994.
The DP-2005 is targeting to develop 7326 hectares of land with utilization rate of 6.10 hectares per
1000 Persons. The city witnessed utilization of only about 4.6 hectares per 1000 persons by 2005.
The DP-2011 is targeting to develop 9529 hectares of land with utilization rate of 5.95 hectares per
1000 Persons.The land allocation for various uses is given below in table 3.3.

Jabalpur Transport Sector CMP Under JNNURM
Municipal Corporation, Jabalpur R-1
18
Table 3.3 Jabalpur Land use Distribution
S.
No.Land use
Existing (2005) Proposed (2021)
Area in
(Hect)
%
share
Rate of
Land
Area in
(Hect)
%
share
Rate of Land
Allocation
1 Residential 3215 58.29 2.68 4734 49.67 2.95
2 Commercial 209 3.79 0.17 670 7.06 0.42
3 Industrial 368 6.67 0.31 621 6.51 0.39
4 Public/Semi- 730 13.23 0.61 1379 14.47 0.86
5 Recreation 142 2.57 0.12 702 7.36 0.44
6 Transportation 852 15.45 0.71 1423 14.93 0.89
Total 5516 100.00 4.60 9529 100.00 5.95
The major transport system proposals identified in Development Plan-2005 in order to
improve the traffic and transportation situation within Jabalpur are summarized below:
* Tempos are a major cause of pollution and the Plan indicates that tempos should be banned
within city limits and these routes be provided with mini buses.
* Electric Tram has been recommended along the primary arterial road ARP-4 between Kheri
Village and Baghatal on NH-12.
* Construction of bridge across Narmada at Gwarighat connecting Mangeli/Manegaon.
* In order to reduce traffic jams, vehicular underpass has been proposed near Madan Mahal
Railway station. In addition over bridges to cross the Railway tracks have been proposed at
Garha Railway crossing, along bypass at Mohniya village, primary arterial between Adhartal and
Ranjhi Industrial area, primary arterial near Bahdan village (Kachpura) and along other (primary)
arterials connecting roads linking industrial area and catering to heavy vehicles.
* Geometric improvements are proposed for intersections at Damoh Naka, Tularam Chowk,
Karamchand Chowk, Ghamandi Chowk, Omti Chauraha, Andherdev Chauraha, Ranital
Chauraha, Nagar Nigam Chauraha, Ghamapur Chauraha, Madan Mahal Chauraha, Gorakhpur
and Russel Chowk.
* The DP-1991 had proposed the airport to be located near Tewar. However, this proposal has
been abolished under the DP-2005 and the existing airport at Dumna is proposed to be
developed by extension within acquired land at village Chakdehi. The link road connecting the city
with Dumna Airport passes through restricted area and needs to be developed.
* Railway station at Adhartal has been proposed. Commuter rail services are proposed to be
provided between industrial establishments connecting Kachpura & Panagarh. The Jabalpur-
Gondia line is proposed to be converted into broad gauge and Gwarighat, Howbagh, Jabalpur,
Khamaria, Ranjhi, Panagarh commuter red I services may be introduced.
* Regional bus stand is proposed at Madhotal over 10 hectares land. The existing bus stand near
Nagar Nigam is proposed to be converted into intra city bus terminal. In addition sub-regional bus
stands are proposed near Jabalpur Talab, Damoh Naka and Garha (near Paraswara Village).
* Intra city bus terminals are proposed at Gorakhpur and Howbagh railway station, Ranjhi,

Jabalpur Transport Sector CMP Under JNNURM
Municipal Corporation, Jabalpur R-1
19
Maharajpur (near village Kheri), Primary arterial at Kudwari, Patan Road (near Karmeta),
Dhanwantari Nagar (adjacent to proposed Transport Nagar), Medical college junction and Damoh
Naka over an area of 4 hectares each.
* Existing Railway Godowns at Madan Mahal and Jabalpur Main station would continue to function
in the future. In addition, Railway Godown has been proposed within Adhartal Railway land due
to its proximity with Kachpura Railway siding and industrial area.
* Transport Nagar over 15 hectares land has been proposed at Maharajpur. In addition truck
terminals over four to five hectares are proposed at Oriya, Sahdan, Kungwa, Paraswara and
Madhotal.
* In order to improve connectivity and efficiency over the central area network, the plan proposes
to develop orbital roads, which would be linked by north-south and east-west radials, through the
central area.
Review of the Development Plans indicate that the planned targets in DP-1991 could not be
achieved within the stipulated period due to various factors, primarily related to non-availability of
requisite funds and lack of effective coordination. As a result of non-development of targeted area
under residential usage, locations like Napier town, Wright town and Civil lines have witnessed
excessive growth in population densities. In addition Garha, Amanpur, Lakshmipur, area adjacent
to Damoh Road, Ricchai and Ranjhi have also witnessed growth in density levels.
Although a part of the ring road from south of Jabalpur upto NH-7 near Khairi has been
constructed, the other projects are yet to be completed. As a result, the north-south Purana
Mirzapur road within city limits witness’s severe congestion levels.
One of the major reasons for non-achievements of tile-planned targets has been slow or non-
implementation of a number of transportation projects identified in the DP-1991.
On the whole while the two Development Plans prepared for the city did attempt to regulate the
growth and development of the city with a certain degree of success, a lot remains to be desired
particularly with, respect to lack of integration between land use and transport system. Though the
Development Plan did emphasize that the efficient movement within the city can only be achieved
by evolving a functional land use pattern combined with efficient circulation plan, in actual practice,
this has remained a distant dream leading to imbalance between land use and transport system.

Jabalpur Transport Sector CMP Under JNNURM
Municipal Corporation, Jabalpur R-1
20
CHAPTER - 4
EXISTING TRANSPORT SYSTEM
4.1 EXISTING TRANSPORT SYSTEM IN THE CITY
The role of planning for traffic and transportation in Jabalpur at present rests with a number of
agencies, including Municipal Corporation, National Highways, State Highways, the Indian Railways,
Interstate bus operators, private bus operators, ete. More often than not, these agencies play key role
in transport service provision in an urban area.
The Municipal Corporation of Jabalpur (MCJ) is vested with maintenance and development of the
street network (Including National and State Highways) within away traffic management and
circulation system, the public transportation system, control of IPT, management of truck operations,
etc.
4.1.1 Vehicular Growth and Composition:
There are 5.48 lakh-registered vehicles up to Dec, 2010 at Jabalpur. The total number of registered
vehicles has grown at a CAGR of 9.0 per cent.
Table 4.1Vehicular Growths
S.No Year Total Number of Registered
Vehicles (Cumulative)
Annual Growth
Rate
1 1996-97 1,88,909 8.7
2 1997-98 2,04,831 8.4
3 1998-99 2,27,545 11.1
4 2000-01 2,50,129 9.9
5 2001-02 2,71,305 8.5
6 2003-04 3,57,466 7.1
7 2004-05 3,85,671 7.9
8 2005-06 4,17,679 8.3
9 2006-07 4,20,069 5.70
10 2007-08 4,49,279 6.95
11 2008-09 4,99,534 11.18
12 2009-10 5,48,121 9.7
*Source: RTO, Jabalpur

Jabalpur Transport Sector CMP Under JNNURM
Municipal Corporation, Jabalpur R-1
21
Table 4.2 (A) Total Number of Registered Vehicles As on quarter ending Dec 2010 of Jabalpur
S.No. Class of vehicles Total No. of
registered
vehicles on the
closing day of
previous
quarter ending
Total no of
registered
MV during
the
quarter
Total No. of MV
registration
canceled or
transferred to
other province
of country
Total No. of
registered
MV quarter
ending
Total No.
of R.C.’s
that been
surrender
to the
R.A.
Remarks
1 2 3 4 5 6 7 8
1 Goods Vehicles
1. Multiaxled and
Articulated vehicle
Private Sector 2455 173 - 2628
Public Sector - - - - -
2. Medium and Heavy
Trucks and Lorries
Private Sector 7019 67 74 7012 -
Public Sector - - - -
3. L.C. Vs. (Four
Wheelers only)
Private Sector 4292 248 01 4539 -
Public Sector - - - - -
4. L.C. Vs. (Three
Wheelers only)
Private Sector 4847 110 - 4957
Public Sector
Passenger Vehicles
Full Bus (Over 30+1)
1. M.P.S.R.T.C.
A. Ordinary 316 - - 316
B. Deluxe - - - -
C. Other’s
A. Ordinary 339 05 12 332
B. Deluxe 44 01 - 45
B Mini Busses
(a) Upto 12+1 7436 176 7512
(b) 12+1 to 30+1 823 12 04 831
(c) Motorcab 1887 142 01 2028

Jabalpur Transport Sector CMP Under JNNURM
Municipal Corporation, Jabalpur R-1
22
d. Tempo
(a) Upto 6+1 76 - - 76
(b) Over 6+1 498 - - 498
(c) Autoricshaw 5886 204 03 6087
2. Two Wheelers
1. Motor cycle Scooter 340779 10265 437 350607
2. Mopeds (Auto cycle
etc.)
103495 34 - 103529
3. Cars 35199 1602 208 36593
4 Jeeps 2081 - - 2081
5. Tractors 11544 207 08 11743
6. Troli 2980 09 - 2989
7. Other Vehicles 3595 24 01 3618
Total Vehicles 535591 13279 749 548121
* Source- R.T.O Jabalpur
4.1.2 Road Net Work Characteristics:
National Highway No.7 cuts across the city from north to south. This road is encroached and highly
congested, forming one of the principal arterial roads of the city.
A bye pass branches off from NH 7 in the north and runs all the way to the southwest, crossing the
state highways and reaching NH 7 once again. The original alignment of NH 7, which ran through the
heart of city, is now completely by-passed.
The road network is constrained by a railway line that runs along the central ridge of the city. The
cantonment lying to the east of the railway line is connected to the main town, which lies to the west of
the railway line, via four grade-separated rail crossings. However, to the north and south of the town,
grade-separated crossings are limited to a few locations. At-grade crossings still pose major hurdles for
free-flowing traffic.
The Jabalpur Development Plan, 2011 document prepared in 2005 calls for some major up gradation
of the road network in the areas between the core city and the newly formed by-pass road.
Table 4.3 Parking Duration of Vehicles
Location Stretch Parking Duration
2W Car Auto Tempo LCV HCV Buses
Andherdev Marg Tularam Chowk & Bhargav Chowk 46.6 30.0 15.0 0.0 7.5 0.0 0.0
Jabalpur Bus
Stand
0.0 0.0 0.0 0.0 0.0 0.0 73.7
Civic Center Hotel Tarang & Rajdhani
Restaurant
53.0 50.5 15.0 0.0 0.0 7.5 0.0
TCPO to Prakash Collection Shop 40.9 38.9 22.4 0.0 7.5 0.0 0.0
Favvara Chowk Lordganj Police Station and
Favvara Chowk
38.6 34.0 32.7 0.0 0.0 0.0 0.0
Favvara Chowk to Kamania Gate 38.4 32.8 45.0 0.0 0.0 0.0 0.0

Jabalpur Transport Sector CMP Under JNNURM
Municipal Corporation, Jabalpur R-1
23
Bhargab Chowk to Favvara Chowk 34.4 44.7 20.0 7.5 37.5 0.0 0.0
Favvara Chowk & Mandi Chowk 28.0 35.0 18.5 7.5 0.0 0.0 0.0
In front of
Jabalpur Bus
Stand
Section in front of Jabalpur Bus
Stand
47.9 50.2 36.2 21.4 20.6 7.5 0.0
Jayprakash
Narayan Marg
Malviya Chowk to Super Market 34.9 43.4 20.5 15.0 37.5 0.0 0.0
Super Market to Lordganj Pokice
Station
45.5 51.7 18.8 0.0 0.0 0.0 0.0
Sadar Market Intersection to Playground 42.4 35.8 44.4 0.0 15.0 0.0 0.0
Post Office to Intersection 57.5 42.8 22.5 0.0 21.0 15.0 0.0
Karamchand
Chowk
Karamchand Chowk to Tularam
Chowk
32.2 41.1 23.0 0.0 7.5 0.0 0.0
Karamchand Chowk to Badi Omti 35.7 46.2 26.9 7.5 15.0 7.5 0.0
Karamchand Chowk to Rajeev
Gandhi Chowk
36.7 36.0 37.7 0.0 7.5 0.0 0.0
Karamchand Chowk to Malviya
Chowk
36.8 24.5 15.0 0.0 7.5 0.0 0.0
Shastri Marg Nagar Nigam Chowk to Navbharat
Press
20.0 25.0 18.8 15.0 7.5 0.0 0.0
Shastri Marg Navbharat Chowk to Bloom Chowk 39.0 69.1 45.8 33.0 75.0 118.6 0.0
Victoria Marg Badi Omti Chowk to Tularam
Chowk
36.5 48.4 26.8 0.0 0.0 0.0 0.0
4.1.3 Area Wise Road Network
The appreciation of road network characteristics is important to assess the existing capacity level of
the roads, identify the problems if any and assess the scope of improvement or upgradation of the
network to cater to the existing and future traffic demand. For the present study a detailed inventory of
323 km has been carried out, out of which 63.9%, 6.16% and 21.83% of roads passes through
Corporation, Cantonment and Villages respectively, About 8.1 % of roads presses through OFK, GCF
& VFJ area combined together.
4.1.4 Total Road Length
The city contains a dense network of roads. A detailed inventory survey of about 323 km of roads has
been carried out for the entire study area. The analysis is done at four spatial levels.
1- Corporation area
2- Cantonment area
3- Vehicle factory, Jabalpur (VFJ), Ordnance factory, Khamariya (OFK) and Gun Carriage factory (GCF).
4- Villages
The road network inventory data was analyzed in terms of the parameters like type of road, Right of Way
(ROW), carriageway, type of pavement, service lane availability, on street parking, service lane
availability, drainage facilities, footpath and street lighting facilities.

Jabalpur Transport Sector CMP Under JNNURM
Municipal Corporation, Jabalpur R-1
24
Table 4.4 The distribution of total length of the road passing through different spatial units of
the study area.
Name of Area Total Length of Roads
(In Kms.)
Corporation 206.5
Cantonment 19.90
Villages 70.50
OFK, GCF & VFJ 26.10
Total 323.00
4.1.5 Type of Road
Distribution of road length by type of road shows that about 35.7% of roads in the Corporation area
are arterial roads while in the Cantonment and OFK, GCF & VFJ area 10.7% and 36.7% respectively.
Nearly 64% of the roads are of arterial type in the village area.
Table 4.5 Distribution of road length by type of road (in%)
Type of
classification
Road Length
Corporation Cantonment Village OFK, GCF & VFJ
Arterial 35.7 10.7 64.0 36.72
Sub Arterial 27.6 32.3 31.8 21.30
Collector 29.4 44.9 2.8 41.98
Local 7.3 12.0 1.3 0.00
Total 100.0 100.0 100.0 100.0
4.1.6 Right of way (ROW)
The study shows that nearly 18% of road in study area have ROW above 30m and nearly 82% of
roads in study area have ROW below 30m. It can be observed from Table that about 90.8% of roads
in the Corporation have ROW below 30m and in the Cantonment area 93.6% of the roads have ROW
30m, whereas in village 49% has ROW below 30m. In the ordinance factory, vehicle factory and GCF
area, 86.6% have ROW below 30m.
Table 4.6 Distribution of Road Length by ROW (in%)
Road (m) Road Length
Corporation Cantonment Village OFK, GCF & VFJ
Upto 10 13.34 16.90 10.47 25.29
10 to 15 22.33 28.25 26.89 40.12
15 to 20 21.09 25.03 4.04 13.50
20 to 30 34.12 23.50 7.61 7.73
30 to 40 4.91 6.34 15.90 13.35
40 to 60 4.21 0.00 35.08 0.00
Above 60 0.00 0.00 0.00 0.00
Total 100.0 100.0 100.0 100.0

Jabalpur Transport Sector CMP Under JNNURM
Municipal Corporation, Jabalpur R-1
25
4.1.7 Service lane Availability
There is no provision of service lane in almost the entire road network in the study area. This causes
the local traffic to use the main network for its movement, which affects the level of service on the
network.
4.1.8 Occurrence of On-street Parking
On-street parking reduces the carriageway width for the traffic movement thereby resulting in the loss
of traffic carrying capacity of the road network. It has been observed that nearly 70% of road network
in the entire study area has on street parking with the majority falling in the corporation area. Nearly
83.2%, 46.8% and 55.8% of the roads in the Corporation, Cantonment and Village area respectively
shows the phenomena of on street parking. About 38% of roads network has on street parking in the
OFK, GCF & VFJ area. Table shows road length distribution by occurrence of On-Street Parking.
Table 4.7 Distribution of Road Length by Occurrence on –Street Parking (in %)
On-Street parking Road Length
Corporation Cantonment Village OFK, GCF & VFJ
On both sides 81.8 44.2 55.0 32.64
One side 1.4 2.6 0.8 4.54
Not observed 16.8 53.1 44.2 62.83
Total 100.0 100.0 100.0 100.0
In the Corporation area major parking is observed in the Central area, which includes roads such as:
1- Victoria Marg
2- Jayaprakash Narayan Marg
3- Four arms of Tularam Chowk
4- Favvara Chowk
The area around Favvara Chowk shows large amount of on street parking and in absence of
adequate ROW coupled with encroachments by shops and street side vendors, seriously affects
movement of traffic.
4.1.9 Type of Pavement
Distribution of road length by type of pavement shows that most of the roads in the study area are
bituminous paved and very few of them are concrete roads. It can be seen from the Table that all the
roads in the cantonment are of bituminous type.
Table 4.8 Distribution of Road Length by Type of Pavement
(in%)
Pavement
Type
Road Length
Corporation Cantonment Village OFK, GCF & VFJ
Bituminous 94.8 100 98.7 100
WBM 0.0 0 0.0 0
Concrete 5.2 0 1.3 0
Others 0.0 0 0.0 0
Total 100.0 100.0 100.0 100.0

Jabalpur Transport Sector CMP Under JNNURM
Municipal Corporation, Jabalpur R-1
26
4.1.10 Pavement Condition
Analysis of the condition of the roads in the study area in terms of extent of surface cracking, rutting,
undulation and bumps, potholes, patches etc reveal that the general quality of network is good. The
overall quality of roads is very good in the Cantonment areas. Table shows the distribution of road
length by condition of pavement.
Table 4.9 Distribution of Road Length by Condition of pavement (in%)
Pavement
Condition
Type
Road Length in
Corporation
Road Length in
Cantonment area
Road Length in
Villages
Road Length in
OFK, GCK&VFJ
Exce
ss
ive
Med
ium
Low Tota
l
Ex
ce
ss
ive
Med
ium
Low Tot
al
Exce-
ssive
Med
ium
Lo
w
Total Exce
ssive
Med
ium
Low Total
Surface
Cracking
10.1 50 39.8 100 0.0 22.3 77.7 100 28.9 27.2 43.9 100 18.0 34.8 47.3 100
Rutting 10.1 49.8 40.0 100 0.0 22.3 77.7 100 28.9 27.2 43.9 100 18.0 34.8 47.3 100
Undulation
and bumps
11.1 49 39.8 100 0.0 22.3 77.7 100 28.9 27.2 43.9 100 18.0 34.8 47.3 100
Potholes 11.6 48.5 40.0 100 0.0 22.3 77.7 100 28.9 27.2 43.9 100 18.0 34.8 47.3 100
Patches 11.6 48.5 40.0 100 0.0 22.3 77.7 100 28.9 27.2 43.9 100 18.0 34.8 47.3 100
4.1.11 Major Transport Nodes:
Jabalpur City is connected to other parts of the state and country by road and railway line. National
Highway NO.7 connecting Varanasi and Nagpur traverses the city from north to south. National
Highway No. 12, leading to Jaipur links the city to Bhopal and the western part of the state and
country. The city is also wellconnected to other regional nodes like Damoh, Dindari. National highway
No.12 A connects the city with UP border via Tikamgarh and Prithvipur on North West and
Chhatishgarh border via Mandla.
In terms of railway linkage, Jabalpur lies on the Mumbai-Kolkata (via Allahabad) trunk railway route
and is the zonal headquarter for-the railways. Jabalpur is also connected to Balaghat and Gondia
towns by a narrow-gauge railway line, which is undergoing up gradation to broad gauge.
However, in terms of connectivity by air, the city has limited options with only one flight operating
between New Delhi and Jabalpur.
4.1.12 Pedestrian and NMV Facilities
Leaving few roads, all other roads lack footpath availability and marking of Zebra Crossings for the
pedestripn movements. On roads of the city no separate lane is provided/earmarked for the NMV.
4.1.13 Traffic Management
As part of its traffic management initiatives, MCJ installed traffic signals. MCJ, in consultation with the
Traffic Police, has designated some road corridors in the core city area as one-way traffic corridors.
These roads are very narrow and their capacities are further reduced by on-road parking and
significant pedestrian traffic and slow moving vehicles.
It needs to mention, that such initiatives are ad hoc. They do not form part of a comprehensive traffic
management plan. In a bid to' improve some of the major corridors which have significant commercial
land use, MCJ has identified. Such road stretches, including intersections, for improvement.

Jabalpur Transport Sector CMP Under JNNURM
Municipal Corporation, Jabalpur R-1
27
It is evident from tne results of the household survey, that walking is the most preferred mode of
travel (39 percent of households cited walking as their mode of travel). Yet, most of the roads in the
city do not have footpaths, which forces people to walk and the roads. Movement of people on the
roads has led to lower speeds of traffic. There is increased risk of accidents as well. It is reported that
over 50 per cent of the fatal road accidents of Jabalpur involved trucks. As a principle, trucks have
been banned on the arterial roads in Jabalpur during morning and evening peak traffic periods the
trucks are forced to use the by-pass roads. For Jabalpur-bound trucks, proper truck stand is required
to be constructed termed as Transport Nagar as detailed in the development plan.
There are no organized on street marked parking arrangements in any of the major commercial
areas of the city. Most of the core market areas of the city are characterized by narrow roads with a
high proportion of pedestrian and slow moving traffic. The capacity of the roads is further reduced by
vehicles parked on the roadsides. The multi levels parking adjoining core city area are must.
4.1.14 Traffic Characteristics:
The pre dominant mode of travel (motorized) in Jabalpur, like in most other cities in India is two-
wheeler and household modes of travel used for work trips. As per survey results 65 percent of the
respondents use non-motorized modes of travel to work place (by walk, bicycles and cycle rickshaw}.
About 24 per cent use two-wheelers and only 7 per cent of the respondents depend on public
transport.
The public transport mode is serviced by private transport operators through mini-buses and three-
wheeler tempos - there is no Government run public transport system in Jabalpur.
Table 4.10 Modes of Travel
Mode of Travel Number of Respondents
Walk 613
Bi-cycle 350
Cycle Rickshaw 65
Scooter/Motor Bike 377
Auto Rickshaw 18
Car 54
Public Transport 110
Total 1,587
*Source: CDP, Jabalpur
4.1.15 Travel Time Distribution -
Based on the primary household survey the average trip duration is less than 15 minutes for a
majority (over 50 per cent of respondents) of the households surveyed. About 30 per cent of the
respondents indicated an average trip duration of 15 to 30 minutes. Therefore, the average trip
duration of all the respondents works out to about 20 minutes - this includes walk trips as well.
Table 4.11 Average Trip Duration
Trip Duration
(minutes) % Respondents
< 15 52.6
15 to 30 31.2
30 to 60 10.7
> 60 5.5
Total 100.0

Jabalpur Transport Sector CMP Under JNNURM
Municipal Corporation, Jabalpur R-1
28
4.1.16 Intercity Bus Transport:-
The inter-city bus terminal at present is located in the central area of the city (off Model Road) and is
not adequate in terms of its bus handling capacity. It is necessary to have a new terminal in the city to
Facilitate passenger access. Existing Bus terminals also required upgradation.
4.1.17 Intermediate Public Transport:-
In absence of adequate public transport system the large intercity passenger demand is
catered by 300 auto rickshaws, 80 private buses and 3000 cycle rickshaws.
The predominant mode of IPT is the cycle rickshaw. It is reported that there are at least 3,000
licensed and unauthorized cycle rickshaws in Jabalpur. Auto rickshaws also constitute a small portion
of the IPT share. Given the nature of cycle rickshaws: that are slow and always obstructing fast
moving vehicles, it is easy to suggest that this mode should be phased out. A number of people's
livelihood, however, depends on cycle rickshaws. They are also non-polluting in terms of, air and
noise pollution and hence it would he a good idea to retain them. However, the number and their
areas of operation need to be restricted.
4.1.18 Traffic Safety
Lack of traffic sign and markings traffic signals, segregation of slow moving and fast moving traffic,
footpaths for pedestrian, good road surface proper parking space and proper traffic management
makes our road unsafe for traffic. Successful tackling of these problems will ensure safer journey on
the roads.
4.1.19 Existing Transport System in the City
The transport system in the city comprising of mini buses and 3 wheeler tempos is entirely run by
private operators. There are a total of five routes for mini buses and three for tempos, mostly
originating from the city centre and connecting to the fringe area of the city. In terms of fleet size,
there are about 550 registered mini buses and tempos. Existing city Bus routes are shown below in
Table 4.12
Table 4.12 Existing City Bus Route
S.No. Route No. Route
1. 1 Gwarighat to Railway platform no. 4 via Shastri Bridge
2. 2 Karmeta to Sai Baba Mandir via Baldevbagh collectorate, Ghampur,
Kanchghar chowk, Ranjhi
3. 3
4. 4 Agriculture College to Gohalpur via Adhartal, Raddichowk, Madan
Mahal Railway Station.
5. 5 Tilwaraghat to Gour Tiraha via Medical College, Madan Mahal.
The share of public transport to total trips is very low (only seven percent). This is not usually case in
other terms. Usually public transports account for the bulk of daily trips and could be between 40 to
70 percent.
The system of private bus operators does have many problems such as:
• Poor quality of service and comfort to passengers
• Lack of proper bus stations with basic amenities
• Reckless driving by private operators

Jabalpur Transport Sector CMP Under JNNURM
Municipal Corporation, Jabalpur R-1
29
• Rampant overcrowding of buses
• No scheduled departure or arrival timings - there is no specific waiting time for buses at
various bus stops, buses halt at a stop until they are filled with passengers Inadequate
coverage of city - private bus operators run more on market demand and Will not run
buses to outlying areas that may not have sufficient passengers and Commuter safety is
totally ignored.
• Inadequate coverage of city.
• Comuter safety is totally ignored.
As per the household survey conducted in the.city, people's access to the public transport system is
limited as the system covers very few areas of the town. A majority of commuters have to walk a long
distance to access the system. About 27 per cent of the city's population is not covered at all by
public transport (bus stand to reside'nce distance of over 2 kms).
4.2 Issues and Prospects
The city road network system lacks functional hierarchy. The central area road network has restricted
capacity due to high concentration of commercial activities and encroachment by hawkers. A number
of uncontrolled intersections affect the smooth operation of traffic. Peripheral area, on the other hand
has inadequate road network system, although most of the new developments are spread along
these radials. This situation has resulted in traffic congestion on the city road network system.
Presence of Cantonment area in the middle of Jabalpur Planning Area acts as a barrier to the
development of eastern part of the city comprising Umariya, Bhita, Sukhlalpur, Chakdehi, Dumna
(Aerodrome area) etc. A good road network system connecting these areas, without affecting the
Cantonment security, is essential to encourage overall development in this area.
Parking, particularly within the central area, needs special attention. There are limited organized and
off-street parking facilities in the city. Available parking facilities are not sufficient to meet the demand
and this has led to chaotic situation in the city. As a result, vehicles are parked irregularly, occupying
footpaths and precious road space, thereby reducing effective road space for traffic movement.
Poor intersection geometrics, absence of channelisers, lack of control and poor sense among road
users have resulted in chaotic situations at the intersections. Most of the roads in the central area
experience congestion due to encroachments and commercial activities. Lack of adequate facilities
for vegetables and flower markets have resulted in hawkers occupying the precious road space.
Lack of exclusive pedestrian facilities in the city core area results in significant vehicular-pedestrian
conflicts, thereby exposing pedestrians to risk of accidents and delays to vehicular traffic.
Pedestrians and vehicles share the same road space, often leading to unsafe and uncontrolled
crossing of pedestrians. Stray animals on the roads and within the intersection area is also a major
problem affecting smooth flow of traffic.
At present 3 ROB's, 2 RUB's and 3 level crossings provide access across the railway line. Of the
three ROB's, TWo are widely used. Tne two RUB's have low vertical clearance, thus heavy vehicles
are banned at these locations. Poor road surface with water logging is a regular feature during rainy
seasons. Two level crossings at Gorakhpur and on Garha road witness severe congestion due to
high level of activities and presence of intersections on either side of the Railway crossing.
Influence of slow moving traffic is noteworthy on the city road network. Absence of exclusive tracks
for slow moving vehicles has resulted in slow moving vehicles sharing the road space with fast

Jabalpur Transport Sector CMP Under JNNURM
Municipal Corporation, Jabalpur R-1
30
moving vehicles thereby affecting stream speeds.
The city lacks a well-developed organized public transport system that can effectively canter to the
mobility needs of the city dwellers and promote desirable urban from/structure and direction of growth
to the city. The present public transport system comprises of tempos and minibuses, which are highly
unorganized. Selection and introduction of appropriate technology, with proper routing and scheduling
is extremely vital to meet the future travel demand of the city.
4.3 Accidents
The city of Jabalpur witnessed about 1317 accidents in the year 2009, with about 466(35.4 percent)
involving two wheelers, 291 (22.1 percent) involving cars/jeeps, 192 (14.6 percent) involving trucks,
150 (11.4 percent) involving buses/minibuses and 149 (11.3 percent) involving three wheelers. These
accidents resulted in 78 deaths and 1351 injuries to road users. Amongst fatal accidents, about 50
percent involved trucks. Fatal accidents are generally observed along arterial roads near city
boundaries and at busy intersections. The past trend in growth of accidents within the city corporation
is tabulated below in table 4.13.
Table 4.13 Trend in growth of Accidents
Year Total
Accidents
Fatal
Accidents
Non-fatal
accidents Deaths
Number of
injured
persons
1991 778 62 716 64 594
1992 627 75 552 75 516
1993 504 40 464 43 437
1004 587 50 537 53 549
1995 681 70 611 75 679
1996 715 72 643 73 674
1997 800 78 722 84 755
1998 878 107 771 116 852
1999 827 72 755 85 804
2000 879 49 830 53 920
2001 870 72 798 73 840
2004 1045 83 999 64 1082
2005 1212 94 1165 96 1259
2006 1289 132 1196 80 1328
2007 1308 81 1221 85 1342
2008 1288 75 1207 79 1349
2009 1317 76 1233 78 1351
*Source: Traffic Police, Jabalpur
4.4 Transport System
The city had about 5.4 lakh vehicles in the year Dec 2010, registering an annual growth rate of 8.26
percent per annum in the last decade. Amongst the total vehicles, two wheelers comprise about
60.42 percent, while cars and jeeps about 29.16 percent. The mode-wise registration data of vehicles
for the last five years has been presented in Table.

Jabalpur Transport Sector CMP Under JNNURM
Municipal Corporation, Jabalpur R-1
31
Table 4.14 Year wise Vehicle Registered Data
Period
Auto
ricks
haw
Two·
Whe
eler
Mope
d
Cycle
Car
Jeep
Multi
Axle
Med.&
Heavy
Goods
Light
Goods
Vehicle
Bus Mini
bus
Motor
Cab Tempo
Tractor
Trailer Other Total
1997 to 1998 118 8489 4481 919 3 693 377 31 557 17 2 589 13 16289
1998 to 1999 242 10396 4316 998 11 208 280 24 341 18 18 443 21 17316
1999 to 2000 383 5501 13290 143 0 243 242 19 607 30 14 789 27 22584
2000 to 2001 329 5374 12313 1465 0 182 228 16 474 26 4 716 49 21176
2001 to 2002 214 12602 4855 921 0 193 190 4 373 39 8 719 47 20165
March 2007 4297 251674 103026 22798 462 7052 6026 686 6257 944 579 12916 3347 420069
March 2008 4607 274688 103213 25976 1006 7146 6895 686 6640 1069 579 13372 3397 449279
Source: RTO Office, Jabalpur
The role of public transport is marginal in the context of overall transport system. It is understood that about
450 minibuses and 300 tempos presently operate within the city area providing public transport services.
These services operate outside the central area and provide connection up to the bus stand in the core area
of the city. At present these services operate on six routes and do not follow any fixed schedule for
operations. Most of these are operated from the bus stand. In addition about 3000 cycle rickshaws and 300
auto rickshaws provide IPT services within the urban area.

Jabalpur Transport Sector CMP Under JNNURM
Municipal Corporation, Jabalpur R-1
32
CHAPTER – 5
ANALYSIS OF EXISTING TRAFFIC / TRANSPORT SITUATION
5.0 FIELD DATA COLLECTION ACTIVITIES
The traffic survey for establishing data base and to appreciate the existing traffic characteristic were
conducted during the period February – June 2007. A number of traffic and transportation surveys
were conducted as a part of study in order to asses the passenger and good movement pattern,
travel characteristics, pedestrian and parking characteristics and the available infrastructure facilities
within the study area. The data collection activities included classified traffic volume count surveys,
origin destination surveys, road inventory surveys, household travel surveys, public and IPT operator
surveys, Parking surveys, pedstrian surveys, terminal surveys. In addition significant data from
secondary sources pertaining to land use, demographic, socioeconomic characteristics public
transport system etc. was also collected as a part of the data collection activity.
Data collected through such extensive fieldwork will be used for appreciating the existing traffic and
travel characteristics, and for calibration and validation of travel demand and land use models for the
base year. This chapter deals with the survey preliminaries, nature and extent of fieldwork under
taken and the preliminary surveys finding for appreciating the existing traffic characteristics within the
Jabalpur study area.
5.1 Traffic Analysis
5.1.1 Zoning System
For better understanding of travel pattern within the study area and its interaction with regions
external to this area, a total of 102 zones, called Traffic Analysis Zones (TAZs) have been identified.
The zoning system has been developed based on network connectivity and importance of town/region
with respect to Jabalpur Urban Area. These 102 zones have been demarcated within the study area
spread over the district, state of Madhya Pradesh.
Considering the ease in obtaining the required zonal information, administrative wards have been
adopted as TAZs within the corporation area, which account for 60 zones. Traffic study
characteristics thus comprises of 60 zones in Corporation Area, 11 within Cantonment Board, Vehicle
and Ordinance factory area and 31 zones within surrounding villages in Jabalpur Planning Area.
Table 5.1 Internal Zones
S.No. Details Population(Thousands)
Jabalpur Municipal Corporation
1 Kamala Nehru 11.77
2 Subhadrakumari Chowhan 14.22
3 Swami Dayanand Saraswathi 14.72
4 Jayaprakash Narayan 9.25
5 Syama Prasad Mukhariee 16.02
6 Jawharlal Nehru 9.44
8 Dr. Ram Manohar Lohiya 11.03
9 Pandit Bhavani Prasad Tiwari 11.80

Jabalpur Transport Sector CMP Under JNNURM
Municipal Corporation, Jabalpur R-1
33
10 Kasturiba Gandhi 9.71
11 Swami Vivekananda 17.66
12 Charital 20.48
13 Mahatma Gandhi 34.92
14 Jawahar Ganj 9.68
15 Laomanya Balgangadhar 9.13
16 Ravindranath Tagore 9.40
17 Maharsi Aravind 12.29
18 Swaramai 13.58
19 Hanumantal 12.74
20 Pandit Motilal Nehru 9.71
21 Sardar Vallab Bhai Patel 9.26
22 Dr. Rajendra Prasad 8.10
23 Pandit Dindayal Upadhyaya 15.47
24 Rajiv Gandhi 26.97
25 Govind Vallabh Pant 16.27
26 Maulana Abdul Kalam Azad 11.69
27 Dr. Sarvapalli Radhakrishnan 14.41
28 Acharya Vinobabhave 14.82
29 Seetalmai 12.84
30 Sanjay Gandhi 12.89
31 Dwaraka Prasad Misra 14.07
32 Seth Govind Das 14.09
33 Siddha Baba 11.15
34 Subash Chandra Bose 16.06
35 Lal Bahadur Sastri 34.88
36 Takkar Gram 23.87
37 Sahid Ashafok Ali 26.79
38 Dr. Jakir Hussen 14.85
39 Chittaranjan Das 19.77
40 Deevan Adhar Sinha 23.28
41 Ghokulpur 25.45
42 Ambedkar 16.18
43 Sahid Bhagat Singh 23.54
44 Chandra Sekhar Azad 19.38
45 Lala Laiapati Rai 17.60
46 Dr. GonJe Hisalwa 20.66
47 Narasimha 12.68
48 Virsavarkar 12.93
49 Garha 19.34
50 Indira Gandhi 30.46

Jabalpur Transport Sector CMP Under JNNURM
Municipal Corporation, Jabalpur R-1
34
51 Rani Durqavathi 16.55
52 Madan Mahal 20.40
53 Guoteswar 18.36
54 Banarasidas Bhanoth 14.74
55 Giriraj Kishore 15.16
56 Sahid Gurian Singh 24.81
57 Tripuri 17.97
58 Sankash 23.51
59 Gwariqhat 27.11
60 Rani Laxmi Bai 22.21
Jabalpur Cantonment Board & Vehicle Ordinance Factory Area
61 Cantonment Ward-1 16.89
62 Cantonment Ward-2 11.06
63 Cantonment Ward-3 6.44
64 Cantonment Ward-4 5.87
65 Cantonment Ward-5 5.78
66 Cantonment Ward-6 16.69
67 Part of Cantonment Ward-7, Cheetapar 4.94
68 Part of cantonment Ward-7, Karonda 4.94
69 Panchari, Vehicle Factory zone 20.19
70 Chandeli, Jheria 0.00
71 Khamharia, Tiqhara, Ghana, Bargawa 25.19
Villages in Jabalpur Planning Area
72 Bahari, Kunda, Chhitapar, Pipariya 1.97
73 Tevar 3.08
74 Padua, Pindrai, Vikrampur 1.68
75 Kanqwa, Aduva 1.63
76 Bahdan 0.94
77 Basaha, Lamti, Raksa 0.97
78 Simariva, Rengva, Kachneri 1.89
79 Karmeta 5.04
80 Nandan Rosara 0.00
81 Oriva 1.61
82 Riwzha, Kathonda 1.51
83 Khiriva Kalan 0.82
84 Amkhera, Kudwari 3.47
85 Khiriva Khurd, Khajuri, Gurda, Chanti 1.22
86 Maharajpur 6.70
87 Hathana, Khairi 2.50
88 Suhaqi 7.49
89 Pipariva, Kandara Kheda 3.48

Jabalpur Transport Sector CMP Under JNNURM
Municipal Corporation, Jabalpur R-1
35
90 Kawalari, Lamti 0.60
91 Ema, Pipariva 3.54
92 Ricchai 19.12
93 Madhai 8.83
94 Bilpura 16.13
95 Mohania 2.66
96 Pipariva, Son pur 7.29
97 Umariya 2.75
98 Dumna, Cheqdehi 0.27
99 Mahgava, Kota, Sukhlalpur 0.00
100 Tilhari, Bhatoli 0.00
101 Pareswar 3.15
102 Manegaon 7.81
Total 1250.10
5.1.2 Identification of Screen and Cordon Lines
An imaginary line representing the boundary of the study area is termed as the cordon line.
Similarly imaginary lines along the physical and natural barriers, having few road crossing points
within the study area are termed as screen lines. The following screen lines have been identified:-
1. The north south screen line has been identified along the Allahabad-Jabalpur-Gondia
Railway Track.
2. The east west screen line has been demarcated along the Itarsi-Jabalpur railway track upto
to Satpula Bridge and thereafter along the Kundam Road (SH-22).
An imaginary line engulfing the study area and representing the boundary of the study area has beein
identified as the outer cordon line. The identified inner cordons, act as a boundary to the internal CBD
and the screen lines .
5.1.3 Secondary Data
The secondary data have been collected to describe:
* Characteristics of existing demand for travel.
* Existing supply of transport infrastructure including fleet size, operation, cost, performance,
regulation and utilization.
* Demographic and socio-economic characteristics.
* Present and proposed land use patterns.
* Planned transport investments, policy changes and other government actions.
* Funding sources and expected funds available for transport improvements.
While planning level (land use, demographic, socio-economic) and transport policy related information
is largely available from secondary sources, a number of primary surveys have been undertaken to
obtain information on network, system and travel pattern etc.

Jabalpur Transport Sector CMP Under JNNURM
Municipal Corporation, Jabalpur R-1
36
5.2 Primary Survey
The following primary traffic surveys were conducted for appreciating the existing traffic and travel
demand characteristics and to prepare the transport infrastructure improvement plans:
i) Road Inventory Survey
ii) Speed and delay survey
iii) Classified traffic volume count survey
iv) Origin – destination survey
v) Public transport operator survey
vi) Intermediate Public transport (IPT) user survey
vii) Parking Survey
viii) Pedestrian Survey
ix) Intersection turning movement survey
x) Terminals survey
The brief methodology adopted, locations, nature and extent of data collection during each of the
above-mentioned surveys has discussed below.
5.2.1 Road Inventory Survey
The objective of this survey was to asses the physical characteristics and condition of roads within the
study area, identify physical constraints and bottlenecks, asses potential capacity and identify the
extent for its future development/ improvement. About 323 Km. of primary road network was identified
for road inventory within the study area. The road network was categorized in terms of arterial, sub-
arterial and collector road. The survey was conducted by traveling along the identified road network
and by collecting details on road characteristics by visual evaluation, inspection and physical
measurement. The road network include for study has been given as under:
The data collected include right of way availability, carriageway width and surface type, abutting land
use, utility and services (on surface), on street parking and condition of drains, tree (within ROW),
traffic control and management measures and other special features.
The following data is extracted from the road network inventory surveys:
* Road geometric in terms of cross sectional elements.
* Existing street infrastructure in-terms of street lighting, guard rail etc.
* Traffic regulation and management measures.
* Existing capacity levels, LOS bottleneck zones.
* Existing and potential capacity of the link.
* Potentials, problems and constraints for traffic management plans.
* Identification of existing road hierarchy.
5.2.2 Speed and Delay Survey
Journey speed is one of the most, defining characteristics of traffic and its measurement is essential
in transport planning to evaluate the road network system, to provide vital inputs to travel demand
modeling and assist in economic analysis of improvement plans.
As a part of the present study, 323 Km of road network in the city was identified and the speed and
delay survey was carried out both in peak and off peak hours by "Moving Car Observer Method". The
network consisted of 356 nodes and 418 links. The data collected was analyzed to assess the speed
characteristics along the identified road network and identify locations and size of delay.

Jabalpur Transport Sector CMP Under JNNURM
Municipal Corporation, Jabalpur R-1
37
5.2.2.1 Spatial speed profile
Spatial analysis of speeds on the road network indicates that there is a marked difference in
average speeds between the VFJ and GCF areas and the rest of the study area. Distribution of
road length by journey speeds is presented in Table 5.2.
Table 5.2 Percentage Distribution of road length by journey speeds
Journey Speed
(Km./hr)
Road Length (%)
Corporation Cantonment Villages OFK/VFJ/GCF
Up to 10 16.72 3.34 7.68 0.00
>10 and <=20 52.05 74.45 55.37 6.36
>20 and <=30 23.94 11.28 24.72 57.22
>30 and <=40 3.47 3.23 8.37 29.67
>40 3.82 7.70 3.86 6.75
Total 100 100 100 100
The average speed in the study area has been found to be 18.83 kmph. Majority of city road network
has an average traffic speeds between 20 to 30 kmph. Nearly 68 % of the roads in corporation area
have speeds less than 20 kmph. It has been observed that the speed of the traffic in the OFK, GCF
and VFJ is much more than the rest of the study area suggesting the better conditions of the roads in
those parts of the study area.
5.2.2.2 Speed profile by Carriage width and type
Low speeds on city corridor are basically due to the congestion and inadequate carriageway widths.
Distribution of road length by carriageway width and average speed is presented in Table 5.3.
Table 5.3 Distribution by Carriageway and average Speed
Carriageway
Width
Speed (Kmph)
Upto 10 >10& <=20 >20 & <=30 >30 & <=40 >40 Total
Single Lane 5.96 71.00 15.99 3.96 3.08 100.00
Intermediate Lane 23.04 35.73 36.17 1.61 3.45 100.00
2 Lane 19.14 47.35 20.68 8.20 4.62 100.00
3 Lane 9.73 45.71 39.57 2.33 2.66 100.00
4 Lane 5.77 62.98 28.93 2.33 0.00 100.00
More Than 4 Lane 3.32 68.40 11.77 5.85 10.66 100.00
It can be observed from the above table that low speed prevails on less configuration roads having
inadequate carriageway width. In general high average speeds have been observed on divided roads
than on undivided roads. Distribution of road lengths by type of carriageway and speed has been
presented in Table 5.4.
Table 5.4 Distribution of Road Length by Speed and type of Carriageway
Carriageway
Width
Speed (Kmph)
Upto 10 >10& <=20 >20 & <=30 >30 & <=40 >40 Total
Undivided 14.17 53.30 23.35 5.08 4.10 100.00
Divided 6.42 45.98 38.98 8.62 8.62 100.00

Jabalpur Transport Sector CMP Under JNNURM
Municipal Corporation, Jabalpur R-1
38
The distribution by speed and road classification shows, as it can be observed from Table 5.5 that in
general the arterial roads have more traffic speed than the sub-arterial and the collector roads.
Table 5.5 Distribution of Road Length by Speed and Road Classification
Carriageway
Width
Speed (Kmph)
Upto 10 >10& <=20 >20 & <=30 >30 & <=40 >40 Total
Arterial 18.55 43.84 27.65 6.35 3.61 100.00
Sub-Arterial 10.32 64.59 16.86 5.73 2.51 100.00
Collector 10.94 59.2 25.19 1.52 3.16 100.00
5.2.3 Classified Traffic Volume Count Survey
These surveys were conducted in order to appreciate the traffic characteristics in terms of volume,
composition, peak hour and directional split at individual survey locations at the cordon & screen
lines.
5.2.3.1 Outer Cordon Survey
Classified Traffic Volume count surveys at the outer cordon were conducted for 24 hours on a typical
working day to identify locations with high intensity of traffic at the cordon line. In all, seven locations
were identified along the outer cordon to obtain hourly mode wise traffic at individual locations.
The locations included for outer cordon survey as schedule for conducting of surveys, is presented in
Table 5.6.
Table 5.6 Locations and Schedule of Cordon Survey
Location Id Road Locations Date
OC1 Damoh To Jabalpur Karmeeta (SH-7) 21st
June 2007
OC2 Patan To Jabalpur (Near By -Pass) 18th June 2007
OC3 NarsinghPur To Jabalpur (N.H.-12) 19th June 2007
OC4 Nagpur To Jabalpur (Tilwara Bridge N.H.-7) 22th June 2007
OC5 Mandla To Jablapur (Gour Bridge) (N.H.-12 A) 20th June 2007
OC6 Kundla Road To Jablapur (Khamariya) 15th June 2007
OC7 Katni To Jabalpur (N.H.-7) (Agriculture College) 26thJune 2007
5.2.3 .2 Screen Line Surveys
Classified traffic volume count and vehicle occupancy surveys were conducted at mid blocks along
roads crossing the demarcated screen lines. The surveys at some locations were generally
conducted for 16 hours (6.00 AM to, 10.00 PM) on a working day since majority of vehicular traffic in
urban area is observed during this period of the day. However, 24 hours surveys were also conducted
at selected locations to study the variation in day and night traffic and to evolve factors for expanding
16-hour traffic to 24 hours.
About sixteen (16) locations, comprising four locations along north-south screen line, seven along
east west screen line and five along inner cordon screen line were identified. The details regarding
locations and survey duration are presented in Table 5.7.

Jabalpur Transport Sector CMP Under JNNURM
Municipal Corporation, Jabalpur R-1
39
Table 5.7 Screen Line Survey Location and Schedule
Location
Id. Location Details Date Day
North South Screen Line (4 Locations)
NS1, Railway Crossing Near Bandariya Tiraha 28th May 2007 Monday
NS2, Shobhapur Railway crossing Between Adhartal &
Vehicle Factory 28
m May 2007 Monday
NS3, Gwarighat Railway Crossing 28 rd
May 2007 Monday
NS4, Satpula Bridge on Kudam Road 4 th
June 2007 Monday
East West Screen Line (7 Locations)
EW1 Along Bypass Near Bahadan Village 4th June 2007 Monday
EW2 Railway Bridge Near Madan Mahal Chowk 8 th
June 2007 Friday
EW3 Shastri Bridge over Proposed Corridor No.-2 26 th
May 2007 Saturday
EW4 Between Badariya Tiraha to Chandanvan Road (IV
th
Railway Underpass) 14
th June 2007 Thursday
EW5 Nagraj Chowk on Chandanvan to Badariya tiraha 28 th
May 2007 Monday
EW6 First Bridge on Gour Bridge to Chandanvan
Road 5
th June 2007 Monday
EW7 Sheela Cinema on Chandanvan to Gour Bridge
Road 28
th May 2007 Monday
Inner Cordon Line (5 Locations)
IC1 Near Damoh Naka 28th May 2007 Monday
IC2 Near Ranitaal Chowk 28 th
May 2007 Monday
IC3 Gorakhpur Chowk 28 th
May 2007 Monday
IC4 Raddi Chowk 4 th
June 2007 Monday
IC5 Ambedakar Road, Gohalpur 14 th
June 2007 Thursday
Classified traffic volume count surveys were conducted in fifteen-minute interval within each hour. The
vehicle occupancy surveys for passenger vehicles were conducted simultaneously in order to assess the
average number of passengers crossing the screen lines over different modes.
The following outputs are derived from the screen line survey data
� Traffic Characteristic in terms average daily traffic (ADT).
� Hourly Variation of Traffic (P.C.U.s & Vehicles).
� Peak hour flows and directional distribution of traffic.
� Traffic Composition and intensity along the corridors.
5.2.4 Origin-Destination Surveys at Outer Cordon
The objective was to obtain information on travel pattern of passenger and goods vehicles at the
cordon line along with the trip desire in terms of destined and through trips to the study area.

Jabalpur Transport Sector CMP Under JNNURM
Municipal Corporation, Jabalpur R-1
40
The O-D survey was conducted at seven locations along the cordon line; simultaneously with the
classified traffic volume counts surveys. The survey was conducted by roadside interview method for
24 hours on a sample basis. The survey locations are included in Table 5.8.
Table 5.8 Locations and Schedule of Cordon Survey
Location Id Road Locations Date
OC1 Damoh To Jabalpur Karmeeta (SH-7) 21st
June 2007
OC2 Patan To Jabalpur (Near By -Pass) 18th June 2007
OC3 NarsinghPur To Jabalpur (N.H.-12) 19th June 2007
OC4 Nagpur To Jabalpur (Tilwara Bridge N.H.-7) 22th June 2007
OC5 Mandla To Jablapur (Gour Bridge) (N.H.-12 A) 20th June 2007
OC6 Kundla Road To Jablapur (Khamariya) 15th June 2007
OC7 Katni To Jabalpur (N.H.-7) (Agriculture College) 26thJune 2007
The survey elicits information regarding travel pattern in terms of size and desire, trip purpose, trip
length, mode of travel, journey time and cost. In addition, details on goods movement in-terms of
quantity by type, tonnage, mode, trip length, lead-load spectrum etc. were also obtained.
5.2.5 House Hold Travel Survey:
The objective for conducting the house hold travel survey was to asses the house hold, socio-
economic and trip characteristics of resident within the Jabalpur urban area. The survey was carried
out on a sample basis for about 7606 household’s representative about three percent household with
the study area.
Table 5.9 House Hold Travel Survey
S.
No.
Zone
No.
Zone Description Number of
Household (2007)
House Hold
Surveyed
Jabalpur Municipal Corporation
1 1 Kamala Nehru 2402 72
2 2 Subhadrakumari Chowhan 2902 87
3 3 Swami Davanand Saraswathi 3004 90
4 4 Jayaprakash Narayan 1888 57
5 5 Svama Prasad Mukhariee 3269 98
6 6 Jawharlal Nehru 1927 58
7 7 Madan Mohan Malaviva 2251 68
8 8 Dr. Ram Manohar latiya 2408 72
9 9 Pandit Bhavani Prasad Tiwari 1982 59
10 10 Kasturiba Gandhi 3604 72
11 11 Swami Vivekananda 4078 98
12 12 Charital 6820 105
13 13 Mahatma Gandhi 1976 59
14 14 Jawahar Ganj 1863 56
15 15 Lakmanya Balgangadhar 1918 58
16 16 Ravindranath Tagar 2508 75

Jabalpur Transport Sector CMP Under JNNURM
Municipal Corporation, Jabalpur R-1
41
17 17 Maharsi Aravind 2771 83
18 18 Swaramai 2600 78
19 19 Hanumantal 1982 59
20 20 Pandit MatHai Nehru 1890 57
21 21 Sardar Vallab Bhai Patel 1653 50
22 22 Dr. Rajendra Prasad 3157 95
23 23 Pandit Dindaval Upadvava 5198 156
24 24 Rajiv Gandhi 3320 100
25 25 Govind Vallab Panth 2386 72
26 26 Maulana Abdul Kalam Azad 2941 88
27 27 Dr. Sarvapalli Radhakrishnan 3024 91
28 28 Acharya Vinobabhave 2620 79
29 29 Seetalmai 2631 79
30 30 Sanjay Gandhi 2871 86
31 31 Dwaraka Prasad Misra 2876 86
32 32 Seth Govind Das 2276 68
33 33 Siddha Baba 3278 98
34 34 Subash*Chandra Bose 6812 204
35 35 Lal Bahadur Sastri 4871 146
36 36 Takkar Gram 5161 155
37 37 Sahid Arafak All 3031 91
38 38 Dr. Jakir Hussen 4035 121
39 39 Chittaranian Das 4751 143
40 40 Deevan Adhar Sinha 5194 156
41 41 Ghokulpur 3302 99
42 42 Ambedkar 4804 144
43 43 Sahid Bhaqat 3955 119
44 44 Chandra Sekhar Azad 3592 108
45 45 Lala Laiapati Rai 4216 126
46 46 Dr. GonJe Hisalwa 2588 78
47 47 Narasimha 2639 79
48 48 Virsavarkar 3947 118
49 49 Garha 6216 186
50 50 Indira Gandhi 3378 101
51 51 Rani Durqavathi 4163 125
52 52 Madan Mahal 3747 112
53 53 Guoteswar 3008 90
54 54 Banarasidas Bhanoth 3094 93
55 55 Giriraj Kishore 5063 152
56 56 Sahid Gurian Sing 3667 110
57 57 Tripuri 4798 144

Jabalpur Transport Sector CMP Under JNNURM
Municipal Corporation, Jabalpur R-1
42
58 58 Sankash 5533 166
59 59 Gwariqhat 4533 136
60 60 Rani Laxmi Bhai 4563 137
Jabalpur Cantonment Board & Vehicle Ordinance Factory Area
61 61 Cantonment Ward-1 3447 103
62 62 Cantonment Ward-2 2257 68
63 63 Cantonment Ward-3 1314 39
64 64 Cantonment Ward-4 1198 36
65 65 Cantonment Ward-5 1180 38
66 66 Cantonment Ward-6 3406 102
67 67 Part of Cantonment Ward-7,
Cheetapar 1008 36
68 68 Part of cantonment Ward-7,
Karonda 1008 35
69 69 Panchari, Vehicle Factory xone 4120 124
70 70 Chandeli, Jheria 0 0
71 71 Khamharia, Tiqhara, Ghana,
Bargawa 5141 154
Villages in Jabalpur Planning Area
72 72 Bahari, Kunda, Chhitapar, Pipariya 402 29
73 73 Tevar 629 19
74 74 Padua, Pindrai, Vikrampur 343 15
75 75 Kanqwa, Aduva 333 14
76 76 Bahdan 192 12
77 77 Basaha, Lamti, Raksa 198 12
78 78 Simariva, Ren!::JVa, Kachneri 386 15
79 79 Karmeta 1029 31
80 80 Nandan Rosara 0 0
81 81 Oriva 329 14
82 82 Riwzha, Kathonda 308 11
83 83 Khiriva Kalan 167 9
84 84 Amkhera, Kudwari 708 21
85 85 Khiriva Khurd, Khajuri, Gurda,
Chanti 249 17
86 86 Maharajpur 1367 41
87 87 Hathana, Khairi 510 15
88 88 Suhaqi 1529 46
89 89 Pipariva, Kandara Kheda 710 23
90 90 Kawalari, Lamti 122 12
91 91 Ema, Pipariva 722 27
92 92 Ricchai 3902 117

Jabalpur Transport Sector CMP Under JNNURM
Municipal Corporation, Jabalpur R-1
43
93 93 Madhai 1802 54
94 94 Bilpura 3292 99
95 95 Mohania 543 29
96 96 Pipariva, Son pur 1488 45
97 97 Umariya 561 17
98 98 Dumna, Cheqdehi 55 8
99 99 Mahgava, Kota, Sukhlalpur 0 0
100 100 Tilhari, Bhatoli 0 0
101 101 Pareswar 643 23
102 102 Maneqaon 1594 48
Total 255127 7606
The main steps involved in conducting the surveys were:-
� Design of Draft questionaire.
� Modification of draft questionaire following discussion with the client.
� Appointment and training of enumerators.
� Conduct of Pilot surveys and revision of questionnaire, as necessary.
� Conduct of main survey, data coding, punching and checking.
� Data Analysis.
In addition, an opinion survey of the head of the household was carried-out on a sample basis
amongst selected for home interview surveys in order to asses the opinion about Mass Transportation
System if developed, preference to use it and willingness to pay for the proposed services.
The survey provided details on socio economic and personals characteristics at household and
individual levels. In addition, it provided detailed household trip making pattern (Zone-to-Zone trip)
table) and its relation with socio economic characteristics. A trip has been defined a journey from a
place of origin to a place of destination by a person capable for performing independent trip by any
mode, for any purpose and at any time of the day.
5.2.6 Public transport operator survey:
The objective was to asses the operational characteristics for the existing public transport nodes,
which in the present case are buses and tempos.
The surveys were conducted at the existing central bus Stand and Damoh Naka within the city to
determine the operational characteristics, in terms of vehicle utilization, passenger carried, operating
expenses and revenues. In all 110 operators comprising 33 minibuses operators and 77 tempo
operators were interviewed during the survey.
5.2.7 Intermediate Public Transport (IPT) Survey (Operators and Users):
The objective was to asses the operational characteristics of the IPT (Auto Rickshaw, Cycle, and
Rickshaw, Tempo etc.) to identify problems and issues and suggest appropriate policies for its rational
development. The IPT users were also interveiwd to asses their trip pattern (Origin -destination) along
with trip purpose and cost.
The survey was condcted at locations with concetration of IPT modes and trips. The major location
included.

Jabalpur Transport Sector CMP Under JNNURM
Municipal Corporation, Jabalpur R-1
44
* Jabalpur Main Railway Station (Both Side)
* Nagar Nigam Bus Stand
* Damoh Naka Bus Stand
* In front of Empire Takies
* Gorakhpur Railway Crossing (Both side)
* Vehicle more, Ranjhi
* Russel Chowk
The survey provided information regarding to trip characteristics, in terms of origin and destination of
trip by IPT modes, purpose of trip, frequency and cost of trip, IPT operational characteristics in terms
of route of operation, vehicle utilization, passenger carried, operating cost and revenue. The date was
used to asses the dispersal pattern of inter city / intra city trips from these terminals to reach the
ultimate destination after alighting from buses / trains. In all 201 IPT operators comprising of 122 auto
rickshaw operators were covered. In addition 247 users of public transport and Para transits were also
enumerated.
5.2.8 Parking Survey
The main objective was to appreciate the parking demand and supply characteristics, identify issues
and constraints & suggest appropriate policies for meeting the horizon year parking demand.
The survey was conducted simultaneously in order to assess the level of usage of on-street and off-
street parking facilities at pre-selected locations where significant parking is observed. The surveys
provide information on utilization of parking space turnover rates and the average parking duration.
The survey was conducted for 12 hour at twelve locations given below in Table 5.10.
Table 5.10 Parking Survey Locations & Schedule
Road
Section/Location Stretch
Nature
Of Parking Date
Favvara Chowk Bhargav Chowk to Favvara Chowk On-street 27 May 2007
Favvara Chowk Fountain Chowk to Mandi Chowk On-street 27 May 2007
Favvara Chowk From lord qani Police Station to Favvara Chowk On-street 27 May 2007
Favvara Chowk From Favvara Chowk to Kamania Gate On-street 27 May 2007
Bus Stand In front of Bus Stand On-street 27 May 2007
Victoria Marg From badi Omti to Tularam Chowk On-street 01 Apr 2007
Andherdev Marq From Tularam Chowk to Bharqav chowk On-street 01 Apr 2007
Karamchand Chowk From karamchand Chowk to Tularam Chowk On-street 01 Apr 2007
Jaiprakash Narayan
Marq From Malviya Chowk to Ganiipura market On-street 01 Apr 2007
Karamchand Chowk Karamchand Chowk to Malviya Chowk On-street 03 Apr 2007
Karamchand Chowk From Karamchand Chowk to Badi Omti. On-street 03 Apr 2007
Karamchand Chowk From Karamchand Chowk to Rajiv Gandhi
Chowk On-street 03 Apr 2007
Shastri Marg Nagar Nigam Chowk to Nav Bharat Office On-street 03 Apr 2007
Railway Station Inside railway station parkinq lot On-street 04 Apr 2007
Jaiprakash Narayan
Mrg From Lord Ganj Chowk to Ganjipura Market On-street 04 Apr 2007
Sadar Market Entire Stretch On-street 04 Apr 2007
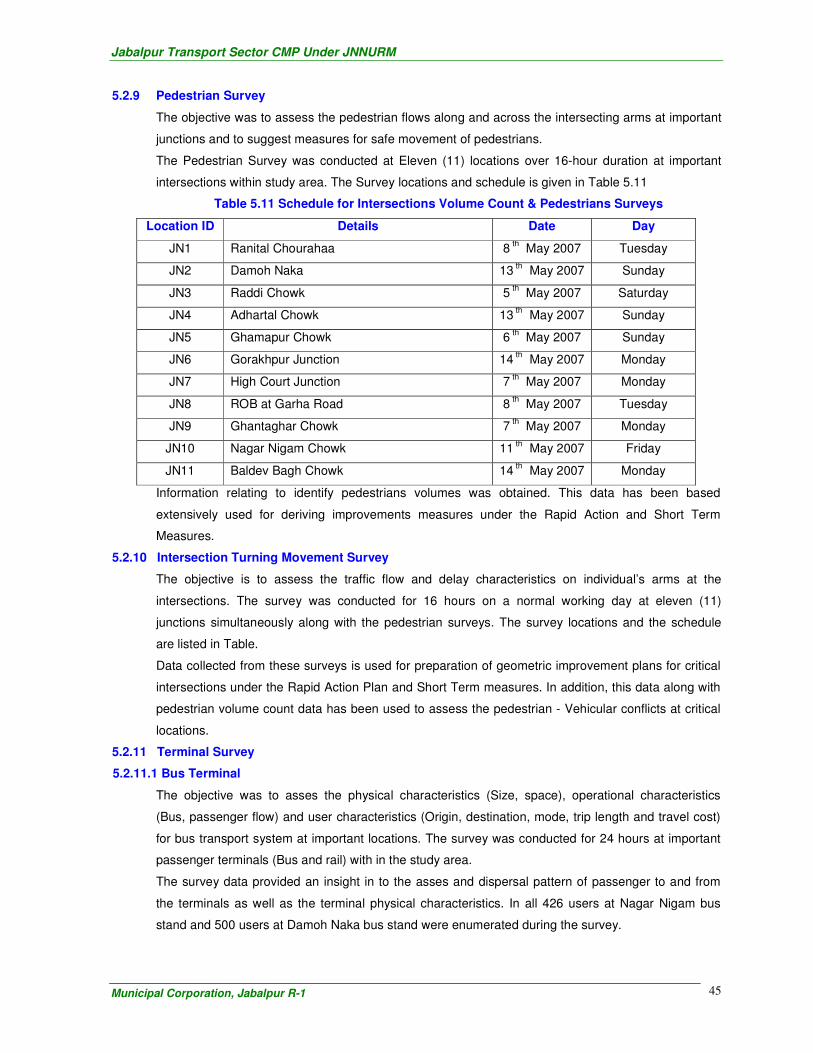
Jabalpur Transport Sector CMP Under JNNURM
Municipal Corporation, Jabalpur R-1
45
5.2.9 Pedestrian Survey
The objective was to assess the pedestrian flows along and across the intersecting arms at important
junctions and to suggest measures for safe movement of pedestrians.
The Pedestrian Survey was conducted at Eleven (11) locations over 16-hour duration at important
intersections within study area. The Survey locations and schedule is given in Table 5.11
Table 5.11 Schedule for Intersections Volume Count & Pedestrians Surveys
Location ID Details Date Day
JN1 Ranital Chourahaa 8 th
May 2007 Tuesday
JN2 Damoh Naka 13 th
May 2007 Sunday
JN3 Raddi Chowk 5 th
May 2007 Saturday
JN4 Adhartal Chowk 13 th
May 2007 Sunday
JN5 Ghamapur Chowk 6 th
May 2007 Sunday
JN6 Gorakhpur Junction 14 th
May 2007 Monday
JN7 High Court Junction 7 th
May 2007 Monday
JN8 ROB at Garha Road 8 th
May 2007 Tuesday
JN9 Ghantaghar Chowk 7 th
May 2007 Monday
JN10 Nagar Nigam Chowk 11 th
May 2007 Friday
JN11 Baldev Bagh Chowk 14 th
May 2007 Monday
Information relating to identify pedestrians volumes was obtained. This data has been based
extensively used for deriving improvements measures under the Rapid Action and Short Term
Measures.
5.2.10 Intersection Turning Movement Survey
The objective is to assess the traffic flow and delay characteristics on individual’s arms at the
intersections. The survey was conducted for 16 hours on a normal working day at eleven (11)
junctions simultaneously along with the pedestrian surveys. The survey locations and the schedule
are listed in Table.
Data collected from these surveys is used for preparation of geometric improvement plans for critical
intersections under the Rapid Action Plan and Short Term measures. In addition, this data along with
pedestrian volume count data has been used to assess the pedestrian - Vehicular conflicts at critical
locations.
5.2.11 Terminal Survey
5.2.11.1 Bus Terminal
The objective was to asses the physical characteristics (Size, space), operational characteristics
(Bus, passenger flow) and user characteristics (Origin, destination, mode, trip length and travel cost)
for bus transport system at important locations. The survey was conducted for 24 hours at important
passenger terminals (Bus and rail) with in the study area.
The survey data provided an insight in to the asses and dispersal pattern of passenger to and from
the terminals as well as the terminal physical characteristics. In all 426 users at Nagar Nigam bus
stand and 500 users at Damoh Naka bus stand were enumerated during the survey.

Jabalpur Transport Sector CMP Under JNNURM
Municipal Corporation, Jabalpur R-1
46
5.2.11.2 Rail Terminal
The objective of the survey was to asses the user’s dispersal characteristics at railway stations. In all
5819 passengers comprising of 4352 passengers at Jabalpur main railway station 830 passenger at
Madan Mahal Railway Station and 637 passenger at Howbagh Railway Station were enumerated as
part of the survey.
5.2.11.3 Goods Terminal:
The objective was to asses the truck operator characteristics and their requirements, issues and
problems. The survey was conducted to capture both, local and regional goods transport operators. In
addition, physical appreciation of goods terminals within the study area along with deficiencies and
problem associated with the terminals were also studies. The following location were include the
survey.
* Baldeobagh
* Madan Mahal
* Ukheri Road
* Aghakhan Chowk
* Gorakhpur
* Bus Stand
* Mahanadda
* Russel Chowk
* Damoh Naka
* Katnga
* Panti Naka
The survey data provided a basis for assessing the operational characteristics of truck operator. In all
78 truck operator were enumerated.
5.2.12 Willingness to pay/use
In addition to the opinion & willingness to pay survey conducted along with the household surveys,
Willingness- to-Pay Surveys were also conducted at other locations having concentration of public
activities. About 100 samples were collected at the following locations:
� Jabalpur Main Railway Station
� Madan Mahal Railway Station
� Bus Stand
� Empire Talkies Gorakhpur
� Ranjhi
� Rampur
� Gwarighat
The objective of the survey was to assess the user's willingness to pay for improved public transport
system.

Jabalpur Transport Sector CMP Under JNNURM
Municipal Corporation, Jabalpur R-1
47
CHAPTER -6
TRAFFIC AND TRANSPORTATION SYSTEM CHARACTERISTICS
6.1 Passenger Car Equivalency
Many vehicle types, different in size and performance, can be observed on Indian Roads, Occupying
common road space. In addition to motorized vehicles, presence of non motorized vehicle such as
Animal or hand drawn, cycle etc. is an common sight in order to express the intensity, the
composition of various types of vehicle play a major role and it would be convenient to express
different vehicle types in single unit terms for this purpose. The Indian Road Congress (IRC) has
recommended Passenger Car Unit (PCU) for various vehicle types, considering their characteristics,
both physical and mechanical. These factors are different for rural and urban conditions. In the
present context, PCU factor recommended for urban area is given in table.
Table 6.1 Passenger Car Unit Equivalency Factors
S. No. Vehicle Type PCU
1. Two wheeler 0.50
2. Auto Rickshaw 1.20
3. Car / Jeep / Van 1.00
4. Tempo / Minibus / LCV 1.40
5. Bus / HCV 2.20
6. MAV 4.00
7. Agriculture Tractor 2.00
8. Agriculture Tractor and Trailor 4.00
9. Animal / Hand Drawn 2.00
10. Cycle 0.40
11. Other 1.50
6.2 Trafic Volume Count Surveys
6.2.1 Outer Cordon Survey
Traffic volume count surveys were conducted at seven locations at outer cordon of the study area for
24 hours on a typical working day. On an average about 54679 vehicle and 79284 PCU move in and
out of the Jabalpur urban study area per day. The mode wise summary of daily traffic survey in study
area at the outer cordon is presented below:-
Table 6.2 Average Daily Traffic at Outer Cordon
S. No. Location ID Location Total Vehicle Total PCUs
1. OC1 Damoh To Jabalpur Karmeeta (SH-7) 5501 4886
2. OC2 Patan To Jabalpur (Near By -Pass) 3941 3483
3. OC3 NarsinghPur To Jabalpur (N.H.-12) 8697 11584
4. OC4 Nagpur To Jabalpur (Tilwara Bridge N.H.-7) 8560 19698
5. OC5 Mandla To Jablapur (Gour Bridge) (N.H.-12 A) 7466 8175
6. OC6 Kundla Road To Jablapur (Khamariya) 3593 4852
7. OC7 Katni To Jabalpur (N.H.-7) (Agriculture College) 16921 26606
Total 54679 79284
Traffic Composition
Modal Composition amongst total traffic varies considerabily at different locations, as
observed, is given in table. Amongst total traffic crossing outer cordon, two-wheeler
contribute to max 29.38%, followed by Cycle 28.86% Truck 25.41% in terms of total vehicle.

Jabalpur Transport Sector CMP Under JNNURM
Municipal Corporation, Jabalpur R-1
48
Table 6.3 Percentage of Modal Composition of Traffic at Outer Cordon
S.
No.
Location
ID
Two
Wheel
er in
%
Auto
Ricks
haw in
%
Car
/Jeep/
Van in
%
Temp
o
Bus
in %
Truck
in %
Agr.
Tract
/trailer
in %
Anima
l
/Hand
Drawn
in %
Cycle
in %
Cycle
Rick.
in %
Total
in %
1. OC1 36.52 0.44 5.64 0.44 4.14 6.11 3.04 0.24 42.07 1.42 100
2. OC2 35.63 0.43 4.54 1.83 3.91 5.99 2.92 0.58 43.14 0.94 100
3. OC3 34.66 0.90 10.93 3.61 2.98 25.12 1.82 0.13 19.60 0.23 100
4. OC4 14.66 0.18 8.84 0.14 4.52 65.19 0.42 0.04 5.97 0.06 100
5. OC5 31.70 0.52 8.80 3.60 4.06 15.80 0.62 0.44 34.18 0.25 100
6. OC6 29.50 0.36 6.32 0.42 5.07 25.99 1.11 0.31 30.92 0.00 100
7. OC7 22.96 0.59 6.74 2.76 3.07 35.07 2.02 0.50 26.14 0.22 100
Average Total
Vehicle 29.38 0.49 7.40 1.83 3.96 25.61 1.71 0.32 28.86 0.45
100
The Percentage of Modal distribution of vehicular traffic as observed for all seven
locations can be assessed from the charts given below:-
* Graph 6.1 OC1 Damoh To Jabalpur Karmeeta (SH-7)
Two Wheeler -36.52%
Auto Rickshaw - 0.44%
Car /Jeep/ Van -5.64%
Tempo - 0.44%
Bus - 4.14%
Truck - 6.11%
Agr. Tract /trailer - 3.04%
Animal /Hand Drawn -0.24%
Cycle -42.07%
Cycle Rick. - 1.42%
OC1 Damoh To Jabalpur Karmeeta (SH-7)
* Graph 6.2 OC2 Patan To Jabalpur (Near By -Pass):
OC2 Patan To Jabalpur (Near By -Pass):
Two Wheeler -35.63%
Auto Rickshaw - 0.43%
Car /Jeep/ Van -4.54%
Tempo - 1.83%
Bus - 3.91%
Truck - 5.99%
Agr. Tract /trailer - 2.92%
Animal /Hand Drawn -0.58%
Cycle -43.10%
Cycle Rick. - 0.94%

Jabalpur Transport Sector CMP Under JNNURM
Municipal Corporation, Jabalpur R-1
49
*Graph 6.3 OC3 NarsinghPur To Jabalpur (N.H.-12):
Tw o Wheeler -34.66%
Auto Rickshaw - 0.90%
Car /Jeep/ Van -10.93%
Tempo - 3.61%
Bus - 2.98%
Truck - 25.12%
Agr. Tract /trailer - 1.82%
Animal /Hand Draw n -0.13%
Cycle -19.60%
Cycle Rick. - 0.23%
*Graph 6.4 OC4 Nagpur To Jabalpur (Tilwara Bridge N.H.-7):
Two Wheeler -14.66%
Auto Rickshaw - 0.18%
Car /Jeep/ Van -8.84%
Tempo - 0.14%
Bus - 4.52%
Truck - 65.19%
Agr. Tract /trailer - 0.42%
Animal /Hand Drawn -0.04%
Cycle -5.97%
Cycle Rick. - 0.06%
•Graph 6.5 OC5 Mandla To Jablapur (Gour Bridge) (N.H.-12 A):
Tw o Wheeler -31.7%
Auto Rickshaw - 0.52%
Car /Jeep/ Van -8.80%
Tempo - 3.60%
Bus - 4.06%
Truck - 15.80%
Agr. Tract /trailer - 0.62%
Animal /Hand Draw n -0.44%
Cycle -34.20%
Cycle Rick. - 0.25%

Jabalpur Transport Sector CMP Under JNNURM
Municipal Corporation, Jabalpur R-1
50
*Graph 6.6 OC6 Kundla Road To Jablapur (Khamariya):
Tw o Wheeler -29.5%
Auto Rickshaw - 0.36%
Car /Jeep/ Van -6.32%
Tempo - 0.42%
Bus - 5.07%
Truck - 25.99%
Agr. Tract /trailer - 1.11%
Animal /Hand Draw n -0.31%
Cycle -30.90%
Cycle Rick. - 0.0%
*Graph 6.7 OC7 Katni To Jabalpur (N.H.-7) (Agriculture College):
Two Wheeler -22.96%
Auto Rickshaw - 0.59%
Car /Jeep/ Van -6.74%
Tempo - 2.76%
Bus - 307%
Truck - 35.07%
Agr. Tract /trailer - 2.02%
Animal /Hand Drawn -0.50%
Cycle -26.10%
Cycle Rick. - 0.22%
Temporal Variation of Traffic
Study of day and night variation in traffic at the outer cordon reveal that about 75% traffic moves
between 8.00 am to 8.00 pm. The Comparatively hourly variation of traffic at the survey location is
presented in graph below:-
Temporal Variation of Traffic at Outer Cordon Locations
0500
100015002000250030003500400045005000
06-0
7
08-0
9
10-1
1
12-1
3
14-1
5
16-1
7
18-1
9
20-2
1
22-2
30-
12-
34-
5
Vehicle OC1
Vehicle OC2
Vehicle OC3
Vehicle OC4
Vehicle OC5
Vehicle OC6
Vehicle OC7
Graph 6.8 Temporal Variation of Traffic at Outer Cordon Locations

Jabalpur Transport Sector CMP Under JNNURM
Municipal Corporation, Jabalpur R-1
51
The day and night traffic along with peak hour traffic volume in PCUs is presented in table. It can be
seen that peak hour traffic ranged between 5.48% to 6.94%. In general it is observed that the peak
traffic percentage decreases with increase in ADT.
Table 6.4 Temporal Variation of Traffic at Outer Cordon
Location Traffic in PCUs Peak Hour%
of ADT 8– 20 Hrs.) 20– 8 Hrs.) ADT Peak Hrs. Traffic
OC1 3473 1413 4886 339 6.94
OC2 2356 1127 3483 223 6.41
OC3 7829 3755 11584 690 5.95
OC4 6899 12799 19698 1173 5.95
OC5 5006 3169 8175 516 6.31
OC6 2558 2294 4852 266 5.48
OC7 11337 15269 26606 1848 6.94
6.2.2 Inner Cordon Survey
An imaginary line surrounding the central area of Jabalpur has been identified as the inner cordon to
the study area. 5 locations for volume count survey were identified along the inner cordon. The
location wise directional classified volume counts data is given in table 6.5.
Average Daily Traffic:
Summary of mode wise directional 16 hour’s traffic at the inner cordon line is given traffic table. In
addition Table 6.5 presents the traffic volume at various locations and the location wise share in total
volume.
In all 210235 vehicle (163745 PCUs) were observed at the inner cordon during 6.0 am to 10 pm,
which suggests nearly a four times increasing a traffic at the inner cordon in comparsion to the outer
cordon.
Table 6.5 Average Daily Traffic at Inner Cordon
S. No. Location ID Lacation Total
Vehicle
Total
PCUs
% share in
Total Vehicle
1. IC1 Near Damoh Naka 48699 40076 23.16
2. IC2 Near Ranitaal Chowk 58298 44602 27.73
3. IC3 Gorakhpur Chowk 42623 33795 20.27
4. IC4 Raddi Chowk 44330 32465 21.09
5. IC5 Ambedakar Road, Gohalpur 16285 12807 7.75
Total 210235 163745 100%
Traffic Composition
Within the study area movement of freight vehicle is restricted to a few corridors and the significance of two
wheeler and cycles increases considerably as reflected from the composition of traffic at inner cordon
presented in table 6.6 of the total traffic crossing inner cordon, two wheeler contribute to 37.12%, Auto
Rickshaw 2.10%, Car Jeep van 2.42%, Tempo 0.59%, Bus 1.18%, Truck 1.37%, Agriculture
Tractor / trailer 0.46%, Animal Hand Drawn 1.64%, Cycle 41.04% and Cycle Rickshaw
11.46% in terms of total vehicle.

Jabalpur Transport Sector CMP Under JNNURM
Municipal Corporation, Jabalpur R-1
52
Table 6.6 Composition of Traffic at Inner Cordon
S. No. Locati
on ID Two
Wheel
er in
%
Auto
Ricks
haw in
%
Car
/Jeep/
Van in
%
Temp
o
Bus
in %
Truck
in % Agr.
Tract
/trailer
in %
Anima
l
/Hand
Drawn
in %
Cycle
in %
Cycle
Rick.
in %
Total
in %
1. IC1 35.82 2.66 2.42 0.30 0.79 3.04 0.48 0.85 37.80 15.83 100.0
2. IC2 38.41 2.56 3.05 0.08 0.19 0.13 0.16 1.13 35.79 18.51 100.0
3. IC3 41.77 2.14 1.42 0.08 3.39 0.47 0.07 1.61 37.05 11.99 100.0
4. IC4 44.66 2.33 4.36 2.19 1.56 2.77 0.51 0.77 36.86 3.98 100.0
5. IC5 24.95 0.81 0.87 0.28 0.08 0.52 1.07 3.89 57.68 9.83 100.0
Average
Total Vehicle 37.12 2.10 2.42 0.59 1.18 1.37 0.46 1.64 41.04 11.43
100
*Graph 6.9 IC1 Near Damoh Naka
Tw o Wheeler -35.82%
Auto Rickshaw 2.66%
Car /Jeep/ Van 2.42%
Tempo - 0.30
Bus - 0.79%
Truck 3.04%
Agr. Tract /trailer 0.48%
Animal /Hand Draw n 0.85%
Cycle - 37.880 %
Cycle Rick. 15.83%
* Graph 6.10 IC2 Near Ranitaal Chowk:
Two Wheeler -38.41%
Auto Rickshaw 2.56%
Car /Jeep/ Van 3.05%
Tempo - 0.08
Bus - 0.19%
Truck 0.13%
Agr. Tract /trailer 0.16%
Animal /Hand Drawn 1.13%

Jabalpur Transport Sector CMP Under JNNURM
Municipal Corporation, Jabalpur R-1
53
* Graph 6.11 IC3 Gorakhpur Chowk:
Tw o Wheeler -41.77%
Auto Rickshaw 2.14%
Car /Jeep/ Van-1.42%
Tempo - 0.08
Bus - 3.39%
Truck 0.47%
Agr. Tract /trailer 0.07%
Animal /Hand Draw n 1.61%
Cycle - 37.05%
Cycle Rick. 11.99%
* Graph 6.12 IC4 Raddi Chowk:
Two Wheeler -44.66%
Auto Rickshaw 2.33%
Car /Jeep/ Van-4.36%
Tempo - 2.19
Bus - 1.56%
Truck 2.77%
Agr. Tract /trailer 0.51%
Animal /Hand Drawn 0.77%
Cycle - 36.86%
Cycle Rick. 3.98%
* Graph 6.13 IC5 Ambedakar Road, Gohalpur:
Two Wheeler -24.95%
Auto Rickshaw 0.81%
Car /Jeep/ Van-0.87%
Tempo - 0.28%
Bus - 08%
Truck -0527%
Agr. Tract /trailer -1.07%
Animal /Hand Drawn -3.89%
Cycle - 57.68%
Cycle Rick. 9.83%
Temporal Variation of Traffic:
Behavior of traffic over the day across different locations exhibits that area near residential localities
exhibit pronounced morning and evening peak. Locations along arterial roads experience a distinct
peak, which is generally maintained till late evening (8.00 pm), after which traffic starts receding. At

Jabalpur Transport Sector CMP Under JNNURM
Municipal Corporation, Jabalpur R-1
54
some locations many peaks were observed in Fig.6.7 presents the hourly variation of traffic at the
locations along the inner cordon.
Table 6.7 Peak Hourly Traffic at Inner Cordon
Location Total
Traffic
PCUs
Morning Peak Evening Peak
PCUs % of Total
Hourly Traffic
PCUs % of Total
Hourly Traffic
IC1 40076 3116 7.78 4174 10.42
IC2 44602 3237 7.26 5124 11.49
IC3 33795 2374 7.02 2804 8.30
IC4 32465 2510 7.73 2943 9.07
IC5 12807 1212 9.46 874 6.82
Total 163745 12449 7.60 15919 9.72
Peak hour as percentage of total traffic varies between 7.02 % to 9.46 % in the morning period
between 7.00 to 9.00 am, and 6.82% to 11.49% in the evening between 18.00 pm to 20.0 pm.
Compartive Temporal Variation of traffic
0
2000
4000
6000
8000
10000
12000
06-0
7
08-0
9
10-1
1
12-1
3
14-1
5
16-1
7
18-1
9
20-2
1
22-2
3
00-0
1
02-0
3
04-0
5
Vehicle IC1
Vehicle IC2
Vehicle IC3
Vehicle IC4
Vehicle IC5
Graph 6.14 Compartive Temporal Variation of traffic
6.2.3 Screen Line Survey
The Allahabad – Gondia railway line running north south has been considered as north south screen
line. The east west screen line follows Itarsi Allahabad railway line up to Gun Carriage factory (GCF)
and then runs parallel to SH -22 towards Kundam.
Average Daily Traffic
North South Screen Line
Traffic data at this screen line will be used for validating the east west travel within the study area.
Classified traffic volume count for 16 hours were conducted at the crossing facilities. About 4 locations
comprising NS1, NS2, NS3 and NS4 are located in this screen line. The mode wise directional traffic
is presented in table 6.8.
On an average 49253 vehicles (32179 PCUs) cross the railway line Table 6.8 presents the traffic
volume and the location wise share in total traffic at the north south screen.

Jabalpur Transport Sector CMP Under JNNURM
Municipal Corporation, Jabalpur R-1
55
Table 6.8 Average Daily Traffic at North South Screen Line
S.
No.
Location
ID
Lacation Total
Vehicle
Total
PCUs
1. NS1
Railway Crossing Near Bandariya
Tiraha 21241 14807
2. NS2
Shobhapur Railway crossing Between
Adhartal & Vehicle Factory 10603 7685
3. NS3 Gwarighat Railway Crossing 16446 12379
4. NS4 Satpula Bridge on Kudam Road 35359 26846
Total 83649 61717
East West Screen Line
Traffic data at this screen line will be used for validating the East West traffic movement within the
study area. Classified traffic volume count for 24 hours were conducted at the crossing facilities.
About 7 locations comprising EW1, EW2, EW3, EW4, EW5, EW6 and EW7 are located in this screen
line. The mode wise directional traffic is presented in 6.9 table.
On an average 191166 vehicles (141675 PCUs) cross the railway line. Table 6.9 presents the traffic
volume and the location wise share in total traffic at the East West screen.
Table 6.9 Average Daily Traffic at East West Screen Line
S.
No.
Location
ID
Location Total
Vehicle
Total
PCUs
1. EW1 Along Bypass Near Bahadan Village 4857 9373
2. EW2
Railway Bridge Near Madan Mahal
Chowk 35600 26892
3. EW3
Shastri Bridge over Proposed Corridor
No.-2 55149 43260
4.
EW4
Between Badariya Tiraha to
Chandanvan Road (IVth Railway
Underpass) 42539 31435
5. EW5
Nagraj Chowk on Chandanvan to
Badariya tiraha 30851 25701
6. EW6
First Bridge on Gour Bridge to
Chandanvan Road 49228 33659
7. EW7
Sheela Cinema on Chandanvan to Gour
Bridge Road 50933 42870
Total 269157 213190
Traffic Composition
North – South Screen Line
Within the study area movement of freight vehicle is restricted to a few corridors and the significance
of two wheeler and cycles increases considerably as reflected from the composition of traffic at inner
cordon as given in table 6.10. of the total traffic crossing inner cordon, two wheeler contribute to

Jabalpur Transport Sector CMP Under JNNURM
Municipal Corporation, Jabalpur R-1
56
43.65%, Auto Rickshaw 2.88%, Car Jeep van 4.51%, Tempo 1.50%, Bus 2.17%, Truck
2.54%, Agriculture Tractor / trailer 0.18%, Animal Hand Drawn 0.71%, Cycle 39.75%
and Cycle Rickshaw 2.10% in terms of total vehicle.The above composition shows the
poor state of Public transport system in the city.
Table 6.10 Composition of Traffic at North South Screen Line
S. No. Locati
on ID Two
Wheel
er in
%
Auto
Ricks
haw in
%
Car
/Jeep/
Van in
%
Temp
o
Bus
in %
Truck
in % Agr.
Tract
/trailer
in %
Anima
l
/Hand
Drawn
in %
Cycle
in %
Cycle
Rick.
in %
Total
in %
1. NS1, 48.99 2.89 9.79 0.08 0.24 1.62 0.04 0.62 32.28 3.45 100.0
2. NS2, 41.73 2.14 4.73 3.83 3.02 1.38 0.17 0.85 41.63 0.53 100.0
3. NS3, 44.14 2.45 1.17 1.61 0.51 5.94 0.39 0.82 40.81 2.16 100.0
4. NS4, 39.74 4.04 2.35 0.49 4.93 1.21 0.14 0.55 44.27 2.28 100.0
Average Total
Vehicle 43.65 2.88 4.51 1.50 2.17 2.54 0.18 0.71 39.75 2.10
100
*Graph 6.15 NSI Railways Crossing Near Bandariya Tiraha
Tw o Wheeler-48.99%
Auto Rickshaw -2.89%
Car /Jeep/ Van 9.78%
Tempo - 0.08%
Bus - 0.24 %
Truck -1.62 %
Agr. Tract /trailer-0.04%
Animal /Hand Draw n - 0.62
%Cycle - 32.28 %
Cycle Rick. - 3.45 %
*Graph 6.16 NS2 Shobhapur Railway crossing Between :
Tw o Wheeler-41.73%
Auto Rickshaw -2.14%
Car /Jeep/ Van 4.73%
Tempo - 3.83%
Bus - 3.02 %
Truck -1.38 %
Agr. Tract /trailer-0.17%
Animal /Hand Draw n - 0.85 %
Cycle - 41.63 %
Cycle Rick. - 0.53 %

Jabalpur Transport Sector CMP Under JNNURM
Municipal Corporation, Jabalpur R-1
57
*Graph 6.17 NS3 Gwarighat Railway Crossing:
Tw o Wheeler-44.14%
Auto Rickshaw -2.45%
Car /Jeep/ Van 1.17%
Tempo - 1.61%
Bus - 0.51 %
Truck -5.94 %
Agr. Tract /trailer-0.39%
Animal /Hand Draw n - 0.82 %
Cycle - 40.81 %
Cycle Rick. - 2.16 %
*Graph 6.18 NS4 Satpula Bridge on Kudam Road:
Tw o Wheeler-39.74%
Auto Rickshaw -4.04%
Car /Jeep/ Van 2.35%
Tempo - 0.49%
Bus - 4.93 %
Truck -1.21 %
Agr. Tract /trailer-0.14%
Animal /Hand Draw n - 0.55%
Cycle - 44.27 %
Cycle Rick. - 2.28 %
East west Screen Line:
Compostion of traffic at the east west screen line is presented in table 6.11, of the total traffic crossing
inner cordon, two wheeler contribute to 41.64%, Auto Rickshaw 3.33%, Car Jeep van
8.21%, Tempo 0.32%, Bus 0.95%, Truck 8.27%, Agriculture Tractor / trailer 0.51%,
Animal Hand Drawn 0.68%, Cycle 26.35% and Cycle Rickshaw 9.74 % in terms of total
vehicle. The motorized private modes commanded a share of 49.85% in the total traffic
crossing east-west screen line.
Table 6.11 Composition of Traffic at East West Screen Line
SNo. Locatio
n ID Two
Wheele
r in %
Auto
Ricksh
aw in %
Car
/Jeep/
Van in
%
Tempo Bus
in %
Truck
in %
Agr.
Tract
/trailer
in %
Animal
/Hand
Drawn
in %
Cycle
in %
Cycle
Rick.
in %
Total
in %
1. EW1 21.14 0.41 8.20 0.33 0.66 51.67 2.68 0.00 14.13 0.77 100.0
2. EW2 40.40 2.38 3.41 0.02 0.00 0.00 0.11 1.83 35.92 15.94 100.0
3. EW3 52.63 2.83 9.28 1.32 2.89 2.70 0.18 0.57 23.45 4.14 100.0
4. EW4 47.22 2.40 8.44 0.04 0.14 0.02 0.11 0.38 26.97 14.28 100.0
5. EW5 42.68 5.38 15.86 0.18 1.35 2.42 0.24 0.95 24.94 6.02 100.0
6. EW6 50.34 4.47 5.14 0.06 0.17 0.38 0.08 0.37 29.95 9.03 100.0
7. EW7 37.05 5.41 7.16 0.29 1.43 0.72 0.20 0.64 29.13 17.96 100.0
Average Total Vehicle 41.64 3.33 8.21 0.32 0.95 8.27 0.51 0.68 26.35 9.74 100.0

Jabalpur Transport Sector CMP Under JNNURM
Municipal Corporation, Jabalpur R-1
58
*Graph 6.19 EW1 Along Bypass Near Bahadan Village:
Tw o Wheeler-21.14%
Auto Rickshaw -0.41%
Car /Jeep/ Van 8.20%
Tempo - 0.33%
Bus - 0.66 %
Truck -51.67 %
Agr. Tract /trailer-2.68%
Animal /Hand Draw n - 0.00%
Cycle - 14.13 %
Cycle Rick. - 0.77 %
* Graph 6.20 EW2 Railway Bridge Near Madan Mahal Chowk:
Tw o Wheeler-40.40%
Auto Rickshaw -2.38%
Car /Jeep/ Van 3.41%
Tempo - 0.02%
Bus - 0.00%
Truck -00 %
Agr. Tract /trailer-0.11%
Animal /Hand Draw n - 1.83%
Cycle - 35.92 %
Cycle Rick. - 15.94 %
* Graph 6.21 EW3 Shastri Bridge over Proposed Corridor No.-2:
Two Wheeler-52.63%
Auto Rickshaw -2.83%
Car /Jeep/ Van 9.28%
Tempo - 1.32%
Bus - 2.89%
Truck -2.70%
Agr. Tract /trailer-0.18%
Animal /Hand Drawn - 0.57%
Cycle - 23.45 %
Cycle Rick. - 4.14 %
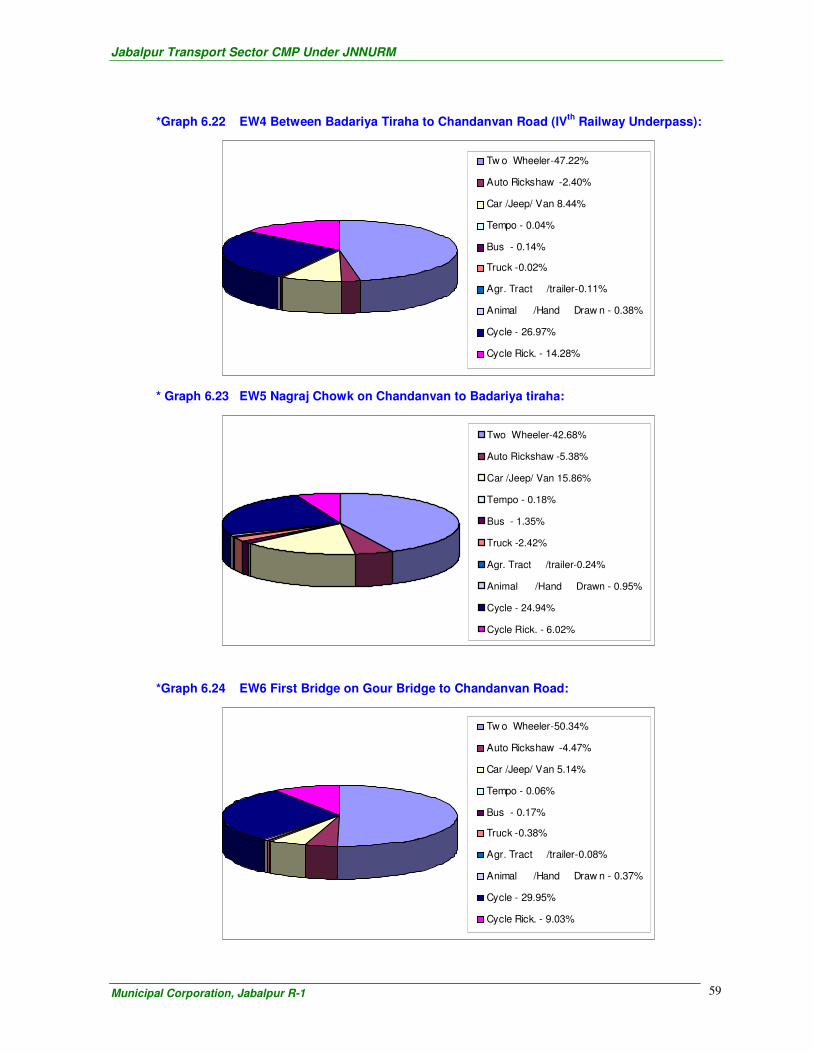
Jabalpur Transport Sector CMP Under JNNURM
Municipal Corporation, Jabalpur R-1
59
*Graph 6.22 EW4 Between Badariya Tiraha to Chandanvan Road (IVth
Railway Underpass):
Tw o Wheeler-47.22%
Auto Rickshaw -2.40%
Car /Jeep/ Van 8.44%
Tempo - 0.04%
Bus - 0.14%
Truck -0.02%
Agr. Tract /trailer-0.11%
Animal /Hand Draw n - 0.38%
Cycle - 26.97%
Cycle Rick. - 14.28%
* Graph 6.23 EW5 Nagraj Chowk on Chandanvan to Badariya tiraha:
Two Wheeler-42.68%
Auto Rickshaw -5.38%
Car /Jeep/ Van 15.86%
Tempo - 0.18%
Bus - 1.35%
Truck -2.42%
Agr. Tract /trailer-0.24%
Animal /Hand Drawn - 0.95%
Cycle - 24.94%
Cycle Rick. - 6.02%
*Graph 6.24 EW6 First Bridge on Gour Bridge to Chandanvan Road:
Tw o Wheeler-50.34%
Auto Rickshaw -4.47%
Car /Jeep/ Van 5.14%
Tempo - 0.06%
Bus - 0.17%
Truck -0.38%
Agr. Tract /trailer-0.08%
Animal /Hand Draw n - 0.37%
Cycle - 29.95%
Cycle Rick. - 9.03%

Jabalpur Transport Sector CMP Under JNNURM
Municipal Corporation, Jabalpur R-1
60
* Graph 6.25 EW7 Sheela Cinema on Chandanvan to Gour Bridge Road:
Two Wheeler-37.05%
Auto Rickshaw -5.41%
Car /Jeep/ Van 7.16%
Tempo - 0.29%
Bus - 1.43%
Truck -0.72%
Agr. Tract /trailer-0.20%
Animal /Hand Drawn - 0.64%
Cycle - 29.13%
Cycle Rick. - 17.96%
Temporal Variation of Traffic
North South Screen Line
Peak hour traffic presented in table at the north – south screen line locations.
Table 6.12 Peak Hour Traffic at North South Screen Line
Location Total
Traffic
PCUs
Morning Peak Evening Peak
PCUs % of Total
Hourly Traffic
PCUs % of Total
Hourly Traffic
NS1 14807 1547 10.45 1479 9.99
NS2 7685 447 5.82 563 7.32
NS3 12379 915 7.39 1011 8.17
NS4 26846 4736 17.64 1702 6.34
Total 61717 7645 41.24 4755 8.02
Peak hour as presented of total traffic varies between 7.39 % to 17.64 % in the morning period
between 7.00 to 9.00 am. and 7.32 % to 9.99 % in the evening between 18.00 pm to 20.0 pm.
0
1000
2000
3000
4000
5000
06-0
7
08-0
9
10-1
1
12-1
3
14-1
5
16-1
7
18-1
9
20-2
1
22-2
3
00-0
1
02-0
3
04-0
5
Vehicle NSI
Vehicle NS2
Vehicle NS3
Vehicle NS4
Graph 6.26 Peak Hour Traffic at North South Screen Line

Jabalpur Transport Sector CMP Under JNNURM
Municipal Corporation, Jabalpur R-1
61
East West Screen Line
Peak hour traffic presented in table at the East – West screen line locations.
Table 6.13 Peak Hour Traffic at East West Screen Line
Location Total
Traffic
PCUs
Morning Peak Evening Peak
PCUs % of Total
Hourly Traffic
PCUs % of Total
Hourly Traffic
EW1 9373 521 5.56 543 5.79
EW2 26892 2678 9.96 2213 8.23
EW3 43260 3617 8.36 3733 8.63
EW4 31435 2914 9.27 2235 7.11
EW5 25701 3225 12.55 1707 6.64
EW6 33659 2609 7.75 2770 8.23
EW7 42870 3777 8.81 3310 7.72
Total 213190 19341 9.04 16511 7.78
Peak hour as presented of total traffic varies between 5.56 % to 9.96 % in the morning period
between 7.00 to 9.00 am. and 5.79 % to 8.63 % in the evening between 18.00 pm to 20.0 pm. This
comparative temporal varation of traffic at various locations can be seen from graph below.
Comparative Temporal varation of traffic
0
5000
10000
15000
20000
25000
30000
07-0
8
10-1
1
13-1
4
16-1
7
19-2
0
22-2
3
01-0
2
04-0
5
Vehicle NSI
Vehicle NS2
Vehicle NS3
Vehicle NS4
Vehicle NS5
Vehicle NS6
Vehicle NS7
Graph 6.27 Comparative Temporal varation of traffic
6.3 Variation of Day Night Traffic
In order to study the traffic intensity during the night hour (10.00 Pm. To 6.0 am), 24 hours classified
volume count survey was conducted at one location given below.
* EW1 Along Bypass near Bahdan Village
The selected control point is located along the main traffic corridors, one connecting the CBD and the
other out side of the CBD. Table below presents the ratio of 24 hours and 16 hours at these locations.

Jabalpur Transport Sector CMP Under JNNURM
Municipal Corporation, Jabalpur R-1
62
Table 6.14 Ratio of 24 Hour Traffic to 16 Hours
Location : EW1 Along Bypass Near Bahdan Village
Motorized Vehicles Non Motorized Total Vehicles
Two
Wheele
r
Auto
Ricksh
aw
Car
/Jeep/
Van
Tem
po
Bus Truck Agr.
Tract
/trail
er
Animal
/Hand
Drawn
Cycl
e
Cycle
Ricksh
aw
Moto
rized
Non
Moto
rized
Total Mini
Standar
d LCV 2/3
Axle
Multi
Axle
1.09 1.25 1.17 1.0 1.0 1.43 1.21 1.36 1.29 1.17 0.0 1.06 1.04 1.25 1.06 1.22
6.4 Traffic Movement Pattern
In order to under stand the travel pattern in study area, Origin – Destination Surveys for 24 Hours
were conducted at all the outer cordon locations. This section describes the travel desire
characteristics, purpose of travel, loading pattern of freight vehicles etc.
6.4.1 Sample size
The origin destination survey was conducted by adopting roadside interview method by stopping
vehicle randomly of sample basis. The sample size has to be large enough about 20% to explain the
characteristics of traffic to an acceptable level of accuracy. The percentage of sample size collected at
individual location at outer cordon given in table are as under:
Table 6.15 Sample Size of OD Surveys at Outer Cordon
Type of Vehicle OC1 OC2 OC3 OC4 OC5 OC6 OC7
Two Wheeler 402 281 603 251 473 212 777
Auto Rickshaw 5 3 16 3 8 3 20
Car /Jeep/ Van 62 36 70 151 131 45 228
Tempo 5 14 63 2 14 3 93
Bus 46 31 52 77 61 36 102
Cycle 463 340 341 102 510 222 885
LCV 17 12 51 74 21 25 101
2/3 Axle 50 35 378 1032 212 161 1071
Multi Axle 1 1 9 10 3 0 13
Agr. Tract /trailer 33 23 32 7 9 8 68
Total 1082 775 1613 1711 1443 716 3358
6.4.2 Travel Pattern of Passenger Vehicle Trips :
Travel Pattern varied largely amongst different locations. The location wise travel pattern of
motorized passenger traffic at the outer cordon has been given in table. It can be seen that some
internal to internal traffic was also captured during the outer cordon surveys possibly on account of
location of survey count points and network or zonal boundary constraints. The mode wise movement
pattern of passenger vehicles. While internal – external traffic accounts for 44.12 %share, External –
Internal account for 43.37% share, while through traffic is 9.78%.

Jabalpur Transport Sector CMP Under JNNURM
Municipal Corporation, Jabalpur R-1
63
Table 6.17 Travel Pattern of Passenger Vehicle at Outer Cordon:
Location
ID
Location External
to
Internal
External to
External
Internal
to
External
Internal
to
Internal
Total
OC1 Damoh To Jabalpur
Karmeeta (SH-7)
3690
(27.4%)
(47.27%)
1350
(64.5%)
(17.29%)
2220
(22.3%)
(28.44%)
96
(9.8%)
(1.23%)
7807
(28.5%)
(100%)
OC2 Patan To Jabalpur
(Near By -Pass)
963
(7.2%)
(50.16%)
49
(2.30%)
(2.55%)
641
(6.40%)
(33.40%)
246
(25.0%)
(1.10%)
1920
(7.00%)
(100%)
OC3 NarsinghPur To
Jabalpur (N.H.-12)
2845
(21.1%)
(50.16%)
301
(14.40%)
(6.54%)
1364
(13.70%)
(29.65%)
12
(1.2%)
(0.59%)
4601
(16.8%)
(100%)
OC4 Nagpur To Jabalpur
(Tilwara Bridge
N.H.-7)
847
(6.3%)
(39.68%)
121
(5.80%)
(5.67%)
1029
(10.3%)
(48.18%)
13
(1.30%)
(0.59%)
2135
(7.80%)
(100%)
OC5 Mandla To Jablapur
(Gour Bridge) (N.H.-
12 A)
2538
(18.8%)
(54.18%)
166
(7.90%)
(3.54%)
1650
(16.50%)
(35.22%)
251
(25.50%)
(5.35%)
4684
(17.10%)
(100%)
Location
ID
Location External
to
Internal
External to
External
Internal
to
External
Internal
to
Internal
Total
OC6 Kundla Road To
Jablapur
(Khamariya)
1861
(13.8%)
(71.35%)
38
(1.80%)
(1.46%)
629
(6.3%)
(24.12%)
18
(1.80%)
(0.70%)
2608
(9.5%)
(100%)
OC7 Katni To Jabalpur
(N.H.-7) (Agriculture
College)
721
(5.4%)
(19.83%)
68
(3.20%)
(1.86%)
2437
(24.40%)
(67.02%)
349
(35.40%)
(9.58%)
3637
(13.30%)
(100%)
All Location
13465
(49.16%)
(100.0%)
2092
(7.64%)
(100.0%)
9971
(36.40%)
(100.0%)
983
(3.59%)
(100.%)
27392
(100.0%)
(100%)
6.4.3 Average Trip Length, Travel Time and Travel Cost by Mode
Analysis of the data for average trip length (ATL) for the study area shows that walk trips have an ATL
of 1.38 km, scooter trips 5.26 km and car 8.34 km. The details of ATL as well as Average trip time
(ATT) and Average Trip Cost (ATC) are presented in Table. It can be observed that for Mini bus trip,
the ATT is as high as 51.82 minutes in spite of the ATL being 8.81 Km.

Jabalpur Transport Sector CMP Under JNNURM
Municipal Corporation, Jabalpur R-1
64
Table 6.18 Mode wise ATL, A TT and A TC for Study area
Mode ATL (Km) ATT (Min) ATC (Rs) ATS (Km/hr)
Walk 1.38 23.64 0.00 3.50
Scooter/Motor Cycle 5.26 29.53 3.55 10.69
Auto Rickshaw/Taxi 4.78 34.65 9.68 8.28
Tempo 4.53 38.72 4.91 7.02
Cycle 4.03 33.48 0.00 7.22
Car/Jeep 8.34 30.44 11.11 16.44
Govt. Car/Van 3.17 17.50 8.67 10.87
Cycle Rickshaw 3.61 37.61 7.15 5.76
Shared Vehicle 4.35 29.00 5.90 9.00
Mini Bus 8.81 51.82 5.78 10.20
Chartered/Contract
Bus 9.88 52.19 2.88
11.36
State Transport Bus 8.18 43.45 6.09 11.30
Institutional/Company
Bus 12.23 65.97 3.74
11.12
Rail 96.69 147.69 22.85 39.28
All Modes 3.62 30.16 1.99 7.20
The average walking time has been observed as 23.64 minutes while the average time for two
wheeler trips is about 29.53 minutes. The ATL and ATT for Mini bus, the predominant public transport
in the study area is 8.81 Km & 51.82 minutes respectively, while it is 4.53 Km and 38.72 minutes for
tempo.
6.4.4 Trip Purpose:
Trip distribution by purpose of travel shows that work and education trips account for 16.1 percent and
16.7 percent of the total trips made in the study area respectively. Shopping trips account for 5.73
percent share. Area wise details of purpose of trip are given in Table.
Table 6.19 Purpose-wise Distribution of Trip
Area Work Business Education Shopping Social Recreation Health
/Hospital
Return
Home
Other
Purpose
Total
Corporation 15.52 3.68 16.20 6.17 3.95 1.80 1.12 48.4 3.17 100
Cantonment 17.31 3.96 18.00 4.55 2.67 1.48 0.0 49.6 2.47 100
VFJ/OFK/GCF 20.47 2.55 18.80 4.29 3.11 0.06 1.12 49.0 0.56 100
Villages 19.36 4.77 21.90 1.31 1.24 0.62 0.48 49.10 1.24 100
Study Area 16.10 3.68 16.70 5.73 3.70 1.62 1.04 48.5 2.87 100
6.4.5 Trip Length Distribution
The average trip lengths observed are 4.91 km and 3.62 km including and excluding walk trips
respectively. Trip length frequency distribution (TLFD) shows that majority of the vehicular trips have
trip lengths between 3 and 5 km (37.9 percent), followed by 5 to 7 km (18.4 percent). The detail of the
distribution of trips by trip length range is presented in Table.

Jabalpur Transport Sector CMP Under JNNURM
Municipal Corporation, Jabalpur R-1
65
Table 6.20 Percentage Distribution of Trips by Trip Length Range
Trip Length
(Km) Excluding Walk Including Walk
0-1 3.37 24.37
1-2 8.26 14
2-3 5.18 5.03
3-5 37.89 26.33
5-7 18.45 12.54
7-10 15.09 10.07
10-15 6.29 4.09
>15 5.48 3.56
Total 100 100
There is marked varation in the distribution patterns of trip lengths in Villages and the rest of the
study area. It is evident from Table below that the average vehicular trip length increases from
4.44 km in Cantonment to 6.25 km in extension area exhibiting a 30 percent increase.
Table 6.21 Distribution of trips by length in Different locations
Area Trips Trip Length Range in (Km) Average
Trip Length
(Km)
Up
to 1
>1&
<=2
>2&
<=3
>3&
<=5
>5&
<=7
>7&
<=10
>10&
<=15 >15 Total
Excl.
walk
Trips
Incl.
walk
Corporation 28.99 21.35 13.57 18.63 8.42 5.83 2.13 1.08 100 3.55 4.84
Cantonment 32.54 22.06 18.3 13.55 5.64 4.15 2.87 0.89 100 3.06 4.44
VFJ/OFK/GCF 19.17 21.03 17.3 17.17 9.83 6.16 3.86 5.48 100 4.46 5.03
Villages 35.27 15.15 13.69 13.49 6.09 7.05 5.95 3.32 100 4.01 6.25
Study Area 28.87 21.02 13.99 18.06 8.27 5.85 2.48 1.46 100 3.62 4.91
All the areas except VFJ/OFK/GCF have a majority of trips in the range of 1 to 2 Km while the
VFJ/OFK/GCF has major share (21.03 percent) of trips lie in the range of 1.00 to 2.00 Km. Average
vehicle trip lengths are the highest in the VFJ/OFK/GCF, while it is the lowest in the Cantonment.
6.5 Parking Characteristics:
Parking surveys and their analysis provide information on parking demand, extent of the usage of
parking facility and the availability of parking space.
Data was collected from major parking areas within the central area where significant vehicular
parking is observed. Vehicular parking within Jabalpur city is generally on street and very limited off-

Jabalpur Transport Sector CMP Under JNNURM
Municipal Corporation, Jabalpur R-1
66
street parking lots exist within the city. Thus eleven on-street and off-street parking locations (Jabalpur
Railway Station) were surveyed to obtain parking details.
For estimating parking demand and planning parking facilities, it would be necessary to express the
space occupied by individual vehicles in single unit terms. The Consultants have adopted the
following values as listed in Table against each mode as Equivalent Car Spaces (ECS).
Table 6.22 Equivalent Car Space
Vehicle Type ECS
Two Wheeler 0.25
Auto Rickshaw 0.50
Car/Jeep/Van 1.00
Bicycle 0.80
Hand Drawn 0.50
LCV 1.50
HCV 2.00
Cycle Rickshaw 0.30
6.5.1 On-street Parking Characteristics
Maximum Parking Accumulation
The summary of maximum parking accumulation at individual locations and the corresponding peak
hour ECS requirements are given in table 6.23.
Table 6.23 Maximum Parking Accumulation
Location
Stretch
Peak hour
Maximum
Accumulation
Vehicles ECS
Andherdev Marg Tularam Chowk & Bhargav Chowk 12.00-12.30 254 51.4
Jabalpur Bus Stand Inside the Bus Stand 13.30-14.00 45 90.0
Civic Center Hotel Tarang & Rajdhani Restaurant 20.00-20.30 139 37.1
TCPO to Prakash Collection Shop 12.00-12.30 142 43.0
Favvara Chowk Lordganj Police Station and Favvara
Chowk
17.00-17.30 224 49.9
Favvara Chowk & Kamania Gate 20.00-20.30 164 35.5
Bhargab Chowk to Favvara Chowk 12.30-13.00 166 48.4
Favvara Chowk & Mandi Chowk 14.30-15.00 157 42.8
In Front of Jabalpur
Bus Stand
Section in front of Jabalpur Bus Stand 19.00-19.30 255 76.9
Jayprakash
Narayan Marg
Malviya Chowk to Super Market 20.30-21.00 361 94.5
Super market to Lordganj Police
Station
20.30-21.01 320 57.9
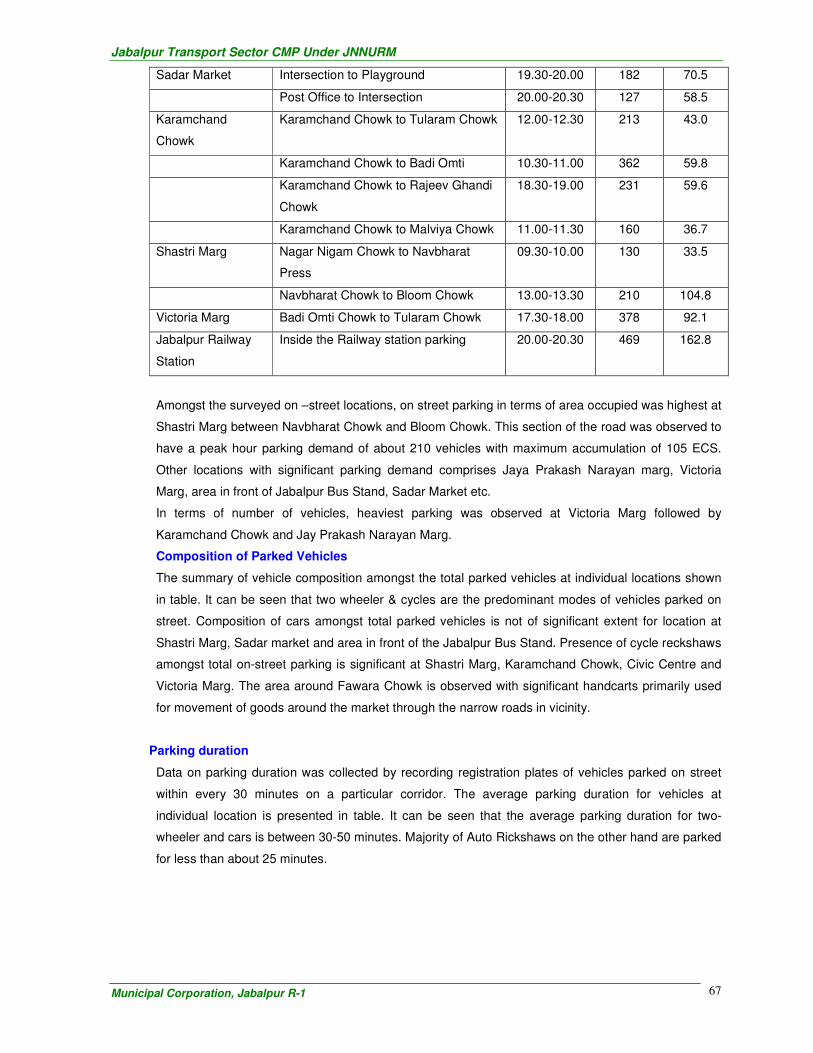
Jabalpur Transport Sector CMP Under JNNURM
Municipal Corporation, Jabalpur R-1
67
Sadar Market Intersection to Playground 19.30-20.00 182 70.5
Post Office to Intersection 20.00-20.30 127 58.5
Karamchand
Chowk
Karamchand Chowk to Tularam Chowk 12.00-12.30 213 43.0
Karamchand Chowk to Badi Omti 10.30-11.00 362 59.8
Karamchand Chowk to Rajeev Ghandi
Chowk
18.30-19.00 231 59.6
Karamchand Chowk to Malviya Chowk 11.00-11.30 160 36.7
Shastri Marg Nagar Nigam Chowk to Navbharat
Press
09.30-10.00 130 33.5
Navbharat Chowk to Bloom Chowk 13.00-13.30 210 104.8
Victoria Marg Badi Omti Chowk to Tularam Chowk 17.30-18.00 378 92.1
Jabalpur Railway
Station
Inside the Railway station parking 20.00-20.30 469 162.8
Amongst the surveyed on –street locations, on street parking in terms of area occupied was highest at
Shastri Marg between Navbharat Chowk and Bloom Chowk. This section of the road was observed to
have a peak hour parking demand of about 210 vehicles with maximum accumulation of 105 ECS.
Other locations with significant parking demand comprises Jaya Prakash Narayan marg, Victoria
Marg, area in front of Jabalpur Bus Stand, Sadar Market etc.
In terms of number of vehicles, heaviest parking was observed at Victoria Marg followed by
Karamchand Chowk and Jay Prakash Narayan Marg.
Composition of Parked Vehicles
The summary of vehicle composition amongst the total parked vehicles at individual locations shown
in table. It can be seen that two wheeler & cycles are the predominant modes of vehicles parked on
street. Composition of cars amongst total parked vehicles is not of significant extent for location at
Shastri Marg, Sadar market and area in front of the Jabalpur Bus Stand. Presence of cycle reckshaws
amongst total on-street parking is significant at Shastri Marg, Karamchand Chowk, Civic Centre and
Victoria Marg. The area around Fawara Chowk is observed with significant handcarts primarily used
for movement of goods around the market through the narrow roads in vicinity.
Parking duration
Data on parking duration was collected by recording registration plates of vehicles parked on street
within every 30 minutes on a particular corridor. The average parking duration for vehicles at
individual location is presented in table. It can be seen that the average parking duration for two-
wheeler and cars is between 30-50 minutes. Majority of Auto Rickshaws on the other hand are parked
for less than about 25 minutes.

Jabalpur Transport Sector CMP Under JNNURM
Municipal Corporation, Jabalpur R-1
68
Table 6.24 Parking Duration of Vehicles
Location
Stretch
Parking Duration
2W Car Auto Tempo LCV HCV Buses
Andherdev marg Tularam Chowk & Bhargav
Chowk
46.6 30.0 15.0 0.0 7.5 0.0 0.0
Jabalpur Bus Stand Inside the Bus Stand 0.0 0.0 0.0 0.0 0.0 0.0 73.7
Civic Center
Hotel Tarang & Rajdhani
Restaurant
53.0 50.5 15.0 0.0 0.0 7.5 0.0
TCPO to Prakash Collection
Shop
40.9 38.9 22.4 0.0 7.5 0.0 0.0
Favvara Chowk
Lordganj Police Station and
Favvara Chowk
38.6 34.0 32.7 0.0 0.0 0.0 0.0
Favvara Chowk & Kamania
Gate
38.4 32.8 45.0 0.0 0.0 0.0 0.0
Bhargab Chowk to Favvara
Chowk
34.4 44.7 20.0 7.5 37.5 0.0 0.0
Favvara Chowk & Mandi
Chowk
28.0 35.0 18.5 7.5 0.0 0.0 0.0
In Front of
Jabalpur Bus
Stand
Section in front of Jabalpur
Bus Stand
47.9 50.2 36.2 21.4 20.6 7.5 0.0
Jayprakash
Narayan Marg
Malviya Chowk to Super
Market
34.9 43.4 20.5 15.0 37.5 0.0 0.0
Super market to Lordganj
Police Station
45.5 51.7 18.8 0.0 0.0 0.0 0.0
Sadar Market Intersection to Playground 42.4 35.8 44.4 0.0 15.0 0.0 0.0
Post Office to Intersection 57.5 42.8 22.5 0.0 21.0 15.0 0.0
Karamchand
Chowk
Karamchand Chowk to
Tularam Chowk
32.2 41.1 23.0 0.0 7.5 0.0 0.0
Karamchand Chowk to Badi
Omti
35.7 46.2 26.9 7.5 15.0 7.5 0.0
Karamchand Chowk to
Rajeev Ghandi Chowk
36.7 36.0 37.7 0.0 7.5 0.0 0.0
Karamchand Chowk to
Malviya Chowk
36.8 24.5 15.0 0.0 7.5 0.0 0.0
Shastri Marg Nagar Nigam Chowk to
Navbharat Press
20.0 25.0 18.8 15.0 7.5 0.0 0.0
Shastri Marg Navbharat Chowk to Bloom
Chowk
39.0 69.1 45.8 33.0 75.0 118.6 0.0
Victoria Marg Badi Omti Chowk to Tularam
Chowk
36.5 48.4 26.8 0.0 0.0 0.0 0.0

Jabalpur Transport Sector CMP Under JNNURM
Municipal Corporation, Jabalpur R-1
69
6.6 Road Network Characteristics
The appriciation of road network characteristics is important to assess the existing capacity level of
the roads, identify the problems if any and assess the scope of improvement or up gradation of the
network to cater to the existing and future traffic demand. For the present study a detailed inventory of
323 km has been carried out, out of which 63.9%, 6.16% and 21.83% of roads passes through
Corporation, Cantonment and villages respectively. About 8.1% of roads passes through OFK, GCF &
VFJ are combined together.
6.6.1 Total Road Length
The city contains a dense network of road. A detailed inventory survey of about 323 Km of road has
been carried out for the entire study area. Distribution of total length of road phasing through different
spatial units of the study area.
Table 6.25 Length of Total Road phasing through study area
Name of Area Total Length of Roads in Km.
Corporation 206.50
Cantonment Board 19.90
Village 70.50
OFK, GCF, VFJ 26.10
Total 323.00
6.6.2 Road Network Characteristics
Majority of the road in the study area are undivided and of bituminous pavement type. The pavement
condition of the roads passing through the cantonment area is good and are will maintained as
compared to the road phasing through rest of the area. The detailed characteristics are described as
under:
Type of Road
Distribution of road length by type of road shows that about 35.7% of road in the corporation area are
arterial road while in the cantonment and OFK, GCF and VFJ area 10.70% and 36.7% respectively.
Nearly 64% of the roads are arterial type road in the village area.
Table 6.26 Distribution of Road length by type of road
Type of
Classification
Road Length
Corporation Cantonment Village OFK, GCF, VFJ
Arterial 35.7 10.7 64.00 36.72
Sub Arterial 27.6 32.3 31.8 21.30
Collector 29.4 44.9 2.80 41.98
Local 7.3 12.00 1.30 0.00
Total 100.0 100.0 100.00 1000.00
Right of way (ROW):
The study shows that nearly 82% of roads in study area have ROW below 30m. It can be observed
from Table that about 90.8% of roads in the Corporation have ROW below 30m and in the
Cantonment area 93.6% of the roads have ROW below 30m, whereas in villages 49% has ROW below
30m. In the ordinance factory, vehicle factory and GCF area, 86.6% have ROW below 30m.

Jabalpur Transport Sector CMP Under JNNURM
Municipal Corporation, Jabalpur R-1
70
Table 6.27 Percentage Distribution of Road Length by ROW
ROW (m)
Road Length
Corporation Cantonment Villages OFK,GCF,VFJ
Up to 10 13.34 16.90 10.47 25.29
10 to 15 22.33 28.25 26.89 40.12
15 to 20 21.09 25.03 4.04 13.50
20 to 30 34.12 23.50 7.61 7.73
30 to 40 4.91 6.34 15.90 13.35
40 to 60 4.21 0.00 35.08 0.00
above 60 0.00 0.00 0.00 0.00
Total 100.0 100.00 100.00 100.00
There is no provision of service lane in almost the entire road network in the study area. This causes
the local traffic to use the main network for its movement, which affects the level of service on the
network.
Occurrence of On-street Parking
On-street parking reduces the carriage way width for the traffic movement thereby resulting in the loss
of traffic carrying capacity of the road network. It has been observed that nearly 70% of road network
in the entire study area has on street parking with the majority falling in the corporation area. Nearly
83.2%, 46.8% and 55.8% of the roads in the Corporation, Cantonment and village area respectively
shows the phenomena of on street parking. About 38% of roads network has on-street parking in the
OFK, GCF& VFJ area. Table 6.28 shows the road length distribution by occurrence of On-Street
Parking.
Table6.28 Percentage Distribution of Road Length by Occurrence of On-Street Parking
On-Street parking
Road Length
Corporation Cantonment Villages OFK,GCF,VFJ
On both sides 81.8 44.2 55.0 32.64
One side 1.4 2.6 0.8 4.54
Not observed 16.8 53.1 44.2 62.83
Total 100.0 100.0 100.0 100.0
In the Corporation area major parking is observed in the Central area, which includes roads such as:
* Victoria Marg
* Jaiprakash Narayan Marg
* Four arms of Tularam Chowk
* Fawara Chowk
The area around Fuvvara Chowk shows large amount of on street parking and in absence of
adequate R0W coupled with encroachments by shops and street side vendors, seriously affects
movement of traffic.
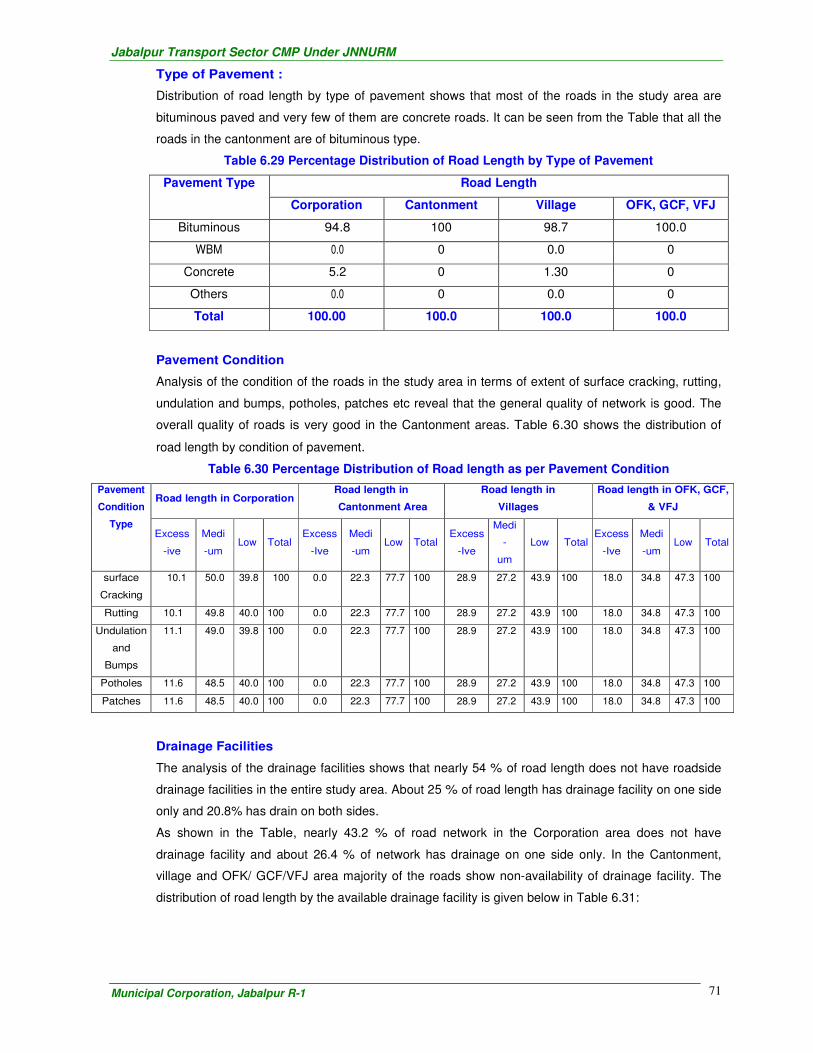
Jabalpur Transport Sector CMP Under JNNURM
Municipal Corporation, Jabalpur R-1
71
Type of Pavement :
Distribution of road length by type of pavement shows that most of the roads in the study area are
bituminous paved and very few of them are concrete roads. It can be seen from the Table that all the
roads in the cantonment are of bituminous type.
Table 6.29 Percentage Distribution of Road Length by Type of Pavement
Pavement Type Road Length
Corporation Cantonment Village OFK, GCF, VFJ
Bituminous 94.8 100 98.7 100.0
WBM 0.0 0 0.0 0
Concrete 5.2 0 1.30 0
Others 0.0 0 0.0 0
Total 100.00 100.0 100.0 100.0
Pavement Condition
Analysis of the condition of the roads in the study area in terms of extent of surface cracking, rutting,
undulation and bumps, potholes, patches etc reveal that the general quality of network is good. The
overall quality of roads is very good in the Cantonment areas. Table 6.30 shows the distribution of
road length by condition of pavement.
Table 6.30 Percentage Distribution of Road length as per Pavement Condition
Pavement
Condition
Type
Road length in Corporation Road length in
Cantonment Area
Road length in
Villages
Road length in OFK, GCF,
& VFJ
Excess
-ive
Medi
-um Low Total
Excess
-Ive
Medi
-um Low Total
Excess
-Ive
Medi
-
um
Low Total Excess
-Ive
Medi
-um Low Total
surface
Cracking
10.1 50.0 39.8 100 0.0 22.3 77.7 100 28.9 27.2 43.9 100 18.0 34.8 47.3 100
Rutting 10.1 49.8 40.0 100 0.0 22.3 77.7 100 28.9 27.2 43.9 100 18.0 34.8 47.3 100 Undulation
and
Bumps
11.1 49.0 39.8 100 0.0 22.3 77.7 100 28.9 27.2 43.9 100 18.0 34.8 47.3 100
Potholes 11.6 48.5 40.0 100 0.0 22.3 77.7 100 28.9 27.2 43.9 100 18.0 34.8 47.3 100 Patches 11.6 48.5 40.0 100 0.0 22.3 77.7 100 28.9 27.2 43.9 100 18.0 34.8 47.3 100
Drainage Facilities
The analysis of the drainage facilities shows that nearly 54 % of road length does not have roadside
drainage facilities in the entire study area. About 25 % of road length has drainage facility on one side
only and 20.8% has drain on both sides.
As shown in the Table, nearly 43.2 % of road network in the Corporation area does not have
drainage facility and about 26.4 % of network has drainage on one side only. In the Cantonment,
village and OFK/ GCF/VFJ area majority of the roads show non-availability of drainage facility. The
distribution of road length by the available drainage facility is given below in Table 6.31:

Jabalpur Transport Sector CMP Under JNNURM
Municipal Corporation, Jabalpur R-1
72
Table 6.31 Percentage Distribution of Road Length as per available of Drainage Facilities :
Pavement Type Road Length
Corporation Cantonment Village OFK, GCF, VFJ
Available (Both Side) 30.4 37.1 7.66 2.7
Available (One Side) 26.4 7.8 3.68 23.0
Not Available 43.2 55.1 88.66 74.3
Total 100.00 100.0 100.0 100.0
Foot path Facilities:
Analysis reveals that most of the roads lack footpath facilities thereby forcing the pedestrians to use
the carriageway, which reduces the width for vehicular movement and increases the risk for
pedestrian movement. About 98.2% of road network lacks in footpath facilities in the entire study area.
About 1.1% has footpath on one side and 0.8 % has footpath on both sides.
Footpath facilities are available more in the Cantonment area than the rest of the areas. Nearly 12%
of roads in the Cantonment area has footpath on one side. The distribution of road length by the
availability of footpath is given in the Table 6.32.
Table 6.32 Percentage Distribution of Road Length as per available of Foot path Facilities
All Pavement Type Road Length(%)
Corporation Cantonment Village OFK, GCF, VFJ
Available (Both Side) 1.01 0.69 0.00 0.0
Available (One Side) 0.39 12.04 0.00 0.00
Not Available 98.60 87.28 100.0 100.0
Total 100.00 100.0 100.0 100.0
Street Light Facilities
Street light facility on one side of the road is available in about 74.8% of the total network identified in
the study area. The distribution of road length by street light facility is shown in Table. Nearly 24% of
network does not have street light facilities thus endangering the road users at night
Table 6.33 Percentage Distribution of Road Length as per available of Street Light Facilities :
All Pavement Type Road Length(%)
Corporation Cantonment Village OFK, GCF, VFJ
Available (Both Side) 0.00 2.85 0.00 0.0
Available (One Side) 85.41 95.04 18.14 100.0
Available Center 2.57 1.06 0.00 0.0
Not Available 12.02 1.06 81.86 0.0
Total 100.00 100.0 100.0 100.0
6.7 Speed and Delay Analysis
Journey speed is one of the most, defining characteristics of traffic and its measurement is essential
in transport planning to evaluate the road network system, to provide vital inputs to travel demand
modeling and assist in economic analysis of improvement plans.
As a part of the present study, 323 Km of road network in the city was identified and the speed and

Jabalpur Transport Sector CMP Under JNNURM
Municipal Corporation, Jabalpur R-1
73
delay survey was carried out both in peak and off peak hours by "Moving Car Observer Method". The
network consisted of 356 nodes and 418 links. The data collected was analyzed to assess the speed
characteristics along the identified road network and identify locations and size of delay.
Spatial speed profile
Spatial analysis of speeds on the road network indicates that there is a marked difference in
average speeds between the VFJ and GCF areas and the rest of the study area. Distribution of road
length by journey speeds is presented in Table 6.34.
Table 6.34 Distribution of road length by journey speeds
Journey Speed
(Km./hr)
Road Length
Corporation Cantonment Villages OFK/VFJ/GCF
Up to 10 16.72 3.34 7.68 0.00
>10 and <=20 52.05 74.45 55.37 6.36
>20 and <=30 23.94 11.29 24.72 57.22
>30 and <=40 3.48 3.23 8.37 29.67
>40 3.82 7.70 3.86 6.75
Total 100 100 100 100
The average speed in the study area has been found to be 18.83 kmph. Majority of city road network
has an average traffic speeds between 20 to 30 kmph. Nearly 68 % of the roads in corporation area
have speeds less than 20 kmph. It has been observed that the speed of the traffic in the OFK, GCF
and VFJ is much more than the rest of the study area suggesting the better conditions of the roads in
those parts of the study area.
Speed profile by Carriage width and type
Low speeds on city corridor are basically due to the congestion and inadequate carriageway widths.
Distribution of road length by carriageway width and average speed is presented in Table 6.35.
Table 6.35 Distribution by Carriageway and average Speed
Carriageway
Width
Speed (Kmph)
Upto 10 >10& <=20 >20 & <=30 >30 & <=40 >40 Total
Single Lane 5.96 71.00 15.99 3.96 3.08 100.00
Intermediate Lane 23.04 35.73 36.17 1.61 3.45 100.00
2 Lane 19.14 47.35 20.68 8.20 4.62 100.00
3 Lane 9.73 45.71 39.57 2.33 2.66 100.00
4 Lane 5.77 62.98 28.93 2.33 0.00 100.00
More Than 4 Lane 3.32 68.40 11.77 5.85 10.66 100.00
It can be observed from the above table that low speed prevails on less configuration roads having
inadequate carriageway width. In general high average speeds have been observed on divided road
than on undivided roads. Distribution of road lengths by type of carriageway and speed has been
presented in Table 6.36.

Jabalpur Transport Sector CMP Under JNNURM
Municipal Corporation, Jabalpur R-1
74
Table 6.36 Distribution of Road Length by Speed and type of Carriageway
Carriageway
Width
Speed (Kmph)
Upto 10 >10& <=20 >20 & <=30 >30 & <=40 >40 Total
Undivided 14.17 53.30 23.35 5.08 4.10 100.00
Divided 6.42 45.98 38.98 8.62 8.62 100.00
The distribution by speed and road classification shows, as it can be observed from Table, that in
general the arterial roads have more traffic speed than the sub-arterial and the collector roads.
Table 6.37 Distribution of Road Length by Speed and Road Classification
Carriageway
Width
Speed (Kmph)
Upto 10 >10& <=20 >20 & <=30 >30 & <=40 >40 Total
Arterial 18.55 43.84 27.65 6.35 3.61 100.00
Sub-Arterial 10.32 64.59 16.86 5.73 2.51 100.00
Collector 10.94 59.2 25.19 1.52 3.16 100.00
6.8 Public and Para Transits System
Operational Characteristics
The predominant modes offering public and para public transport services in the study area are mini
buses, tempo, auto rickshaw and cycle rickshaw. In order to under stand the operating characteristics
of these modes, drivers of these vehicles as well as the users were interviewed on sample basis.
6.9 Pedestrian Characteristics
The objective was to assess the pedestrian flows along and across the intersecting arms at important
junctions and to suggest measures for safe movement of pedestrians.
Information relating to identification pedestrians volumes was obtained. This data has been based
extensively for deriving improvements measures under the Rapid Action and Short Term Measures.
Table 6.38 Peak Pedestrian Flow
Location ID Details Peak Hour Total Pedestrian Flow
(across)
JN1 Ranital Chourahaa 19.00 – 20.00 955
JN2 Damoh Naka 18.00 – 19.00 1845
JN3 Raddi Chowk 18.00 – 19.00 1828
JN4 Adhartal Chowk 17.00 – 18.00 796
JN5 Ghamapur Chowk 20.00 – 21.00 1074
JN6 Gorakhpur Junction 18.00 – 19.00 670
JN7 High Court Junction 14.00 – 15.00 474
JN8 ROB at Garha Road 17.00 – 18.00 258
JN9 Ghantaghar Chowk 18.00 – 19.00 455
JN10 Nagar Nigam Chowk 08.00 – 09.00 1026
JN11 Baldev Bagh Chowk 18.0 – 19.00 885

Jabalpur Transport Sector CMP Under JNNURM
Municipal Corporation, Jabalpur R-1
75
It can be observed that Damoh Naka has the maximum pedestrian flow followed by Raddi Chouk and
Ghamapur Junction. In order to study the complexity of problem, Constant has used the variable
(PV2) which is the product to pedestrian flow and square of traffic conflicting with pedestrian.
As per IRC 103 – 1988 if the PV2 value is more than 1 x 10
8 and 2 x 10
8 for divided and undivided road
respectively, then control crossings for pedestrian is warranted. Such Control measures may be in the
form of Zebra Crossing, Pedestrian signals or grade separated crossing etc. Hence estimation of PV2
is of utmost importance. For estimating PV2 at each locations consultants have utilized the traffic data
already variable through secondary sources or collected from the primary survey.
6.10 Stated Preference Survey
A Stated Preference Survey was carried out by the Consultants simultaneously with the opinion
survey. The respondents have an average travel time of 31.2 minutes and the average cost they
incurred for their journey to the work place was Rs. 8.80. Table 6.39 below shows the result of Stated
Preference Survey.
Table 6.39 Stated Preference Survey Result
Acceptable Walking Distance (meters) 257.91
Acceptable Waiting Time (minutes) 7.13
Acceptable Travel Time (minutes) 17.14
Acceptable Fare (Rupees) 6.63
Willingness-to pay for different scenarios (time savings from 10 min to 30 minutes) were asked for
proposed public transport system and results obtained are presented in Table. It can be observed that
people are willing to pay a maximum of Rs. 4.30 for 30-minute time saving.
Table 6.40 Willingness to Pay for Different Scenarios of Time Saving
Time Willingness to Pay
10 minutes 2.5
15 minutes 3.3
20 minutes 3.8
25 minutes 4.1
30 minutes 4.3
Acceptability of fare levels are presented in Table 6.41 below. It can be observed that beyond Rs.
5.00 acceptability levels declines sharply.
Table 6.41 Acceptability of Fare Levels for Proposed Public Transport System
Acceptability Fare Level (Rupees)
1 2 3 4 5 6 7 8 9
Acceptable 96.6 85.63 78.31 62.89 43.22 32.95 26.21 23.43 23.36
Neutral 1.98 9.58 8.73 17.85 22.03 12.5 8.83 3.43 1.42
Not Acceptable 1.42 4.79 12.96 19.26 34.75 54.55 64.96 73.14 75.21
Total 100 100 100 100 100 100 100 100 99.99

Jabalpur Transport Sector CMP Under JNNURM
Municipal Corporation, Jabalpur R-1
76
CHAPTER -7
Household Socio – Economic and Travel Characteristics
7.1 Socio-Economic Characteristics:
An appreciation of the demographic, socio-economic and travel characteristics of the city dwellers is
essential in order to understand the travel needs of the people, their propensity to travel, preferences
for travel modes, ability and willingness to pay for travel and their desire of travel within the area.
Such an understanding helps in rational policy formulation, decision making and in identification of
the relevant transport system to serve the area in the horizon year.
For the present study, household travel survey comprising 7606 households, spread over 102 traffic
zones, and was conducted in order to elicit the necessary socio-economic and travel characteristics.
The household data collected as a part of the field surveys, has been analyzed under the following
heads: -
i) Socio-economic characteristics
ii) Personal characteristics, and
iii) Trip characteristics
In order to appreciate the socio-economic and travel characteristics at a micro level the data has
been analyzed at four spatial levels within the study area of Jabalpur Urban Area. These are:
i) Corporation (comprising zones 1 to 60)
ii) Cantonment (Zones 61 to 68)
iii) Vehicle Factory Jabalpur (VFJ), Ordinance Factory Khamariya (OFK) and Gun
Carriage Factory (GCF) (zones 69, 71 & 92)
iv) Villages (all other zones till 102)
In addition characteristics at the zonal level have also been analyzed and presented.
7.2 House Hold Socio Economic Characteristics
7.2.1 Household Size
Average household size in the study area was observed to be 4.90. The distribution of households by
size, at the four spatial levels and the study area, is presented in Table 7.1
Table 7.1 Distribution of Households by size
Corporation Cantonment Villages VFJ/OFK/GCF Study Area
1 1.04 0.57 0.78 0 0.91
2-3 17.01 16.09 15.12 22.78 17.3
4-5 51.82 52.3 48.84 58.36 52.15
6-7 22.39 23.56 28.29 17.79 22.52
8-10 6.93 5.75 6.59 1.07 6.36
11-15 0.74 1.15 0.39 0 0.67
>15 0.07 0.57 0 0 0.09
Total 100 100 100 100 100
Avg. HH Size 5 5.05 5 4.46 4.90

Jabalpur Transport Sector CMP Under JNNURM
Municipal Corporation, Jabalpur R-1
77
It can be observed that the household structure predominantly is of joint family with 75 percent
households having a size between 4 and 7. Interestingly large sized families are more predominant
within the corporation and Cantonment than the adjacent Villages.
1
2-3 4-5
6-7 8-10
11-15 >15
Fig. 7.1 Percentage Distribution of Household Size in Study Area
7.2.2 Household Income
Average household income in the study area was recorded at Rs.6,120 per month. The distribution of
households under various income groups reveals that majority of the household (26.65 percent) fall
within an income range of Rs.4,500-7,500 per month. Disaggregate analysis shows that zone 6
(Jawaharlal Nehru Ward) is the most affluent zone in the study area having an average household
income of Rs.10,788 per month, while zone 78, formed by Simariya, Kachnari and Rengwa villages,
had the least household income of Rs.1822. Table 7.2 shows the distribution of households under
different income groups.
Table 7.2 Distribution of Households by income
Area Upto
1500
1501-
3000
3001-
4500
4500-
7500
7501-
10000
10001-
15000
15000-
20000
20000
and
above
Total Average
House hold
Income
(Rs./month)
Corporation 4.71 22.5 17.23 27.61 16.49 7.41 2.85 1.19 100 5980.73
Cantonment 2.87 22.99 17.24 27.59 14.94 9.77 4.02 0.57 100 6202.59
Village 11.63 32.56 19.77 22.48 9.3 2.71 1.55 0 100 4334.3
VFJ/OFK/GCF 0 1.78 2.49 20.64 51.25 20.28 2.85 0.71 100 9049.82
Study area 4.75 21.58 16.21 26.65 18.73 8.24 2.81 1.03 100 6120.35
It can also be seen that amongst the four spatial levels, VFJ/OFK/GCF area is the most affluent
with average household income of Rs. 9050 per month followed by Cantonment with average
income of Rs. 6203 per month. Surprisingly, average income levels within the Corporation area
was found be less than the overall study area average.

Jabalpur Transport Sector CMP Under JNNURM
Municipal Corporation, Jabalpur R-1
78
Upto 1500
1501-3000
3001-4500
4500-7500
7501-10000
10001-15000
15000-20000
20000 and above
Fig. 7.2 Percentage Distribution of Household in Study area as per Income
7.2.3 Vehicle Ownership
Average vehicle ownership rate in the study area was observed to be 0.81 vehicles per household in
case of motorized, vehicles and 2.05 vehicles per household when bicycles are also taken into
consideration (Table 7.3). The car ownership rates are lower as compared to two wheeler and cycle
ownership.
Table 7.3 Household Vehicle Ownership Rates (Vehicle/Household)
Vehicle Vehicle Ownership Rate
Two Wheeler 0.79
Cycle 1.24
Car/Jeep 0.03
Two Wheeler & Cycle 0.48
Car & Two Wheeler 0.018
Car & Cycle 0.016
The distribution of households by vehicular ownership shows that about 97.65 percent households in
the study area own some form of a vehicle (Table 7.4). Two wheelers and bicycles are the most
common vehicles owned by households in the study area. About 47 percent of households own at least
one bicycle indicating the importance of cycles as a mode of mobility.
Table 7.4 Distributions of Households by Vehicle Ownership
Vehicle Corporation Cantonment Village VJF/OFK/GCF Study Area
No vehicle 2.61 0.9 4.13 0.19 2.35
2 Wheeler/Moped 30.56 25.34 21.34 30.32 29.69
Cycle 45.47 55.43 58 46.16 46.85
Car/Jeep 1.1 0.68 0.69 0.78 1.02
2w & cycle 17.97 16.52 15.32 22.25 18.22
Car & 2 w 0.8 0.68 0 0 0.65
Car & cycle 0.76 0 0 0 0.59
Other 0.48 0 0.17 0 0.38
Total 100 100 100 100 100

Jabalpur Transport Sector CMP Under JNNURM
Municipal Corporation, Jabalpur R-1
79
Only a small proportion of households (2.35%) do not own a vehicle, while 19.5 percent households
own more than one vehicle.
Fig.7.3 Percentage Distribution of Household’s Vehicle Ownership in study Area
Table 7.5 Distribution of Households by Monthly Expenditure on Travel
Monthly
Expenditure
(Range (Rs.)
Corporation Cantonment Village VJF/OFK/GCF Study Area
0 to 100 986 55 2 230 1024
(16.3%) (13.0%) (31.0%) (0.4%) (15.6%)
100 to 200 1064 52 23 241 1116
(17.6%) (12.3%) (32.5%) (5.7%) (17.0%)
200 to 300 901 88 98 136 978
(14.9%) (20.8%) (18.3%) (9.3%) (14.9%)
300 to 500 1337 115 103 185 978
(22.1%) (27.3%) (24.9%) (26.1%) (14.9%)
500 to 800 1252 82 137 90 1504
(20.7%) (19.5%) (12.2%) (34.6%) (22.9%)
800 to 1000 544 49 56 41 1405
(9.0%) (11.7%) (5.6%) (14.3%) (21.4%)
1000 to 1500 617 19 34 41 617
(10.2%) (4.6%) (5.6%) (8.6%) (9.4%)
1500 and
above
345 16 6 7 322
(5.7%) (3.9%) (1.0%) (1.4%) (4.9%)
Total 6048 422 395 741 6567
(100.00%) (100.00%) (100.00%)) (100.00%) (100.00%)
Study Area No vehicle
2 Wheeler/Moped
Cycle
Car/Jeep
2w & cycle
Car & 2 w
Car & cycle
Other

Jabalpur Transport Sector CMP Under JNNURM
Municipal Corporation, Jabalpur R-1
80
7.6 Average Monthly Household Expenditure on Travel by Income Group
Income Range Corporation Cantonment Village VJF/OFK/GCF Study Area
Up to 1500 683 64 49 0 768
(11.3%) (15.2%) (12.5%) (0.0%) (11.7%)
1501-3000 569 42 29 78 604
(9.4%) (10.0%) (7.3%) (10.5%) (9.2%)
3001-4500 605 39 33 85 650
(10.0%) (9.3%) (8.3%) (11.5%) (9.9%)
4501-7500 605 42 31 56 637
(10.0%) (10.0%) (7.9%) (7.6%) (9.7%)
7501-10000 544 30 33 51 552
(9.0%) (7.1%) (8.3%) (6.9%) (8.4%)
10001-15000 562 28 23 52 565
(9.3%) (6.6%) (5.9%) (7.0%) (8.6%)
15001-20000 538 0 31 45 571
(8.9%) (0.0%) (7.8%) (6.1%) (8.7%)
20000 and
Above
423 22 0 66 466
(7.0%) (5.3%) (0.0%) (8.9%) (7.1%)
Total 6048 422 395 741 6567
(100.00%) (100.00%) (100.00%)) (100.00%) (100.00%)
0
5
10
15
20
Up
to
15
00
30
01
-
45
00
75
01
-
10
00
0
15
00
1-
20
00
0
Corporation
Cantonment
Village
VJF/OFK/GCF
Study Area
Fig.7.4 Percentage Average Monthly Expenditure on travel as per House Hold Income
7.3 Personal Characteristics
7.3.1 Age Structure
Population distribution under different age groups reveals that majority of the population (42.58
percent) in the study area is in the age group of 18-40 years. Population under working age group
(18-60 years) constitutes about 72 percent within the total population study area. Table 7.7 shows the
population distribution under different age groups in the study area.

Jabalpur Transport Sector CMP Under JNNURM
Municipal Corporation, Jabalpur R-1
81
Table 7.7 Population distributions by Age (in %)
Area
Age (in years)
0-5 5-18 18-40 40-60 60 and
above Total
Corporation 1.33 15.96 43.11 28.7 10.9 100
Cantonment 1.84 14.79 45.18 29.29 8.9 100
VFJ/OFKlGCF 0.54 12.97 36.18 40.29 10.02 100
Villages 1.81 19.15 42.04 25.89 11.12 100
Study Area 1.33 15.91 42.58 29.43 10.74 100
The population distribution in the study area by age groups. It can be seen that population below 5
years of age constitute about 1.3 percent, whereas population over 60 years comprise about 10.7
percent of the total population within study area.
0
10
20
30
40
500-5
18-
May
18-4
0
40-6
0
60
and
Age (in years)
Corporation
Cantonment
VFJ/OFKlGCF
Villages
Study Area
Fig.7.5 Age Structure of Study Area
7.3.2 Gender
The Sex Ratio (number of females per thousand males) in the study area is observed as 868. Area
wise distribution of male population varies between 55.2 to 50.3 percent in the study area. Table 7.8
below shows the percentage of males and females within different parts of the study area. The
VFJ/OFK/GCF area has a fair balance in gender ratio in comparison to other spatial regions in the
study area.
Table 7.8 Distribution of Population by Gender
Area Gender
Male Female
Corporation 53.80 46.20
Cantonment 55.19 44.81 VFJ/OFKlGCF 50.32 49.68
Villages 52.71 47.29
Study Area 53.53 46.4 7

Jabalpur Transport Sector CMP Under JNNURM
Municipal Corporation, Jabalpur R-1
82
7.3.3 Educational Profile
Nearly 91.1 percent of the total population within the study area is literate. Majority of the population
(47.5 percent) has secondary educational qualifications. Graduate and higher qualified population
accounted for 20.3 percent, while professional or technical graduates constitute about 0.84 percent of
total population (Table 7.9). There are spatial inequities in terms of educational status of population
residing in different parts of the study area. While VFJ/OFK/GCF has about 30.9 percent graduate
population, it is only 6.9 percent in case of Villages, probably on account of poor access to educational
facilities and poor economic status.
Table 7.9 Distribution of Population by Education
Area Illiterate Primary Middle/lnter
mediate Graduate
Post
Graduate
& Above
Profes
sional Others Total
Corporation 8.52 19.92 47.58 15.7 4.21 0.96 3.10 100
Cantonment 9.14 17.61 54.06 11.96 2.6 0.56 4.06 100
VFJ/OFK/GCF 6.84 9.86 42.05 30.92 8.74 0.24 1.35 100
Villages 15.09 23.07 47.37 6.97 2.32 0.31 4.88 100
Study Area 8.93 19.28 47.49 15.97 4.32 0.84 3.16 100
7.3.4 Occupation
The classification of workers under different occupation groups has been detailed in Table 7.10. The
estimated work force participation rate (WFPR) in the study area as estimated from household survey
is 31.4 percent. Of this maximum workers are under the service sector (16.3%). Interestingly, the
unemployment rate is maximum in Cantonment at about 10.4 percent.
Table 7.10 Distribution of Population by Occupation (in %)
Area Type of Occupation
Service Busine
ss
Daily
Wages
(Casual
House
wife
Student Retired Unemployed Other
Total
Corporation 16.81 9.10 6.55 24.53 28.30 3.82 8.40 3.48 100
Cantonment 17.16 12.42 4.29 25.62 22.91 2.93 10.38 4.29 100
VFJ/OFKlGCF 26.63 3.42 0.4 28.3 26.79 3.10 10.10 1.27 100
Villages 11.30 9.44 8.67 26.93 26.24 2.48 9.44 5.50 100
Study Area 16.35 8.87 6.13 25.06 27.74 3.62 8.72 3.51 100
7.3.5 The distribution of population by occupation
The distribution of the population in the study area based on occupation reveals that about 27.8
percent of the population comprise of students, while 25 percent comprised of housewives. The
unemployed population share is 8.7 percent while retired population was nearly 3.6 percent. Spatial
distribution shows that larger share of population in VFJ/OFK/GCF are engaged in services as
occupation compared to the rest of the study area.

Jabalpur Transport Sector CMP Under JNNURM
Municipal Corporation, Jabalpur R-1
83
Type of Occuption Service-16.35%
Type of Occuption Business-8.87
Type of Occuption Daily Wages-6.13
Type of Occuption House-25.06
Type of Occuption Student-27.74
Type of Occuption Retaired-3.62
Type of Occuption Unemployed-8.72
Fig.7.6 Distribution of population by occupation
7.3.6 Driving License Holders
Table 7.11 gives the percentage .of population having a driving license. The table shows that out .of
the population above 18 years .of age, only about 15.9 percent individuals within the study area
possess driving licenses.
Table 7.11 Percentage Distribution of Population By Driving License Holder
Area No License Two
Wheeler Car Others Total
Corporation 84.76 14.39 0.61 0.25 100
Cantonment 85.67 13.66 0.56 0.11 100
VF J/OFK/GCF 69.08 30.37 0.32 0.24 100
Villages 90.71 8.82 0.46 0 100
Study Area 84.08 15.13 0.57 0.22 100
It can be seen that while 50% household own form of motorized vehicles only about 15.9% individual
posses a driving license.
7.4 Travel Characteristics
Data on trip information has been analyzed with a view to assess the travel characteristics and trip
pattern in the study area. The travel and socio-economic characteristics will form the basis for
constructing the travel demand model for the study area.
7.4.1 Total Trips
An estimated 26,337 trips were preformed on an average day by 7606 households selected at
random within the study area, out of which Corporation contributed is 84.6 percent, Cantonment 3.84
percent, VFJ/OFK/GCF 6.1 percent and 5.5 percent by Villages.
7.4.2 Per Capita Trip Rate
The overall per capita trip rate (PCTR) observed in the study area was 1.57 while the PCTR
excluding walk trip was 1. Spatial Analysis of PCTR reveals that highest vehicular PCTR was
observed in VFJ/OFK/GCF (1.09), followed by the Corporation area (1.05). The Villages recorded the
lowest vehicle PCTR of 0.61 indicating the prevalence of low-income and low mobility level
population. The overall PCTR varies significantly over spatial entities of the study area, as shown
below in Table 7.12. The spatial variation of PCTR value across the study area is shown in Fig.7.7

Jabalpur Transport Sector CMP Under JNNURM
Municipal Corporation, Jabalpur R-1
84
Table 7.12 Per Capita Trip Rate of Different localities
Area Including Walk Trips Excluding Walk Trips
Corporation 1.68 1.05
Cantonment 1.14 0.66
VFJ/OFK/GCF 1.28 1.09
Village 1.11 0.61
Study Area 1.57 1.0
0
0.5
1
1.5
2
Cor
pora
tion
Can
tonm
ent
VFJ/OFK/G
CF
Village
Study
Are
a
Including WalkTrips
Excluding WalkTrips
Fig.7.7 Per Capita Trip Rates
7.4.3 Mode of Travel
The distribution of trips amongst different modes (Fig.7.8) show that the share of trips by personalized
vehicles (cycles, two wheelers & cars) and public/IPT transport accounted for 48.08 percent and 14.8
percent respectively (refer Table 7.13). Walk trips constitute about 36.7 percent of total trips in the
study area. The share of walks trips in total understandably is highest in Villages followed by
Cantonment and Corporation respectively. Public transport trips are lowest at 4.7 percent in
Cantonment followed by Village at 6.94 percent largely due to poor accessibility to public transport as
compared to Corporation where it is over 15 percent.
Table 7.13 Mode wise distribution of Trips
Area Walk Private (Excluding
Walk)
Public Transport &
IPT
Others Total
Corporation 37.56 46.73 15.47 0.22 100
Cantonment 42.33 52.92 4.74 0 100
VFJ/OFK/GCF 14.5 63.91 18.10 3.48 100
Village 44.8 47.79 6.94 0.49 100
Study Area 36.74 48.08 14.76 0.42 100

Jabalpur Transport Sector CMP Under JNNURM
Municipal Corporation, Jabalpur R-1
85
010203040506070
Cor
pora
tion
Can
tonm
ent
VFJ/OFK/G
CF
Village
Study
Are
a
Walk
Private (ExcludingWalk)
Public Transport &IPT
Others
Fig.7.8 Mode wise distribution of Trips
7.4.4 Trip Purpose
Trip distribution by purpose of travel (Figure 7.9) shows that work and education trips account for 16.1
percent and 16.7 percent of the total trips made in the study area respectively. Shopping trips account
for 5.73 percent share. Area wise details of purpose of trip are given in Table 7.14.
Table 7.14 Purpose-wise percentage Distribution of Trip (Area wise)
Area Work Business Education Shopping Social Recr-
eation
Health
/Hospital
Return
Home
Other
Purpose
Total
Corporation 15.52 3.68 16.20 6.17 3.95 1.80 1.12 48.4 3.17 100
Cantonment 17.31 3.96 18.00 4.55 2.67 1.48 0.0 49.6 2.47 100
VFJ/OFK/GCF 20.47 2.55 18.80 4.29 3.11 0.06 1.12 49.0 0.56 100
Villages 19.36 4.77 21.90 1.31 1.24 0.62 0.48 49.10 1.24 100
Study Area 16.10 3.68 16.70 5.73 3.70 1.62 1.04 48.5 2.87 100
Work-16.1%
Business-3.68%
Education-16.7%
Shopping-5.73%
Social-3.7%
Recreation-1.62%
Return Home-48.5%
Other Purpose-2.87%
Fig.7.9 Purpose-wise percentage Distribution of Trip
7.4.5 Trip Length
The average trip lengths observed are 4.91 km and 3.62 km including and excluding walk trips
respectively. Trip length frequency distribution (TLFD) shows that majority of the vehicular trips have
trip lengths between 3 and 5 km (37.9 percent), followed by 5 to 7 km (18.4 percent). The detail of the
distribution of trips by trip length is presented in Table7.15. The lengthwise distribution of trips is
presented in Table and the distribution of trips by trip length.

Jabalpur Transport Sector CMP Under JNNURM
Municipal Corporation, Jabalpur R-1
86
Table 7.15 Distribution of Trips by Trip Length
Trip Length
(Km)
Excluding Walk Including Walk
0-1 3.37 24.37 1-2 8.26 14 2-3 5.18 5.03 3-5 37.89 26.33 5-7 18.45 12.54
7-10 15.09 10.07 10-15 6.29 4.09 >15 5.48 3.56
Total 100 100
There is a marked variation in the distribution pattern of trip lengths in Villages and the rest of the study
area. It is evident from Table 7.16 below that the average vehicular trip length increases from 4.44 km
in Cantonment to 6.25 km in extension area exhibiting a 30 percent increase.
Table 7.16 Distribution of trips by length (Area wise)
Area Trips Trip Length Range in (Km) Average
Trip Length
(Km)
Up
to 1
>1&
<=2
>2&
<=3
>3&
<=5
>5&
<=7
>7&
<=10
>10&
<=15 >15 Total
Excl.
walk
Trips
Incl.
walk
Corporation 28.99 21.35 13.57 18.63 8.42 5.83 2.13 1.08 100 3.55 4.84
Cantonment 32.54 22.06 18.3 13.55 5.64 4.15 2.87 0.89 100 3.06 4.44
VFJ/OFK/GCF 19.17 21.03 17.3 17.17 9.83 6.16 3.86 5.48 100 4.46 5.03
Villages 35.27 15.15 13.69 13.49 6.09 7.05 5.95 3.32 100 4.01 6.25
Study Area 28.87 21.02 13.99 18.06 8.27 5.85 2.48 1.46 100 3.62 4.91
All the areas except VFJ/OFK/GCF have a majority of trips in the range of 1 to 2 Km while the major
share (21.03 percent) of trips for VFJ/OFK/GCF lie in the range of 2.00 to 3.00 Km. Average vehicle
trip lengths are the highest in the VFJ/OFK/GCF, while it is the lowest in the Cantonment.
05
10152025303540
Up >1& >2& >3& >5& >7& >15
Trips Trip Length Range in (Km)
Corporation
Cantonment
VFJ/OFK/GCF
Villages
Study Area
Fig.7.10 Trip Length Frequency Distribution

Jabalpur Transport Sector CMP Under JNNURM
Municipal Corporation, Jabalpur R-1
87
7.4.6 Average Trip Length, Travel Time and Travel Cost by Mode
Analysis of the data for average trip length (ATL) for the study area shows that walk trips have an ATL
of 1.38 km, scooter trips 5.26 km and car 8.34 km. The details of ATL as well as Average trip time
(ATT) and Average Trip Cost (ATC) are presented in Table. It can be observed that for Mini bus trip,
the ATT is as high as 51.82 minutes in spite of the ATL being 8.81 Km.
Table 7.17 Mode wise ATL, A TT and A TC for Study area
Mode ATL (Km) ATT (Min) ATC (Rs) ATL (km/hr)
Walk 1.38 23.64 0.00 3.50
Scooter/Motor Cycle 5.26 29.53 3.55 10.69
Auto Rickshaw/Taxi 4.78 34.65 9.68 8.28
Tempo 4.53 38.72 4.91 7.02
Cycle 4.03 33.48 0.00 7.22
Car/Jeep 8.34 30.44 11.11 16.44
Govt. Car/Van 3.17 17.50 8.67 10.87
Cycle Rickshaw 3.61 37.61 7.15 5.76
Shared Vehicle 4.35 29.00 5.90 9.00
Mini Bus 8.81 51.82 5.78 10.20
Chartered/Contract
Bus 9.88 52.19 2.88 11.36
State Transport Bus 8.18 43.45 6.09 11.30
Institutional/Company
Bus 12.23 65.97 3.74 11.12
Rail 96.69 147.69 22.85 39.28
All Modes 3.62 30.16 1.99 7.20
The average walking time has been observed as 23.64 minutes while the average time for two
wheeler trips is about 29.53 minutes. The ATL and ATT for Mini bus, the predominant public transport
in the study area is 8.81 Km & 51.82 minutes respectively, while it is 4.53 Km and 38.72 minutes for
tempo.
7.4.7 Average Trip Length by Purpose
The purpose wise distribution of ATL indicates that amongst trips, 'work' trips have average trip
lengths (4.75 km) followed by business trips (3.92 km), 'other purposes' trips (3.64 km). The average
trip length for education trips is 3.05 km while average trip length for shopping trips is 2.55 km. The
purpose wise Average trip length for the study area is presented in Table 7.18.

Jabalpur Transport Sector CMP Under JNNURM
Municipal Corporation, Jabalpur R-1
88
Table 7.18 Average Trip Length by Trip Purpose
S. No. Purpose Average Trip Length (Km)
1 Work 4.75
2 Business 3.92
3 Education 3.05
4 Shopping 2.55
5 Social 3.43
6 Recreation 2.48
7 Health / Hospital 2.83
8 Return Home 3.61
9 Other Purpose 3.64
7.4.8 Purpose and Mode of Travel
The mode wise trip distribution by purpose (Table 7.19) indicates that while walk trip are mainly for
education purpose, cycles trips are used for work purpose. Majority of private motorized vehicle trips
(25.8%) are for work purpose while para transit and public transport modes are largely use for
educational purpose.
Table 7.19 Percentage Mode wise Distribution of Trip by Purpose
Mode
Purpose
Work Business Education Shopping Social Recreation Health
/Hospital
Return
Home
Other
purpose
Walk 9.87 2.65 19.23 7.94 3.56 2.81 1.42 49.06 100
Cycle 21.13 3.18 20.02 1.82 2.51 0.76 0.26 48.83 100
Private
(2W/Car)
25.8 7.37 7.02 3.68 3.56 1.32 0.68 47.44 100
PT/IPT 10.86 2.28 18.88 6.55 6.69 0.85 2.51 48.06 100
Others 20.56 3.16 20.1 2.02 2.69 0.76 0.35 48.78 100
The purpose wise distribution of trips across modes (Table 7.20) reveals that majority of work and
business trips (26.1 percent and 35.7 percent respectively) are performed by private motorized
vehicles, while 33.6 percent of education trips are performed by walk. The major modes for shopping
trips are walk (55.2 percent) and private motorized vehicles (15.1 percent) respectively.

Jabalpur Transport Sector CMP Under JNNURM
Municipal Corporation, Jabalpur R-1
89
Table 7.20 Percentage Mode wise Distribution of Trip by Modes
Mode
Purpose
Work Business Education Shopping Social Recreation Health
/Hospital
Return
Home
Other
purpose
Walk 16.90 21.70 33.60 55.2 32.5 57.3 50.2 30.7 41.7
Cycle 26.0 18.80 25.10 9.06 16.4 11.2 6.59 22 12.9
Private
(2W/Car)
26.10 35.70 7.30 15.1 19.2 15.9 14.3 17.5 22.3
PT/IPT 4.06 4.07 7.20 9.93 13.3 3.81 19.4 6.56 8.71
Others 26.90 19.80 26.80 10.7 18.7 11.8 9.52 23.3 14.4
Total 100 100 100 100 100 100 100 100 100
7.4.9 Purpose and Trip Length Relationship
The distribution of trips by purpose and trip length reveals that 59.2 percent of work trips and 66.2
percent of business trips are confined upto a distance of five km while 44.2 percent of the education
trips are upto a distance of two km (Table 7.21).
Table 7.21 Purpose wise Distribution of Trips by Trip Length
Trip
Length
Purpose of Travel
Work Business Education Shopping Social Recreation Health/
Hospital
Return
Home
Other
purpose
0-1 14.4 28.4 28 29.3 22.2 45.4 35 24.6 31.9
1-2 11.6 10.8 16.2 17.5 13 18 15.5 13.9 13.6
2-3 4.02 4.57 6.68 5.33 4.32 2.33 5.83 5.03 3.47
3-5 29.2 22.4 24.9 29.5 25.7 16.9 17.5 26.4 25.9
5-7 13.8 9.38 11.6 13.5 17.6 9.88 13.6 12.4 10.4
7-10 14.9 13 7.67 2.48 10.8 2.91 6.8 10.2 6.62
10-15 6.13 5.29 3.04 1.33 3.51 2.33 5.83 4 3.79
>15 5.97 6.25 1.77 0.95 2.97 2.33 0 3.49 4.42
Total 100 100 100 100 100 100 100 100 100
7.5 Zonal Travel Characteristics
Travel Characteristics have also been compiled at the zonal level in terms of mode of travel, Purpose
of travel, trip length and per capita trip rate.
7.5.1 Mode of Travel The distribution of trips by mode of travel at zonal level are presented below
in table 7.22.

Jabalpur Transport Sector CMP Under JNNURM
Municipal Corporation, Jabalpur R-1
90
Table 7.22 presents the distribution of trips by mode of travel at zonal level
Mode of Travel
Zone Number Walk Private Mode PT/IPT Others Total
1 29.43 36.4 1.25 15.46 100
2 26.03 40 3.49 14.92 100
3 43.91 27.27 8.9 7.55 100
4 41.87 27.59 0 3.95 100
5 63 5.29 2.64 2.64 100
6 18.79 41.82 2.42 7.88 100
7 29.03 24.19 3.23 16.13 100
8 31.72 26.9 0 17.93 100
9 47.37 28.07 2.63 5.26 100
10 36.44 19.49 0.85 12.7 100
11 23.11 30.44 3.1 18.22 100
12 23.91 39.8 0 19.07 100
13 30.25 20.99 0 20.37 100
14 20.67 24.04 4.33 21.16 100
15 49.23 12.31 0 14.62 100
16 49.07 12.15 3.27 5.61 100
17 23.46 13.41 7.27 20.11 100
18 33.28 19.36 0 20 100
19 45.16 12.1 0 8.06 100
20 24.62 26.67 2.56 18.46 100
21 31.4 23.14 1.65 14.87 100
22 29.87 27.56 3.86 15.99 100
23 63.94 8.17 3.37 1.44 100
24 63.97 8.82 3.68 4.41 100
25 53.61 10.31 5.15 7.22 100
26 66.22 6.43 1.08 4.83 100
27 65.89 2.33 1.16 4.27 100
28 57.18 9.23 6.92 8.72 100
29 31.23 32.02 6.82 7.88 100
30 36.16 16.52 9.6 8.92 100
31 28.73 16.26 7.36 14.02 100
32 29.58 14.67 2.93 10.27 100
33 34.74 18.42 8.95 12.81 100
34 25.38 26.81 2.2 15.27 100
35 54.91 7.48 2.56 13.25 100
36 37.24 15.49 0 15.37 100
37 59.72 7.99 0 8.34 100
38 75.46 4.46 0 4.46 100

Jabalpur Transport Sector CMP Under JNNURM
Municipal Corporation, Jabalpur R-1
91
Mode of Travel
Zone Number Walk Private Mode PT/IPT Others Total
39 22.6 30.8 1.2 21 100
47 47.15 44.31 8.54 0 100
48 21.84 71.84 6.32 0 100
49 32.49 52.53 14.63 0.36 100
50 38.85 40.54 20.6 0 100
51 29.45 47.51 23.05 0 100
52 28.55 53.84 17.47 0.14 100
53 40.93 48.71 10.37 0 100
54 48.92 42.71 8.37 0 100
55 45.45 46.69 7.03 0.83 100
56 29.08 61.99 8.93 0 100
57 63.56 29.93 6.29 0.22 100
58 16.72 64.81 17.89 0.59 100
59 55.93 30.02 12.82 1.21 100
60 53.2 33 13.8 0 100
61 49.02 45.58 5.39 0 100
62 55.88 39.7 4.41 0 100
63 49.32 47.97 2.71 0 100
64 24.14 65.52 10.35 0 100
65 35.62 60.28 4.11 0 100
66 26.96 68.14 4.9 0 100
67 57.14 37.14 5.71 0 100
68 37.29 59.32 3.38 0 100
69 24.62 60.66 14.42 0.3 100
70 0 0 0 0 0
71 4.47 65.7 22.04 7.78 100
72 73.33 26.67 0 0 100
73 36.36 45.45 18.18 0 100
74 36 52 12 0 100
75 35.71 35.71 28.57 0 100
76 75 25 0 0 100
77 40 60 0 0 100
78 83.33 16.67 0 0 100
79 62 32 6 0 100
80 0 0 0 0 0
81 50 25 25 0 100
82 65.22 34.78 0 0 100
83 0 100 0 0 100
84 51.06 39.36 9.57 0 100

Jabalpur Transport Sector CMP Under JNNURM
Municipal Corporation, Jabalpur R-1
92
Mode of Travel
Zone Number Walk Private Mode PT/IPT Others Total
85 22.22 75.55 2.22 0 100
86 41.88 47.87 9.4 0.85 100
87 49.12 50.88 0 0 100
88 42.28 57.72 0 0 100
89 52.08 39.59 8.33 0 100
90 57.14 42.86 0 0 100
91 79.49 20.51 0 0 100
92 15.38 67.62 17.01 0 100
93 64.29 26.79 8.93 0 100
94 20.41 71.43 8.16 0 100
95 37.5 62.5 0 0 100
96 30.3 62.62 7.07 0 100
97 0 85.72 14.27 0 100
98 0 100 0 0 100
99 0 0 0 0 0
100 81.25 12.5 6.25 0 100
101 35 60 5 0 100
102 22.93 63.69 9.56 3.82 100
Study Area 36.74 48.08 14.76 0.42 100
7.5.2 Purpose of Travel
Table below presents distribution of Trips by Purpose of Travel at Zonal Level
Table 7.23 Distribution of Trips by Purpose of Travel
Zone
Number
Purpose
Work Business Educ
ation
Shop
ping
Social Recre
ation
Health
/Hospital
Return
Home
Other
Purpose
Total
1 16.71 6.73 19.2 2.24 2.99 1.25 0.5 46.63 3.74 100
2 13.02 6.35 19.68 2.22 2.54 0.63 0 49.52 6.03 100
3 18.76 2.9 11.61 7.35 7.35 1.93 0.97 47.39 1.74 100
4 10.84 8.37 14.78 3.94 12.32 0.49 0.49 47.78 0.99 100
5 16.3 0.88 13.22 12.33 0 7.05 0 49.78 0.44 100
6 18.18 4.24 14.55 4.85 3.64 0 0 48.48 6.06 100
7 20.97 0 20.16 2.42 0.81 1.61 0.81 50 3.23 100
8 15.17 6.21 23.45 4.14 2.07 0 0 46.21 2.76 100
9 13.16 4.39 12.72 6.58 0.44 10.96 0 49.56 2.19 100
10 16.95 2.54 21.19 2.54 4.24 0 1.69 50 0.85 100
11 14 2.67 12.67 6.22 10.89 4.89 1.11 47.33 0.22 100

Jabalpur Transport Sector CMP Under JNNURM
Municipal Corporation, Jabalpur R-1
93
Zone
Number
Purpose
Work Business Educ
ation
Shop
ping
Social Recre
ation
Health
/Hospital
Return
Home
Other
Purpose
Total
12 11.87 3.18 11.71 8.36 5.02 3.01 1.17 48.66 7.02 100
13 12.96 4.32 17.9 8.02 4.32 1.23 2.47 48.15 0.62 100
14 12.5 2.4 21.63 8.65 4.81 0 0.48 49.04 0.48 100
15 7.69 5.38 21.54 4.62 2.31 2.31 0 50.77 5.38 100
16 16.82 3.27 16.36 6.54 0.47 2.8 1.4 49.07 3.27 100
17 21.23 8.38 9.5 3.91 3.91 1.12 1.12 46.93 3.91 100
18 9.6 6.56 11.84 11.84 9.6 0.48 0.96 47.84 1.28 100
19 14.11 6.05 21.77 4.44 2.42 0.81 0 49.19 1.21 100
20 11.79 6.15 25.13 4.1 2.05 0.51 0.51 49.23 0.51 100
21 13.22 1.65 20.66 11.57 1.65 0.83 0.0 49.59 0.83 100
22 15.16 4.41 19.19 8.25 2.5 1.15 0.58 48.56 0.19 100
23 20.19 0.96 16.83 0.24 0 5.29 0 49.76 6.73 100
24 28.68 0.37 12.13 1.84 0 0 0.37 49.63 6.99 100
25 18.56 1.03 24.74 0 0 0 0.52 48.97 6.19 100
26 17.16 2.68 11.8 7.77 5.09 2.95 1.61 46.38 4.56 100
27 33.72 1.55 12.4 0 0 0.39 0 49.22 2.71 100
28 25.64 1.54 12.56 5.38 0.77 0 0 20 4.1 100
29 11.02 5.77 13.39 6.04 4.99 4.46 0.79 48.8 4.72 100
30 20.54 3.79 19.64 0.89 1.79 1.12 0.45 48.44 3.35 100
31 15.67 3.97 11.26 7.95 6.4 0.88 1.77 48.57 3.53 100
32 17.43 1.94 15.98 7.99 3.63 0.73 1.21 48.43 2.66 100
33 11.75 4.21 9.3 9.82 8.6 3.86 1.75 46.67 4.04 100
34 13.91 3.41 22.71 5.87 3.31 0.19 0.95 48.06 1.61 100
35 13.19 0.43 21.7 8.94 2.98 1.7 0 48.94 2.13 100
36 19.01 3.39 19.79 4.82 3.13 0.39 0.52 47.79 1.17 100
37 21.18 1.74 13.89 5.56 3.82 0.69 0 49.65 3.47 100
38 15.61 0.74 14.87 5.95 12.27 0 0.74 49.07 0.74 100
39 12.72 4.17 17.89 7.95 5.37 0.6 0.99 48.31 1.199 100
40 16.31 2.02 18.46 7.82 5.93 0.4 0.13 48.38 0.54 100
41 11.26 1.83 12.18 7.61 5.02 2.89 1.07 48.55 9.59 100
42 22.04 0.23 14.85 1.16 3.02 0 0.46 48.49 9.74 100
43 21.98 2.16 18.32 2.37 0 0.86 0.43 49.78 4.09 100
44 10.86 8.15 15.18 6.87 5.43 2.56 2.4 46.17 2.4 100
45 19.51 4.39 18.54 2.44 2.44 2.93 0.98 48.78 0 100
46 10.76 3.67 15.89 7.82 0.24 4.89 6.11 48.9 1.71 100
47 8.54 8.13 14.23 8.54 4.47 2.03 3.25 47.97 2.85 100

Jabalpur Transport Sector CMP Under JNNURM
Municipal Corporation, Jabalpur R-1
94
Zone
Number
Purpose
Work Business Educ
ation
Shop
ping
Social Recre
ation
Health
/Hospital
Return
Home
Other
Purpose
Total
48 11.49 16.09 8.62 11.49 8.05 0 0.57 42.53 1.15 100
49 11.73 3.79 14.26 7.76 3.43 0.54 4.51 49.28 4.69 100
50 18.58 1.69 15.54 7.77 2.36 0.68 0 49.66 3.72 100
51 22.33 4.28 11.64 3.33 2.85 0.24 4.75 49.41 1.19 100
52 10.53 2.81 10.81 7.16 7.72 6.74 0.98 47.19 6.04 100
53 18.13 3.63 16.58 5.7 3.63 2.59 0 49.22 0.52 100
54 9.73 6.76 15.41 7.3 1.08 0.54 8.11 49.46 1.62 100
55 16.53 3.31 26.03 1.65 0.83 0 0.41 49.17 2.07 100
56 18.62 2.81 21.68 1.53 2.81 0.51 0.51 48.72 2.81 100
57 16.49 0.43 16.27 14.1 0 3.47 0 49.24 0 100
58 10.85 3.81 19.94 4.4 4.11 1.17 0 46.33 9.38 100
59 17.26 6.38 14.89 7.09 1.18 3.55 0.47 48.23 0.95 100
60 9.09 6.06 24.58 3.03 4.04 0 0 49.16 4.04 100
61 19.12 3.92 21.08 0.98 0.98 0.49 0 48.53 4.9 100
62 13.24 3.68 21.32 4.41 1.47 1.47 0 50.74 3.68 100
63 20.95 3.38 10.81 10.14 3.38 0.68 0 49.32 1.35 100
64 24.14 3.45 6.9 3.45 5.17 1.72 0 50 5.17 100
65 15.07 5.48 1918 2.47 4.11 2.74 0 49.32 1.37 100
66 15.02 5.39 18.63 3.92 2.94 1.96 0 50 1.96 100
67 12.86 4.29 17.14 7.14 5.71 2.86 0 50 0 100
68 18.64 1.69 22.03 5.08 1.69 1.69 0 49.15 0 100
69 22.67 1.2 17.72 4.5 2.7 0.15 1.35 49.1 0.6 100
70 0 0 0 0 0 0 0 0 0 100
71 18.73 3.17 20.46 3.75 3.17 0 0.72 49.28 0.72 100
72 26.67 3.33 16.67 0 3.33 0 0 50 0 100
73 22.73 2.27 22.73 0 0 0 0 50 2.27 100
74 18 6 18 6 0 0 0 50 2 100
75 21.43 0 25 0 0 3.57 0 50 0 100
76 12.5 12.5 0 0 0 0 0 50 25 100
77 30 0 20 0 0 0 0 50 0 100
78 13.89 2.78 30.5 0 0 0 0 50 2.78 100
79 26 3 19 1 0 0 0 50 1 100
80 0 0 0 0 0 0 0 0 0 100
81 29.17 0 16.67 0 0 0 0 50 4.17 100
82 21.74 4.35 21.74 0 2.17 2.17 0 47.83 0.0 100
83 50 0 0 0 0 0 0 0 50 100
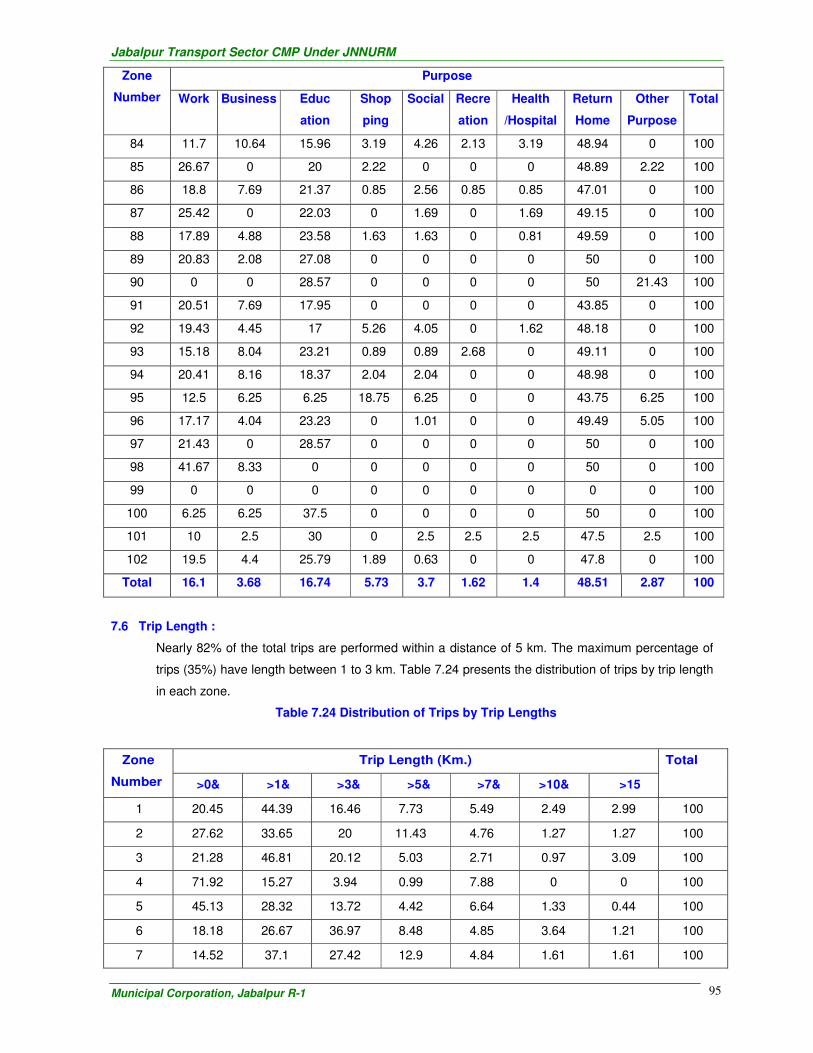
Jabalpur Transport Sector CMP Under JNNURM
Municipal Corporation, Jabalpur R-1
95
Zone
Number
Purpose
Work Business Educ
ation
Shop
ping
Social Recre
ation
Health
/Hospital
Return
Home
Other
Purpose
Total
84 11.7 10.64 15.96 3.19 4.26 2.13 3.19 48.94 0 100
85 26.67 0 20 2.22 0 0 0 48.89 2.22 100
86 18.8 7.69 21.37 0.85 2.56 0.85 0.85 47.01 0 100
87 25.42 0 22.03 0 1.69 0 1.69 49.15 0 100
88 17.89 4.88 23.58 1.63 1.63 0 0.81 49.59 0 100
89 20.83 2.08 27.08 0 0 0 0 50 0 100
90 0 0 28.57 0 0 0 0 50 21.43 100
91 20.51 7.69 17.95 0 0 0 0 43.85 0 100
92 19.43 4.45 17 5.26 4.05 0 1.62 48.18 0 100
93 15.18 8.04 23.21 0.89 0.89 2.68 0 49.11 0 100
94 20.41 8.16 18.37 2.04 2.04 0 0 48.98 0 100
95 12.5 6.25 6.25 18.75 6.25 0 0 43.75 6.25 100
96 17.17 4.04 23.23 0 1.01 0 0 49.49 5.05 100
97 21.43 0 28.57 0 0 0 0 50 0 100
98 41.67 8.33 0 0 0 0 0 50 0 100
99 0 0 0 0 0 0 0 0 0 100
100 6.25 6.25 37.5 0 0 0 0 50 0 100
101 10 2.5 30 0 2.5 2.5 2.5 47.5 2.5 100
102 19.5 4.4 25.79 1.89 0.63 0 0 47.8 0 100
Total 16.1 3.68 16.74 5.73 3.7 1.62 1.4 48.51 2.87 100
7.6 Trip Length :
Nearly 82% of the total trips are performed within a distance of 5 km. The maximum percentage of
trips (35%) have length between 1 to 3 km. Table 7.24 presents the distribution of trips by trip length
in each zone.
Table 7.24 Distribution of Trips by Trip Lengths
Zone
Number
Trip Length (Km.) Total
>0& >1& >3& >5& >7& >10& >15
1 20.45 44.39 16.46 7.73 5.49 2.49 2.99 100
2 27.62 33.65 20 11.43 4.76 1.27 1.27 100
3 21.28 46.81 20.12 5.03 2.71 0.97 3.09 100
4 71.92 15.27 3.94 0.99 7.88 0 0 100
5 45.13 28.32 13.72 4.42 6.64 1.33 0.44 100
6 18.18 26.67 36.97 8.48 4.85 3.64 1.21 100
7 14.52 37.1 27.42 12.9 4.84 1.61 1.61 100

Jabalpur Transport Sector CMP Under JNNURM
Municipal Corporation, Jabalpur R-1
96
Zone
Number
Trip Length (Km.) Total
>0& >1& >3& >5& >7& >10& >15
8 28.28 40 14.48 4.83 11.03 1.38 0 100
9 62.28 14.91 9.65 6.14 2.63 2.63 1.75 100
10 28.81 33.9 21.19 5.93 3.39 6.78 0 100
11 26.44 31.11 24.44 7.33 7.11 1.78 1.78 100
12 21.07 26.25 19.4 13.04 10.03 6.52 3.68 100
13 25.31 51.85 8.02 9.88 4.94 0 0 100
14 13.46 49.04 24.04 5.77 7.69 0 0 100
15 59.23 26.15 10 1.54 1.54 0 1.54 100
16 31.31 46.73 16.82 1.87 2.34 0.47 0.47 100
17 27.37 31.84 17.32 5.03 8.94 3.91 5.59 100
18 20 45.76 26.72 3.68 2.88 0.48 0.48 100
19 39.11 33.47 15.73 5.24 6.45 0 0 100
20 28.72 33.85 19.49 11.79 6.15 0 0 100
21 25.62 29.75 31.4 6.61 3.31 1.65 1.65 100
22 25.53 37.04 19.96 11.32 3.26 1.73 1.15 100
23 41.59 39.66 11.06 4.81 0.48 0.48 1.92 100
24 25.74 50.37 11.76 6.99 2.21 2.21 0.74 100
25 44.09 24.73 21.51 1.08 3.23 2.15 3.23 100
26 39.41 50.67 8.04 0.8 0 0.54 0,54 100
27 34.88 48.84 11.63 2.33 2.33 0 0 100
28 15.9 48.72 23.59 5.38 6.41 0 0 100
29 33.33 39.37 18.11 5.25 3.41 0 0.52 100
30 26.12 22.54 23.88 14.51 6.47 4.24 2.23 100
31 27.37 32.45 22.74 7.95 4.19 3.53 1.77 100
32 28.81 34.14 25.91 9.69 1.45 0 0 100
33 34.39 28.6 23.51 7.89 3.51 1.05 1.05 100
34 17.6 32.36 29.33 12.02 7.47 0.85 0.38 100
35 37.66 42.77 8.51 2.98 5.53 2.13 0.43 100
36 34.11 36.07 19.14 3.52 6.64 0.26 0.26 100
37 52.08 36.81 8.33 2.08 0.69 0 0 100
38 57.62 26.02 6.69 3.72 5.95 0 0 100
39 16.7 30.22 28.23 12.72 11.33 0 0.8 100
40 18.46 40.43 21.29 14.02 4.72 1.08 0 100
41 17.66 18.42 29.68 16.74 13.24 2.44 1.83 100
42 29 31.79 13.23 11.37 10.44 3.48 0.7 100

Jabalpur Transport Sector CMP Under JNNURM
Municipal Corporation, Jabalpur R-1
97
Zone
Number
Trip Length (Km.) Total
>0& >1& >3& >5& >7& >10& >15
43 25.43 39.66 15.73 4.31 8.19 6.03 0.65 100
44 24.92 29.07 20.29 11.18 9.74 4.15 0.64 100
45 22.44 42.93 19.51 3.9 8.29 0.98 1.95 100
46 50.37 37.9 5.87 3.42 1.96 0.49 0 100
47 53.66 23.17 10.16 8.13 1.63 3.25 0 100
48 26.44 40.8 22.99 4.02 4.6 1.15 0 100
49 31.77 33.57 12.64 9.03 6.68 6.32 0 100
50 23.31 41.55 26.35 3.38 3.38 1.35 0.68 100
51 19.24 33.02 10.21 15.68 9.74 10.45 1.66 100
52 28.09 28.79 18.4 12.08 9.27 1.83 1.54 100
53 18.65 44.56 15.54 10.36 5.7 3.11 0.07 100
54 53.24 28.65 10 2.7 3.78 1.62 0 100
55 38.02 42.15 14.46 2.48 1.24 0.83 0.83 100
56 19.39 38.27 18.11 15.56 3.06 3.32 2.3 100
57 19.96 33.41 19.09 14.75 7.59 5.21 0 100
58 5.87 42.52 23.46 12.61 8.21 2.35 4.99 100
59 30.5 36.64 14.89 9.46 5.44 2.84 0.24 100
60 47.81 15.15 7.07 15.15 8.08 3.37 3.37 100
61 35.78 24.51 17.65 7.84 5.39 7.35 1.47 100
62 31.62 43.38 12.5 8.09 1.47 1.47 1.47 100
63 33.78 49.32 10.81 1.35 3.38 1.35 0 100
64 20.69 24.14 13.79 13.79 13.79 6.9 6.9 100
65 42.47 16.44 21.92 2.74 10.96 5.48 0 100
66 27.45 51.96 15.69 2.94 0.98 0.98 0 100
67 42.86 51.43 2.86 2.86 0 0 0 100
68 28.81 49.15 8.47 8.47 5.08 0 0 100
69 33.03 39.04 14.71 8.11 4.5 0.6 0 100
70 0 0 0 0 0 0 0 0
71 3.89 37.03 19.45 12.25 6.92 7.78 12.68 100
72 46.67 26.67 6.67 0 0 6.67 13.33 100
73 22.73 9.09 11.36 20.45 0 31.82 4.55 100
74 20 32 8 4 12 8 16 100
75 21.43 17.86 3.57 0 7.14 25 25 100
76 75 0 0 0 0 25 0 100
77 10 0 40 20 20 10 0 100

Jabalpur Transport Sector CMP Under JNNURM
Municipal Corporation, Jabalpur R-1
98
Zone
Number
Trip Length (Km.) Total
>0& >1& >3& >5& >7& >10& >15
78 61.11 22.22 16.67 0 0 0 0 100
79 50 26 10 2 8 2 2 100
80 0 0 0 0 0 0 0 0
81 41.67 16.67 0 8.33 33.33 0 0 100
82 56.52 26.09 4.35 0 13.04 0 0 100
83 0 0 100 0 0 0 0 100
84 38.3 41.49 8.51 2.13 7.45 0 2.13 100
85 13.33 20 20 15.56 22.22 8.89 0 100
86 43.59 8.55 35.9 6.84 3.42 0 1.71 100
87 27.12 33.9 3.39 15.25 13.56 3.39 3.39 100
88 39.84 42.28 8.94 3.25 4.07 1.63 0 100
89 33.33 25 8.33 0 8.33 20.83 4.17 100
90 0 7.14 0 0 0 42.86 0 100
91 71.79 15.38 5.13 5.13 2.56 0 0 100
92 24.7 40.08 17.41 7.69 8.5 1.62 0 100
93 60.71 18.75 11.61 6.25 2.68 0 0 100
94 22.45 48.98 8.16 12.24 4.08 4.08 0 100
95 25 37.5 0 12.5 25 0 0 100
96 31.31 22.22 15.15 10.1 6.06 8.08 7.07 100
97 0 0 100 0 0 0 0 100
98 16.67 0 0 16.67 16.67 0 50 100
99 0 0 0 0 0 0 0 0
100 37.5 50 0 12.5 0 0 0 100
101 25 15 35 10 10 0 5 100
102 12.58 57.23 9.43 2.52 5.03 11.95 1.26 100
Study 28.87 35 18.06 8.27 5.85 2.48 1.46 100
7.7 Trip Rates :
Table 7.25 presents the per capita trip rates, vehicular and including walk, at zonal level. The overall
PCTR varies from 2.73 to 0.36 with an overall average of 1.57. Similarly the vehicular PCTR varies
from 2.18 to 0.19 against an overall average of 1.0.

Jabalpur Transport Sector CMP Under JNNURM
Municipal Corporation, Jabalpur R-1
99
Table 7.25 Zonal Travel Characteristics
Zone
Number
PCTR
(Including Walk)
Vehicular
PCTR 1 1.59 1.12
2 1.26 0.93
3 2.11 1.18
4 1.65 0.96
5 1.89 0.70
6 1.83 1.49
7 1.20 0.85
8 1.46 1.00
9 1.95 1.03
10 1.26 0.80
11 2.36 1.81
12 2.35 1.79
13 1.64 1.14
14 2.02 1.60
15 1.57 0.80
16 1.71 0.87
17 1.24 0.95
18 2.01 1.34
19 1.35 0.74
20 2.10 1.58
21 1.73 1.19
22 1.75 1.23
23 1.48 0.53
24 1.46 0.53
25 1.13 0.53
26 1.67 0.57
27 1.18 0.40
28 1.19 0.51
29 1.82 1.25
30 1.11 0.71
31 1.50 1.07
32 1.54 1.09
33 2.00 1.31
34 2.03 1.52
35 1.77 0.80
36 1.93 1.21
37 1.40 0.57
38 1.71 0.42

Jabalpur Transport Sector CMP Under JNNURM
Municipal Corporation, Jabalpur R-1
100
Zone
Number
PCTR
(Including Walk)
Vehicular
PCTR 39 2.26 1.75
40 1.64 1.17
41 2.68 2.18
42 1.33 0.79
43 1.16 0.60
44 1.90 1.44
45 1.42 0.99
46 1.73 1.03
47 2.34 1.24
48 1.76 1.37
49 2.12 1.43
50 1.79 1.10
51 1.64 1.16
52 2.73 1.96
53 1.65 0.97
54 1.73 0.88
55 1.07 0.58
56 1.41 1.00
57 1.61 0.59
58 2.01 1.67
59 1.32 0.60
60 0.97 0.45
61 1.00 0.51
62 0.84 0.37
63 1.44 0.73
64 0.84 0.64
65 0.92 0.59
66 1.22 0.89
67 1.84 0.79
68 1.69 1.06
69 1.40 1.05
70 0 0.0
71 1.41 1.35
72 1.43 0.38
73 1.22 0.78
74 0.91 0.58
75 1.27 0.82
76 1.14 0.29
77 1.25 0.75

Jabalpur Transport Sector CMP Under JNNURM
Municipal Corporation, Jabalpur R-1
101
Zone
Number
PCTR
(Including Walk)
Vehicular
PCTR 78 1.24 0.21
79 1.25 0.48
80 0 0.0
81 1.04 0.52
82 1.07 0.37
83 0.36 0.36
84 1.16 0.57
85 1.18 0.92
86 1.26 0.73
87 1.13 0.60
88 1.11 0.64
89 0.74 0.35
90 1.17 0.50
91 1.15 0.24
92 0.86 0.73
93 1.13 0.40
94 1.23 0.98
95 0.73 0.45
96 1.18 0.82
97 1.56 1.56
98 0.67 0.67
99 0 0.00
100 1.00 0.19
101 1.05 0.68
102 1.09 0.84
Study Area 1.57 1.00

Jabalpur Transport Sector CMP Under JNNURM
Municipal Corporation, Jabalpur R-1
102
7.8 Comparative Analysis of Urban Transport Environment:
Sl.No. Index Description Average
Value
Data Source
1. Congestion Average travel speed/30 0.63 Road Inventory
Survey
2. Walkability (Footpath length/Length of major roads in
the city)x0.5+(rate estimated based on
estimated of available pedestrian
facilities)x0.5
0.00 Road
Infrastructure
Survey
3. City Bus
Transport
Number of public and private city buses per
100,000 people
6.46 Public transport
Survey
4. Safety (Number of annual traffic accident death
per 100,000 people)x0.5+(number of
fatalities per 100,000 people)x0.5
56.9 Traffic Safety
Survey
5. Paratransit Number of paratransit vehicles per 100,000
people
266.77 Intermediate
Public Transport
Survey
6. Slow Moving
Vehicles
Slow moving vehicle share in total trips 0.80 Intermediate
Public Transport
Survey
7. Trip
Distribution
Average trip length(Km) 3.62 O-D Survey
8.
N.M.Vs Number of NMVsper 100,000 people
242.52 Socio-economic
Survey
9. Passenger
Vehicle
Number of Passenger Vehicles per
100,000 people
303.15 Vehicle
Ownership
Survey

Jabalpur Transport Sector CMP Under JNNURM
Municipal Corporation, Jabalpur R-1
103
CHAPTER - 8
TRAVEL DEMAND MODELLING AND FORECASTING
8.1 Model Framework
The goal of trip generation analysis is to establish an adequate functional relationship between trip
end volumes and the land use and socio-economic characteristics of the units from which they
originate or to which they are destined.
The desired end product in trip generation analysis is an accurate identification and quantification of
trips beginning and ending in the various analysis units within a transportation study area.
The three main methods, which explicitly attempt to capture the land-use travel relationship, are:
I. Trip Rate Analysis
II. Cross Classification Analysis
III. Multiple Linear" Regression Analysis
Of all the three methods, the Consultants have adopted the use of multiple Linear Regression
analysis for the present study. In this method, the choice of independent variables becomes critical.
Overall in developing a multiple linear regression model the following considerations have been kept
in mind by the Consultants:
I. Identification of those independent variables which have significant and separate effects on trip
generation
II. Model must not only provide good statistical fit to present-day data but also be of logical and
Meaningful form.
III. Variables must be capable in explaining trip-making behavior.
IV. Variables must be capable for being estimated for future years.
In order that future travel demand is scientifically estimated, it is important that the base year travel
demand characteristics are clearly captured in a mathematical model and are statistically calibrated.
Table presents the data input for developing trip generation models.
Table 8.1 Zonal Data Input for Trip Generation Models
Zone
Number
Projected
Population in
Thousands
(2013)
(X)
Observed Trip
Productions in
Hundreds (Y)
Projected
Employment in
Thousands (2013)
( P )
Observed Trip
Attractions in
Hundreds
(Q)
1 11.77 2.00 6.39 2.75
2 14.22 2.10 8.06 3.79
3 14.72 2.10 5.74 2.93
4 9.25 1.10 3.77 2.08
5 16.02 3.00 3.01 1.78
6 9.44 2.00 3.70 2.33
7 11.03 2.00 2.06 1.38
8 11.80 2.00 3.34 2.37
9 9.71 2.00 3.09 2.32
10 17.66 4.00 1.68 1.32

Jabalpur Transport Sector CMP Under JNNURM
Municipal Corporation, Jabalpur R-1
104
Zone
Number
Projected
Population in
Thousands
(2013)
(X)
Observed Trip
Productions in
Hundreds (Y)
Projected
Employment in
Thousands (2013)
( P )
Observed Trip
Attractions in
Hundreds
(Q)
11 20.48 5.00 4.95 4.11
12 34.92 8.00 6.69 5.82
13 9.68 2.00 2.05 1.87
14 9.13 2.00 3.04 2.89
15 9.40 3.00 1.59 1.58
16 12.29 3.00 3.09 3.18
17 13.58 4.00 4.20 4.49
18 12.74 4.00 8.24 9.14
19 9.71 3.00 4.38 5.03
20 9.26 3.00 2.03 2.42
21 8.10 3.00 4.07 5.01
22 15.47 5.00 5.28 6.71
23 26.97 9.00 6.14 8.04
24 16.27 6.00 5.91 7.98
25 11.69 4.00 6.30 8.76
26 14.41 5.00 5.56 7.96
27 14.82 6.00 7.48 11.00
28 12.84 5.00 7.40 11.18
29 12.89 5.00 4.44 6.87
30 14.07 6.00 9.38 14.92
31 14.09 6.00 6.42 10.46
32 11.15 5.00 7.14 11.93
33 16.06 7.00 7.17 12.18
34 34.88 15.00 11.71 20.38
35 23.87 11.00 6.16 10.97
36 26.79 12.00 12.71 23.14
37 14.85 7.00 6.10 11.35
38 19.77 10.00 5.24 9.95
39 23.28 12.00 6.25 12.13
40 25.45 13.00 9.68 19.17
41 16.18 8.00 5.11 10.33
42 23.54 12.00 7.97 16.42
43 19.38 10.00 9.36 19.65
44 17.60 10.00 9.00 19.27
45 20.66 12.00 11.10 24.21

Jabalpur Transport Sector CMP Under JNNURM
Municipal Corporation, Jabalpur R-1
105
Zone
Number
Projected
Population in
Thousands
(2013)
(X)
Observed Trip
Productions in
Hundreds (Y)
Projected
Employment in
Thousands (2013)
( P )
Observed Trip
Attractions in
Hundreds
(Q)
46 12.68 7.00 4.25 9.44
47 12.93 7.00 5.67 12.81
48 19.34 11.00 2.85 6.56
49 30.46 18.00 6.25 14.63
50 16.55 10.00 3.72 8.86
51 20.40 13.00 7.39 17.88
52 18.36 12.00 6.41 15.77
53 14.74 9.00 2.86 7.14
54 15.16 10.00 4.06 10.30
55 24.81 16.00 4.98 12.86
56 17.97 12.00 6.22 16.30
57 23.51 16.00 7.71 20.51
58 27.11 19.00 3.75 10.12
59 22.21 16.00 7.70 21.11
60 22.36 16.00 8.29 23.05
61 16.89 12.00 5.34 15.06
62 11.06 8.00 3.65 10.44
63 6.44 5.00 2.04 5.92
64 5.87 4.00 2.03 5.98
65 5.78 4.00 2.47 7.35
66 16.69 13.00 3.41 10.31
67 4.94 4.00 1.11 3.38
68 4.94 4.00 1.33 4.14
69 20.19 16.00 7.67 24.20
70 0.00 0.00 0.00 0.00
71 25.19 21.00 8.33 26.94
72 1.97 2.00 0.71 2.33
73 3.08 3.00 0.85 2.82
74 1.68 1.00 0.79 2.64
75 1.63 1.00 0.31 1.05
76 0.94 1.00 0.25 0.85
77 0.97 1.00 0.32 1.09
78 1.89 2.00 0.53 1.85
79 5.04 5.00 2.59 9.21
80 0.00 0.00 0.00 0.00

Jabalpur Transport Sector CMP Under JNNURM
Municipal Corporation, Jabalpur R-1
106
Zone
Number
Projected
Population in
Thousands
(2013)
(X)
Observed Trip
Productions in
Hundreds (Y)
Projected
Employment in
Thousands (2013)
( P )
Observed Trip
Attractions in
Hundreds
(Q)
81 1.61 2.00 0.51 1.84
82 1.51 1.00 0.42 1.55
83 0.82 1.00 0.07 0.25
84 3.47 3.00 1.18 4.44
85 1.22 1.00 0.42 1.59
86 6.70 7.00 1.94 7.43
87 2.50 2.00 0.68 2.64
88 7.49 8.00 2.39 9.36
89 3.48 4.00 0.90 3.58
90 0.60 1.00 0.00 0.00
91 3.54 4.00 0.89 3.58
92 19.12 20.00 4.82 19.64
93 8.83 9.00 2.48 10.19
94 16.13 17.00 4.86 20.19
95 2.66 3.00 0.56 2.35
96 7.29 8.00 1.68 7.13
97 2.75 3.00 0.31 1.34
98 0.27 0.00 0.16 0.67
99 0.00 0.00 0.00 0.00
100 0.00 0.00 0.24 1.07
101 3.15 4.00 0.40 1.77
102 7.81 9.00 3.08 13.77
Total 1250.10 669.00 418.03 840.79
Number of zones (n) = 102
TRIP GENERATION MODEL FOR THE STUDY AREA
Regression Coefficient (b1) = 0.443
Regression Constant (b0) = 1.599
There fore the Trip Generation Model is Y = 1.599 + 0.443* X
Co relation Coefficient (r) = 0.82
TRIP ATTRACTION MODEL FOR THE STUDY AREA
Regression Coefficient (b1) = 1.651
Regression Constant (b0) = 2.057
There fore the Trip Attraction Model is Q = 2.057 + 1.651* P
Co relation Coefficient (r) = 0.84

Jabalpur Transport Sector CMP Under JNNURM
Municipal Corporation, Jabalpur R-1
107
8.2 Trip Production
Zonal Regression method has been adopted to develop trip production equations for the study area.
The explanatory variables at the zonal level considered to construct the model are population,
workers, income and zonal number of students. Of all the variables, the best-fit equation was
achieved taking zonal population as the independent variable since zonal population can be
forecasted with reasonable accuracy while there is uncertainty about forecasting other variables at
the zonal level for the horizon year. The Trip Production step was carried out at four different spatial
levels Le Corporation, Cantonment and VFJ/GCF/OFK clubbed together to form one spatial level,
villages and the overall study area. The statistically significant equations for the different areas
obtained by regression method.

Jabalpur Transport Sector CMP Under JNNURM
Municipal Corporation, Jabalpur R-1
108
CHATER 9.0
ISSUES, CONSTRAINTS AND POTENTIAL
9.1 General
A number of issues have been identified by the Consultants based on an in-depth analysis of the data
collected on transport system, traffic & travel characteristics
9.2 Issues
9.2.1 Road Network
In spite of a dense road network, the study area has been experiencing acute traffic congestion and
its associated problems. Some of the outstanding problems relating to the road network are:
i. Absence of functional hierarchy of road network as a result of which there is a intermixing up of local
traffic and long distance traffic besides overloading of some major roads. The problem gets
compounded with absence of service areas.
ii. Narrow road network with restricted capacity particularly in the central area resulting in congestion
and loss of productivity.
iii. Absence of development controls along the major arterial routes resulting in proliferation of
commercial activities which is affecting the level of service of the Corridor.
iv. Lack of access control particularly along arterial roads leading to Poor operating speeds on the
network.
v. Absence of control on encroachment activities along roads, particularly in the central area, resulting in
loss of capacity for traffic and pedestrian movement.
vi. Poor road surface quality and absence of provision of essential street furniture elements.
vii. Poorly designed intersections along major arterial corridors coupled with inadequate machinery for its
management and control.
viii. Lack of adequate facilities for vegetable & flower markets has resulted in hawkers encroaching
precious road space.
ix. Severe congestion is experienced at the level crossings.
9.2.2 Parking
Parking is a serious issue in the study area and its management needs topmost priority. Some of the

Jabalpur Transport Sector CMP Under JNNURM
Municipal Corporation, Jabalpur R-1
109
significant problems associated with parking are:
i. Parking demand is high particularly in central area primarily due to concentrated commercial activities
and needs special attention
ii. There is an absence of adequate off-street parking facilities as a result of which parkers are forced to
park their vehicles on the streets.
iii. On-street parking phenomena reduce the effective road width available for movement of traffic.
iv. There is an absence of a comprehensive parking policy for the study area, involving components such
as organization of circulation system and on-street parking, identification of possible off-street parking
sites, intensive utilization of existing parking areas including air rights exploitation, levy of parking fee,
municipalisation of parking spaces, parking norms and standards and travel demand management
measures.
9.2.3 Public Transport System
The major issues relating to the public transport system in the study area are:
i. The present public transport system comprises of mini-buses & Tempo (shared) Absence of a proper
public transport system with well planned routes and schedules has led to mushrooming of Para
transit, which operate on an ad-hoc schedule.
ii. The existing public transport infrastructure in terms of stops, depots, terminals/stands, vehicles etc. is
sadly lacking and whatever exists on city roads is grossly inadequate' and is not aesthetically
pleasing.
iii. There is an absence of well-coordinated public transport development policy which can check the
inequities in provision of public transport and which can guide the future development pattern of the
city.
While IPTs are sharing a reasonable share of travel demand in Jabalpur, there is very little
understanding of their role, potential and constraints. Some of the issues are:
i. There is little effort to plan for their rational development & growth.
ii. There is an inherent bias against them.
iii. They are highly disorganised, poorly equipped and iII-informed.
iv. There is poor understanding of their characteristics, contributions and problems.
v. They suffer from technological obsolescence.
In the context of growing travel demand in Jabalpur, the multi-dimensions of trips performed and the
constraints on public resources, it is important to recognise the role of Para transit and incorporate
them in the planning and development process.

Jabalpur Transport Sector CMP Under JNNURM
Municipal Corporation, Jabalpur R-1
110
9.2.4 Terminals
Railway Station
The present Railway Station an account of its location and function , its discharge has become an
area of congestion. All the roads approaching the railway station are encroached by Shopkeepers,
hawkers and parked vehicles. Entry to railway station from city side is congested & there is no
provision of parking of private vehicles.
Bus Terminals
The entry/exist of Damoh Naka bus terminal creates problems, The facilities within the Bus Terminals
in terms of bays, idle parking, administrative area, boarding alighting platforms and circulation are
inadequate and there is a total lack of terminal planning principles and design criteria in the
development and operation of terminal complexes.
9.3 Constraints
Presence of Cantonment area in the middle of Jabalpur Planning Area acts as barrier to the
development of eastern part of the city comprising Umariya, Bhita, Suklalpur, Chakdehi, umna
(Aerodrome area) etc.
9.4 Potential
Having identified issues, the Consultants have identified potentials of the transport infrastructure to
alleviate some of the problems of the city. These are:
i. The city has excellent connectivity with its region offering tremendous growth opportunities for its
development.
ii. NH-7 is an important corridor for future travel needs of the city. It has the potential to align the
medium capacity light rail transit system along it.
iii. The railway Line from Allahabad (north) to Itarsi (west) & Gonda (south) offers great potential to run
urban rail transit system provided R/W is available.
The city has a number of bus terminals/stands sites which though intensive and multi use could be
commercially exploited to finance its redevelopment and expansion programme
9.5 Issues in Urban Transport in Jabalpur
The city lacks a well-developed organized public transport system that can effectively canter to the
mobility needs of the city dwellers and promote desirable urban from/structure and direction of growth
to the city. The present public transport system comprises of tempos and minibuses, which are highly
unorganized. Selection and introduction of appropriate technology, with proper routing and scheduling
is extremely vital to meet the future travel demand of the city.
The city road network system lacks functional hierarchy. The central area road network has
restricted capacity due to high concentration of commercial activities encroachment by hawkers
number of uncontrolled intersections affect the smooth' operation of traffic. Peripheral area, on the
other hand, has inadequate road network system, although most of the new developments are spread
along these radials. This situation has resulted in traffic congestion on the city road network system.
Presence of Cantonment area in the middle of Jabalpur Planning Area acts as a barrier to the
development of eastern part of the city comprising Umariya, Shita, Sukhlalpur, Chakdehi, Dumna
(Aerodrome area) etc. A good road network system connecting these areas, without affecting the

Jabalpur Transport Sector CMP Under JNNURM
Municipal Corporation, Jabalpur R-1
111
Cantonment security, is essential to encourage overall development in this area.
Parking, particularly within the central, area, needs special attention. There are limited organized on
and off-street parking facilities in the city. Available parking facilities are not sufficient to meet the
demand and this has led to chaotic situation in the city. As a result, vehicles are parked irregularly,
occupying footpaths and precious road space, thereby reducing effective road space for traffic
movement.
Poor intersection geometries, absence of channelizers, lack of control and poor sense among road
users have resulted in chaotic situations at the intersections. Most of the roads in the central area
experience congestion due to encroachments and commercial activities. Lack of adequate facilities
for vegetables and flower markets have resulted in hawkers occupying the precious road space.

Jabalpur Transport Sector CMP Under JNNURM
Municipal Corporation, Jabalpur R-1
112
PART - II
DEVELOPMENT OF URBAN LAND USE
AND TRANSPORT STRATEGY

Jabalpur Transport Sector CMP Under JNNURM
Municipal Corporation, Jabalpur R-1
113
CHAPTER –10
DEVELOPMENT OF VISION AND GOALS
10.1 Integrated Planning:
For the success & sustainability of any development work it is very essential to make integrated
planning with respect to study, design & implementation.
To achieve the above goal, Jabalpur Development Plan 1991, was prepared in 1975 by TCPD. After
that TCPD under took an exercise in 1994-95 for extended planning horizon of 2005 as already
discussed in chapter 3.
10.2 CHALLENGES AND OPPORTUNITIES
Long-range transportation decisions need to be made with a clear understanding of the cost of our
choices and how to pay for them. In developing the Mobility Plan, we must assess current funding
challenges and opportunities, future needs and revenues, and options for closing any financial gaps.
10.2.1 What are the current challenges?
(i) Sustainability of the fuel tax:
For nearly a century, the fuel tax has been the primary means of funding the construction and
maintenance of our roadway system, both at the federal and state levels. However, the increasing
numbers of fuel-efficient and alterative fuel vehicles, combined with the effects of inflation on per-
gallon fuel taxes, continue to erode the purchasing power of fuel tax revenue.
(ii) Model funding:
Currently, the state constitution, which was established when Jabalpur essentially functioned as a
highway department, prohibits the use of motor fuels tax revenue for modes other than highways.
However, sharing funds among modes should be considered when it can improve the overall
multimodal transportation system.
Lack of dedicated funding for some modes: Currently, the largest share of funding for Pennsylvania
public transportation, for example, comes from the state, through Pennsylvania's General and Lottery
Funds. In today's environment of fiscal constraint and cost-cutting, public transportation operates
with a great deal of uncertainty, as it must compete with other critical programs such as education
and social services for funding.
10.2.2 What are the current opportunities and options?
It has been deeply evaluated in Jabalpur to fund and finance transportation. Recent advances in
technology, such as electronic toll collection and smart-card technologies have eliminated many of
the barriers that have historically prohibited certain funding strategies. In addition, over the last
decade, many innovative funding and finance techniques have been tested in the U.S. and abroad,
so we have opportunity to benefit from these.
Today's challenging transportation funding and finance environment proposed to:
• Create adequate and predictable funding sources for all transportation modes.
• Permit funds to be co-mingled among modes when investments across modes offer significant
benefits.
• Empower groups & individuals that want to invest more in transportation to do so through local taxes.
• Create mechanisms to permit private sector involvement in the funding and financing of projects.
Jabalpur Transport Sector CMP Under JNNURM
Municipal Corporation, Jabalpur R-1
114
• Create innovative funding and finance options to enable local and regional transportation
organizations to better capitalize on their investments.
10.2.3 Vision, Goals and Objective
This comprehensive mobility plan in Jabalpur is aimed at providing the best performing transportation
system for people, business and places and is developed in following layers.
VISION: Broad, overarching theme that underlies all advancements of the comprehensive Mobility
Plan.
GOALS: General statements of direction for the entire transportation system.
OBJECTIVES: Specific outcomes to achieve under each goal.
STRATEGIES: Specific programs, initiatives, or policies to achieve the stated objectives.
ACTIONS: Major tasks or steps required implementing strategies.
Provision for periodical update and maintenance of CMP. The internal for periodic update is
maintenance of CMP has been proposed in terms of three time intervals.
(i) 10 years
(ii) 15 years
(iii) 25 years
10.3 URBAN TRANSPORT DEVELOPMENT STRATEGIES
10.3.1 Move people and goods safely and securly.
The general public, stakeholders, local authorities and elected representatives all together agreed
that safety and security are the leading priorities for Jabalpur's transportation system. Enhancing
safety and security is the foremost goal of the comprehensive Mobility Plan.
A safe and secure system will surly balance the expectations of travelers are safety with the need to
move about without major delays and inconvenience. To this end, it will focus on maintaining safe
and continuous operation of the vital links of Jabalpur's communities and businesses required for
both normal daily activities and extraordinary situations, such as natural or man-made events. This
goal will be advanced through a combination of design, operations, and maintenance enhancements;
appropriate use of technology; education; and strategic planning to secure critical facilities and
ensure their uninterrupted operation.
Objectives:
1. Reduce the number of fatalities and crashes.
2. Ensure the uninterrupted operation of vital transportation services.
3. Direct resources to support economic and community development.
4. Integrate land use and transportation.
5. Preserve natural, historical, and cultural resources.
6. Promote energy conservation.
Strategies:
I. Implement this Comprehensive Mobility Plan in totality.
II. Improve the security of high-risk transportation facilities.
III. Development of comprehensive and coordinated plans and procedures for emergency

Jabalpur Transport Sector CMP Under JNNURM
Municipal Corporation, Jabalpur R-1
115
response and recovery.
IV. Support economic development by leveraging transportation investments.
V. Assign a higher priority to transportation investments that yield economic development, land
use, environmental stewardship, and public safety outcomes.
VI. Promote efficient land use through transportation investment and supporting policies.
VII. Accelerate "Smart Transportation" initiatives to implement projects at an appropriate scale
and improve transportation's compatibility with its surrounding environment.
10.3.2 Improve quality of life by linking transportation, land use, economic development, and
environmental stewardship.
This Mobility Plan envisions a transportation system for Jabalpur where resources for all modes are
better aligned with economic and community development needs; where our natural, historical, and
cultural assets are preserved and our mobility options are implemented while respecting resource
conservation.
Emphasis has been made so that transportation investments are balanced with other considerations
to truly enhance quality of life. For example, in many areas of the state, construction of new high
capacity highways has made it possible for people to move farther and farther from their workplaces.
This cycle of increased miles traveled generates more congestion and pollution and further threatens
our rural landscapes and farmland.
10.3.3 Develop and sustain quality transportation infrastructure.
Preserving our existing multimodal system and building new infrastructure to last has been affirmed
by MCJ leadership, stakeholders, and the public as a preferred direction for Jabalpur. Through this
goal, the Mobility Plan places a priority on that approach.
Jabalpur's transportation system is one of the states oldest and most extensive, representing crores
of rupees of public and private investment over decades.
With a significant portion of Jabalpur's transportation infrastructure, which is more than 40 years old,
most of it is in need of maintenance and repair. More then half of all roadway miles are rated in poor
or fair condition, and almost one quarter of MCJ-owned bridges are structurally week. Under
passages are low and narrow considering the shortfall in funding for transportation in Jabalpur, MCJ
recognizes the need for investing and preserving the existing system before expanding its capacity.
Objectives:
1. Advance a program to achieve desired maintenance cycles.
2. Accelerate the use of innovative construction techniques, better materials, and improved
maintenance practices.
Strategies:
I. Collaborate with regional planning partners and other stakeholders to Improve investment
decisionmaking using asset condition data.
II. Expand and accelerate the implementation of cost-effective products and practices.
10.3.4 Provide mobility for people, goods, and commerce.
Enhancing mobility the ability to easily move people or goods from one place to another is the core
mission of any transportation system. The Mobility Plan vision is to balance and satisfy mobility

Jabalpur Transport Sector CMP Under JNNURM
Municipal Corporation, Jabalpur R-1
116
needs, ranging from the travel of our physically challenged citizens to that of moving goods within and
through the City.
Transportation in Jabalpur is heavily influenced by several social and economic factors. These include
a rapid increase in the population, a high rate of land consumption, the transition from a
manufacturing to a service economy, growth in truck freight, and the limited funds available to
maintain Jabalpur's transportation infrastructures.
Overcoming these challenges and facilitating the efficient movement of people and goods is vital to
our economy and quality of life. Jabalpur can improve both through a range of public and private
initiatives, including expanded and strategically targeted transportation investment.
Objectives:
1. Improve connectivity and accessibility throughout the transportation network.
2. Improve transportation system operating efficiency.
3. Improve transportation system reliability.
Strategies:
I. Expand cost-effective transportation options for whole Jabalpur's.
II. Invest in technologies that improve connectivity.
III. Implement RTS Operations Plan to reduce congestion while improving safety.
IV. Explore distance-based and value-pricing initiatives for demand management.
V. Expand transportation system management knowledge, skills, and applications among
transportation professionals.
VI. Encouraging private participation in public Transport system.
VII. Identify and correct reliability deficiencies throughout the transportation system.
10.4 Strategies for Urban Transport
Strategies to meet the urban travel demand cannot succeed without the fullest cooperation of the
general public. Such cooperation is best secured if the objective of any initiative is made clearly
known to them so that they are able to appreciate the likely benefits of certain travel choices or
sacrifices that they may have to make. Mechanisms for greater public participation in the city
specific initiatives, such as the Bhagidari scheme in Delhi, would help bring about greater public
cooperation and support. Intensive awareness campaigns that educate people on the ill effects of
urban traffic congestion, especially on their health and well being could be useful. Such
campaigns could also build in modules to encourage individuals, families and communities to
adopt ‘Green Travel Habits’ that would go a long way in making travel less polluting and
damaging.
10.4.1 Contain Travel Demand
The first step towards meeting future travel demand is obviously to aim at reducing the travel
demand itself through innovative means without compromising economic growth. As stated
earlier, travel demand is a function of the population, the per capita trip rate and the average trip
length. In a progressively urbanizing developing economy such as ours, there is little possibility of
reduction in the per capita trip rate. This is because a larger share of the population would be
securing employment (especially women) and a larger share of children would be attending
schools. Efforts at reducing travel demand have, therefore, to focus on reducing the average trip
length. The key to reducing trip lengths is through a proper integration of land use and transport

Jabalpur Transport Sector CMP Under JNNURM
Municipal Corporation, Jabalpur R-1
117
planning. Business and residential districts that are well interspersed entail shorter trip lengths as
compared to an urban form that has a single business district surrounded by sprawling residential
suburbs. Small, self-contained, clusters are considered desirable from a transport perspective, in
mega-cities, as people are expected to move to residences that are closer to their place of work,
or seek work closer to home. Hence, as a city expands, it would be desirable to channel the
growth in such a manner that it takes place around a number of self-contained clusters. It is
essential that the transport network guide the urban form, rather than the urban form guiding the
transport system. Land use planning would therefore require that transport corridors be
developed early so that new settlements come up around these corridors and not in a
haphazard manner.
10.4.2 Developing an Optimal Modal Mix
This requires an assessment of the likely travel patterns, segmented for different categories of city
residents and an identification of the modes that are the most sustainable. Mode share
projections, which do not include walking trips, show a high reliance on public transport and
cycling Further, survey-based studies carried out in Jabalpur show that while high income
households rely heavily on personal vehicles, the low income households rely more on non-
motorized modes. Walking constitutes a high share for both categories in Jabalpur followed by a
reliance on public transport (Table 7.13). Modal choices have to be made based on their relative
congestion impacts, emission characteristics and energy efficiency if they are to lead to
sustainable mobility. It is well known that non-motorized modes emit no pollutants and occupy
least amount of road space. Hence, they should be amongst the most preferred modes. However,
they are not suitable for trip lengths longer than 6 to 7 km in highly undulating terrains during hot
weather. In such a scenario, motorized modes become essential. Among motorized modes,
mentioned already, public transport occupies less road space, consumes less fuel and emits least
pollutants per passenger km of travel compared to personal motor vehicles. Hence, there is a
need to encourage preference for public transport over personal vehicles. Strategies that
channel travel demand towards these modes should adopt a preference for non-motorized modes
and public transport. These strategies would also lead to a more equitable allocation of road
space—being equitable to people rather than vehicles. Today, road space gets allocated
automatically to whichever vehicle occupies it first, regardless of how many people it carries. Thus
a big car with only one passenger gets the same allocation preference as a bus with 40 or more
passengers. Systems of road allocation that are able to differentiate between such vehicles need
to be put in place. Essentially efforts have to be aimed at containing the use of personal motor
vehicles for family outings during weekends and special/emergency requirements. Daily
commutes to work or school should be undertaken on more sustainable modes. A study carried
out by Consultant corroborates that while people who use cars are captive to that mode, people
who use two-wheelers are willing to shift to mass modes, if it is convenient to them .Use of
personal vehicles can be discouraged by making its use more expensive and difficult. This can be
achieved by a combination of fiscal and control measures. Examples of fiscal measures include
charging of a fee for using certain crowded parts of a city, levy of high parking fees, increasing
vehicle registration charges and by increasing the tax on fuel, etc. Examples of outright control
measures include physical restrictions on the use of personal vehicles on some corridors, limiting

Jabalpur Transport Sector CMP Under JNNURM
Municipal Corporation, Jabalpur R-1
118
the availability of parking space in city centres, limiting the availability of road space for personal
vehicles and restrictions on the ownership of vehicles, etc
10.4.3 Promoting the Use of Non-motorized Modes
Yet another strategy to reduce personal motor vehicle use is to promote the use of non-motorized
modes as they are ‘greener’ modes of travel. This can be done by investing in a segregated right
of way for bicycles and pedestrians, converting crowded areas like market places into no vehicle
zones, bringing about improvements in bicycle technology, providing safer parking facilities for
bicycles at work places and finally promoting cycling and walking as healthy and exciting
activities. Because cyclists and pedestrians are, on most roads, required to share the same right
of way with motorized modes, they are exposed to grave risks of accident. As already seen, road
accident data from Jabalpur (Table4.13) indicates that most of the road accident related fatalities
involve pedestrians and cyclists. Unfortunately, most roads in Jabalpur do not provide segregated
lanes for them. It has been seen that providing separate bicycle tracks has significant
advantages, including a more optimal use of the road space. Capacity estimations of a typical
arterial road in Jabalpur show improvement in corridor capacity by 19–23 per cent through
providing an exclusive bicycle track . If a high capacity bus lane is also added the road carrying
capacity can go up to the extent of 56–73 per cent. Simultaneously, all motor vehicles can
experience increased travel speeds as they are no longer constrained by slow moving vehicles.
Time saving to the extent of 48 per cent has been estimated for typical arterial roads in Jabalpur.
There are positive impacts on congestion with 80 per cent reduction in delays at intersections.
Safety benefits are estimated to translate into a 46 per cent reduction in accident costs with the
segregated facility reducing the risk of injury in accidents by 40 per cent and in fatality by 50 per
cent. Energy consumption and pollution also decrease because the motor vehicles have a
smoother flow. Estimations show that there is a 28 per cent reduction in fuel consumption and 29
per cent reduction in the health-related externalities of air pollution.
10.4.4 Reduce Emissions from Motor Vehicles
The strategy of reducing emissions from motor vehicles can be achieved by improving traffic flow,
vehicle technology, cleaner fuels, and by reducing emissions from in-use vehicles.
10.4.5 Improving traffic flow
Vehicles travelling at a steady speed emit fewer pollutants than a vehicle requiring frequent
starts and stops or spending considerable time in idling. Hence the focus of traffic flow
improvements is to enable a vehicle to move at a steady speed and reduce the incidence of starts
and stops. Among the biggest impediments to improved traffic flow in Jabalpur is the
heterogeneity of vehicles on the roads.
A host of traffic engineering measures exist that can be employed to smoothen traffic flow. Among
them are segregation of slow moving traffic from faster traffic (typically through separate tracks for
buses, cycles and pedestrians) scientific design of intersections, bus stops (so that they do not
obstruct traffic when they stop to pick up or drop passengers), flexilaning to allow flexibility in road
capacity during the morning and evening peaks, synchronization of traffic lights, etc. In addition,
traffic management measures like a network of oneway streets and staggering work hours would
Jabalpur Transport Sector CMP Under JNNURM
Municipal Corporation, Jabalpur R-1
119
also help in improving traffic flow. While the focus of attention is generally on passenger traffic,
Jabalpur also generate considerable amounts of freight traffic. Proper management of such
freight traffic can also contribute significantly to improving traffic flow. The measures include
specifying limited hours during which large commercial vehicles can enter city limits, constructing
truck terminals outside city limits, constructing city bypasses that can help in diverting through
traffic and shifting wholesale markets and establishments that are major origins and destinations
of freight traffic, to the outer fringes of the city.
10.4.6 Improving vehicle technology
Improving vehicle technology requires mandating the phased use of cleaner technologies and
laying down a clear and time bound action plan, with adequate lead-time, to allow the auto and oil
industry to make the required investments.
10.4.7 Use of cleaner fuels
Cleaner fuels could include both cleaner petroleum fuels and as well as alternate fuels. In respect
of petroleum fuels, issues to be addressed are the sulphur content and the content of other
pollutants .
10.4.8 Reducing emissions from in-use vehicles
Measures are also necessary to ensure that the vehicles being used currently are properly
maintained so that they do not become emissions and safety hazards. So far, these initiatives
have largely been directed at commercial vehicles, by way of not allowing those of a certain
vintage to operate on city roads or requiring them to be retrofitted to use cleaner alternative fuels.
Unfortunately, no initiatives have been taken with regard to personal vehicles. Besides, the Motor
Vehicles Act only requires commercial vehicles to undergo stringent testing at specified
periodicity. There is no requirement for any similar stringent testing of personal vehicles, except
for a periodic requirement of undergoing an exhaust emissions test, and this appears to be
necessary.
10.4.9 Improve Urban Public Transport
Several measures are necessary to bring about the required improvements in public transport. To
begin with a public transport system design, which can be developed within city constraints given
the city’s topography, time taken to develop the systems and improve accessibility to people
would be an ideal system.
10.4.10 System design
The design of an efficient and cost-effective public transport system is a complex task and several
system design parameters need to be kept in mind. A well-designed system is one that meets the
demand in a cost effective manner, without too much spare capacity or without too much
crowding. The following indicators can summarize optimality of a system:
• Least space consumption per passenger-km
• Least energy consumption per passenger-km
• Least emission per passenger-km
• Least accidents per passenger-km
The critical design parameters that need to be taken into account are:
• Line capacity, which is the number of people who can be transported per hour

Jabalpur Transport Sector CMP Under JNNURM
Municipal Corporation, Jabalpur R-1
120
• Speed, that is, the average speed of the system
• Cost, both capital and annual
• Construction time
• Ease of access
• Load factor, which is defined as the ratio of the number of actual users to available capacity. For
achieving low cost per passenger, the load factor should be close to one. Similarly for lower fuel
consumption and emissions per passenger, the actual number of users should be close to
capacity.
There is also a range of public transport technologies with different cost–capacity–route flexibility
characteristics. While bus systems on a shared right of way are the least expensive and the most
flexible, they offer the lowest carrying capacity. Dedicating lanes for such buses and using longer,
articulated buses can increase the capacity of the system. However, this increases costs and
limits route flexibility. At the other end are underground rail-based systems that offer very high
capacity but are very expensive and offer virtually no route flexibility. Thus, the choice of
technology involves trade-offs in terms of cost and capacity that should be carefully taken into
account in designing the public transport system. Any laxity in this can easily lead to a system that
is either inadequate or has used up resources in providing capacity that is not required Design of
a public transport system also requires a prior decision with regard to the type of city.
Geographical features like the availability of land, in turn, often determine city type. Highly dense
cities, that have severe land availability constraints, would have only one or a few city centres and
would require high capacity public transport systems. However, in medium density cities less
expensive bus-based systems would be adequate.
10.4.11 Accessibility
For a public transport system to be attractive, it is essential to improve access to its services. Safe
access is critical for those who have no other travel choices and safe as well as convenient
access is an important choice variable for those who do have other travel options and need to be
persuaded to use public transport. It is useful to lay down standards for accessibility in terms of
the distance within which public transport access points should be available. Typically such
distances should be in the range of 0.5 to 1 km in central areas and 1 to 2 km in outlying areas.
Such standards are useful for the design of public networks and routes. A cluster approach in
urban planning also makes it easier to provide better public transport coverage, as connecting
cluster centres is often adequate to meet public transport needs. Short, intra-cluster trips can
usually be performed by walking, cycling or para-transit. One idea that is becoming popular is that
of transit villages. Transit villages are essentially high-density residential or commercial centres
close to or on transit stations. They offer the advantage of easy access to public transport
services and thereby have the potential to make public transport usage more popular. The
development of such transit villages can be facilitated by sound policies regarding land allotment
and suitable incentives under the local municipal laws for land use. Permitting a higher Floor Area
Ratio (FAR) in such areas would attract investments in such property development and reduce
the cost of such property for owners. It is not always possible to cover all areas with public
transport. This necessitates the use of personal transport. However, it is possible to encourage
people to use public transport in the busy commercial centres and restrict the use of personal

Jabalpur Transport Sector CMP Under JNNURM
Municipal Corporation, Jabalpur R-1
121
vehicles to the outlying areas. This can be done by planned integration of public and personal
transport operations. Typically this calls for good parking facilities at public transit stations and
easy access to public transport from there. The park and ride facilities that exist in many
developed countries seek to achieve this. In the Indian context, such park and ride infrastructure
would need to focus on parking for two wheelers and bicycles more than cars. Similarly, there are
many commuters who use suburban systems. Good integration of the intra-city system with
suburban systems enhances access to public transport.
10.4.12 Premium services
It is also important to recognize that there is a large segment of personal vehicle users which
would prefer to use public transport, even at higher fares, provided the quality of service is
acceptable. These people are not willing to face crowds; they value travel comfort and time saved
in travelling. With rising income levels the size of this segment is growing. Typically these would
be the present users of two wheelers and second hand cars. In order to wean such commuters
away from using personal vehicles and towards public transport, it is essential to introduce a
range of premium services, at fares higher than the present but economical to targeted users.
Thus, express, air-conditioned bus services, using better quality buses, need to be introduced at
premium fares. Proper pricing of such services is essential to keep away crowds. These services
are not intended to meet the social obligation of offering affordable transport to the weaker
sections of society, but to meet an equally important obligation of reducing urban congestion and
air pollution. Such services would also help in improving the social image of bus travel.

Jabalpur Transport Sector CMP Under JNNURM
Municipal Corporation, Jabalpur R-1
122
CHAPTER 11.0
FUTURE URBAN DEVELOPMENT AND TRANSPORT NETWORK SCENARIOS
11.1 Road Network Scenarios
Regional Spatial Pattern
The Jabalpur Division comprises of eight districts namely Jabalpur, Kantni, Chindwada, Mandla,
Seoni, Dindori, Balaghat and Narsigpur. The city commands a large region within which are a number
of important towns such as Sihora, Damoh, Patan, Katni, Narsinghapur etc. Each of the towns has its
own functional specialization. The future development of Jabalpur needs to be viewed organized in a
regional development perspective.
The regional settlement development polity should enable promotion of a strong and sound economic
base, ensure optimum utilization of land recourse, promote functional specialization of different urban
centers, develop an efficient and capable regional transport and circulation system to direct growth
pattern, enable interactions and carry flows efficiently.
The regional transport system needs to be planned and developed under a Regional Transport Policy
framework. The main components of such a policy should to be:
* Promote the rational distribution of people and activities over the regional spatial through
improved accessibility.
* Accelerate the rate of growth of regional forms by increased accessibility and improved
connectivity.
* Enable decentralization of activities towns city to other regional towns.
• Enable regional movements which are through with reference to Jabalpur to disperse at
regional level and avoid congesting city road network.
11.1.1 Jabalpur Urban Development Scenarios and Strategies :
Based on the selected regional development pattern, the assigned size of Jabalpur city needs to be
accommodated within the city limits. A number of planning parameters have been identified which
need to be considered while evolving alternate urban development scenarios.
These parameters are:
* Population
* Economy
* Mobility
* Modal share and
* Transport System
With each parameter three different scenarios viz. pessimistic, conservative and optimistic have been
considered. Table shows various alternative scenarios evolved.

Jabalpur Transport Sector CMP Under JNNURM
Municipal Corporation, Jabalpur R-1
123
Table 11.1 Urban Development Strategies
Parameters Pessimistic Conservative Optimistic
Population Unabated Growth
Size (2031) : 17.38 Lakhs
Trend based Growth
Size (2031) : 13.37
Lakhs
Planned Dispersal
Growth Size (2031) :
13.55 Lakhs
Economy Decline in Existing
WFPR
WFPR : 30%
Present level in WFPR
to continue
WFPR : 31.4%
High Growth in WFPR
WFPR : 33%
Mobility Decline in Mobility levels
PCTR (veh): 0.70
Present Level in
mobility to continue
PCTR (veh) : 1.00
Higher Mobility levels
PCTR (veh) : 1.20
Modal Share Stagnant Public
Transport
Modal Share : 14.76%
Moderate Improvement
in public transport
Modal Share : 20%
Higher Share of Public
Transport Modal Share :
60%
Transport
System
Stagnant Road Network
System with deterioration
in LOS
Moderate Improvement
in Road Network
System, Maintenace of
existing LOS
Intense development of
Road Network system
with HCBS/LRT, High
LOS
11.1.2.1Planning Period
The planning period is taken as 20 years. The horizon year for all estimates and planning programme
will be 2033. The most acceptable scenario under each planning parameter is briefly described here
under:
11.1.2.2 Population Size
As noted earlier, the potential population size of Jabalpur city ranges between 13.75 lakhs and 16.28
lakhs. The population size will be finalized on an analysis of regional development pattern. The
probable size would be around 15.0 laks for the city and 19 lakhs for the study area as a whole.
11.1.2.3 Economic Base
The economic base of the city is important to sustain the growth of the city and maintain the standard
of living. Considering the regional importance of Jabalpur, a balanced mixed economic base
comprising industry, education, trade and commerce, administration and tourism will be appropriate.
The WFPR of Jabalpur in 1991 was 31.4%. The WFPR during the horizon year is expected to be
around 33%
11.1.2.4 Mobility
Presently as revealed by the Consultants household survey, the per capita trip rate (PCTR) of
Jabalpur is 1.47 including walk and 1.00 excluding walk. With economic development, higher vehicle
ownership, good public transport system and increased mobility the PCTR would increase. Future
travel demand estimates will be made by construction f travel demand models. In the interim a PCTR
of 1.20 (excluding walk) by 2021 is adopted to give indicative size of travel demand.

Jabalpur Transport Sector CMP Under JNNURM
Municipal Corporation, Jabalpur R-1
124
11.1.2.5 Modal Share
The modal share in favor of public transport (including para transit) in Jabalpur is a low of 14.76%. In
the context of resource conservation (land, energy,), sustained development and environmental
quality, it is necessary to improve the public transport share to a level of 30% to 40%. The study group
on Alternative System of Urban Transport, Set up by Planning Commission, Government of India
has recommended the desired modal share for city size. For a city of 1.5 m it is proposed to adopt a
modal share of 40% as per the study group recommendations.
11.1.2.6 Transport System
As of now the predominant travel modes are bicycles and two-wheelers while public transport
technology is conventional buses (standard and mini). However as the city grows and travel demand
increases it is necessary to identify more appropriate transport technology to service the city needs.
Amongst the myriads of available technologies, the Light Rail Transit System, on surface or elevated
tracks, along with high Capacity Bus System (HCBS) seems) to be most appropriate option for the
city.
11.1.3 Population Distribution Strategy
Three alternative strategies of population distribution have been proposed. The are
P1 : Brown field development Strategy
This strategy aims at the conservation of land accommodation of all future development under present
developed area primarily through redensification of existing development area. Further it is also
assumed that population increase shall follow the existing natural trend. Figure show the conceptual
diagram of Brownfield development.
Fig. 11.1 Brown Field Development Strategy Concept
P2: Green field Development Strategy
The strategy aims at extending the development into Greenfield areas to accommodate the additional
population and activities primarily through densification of middle and outer areas. Figure shows the
conceptual diagram of Greenfield development.

Jabalpur Transport Sector CMP Under JNNURM
Municipal Corporation, Jabalpur R-1
125
Fig. 11.2 Green Field Development Strategy Concept
P3: Corridor Development Strategy
This strategy aims to density area adjacent to the transport corridors. Accessibility and availability of
land in areas served by corridors is a major consideration in this strategy. Figure shows the
conceptual diagram of Corridor Development strategy.
11.1.4 Employment Distribution Strategy
The employment distribution strategies are closely related to the population distribution strategies.
The following three employment strategies are proposed:
E1 : Mono-Nucleus structure Strategy
In this strategy it is proposed that the employment opportunities will witness natural increase within
the existing activity centers without any deliberate intervention. Thus all additional employment would
get accommodated within the present activity node.
E2: Multi-Nuclei Structure (Twin-city) Strategy
In this strategy it is assumed that with planning intervention, new employment centres would get
developed. As part of this strategy, it is proposed to develop a new activity node in the northern side
between the NH-7 & the railway line to Katni. shows the proposed locations of the new activity node in
the twin city strategy.
E3: Multi-nuclei Structure (Tri-Centre) Strategy
In this strategy it is assumed that with planning intervention, new employment centres would get
developed at proposed activity nodes, namely:
i) in north between NH-7 and the railway line to Katni
ii) In west between NH-12 and the railway line to Narsingpur
11.1.5 Network Development Strategy
Three transport network strategies have been proposed. These are:
Nl: Development of Road Network
In this strategy a concept of Grid-in-Grid road network has been proposed as part of which a bypass
on the eastern side of the city is proposed, this concept would facilitate movement of non-destined

Jabalpur Transport Sector CMP Under JNNURM
Municipal Corporation, Jabalpur R-1
126
traffic circumferentially on the bounding network of the respective areas i.e. CBO, the city or the urban
agglomeration.
N2: Development of Road Network along with HCBS
In this strategy it is proposed to develop High Capacity Bus Service (HCSS) corridors, namely:
i) North-South corridor (Katni-Siwami road NH-7)
ii) East-West Corridor, comprising
a) NH-12 (Narsighpur Road)
b) SH-22 (Kundam Road)
c) SH-37 (Damoh Road, Mandla Road)
In addition, the standard buses would play as per the network identified in N 1. Figure 9.7 shows the
proposed HCBS corridors
N3: Development of Road Network System (N1) with LRT
In this strategy it is proposed that in addition to network with standard buses as proposed in strategy
(Nl), a Light Rail Transit System on NH-7 and commuter rail service between Katni and Narsingpur
are proposed. Figure shows the network.
To Damoh To Katni
(N.H.-7)
(S.H.-37)
To
To Patan Kundam
(SH-22)
CBD
Grid

Jabalpur Transport Sector CMP Under JNNURM
Municipal Corporation, Jabalpur R-1
127
To Narsinghpur To Nagpur To Mandla
(NH-12) (N.H.-7) (SH-37)
Fig. 11.3 Grid in Grid Road Network
Based on the above-mentioned strategies alternative scenarios of development would be tested and
evaluated through the application of Land Use Transport Model (LUTM).
11.2 INTEGRATING LAND USE AND TRANSPORTATION AND USING LAND AS RESOURCE
Foreword
A Public Transport system is an opportunate time to introduce long sought land –use changes within
the urban landscape. Land use refers to the manner is which urban form is shaped through policy
actions and consumer preferences. Land use is often categorized by what is known as the “3Ds”:
Density, Diversity and Design. If developed through a mutually supportive package of measures, the
3Ds is the basis of creating an effective ridership base for public transport system. Public transport
system is a practical means to access employment, education and public services, therefore the land
use has been enhanced such that its restructuring to an extent brings about changes in the sprawl of
population and the mobility needs of the people are served. Properly Community benefits have been
optimized in terms of improvement of landscaping, infrastructure and environment.
Areas with medium and high-density populations provide a critical mass of inhabitants to support
shops and public services without requiring access by motorized vehicles.
In low-density area, customers must be drawn from a wider area in order for commercial centers to
reach financial viability. The car becomes a necessity to cross such distances. Higher density
communities can provide a sufficient customer base within a walking distance. For this reason, a
fortuitous circle of relationships exist between urban density, Vehicle ownership, and energy use and
vehicle emissions.
Diversity refers to creating a mix of uses within a local area. By combining residential and commercial
uses into a single area, the number of trips and the length of travel are both reduced. People are able
to meet most of their daily needs by walking, cycling, or public transport. Design refers to the planning
of housing, shops, and public transport in a manner that supports a reduced dependence on cars.
Transit-oriented development (TOD) has emerged as one of the principal mechanisms to make this
happen. This section reviews how land-use policy will be shaped to support a successful Public
Transport system.
We have actively integrated 3 D’s as mentioned above as well as provided details of various property
development with increased FSI around main Corridors & feeder Roads. The focus has been entirely
on cohesion in infrastructure development & transportation efficiency & sustainable development.

Jabalpur Transport Sector CMP Under JNNURM
Municipal Corporation, Jabalpur R-1
128
Introduction to transit-oriented development (TOD)
Local land-use patterns significantly affect the usage of public transport systems. Travellers will
generally only use public transport if it requires walking less than a kilometre. Increasing the
Portion of destinations (homes, worksites, shops, schools, public services, etc.) located near public
transport stations, and improving walking conditions in areas served by public transport, makes the
system more effective to users and profitable for operators. This type of land use is called transit-
oriented development (TOD) or smart growth.
Public Transport system can provide a catalyst for transitoriented development. A public
transport station can be the nucleus of a transit centre, also called an urban village. A typical village
contains an appropriate mix of housing, schools, shops and public offices, employment centres, and
religious (church, mosque, and synagogue), recreation and entertainment facilities. As much as
possible major destinations should be located within view of the public transport station so they are
easy for visitors to find. Each urban village should have its own name and identity, which can be
encouraged with appropriate signs and public art, and special events, such as a neighbourhood
festival.
Higher density housing, such as multi-story apartment buildings and condominiums, should be located
near public transport stations. Medium-density housing, such as low-rise apartments, townhouses,
and small-lot single family homes, can be located further away, but still within convenient walking
distance of the transit centre.
A typical urban village has a diameter of 1 to 1.5 kilometres, a size that allows most destinations to be
located within half a kilometre walking distance of the public transport station. This diameter contains
an area of 80 to 160 hectares, enough to house 2,000 to 4,000 residents with medium-density
housing (25 residents per hectare), or more with higher-density housing. Of course, not every urban
village will follow this exact design, some may be primarily commercial, industrial or recreational
centres, and others are limited in size due to geographic features such as parks and waterways.
TRANSIT LINE
HIGH DENSITY
RESIDENTIAL
BUSINESS
AND
PUBLIC
BUILDINGS
MEDIUM
DENSITY
RESIDENTIAL

Jabalpur Transport Sector CMP Under JNNURM
Municipal Corporation, Jabalpur R-1
129
Some may be smaller or larger, depending on demographic and land use factors. Each urban village
should be carefully planned to take advantage of its unique features.
Transit-oriented development provides many benefits compared with more dispersed land-use
patterns. TOD increases the number of destinations within walking range of public transport stations.
This, in turn, increases public transport system ridership and revenues, and reduces local traffic
problems. More compact development with well-planned urban villages tends to reduce the cost of
providing public services such as utilities, roads, policing, and schools. Improved walking conditions,
reduced motor vehicle traffic, and better public services tends to increase neighbourhood liveability. It
also provides economic efficiency benefits, including increased lower business costs for parking and
goods distribution, and an expanded labour pool. These efficiencies tend to increase overall economic
productivity, business activity and tax revenues. Even people, who do not use public transport, benefit
from having BRT service and transit-oriented development in their communities.
Because of these benefits, property values tend to increase in areas with high-quality public transport
services
Transit-oriented development reflects several specific land use features. Density refers to the number
of people or jobs in a given area. Increased density tends to reduce per capita automobile travel and
increase public transport ridership. This result occurs because density increases the number of
people and destinations served by public transport, which leads to improved public transport service
(more frequent service with greater coverage) and better pedestrian conditions. As a general rule,
densities of at least 25 employees or residents per hectare are needed within walking distance of a
public transport line (i.e., within 0.5 kilometers of each station) to create the demand needed for
quality service. The exact density requirements are affected by various factors, including the portion of
residents who commute by public transport, and the distance that residents are accustomed to walk,
and so may vary from one area to another.
Table 11.2 Benefits of transit-oriented development TOD
Transit Users Benefits Transit Operators
Benefits
Benefits to Society
� More destinations
near transit stations
� Better walking
conditions
� Increases security
near transit stations
� Increased ridership
� Lower costs per rider
� Better image
� Reduced traffic
problems
� Reduced publiC
infrastructure and service
costs
� Community liveability
� Increased property
values, business activities
and tax revenues
Clustering means that commonly used businesses and public service are located together in an urban
village, mall or district, as opposed to these services being dispersed throughout a community or
scattered along a roadway. Clustering makes these businesses and services more convenient for

Jabalpur Transport Sector CMP Under JNNURM
Municipal Corporation, Jabalpur R-1
130
pedestrians and public transport access. Clustering allows several errands to be accomplished during
a single trip, helps create the critical mass of public transport riders needed for quality service, and
encourages public transport commuting by locating more services (cafes, banks, and stores) near
worksites for employees to use during breaks.
Citizenship streets exploit the advantages of clustering in conjunction with its BRT stations. These
streets are a mix of shops as well as key public services such as health care, counseling, employment
services, gymnasiums, and libraries. The Citizenship Streets are fully pedestrianized with one side
typically bordering a BRT station. A person can often meet most of their daily journey requirements
through visiting a single Citizenship Street.
Land-use mix refers to locating different but related activities close together, such as homes, schools
and stores. Land-use mix reduces the need for automobile travel by allowing residents and
businesses to walk rather than drive to more activities.
Connectivity refers to the degree that road and path networks allow direct travel from one location to
another. Smaller city blocks, connected streets and shortcuts for non-motorised travel tend to
minimise travel distances and support walking and cycling, and therefore public transport travel. Large
blocks, dead-end streets and inadequate walking facilities reduce connectivity, increasing the distance
that people must travel to reach their destinations. The difference between low and high connectivity
street patterns.
Walkability refers to the quality of the walking environment, including the condition of footpaths, road
crossings, cleanliness and security. At a minimum, transit villages need wide, well-maintained
footpaths, crosswalks that allow pedestrians to safely cross-busy streets, and adequate cleanliness
and security. In addition, it is desirable to have public parks, shade trees and other landscaping,
attractive buildings, pedestrian refuges (so pedestrians need only cross half the street at a time) and
traffic calming (to control vehicle traffic speeds), bicycle lanes, washrooms, drinking fountains, and
other amenities to enhance pedestrian convenience, comfort and delight.
Site design refers to how buildings are designed and positioned with respect to roads, footpaths, and
parking facilities. Buildings with entrances that connect directly to the footpath, rather than being set
back behind a large parking lot, tend to encourage walking.
Parking management refers to how parking is supplied, regulated and priced. Generous parking
supply creates more dispersed land-use patterns that are less suitable for walking and public transit
access. Free parking represents a subsidy of driving which increases vehicle ownership and use.
Ineffective enforcement of parking regulations can lead to motorists parking on footpaths, creating
barriers to pedestrian travel.
Together these land-use factors can have a major effect on travel behaviour. Research in both
developed and developing countries indicates that a combination of increased density, land-use mix,
street connectivity and walkability increase public transport and non-motorised travel, and reduce per
capita automobile travel. The results from one study shows that residents of the most urbanized
neighborhoods in Portland (US) use public transport about eight times as much, walk six times as
much, and drive about half as much as residents of the least urban area.
In developing countries, where land use is frequently difficult to regulate, transport sector interventions
like BRT are one of the best ways to affect changes in land use that are largely dominated by private
market based decisions. However, there are some public policies that have been successfully used to

Jabalpur Transport Sector CMP Under JNNURM
Municipal Corporation, Jabalpur R-1
131
encourage higher-density development in the area served by a new BRT system. This section
describes specific public policies that can help implement transit-oriented development.
Public facility location and infrastructure investments
One of the easiest ways for a government to ensure transit-oriented development is to locate public
facilities, sush as government offices, schools and colleges, sports and recreation centres, and
cultural facilities along public transport corridors.
Transit centres and urban villages can be given priority when public investments are made to improve
footpaths, roads, parks, public utilities and services such as water and sewage, garbage collection,
and electricity. As a result, the majority of transportation funds are spent on system management and
preservation projects, and less is devoted to expanding roadway capacity in areas with unplanned,
dispersed development.
11.3 Inventory: -
Public transit impact would be significantly higher in the walking distance zone of transit routes. A
distance of 500 m is generally taken as Traffic influence zone. Within this zone the areas closer to the
road are likely to experience higher level of impact, as the accessibility hanges would be more
favorable. Hence a zone extending along the rapid Transit corridor extending to 250m on either side
or the nearest road which ever is farther has been taken as Immediate Transit influence zone. Near
junctions, the influence is expected to extend longer. Hence a distance of 500 meters along he roads
meeting the corridor has been taken as immediate transit influence.
Table 11.3 Existing Land Use (% age Areas)
S.No. Corridor Resdential Commercial Public Ind. Vacant Total
1 Agricultural College
(Adhartal) to Gwari
Ghat
52.50 6.30 13.40 8.20 19.60 100.00
2 Tilwara Ghat to
Khamaria
54.10 7.10 12.80 7.60 18.40 100.00
3 Gour Bridge to
Railway Station
(Railway Bridge No.4)
49.60 6.40 14.50 6.50 26.00 100.00
4 Karmeta To Damoh
Naka
51.80 6.80 13.50 7.20 20.7 100.00
5 Deen Dayal Chowk to
Nagar Nigam Chowk
54.10 7.30 12.80 8.30 17.50 100.00
6 Raddi Chowk to
Ghamapur Chowk
52.9 6.40 13.60 7.10 20.0 100.00
7 Maal Godown to
R.D.V.V.
51.80 7.40 12.50 7.80 20.50 100.00
8 Chandanvan to
Bandariya Tiraha
50.60 6.80 11.90 8.10 22.60 100.00

Jabalpur Transport Sector CMP Under JNNURM
Municipal Corporation, Jabalpur R-1
132
11.4 Assesements of Developments Potential:
The vacant land and the area under slums, which are in the immediate corridor influence zone, are
likely to be influnced by road and transit development. They are likely under go development pressure
in the immediate future. Giving extra FSI for new construction undertaken can intensity the land use in
the catchment area of the corridors. Total area of land, which is amenable for development and
redevelopment, includes vacant lands owned by government and private bodies, and slum areas.
11.4.1 Floor Surface Index
The full potential of land can be utilized by increasing the FSI. FSI for different wards in enlisted –
Ward’s Name FSI
Thakkar Gram, shaheed Ashfaqullah Ward, Dr. Sakir
Hussain Ward, Pt. Deen Dayal Upadhyay ward, Rajeev
Gandhi Ward, Sanjay Gandhi Ward, Pt. Dwarka Prasad
Mishra Ward, Seth Govind Das Ward.
1.25
Subhadra Kumari Chauhan Ward, Swami Dayanand
Saraswati Ward, Jawahar Lal Nehru Ward, Vivekanand
Ward, Cherital Ward.
1.50
Govind Vallabh Pant Ward, Maulana Azad ward, dr.
Sarva Palli Radha Krishnan ward, Acharya Vinoba
Bhave ward, Sheetala my ward, Lal Bahadur Shastri
ward, Lala Lajpat Rai ward, Dr. George Disilva ward,
Narsimha ward, Kamla Nehru ward, Garha ward, Indira
Gandhi ward, Rani Durgawati ward, Madan mahal
ward, GwariGhat Ward’s Katanga region, Banarasi Das
Bhanot ward.
1.55
Jai Prakash Narayan ward. Dr. Shyam Prasad
Mukherjee ward Pt. Madan Mohan Malviya ward, Dr.
Ram Manohar Lohiya Ward, Pt. Bhavani Prasad Tiwari
Ward, Kasturba Gandhi Ward, Mahatma Gandhi Ward,
Jawahar Ganj Ward, Lokmanya Bal Gangadhar Tilak
Ward, Ravindra Nath Tagore Ward, Maharshi Arvind
Ward, Khermai Ward, Hanuman Tal Ward, Sardar
Vallabh Bhai Patel Ward, Motilal Nehru Ward, Dr.
Rajendra Prasad Ward.
1.75
11.5 Land Value Assesement and Revenue Potential
On the basis of experience of various Public Transport system in other cities of the country the value
of land, which is along the corridors, is likely to get enhaced approximately 20 % within two years of
construction of such system. As time passes the value of Land increases continuously.
The tax increment on the basis of increasing FSI have good potential of revenue. Parking can be also
a potential source of income. Development of Commercial centers, cinema house, Community center,
committee room etc. have major Revenue Potential.

Jabalpur Transport Sector CMP Under JNNURM
Municipal Corporation, Jabalpur R-1
133
11.6 PPP Potential
In Public Transportation projects there is wide scope of Public-Private Partership. Similarly in land use
and development PPP can be vital. Some areas for example
a. Parking.
b. Multiplexes.
c. Community Centres.
d. Commercial Centres
11.7 Impact Assement
By the construction of well Designed Public Transport system the present scenrio of the city will get
changed completely. Traffic Jams will be removed. Travel time will be reduced. Comfortable, safe and
economical journey will be possible. By the development of areas along the corridor the people wil get
benefitted. Accidents will get negligibly small. Environmental conditions will get enhanced.
11.8 Implementation Mechanism
The whole area cannot be developed simultaneously. It should be implemented in phases. First of all
vacant land should be developed. Slum areas can be taken up after that. In Last phase the existing
government-building infrastructure can be modified.

Jabalpur Transport Sector CMP Under JNNURM
Municipal Corporation, Jabalpur R-1
134
PART III
PLANS AND PROJECTS

Jabalpur Transport Sector CMP Under JNNURM
Municipal Corporation, Jabalpur R-1
135
CHAPTER - 12.0
PUBLIC TRANSPORT IMPROVEMENT PLAN
12.1 BUS SERVICE IMPROVEMENT PLAN
12.1.1 Existing Bus Transport System in the City
The transport system in the city comprising of mini buses and 3 wheeler tempos is entirely run by
private operators. There are a total of five routes for mini buses and three for tempos, mostly
originating from the city centre and connecting to the fringe area of the city. In terms of fleet size,
there are about 550 registered mini buses and tempos.
Table 12.1 Existing City Bus Route
S.No. Route No. Route
1. 1 Gwarighat to Railway plateform no. 4 via Shastri Bridge
2. 2 Karmeta to Sai Baba Mandir via Baldevbagh collectorate, Ghampur,
Kanchghar chowk, Ranghi
3. 3
4. 4 Agriculture College to Gohalpur via Adhartal, Raddichowk, Madan
Mahal Railway Station.
5. 5 Tilwaraghat to Gour Tiraha via Medical College, Madan Mahal.
The share of public transport to total trips is very low (only seven percent). This is not usually case in
other terms. Usually public transports account for the bulk of daily trips and could be between 40 to
70 percent.
The system of private bus operators does have many problems such as:
• Poor quality of service and comfort to passengers
• Lack of proper bus stations with basic amenities
• Reckless driving by private operators
• Rampant overcrowding of buses
• No scheduled departure or arrival timings - there is no specific waiting time for buses at
various bus stops, buses halt at a stop until they are filled with passengers Inadequate
coverage of city - private bus operators run more on market demand and Will not run
buses to outlying areas that may not have sufficient passengers .
• Comuter safety is totally ignored.
The designed public transport system will assign the public routes, with all necessary infrastructures
like bus stop, etc. As per the household survey conducted in the.city, people's access to the public
transport system is limited as the system covers very few areas of the town. A majority of commuters
have to walk a long distance to access the system. About 27 per cent of the city's population is not
covered at all by public transport (bus stand to reside'nce distance of over 2 kms), which lead to high
reliance a personal vehicles.

Jabalpur Transport Sector CMP Under JNNURM
Municipal Corporation, Jabalpur R-1
136
12.1.2 Issues and Prospects
The city road network system lacks functional hierarchy. The central area road network has restricted
capacity due to high concentration of commercial activities and encroachment by hawkers. A number
of uncontrolled intersections affect the smooth operation of traffic. Peripheral area, on the other hand
has inadequate road network system, although most of the new developments are spread along
these radials. This situation has resulted in traffic congestion on the city road network system.
Presence of Cantonment area in the middle of Jabalpur Planning Area acts as a barrier to the
development of eastern part of the city comprising Umariya, Bhita, Sukhlalpur, Chakdehi, Dumna
(Aerodrome area) etc. A good road network system connecting these areas, without affecting the
Cantonment security, is essential to encourage overall development in this area.
Parking, particularly within the central area, needs special attention. There are limited organized and
off-street parking facilities in the city. Available parking facilities are not sufficient to meet the demand
and this has led to chaotic situation in the city. As a result, vehicles are parked irregularly, occupying
footpaths and precious road space, thereby reducing effective road space for traffic movement.
Poor intersection geometrics, absence of channelisers, lack of control and poor traffic causing sense
among road users have resulted in chaotic situations at the intersections. Most of the roads in the
central area experience congestion due to encroachments and commercial activities. Lack of
adequate facilities for vegetables and flower markets have resulted in hawkers occupying the
precious road space.
Lack of exclusive pedestrian facilities in the city core area results in significant vehicular-pedestrian
conflicts, thereby exposing pedestrians to risk of accidents and delays to vehicular traffic.
Pedestrians and vehicles share the same road space, often leading to unsafe and uncontrolled
crossing of pedestrians. Stray animals on the roads and within the intersection area is also a major
problem affecting smooth flow of traffic.
At present 3 ROB's, 2 RUB's and 3 level crossings provide access across the railway line. Of the
three ROB's, TWo are widely used. Tne two RUB's have low vertical clearance, thus heavy vehicles
are banned at these locations. Poor road surface with water logging is a regular feature during rainy
seasons. Two level crossings at Gorakhpur and on Garha road witness severe congestion due to
high level of activities and presence of intersections on either side of the Railway crossing.
Influence of slow moving traffic is noteworthy on the city road network. Absence of exclusive tracks
for slow moving vehicles has resulted in slow moving vehicles sharing the road space with fast
moving vehicles thereby affecting stream speeds.
The city lacks a well-developed organized public transport system that can effectively cater to the
mobility needs of the city dwellers and promote desirable urban from/structure and direction of growth
to the city. The present public transport system comprises of tempos and minibuses, which are highly
unorganized. Selection and introduction of appropriate technology, with proper routing and scheduling
is extremely vital to meet the future travel demand of the city.
12.2 BUS SERVICES AND OPERATIONS
Jabalpur city transport services Ltd (JCTSL) has been established as a Special Purpose Vehicle
(SPV) to provide a dependable and good public transport service. JCTSL is going to introduce
innovative schemes to improve the bus services in the city through promoting private sector
participation in terms of investment on and operation of high quality buses under its overall planning

Jabalpur Transport Sector CMP Under JNNURM
Municipal Corporation, Jabalpur R-1
137
and control.
12.2.1 “Open” versus “Closed” system
The degree to which access is limited to prescribed operators and vehicles can have a
significant impact on vehicle speeds, environmental impacts, and the system’s aesthetic
qualities. Emergency vehicles, such as ambulances, are generally permitted access on
most BRT systems, whether it is an open or closed system. This public service provides
an additional motivation for approving a BRT project, for the highest ranked officials,
such as the national president or Prim Minister, the exclusive bus-ways does allow for
potential safer movements, which can be important in nations where terrorism or other
security threats may exists. Systems that limit access to prescribed operators are known
as “closed system”. Typically, this access is granted through a competitive selection
process. In these cases, private companies compete for the right to provide public transport
services under a process of competitive tendering. These systems also only permit vehicles
with highly defined specifications to operate on the corridor. By contrast, systems that have
implemented a busway system without any sector reform or any exclusivity are known as
"open systems". In an open system, operators will largely continue to run the same routes as,
they did previously. Thus, the operators will tend to utilise the busway infrastructure whenever
it coincides with their previous routing, and they will likely also operate parts of their existing
routes without bus way infrastructure.
12.2.2 Bus Services Types:
12.2.2.1 Local services
The most basic type of public transport service along a corridor is typically known as "local
service". This term refers to stops being made at each of the major origins and destinations
along a route. While local services provide the most complete route coverage along a corridor,
such services also result in the longest travel times. In comparison to conventional bus services,
the local services of a BRT system are considerably more efficient. BRT stations only alight and
board passengers at designated stations. Further these stations are separated by enough
distance to minimise stop times while at the same time are close enough to be accessed by most
persons in the area. A typical range of distances is between 300 metres and 700 metres.
12.2.2.2 Limited-stop services
Single lane BRT systems with only local services have significant disadvantages. Most impor-
tantly, at high passenger volumes, they have much lower capacity and speed. Typically, the vast
majority of passengers will get on and off at a few major stations. A few passengers, however,
will get off at less used stations. For many passengers, stopping at each intermediate station
adds significantly to the overall travel time with relatively little commercial benefit to the system
operators. Thus, both passengers and operators can benefit from the provision of services that
skip intermediate stops. BRrs relative flexibility means that "limitedstop services" or "skipped-stop
services" can be accommodated. The number of station stops to be skipped depends on the
demand profile. Major station areas with the largest customer flows may be the most logical
stops retained in a limited-stop service. However, the system can employ multiple limited-stop
routes in order to ensure travel times are minimised for the largest number of customers. Thus,
limited-stop routes can differ by the stations served as well as by the number of stations skipped

Jabalpur Transport Sector CMP Under JNNURM
Municipal Corporation, Jabalpur R-1
138
by the service. Some routes may skip 3 or 4 stations while other routes may skip double that
number. Well-designed stations can permit customers to transfer from a local service to a limited-
stop service. Thus, even if a customer does not reside near a limited-stop station, he or she can
transfer to a more rapid service after just a few stpps in a local-service vehicle. In some
instances, customers may find it advantageous to go beyond their desired stop in a limitedstop
vehicle and then return a few stations by way of a local service. The principal idea is to give the
maximum flexibility to the customer in order to reach the destination in the most convenient
manner starting time difference ensures that the express service does not overtake the local service.
12.2.2.3 Express services
Another type of limited-stop service is known as an "express service". Express services skip all
stations between a peripheral area and a central core area. Thus, express services are an extreme
form of limited-stop service. Express services function quite well when the origin of the trip is a high-
demand area that is some distance from the city centre. If population densities are such that vehicles
reach capacity at peripheral areas, then it can be efficient to transport these passengers directly to
central locations. In many cases, the trip origin for an express service will be a transfer terminal
where demand from numerous feeder services has been consolidated. The reduced travel time of
express services can be a major enticement to curb the growth of private motorised vehicles in the
city's periphery. In many developing cities, low-income communities are often located at such
peripheral locations, and thus, the provision of express services can be way of achieving greater
equity within a system. Express feeder buses can also work well to connect a large residential area a
considerable distance from the transfer terminal
12.2.2.4 Shortened routes
Even within BRT systems that only allow for local stops, it is possible to adjust the service to better
meet the demand by having some bus routes turn around before reaching the final terminals. The
same corridor can host several routes of varying lengths. Ideally, the highest-frequency of service will
be provided on the highest-density section of the corridor. Thus, rather than operating a route across
the entire length of a corridor, the service can focus mostly on the higher-demand portions. A single
corridor may be split into two or more routes covering a different portion.
12.2.3 Route & Frequency:
The city bus route network system has been planned and designed in a scientific manner. Direction
oriented Hub and Spoke patten} of routing has been adopted. Routes have been planned to ensure
that besides the regular city transport users, office goers, students and employees should also avail
the services. It has been ensured that proposed routes caters to the requirement of places of
residence as well as places of job. 8 Nos. high travel demand routes have been identified. Company
has taken permit for these routes from R.T.O After due testing of routes and time scheduling JCTSL
has initially started operation of 30 buses on these identified routes and later on add to its fleet of
coaches to improve the frequency of buses at particular bus stop of intersection. Colour coding of
routes and buses and their numbering has been carried out in such a manner that a commuter may
easily identify the bus stop and intersection for convenient commuting.

Jabalpur Transport Sector CMP Under JNNURM
Municipal Corporation, Jabalpur R-1
139
12.2.4 Fleet Requirement:
Most decision makers unfamiliar with BRT systems assume that the secret to a high-capacity
and high-speed system lies in the procurement of larger vehicle While larger vehicles are one
contributing factor, they are rarely the-principal / component in finalising rapid, high-capacity
seryices. Station efficiency is more likely to be the criticai factor in optimising system operations.
However, the size and design of the vehicle will be an important decision factor, especially
in3terms of ensuring Customer convenience and comfort.
12.2.5 Optimizing Vehicle Size
Determining the optimum vehicle size is usually one of the last decisions that should be made when
designing a Public Transport system system. It should be done only better the number of stopping
bays and other considerations have already been decided. The relative costs of vehicle operations
relative to waiting times must also be considered first.
Using the equation as a basis for vehicle sizing, the required vehicle size could be calculated
Co
Cb = [Lf X F X Nsb]
Where
Cb = Vehicle capacity (passengers/vehicles)
Co = Corridor Capacity (pphpd)
Lf = Load factor
F = Service frequency (Vehicle/hrs.)
Nsb = No. of stopping Bays
Adopting potential vehicle frequency as 2 minute, and a reasonable load factor would be 0.85 or
below.
The demand analysis indicates a corridor capacity of 2,000 pphpd and one stopping bays per station
then the optimal vehicle size would be calculated as:
= 2,000/ 0.85 x 30 x1
= 78 passanger per vehicle
Thus 12 meter long standard CNG Bus however JCTSL is presently using 9 m long busses of
capacity 45-50 would be sufficient for this heavy traffic corridor.
12.2.5.1 Size of vehicle fleet
The chosen vehicle capacity will directly determine the number of vehicles required for a corridor.
Procurement of larger vehicles will reduce the total number of vehicles required. Smaller vehicles will
require more vehicles to be purchased, but as noted earlier, smaller vehicles will also contribute
higher frequency services and thus shorter customer waiting times. Also, the cost of a vehicle is fairly
proportional to its size, so there is not necessarily a cost penalty for purchasing smaller vehicles.
However, each additional vehicle does add to total operational costs due to the need for an additional
driver.
The factors involved in determining the operational size of the vehicle fleet include:
• Peak passenger demand at the critical point along a corridor
• Total travel time to complete a full travel cycle along the corridor.
• Capacity of vehicle.

Jabalpur Transport Sector CMP Under JNNURM
Municipal Corporation, Jabalpur R-1
140
Optional Fleet Size Demand on Travel Time for a Vehicle Capacity (cb)
for Corridor (Fo) = Critical time (D) X complete cycle (Tc) Hours) / (passenger/vehicle)
Fo = D x Tc
Cb
The demand along a corridor is 2,000 pphpd using a vehicle with an operational capacity of 180
passengers and requiring one hour to traverse a complete cycle of the corridor, and then the required
operational feet size will be:
Fo = 2,000pphpd x 1 hour = 25 vehicle
80 passenger / vehicle
In addition to the operational fleet, system planners will also have to factor in a contingency value. A
contingency factor of 10 percent is commonly utilized.
Total Fleet sizes (Ft) = Optional Fleet Size + Operation fleet sizes x Contingency value (Cv)
for Corridor (Fo) for Corridor (Fo)
Ft = Fo + (Fo X Cv)
Based on the previous example for calculating the operational Beet size and an assumed contingency
value of 10 percent, the total Beet required for the corridor will be:
Ft - 25 + (25 x 0.1) =28 vehicles
In reality, there should not be any dedicated contingency vehsicles that are always withheld from
service. Instead, all vehicles should be ro-tated between operational service, maintenance) and
contingency status. This practice ensures a relatively equal number of kilometres for each vehicle in
the fleet.
12.2.6 System of Procurement
The appropriate structuring of the procurement process can create a competitive environment that will
drive cost reduction and efficiency. Additionally, a well-designed procurement plan will promote an
open and transparent process that will help to eliminate corruption and graft. System developers
should seek a wide range of bidders for each piece of equipment needed. To achieve this
environment of competitiveness, the procurement specifications should be sufficiently rigorous to
meet system requirements while also permitting bidding firms the ability to innovate. Prior to issuing
tenders, an explicit set of criteria should be created that sets forth the determining parameters for
selecting a bid and the relative weight given to each factor (cost, experience, quality, etc.). The
determination of winning bids ultimately should be decided by an objective, independent body whose
members have no commercial interest with the overall project and have no relationship in any form to
the bidding firms.
JCTSL is a public limited company working under public-private partnership model designed for
operation by private contractors and service providers under government oversight. System
implementation requires detailed technical, legal, and financial design; creation of a new public entity
in charge of system planning, development, and control; overcoming resistance to change from
traditional operators and small bus owners; development of the infrastructure; contracting and starting
up the operation; and earmarking with provision of funds for system expansion.
Proposed BRT shall be composed of following components:
� Specialized infrastructure;

Jabalpur Transport Sector CMP Under JNNURM
Municipal Corporation, Jabalpur R-1
141
� Efficient operations;
� Advanced fare collection;
� Institution for system planning, development, and control.
� Public institutions to provide infrastructure, planning, and control,
� Operations and billeting are to be contracted out to private companies.
12.2.7 Ticketing System
Fully computerized 'Electronic Ticketing Machines are used for issuing daily passenger tickets.
Ticketing system has been finalized. by company to ensure the common ticketing system for all
operators. The software used in. these machines in owned by JCTSL. This eliminates the risk of
passengers being ever charged more than the specified fares by the operators. The computerized
ticketing system also helps in effective monitoring and control of conductors and management of
ticketing data.
With the hi-tech Electronic Ticket Issuing Machines, it is easy for the conductor to issue tickets
generated through the machine and to collect the money from passengers.
The stages on the route and respective fares are fed to the machine". For example, if a passenger
boards the bus at stop number four and intends to get down at 10, the driver will press the buttons 4
and 10. A ticket will come out and corresponding fare will be displayed on the machine and ticket, for
which the money will be collected by the conductor.
12.2.7.1 Passes
One of the important sources of revenue to the company and the operators is system of various kinds
of passes. Project envisages sharing of pass revenue in the ratio of 80:20. Operators will get 80%,
Le. 240 Rs. against the denomination of RS.300 monthly pass JCTSL will save an amount Rs. 30.50
on new pass and Rs. 42.50 on renewed passes. Remaining amount will go to the vender for
processing, marketing and delivery of passes. System· of issuing passes is being done through 15
instant pass centers and a network of distributors and retailers. Company has taken a minimum
guarantee of issuing of issuing at least 2500 passes every month from the agency. This minimum
guarantee of passes ensures an assured income of Rs. 7.5 lakhs per month to be shared between
the JCTSL and operators.
Our pass system is complete modular, web-based solution specially designed for Public Transport
Systems. It aims at reducing the strenuous workload involved in managing passes by seamlessly
integrating the various aspects of running a large system.
System is based on Client-Server architecture. It provides central database, which can be updated
from several clients synchronously.
System reduces the error/faults of manual system by providing bar code, which reduces duplicity.
Pass center no, shift no date and pass no, are encoded in the barcode. Beside barcode card contains
detail user information such as photograph of pass owner, unique id-number, name, address & age of
the pass owner, stamp & sign of authorized signatory, rules & regulation on backside and a specially
designed hologram to root out any scope of duplicity.
In this system, there is one centralized server located at the JCTSL Head Quarters and is attached
with several clients at different locations.
Metro card vending machines and metro cares for the purpose of passes would be adopted at later
stages. It is planned to upgrade the system to RF enabled passes very soon. Apart from monthly

Jabalpur Transport Sector CMP Under JNNURM
Municipal Corporation, Jabalpur R-1
142
passes we are also planning to introduce student, family and various other kind of passes at latter
stages.
12.2.8 Online GPS Bus Monitoring & PIS Solutions
This is the most technology saw part of the entire project wherein a fully automated vehicle tracking
system will ensure that the city buses reach the stop at the fixed time. Any deviation from timing
would be corrected and controlled using GPS and real time tracking solutions.
The proposed system will offer following advantages
1. Estimated time of arrival that could be flashed on display screens at Bus Stops.
2. Schedule & Itinerary adherence.
3. Log of exact kilometer traveled by Bus.
4. Punctuality and improvement in driving pattern.
5. Control over unauthorized and unscheduled stoppage.
6. Better KMPL & EPKM.
7. Better Analysis.
8. Migration to Passenger Information System including IVRS.
12.2.9 Integration of Buses with Intermediate public transport
Multimodal implementation- For multimodal implementation we have suggested the use of existing
Buses, mini buses as well as full size busses to be operated on feeder as well as arterial routes. Many
existing routes will support BRTS corridors as well. These existing routes have private as well as JCTSL
buses & three wheelers i.e. tempo’s. The focus of whole exercise has been to provide cohesive, mutually
supportive, sustainable architecture for transportation modal.
This model realize heavily on support of different models of transportation like mini buses, three wheelers
etc so as facilitate efficiencies & timely connectivity for passenger.
New fleet of HCBC (high capacity buses) will be supported by existing JCTSL framework and in no small
parts by existing mini9 busses BRTS & JCTSL will fulfill 91% of public transport demand while rest will be
covered by mini busses.
Special care will be taken to integrate the proposed BRT system for Jabalpur with all other modes of
transport. In addition, the design of the BRT routes ensures that passengers using the system have
easy access to taxis, three-wheelers, etc., if necessary by providing for convenient pick-up zones and
parking places. In addition the walking spaces and road crossing locations have been made
particularly safe for commuters.
The cost of infrastructure development for 'Bus Rapid Transit System' is inclusive of:
� Construction of physically segregated bus lanes in cement concrete
� Resurfacing of motor vehicle lanes in re-usable asphalt (to ensure minimum changes in
elevation on resurfacing)
� New storm water drainage system
� Provision of underground ducts conduits for other services
� Replacement of light poles and fixtures
� Shifting of existing electricity/telephone poles and trees (reduced to an absolute minimum)
wherever necessary.

Jabalpur Transport Sector CMP Under JNNURM
Municipal Corporation, Jabalpur R-1
143
� Construction of footpaths and segregated NMV lanes.
� Provision of new street furniture, street benches, dust bins, bollards etc.
� Construction of new bus stops.
12.2.10 Common Utility Offices at Terminals and near Bus Stops along the corridors:
While deciding the location of terminals and bus stops due consideration has been taken to provide it
near public utility offices such as Nagar Nigam Zonal Offices, Electricity distribution offices, Post
Offices, Banks at MS shopping complexes etc.
12.3 MRT DEVELOPMENT PLAN
12. 3.1 Evaluation Of Alternative Technologies For Solution Of Existing Problems
Types of Mass Rapid transport technologies
• Bus Rapid Transit (BRT) Bus based technologies typically operating on exclusive right of way lanes
at the surface level; in some cases Underpasses or tunnels are utilized to provide grade separation
at intersection or in dense city centers.
• Light Rail Transit (LRT) - Electric rail-based technology operating either as a single rail car or as a
short train of cars typically on exclusive right-of-way lanes at the surface level with overhead electrical
connectors.
• Trams- Trams can also be considered a type of LRT, but typically utilize smaller-sized car riages and
may share road space with other forms of traffic.
• Underground metro- A heavy rail trasit system operating on grade separated tracks that are located
principally underground.
• Elevated rail transit - A rail transit system operating on grade separated tracks that are located
principally on an aerial structure; elevated systems can also be considered a form of metro.
• Suburban rail – A heavy rail transit system operating on exclusive right-of-way tracks that are located
principally at the surface level but generally grade separated; typically carries passengers between
suburban and urban locations; differs from other urban rail systems by the facts that carriages are
heavier and the distances travelled are usually longer.
• Personal Rapid Transit (PRT)- A rail-or wheel-based system carrying passengers in small Automatic
Guided Vehicles (AGV); PRT typically operates on exclusive right-of-way lanes that may also be
grade separated.
12.3.2 Rail verses Road
1. Whether a system called BRT or LRT or metro perhaps matters less than whether rhe system
meets the needs of the particular customer.
2. Given that mass transit implies a certain level of both capacity and speed, some systems are
technically better described by the more general term of "public transport" than "mass transit"
Whether a system qualifies as "mass transit" is dependent both on the nature of the
technology and the circumstances of the particular city.
12.3.3 Criteria in technology Selection
The decision to select a particular technology depends upon many factors. Costs, performance
characteristics, local conditions, and personal prefomances have historically all played a role in the
decision-making process. This section will outline some of the factors that should be considered in
selecting the type of mass transit system for a city.
The planning and decision-making process can be defined so that the ultimate outcome reflects the

Jabalpur Transport Sector CMP Under JNNURM
Municipal Corporation, Jabalpur R-1
144
goals and objectives of the city in conjunction with the current and projected trends. The goals and
objectives will likely in part reflect the vision statement developed by the political leader. Additionally,
objectives regarding quality of life and city image will likely be part of the evaluation. Demographic
trends will help to indicate the transport service levels I"equired to meet the future form of the city.
As the decision-making process enters actual comparisons between different public transport
technologies, a framework for objectively evaluating each criteria should be dearly articulated. The
evaluation process will likely begin with the widest number of options under consideration. As the
evaluation proceeds, increasing levels of detailed analysis will be utilized to narrow the choices.
Feasibility" studies and "cost-benefit" analysis may be uriIised to deternline in detail the financial
viability of a particular option. In instances where oniy a single technology is considered, it is not
uncommon for "feasibility" studies ro almost always deliver a verdict of "feasible irrespective of
potentially berrer alternatives, Public rransporr technology decisions can rhus become a self-fulfilling
prophecy based upon political or personal preferences rather than cusromer needs.
By understanding Customer needs with respect to fare levels, routing and location, navel time,
comfort, safety, security:" frequency of service, quality of infrastructure, and ease of access, system
developers can define the preferred type of service without bias toward any particular technology.
Table 12.2 Factors in choosing a type of Public Transport technology
Category Factor
Cost Capital costs (infrastructure and property costs)
Operating costs
Planning costs
Planning and management Planning and implementation time
Management and administration
Design Scalability
Flexibility
Goals and objectives Access/ mobility, quality of life, city Image, etc.
Current situation and trends Current problems and future challenges
Indentify investment alternatives Car-based city, metro , LRT, BRT, etc.
Evaluates alternatives Objective decision –making process
Decision

Jabalpur Transport Sector CMP Under JNNURM
Municipal Corporation, Jabalpur R-1
145
Diversity versus homogeneity
Performance Capacity
Travel time speed
Service frequency
Reliability
Comfort
Safety
Customer service
Image and perception
Impacts Economic impacts
Social impacts
Environmental impacts
Urban impacts
The choice of public transport technology should be based on a range of considerations with
performance and cost being amongst the most important. These requirements are ideally derived
from an objective analysis of the existing and projected situation. The categories of the charac-
teristics that can help shape a city's decision towards the most appropriate type of public
transport technology.
12.3.4 Strategic design consideration
. Scalability
. System Flexibility
. Diversity and homogeneity
. Performance
12.3.5 Technology decision making
12.3.5.1 Comparative Descision Matrix
As it is being discussed earlier the table below and notes the circumstances that are best suited to
each technology.
Table 12.3 Comparative Descision Matrix
Technology Demand
requirements
Advantages Disadvantages
Metro
rail/elevated rail
system
High to very high
passenger demand
(30,000 to 80,000
pphpd)
• Superior image for city
• High commercial speeds (28-35
kph)
• Attracts discretionary public
transport riders
• Uses relatively little public space
• Low local air emissions
• Very high infrastructure
costs (US$45 million to
US$350 million per km)
• May require operational
subsidies.
• Poor revenue recovery
during non-peak periods
• Long development and
construction times
Complex integration with

Jabalpur Transport Sector CMP Under JNNURM
Municipal Corporation, Jabalpur R-1
146
feeder services
Light rail transit
(LRT)
Moderate
passenger demand
(5,000 to 12,000
pphpd)
• Provides good image for city
• Attracts discretionary public
transport riders
• Quiet ride performance
• Can be fitted to narrow streets
• Low local air emissions
• Moderately high
infrastructure costs
(US$15 million to US$45
million)
• May require operational
subsidies
• Limitations with respect to
passenger capacity.
Bus rapid transit
(BRT)
Low to high
passenger demand
(3,000 to 45,000
pphpd)
• Relatively low infrastructure costs
(US$0.5 million to US$14 million)
• Often does not require operational
subsidies
• Good average commercial speeds
(20-30 kph)
• Ease of integration with feeder
services
• Moderately good image for city
• Can carry with it the
negative stigma of bus
technology
• Relatively unknown to
many decision makers
Conventional
bus services
Low passenger
demand (500 to
5,000 pphpd)
• Low infrastructure costs
• Relatively low operating costs
• Appropriate for small cities with
low demand
• Poor service image
• Often lacking in basic
customer amenties and
comfort
• Regularly loses mode
share to private vehicles.
12.3.6 Appropriate Technology
BRT is increasingly being recognised as asound technology option for a range of city conditions
and, especially for developing-nation cities seeking both high quality and a low-cost solution.
BRT's ability to operate profitably across a broad range of operating conditions and the relatively
low Cost of its infrastructure made it option worthy of consideration. Based on the experiences to
date, the conditions most favourable to BRT are:
• Passenger demand ranging from 3,000 to 45,000 pphpd along a given corridor.
• Need for average commercial speeds over 20 kph.
• Cities seeking to avoid the need for operationa I subsidies; and
• Availability of capital funding in the range of Rs 8.0 Cr. to Rs 12.0 Cr. per kilometer.
BRT's broad set of profitable operating conditions has given the technology some versatility in
terms of compatible public transport environments. BRT systems have fulfilled a range of roles in
cities, including trunk services, feeder services to other transit technologies, and temporary
solutions prior to rail upgrades.
A city with few financial resources may wish to consider developing a full mass transit network with
BRT prior to a limited rail-based corridor. Building a single, limited corridor of high technology does

Jabalpur Transport Sector CMP Under JNNURM
Municipal Corporation, Jabalpur R-1
147
little to provide a meaningful network for those persons who depend upon public transport for their
daily mobility needs. In time, if the desire to convert to rail is strong, then this possibility is always
there as a future conversion option. For such cities, BRT can provide a quality network over the
medium term and thus do much to relieve the pressures of congestion, contamination, and
inadequate access.
12.3.7 FUTURE TRAVEL DEMAND SCENARIO
12.3.7.1 Planning Period:
The planning period is taken as 20 years after the construction. The horizon year for all estimates
and planning programme will be 2029. The most acceptable scenario under each transportation
parameter is briefly described here under:
12.3.7.1 Mobility
Presently as revealed by household survey, the per capita trip rate (PCTR) of Jabalpur is 1.47
including walk and 1.00 excluding walk. With economic development, higher vehicle ownership,
good public transport system and increased mobility the PCTR would increase. Future travel
demand estimates will be made by construction of travel demand models. In the interim a PCTR of
1.20 (excluding walk) by 2021 is adopted to give indicative size of travel demand.
12.3.7.1 Modal Share
The modal share in favour of public transport (including Para transit) in Jabalpur is a low of 14.76%.
In the context of resource conservation (land, energy,) sustained development and environmental
quality, it is necessary to improve the public transport share to a level of 30% to 40%. The study
group on Alternative System of Urban Transport, set up by Planning Commission, Government of
India has recommended the desired modal share for city size. For a city of 1.5 m it is proposed to
adopt a modal share of 40% as per the study group recommendations.
12.3.7.1 Transport System
As of now the predominant travel modes are bicycles and two wheelers while public transport
technology is conventional buses (standard and mini). However as the city grows and travel demand
increases it is necessary to identify more appropriate transport the city needs. Amongst the morden
of available technologies, the Light Rail Transit system, all surface or elevated tracks, along With
High Capacity Bus System (HCBS) seems to be most appropriate option for the city.
12.3.7.1 Population Growth:
The growth of population of Jabalpur city during the last few decades and projected population in
future years is as under:
Table 12.4 Population Trends in MCJ
Year Population Decadal Growth (%)
1951 2.04 -
1961 2.95 44.61
1971 4.42 49.83
1981 6.49 46.83
1991 7.62 17.41
2001 9.32 22.31
2011 10.54 13.09
2021 13.54
Projected Population 2031 17.39
2033 18.28

Jabalpur Transport Sector CMP Under JNNURM
Municipal Corporation, Jabalpur R-1
148
12.3.7.1 Vehicles and Traffic Growth:
The city had about 2.73 Lacs vehicles in the year 2001-02 then registered an annual growth of about
7.19 Lacs per annum in the last decades. At the present trend of the growth of vehicle the number of
vehicles will be about 15.47 lacs per decade. The traffic on NH-7 near Ranital Chowk will be about
298302 per day comprising 125000,two wheeler 7276 autos, 9506 cars/JeepVan, 245 tempos, 441
mini bus, 11 standard buses, 250 LCV, 1702/3 axle, 25 multi axle, 285 agriculture tractor, 155000
slow moving vehicles. Peak hour traffic will be 32810 nearly 11 %. The day's traffic two wheelers 41
%, slow moving vehicles 52%, car jeep/ van 3.5%, and commercial vehicles less then 1 % will be
composition of traffic in peak hour.
12.3.7.2 Vehicle Population in Jablapur
Table 4.1 presents the growth trend in number of registered vehicles in Jabalpur. The total number of
registered vehicles has grown at a CAGR of 9.5 per cent.
Table 4.2(A) and Table 4.2(B) shows almost all types of vehicles, such as mini-buses, motor cabs,
auto rickshaws, car and jeeps, have registered increasing volumes.
12.3.7.3 Maximize the benefit of transportation investments.
Maximizing the benefits of transportation investments is essential to achieve the vision of a best
performing system that is in good condition, where delay is minimized, and where capacity-adding
improvements have the greatest positive impacts on mobility, safety, the economy.
It is especially vital to maximize the benefit of future investments given the large gap between current
revenue sources and the costs of maintaining and improving the existing system. This reality affects
all modes and underscores the importance of strategic choices and innovation to address financial
constraints.
This broad goal acknowledges that transportation needs will always exceed available resources.
Emphasis is given to our transportation system to be properly scaled and appropriately
interconnected. Taken together, the Goal 5 objectives and strategies are intended to advance two
priorities:
1. Ensure the sufficiency of transportation funding.
2. Continue to improve the strategic and analytical foundations of transportation investment
making.
Municipal Corporation Jabalpur will expand and diversify the revenue sources for transportation
funding in order to provide the level of mobility necessary for a strong economy and quality of life.
Expansion and diversification will require change and creativity. The city needs to respond to the
changing energy landscape, the role of the private sector and innovative partnerships, and the need
for a wider range of tools for local transportation finance.
Municipal Corporation Jabalpur will provide leadership to improve the policy, collaborative, and
technical inputs to effective investment making. Today's challenges require an environment of
innovation and analytical approaches for prioritizing funds and delivering services.

Jabalpur Transport Sector CMP Under JNNURM
Municipal Corporation, Jabalpur R-1
149
12.3.8 Vision
Jabalpur's Transportations system needs to
Function well as an integrated, multimodal citywide system.
• Be preserved and maintained, with new infrastructure built to last.
• Encourage easy and efficient movement of people, goods and information.
• Be an economic generator.
• Be linked with future business markets and the global economy.
• Utilize smart technology for enhanced transportations operators.
• Be diverse and adaptable for all.
• Support quality developmeot.
• Break down institutional barriers.
Need for Mass Rapid Transit System in the city
In the context of accelerated growth of city size and activity concentration, increase in travel
demand, constrained by limited resources, energy constraints and environment quality the public
transport policy, system planning, operation and management becomes the backbone of the
transport system plan. A priority is given in the identification of an appropriate system and providing
the necessary infrastructure and conductive operational environment for efficient and effective
performance.
Increasing the Bus share of Public Transport from the existing 14.76 per cent to 60 per cent in 2015
demands an increase in their service levels. Minibuses and Tempos currently offer Public Transport
Service predominantly and standard buses to certain extent. It is pertinent that in coming years there
will be a shift towards more efficient public transport systems. The base year supply of public
transport is 0.182 standard buses (existing fleet converted to equivalent standard buses) per
thousand populations. This supply level will have to be increased suitably over the next 20 years by
augmentation and efficient mass transport system.
The Metro bus route network system needs to be planned and designed on a scientific manner
Direction oriented hub and spoke pattern of routing may be adopted. Presently Jabalpur is not
having any efficient form of organized Public Transport System. Public Transport In Jabalpur was
catered through tempo, rickshaws, mini buses and buses running on the road in an unorganized
manner.
Initiatives
Jabalpur City Transport Services Ltd. (JCTSL) was formed for providing proper transport system
separately. In the context of rapid growth of the city, increasing mobility, high travel demand:
increasing congestion, delays accidents, and need for conservation of energy, growing community
consciousness towards environmental quality and to address a host of such other' problems and
objectives, public mass transport system of the city stands out as the most critical element. It needs
to be rationally planned, efficiently operated and diligently managed to be effective and productive
by itself and in turn enable the city to be productive and competitive.
1. A centralized study was conducted by Snow Fountain Consultants, In Association with TRIPP, IIT Delhi,
in year 2007, specifying the various recourses. After analyzing the various studies it has evolved that
BRTS is the most feasible solution for the Mass Rapid transport System, which has been discussed
more elaborately in the preceding pages. Recommendations made during Stakeholder consultation.

Jabalpur Transport Sector CMP Under JNNURM
Municipal Corporation, Jabalpur R-1
150
Stake holder meeting was organized in consultation with TRIPP IIT Delhi’s illumenaries Prof. Gautam
Tiwari, Prof. Dinesh Mohan. The meeting had active participation of various stake holders like Jabalpur
Municipal Cooperation, Jabalpur Traffic Department, JCTSL MLC members. etc.
BRTS condor’s selection infrastructure design proposed ROW, proposed feeder Roads arterial roads
were modified wherever needed due to constructive suggestions of various stakeholders. JCTSL
capacity augmentation was one of the recommendation which was incorporated.
Introduction of bus priority corridors and a new fleet of High Capacity Busses (HCBC) to operate on
them by 2011, further augmentation of the existing standard bus fleet. The two systems combined
are estimated to cater to a share of 91 % of public transport demand Minibuses would cater
remaining share Comprehensive Traffic and Transportation study for Jabalpur Urban Area June
2007 Snow Fountain Consultants, Lucknow.
2. Augmentation of the standard bus and urban bus fleet to cater to 100% of the· public transport fleet
by 2021. Minibuses to be phased out of operation from the study area.
While designing the routing of Public Transport System following Proper Policy can be considered.
• Connect all major Production and Attraction Centers
• Evolve an integrated network connecting intercity passenger terminals.
• Direction oriented routing system with feeder services may serve city and thus provide high
accessibility and service levels to community.
12.3.9 Advantages of BRTS over other MRTS Options
1. Bus Rapid Transit and other MRTS options such as light Rail each have a variety of
advantagesand disadvantages Bus Rapid Transit generally has the advantage of
(1) Having more flexibility than light Rail.
(2) Being able to phase in service rather than having to wait for an entire system to be built. Transit
operators with experience in Bus Rapid Transit systems say that one of the challenges faced by Bus
Rapid Transit is the negative stigma potential rider attach to buses regarding their noise, pollution,
and quality of ride. Other MRTS Options such as Light Rail and Metro has advantages, according to
transit officials, associated with increased economic development and improved community image.
Bus Rapid Transit Capital Costs per Km. Generally Lower Than Light Rail
The Bus Rapid Transit projects cost less on average to build than the other MRTS options like Light
Rail proj ects, on a per-km. basis.
2. Bus Rapid Transit Is Generally More Flexible than other MRTS Options·
Bus Rapid Transit systems operate more flexibly than Other MRTS Options. Bus Rapid Transit can
respond to changes in employment, land-use, and community patterns by increasing or decreasing
capacity. Bus Rapid Transit routes can also be adjusted and rerouted over time to serve new
developments and dispersed employment centers that may have resulted from urban sprawl. On the
other hand, MRTS lines are fixed and cannot easily change to adjust to new patterns of housing and
employment.
Although Bus Rapid Transit sometimes uses rail-style park-and-ride lots, Bus Rapid Transit routes
can also collect riders .in neighborhoods and then provide rapid long-distance service by entering a
bus way or HOV facility. Transit agencies have considerable flexibility to provide long distance service
without requiring a transfer between vehicles. This is a significant benefit, because some research
has shown that transit riders view transferring to be a significant disincentive to using mass transit. In

Jabalpur Transport Sector CMP Under JNNURM
Municipal Corporation, Jabalpur R-1
151
contrast, Other MRTS, options frequently requires a transfer of some type- either from a bus or a
private automobile.
Finally, bus-based systems ability to operate both on and off a bus way or bus lane provides Bus
Rapid Transit the flexibility to respond to operating problems, For example, buses can pass disabled
vehicles, while Rail trains can be delayed behind a stalled train or other vehicle on the tracks. Thus,
the impact of a breakdown of a Bus Rapid Transit vehicle is limited, while a disabled Rail train may
disrupt portions of the system.
3. Bus Rapid Transit Operation Can Be Phased in
Bus Rapid Transit systems differ from Other MRTS Options in that they provide greater flexibility in
how they can be implemented and operated.
In constructing a Bus Rapid Transit system, it is not necessary to include all the final elements before
beginning operations; it is possible to phase in improvements over time. Improvements such as
signal prioritization and low-floor buses, which improve capacity and bus speed, can be added
incrementally. These incremental changes can have significant effects. For example, one Los
Angeles Bus Rapid Transit route increased its speed and cut 10 percent off its schedule time, by
installing signal priority for buses to provide several additional seconds to allow buses to pass
through intersections before the signal changed. Overall, the line was able to reduce travel time by
29 percent with all the improvements. In contrast, a transit expert noted that a MRTS segment must
be fully completed and tested before starting operation and realizing benefits.
4. Bus Service's Negative Image Can Be Overcome with Equal Service Characteristics
It is general perception that a negative image exists for bus service, particularly when compared to
rail service. Communities may prefer Other MRTS Options to Bus Rapid Transit in part because the
public sees rail as faster, quieter, and less polluting than buses, even though Bus Rapid Transit is
designed to overcome those problems. While transit officials noted a public bias toward MRTS,
research has found that riders have no preference for rail over bus when service characteristics are
equal.
While environmental benefits have helped justify Other MRTS Options, the gap in environmental
benefit between rail and buses may be narrowing. Now days· there is much needed focus on
improving the design of buses not just to increase their attractiveness, but also to reduce their noise
levels and emissions. Nowadays diesel buses are becoming much cleaner. It is noted that,
emissions from individual buses declined substantially between 1988 and 1999. Improvements in
diesel technology have resulted in heavy-duty diesel engines that are more reliable and less polluting
than their predecessors. In addition, we found that newer buses can use alternative fuels, such as
liquefied natural gas, fuel cells, and hybrid technologies, which may have some beneficial effect on
urban air quality as they are adopted into bus fleets. It can now be said that the poor image of buses
was probably a result of a history of slow bus service due to congested streets, slow boarding and
fare collection, and traffic lights. Bus Rapid Transit is essentially designed to eliminate delays and
provide faster service on better vehicles. The image of buses can be improved over time through bus
service that incorporates Bus Rapid Transit features. This change could replicate the improved
image that Other MRTS Options experienced when Metro Rail began to be built.

Jabalpur Transport Sector CMP Under JNNURM
Municipal Corporation, Jabalpur R-1
152
5. Bus Rapid Transit Can Be an Interim System
Bus Rapid Transit also has the advantage of establishing a mass transit corridor and building rider
ship without precluding future changes. The development of a bus way secures a transit right-of-way
for the future. Some cities have identified Bus Rapid Transit as a means of building transit rider ship
in a travel corridor to the point where investment in a rail alternative becomes a cost-effective choice.
For example, one of the projects in FTA's demonstration program, the Dulles Corridor Bus Rapid
Transit project in Virginia, hopes to build transit rider ship in this fashion. However, converting a bus
facility to light Rail involves additional capital costs. The idea of converting a Pittsburgh bus way to
rail was studied by the Port Authority of Allegheny County, and the agency concluded that the $401
million capital cost of the conversion was too high.
6. Bus Rapid Transit Capital Costs per Km. Generally Lower Than Light Rail
Bus Rapid Transit Capital Costs were generally lower than Light Rail Capital costs in the cities we
reviewed, when compared on a cost-per-km basis
We found mixed results when we compared the operating costs of Bus Rapid transit and Light Rail
Systems. In examining performance characteristics, we found that the rider ship and operating
speeds of Bus Rapid Transit and Light Rail systems were similar in many respects.
Conclusion
Bus Rapid Transit systems can have lower capital costs than Other MRTS Options yet it can often
provide similar performance. Further, Bus Rapid Transit's flexibility may be a potentially valuable
feature for many communities with sprawling patterns of development, where public transportation
needs can be more complex and difficult to address than focusing on a single central business
district.
Bus Rapid Transit is a relatively new concept, some of the projects have not reached the point of
being ready for funding consideration and there are many other rail projects further along in
development with which they will ultimately have to compete.
The future of Bus Rapid Transit largely rests with the willingness of communities to consider it as
they explore transit options to address their specific situations. Such decisions are difficult and made
on a case-by-case basis considering a variety of factors including cost, rider ship, environmental
impacts, community needs and attitudes. No one-transit option is right for all situations. However,
given the merits of Bus Rapid Transit and its potential cost advantages, we believe that it should be
given serious consideration as options are explored.
12.3.10 Potential and Feasibility of BRTS in the city
I. AIl number of transit options are available to communities to help address growing traffic
congestion. One such option is Bus Rapid Transit. Bus Rapid Transit is an emerging approach
to using buses as an improved high-speed transit system. By employing innovative
technologies such as signal prioritization, better stations or shelters, fewer slops, and faster
service on more attractive vehicles, Bus Rapid Transit Shows promise in meeting a variety of
transit needs.
II. Bus Rapid Transit involves coordinated improvements in a transit system's infrastructure,
equipment, operations, and technologies that give preferential treatment to buses on urban
roadways.
I. Bus ways special roadways designed for the exclusive use of buses-can be totally separate

Jabalpur Transport Sector CMP Under JNNURM
Municipal Corporation, Jabalpur R-1
153
roadways to operate within highway right-of-way separated from other traffic by barriers.
Sufficient ROW is available in the major corridors of traffic in the city where we need to provide
the mass rapid transport system.
Average Trip Length
Average trip Length in Jabalpur is 3.36 km. excluding walk trips. While majority of trips have trip
length less than 6 km. Such kind of trip length is most suitable for Bus Rapid Transit System rather
than Light Rail. The following study conducted under Comprehensive Traffic and Transportation study
for Jabalpur Urban Area by Consulting Engineering Services (India) Pvt. Ltd. justifying the feasibility
of Bus Rapid Transit System.
The total Passenger 'kilometers and passenger hours made under each of various alternatives for
public Transport System are derived in Jabalpur to understand the benefits of one system over the
other. The observations are presented in Table 12.5 and Table 12.6.
It is seen from Table that introduction of priority corridors results in substantial savings in time. The
LRT system, due to its higher speeds attracts more trips resulting in higher passenger kilometers.
However, due to the time taken for modal interchange from road based to rail based system and
vice versa, this system increases the travel time. Absence of parallel bus corridors also compels
people to use the LRT system for shorter trip lengths thereby resulting in higher travel time.
Therefore, in catering to the demand till the horizon year (2029). It is recommended to implement a
road based public transport system, Bus Rapid Transit System. The choice of the road based public
transport system will be based on the assessment of benefits with and without priority bus corridors
to meet the public transport travel demand. It is felt that, this high capacity corridor will bring about
reidensification of its adjacent areas and urban renewal beyond 2029. This will result in additional
demand on the corridor that will be higher than the capacity of a road based system. The LRT
therefore, will have to be exercised as an option along the identified corridor to cater to the public
transport travel demand after 2029.
Table 12.5 Performance indicators of different public transport system
Indicators 2011 2018 2033
Without
Priority
Corridor
With
Priority
Corridor
Without
Priority
Corridor
With
Priority
Corridor
With High
Capacity
System (LRT)
Total pass. Km
in a day ('000) 5331 7916 8096 15372 15699 17148
Totalpass. hrs
in a day ('000) 453 657 608 1180 1145 1180
Saving in Pass
hrs ('000) -- -
49
- 34.6 -35

Jabalpur Transport Sector CMP Under JNNURM
Municipal Corporation, Jabalpur R-1
154
Potential Cost and Benefits
Table 12.6 Cost of Alternative Public Transport System
Public Transport
System
Vehicle Operating Cost
(in millions)
Value of Travel Time (in
millions) Total VOC +
VOTT Public
Transport
Non Public
Transport
Public
Transport
Non Public
Transport
Do Nothing Scenario 32 91 348 61 532
Standard Bus System 39 58 323 39 458
High Capacity Bus and
Standard Bus System 37 58 311 39 445
It may be inferred from this table that difference in cost of alternative Public Transport systems as
compared to the 'Do-Nothing' scenario, would form the benefit stream.
The summary of the results obtained from the economic analysis undertaken for the entire project
period (2029), is presented in Table 12.7.
Table 12.7 Economic Internal Rate of Return
Proposed Public Transport System EIRR (VOC+VOTT)
Standard Bus System 24.9%
Standard Bus System + High Capacity Bus System
(Urban Bus) 26.8%
12.3.11 TRANSPORT PLANNING
12.3.11.1 Equitable allocation of road space
At present, road space gets allocated to whichever vehicle occupies first. The focus is, therefore, the
vehicle and not people. The result is that a bus carrying 40 people is allocated only two and a half
times the road space that is allocated to a car carrying only one or two persons. In this process, the
lower income groups have, effectively, ended up paying, in terms of higher travel time and higher
travel costs, for the disproportionate space allocated to personal vehicles. Users of non-motorized
modes have tended to be squeezed out of the roads on account of serious threats to their safety. If
the focus of the principles of road space allocation were to be the people', then much more space
would need to be allocated to public transport systems than is allocated at present.
The Central Government would, therefore, encourage measures that allocate road space on a more
equitable basis, with people as its focus. This can be achieved by reserving lanes and corridors
exclusively for public transport and non-motorized modes of travel. Similarly lanes could be reserved
for vehicles that carry more than three persons (popularly known as High Occupancy Vehicle Lanes).
Past experience has been that such reserved lanes are not respected by motorists and therefore lose
meaning. In order to facilitate better enforcement physical segregation has been proposed.
It is well known that public transport occupies less road space and causes less pollution per
passenger per km than personal vehicles. As, such, public transport is a more sustainable form of
transport.

Jabalpur Transport Sector CMP Under JNNURM
Municipal Corporation, Jabalpur R-1
155
12.3.11.2 Quality and pricing of Public Transport
So far fares for public transport have been set on the premise that this mode of travel is used by the
poor, who have no other means of meeting their travel needs. As such, fares have been kept low as
a measure of social equity. This has resulted in most public transport systems being unable to
recover their operating costs. It has, in fact, encouraged poorly operated systems that have been
financially sustainable only through serious compromises on the quality of the service they render. In
the present day context, however, public transport serves another social purpose. Their needs are,
however, for improved quality and not so much for low fares. It is, therefore, necessary to think of
different types of public transport services for different segments of commuters. Those who place a
premium on cost are the poorest sections of society and need to be given affordable prices. The cost
of providing public transport for them needs to be subsidized by other sections of society. However,
there is another segment that values time saved and comfort more than price. This segment is
comparatively better off and would shift to public transport if high quality systems are available to
them. The cost of providing public transport to them need not be subsidized and can be met from the
fare revenues. As such, the Central Government would encourage the' provision of different levels of
services a basic service, with subsidized fares and a premium service, which is of high quality but
charges higher fares and involves no subsidy.
To facilitate this, the Central Government would offer support under the JNNURM for premium
service infrastructure such as improved bus stations and terminals, improved passenger information
systems, use of intelligent transport systems for monitoring and control, restructuring of State
Transport Corporations, etc.
To ensure that the fares charged are fair and reasonable, as per requirement of Central government
would regulatory authority had been set up by the State Government to, interlaid, regulate the prices
to be charged by different types of public transport services has already been feed.
12.3.11.3 Technologies for Public Transport
There is a wide spectrum of public transport technologies. At one end are high capacity, but high
cost, technologies like underground metro systems and at the other are low capacity bus systems
running on a shared right of way. Within these extremes are a range of intermediate possibilities,
such as buses on dedicated rights of way, elevated sky bus and monorail systems, electric trolley
buses, etc. While some of them are most effective over high-density trunk corridors others prove
useful as feeder systems or subsystems that serve limited subareas within a city. Similarly, there are
examples of available waterways being taken advantage for public transport as also systems like
ropeways that suit hilly terrains. While the high capacity rail systems and buses on shared rights of
way are the only ones tried out in India, several of the others have proved successful in other parts of
the world. Electric trolley buses have been running in San Francisco. New Bus Rapid Transit
Systems (BRTS) have become very popular in cities like Bogota (Colombia) and Curritiba (Brazil).
12.3.11.4 Priority to non-motorized transport
With increasing urban sprawl and rising income levels, non-motorized transport has lost its earlier
importance. Statistics show that the share of bicycle trips out of the total trips in Delhi has declined
from 17% in, 1981 to 7% in 1994. The longer trip lengths have made cycling more difficult. Further,
nonmotorized modes are also exposed to greater risk of accidents as they share a common right of
way with motorized vehicles. However, non-motorized modes are environmentally friendly and have

Jabalpur Transport Sector CMP Under JNNURM
Municipal Corporation, Jabalpur R-1
156
to be given their due share in the transport system of a city. The problems being faced by them
would have to be mitigated.
First of all, the safety concerns of cyclists and pedestrians have to be addressed by encouraging the
construction of segregated rights of way for bicycles and pedestrians.
12.4 FEEDER NETWORK & INFRASTRUCTURE
12.4.1 Feeder Service Design
A well-designed system can accommodate a range of population densities in order to achieve
a true 'city-wide" service.' in general, there are three options in terms of the overall service structure:
I. Trunk-feeder services
2 Direct services;
3. Mix of trunk-feeder services and direct services ("hybrid" services).
Fig 12.1 Illustrative comparison between trunk- feeder services and direct services.
Trunk-feeder services utilize smaller vehicles in lower density areas and utilise larger vehicles along
higher-density corridors. The smaller vehicles thus "feed" passengers to the larger "trunk" corridors.
Many passengers utilizing a trunk-feeder system will need to make a transfer at a terminal site. Direct
services will have less need for feeder vehicles and transfers, generally taking passengers directly
from their origin to a main corridor without the need for a transfer.
12.4.2 Trunk-feeder services
Trunk-feeder service utilize smaller vehicles from residential areas to provide access to terminals or
transfer stations, where customers transfer to larger trunk vehicles Typically, the feeder service
vehicle will operate on mixed-traffic lanes while the trunk vehicles will operate on exclusive bus ways.
In many respects, the concept of trunk-feeder services is similar to the practice of hub-and-spoke
operations as utilized by the airline industry.
12.4.3 Mix of trunk-feeder services and direct services

Jabalpur Transport Sector CMP Under JNNURM
Municipal Corporation, Jabalpur R-1
157
Trunk-feeder services and direct services are not mutually exclusive. A system developer could
elect to use different services in different sectors of the city, depending on the local
circumstances. Increase that give way to low density residential plots, then a trunk feeder service
can be employed in areas with less variability in corridor population density, then direct service
could be employed 'the relative flexibility of BRT in comparison to other public transport options
means that routes and services can be tailored quite closely to customer needs. The system can be
designed to minimize travel times for the greatest number of passengers. Routing options, such as
local, limited-stop, af1d express services, permit an array of permutations that maximize system
efficiency and minimize travel times for customers. Both passengers and operators can benefit from
adjusting public transport services to more closely match existing demand. An effective route network
can be achieved through the following design principles:
1. Minimizing the need for transfers through efficient routing permutations;
2. Providing local, limited-stop, and express services within the BRT system;
3. Shortening some routes along a corridor to focus on high-demand sections.
Customers typically prefer to have choices and options. Providing alternative routing options serves
several objectives, including good customer service, reduced travel times, and increased system
capacity.
Table 12.8 Comparison of trunk-feeder services and direct services
Factor Trunk freedom services
in closed system
Direct Services in open
system
Direct Services in closed
system
Travel time Time penalty incurred for
requiring transfer, but
speed and capacity along
the trunk bus way
maximized.
Time saved in avoiding
transfers, but "bunching" of
vehicles along bus way will
increase travel time
Allows T authority to control bus
way congestion while also
gaining the time savings
benefits from fewer transfers
Operational
efficiency
Matches supply and
demand very closely; pro-
duces high efficiency even
when there are significant
variances in population
density between corridors
and residential areas
Compromise between
high-demand areas and
low-demand areas may
reduce overall efficiency;
however, gains are
realised if route distance is
short
Compromise between high-
demand areas and low-
demand areas may reduce
overall efficiency; however,
gains are realized if route
distance is short
Infrastructure
Requires construction of
terminals and intermediate
transfer facilities
Avoids costs of terminals
but may require more
costly stations
Avoids cost of terminals
Vehicle types
Trunk routes typically
restricted to large vehicles;
feeder routes typically
employ standard sized
buses or smaller'
Often little standardization
of vehicles; vehicles may
require doorways on both
sides
BRT authority can stand- ardise
the vehicles; vehicles must be
capable of both on and off bus
way operation and thus may
require door- ways on both
sides
Capacity High passenger flow rates The bunching of vehicles Capacity will be somewhat

Jabalpur Transport Sector CMP Under JNNURM
Municipal Corporation, Jabalpur R-1
158
can be handled efficiently
with trunk-feeder services
and on-board fare
payment inhibit system
capacity
lower than for trunk-feeder
systems as vehicle sizes will be
somewhat smaller
System
image I
customer
friendliness
Metro-like route structure
makes for customer-friendly
system
Lack of clear route Ill'
maps and plethora of
routes can create
customer confusion
Potentially more complex than
a trunk-feeder system but more
organized than an open system
12.4.4 Route network:
'A system is a network of interdependent components that work together to try to accomplish the aim
of the system. A system must have an aim. Without the aim, there is no system. "
12.4.5 On different selected corridors, the improvement of feeder roads is already planned the detail
are as under.
The Proposed improvement as per National Urban Transport Policy has been taken up. Segrated
lane for bicycles & pedstrain has been provided surface drain below pedstrain & proper street light
provision has been made.
Table 12.9 Feeder roads
S. No. Feeder Road Name Length Cost in Lacs
From To
1. Damoh Naka I.T.I. 2.748 961.086
2. Medical Tiraha Dhanwantari Nagar 2.000 1706.819
3. Katnga Tiraha Gwarighat 6.174 2182.037
4. Collect-rate RDVV 3.525 1230.201
5. Ghamapur Chowk Katnga Tiraha 3.449 1116.973
6. I.T.I. By Pass 3.131 1083.699
7. Mdical Tiraha Tilwara 5.159 597.345
8. Circuit House Gaur River 7.510 2497.038
9. Shastri Bridge Medical Gate 5.350 1715.600
10. Gohalpur Police Chowki Amkhera 2.208 512.342
11. Railway Bridge No. 01 Kairab Guest House 0.940 242.778
12. Madan Mahal Chowk to Madan Mahal Thana 0.896 328.949
13. Ghamapur Chwok Ranjhi 5.750 1785.206
14. RDVV Thana Rabertsganj 1.048 262.913
15. Circuit House Russel Chowk 1.445 453.683
16. Choti line Fatak Bandariya Tiraha 1.218 325.771
17. Chandanwan Teen Patti Chauraha 1.300 365.192
18. Ravindra Nagar Tiraha Amkhera 1.665 385.380
19. Baldevbagh Ukheri MR-4 1.554 368.911
20. Madan Mahal Rly. Station Rani Tal 0.838 195.764
21. Ghamapur Raddi Chowk 2.150 605.943
22. Ambedkar Chowk Rly. Bridge No. 01 1.000 270.747

Jabalpur Transport Sector CMP Under JNNURM
Municipal Corporation, Jabalpur R-1
159
S. No. Feeder Road Name Length Cost in Lacs
From To
23. Amkhera By pass 2.752 676.375
24. Adhartal Shobha Rly. Station 2.393 735.952
25. Ghamandi Chowk Ranital 1.025 169.910
26. Corporation Chowk P & T Gate No. 03 0.986 213.864
27. Damoh Naka Badi Khemrai 1.441 276.322
28. Sharda Chowk Sainik Society 1.119 231.403
29. Russel Chowk Shastri Bridge 0.845 231.043
30. Shastri Bridge Medical Tiraha 1.176 242.547
31. Russel Chowk Bus Stand 0.660 162.028
32. RDVV Dumna Airport 10.476 2504.801
33. Rampur Tiraha Bargi Hill 6.568 1362.569
Selecting feeder routes
Normally, when a BRT system is built, many of the traditional bus and paratransit routes are re-
moved from the corridor. The traditional routes generally operated both along the trunk corridor
and off the corridor. The first step in identifying feeder routes is to look at those traditional bus
and paratransit routes, and assign to feeder vehicles to those parts of the traditional routes that
are not along the new BRT corridor. The traditional routes, however, are unlikely to be entirely
optimal, and it is likely that new routes will need to be created using the data from the traffic
model. Just as the demand analysis from Chapter 4 shaped the location of the trunk-line
corridors, passenger demand profiles should also underpin feeder route selection. Both major
residential areas and secondary commercial roadways are typically the focus of feeder services.
For distances beyond 500 metres from a trunkline station, many customers will likely prefer a
feeder service. In most cases, the areas around the system's trunk terminals are a priority for
feeder services. The terminal location will likely be chosen in part due to the nearby passenger
capture area. Terminals are also the easiest place to facilitate transfers from feeder vehicles to
trunk line vehicles. However, intermediate feeder opportunities should not be ignored. Very often
secondary corridors that run perpendicular to the trunk corridor are fertile areas for customer
demand. In such cases, some form of an intermediate transfer station must be provided to
facilitate the feeder to trunk transfer. The location of feeder services may also be influenced by
social considerations. Low-income communities may be located in peripheral areas with poor
road infrastructure. Smaller feeder vehicles are likely the only option for a system to access such
areas effectively. The overall length of feeder services will depend upon demand patterns and the
relative population density of residential areas. The population density of a feeder area may be two to
four times lower than the population density along a trunk corridor. Since feeder services are
generally expected to deliver at least half of a system's ridership, the length of the total feeder routes
may actually need to be two to four times greater than the length of the total trunk corridors. The
physical shape of a feeder route will depend upon local street configurations and demand profiles.
However, in general, feeder routes tend to take upon one of these types of forms:

Jabalpur Transport Sector CMP Under JNNURM
Municipal Corporation, Jabalpur R-1
160
• Loop route
• Straight roundtrip corridor
• Combination of single corridor and loop route
Single corridor connecting two trunk corridors
12.4.6 The dangers of ignoring feeder services
Can a BRT system operate only on major corridors without any supporting feeder services? Some
cities have attempted to implement a busway system without providing either feeder services or
direct services into residential areas. Typically, this arrangement occurs when a city wishes to
implement a limited experiment on a major corridor during a BRT project's first phase. By doing so,
the municipality can avoid addressing many of the complicated issues related to existing informal
operators who service residential areas. The municipality can also avoid the complications related to
the integration of services. However, the results to date on such an approach have not been entirely
positive. Jakarta (Indonesia) inaugurated its TransJakarta BRT system in January 2004 with an initial
Phase I corridor of 12.9 kilometres. The system in this corridor consists of a single-lane median
busway. The corridor is largely composed of business and shopping oriented destinations with few
residential origins. The municipality tried to designate some pre-existing privately operated
perpendicular routes as official feeder buses, and to give these bus passengers a discount on the
BRT system, but the discount tickets were not honoured by the private bus operators, leading in
effect to a 'trunk' system without a 'feeder' system. The city also elected to allow the existing bus
operators to continue operating in the mixed traffic lanes. While the system enjoys popular support
and significantly reduces the travel time for trips along the corridor, it poorly serves many other
transit passengers using the corridor. The limited BRT system carries 65,000 passengers per day
and about 3,000 passengers per hour per direction at peak times. The continued operation of the
existing operators in the reduced confines of the mixed traffic lanes has also exacerbated overall
traffic congestion levels. As the system expands, these problems will be reduced, but a system of
feeder buses would certainly have significantly increased demand and reduced mixed traffic
congestion. Jakarta's experience with the first phase of the TransJakarta system provides several
lessons regarding the importance of feeder services and coordination with existing services. The
lack of feeder services has created three troubling outcomes in Jakarta:
• Mixed first impression of BRT;
• Insufficient demand for a financially-viable BRT system;
• Increase in overall congestion levels.
While initial reaction to Jakarta's Phase I was mixed, many negative articles in the press and much
consternation from private vehicles users could have been avoided.
12.5 ITS AND PASSENGER INFORMATION SYSTEM, TRAFFIC INFORMATION CENTRE
A planned development and deployment of Intelligent Transportation System in a developing country
like India will greatly help in meeting the transportation challenges further touching the world-class
mobility services.

Jabalpur Transport Sector CMP Under JNNURM
Municipal Corporation, Jabalpur R-1
161
Intelligent Transportation System integrates Information technology, communications (wireless, etc)
and location (GIS, satellite navigation) based technologies into roads, vehicles, traffic and transport
management systems. ITS ensures more informed travelers, planners, managers, buses and
commercial vehicle operators, emergency response services, etc, thereby facilitating safety, equity,
efficiency and environmental protection.
ITS is not a set of technologies and services that accrue more benefit to people who can pay more, in
fact it helps plan and manage safer mobility for pedestrians, cyclists and vulnerable groups; as well as
more reliable and dependable public transport services.
12. 5.1 PITS (Public Intelligent Transport System):
PITS technologies are a collection of technologies that increase the efficiency and safety of public
transportation systems and offer users greater access to information on system operations. The
implementation of PITS technologies is transforming the way public transportation systems operate,
and' changing the nature of the transportation services that can be offered by public transportation
systems. The goal is to provide public transportation decision-makers more information to make
effective decisions on systems and operations and to increase traveler's convenience and rider ship.
PITS teahnologies can be organized into three broad categories that describe the technologies
relevance to transit applications. Each category is comprised of a variety of technology choices that
are available to help transport agencies and organizations meet traveler's service needs while
increasing safety and efficiency.
The three PITS technology categories are:
A. Fleet Management Systems (FMS)
� Communication Systems (FMS)
� Automatic Vehicle Location Systems
� Transit Operations Software
� Geographic Information Systems
B. Passenger Information System (PIS)
� Pre-Trip Transit Traveler Information Systems
� In-Terminal/ Wayside Transit Information Systems
� In-Vehicle Transit Information Systems
C. Electronic Payment Systems (EPS)
� Smart Cards
� Fare Distribution Systems
� Clearinghouse
12.5.2 Road Way Application Design:
12.5.3 Automatic Vehicle Location (AVL) Systems
AVL systems are computer-based vehicle tracking systems that function by measuring the real-time
position • of each vehicle and relaying the information back to a central location. They are used most
frequently to identify the location coordinates of vehicles in order to better satisfy demand. They also
serve to provide location coordinates to respond to emergency situations.
AVL systems are based Global Positioning System (GPS);
� The benefits of A VL include:
� Improved dispatch and operational efficiency;

Jabalpur Transport Sector CMP Under JNNURM
Municipal Corporation, Jabalpur R-1
162
� Improved bverall reliability of service;
� Quicker responses to disruptions in service, such as vehicle failure or
� Unexpected congestion;
� Quicker response to threats of criminal activity (via silent alarm activation by the driver); and
� Extensive information provided at a lower cost for future planning purposes
12.5.4 Transit Operations Software
Data collected from vehicle-based fleet management systems is relayed to centralized computer
systems and is made useful by transit operations software.
The software helps the operator monitor the fleet's performance in meeting demand, identify
incidents, manage response, and restore service more effectively.
Para transit operations software and reporting systems integrate applications such as passenger
registration, automatic geocoding, mapping, real-time and batch trip scheduling, dispatching and
brokering for multiple carriers. These systems often use a GIS platform that assists in optimizing route
planning, and can be combined with an AVL system.
12.5.5 Traffic Signal Constant
The development of a BRT system can also present a unique opportunity to upgrade the traffic
signal technology along the same corridor. A new BRT system will imply several changes that
will affect traffic signal technology.
These changes include:
• New priority treatment for public transport vehicles;
* Bus Rapid Transit - Planning Guide 2007
• New exclusive lanes;
• New turning movements for public transport vehicles;
• New restrictions on private vehicle turns. These options have already been presented.
With new electronic signalling technologies and software programmes now available, an upgrade
of the traffic signal system should be integrated into the BRT planning process. The appropriate
synchronisation of traffic lights often does not currently exist in developing cities. A readjustment
of phase lengths and synchronisation should be undertaken with a special focus on smooth
public transport vehicle flow. Some type of priority for buses can be introduced, such as "green
extension" or "red shortening". In these options vehicle detection, either using the GPS or fixed
detectors (e.g., transducer), is required at the intersection. Information on arriving buses is given
to the signal controller, which can increase the green time or shorten the red time not to stop the
buses. Green extension or red shortening is limited to by certain limitations so as to not affect
signal synchronisation and the overall performance of the signal network. An extreme priority
measure is signal pre-emption, where the signal turns green or remains green if a public
transport vehicle is approaching. Pre-emption is quite commonly used in conjunction with priority
for emergency vehicles.
Passengers have had to rely on a bus schedule (timetable) which, through generally giving an
expected time of arrival based on averages, does not overcome the anxiety of passengers waiting for
buses PIS in the public transport context, use GPSJA VLS and GIS technology to provide.
12.5.6 Bus Application Design:
The system described receives the vehicle location information from a GPS every second. The output

Jabalpur Transport Sector CMP Under JNNURM
Municipal Corporation, Jabalpur R-1
163
of the GPS is processed. The PITS is pre-loaded with the co-ordinates of the bus stops on the route of
a bus. The solution calculates in real-tike the distance between the bus stops and the current location
of the bus. The bus is then assumed to be at or near a bus stop if this distance is less than a given
constant. The LED corresponding to the current bus stop is then flashed to indicate the current
location of the bus.
The display could be used as follows.
On-Board Information helps passengers to have the information of the next bus stop to be served.
Besides this it may include information of the destination and possible connections to other bus lines.
Onboard information will decrease the stress of missing the right bus stop for those passengers who
are not every-day users of that specific bus lane.
12.5.7 Bus Station Application Design:
Dynamic Bus Stop Display is often the most prominent equipment of passenger information systems.
They will give passengers the real-time information of the next bus arrival. This service will highly
improve the conditions of the journey because it will decrease the uncertainty and discomfort of the
waiting for the bus and minimize the waiting time by enabling some last minute shopping without fear
of missing the bus.
12.5.8 Fare Collection System:
The method of fare collection and fare verification has a significant impact on the operational
efficiency of the BRT system, the ability of the system to integrate routes with each other public
transport system, and the fiscal transparence of the system.
Critical design regarding
� Operational plan for the fare collection system;
� Fare policy and fare structure;
� Institutional structure of the fare collection system has to be taken by JCSTL
12.5.9 Operational plan for the fare collection system:
Efficiency fare collection system technology can significantly reduce boarding and alighting time, but
also time queuing to purchase tickets and clearing turnstiles.
12.5.9.1 Off board payment system:
The decision to collect and verify fares on or off board will have a significant impact on the potential
passenger capacity of the system. Off board fare collection and verification reduce the line delays that
generally accompany on board payment.
12.5.9.2 On-Board fare Verification:
In such system, very little actual fare verification is conducted. Occasional checks by public transport
staff are done to control fare evasion. The actual payment of the fare is largely reliant on the public
goodwill and over all will ingresses to comply. From the fare payment point onwards, the costumer
proceeds directly to the public transport vehicle without inspection.
One of the main advantages of proof of payment fare system is that it allows one to avoid the
construction of a closed entry station. No physical separation between the station and the out side
area is necessary.
The main disadvantage of such a system is that the usually result in some revenue loss.
The kind of system also requires a large frame work that allows verification staff (that usually are not

Jabalpur Transport Sector CMP Under JNNURM
Municipal Corporation, Jabalpur R-1
164
police staff) to have defacto police power in the collection of penalties from violators, and a procedure
for collecting when the passenger dose not have the money to pay the fine.
12.5.10 Fare policy and fare structure:
It is critical that the fare policy and the fare structure for the BRT system be selected before the fare
technology is selected. In general there are five types of fare structures:
1. Free fare;
2. Flat fare;
3. Zonal fare;
4. Distance-based fare;
5. Time-based fare.
At Jabalpur JCSTL has appointed “District Based Fare” structure charge a tariffin relation on the
number of Kilometers travels pay more than someone traveling just a short distance.
12.5.11 Institutional Structure of the fare collection system:
Intuitional arrangements for the fare collection and verification system vary widely from system to
system, with different benefits and risks. Most system have the following components.
� The manager of the money (Usually a bank or money manager);
� The equipment provider.
� The Fare provider;
� The fare system operator;
� The public transport authority or its present agency;
12.5.12 Technological elements of a fare system:
Normally, the physical equipment of the fare system consists of the following:
1. Payment medium
The payment is usually cash, tokens, paper tickets, magnetic strip cards or smart cards.
2. Point of Scale (POS) terminals
These terminals are cash points where a tickets, token, magnetic cards, or smart cards
can be purchased or value can be added in to an existing cards.
3. Value-deduction terminal
These terminals are usually terminals and/or card readers
4. Central Computers
The central computer is the repository of the various information streams; the central
computer is typically connected to the point of scale terminal and the value-deduction
terminals via a telecommunication and/or GPRS link.
12.5.13 Traffic Information System:
Information at Home/Office is mainly pre-trip information about routes, connections, fares and
timetables. Some real-time information as the next bus arrival time at a chosen bus stop can be
found. Portable Information Equipment as mobile telephones or hand-held terminals can be used to
give information for passengers before or during the journey. This area is developing very fast e.g.
with WAP based communication. It will give, in future, all kind of possibilities for a user to specify the
information he or she actually needs.
12.5.14 Proposed PITS at JCTSL
The primary purpose is to maintain and monitor information thereby enhancing the performance

Jabalpur Transport Sector CMP Under JNNURM
Municipal Corporation, Jabalpur R-1
165
JCTSL services and commuter satisfaction. The focus of Pits is to automate the JCTSL's operations
utilizing a GPS based vehicle Tracking & GIS based monitoring System and thereby improve the
mass transport services. This will provide efficient utilization of fleet and hence, reduce the cost of
operations. This will also help corporate management in Introducing new routes and planning. In this
process it is able to provide better transport services to the commuters and is reducing the cost of
operation directly & indirectly and therefore contributing in the improvement of the national economy.
12.5.15 Other Information System:
Once the information of vehicle location and schedule compliance gathered, there are many
alternatives to carry the arrivals information for passengers. As telecommunication technologies
advantages there are opportunities to provide passenger with data via kiosk, Internet, SMS, wireless
PDAs and so on. Passenger can plan tripps from home with scheduling and real time information, or
just ask via cellular phone or wireless PDAs, when a public transport vehicles is arriving to given
location.
12.5.16 System Management Plan:
JCTSL has established on BOT Basis, a center that allows service and passenger access
supervision. Each bus is equipped with a Global Positioning Satellite system and a processing unit
that reports its location every 10 seconds. It is proposed to upgrade the current system capabilities so
that control center also receives information from turnstiles that report the number of passengers
entering and leaving the system. Supply of buses and service demand will then be coordinated, and
contingencies managed in real time. Further, Passenger Information System (PIS) is also being
developed where in the passenger will get the estimated time of arrival of buses at bus stop on 6' by
2' LED screens. The revenue generated through advertisements on screens and bus stops will
support system. The PITS details are as under:
12.5.17 Physical and IT Infrastructure Development and Operation:
12.5.17.1 Physical Infrastructure Cost:
S. No
Items Cost in
Lacs per
Unit
Unit Reference
No.
Quantity
Requested
Cost
Lacs
1. Fare Collection Reader Station No. No. of
Station each
type
i) Smart Card System
(4 Reader Per Station)
5.0 Per Station 100 100 500
ii) Magnetic Strip System
(4 Reader per station)
3.50 Per Station 100 - -
iii) Coin Based System
(2 reader per station)
0.75 Per Station 100 - -
2. Fare Collection
turnstiles
Station No. No. of
Station with
turnstiles
i) Rotating turnstile
(4 turnstiles per station)
3.50 Per
turnstiles
100 - -

Jabalpur Transport Sector CMP Under JNNURM
Municipal Corporation, Jabalpur R-1
166
ii) Gate – arm turnstile (4
turnstiles per station)
1.40 Per turnstiles 100 100 140
3. Fare registering unit /
vending machine
Station No. No. of
Station with
machine
-
i) Smart Card System 7.50 Per machine 100 100 750
ii) Magnetic Strip System 5.00 Per machine 100 - 0
iii) Coin Based System 0 Per machine 100 - 0
4. Fare media Card No. Card No.
i) Smart Card System with
micro processing ability
2.00 Per 1000
card
500000 1000
ii) Smart cards w/o micro
processing ability
0.60 Per 1000
card
- -
iii) Coin Based System 0.025 Per 1000
card
- -
5. Fare system Software Software
No.
No. of
software
i) Smart Card System 250.00 Per software 1 1 250
ii) Magnetic Strip System 150.00 Per software 1 - -
iii) Coin Based System 50.00 Per software 1 - -
6. Intelligent
Transportation System
(ITS)
No. of
Station /
inters.
No. of station
/ inters
i) No. ITS operation 0 Per station 100 50 -
ii) Green light phase 10.00 Per 100 100 1000
iii) Real-time information 3.75 Per station 100 100 375
iv) Board band service 0.38 Per station 100 -
Fare system and ITS
Sub-Total 4053
The operation of ITS is proposed type managed with sequence generation from advertisement etc. on
information successes etc.
CHAPTER- 13
ROAD NETWORK DEVELOPMENT PLAN
13.1 Hierarchical Road Network
National Highway No.07 cuts across the city from North to South. This road is encroached and highly
congested, forming one of the principal arterial roads of the city.
A bypass branches off from N.H.-07 in the North and runs all the way to the South-west, crossing the

Jabalpur Transport Sector CMP Under JNNURM
Municipal Corporation, Jabalpur R-1
167
state highway and reaching N.H.-07 once again. The road network is constrained by a railway line that
runs along the central ridge of the city.
The Jabalpur Development Plan -2005 calls for some major upgradation of the road network in the
areas between core city and the newly formed bypass road. These roads would serve to improve
connectivity significantly and help in connecting to the development growth that is taking place in this
area. All the proposals are scrutinized and good no.of proposals are now proposed for implementation
in JNNURM projects which includes Byepass, Major roads and Sector roads.
(1) National Highway and Bypass road(R-1):
(i) Construction of Mandla Bye Pass (Tilwara Ghat Brigde to Gour River via Gwarighat)
(ii) Construction of Kundam Bye Pass
. Key components are:
Sl no. Discription of roads R.O.W.(m)
1 Outside the City limits 55-60
2 Gorakhpur railway crossing toAjad chowk 18-24
3 Bhantalaiya to Byoharbagh 24
4 Madan Mahal chowk to Bedinagar petrilpump 30
5 Bedinagar petrolpump to Tripuri chowk 36
6 Other Road section 36-40
(2) State Highway and Other Regional roads(R-2):
Sl.no. Roads Width within
the city
limits(m)
Outsides the
city
limits(m)
1 Mandala marg
30-35 40
2 Damoh Marg
30-45 45
3 Patan Marg
30-45 45
4 Kundam Marg
24-40 40
5 Old Mirzapur Marg
24-40 -
6 Gorakhpur Railway crossing to Gwarighat
24-30 -
7 Agricultural College (Adhartal) to Gwari Ghat
Agriculture college, Damoh Naka chowk, Ranitaal
Chowk, Madan Mahal Station, Chhoti lin Crossing,
50-60 50-60

Jabalpur Transport Sector CMP Under JNNURM
Municipal Corporation, Jabalpur R-1
168
Rampur Tiraha and Gwarighat.
8 Tilwara Ghat to Khamaria
Medical College, Madan Mahal, Shastri Bridge,
Bus Stand, Naudra Bridge, Chandan Van,
Highcourt, Ghamapur Chowk, Katchghar chowk,
Satpulla, Ranjhi and Khamaria
50-60 50-60
9 Gour Bridge to Railway Station (Railway
Bridge No.4)
Empire Talkies, Kairab Guest house, Railway
Bridge No.- 2, Collectrate Chowk and Railway
station
50-60 50-60
10 Karmeta To Damoh Naka
Via Deen Dayal Chowk
50-60 50-60
11 Deen Dayal Chowk to Nagar Nigam Chowk
Ahinsha Chowk (Vijay Nagar), Ukheri Tiraha,
Labours Chowk, Ranitaal Chowk, Malya Chowk
50-60 50-60
12 Raddi Chowk to Ghamapur Chowk 50-60 50-60
13 Maal Godown to Rani Durgawati University
Rly. Bridge NO.-1, Allahabad Bank Chowk,
Science College.
50-60 50-60
14 Chandanvan to Bandariya Tiraha
Chandanvan Tiraha, Bridge No.3, Shivaji ground,
Katanga Tiraha and Bandariya Tiraha
50-60 50-60
13.2 Primary Arterial Roads (A.R.P.) Construction/ Improvement:
These includes major city roads carrying heavy traffics and connecting sub divisions , Major work
centre , Important Health centres, and Educational centres
PROPOSED PRIMARY ARTERIAL ROAD (50 M.wide) (including Foot path,
central verge, drain, street light)
1 ARP-1
Katni bye pass to Kundum bye pass, Via Maharajpur, Richai, Madai, Mohnia
2 ARP-2
Katni bye pas to ARP4 at Kundum
3 ARP-3
NH-7 Adhartal to ARP-3 at Amkhera
4 M.R.-4
Katni bye pass to NH-12 via. Mahara jabalpur, Amkhera, Kachhpura, Garha,

Jabalpur Transport Sector CMP Under JNNURM
Municipal Corporation, Jabalpur R-1
169
Narsinghpur road NH-12
13.3 Secondary Road Construction/ Improvement:
13.3.1 Sector Roads (S.R.):
* PROPOSED SECTOR ROAD (30 M. wide) including Footpath, Central verge,
drain, street Light
Connecting Roads between ARP & Bye pass
1 SR1
2 SR2
3 SR3
4 SR4
5 SR5
6 SR6
7 SR7
8 SR8
9 SR9
13.3.2 Other Roads:
Sl.no. Discription of roads
Roads of 24-30 m R.O.W.
1 Collectrate to R.D.V.V. via Science college
2 Katinga Tiraha to Gwarighat
3 Medical Tiraha to Byepass via Dhanvantari nagar
4 Damoh Naka to I.T.I.
5 Ghamapur chowk to Katinga Tiraha
6 I.T.I. to Byepass via Shukh
7 Circuit house to Gour river
Roads of18- 24 m R.O.W.
1 Chandanvan to Teenpatti chauraha
2 Chhotiline fatak to Bandariya tiraha
3 Circuit house to Russel chowk
4 R.D.V.V. tiraha to Robertsganj via Lohiya Bridge
5 Ghamapur chowk to ranjhi via kanchghar
6 Madan Mahal chowk to Madan mahal thana
7 Railway bridge no. 1 to Kairab guest house
8 Gohalpur police station to Amkhera
9 Adhartall to Sobhapur railway crossing

Jabalpur Transport Sector CMP Under JNNURM
Municipal Corporation, Jabalpur R-1
170
10 Amkhera to Byepass
11 Ambedkar chowk to Railway bridge no.1
12 Ghamapur chowk to Raddichauki
13 Madanmahal railway station to Ranitall Hanuman Temple
14 Baldev bagh to M.R.4 Ukeri road
15 Ravindra tiraha to Amkhera
Roads of 12-18 m R.O.W.
1 Rampur tiraha to Bergi Hill via Shakti Bhawan
2 R.D.V.V. to Dumna airport
3 Russel chowk to Bus stand via Krishna hotel
4 Shastri bridge to Madan Mahal station
5 Russel chowk to Shastri bridge via Jabalpur hospital
6 Sharda chowk to Sainik society
7 Damoh naka to Khemrai via chhota fawvara
8 Corporation chowk to P&T gate no.3
9 Ghamandi chowk to Ranitall via Garha Fatak
13.4 Intersection and Flyovers, R.O.B’s. & R.U.B’s.
At present 3 R.O.B's, 2 R.U.B's and 3 level crossings provide access across the railway line. Of the
three ROB's, Two are widely used. The two RUB's have low vertical clearance, thus heavy vehicles
are banned at these locations. Poor road surface with water logging is a regular feature during rainy
seasons. Two level crossings at Gorakhpur and on Garha road witness severe congestion due to
high level of activities and presence of intersections on either side of the Railway crossing.
Influence of slow moving traffic is noteworthy on the city road network. Absence of exclusive tracks
for slow moving vehicles has resulted in slow moving vehicles sharing the road space with fast
moving vehicles thereby affecting stream speeds.
To avoid undue hindrance to traffic and to permit free flow traffic, Bridges on major roads are
necessary .The following Projects have been proposed to be taken up in phased manner :
* DEVELOPMENT OF SUB WAY
1 At Mal Godam near Rly. Station
* CONSTRUCTION OF BRIDGE OVER RIVER NARMADA
1 At Gwariqhat
CONSTRUCTION OF RAILWAY OVER BRIDGE
1 Shobhapur Vehicle Estate railway Crossing
2 Gorakhpur choti line Railway Crossinq
3 Madan Mahal Railway Station
4 Chhotiline Crossing near Gwarighat
* WIDENING OF RAILWAY UNDER BRIDGES

Jabalpur Transport Sector CMP Under JNNURM
Municipal Corporation, Jabalpur R-1
171
1 Railway Bridqe No.1 (Under Bridqe)
2 Railway Bridge No.2 (Under Bridge)
3 Railway Bridge No.3 (Under Bridqe)
4 Railway Bridqe No.4 (Under Bridge)
5 Shastri Bridge (Over Bridge)
6 Satpula Bridge (Over Bridge)
7 Garoha Bridge (Over Bridge)
* CONSTRUCTION,WIDENING AND REHALBITATION OF EXISTING BRIDGES
OVER NALA
BRIDGE WIDENING ON OMTI NALA
1 Ghamapur
2 Chhoti Omti
3 Ghantaghar
4 Naudra Bridge
5 Nav Bharat Press
6 Prabhat Bridqe
7 Madan Mahal
8 Sneh Nagar
* CONSTRUCTION OF NEW BRIDGE ON OMTI NALA
1 Nav Adarsh colony
2 Kachnar City Vijay Nagar
3 Wright Town
4 Lohiya Bridge Near MLB School
* CONSTRUCTION OF FLY OVERS
1 Khermai to High Court Via Ghamapur Chouk
2 Damoh Naka
3 Ranitaal chowk
* DEVELOPMENT OF ROAD INTERSECTION
1 Ranital
2 Raddi Chouki
3 Ghamapur
4 Hiqh Court
5 Naudra bridge
6 Nagar Nigam
7 Shastri Bridqe
8 Level Crossing
9 Madan Mahal
10 Katnqa
11 Nagrath Chouk
12 Karamchand Chouk
13 Malviya Chouk

Jabalpur Transport Sector CMP Under JNNURM
Municipal Corporation, Jabalpur R-1
172
14 Badi Omti
15 Ghantaghar
16 Malgodam chouk Opp. S.P. Office
17 Ambedkar Choraha
18 Tripuri Tiraha
19 Medical Tiraha
20 Aga Chouka
21 Labour Chouk Near Sneh Naqar
22 Gulaua Chouk
23 Dhanwantri Nagar Chouk
24 Bandariya Tiraha
25 Ranmpur Tiraha
26 Baldeo bagh chouk
27 Bada Fowara
28 Chhota Fowara
29 Tularam Chouk
30 Darshan Tiraha Ranihi
31 Vehicle Factory/Filtration plant tiraha
32 Adhartal Tiraha
33 Goutam Ji ki Madiya Tiraha
34 Tyaab Ali Chouk
35 Income Tax Chouk
36 Shiva Ji Chouk Madan Mahal
37 Gohalpur Police Station Chouk
38 I.T.1. "Y" Junction
39 Bada Pathar Ranjhi
40 Sai Baba Chouk Civil Lines
41 Russel Chowk
CHAPTER- 14
NMT FACILITY IMPROVEMENT PLAN
As per National Urban Transport policy we have proposed features for non motorized transport & Pedestrian
facility improvement.
NMT feature improvement plays an important part in pedestrian safety as well as it is adjacent to Pedestrian
lane & there are stray chances of pedestrian sharing the NMV lane or vice versa. Also at certain places due to
reduced ROW pedestrian & NMV lane can be merged to form a single lane
14.0 Strategy for NMT Facility Improvement:
The Urban Transport Policy for India clearly recognizes the importants of NMV while layingdown
guidelines for providing Public Trandport System .The key Guiding principles for providing NMT
facilities as per NUTP are –

Jabalpur Transport Sector CMP Under JNNURM
Municipal Corporation, Jabalpur R-1
173
(i) Safety: To maximize the safety of users in relation to other road users as they have a high degree
of vulanerability.
(ii) Coherence: Form a coherent and continuous network linking all O & D points for users, and not
adhoc facilities that end abruptly.
(iii) Directness: Form a direct route from Origin to Destination without significant detour that will
cause the users to ignore the facility.
(iv) Attractiveness: Plan and implement NMT facilities to make NMT travel attractive.
(v) Comfort: Ensure a smooth, Quick and Comfortable flow of NMT traffic without excessive
gradients or uneven surfacing.
14.2 Pedestrian Facility Improvement
Pedestrian paths will be located between the NMV track and the service lane or building boundary, on
both sides of the carriageway. The elevation of pedestrian path from the MV lane will not be more than
0.15m. A minimum width of 1.5 m for Pedestrian’s path has been adopted as per highway Capacity
Manual (2000) and Transport Reasearch Board (TRB) United States specifications.
14.2.1 Design Specification for Pedestrian Path
Sl. Title
Specification
1. Location Pedestrian paths will be located between the NMV track and the service
lane or building boundary, on both sides of the carriageway. The elevation
of pedestrian path from the MV lane will not be more than 0.15m.
2. Entry/Exist All pedestrian infrastructures will be barrier free for all. It will be paved
using adequate tactile pavers for blind, with warning blocks laid carefully
at all entrance/exits (openings to side lanes, parking and pedestrian
crossings) to the pedestrian facilities. All entry exist points will be
accessible by wheelchair with a maximum slope of 1:12.
3.
Size of lanes
b. Width The minimum clear width of the pedestrian path will 1.5m. However the
width of pedestrian paths is dependent on pedestrian volumes at a
particular location. The following table will be used to provide adequate
width of pedestrian path.
Effective capacity for width of pedestrian paths:
Effective width of footpath (m) Effective capacity as per LOS C
in persons per/min counted

Jabalpur Transport Sector CMP Under JNNURM
Municipal Corporation, Jabalpur R-1
174
(averaged over 15min.
1.5 23-50
2.5 58-83
3.5 81-116
5.0 115-165
� Where road right of way is constrained, pedestrian paths can be
combined with service lane/and is textured in pavers indicating
pedestrian use and right of way and it is at the same level as
pedestrian infrastructure to maintain a continuity of the pedestrian
path. The speeds of vehicles on all such mixed lanes will be
controlled by the use adequate texture are traffic-calming devices.
� At locations where right of way widths do not permit segregated
bicycle tracks, bicycle track may be combining with pedestrian
path (with a total minimum width of 2.0m) for short stretches. The
level of this stretch (10 to 40m long) will be name as carriageway
and will be segregated from MV lanes using a row of Boland with
a clear gap of between 1.25 to 1.3
� Continuous segregated-unless at stretches where severe
constriction of right of way rules out the possibility of segregated
tracks. At such locations visual continuity of cycle tracks will be
maintained using texture and pavement markings.
� Pedestrian paths will be shaded And space for service providers
(hawkers), benches, street light and poles etc, will be provided
outside the pedestrian path, the edge for which will be clearly
defined.
� Disabled and general public alike will be provided benches for
disabled along the pedestrian path of use. The spacing of such
facilities will be between 180 to 360 m., based on the table shown
below.
� Table Cumulative percentage of mobility impaired people
observed to be unable to move more than the stated distance in
city centers without rest.
18m 68m 137m 180m 360m
Wheelchair Users 0 5 5 60 85
Visually Impaired 0 0 5 50 75
Ambulant Disabled with
walking aid
10 25 40 80 95
Ambulant Disabled without
walking aid
5 15 25 70 80
4. Edge
Treatment
Segregation from NMV Paths:
� NMV lanes will be visually and physically segregated from

Jabalpur Transport Sector CMP Under JNNURM
Municipal Corporation, Jabalpur R-1
175
pedestrian paths to make a clear distinction between the areas to
be used by each user.
� Pedestrian paths will be preferably raised from the NMV lanes by
25 to 75mm. The edge could be maintained by curbstones which
remain flushed with pedestrian path paving.
� NMV lanes can be combined with pedestrian paths at locations
where the right of way is less than 28 to (at stretches with bus
shelter) 25m (at stretches without bus shelter). Such stretches ill
preferably not be longer than 40m. At such locations no visual of
physical edge need to be defined between pedestrian paths and
NMV lanes.
� At locations where providing service lane is advisable and
limitations of right of way land to combining of service lane
parking and pedestrian facilities such as the level of service lane
is raised to 0.15m above the carriageway level and approx 25 to
75mm above the NMV lane level the bicycle track will be
segregated from the service lane using bollards benches planters
etc. with a dear gaps of between 0.45m to 0.65m and a maximum
permissible height of 0.65m.
� Segregation from Service/parking lanes
� Pedestrian paths will be on both sides of the service lane and
they will be 0.10 to 0.15m above the level of the service lane.
5. Surface
Quality
Pavement pattern, texture and colour of pedestrian paths will be used to
define a clear pedestrian right of way and to emphasize its directness and
continuity. The walking surface will be as free from surface irregularities to
prevent tripping against raised edges.
6. Slops Cross slope for drainage: -
Minimum pavement cross slope of 2 percent adequately provides for
drainage.
Sloping in the direction of curb drain and gutters will be ensured. Smooth
surface is essential to prevent water ponding.
Table 12: Permissible Longitudinal Grade and length for Pedestrian path
and wheel chair ramps (a landing minimum 1.5m long is recommended
after this length) 10.
Length Ramp (in
meters) Maximum gradient
2 1:12
5 1:15
10 1:2

Jabalpur Transport Sector CMP Under JNNURM
Municipal Corporation, Jabalpur R-1
176
14.3 NMV Facility Improvement.
14.3.1 Cycle and Rickshaw Tracks Segregation
Cyclists occupy the curbside lane in a mixed traffic situation. They share this lane with transport and
goods vehicles, buses and three wheeled scooter taxies, leading to the risk of serious accidents.
Thus cycle track segregation is required on all roads with maximum speeds more than 50 km/h
according to all international design guidelines. Cycle track segregation also helps in improving the
traffic flow of other motor vehicles. Even a low cycle volume prevents motorists from using the
curbside lane of the carriageway, as the speed differential between the two makes maneuvering
between the cyclists almost
Conclusion: A segregated bicycle lane is mandatory on all roads with peak speeds of more than 50
km/h. This not only improves bicycle safety but also eliminates friction with motor vehicles improving
its throughput.
Ideal width
Passenger and goods cycle, rickshaws and handcarts also use cycle tracks also along with the
cyclists. The width used by each is as following:
Bicycle - 0.75m
Passenger cycle rickshaw - 0.95m, Goods Cycle Rickshaw- 1.20m
Based on these the minimum and the comfortable width required to allow two way traffic are given
in table 14.1.
Table 14.1 Width of cycle track with respect to its usage
In case of cycle volumes are more than 5000 cyclists per hour (for both direction traffic) cycle tracks
width should be wider than 3.0m may be required. However for lower volumes it is not advisable to
have Widths of cycle tracks less than 1: 5m or more than 2.5. A lesser Width will discourage bicycle
use a higher width would encourage encroachment by other functions such as parking and through
two wheeler traffic.
Conclusion: Width of segregated cycle tracks may vary from 1.5m to 2.5 m depending on bicycle
S.No. Used by Min. Width Comfortable
Width
1. Bicycles 1.5m 1.8m
2. Bicycles and Passenger Rickshaws 1.8m 2.0m
3. Bicycles and Goods Rickshaws 2.0m 2.2m
4. Passenger and Goods Rickshaws 2.2m 2.5m
5. Heavy Goods Rickshaws traffic 2.5m 3.0m

Jabalpur Transport Sector CMP Under JNNURM
Municipal Corporation, Jabalpur R-1
177
traffic and site constraints.
Ideal location
Cyclists are mainstream commuters. They seldom trust lanes or paths, which are away from the
carriageway or likely to be poorly maintained, terminate suddenly. Hence the cycle path will be at
similar level as the carriageway and visually and physically close the motor vehicle lanes. The
cyclists will have an option of joining the main carriageway whenever he/she wishes.
Conclusion: Cycle path will be provided adjacent to the motor vehicular lanes, segregated by a
median, which is mountable by the cyclists.
Material:
Cycles and cycle rickshaws 'do not have shock absorbers. It is therefore advisable to provide
smooth riding surface to the cyclists. However surfacing material such as asphalt requires frequent
maintenance, because of its width (narrower than a Motor Vehicle lane) is difficult as it restricts the
use of pavers. It is therefore advisable to pave the cycle lanes In cement concrete with minimum
vertical and horizontal difference between slabs at joints to be within permissible comfort levels.
Conclusion: Cycle tracks will be constructed in cement concrete, where they are narrower than 3.5m
in widths.
14.3.2 Design Specification for Non Motorized Vehicular (NMV) Lanes
Sl.
No.
Title Specification
1. Location A single path for non-motorized vehicles such as cycles and cycle rickshaws will
be provided between motor vehicle lanes and the pedestrian path for each
direction of traffic on both sides of the road and is will preferably be 50 to 100mm
above the carriageway level.
Entry/Exit � NMV lanes need to be punctured at the junctions and at entrance to
properties/ side lane or access to service lane to allow access by
cyclists and cycle rickshaws.
� Bollards will be used at all entry and exit points to cycle (track with 1. 25
m to 1.3 m as the clear distance between there as 1.25 m and a
maximum height of 0.65m, to prevent encroachment by motor vehicles
and TSRs.
� At all entrance/exit points to NMV tracks other than those at signalized
intersections, the entrance exit area will be raised to a level of 0.15m
above the. Carriageway, and accessed by a ramp with a maximum
slope of 1 to 10 from all sides.
At junctions (on the after side of the junction), the segregation between NMV and
MV lane will be setback by a minimum of 30m. Independent bollards or
curbstones spaced at an interval of 1.5 to 20m will be used to define the cycle
path for this length. This would give the cyclists (released in groups after each
red light) the flexibility to enter the NMV lane along the edge. If the entrance IS
congested by slow moving rickshaw traffic.
3 Parking High parking demand exists for cycle rickshaws, which ply on main roads a

Jabalpur Transport Sector CMP Under JNNURM
Municipal Corporation, Jabalpur R-1
178
serve as feeder service to public transport. The specifications for providing
cycle rickshaw parking along BRT corridor shall be as following:
Cycle rickshaw parking will be provided adjacent to cycle tracks (at the same
level) as 1.5m to 2.5m deep bays (for parallel or parallel or perpendicular
parking) near pedestrian crossings, bus shelters, important nodes, and
landmarks attracting heavy pedestrian traffic; or wherever existing demand is
observed.
� Cycle rickshaw parking will be close to pedestrian crossings at
intersections preferably on the 'on side' of the junction.
� The capacity of cycle rickshaw parking will be as per existing demand at
that location.
� Cycle rickshaw parking will include, features such as sign.
� Boards, light poles, stands, rails (for locking bicycles) etc.
4. Size of
lanes
Clear width of NMV lanes will preferably be 2.5 m. Where road right of way is
constrained, the NMV lane width can be reduced to 1.80 m. In case of severe
constriction of right of way, NMV lane width can be reduced to 1.5m but this
width will not be consistent over large lengths of the lane. At locations where
right of way widths do not permit segregated bicycle tracks, bicycle track may be
combining with pedestrian path (with a total minimum width of 2.0m) for short
stretches. The level of this stretch (10 to 40m long) will be the same as
carriageway and will be segregated from MV lanes using a row of bollards with a
clear gap of between 1.25 to 1.30 m. At constrained right of way locations where
the combined minimum width of NMV lanes and pedestrian paths will be
between 2.5 and--3.5m, and the total length of the constrained stretch is not
more than 10m, the bicycle path may be raised using ramps with min. gradient of
1:10 to the level of the footpath for combining the two at both ends of the
constrained stretch.
Length Continuous segregated unless at stretches where sever constriction of right of
way rules out the possibility of segregated tracks. At such locations visual
continuity of cycle tracks will be maintained using texture and pavement
markings.
Edge
Treatment
Segregation from Pedestrian Paths:
� NMV lanes will be visually and physically segregated from pedestrian
paths to make a clear distinction between the areas to be used by each
user.
� Pedestrian paths will be preferably raised from the' NMV lanes by 25 to
75mm. The edge could be maintained by curbstones, which remain
flushed with pedestrian path paving.
� At locations where providing service lane is advisable and limitations of
right. of way lead to combining of service lane, parking and pedestrian
facilities such as fhe level of service lane is raised to 0.15m above the

Jabalpur Transport Sector CMP Under JNNURM
Municipal Corporation, Jabalpur R-1
179
carriageway level and approx. 25 to 75mm above the NMV lane level;
the bicycle track will be segregated from the service lane using bollards,
benches, planters etc. with a clear gaps of between 0.45m to 0.65m and
a maximum permissible height of 0.65m.
Segregation from MV lanes:
� On streets where fast moving MV traffic is expected (i.e. peak speeds of
more than 50 km/hr) the desirable width to have O.5m segregation
between MV lanes and the cycle track.
� Such segregation will be created using curbstones with the maximum
height of the edge facing MV lanes as 0 .15m.
� In case of narrow road right of way the segregation between cycle track
and MV lanes will be reduced to a 0.15m high (from MV lanes). O.3m
wide, median. The level of the cycle track may be raised so as the
vertical edge from cycle track is only 75 to 50mm high
5. Surface
Quality
The surface of bicycle path will be in 100mm thick cement concrete with 200 mm
thick PCC base.
Gapes and
Joints
Joints and Utility Work
The quality of a bikeway's riding surface is important. Pavement surface
irregularities can do more than cause an unpleasant ride. Gaps between
pavement slabs or drop-ofts at overlays or patches parallel to the direction of
travel can trap a bicycle wheel and cause loss of control. Holes and bumps can
cause bicyclists to swerve into the path of motor vehicles. A single surface
irregularity in itself may not cause as much discomfort, as a group of continuous
irregularity in itself may not cause as much discomfort as a group of or
continuous irregularities. Bicycle pavements will be at least as smooth as the
adjacent road or bicyclists may not use them. The two types of hazards, which
are classified as surface irregularities, are cracks and projections. Cracks are
generally normal fissures such as the gap between two slabs of pavement.
Sinking drainage grates or crude patch jobs may cause projections. They are
further classified as having a parallel or perpendicular orientation. Table 8 shows
maximum acceptable surface irregularities on bikeways.
Table: Maximum acceptable surface regularities on bikeways.
Orientation of
Irregularities
Cracks 1 Projections 2
Irregularities
Parallel 13 mm wide 10 mm high
Perpendicular 13 mm wide 20 mm high
1) Cracks/Fissures in the surface. Often found in hot mix asphalt surfaces or
between slabs of Portland cement concrete. 2) Projection abrupt rises in the
surface of the traveled way. May be caused by sinking drainage grates, crude
patching of the surface, and partial erosion of a layer of asphalt, pavement joints,
pedestrian ramp transitions, or root growth under pavement.

Jabalpur Transport Sector CMP Under JNNURM
Municipal Corporation, Jabalpur R-1
180
To ensure that the riding surface is maintained at a level, which is smooth
enough for bicyclist's safety and comfort, the following guidelines will be
followed.
1. Locate public utility installations such as manhole covers, drainage grates and
grate chambers so that they remain outside of paths Inspect control joints on
paths.
2. Schedule regular maintenance to remove sand (including early removal of
sand left by winter sanding operations), earth and other matter that may
cause skidding.
3. Eliminate surface irregularities which may make riding uncomfortably
Bumpy or lead to drainage problems of cause.
Bicyclists to use the roadway instead of path.
Texture NMV track surface will be provided texture to allow for sufficient skid resistance.
The texture will preferably be parallel to cross slope for drainage and
perpendicular to bicycle movement, to prevent pounding on the track.
7. Slops Longitudinal Grade Length
5%-8% 240m
7% 120m
8% 90m
9% 80m
10% 30m
11+% 15m
Cross Slopes for drainage:
The recommended minimum pavement cross slope of 2 percent adequately
provides for drainage. Sloping in the direction of curb drain and gutters will be
ensured. Smooth surface is essential to prevent water pounding. Where
necessary, catch basins with drains will be provided to carry the intercepted
water under the path. Drainage grates and manhole coves will be located
outside of the travel path of users. To assist in draining the area adjacent to the
NMV track, the design will include consideration for preserving the natural
ground cover. Permissible Longitudinal Grade and Length Table:
Maximum grade lengths for bicycle paths with grades in excess of 5%7.

Jabalpur Transport Sector CMP Under JNNURM
Municipal Corporation, Jabalpur R-1
181
CHAPTER - 15
INTERMODAL FACILITIES
Mechanism to ensure viable and sustainable operations of busses based on viability analysis:
The bus routes has been designed & proposed as such so as to work in tandem with existing routes .i.e.
The existing routes acting as arterials or feeders routes or supporting the designated arterial or feeder
routes.This in itself will lead to increased economics viability & sustainability of transportation as different
modes of transport support each other.
Also
(i) JCTSL existing staff numbers and resources will be strengthened leading to major fortification of
viability & sustainability of BRTS operations.
(ii) Efficient land use by ensuring optional development of properties alongside corridors i.e.by
(iii) Increasing FSI of the properties
(iv) By developing properties to support passengers i.e. passenger oriented facilities like eateries,
ATM’s efficient parking space, convenience stores, medical stores.
(v) Government properties/land not being used can be rented to private companies.
Further to their means, PPP model has been proposed for lease of Government building ensuring
further recurring in- flow of funds .
(vi) The hoardings & adverts on Bus stops, terminals, busses & nearby building at designated places
will be rented out.

Jabalpur Transport Sector CMP Under JNNURM
Municipal Corporation, Jabalpur R-1
182
(vii) Underground cable ducts alongside corridors leased out for a fixed tenure.
15.1 Bus Terminals and Depots
15.1.1 Bus Terminals
In systems utilising feeder services, the decision on where to terminate the exclusive busway
(i.e., trunk corridor) may depend in part on the availability of land for a terminal site. A terminal is
required to facilitate the transfers between feeder and trunk line operations. Additionally, depots
for vehicle parking and maintenance are normally located near the terminal site in order to
facilitate rapid and cost-effective entry of the vehicles into service. Given the relatively large
amount of land required for terminal and depot sites, property acquisition costs will likely be a
major part of the decision on where to locate the sites. Social considerations may also play a
role in the length of a corridor. If low-income communities at the city's periphery are to be
targeted for service for social equity reasons, then the corridor may be extended to cater to
these groups. Thus, while passenger demand will be a principal determinant, other factors such
as terminal and depot siting as well as social considerations, will also play a part in determining
the length of a busway corridor.
Typically, in MRT systems, terminals are the most important transfer points. They are normally
located at the end of each trunk corridor, and provide important transfers between trunk lines
and feeder bus lines serving surrounding areas. The design of the interchange facility should
minimise both customer and vehicle movements to the extent possible. Thus, the most likely
transfer points between complementary routes should be located closely together.
As both feeder vehicles and trunk-line vehicles will be staging at the terminal, the movement of
vehicles should be devised to avoid congestion. Most typically, feeder vehicles arrive on one
side of a platform area with trunk-line vehicles wait on the opposite side.
Other configurations are also possible. Feeder platforms may be placed in an area somewhat
separate from the trunk platforms. This configuration will likely imply that customers must walk
farther to access the trunk services. However, such a configuration may be necessary if the
number of feeder routes greatly exceed the number of trunk routes (and thus creating a
mismatch in terms of platform space). Also, such alternative configurations may also be
necessary due to the physical nature and layout of the intended site for the terminal facility
Terminals are usually the largest transfer facilities in the system, but the terminals also serve
other purposes. Space is typically made available for BRT vehicles to park in order to allow
service adjustments. Obvious adjustments are required between operating during busy peak
periods and non-peak periods. In other cases, the departure times for vehicles are carefully adjusted
in order to assure consistent headways.
The overall design of the terminal facility should seek to optimise fluid movements for both vehicles
and customers. Appropriate spacing should be created to allow vehicles to comfortably move in and
out of position at the stopping bays. Figure 11.96 provides a schematic of an entire terminal facility.
The terminal design must also take into account required turning movements of BRT vehicles.
Whether or not the facility is designed for fare free transfers will have a significant impact on the
facility's design. Fare-free transfers mean that passengers can move from feeder services to trunk line
services with our an additional fare.

Jabalpur Transport Sector CMP Under JNNURM
Municipal Corporation, Jabalpur R-1
183
If an additional fare payment is required, then space must be given to fare collection and fare
verification activities. The physical division between the different fare areas must also be sufficient to
avoid problems with fare evasion.
Given the large numbers of passengers passing through terminal areas, design against crimes such
as pick pocketing should also be considered. Thus, measures such as security cameras may be
appropriate.
Terminals may also serve a range of customer service functions. Some of the provided facilities may
include information kiosks, lost and found offices, restrooms, and commercial establishments.
The architectural design of terminals can either mimic the style of the system's stations or take on a
different look. Terminal platforms are typically not enclosed with walls since entrance to the terminal
site is controlled from a distance. Terminal facilities in cities such as Bogota and Quito have high
ceiling designs with modern roof structures. The scale and style of these facilities imparts an
impression of importance to the customer and helps to instill the system's professional image.
Location of the Proposed Terminal
(A) Interstate Bus Terminal:
Existing ISBT located at Nagar Nigam chauraha is not adequate in terms of its bus handling
capacity, therefore it is necessary to have a new ISBT at Madhotall of approx.10 Hect. Area to
facilitate passenger access.However the existing bus terminal also needs upgradation.
(B) Regional Bus Terminal: The following Regional Bus Terminals are being proposed--
(i) Regional Bus Stand at Damoh Naka
(ii) Corporartion City Bus Stand & Dwarka Pradsad Mishra Bus Terminal
(iii) On ARP near Jabalpur pond
(iv) On ARP at Garha near Paraswara village.
(C) City Bus Terminals:
The following Bus Terminals are being proposed in addition to the existing main Bus
Terminal at Nagar Nigam chauraha.
(i). At Agriculture College
(ii). At Jhanda Chowk (Gwarighat)
(iii). At Tilwara Ghat
(iv). Khamariya
(v). At Gaur bridge
(vi). At Rani Durgavati Vishva Vidyalya (RDVV)
(vii). On Patan marg near Karmeta.
15.1.2 Depots
Depot areas serve an array of purposes including bus-parking areas, re-fuelling facilities, vehicle
washing and cleaning, maintenance and repair areas, and administrative offices for operators, and
employee facilities.
Depot location
Depots are generally, but not always, adjacent to terminals. Normally, the vehicle will enter the
terminal several times a day, but it will generally enter the depot only if it is being taken out of service,
either because it is a nonpeak period, because it is the end of the day, or because it is in need of

Jabalpur Transport Sector CMP Under JNNURM
Municipal Corporation, Jabalpur R-1
184
repairs.
Ideally, depots will be located at or adjacent to terminal facilities, so that depot parking can also be
used for BRT vehicles coming out of service for off-peak periods without having to travel a long
distance to return to a depot. Travel between the depot and terminal areas create" dead kilometers"
since fuel and other expenses are consumed without generating any passenger revenues. These
dead kilometers can considerably increase overall operating costs. Such separation can also create
service irregularities, especially if the BRT vehicles are delayed in mixed traffic congestion while
traveling from the depot.
However, since depots can consume considerable space, the location is often dependent upon the
economical acquisition of sufficient property. In some cases, sufficient land is not available near a
terminal site and any site acquisition can be quite costly.
BRT vehicles must not only travel a long distance from the depot in the morning and to the depot in
the evening, but must travel to depot parking during the non-peak periods. As an alternative to
locating the depot nearby the terminal, it is possible to increase the amount of temporary vehicle
parking at the terminal area or through intermediate parking facilities. However, again, there is often a
limitation on sufficient terminal parking to accommodate all the vehicles.
Terminals and depots for BRT may also be integrated with other transport facilities. This co-location of
urban and long-distance services holds benefits both to the customer as well as the private operators.
Customers are able to easily transfer from the long-distance services into the BRT system. The private
operators may also gain benefit in terms of any shared facilities with long-distance operators.
15.2 Bus –Rail Interchange:
Railway services are available from Madan Mahal station, Jabalpur city station, Haubagh, Adhartal and
Gwarighat railway station in the Jabalpur city. Accordingly,the city Bus Terminals at all of the above
locations are also being proposed which will act as a Bus –Rail interchange. At all these city Bus
Terminals following facilities for the passengers like retireing rooms, waiting rooms , reservration
counters electronic bus route displays etc. should be provided.
15.3 Park and Ride Facilities:
The location of the parking facility should be convenient to the station area. A long walk may
discourage usage from discretionary customers. In cities with frequently unseasonable weather
(wind, rain, strong sun), covered walkways in the parking area may be a worthwhile investment.
In some areas, it will be necessary to include security measures at the parking facilities. Security
measures such as an attendant or security cameras can be effective. If security is insufficient,
motorists will choose to use their private vehicle for the entire commute.
Whether motorists should be charged for parking at a park-and-ride facility depends on the
location of the facility and the set of incentives in place. Subsidising parking for higher income
motorists far from the city centre can be justified because it will encourage motorists to make a
long public transport Trip, reducing significantly the congestion and air pollution that would
otherwise have resulted from the trip. The closer the park-and-ride facility is to the city centre, the less
the social benefit, and hence the weaker the justification for a public subsidy.
15.3.1 Parking Policy – Existing and Proposed
Few policies are as emotionally charged for citizens as parking policy. Threatening to remove even a
few parking spaces to put in a BRT system may seem a daunting challenge to a politician, even if it

Jabalpur Transport Sector CMP Under JNNURM
Municipal Corporation, Jabalpur R-1
185
improves hundreds of thousands of public transport passenger trips daily. First world mayors have the
legal powers to regulate on-street parking, but most fear to use this power. In the Jabalpur, political
control over parking is generally not fully in the hands of mayors, but in the hands of the police, sub
municipal governments, or even local mafias.
A lot of parking is in private hands. Often government employees and the police themselves are
recipients of privileged access to choice parking locations and parking revenues.
Existing parking conditions in Jabalpur are generally far from optimal from almost anyone's
perspective. This situation creates the opportunity to use a BRT project to actually improve the
overall parking situation for motorists, even if the project itself needs to remove thousands of
units of on-street parking. While a mayor may choose to use the BRT project to actually reduce
total city centre parking in order to encourage public transport use and discourage driving, there
are technical tools available even for a mayor that does not want to reduce parking availability. In
either case, a technically sound parking plan is critical, and the mayor's office should prepare a
good public awareness and outreach campaign.
Table summarizes the various parking management strategies that better allow municipalities to
control public space and the growth of private vehicle use.
Table 15.1 Parking management strategies
S.No. Management Strategy Description
Strategies that result in more efficient use of parking facilities
1 Shared parking Parking spaces are shared by more than one user, allowing
facilities to be used more efficiently.
2 Regulate parking facility
use
More convenient and visible parking spaces are managed and
regulated to give porosity to higher-value trips, increase
efficiency and user convenience.
3 More accurate and
flexible standards
Reduce or adjust standards to more accurately reflect demand
at a particular location, taking into account geographic,
demographic and economic factors.
4 Parking maximums Establish maximum in addition or instead of minimum parking
standards to avoid excessive parking supply.
5 Remote parking Encouraging longer-term parkers to use off-site or fringe
parking facilities, so more convenient spaces are available for
porosity users.
6 Improving user
information and marketing
Provide convenient and accurate information on parking
ava6ab6ity and price, using maps, signs, brochures and
electronic communication.
7 Smart growth and
location efficient
development
Encourage more clustered, mixed, multi-modal, initial
development, which allows more shared parking and use of
alternative modes.
8 Improved workability Improve pedestrian condition to allow parkers to conveniently

Jabalpur Transport Sector CMP Under JNNURM
Municipal Corporation, Jabalpur R-1
186
access more parking fac6ities, increasing the functional supply
in an area.
9 Transportation
Management Association
Transportation Management Association are private, non-
profit, member-controlled organizations that can provide
variety of services that encourage more efficient use of
transport and parking resources in an area.
Strategies that reduce parking demand
10 Transportation Demand
Management
programmes
Versus strategies and programmes can encourage more
efficient travel patterns, which, reduces automob6e trips and
parking demand.
12 Parking Pricing Charge motorists directly for using parking facilities, and set
fees to encourage efficient use of parking facilities.
13 Improve parking Pricing
methods
Use of more convenient and effective parking pricing
techniques to make parking pricing more acceptable and cost
effective.
14 Commuter financial
incentives
Parking cash out and transit benefits give commuters financial
incentives to shift modes and reduce parking demand.
15 Unbundled Parking Rent or sell parking spaces separately from binding space, so
occupants pay for just the number of parking spaces that they
use.
16 Tax parking facilities Impose specials taxes on parking facilities and commercial
parking transactions.
17 Improve enforcement and
control
Enforcement should be consistent, fair and friendly. Parking
passes should have clear limitations regarding where, when
and by whom they may be used, and these limitations should
be enforced.
18 Bicycle facilities Supply bicycle parking, storage and changing fac6ities instead
of some automob6e parking spaces.
Strategies that reduce negative Impacts
19 Develop overflow parking
plans
Encourage use of remote parking fac6ities and promote use of
alternative modes during peak persist, such as busy shopping
times and major events.
20 Address spal over
problems
Address spal-over parking problems directly with
management, pricing and enforcement strategies.
21 Parking facility design
and management
Improved parking fac6ity design to address safety, storm
water management, user comfort, security and aesthetic
objectives.
15.3.2 Surveying parking conditions
Securing political support for any change in the existing parking regime is critical. The first step is
to understand fully the existing parking situation and then publicized those elements of the status
quo that are unfair and inequitable. The BRT system can then be presented as an opportunity to

Jabalpur Transport Sector CMP Under JNNURM
Municipal Corporation, Jabalpur R-1
187
optimise parking regulation in the impacted area, and if time permits in the city more generally.
To make this case to the public, policymakers should prepare themselves with as much
information as possible. A good place to start is to conduct a parking occupancy study reviewing
the existing parking situation.
The parking study usually first involves collecting data on the following:
• Total existing officially designated on-street parking units and their specific locations;
• Total locations where people regularly park, whether or not officially designated;
• Total off-street parking units available;
• Existing parking regulatory regime, including time period restrictions if any, and charging
structure for each type of parking unit;
• Total actual occupancy of these parking units throughout the day.
The evaluation of the existing parking situation and its ramifications for parking availability in the
area impacted by the BRT system should then be discussed at a public dialogue. In such a
dialogue, it will generally become clear that some people benefit much more from the existing
parking regime than others.
15.3.3 Parking Space Levy
Based on these experiences, a parking fee can be quite effective at multiple complementary
objectives:
� Reducing private vehicle usage
� Encouraging journeys by public transport
� Raising revenues for public transport infrastructure.
Parking fees may also be a particularly relevant option for developing-nation cities, especially as a
short- to medium-term revenue raising mechanism.
Since the parking space levy is assessed whether or not a space is being utilised regularly, property
owners have an incentive to scrutinize the usefulness of maintaining each parking space. Without a
parking space levy, an urban parking lot may be financially viable even if only a fraction of the spaces
are actually used. With a parking space levy, property owners will tend to convert the space to more
productive uses.
Since the parking space levy is assessed whether or not a space is being utilised regularly, property
owners have an incentive to scrutinise the usefulness of maintaining each parking space. Without a
parking space levy, an urban parking lot may be financially viable even if only a fraction of the spaces
are actually used. With a parking space levy, property owners will tend to convert the space to more
productive uses.
Removing on-street parking, for all its political complexity, is extremely simple from a technical point of
view. The designated parking area can simply be removed. It can be replaced either with a mixed
traffic lane, a bicycle lane, a foot- path, or landscaping. In many cases, planners may decide to
replace the parking space with additional footpath space. Since enforcement is an issue in developing
countries, the use of physical structures like very high curbs and bollards can be necessary to keep
motorists off the footpaths. In general, though, use of trees of other landscaping are a more
aesthetically pleasing form of protective barrier. Some countries use bicycle parking as a bollard,

Jabalpur Transport Sector CMP Under JNNURM
Municipal Corporation, Jabalpur R-1
188
which provides a useful additional service.
Off-street parking can also be regulated through taxation, the removal of subsidies, and changing
building codes. In some countries building owners are given a property tax break if they provide off-
street parking. Such tax breaks tend to encourage the use of private motor vehicle use. To discourage
driving, these tax breaks should be removed or subsidies of equal value should be given to
employees willing to bicycle or use public transport. Parking garages can also be taxed.
Building codes also often frequently create sub optimal parking supply incentives, and should be
reviewed and, if necessary, changed. A BRT project might be a good opportunity to review these
standards. Table 15.2 notes the minimum parking standards required in Jabalpur.
Table 15.2 Jabalpur minimum Parking requirements
S.No. Use Parking Requirement
CBD
1 Offices 1 Space per 100 sqm
2 Commercial 1 Space per 200 sqm
3 Hotel 1 Space per 10 Beds
4 Hospital 1 Space per 10 Beds
5 Flats 1 Space per unit
15.3.4 Design Specification of Parking
Parking has been proposed near Bus stops, bus terminal at convenient locations so as passengers are
provided with shortest routes facilitating minimum travel time & nearby availability of amentias like medical,
convenience stores etc
S.No. Title Specifications
1 Location � Parking will be provided (wherever space permits) in the front of
property boundaries (providing footpath on both sides.)
2. Entry/Exit � Raised platform treatment will be provided at entrance/exit of parking
space. This helps reduces speed of conflicting vehicles. The entry exit
will be raised at the level of pedestrian footpath, with lines defining
cycle path across it created in flushed concrete blocks. The texture
provided will clearly indicate the pedestrian right of way.
3. Size
Width � Parking space will have a minimum width of 3.0 m for parallel parking
and 6.0 m for perpendicular parking.
Length � Parking may be provided along the length of the road/service lane.
However care will be taken and infrastructure designed to discourage
obstructive parking in front of property and side lane accesses.
4. Edge
Treatment
� Parking shall be at the same level as the service lane or 0.10 to 0.15
m below the level of pedestrian path.
� Parking can be segregated from the service lane, visual providing a
different texture, which may be rougher than the one used for service
lane. Demarcation for each car parking space may also be done using
a variety of textures.

Jabalpur Transport Sector CMP Under JNNURM
Municipal Corporation, Jabalpur R-1
189
5. Surface
Quality
� A variety of surfacing materials can be used to pave parking space.
These vary from asphalt, to concrete to block pavers when combined
with pedestrians.
6. Slopes � The recommended minimum pavement cross slope of 2 % adequately
provides for drainage. Sloping in the direction of curb drain and gutters
will be ensured. Smooth surface is essential to prevent waterproofing.
� A recommended ramp with a gradient of 1: 10 will be provided to
access at raised platforms at the entrance/exit to parking space. The
ramp texture will be resistant to skid and wear.
15.3.5 Location of Proposed Parking details
Off-street Parkings are proposed at all the existing and proposed railway stations, all bus
terminals, at all existing & proposed Transport Nagar etc. Apart from this development of multi
level (Three stories) parkings are also being proposed for C.B.D.
1. At Niwadganj mandi
2. At Shrinath ki Talaiya
3. At Lordganj Police station
4. At Tilak bhomi ki Talaiya
5. At Naudara bridge over Omati Nala
6. Near Victoriya Hospital
7. Gorakhpur.
Block Cost
Parking facilities can be quite costly to develop and construct. Each at grade parking bay, may cost
Rs.20.0 Lacs to Rs. 30.0 Lacs. When land purchase costs are excluded. Each parking bay within a
multi-level parking facility will likely cost in the range of Rs.5 Crores to Rs. 6 Crores. Costs can be
even greater in areas with significant land costs. Thus, it can be quite appropriate to establish a fee
for use of parking facilities at public transport stations. The challenge is to develop a fee structure that
still provides a strong incentive for using the public transport system.
Private vehicle owners can also be successfully integrated with the system through the development
of "park-and-ride" or "kiss-and-ride" facilities. These facilities allow private vehicle users to access
the transit system, and therefore complete their total commute by way of public transport. A park-
and-ride facility provides a parking garage or parking lot for vehicles to be kept securely during
the day. A kiss-and-ride facility does not provide parking but rather includes a passenger drop-off
area for private vehicles. A park-and-ride facility should also include space for the kiss-and-ride
option.
The benefits of park-and-ride facilities immediately adjacent to a popular public transport station
must be weighted against the benefits of alternative uses for this land, such as for commercial
development or public amenities. Commercial services and safe and comfortable access for
feeder buses, cyclists, and pedestrians should have priority in public transport station design.
Park-and-ride and kiss-and-ride facilities are most appropriate in suburban locations where
population densities may be insufficient to justify costly feeder services, and distances are too far
to make direct walking and cycling access to the station viable for most people. In developing
cities, these conditions will primarily be found in neighborhoods dominated by affluent

Jabalpur Transport Sector CMP Under JNNURM
Municipal Corporation, Jabalpur R-1
190
households that have sufficient disposable income to own a private vehicle. Attracting this
income group to the public transport system an deliver several benefits. First, offsetting private
vehicle use pays significant dividends in terms of emission reductions and congestion relief.
Second, a public transport system that is of sufficient quality to attract even the highest income
groups is a worthy objective. Third, a healthy mix of all a city's income groups in the system
means that all political interests will have an incentive to ensure the system's future. Finally,
systems which serve all income groups also serve an important social function since the public
transport system may be the one location where all segments of society come together.
The park-and-ride and kiss-and-ride facilities are best situated in suburban locations where land is
less at a premium, and where the target customers are encouraged to travel as much of their total trip
by public transport as possible. Park and-ride is less desirable in downtown locations where the
parking facility is likely to be used to drive into the downtown. The time and cost of switching to public
transport only for the final few kilometers means that few customers will utilize the system under such
circumstances. The principal incentive to these customers will be the timesavings achieved by the
exclusive bus ways over the main portion of the commute
15.4 Freight / Goods Terminals:
Existing Railway Godowns at Madan Mahal and Jabalpur Main station would continue to function
in the future. In addition, Railway Godown has been proposed within Adhartal Railway land due
to its proximity with Kachpura Railway siding and industrial area.
* Transport Nagar over 15 hectares land has been proposed at Maharajpur. In addition truck
terminals over four to five hectares are proposed at Oriya, Wahdan, Kungwa, Paraswara and
Madhotal.
* DEVELOPMENT OF NEW TRANSPORT NAGAR
1 At Maharajpur on Katni Road NH - 7 (4.5 Hact)
2 At Oriya on Damoh/Sagar road (4.0 Hact)
3 At Baidan on Katni Bye pass road (4.0 Hact)
4 At Kuganwa on Narsinghpur road (4.0 Hact)
5 At Goraya on Mandla road (4.0 Hact)

Jabalpur Transport Sector CMP Under JNNURM
Municipal Corporation, Jabalpur R-1
191
CHAPTER - 16
REGULATORY AND INSTITUTIONAL MEASURES
Reporting Jurisdiction: Limits of Municipal Boundary / Planning Boundary
16.1 Unified Metropolitan Transport Authority:
16.1.1 Operations and Management of Proposed Transport System in Jabalpur
Jabalpur city Transport Services Ltd. (JCTSL) is a public limited company working under public-
private partnership model designed for operation by private contractors and service providers under
government oversight. System implementation requires detailed technical, legal, and financial design;
creation of a new public entity in charge of system planning, development, and control; overcoming
resistance to change from traditional operators and small bus owners; development of the
infrastructure; contracting and starting up the operation; and earmarking with provision of funds for
system expansion.
Proposed Transport shall be composed of following components:
I. Specialized infrastructure;
II. Efficient operations;
III. Advanced fare collection;
IV. Institution for system planning, development, and control.
V. Public institutions to provide infrastructure, planning, and control,
VI. Operations and billeting are to be contracted out to private companies.
16.1.2 Integrated Route Planning (TRANSPORT MASTER PLAN)
The city bus route network system has been planned and designed in a scientific manner. Direction
oriented Hub and Spoke pattern of routing has been adopted. Routes have been planned to ensure
that besides the regular city transport users, office goers, students and employees should also avail

Jabalpur Transport Sector CMP Under JNNURM
Municipal Corporation, Jabalpur R-1
192
the services. It has been ensured that proposed routes caters to the requirement of places of
residence as well as places of job. 8 Nos. high travel demand routes have been identified. Company
has taken permit for these routes from R.T.O After due testing of routes and time scheduling JCTSL
has initially started operation of 30 buses on these identified routes and later on add to its fleet of
coaches to improve the frequency of buses at particular bus stop of intersection. Colour coding of
routes and buses and their numbering has been carried out in such a manner that a commuter may
easily identify the bus stop and intersection for convenient commuting.
6.1.4 Integrated Plan for facilities to commuters
Rider ship
A comprehensive Traffic and Transportation Study for Jabalpur Urban Area (CTTS) have been
prepared in April 2003. The CTTS as estimated the travel demand by 2015 to be by 2.19 million and
2029 to be 4.1 million person trips per day.The public transport service caters 14.74 percent of total
trips. Hence by the year 2015 if the public transport is used at the rate of 60% by 2011 the rider ships
will have to be 2.32 million passenger trips per day. We are looking forward to the System where
overall average speed of average 50 kilometers per hour overall.
Cost Recovery
The JCTSL system runs without any operating subsidy from the government. Given that it is almost
privately operated, any increase in revenue from expending passenger totals goes to the operators.
Likewise, if costs increase or demand declines, the private operators are required to absorb the risk
and cover losses. The governments will have to cover capital investments only in the form of
specialized infrastructure development. Experience of operations of past 6 months by JCTSL are so
encouraging and profitable to the operators, service providers and the company that the scope of
increasing the fleet size and improving the quality of buses with better specifications are very high. In
fact the transport companies are trying hard to get their fleet inducted into the JCTSL umbrella.
Future Expansion
The system will be gradually expanded to cover entire city. All future planning of proposed master
plan roads can be made as per BRTS requirements if proposed transit network performs well. This
may cater more than 23 lacs passengers per day by 2015.
16.1.5 Integrated Plan for Institutional framework
(A) Management
The management of the company is entrusted with the Board of directors. There are seven members
on Board of Directors with District Collector of Jabalpur as its Executive Director who has been
entitled to exercise all powers for effective operation and management of the new transport system
under Public private Partnership model.
(B) Board of Directors
The Board of Directors will hold their office by the virtue of their posts. The following are the members
on the board and Subscribers to the Memorandum and Articles of Association. The members on the
board of director’s are:-

Jabalpur Transport Sector CMP Under JNNURM
Municipal Corporation, Jabalpur R-1
193
Current Profile Designation
Mayor of Jabalpur Chairperson
Collector Jabalpur Executive Director.
Municipal Commissioner
Director
Chairman J.DA Director
Addl. Collector Director
CEO, JDA Director
Besides Regional Transport Officer Jabalpur as a subscriber member and Superintendent of Police,
Jabalpur (ex-officio) as a special invitee member to all meetings of the Board will be in team. It has
also been resolved that all the operators shall also be invited to the Meetings of the board so that their
valuable inputs are used for smooth and proper functioning of the company and no such decisions are
taken which are detrimental to the interest of operators.
(C) Functions and Responsibility
The responsibility of the SPV will include following:
I. Finalization of routes.
II. Obtain necessary clearances for operating Buses on the Route.
III. Finalization of Specifications of Buses and other Equipments required for successful
operation of the project such as Ticket Vending Machines etc.
IV. Tendering of Routes to the successful bidders.
V. Training of manpower of operators.
VI. Effective management & monitoring of Punctuality of the plying buses.
VII. Management & Monitoring of passes System.
VIII. Selling Advertisement Space through Selected Vendors.
IX. Development of other related infrastructure such as Bus Stoppages/Stands, Night Parking
of Buses etc through Selected Vendors.
X. Promotion of JCTSL and its services through Mass Media Publicity and through interactive
Websites.
XI. Will act as a Regulatory Authority for proper management of Public Transport System of
the City.
XII. JCTSL’s current manpower strength has been considered while calculating human
resource requirement & it was found that with training & knowledge transfer the existing
staff will be competent to handle the administrative structure for implementation,
Supervision, monitoring and evaluation of the public transport activity in Jabalpur City.
Although we will have to gradually the numbers of staff to 25-30 by the start of phase (I)
and upto 90-100 by the start of Phase (II) to accommodate the demand created due to
phase wise implementation of BRTS.
Currently JSTSL has 25, 52 seater Tata Star low floor Buses operating in Jabalpur, this
capacity will be very soon augmented by addition of another 25, 52 seater buses and 69 mini
buses of 34 seating capacity.

Jabalpur Transport Sector CMP Under JNNURM
Municipal Corporation, Jabalpur R-1
194
16.1.6 Bus Operators
These will be the individuals or companies, which have been selected through a transport bidding
system and have been allotted certain routes. The operators will arrange for the buses as per the
specifications of JCTSL and will hire/engage manpower to run these buses on the specified route.
They will be required to follow the rules & regulation of JCTSL. In return they will pay certain amount
to the JCTSL every month.
Ticketing System
Fully computerized Electronic Ticketing Machines are used for issuing daily passenger tickets.
Ticketing system has been finalized by company to ensure the common ticketing system for all
operators. The software used in these machines in owned by JCTSL. This eliminates the risk of
passengers being ever charged more than the specified fares by the operators. The computerized
ticketing system also helps in effective monitoring and control of conductors and management of
ticketing data.
With the hi-tech Electronic Ticket Issuing Machines, it is easy for the conductor to issue tickets
generated through the machine and to collect the money from passengers.
The stages on the route and respective fares are fed to the machine". For example, if a passenger
boards the bus at stop number four and intends to get down at 10, the driver will press the buttons 4
and 10. a ticket will come out and corresponding fare will be displayed on the machine and ticket, for
which the money will be collected by the conductor.
16.1.7 Institutional Changes in Frame Work
The comprehensive mobility plan of Jablpur is about leading change. A continuous assessment of
institutional factors is part of overall dynamic of leading change. Making institutional changes with
transportation stakeholders will result in numerous benefits to our transportation system in Jablapur.
Organize around mobility:
To go for multimodal transportation approach with multiple public-private entities.
Make greater use of technology:
Introduction of latest technology to address mobility challenges and improve system operations.
Develop Transportation professional:
Transportation professional will require wider range of knowledge, skills, and problem, solving
competencies to function as mobility managers.
Project delivery and finance through P.P.D.:
Strategies to increase revenue and manage costs will have to be diverse and include move expensive
role of private sector in line with requirements of performance & accountability.
Improve Communications:
There will be need to address the challenges of communicating Jablapurs transportation direction to
organizations and individuals. There shall be similar direction of under standing among diverse
stakeholders.
Build a culture that leads change:
City must respond to changes in operating environment.

Jabalpur Transport Sector CMP Under JNNURM
Municipal Corporation, Jabalpur R-1
195
16.2 Traffic Safety Regulations
:
16.4.1 Road Safety
1. Ensuring road safety is one of the priority areas receiving Government’s constant Attention. Tamil
Nadu is the first state in the country to have brought out a road safety policy. This Policy has been
brought out with a vision to stop and reverse the increasing trend in the number of accidents, number
of deaths, number of injuries through adoption of comprehensive measures covering engineering,
education, health, emergency care and enforcement measures. The road Safety policy seeks to
achieve 20% reduction in fatalities and injuries in road accidents by 2013 considering 2006 as the
base year.
2. To translate the objectives of road safety policy into reality the Government have taken
steps to create necessary institutional arrangements. A high level body ‘State Road Safety
Council’ has been constituted under the Chairmanship of Honourable Minister for Transport, to advise
the Government on all policies and programmes relating to road safety at the State level.
This council reviews the implementation of various programmes of different departments and
suggests policy initiatives to Government. Government have also established the District Road Safety
Councils functioning in each District under the Chairmanship of the District Collectors. This council
has been entrusted with the job of considering various measures needed to promote road safety,
prepare road safety plans with special attention to the accident prone spots/stretches, maintenance of
roads, drivers training, accident analysis, publicity initiatives and efforts, transport planning, highway
patrol, passenger amenities etc. in the Districts. These councils are required to meet at least once in a
month. Apart from these State level and district level institutions the State road safety
commissionerate also takes up the following activities:-
(i) Sending proposals to the Government on Road Safety Policies to be implemented in the State.
(ii) Overseeing the functioning of the District Road Safety Councils.
(iii) Reviewing the data relating to road accidents, taking up the case studies and identifying
causes and remedial measures to avert accidents.
(iv) Suggesting and recommending specific schemes for financial assistance under Road
Safety Fund to the Districts and various other agencies including Non- Government
Organizations engaged in the task.
(v) Expediting relief operations and post- accident remedial measures so that the victims could be
timely and suitably assisted;
(vi) Controlling the vehicular pollution by involving the M.P. Pollution Control Board, Police
and other Agencies.
3. The Government has constituted “The Road Safety Fund” from out of the receipts of
compounding fees and spot fines collected by transport/police departments to finance road
safety activities. The Road Safety Fund is administered by an Inter-Departmental committee headed
by the Home Secretary.
16.2.2 Specific Measures for Road Safety
To prevent road accidents and to save precious lives involved in the accidents the
strategy of the Government on road safety measures is focussed mainly on three major thrust areas.
i.e.

Jabalpur Transport Sector CMP Under JNNURM
Municipal Corporation, Jabalpur R-1
196
(A) Preventive measures;
(B) Surveillance and detection; and
(C) Enforcement measures.
(A) . Preventive Measures:
(i) Making Fastening of seat belts compulsory:
The Government have ordered the ‘wearing of seat belts’ by the driver, the person occupying the front
seat, and the person seated in the front facing rear seats of the motor vehicle while in motion as
compulsory.
(ii) Making wearing of helmets compulsory:
Government have also made the ‘wearing of helmets compulsory for all the two-wheeler
drivers and pillion riders. Subsequently on representation from the public, Government have
exempted members of the Meivazhi Sabha, women pillion riders, and children pillion riders from
compulsory wearing of helmets.
(iii) Prohibition of Black films on wind screen front glass and rear windows:
In accordance with the existing provisions of Rule 100(2) of Central Motor Vehicles Rules 1989 use of
black films in the wind screen glass and rear window of the vehicle is prohibited.
(iv) Road Safety Week:
Every year, in the first week of January, Road Safety Week is celebrated throughout the State so as
to create adequate awareness among School/ College students, drivers and all other road users.
During the year 2007-2008 Rs.65 lakhs was provided for Road Safety awareness building
programmes. Apart from this, workshops for drivers involved in road accidents are also conducted as
a measure to sensitize them and to create greater awareness regarding road safety aspects.
(v) Holistic approach to study and prevent fatal accidents;
In order to analyse every case of fatal accidents taking place in this State an Inter–
Departmental team of officers comprising Police, Transport and Highways departments has been
constituted. This Inter–departmental team will visit the accident spot on the same or at the most the
very next day, make a comprehensive study from different angles, prepare a detailed report after
critically analyzing the data and offer specific information and suggest suitable measures, preventive
remedial and punitive that may have to be initiated to avert such incidents in future. This newly set up
information system is expected to provide useful inputs for policy initiatives by Government.
(vi) Special initiatives to ensure greater safety of School children/College students:
Government consider safety of school children and college students as an important aspect
of Road Safety. To address the issue holistically, Government on one hand have prescribed
Separate/specific colour i.e. Sky-Blue for Educational Institutional Buses, in order to differentiate the
Educational Institutional Buses from other Motor Vehicles so as to alert the drivers of other vehicles to
drive carefully and more cautiously. The Government have also prescribed certain specific regulatory
measures to ensure quality of drivers, fitness of vehicles, speed etc.,
(B) Surveillance and Detection:
Emergency Accident Relief Centres: (EARC)
Considering the phenomenal increase in vehicular population contributing to increase in
road accidents, 100 Emergency Accident Relief Centres have been established on all the

Jabalpur Transport Sector CMP Under JNNURM
Municipal Corporation, Jabalpur R-1
197
important National and State Highways, to give first aid to the accident victims within the “golden hour”
and to arrange for further treatment through the nearby referral hospitals. Each centre has an
ambulance to respond to the accident cases with essential drugs, paramedical staff and driver
available round the clock making it convenient for public to access these centres through a toll free
Phone number of 1073. Out of the 100 centres presently functioning, 64 centres are fully sponsored
by private hospitals, institutions and non-government organisations and 36 centres are partially
funded by them with the balance financial assistance from Government. The Government assistance
is upto a maximum of Rs.40,000/- per month per centre. An amount of Rs.1.73 crores has been
allotted for running these 36 partially sponsored Emergency Accident Relief Centres and due to the
timely assistance rendered by these emergency accident relief centres, so far 8127 lives have been
saved from fatalities during the year 2007-2008 upto February 2008. Statements
Showing the details of accidents, fatal details are at Table …….
(C) Enforcement Measures:
Deterrent Punitive action:
Government believes in strict enforcement of Law and deals with offenders sternly. Besides
Launching of criminal prosecution against drivers involved in major and fatal accidents, the licences of
such drivers are suspended for a period of not less than six months in the first instance and cancelled
in the cases of subsequent offences.
Compensation to Road Accident Victims:
16.2.3 The Motor Vehicles Act
The Motor Vehicles Act, 1988 provides for payment of compensation to the victims of road
Accidents with reference to their age, earning capacity, cause of the accident etc. The Act
also provides for a minimum amount of compensation irrespective of the fact as to who was
at fault. These claims are settled by the Motor Vehicles Accident Claims Tribunals established
throughout the State.

Jabalpur Transport Sector CMP Under JNNURM
Municipal Corporation, Jabalpur R-1
198
CHAPTER- 17
FISCAL MEASURES
17.1 Fare policy For Public Transportation
17.1.1 Fare policy and fare structure:
It is critical that the fare policy and the fare structure for the BRT system be selected before the fare
technology is selected. In general there are five types of fare structures:
1. Free fare;
2. Flat fare;
3. Zonal fare;
3. Distance-based fare;
4. Time-based fare.
At Jabalpur JCSTL has appointed “District Based Fare” structure charge a tariffin relation on the number
of Kilometers travels pay more than someone traveling just a short distance
17.1.2 Fare Fixation and Collection System
� Optimum fare structure to meet the twin objectives of:
o Equitable access to poor.
o Incentive for upper middle class to prefer these buses over their own vehicles.
� Reasonable fare to give healthy competition to mini buses and tempos.
� Low enough to secure fullest utilization and high enough to ensure viability of the
system.
The State Government by notification dated 9th December, 2004 has prescribed fare for city buses
in the Municipal Corporation limit area for sitting capacity exceeding 12 (excluding driver)
Accounting minor deviations JCTSL has finalized following fare structure.
� Up to 3 K.M. fare Rs. 3.00
� Up to 7 K.M. fare Rs. 5.00
� Up to 10 K.M. fare Rs. 7.00
� Up to 13 K.M. fare Rs. 10.00
� Up to 16 K.M. fare Rs. 12.00
The tariff in the new Public Transport system will be same as JCTSL proposed Tariffs so that there
is no loss in rider ship.
In any event, public transport system fares in Indian cities are pegged by the marginal cost of
operation of motorcycles and scooters. Now almost all wage earners in the middle and lower
middle incomes can own two wheelers. If people have to wean away from personal transport, the

Jabalpur Transport Sector CMP Under JNNURM
Municipal Corporation, Jabalpur R-1
199
question of charging higher fares except for very long trips does not arise. At present the marginal
cost of running a two-wheeler is around Rs. 0.50-0.70 per km. No what technology is employed for
public transport, we cannot charge higher fares.
In light of above it becomes essential that public transport system must have the minimum capital
and running costs. The issue is not cost benefit analysis but cost effectiveness analysis. In cost
effectiveness analysis the BRTS would have to be compared with light rail, monorail and metro
systems and not in isolation.
17.1.3 Fare Collection System:
The method of fare collection and fare verification has a significant impact on the operational
efficiency of the proposed Transportation system, the ability of the system to integrate routes with
each other public transport system, and the fiscal transparence of the system.
Critical design regarding
� Operational plan for the fare collection system;
� Fare policy and fare structure;
� Institutional structure of the fare collection system has to be taken by JCSTL
A. Operational plan for the fare collection system:
Efficiency fare collection system technology can significantly reduce boarding and alighting time, but
also time queuing to purchase tickets and clearing turnstiles.
B. Off board payment system:
The decision to collect and verify fares on or off board will have a significant impact on the potential
passenger capacity of the system. Off board fare collection and verification reduce the line delays that
generally accompany on board payment.
C. On-Board fare Verification:
In such system, very little actual fare verification is conducted. Occasional checks by public transport
staff are done to control fare evasion. The actual payment of the fare is largely reliant on the public
goodwill and over all will ingresses to comply. From the fare payment point onwards, the costumer
proceed directly to the public transport vehicle without inspection.
One of the main advantage of proof of payment fare system is that it allows one to avoid the
construction of a closed entry station. No physical separation between the station and the out side
area is necessary.
The main disadvantage of such a system is that the usually result in some revenue loss.
The kind of system also requires a large frame work that allows verification staff (that usually are not
police staff) to have defacto police power in the collection of penalties from violators, and a procedure
for collecting when the passenger dose not have the money to pay the fine. .
D. Institutional Structure of the fare collection system:
Intuitional arrangements for the fare collection and verification system vary widely from system to
system, with different benefits and risks. Most system have the following components.
� The manager of the money (Usually a bank or money manager);
� The equipment provider;
� The Fare provider;
� The fare system operator;

Jabalpur Transport Sector CMP Under JNNURM
Municipal Corporation, Jabalpur R-1
200
� The public transport authority or its present agency;
17.1.4 Technological elements of a fare system:
Normally, the physical equipment of the fare system consists of the following:
1. Payment medium
The payment is usually cash, tokens, paper tickets, magnetic strip cards or smart cards.
1. Point of Scale (POS) terminals
These terminals are cash points where a tickets, token, magnetic cards, or smart cards
can be purchased or value can be added in to an existing cards.
2. Value-deduction terminal
These terminals are usually terminals and/or card readers
3. Central Computers
The central computer is the repository of the various information streams; the central
computer is typically connected to the point of scale terminal and the value-deduction
terminals via a telecommunication and/or GPRS link.
17.2 Fare Policy For Parking
Even if the political will to reduce the existing number of parking spaces does not exist, there are
measures that can be taken to improve parking efficiency. Increasing parking fees can do much
to discourage vehicle usage even without removing any parking spaces.
Implementing progressive parking policies do frequently require certain legislative changes.
In most cases, local council approval and even national legislative approval may be required to
implement a fee of this type. Turning over the enforcement of parking infringements to a
municipality or a private company from national or provincial level police can be a difficult
process. As with many of these issues, political will is critical, and devising a successful political
strategy is the key to success. As with any tax or fee, many interest groups will be vehemently
opposed to it. Influential groups, such as motorists and business interests, could form a powerful
opposition, but increasing parking fees can also increase the rotation of parking spaces, which
will help shopkeepers. Regaining political control from politically powerful mafias is always a
challenge. Certainly, a direct link between increased parking fee revenues and a politically
popular high profile public transport improvement like BRT can often be a successful political
strategy.
Of course, not all vehicles that enter an urban area are destined to utilize a parking space.
Parking fees can be another effective mechanism for raising revenues for a BRT system, while also
discouraging private vehicle use, and often at a lower implementation cost. Like with congestion
charging, however, the cost of parking scheme will depend on the technology used, and can vary
widely. Similarly, as with congestion charging, in the cities of lower-income countries, motorists are
more likely to be highly price sensitive to parking charges. This price sensitivity will increase the
effectiveness of the measures from a traffic perspective, but limit somewhat the revenue-raising
capability.
Politically, raising parking fees and enforcing them has proven to be as demanding as implementing
congestion charging. Voters are as likely to resist an increase in parking fees as the imposition of a
road user charge. Parking revenues are also frequently controlled by sub-municipal level
governments that have no responsibility for public transport systems, and which are loath to give up

Jabalpur Transport Sector CMP Under JNNURM
Municipal Corporation, Jabalpur R-1
201
the revenue. Enforcement is frequently controlled by police that are not under the control of the
municipal government but under the control of provincial or national governments. Most importantly, in
developing countries parking revenues are generally not fully under the control of the government,
and are controlled by informal sector with powerful political connections inside decision-making
bodies. Nonetheless, reclaiming public control of parking is a critical part of the process of regaining
public political control over urban space. Once this political battle is won, parking fees are relatively
easy to implement, and can generate significant revenues for BRT, while also reducing congestion.
Since a parking space is a highly visible part of land use, it is a difficult type of fee to avoid or hide.
Parking fees can take several forms, including commercial parking taxes and per space fees. Parking
areas can be either publicly or privately owned. The access to a particular parking area may be either
open to the general public or reserved for specific individuals or groups. The range of typologies for
parking areas. To maximize the effectiveness of a parking strategy, such a strategy should address
most of the typologies noted in table 17.1. A parking fee applied to all non-residential parking spaces
has the potential to both raise considerable revenue as well as discourage the use of private vehicles.
Further, relatively little physical set-up is required and the administrative structure may already be in
place through existing parking regulations.
Table 17.1 Typology of Parking
S.No. Ownership of Parking Space User Space On street or Off- Street
1 Local authority controlled General Public On -street
General Public Off - street
2 Privately owned General Public Off - street
Private non –residential parking Off - street
Residential Off - street
Once a municipality has managed to bring parking under its control, parking revenues can be either
collected directly by the municipality, or indirectly in the form of revenue sharing arrangements,
concession agreements, or commercial parking taxes.
17.3 Potential for Road Congestion Charging
Congestion pricing or congestion charges is a system of surcharging users of a transport network in
periods of peak demand to reduce traffic congestion. Examples include road pricing, and higher peak charges
for utilities, public transport and slots in canals and airports. This variable pricing strategy regulates demand,
making it possible to manage congestion without increasing supply. At the same time, users will be forced to
pay for the negative externalities they create, making them conscious of the costs they impose upon each
other when consuming during the peak demand, and more aware of their impact on the environment.
The application on urban roads is limited to a small number of cities. Four general types of systems are in
use; a cordon area around a city center, with charges for passing the cordon line; area wide congestion
pricing, which charges for being inside an area; a city center toll ring, with toll collection surrounding the city;
and corridor or single facility congestion pricing, where access to a lane or a facility is priced.
Implementation of congestion pricing has reduced congestion in urban areas, but has also sparked criticism
and public discontent. Critics maintain that congestion pricing is not equitable, places an economic burden on
neighboring communities, has a negative effect on retail businesses and on economic activity in general, and
is just another tax.

Jabalpur Transport Sector CMP Under JNNURM
Municipal Corporation, Jabalpur R-1
202
Congestion pricing is a concept from market economics regarding the use of pricing mechanisms to charge
the users of public goods for the negative externalities generated by the peak demand in excess of available
supply. Its economic rationale is that, at a price of zero, demand exceeds supply, causing a shortage, and that
the shortage should be corrected by charging the equilibrium price rather than shifting it down by increasing
the supply. Usually this means increasing prices during certain periods of time or at the places where
congestion occurs; or introducing a new usage tax or charge when peak demand exceeds available supply in
the case of a tax-funded public good provided free at the point of usage.
According to the economic theory behind congestion pricing, the objective of this policy is the use of the price
mechanism to make users more aware of the costs that they impose upon one another when consuming
during the peak demand, and that they should pay for the additional congestion they create, thus encouraging
the redistribution of the demand in space or in time,or shifting it to the consumption of a substitute public
good; for example, switching from private transport to public transport.
This pricing mechanism has been used in several public utilities and public services for pricing higher fees
during congested periods, as a means to better manage the demand for the service, and whether to avoid
expensive new investments just to satisfy peak demand, or because is not economically or financially feasible
to provide additional capacity to the service. Congestion pricing has been widely used by telephone and
electric utilities, metros, railways and autobus services, and has been proposed for charging internet access.
It also has been extensively studied and advocated by mainstream transport economists for ports, waterways,
airports and road pricing, though actual implementation is rather limited due to the controversial issues subject
to debate regarding this policy, particularly for urban roads, such as undesirable distribution effects, the
disposition of the revenues raised, and the social and political acceptability of the congestion charge.
Congestion pricing is one of a number of alternative demand side (as opposed to supply side) strategies
offered by economists to address traffic congestion. Congestion is considered a negative externality by
economists. An externality occurs when a transaction causes costs or benefits to third party, often, although
not necessarily, from the use of a public good. For example, manufacturing or transportation cause air
pollution imposing costs on others when making use of public air. Congestion pricing is an efficiency pricing
strategy that requires the users to pay more for that public good, thus increasing the welfare gain or net
benefit for society.
Nobel-laureate William Vickrey is considered one of the fathers of congestion pricing, as he first proposed it
for the New York City Subway system in 1952. In the road transportation arena these theories were extended
by Maurice Allais, Gabriel Roth who was instrumental in the first designs and upon whose World Bank
recommendation the first system was put in place in Singapore, and Reuben Smeed, the deputy director of
the Transport and Road Research Laboratory whose ideas presented in his report to the British government
were rejected by successive governments since the 1960s The transport economics rationale for
implementing congestion pricing on roads, described as "one policy response to the problem of congestion",
was summarized in a testimony to the United States Congress Joint Economic Committee in 2003:
"congestion is considered to arise from the mispricing of a good; namely, highway capacity at a specific place
and time. The quantity supplied (measured in lane-miles) is less than the quantity demanded at what is
essentially a price of zero. If a good or service is provided free of charge, people tend to demand more of it -
and use it more wastefully - than they would if they had to pay a price that reflected its cost. Hence,
congestion pricing is premised on a basic economic concept: charge a price in order to allocate a scarce
resource to its most valuable use, as evidenced by users' willingness to pay for the resource".

Jabalpur Transport Sector CMP Under JNNURM
Municipal Corporation, Jabalpur R-1
203
CHAPTER - 18
MOBILITY IMPROVEMENT MEASURES AND NUTP OBJECTIVES
18.1 Introduction:
The regional settlement development policy should enable promotion of a strong and sound economic
base, ensure optimum utilization of land recourse, promote functional specialization of different urban
centers, develop an efficient and capable regional transport and circulation system to direct growth
pattern, enable interactions and carry flows efficiently.
The regional transport system needs to be planned and developed under a Regional Transport Policy
framework. The main components of such a policy should to be:
* Promote the rational distribution of people and activities over the regional spatial through
improved accessibility.
* Accelerate the rate of growth of regional forms by increased accessibility and improved
connectivity.
* Enable decentralization of activities towns city to other regional towns.
• Enable regional movements which are through with reference to Jabalpur to disperse at
regional level and avoid congesting city road network.
Based on the selected regional development pattern, the assigned size of Jabalpur city needs to be
accommodated within the city limits. A number of planning parameters have been identified which
need to be considered while evolving alternate urban development scenarios.
These parameters are:
* Population
* Economy
* Mobility
* Modal share and
* Transport System
With each parameter three different scenarios viz. pessimistic, conservative and optimistic have
been considered. Table shows various alternative scenarios evolved.
Table 18.1 Urban Development Strategies
Parameters Pessimistic Conservative Optimistic
Population Unabated Growth
Size (2031) : 17.39 Lakhs
Trend based Growth
Size (2031) : 13.37
Lakhs
Planned Dispersal
Growth Size (2031) :
13.56 Lakhs
Economy Decline in Existing
WFPR
WFPR : 30%
Present level in WFPR
to continue
WFPR : 31.4%
High Growth in WFPR
WFPR : 33%
Mobility Decline in Mobility levels
PCTR (veh): 0.70
Present Level in
mobility to continue
PCTR (veh) : 1.00
Higher Mobility levels
PCTR (veh) : 1.20

Jabalpur Transport Sector CMP Under JNNURM
Municipal Corporation, Jabalpur R-1
204
Parameters Pessimistic Conservative Optimistic
Modal Share Stagnant Public
Transport
Modal Share : 14.76%
Moderate Improvement
in public transport
Modal Share : 20%
Higher Share of Public
Transport Modal Share :
60%
Transport
System
Stagnant Road Network
System with deterioration
in LOS
Moderate Improvement
in Road Network
System, Maintenace of
existing LOS
Intense development of
Road Network system
with HCBS/LRT, High
LOS
Presently as revealed by the Consultants household survey, the per capita trip rate (PCTR) of
Jabalpur is 1.47 including walk and 1.00 excluding walk. With economic development, higher vehicle
ownership, good public transport system and increased mobility the PCTR would increase. Future
travel demand estimates will be made by construction of travel demand models. In the interim a PCTR
of 1.20 (excluding walk) by 2021 is adopted to give indicative size of travel demand.
The modal share in favour of public transport (including para transit) in Jabalpur is a low of
14.76%. In the context of resource conservation (land, energy,), sustained development and
environmental quality, it is necessary to improve the public transport share to a level of 30% to 40%.
The study group on Alternative System of Urban Transport, Set up by Planning Commission,
Government of India has recommended the desired modal share for city size. For a city of 1.5 m it is
proposed to adopt a modal share of 40% as per the study group recommendations.
As of now the predominant travel modes are bicycles and two-wheelers while public
transport technology is conventional buses (standard and mini). However as the city grows and travel
demand increases it is necessary to identify more appropriate transport technology to service the city
needs. Amongst the myriads of available technologies, the Light Rail Transit System, on surface or
elevated tracks, along with high Capacity Bus System (HCBS) seems to be most appropriate option
for the city. In the light of above discussion , the consultant proposed for the development of Bus
Rapid transit System (B R T S) on selected high Traffic density corridors along with other
infrastructure projects as already disscused in CMP. The following corridors have been proposed for
the development of BRTS in phased manner :-
Table 18.2 Bus Corridors
S.
No. Bus Corridors
Length
(Km.)
Length of
overlap with
other Corridor
Net Length
(Km.)
Phase -1
1
Agricultural College (Adhartal) to Gwari Ghat
Agriculture college, Damoh Naka chowk, Ranitaal Chowk,
Traffic Police Station, Nagar Nigam Chowk, Shastri Bridge,
Rampur Tiraha and Gwarighat.
14.70 1.356 13.344

Jabalpur Transport Sector CMP Under JNNURM
Municipal Corporation, Jabalpur R-1
205
2
Tilwara Ghat to Khamaria
Medical College, Madan Mahal, Shastri Bridge, Bus Stand,
Naudra Bridge, Chandan Van, Highcourt, Ghamapur Chowk,
Katchghar chowk, Satpulla, Ranjhi and Khamaria
20.860 - 20.86
Phase - 2
3
Gour Bridge to Railway Station (Railway Bridge No.4)
Empire Talkies, Kairab Guest house, Railway Bridge No.- 2,
Collectrate Chowk and Railway station
9.200 0.268 8.932
4. Karmeta To Damoh Naka
Via Deen Dayal Chowk 3.600 - 3.600
5.
Deen Dayal Chowk to Madan Mahal Railway Station
Ahinsha Chowk (Vijay Nagar), Ukheri Tiraha, Labours
Chowk, Ranitaal Chowk, Madan Mahal station
6.600 0.234 6.366
6. Raddi Chowk to Ghamapur Chowk 2.115 - 2.115
7. Maal Godown to Rani Durgawati University
Rly. Bridge NO.-1, Allahabad Bank Chowk, Science College. 3.300 - 3.300
8.
Chandanvan to Bandariya Tiraha
Chandanvan Tiraha, Bridge No.3, Shivaji ground, Katanga
Tiraha and Bandariya Tiraha
3.300 - 3.300
Total 61.907
18.2 Design concept of BRTS
The BRT concept for these corridors includes the following features:
� Segregated bus lanes in the center of the Road, for uninterrupted movement of Buses.
� Safe pedestrian and commuter movement at all locations.
� Segregation of slow traffic such as bicycles to ensure safety.
� Intelligent Transportation System technologies. Advanced technology can maintain more
consistent distances between buses and inform passengers when the next bus is arriving.
The proposed designs of these corridors are aimed at catering to the mobility needs for all road users
in a safe and efficient environment. The exercise involved participation by many experts and
stakeholders, in the form of workshops and meetings. These discussions constituted a major
component in the planning and conceptualization process. The issues have been categorized as
following: -
18.2.1 Cross Section Design
Prioritization for Space Allocation
Both the side and central lane systems can be implemented in narrower right of way conditions by
prioritizing allocation of available right of way. The table below discuses the method of prioritization
for BRT cross section designs. Table 18.3. Prioritization for space allocation on the right of way
Safety, comfort and efficiency of other motor vehicles also.
Table 18.3 Space Allocations on ROW

Jabalpur Transport Sector CMP Under JNNURM
Municipal Corporation, Jabalpur R-1
206
Between Bus Shelters (mid blocks) At Bus Shelter
Priority 1: Provide 3.1 to 3.5m wide bus lanes in
each direction or in one direction (one way road)
with segregation by paint line with refleotor studs to
600mm wide or 150mm high median (depending on
the availability of space
Priority 1: Provide 3.0 m wide physically
segregated or segregated by marking (if space
is constrained) bus lanes
Priority 2: Cycle/Cycle rickshaw paths, 1.5 to 2.5m
wide (2 way or 1 way as per availability of space)
on both sides of the carriageway
Priority 2: 2m to 3.5m wide (depending on
availability of space) bus shelters
Priority 3: Pedestrian paths as per Existing and
future peak time demand (minimum 1.2m)
Priority3: Cycle/cyclerickshawpaths.1.5 to 2.5
m wide (2 ways or 1 way as per availability of
space) on both \ sides of the carriageway.
Priority 4: 2 to 4 lanes for motorized vehicles
Priority (depending on the availability of space} The
width of each lane may wary from 2.75m to3.5m
depending on the availability of space. Since the
lane widths and numbers will not change between
junctions (excluding locations 50 to 75 m before
junction), the minimum available right of way
between the junctions will be considered for design.
Priority 4: Pedestrian paths as per existing and
peak time demand along the corridor (minimum
1.2m)
Priority 5: 3m to 6m wide segregated service lanes
on both or single side of the carriageway depending
on the availability of space and land use conditions.
Where space is very constrained but provision of
service lane and parking is necessary, the texture
and level of service lane and parking may be made
similar to and combined with sidewalks, segregating
where space permits, using bollards of various
Designs.
Priority 5: 2 to 4 lanes for motorized vehicles
(depending on the availability of space). The
width of each lane may wary from 2.75m'to
3.5m depending on the availability of space.
Since the lane widths and numbers will not
change between junctions (excluding locations
50 to 75 m before junction), the minimum
available right of way between the junctions will
be Considered for design.
Priority 6; Space for parallel! Perpendicular Priority
parking of MV/service vehicles on both or single
side of the carriageway/service lane, depending on
the availability of space
Priority 7: Bus parking bays/-overtaking lanes
Priority 8: 3m to 6m wide segregated service
lanes on both or Single side of the carriageway
depending' on the availability of space and land
use conditions Where space is very constrained
but provision of service lane and combined with
sidewalks, segregating where space permits,
using bollards of various designs.

Jabalpur Transport Sector CMP Under JNNURM
Municipal Corporation, Jabalpur R-1
207
Between Bus Shelters (mid blocks) At Bus Shelter
Priority 9: Space for parallel or perpendicular
parking of motorized/service vehicles on both or
single. Side of the carriageway service lane
Comfort, safety and efficiency of motor vehicles In the City of Jabalpur is hampered by the friction with
slow moving vehicles, buses at bus shelters and encroachment on the carriageway by parked
vehicles, hawkers etc. The BRT System with, central bus lanes proposes separate segregated lanes
for non-motorized vehicles (NMV's) and buses as well as continuous paths. For pedestrians and
designed spaces for parking and designated hawker activity zones. Such a design would streamline
flow of other motorized vehicles making it safe efficient and comfortable.
Conclusion: Central segregated bus lanes and bus shelters along with segregated NMV tracks and
dedicated spaces for parked vehicles and hawker activity is more comfortable, safe and efficient for
motor vehicular traffic.
18.2.2 Bus Lane Location
The following tables list the rationale and criteria for selecting side or centrals lanes:
Table 18.4 Rationale for choosing side or central bus lanes
S.N. Central Bus Lane Curb Side Bus Lane
1. Excessive side-entries for vehicles into service
lanes or individual plots.
Limited access to service lanes
or widely spaced entry points into
adjoining area
Rational The high volume of turning traffic interferes with the through movement of bus traffic
if the bus uses the same curbside lane as tile turning vehicles.
2. Closely placed traffic lights for vehicles may be
combined with bus shelters.
Traffic lights at larger intervals.
Rational Buses using the curbside lane are forced to stop at every red signal with other
vehicles reducing throughput. Therefore central bus lanes are preferred
3. Higher Volume of two-wheeler and three-
wheeler vehicles.
Lower Volume of two-wheeler
and three-wheeler
Rational High volumes of two-wheeler and three-wheeler vehicles interfere with the
movement of buses in the curbside lane especially at the bus-shelters where buses
often cannot approach the designated bus-bays due to the three-wheelers parked
there and the two- wheelers trying to overtake from the left side. Also, the difference
in sizes of these vehicles sharing the curbside lane makes the situation unsafe for
the smaller
Conclusion: Since the selected corridor fulfills all three criteria for central bus lanes, it is
recommended that central segregated bus lanes be used in the proposed BRT system for the city.
18.2.3 Bus Shelter Locations
Commuter comfort can be judged by reduced walking distance to access the system Bus shelters
located at the interchange reduce the walking ·distance of all commuters interchanging bus
direction/routes, at the junction and also for a majority of commuters accessing the system from
their homes and workplaces on both intersecting roads.

Jabalpur Transport Sector CMP Under JNNURM
Municipal Corporation, Jabalpur R-1
208
Conclusion: Bus shelters located close to the junction are convenient for commuters.
Both junction and mid block bus shelters are staggered along the length of the corridor. At the
junction the bus shelters are provided before the stop line hence shelters for each direction are
staggered on both sides of the junction. The geometric designs of the BRT system warrant the
widening of the carriageway at the junction, adding turning pockets to MV lanes, providing dedicated
bus and NMV lanes as well bus shelter bltaking away space from service lane and parking on the
edges. Such a system increases the number of lanes entering the junction by 25 to 100%, reducing
the level of congestion from the existing system. By separating slow and fast road users, efficiency
of crossing for all road users is increased at the junction.
Conclusion: Bus shelters located close to the junction have no effect on the level of congestion at the
junction. The BRT system itself proposes to decongest all junctions on -the corridor by introducing
additional lanes and turning pockets on the carriageway entering the junction so as to increase the
throughput of vehicles in every green phase by more than 25%.
Minimize accidents
The existing bus shelter located away from the junctions increase the risk of accidents as they are
not combined with safe pedestrian crossing infrastructure The bus shelters in the proposed BRT
system include safe pedestrian crossing infrastructure in the form of at grade signalized pedestrian
crossing, or partial subways. At a signalized junction all bus shelters are accessed from at grade
signalized pedestrian crossings or zebra crossings. The junction signal cycle is designed to provide
pedestrian green face with a delay of less than 60 seconds. This would encourage pedestrians to
use the pedestrian crossing during the safe phase of the signal cycle, minimizing the risk of
accidents. Moreover since the bus infrastructure remains segregated from other motorized vehicles,
both physically as well by the signal cycle the risk of any accidents caused by weaving motor
vehicular and bus traffic is eliminated.
Conclusion: Physical infrastructure and signal cycles for buses shall be designed to make junction
bus shelters safer and more convenient for all.
Comfortable for Commuters/Pedestrians
Commuter comfort can be judge by reduced walking distance to access the system. Central bus
lanes allow bug shelters to be placed at a maximum distance of 20 m from the junction. This
reduces the walking distance of all commuters interchanging bus direction/routes at the junction and
also and also for a majority of commuters accessing the system from their homes and workplaces
on the side lanes. In case of side bus lanes, the bus shelters need to be placed at a minimum
distance of 150m before/after the junctions to allow weaving between right turning buses and motor
vehicle traffic at the junction. This also results in queuing leading to over spilling of bus lane on the
junction in case the bus shelter is after the junction and reduced efficiency. Caused by buses
stopping twice (once at the shelter and once at the red light) in case of before the junction side bus
shelters. Conclusion: Central Bus Lanes are better for commuter/pedestrian comfort.
Location along the Corridor
All bus stops generate the demand for pedestrian crossing to, acces,s the Shelters. Thus Shelters
need to necessarily be combined with safe pedestrian crossings. Also bus commuter, boarding and
alighting demand is highest at important junctions and nodes. This can be explained by the fact that
junctions allow multi directional access to the commuters and also that it allows them to interchange

Jabalpur Transport Sector CMP Under JNNURM
Municipal Corporation, Jabalpur R-1
209
between important bus routes and directions. Since junctions are signalized and allow safe
pedestrian crossings, it is advisable that bus shelter be located before all signalized junctions
(directly accessible by the pedestrian crossing). Also since a comfortable walking distance for
pedestrians accessing the bus shelter is 250 to 500m, it is advisable to space the bus shelters
between 500 to 700m.
Conclusion: Bus shelters will be located at all signalized intersection (on the before side), accessed
directly from a signalized pedestrian crossing. The shelters will be spaced 500 to 700m from each
other, if the signalized junctions are spaced at a distance greater than this, and if bus commuter
demand exists between these two junctions, a mid block bus shelters with a safe pedestrian
signalized (in case of at grade crossing) or grade separated access will be provided. Access to bus
shelters will be barrier free from the sides.
Location for bus shelter is more efficient for the BRT system just before the junction or
after/away from the junction
Buses need to stop at all bus shelters for 20 to 30 second to load/offload passengers. This time is
known as the dwell time for buses. Buses also have to necessarily stop at all signalized junction if
they encounter a red light, the probability of which is between 66 to 75%. By locating bus shelters
just before the junction it is possible to combine the bus dwell time with the bus waiting time at the
red light. This would reduce delays in the bus system and improves its average speed, making the
whole system more efficient. In this system buses cannot overflow in to the junction.
Conclusion: Bus shelters located just before the junction in central bus lanes add to the efficiency
of the BRT system.
Since most commuters need to access the junction for route or direction interchange. It is advisable
to provide the bus shelter at the junction under the flyover.
Conclusion: Bus shelters will be providing at the junction under the flyover (on the before side)
directly accessible through safe signalized pedestrian crossing.
Central bus lane design cope with the flyover situation
� The physical segregation of the central bus lanes can be discontinued, minimum 150m from
the foot of the flyover on both sides to allow for weaving between, motor vehicles using the
flyovers and buses accessing the bus shelters under the flyover. These weaving designs are
similar to those being used on new flyover designs in Jabalpur.
Conclusion: The physical segregation for central bus lanes is discontinued 150 m on both
sides from the foot of the flyover.
� Since most commuters need to access the junction for route or direction interchange. It is
advisable to provide the bus shelter at the junction under the flyover.
Conclusion: Bus shelters will be providing at the junction under the flyover (on the before side)
directly accessible through safe signalized pedestrian crossing.

Jabalpur Transport Sector CMP Under JNNURM
Municipal Corporation, Jabalpur R-1
210
CHAPTER – 19
IMPLEMENTATION PROGRAMS
The design & selection of location of BRTS Corridors & feeder as well as arterial roads has been conducted in
complete accord with City Development Plan’s City master plan for Jabalpur City. Various feeder roads,
arterial roads as well as corridors are already proposed in CMP for Jabalpur City.
The design & changes has been suggested as National Urban Transport Policy, also taking in consideration
CDP & city master plan of Jabalpur city.
19.1 List of Mobility Improvement Projects and Measures
The following projects have been identified by Consultant to improve the mobility needs of the
Jabalpur city and as required by the provisions in the National Urban Transport Policy:
Sl.No. Name of The Projects Approx. Cost (Rs.in
Cr.)
1. Roads & services
(i) Improvements of National Highways 300.00
(ii) Improvements of State Highways 200.00
(iii) B.R.T.S. Corridors 61.907 Km 740.00
(iv) A.R.P. Projects 350.00
(v) Development of M.R.-4 as Expressway 130.00
(vi) Sector Roads 250.00
(vii) Other Roads(Feeder Roads) 260.00
Sub Total 2230.00
2. R.O.B.s/BRIDGES/FLYOVERS
(I) Construction of new ROB’s 300.00
(ii) Widening of Existing ROB’s 140.00
(iii) Construction of River Bridges( Minor & Major) 142.00
(iv) New Flyovers 135.00
(v) Subways 1 45.00
Sub Total 662.00
3. Improvement of Junctions 41Nos. 45.00
4. Construction/ Improvement of
BusTerminals/Depot
(i) Upgradation of existing ISBT 1Nos. 15.00
(ii) Construction of new ISBT 1 Nos 75.00
(iii) Construction of new Regional Bus Terminals 100.00
(iv) Construction of new city Bus Terminals 200.00

Jabalpur Transport Sector CMP Under JNNURM
Municipal Corporation, Jabalpur R-1
211
(v) Construction of new Bus Depot 120.00
Sub Total 510.00
5. Construction/ Improvement of Parkings Facilities 40 Nos. 80.00
6. BRTS Services / Buses 150 Nos. 135.00
7. Development of Transport Nagar 5 Nos. 150.00
Grand Total 3912.00
19.2 Selection of Priority Projects / Measures in Phased manner
19.2.1 Phase I
(1) National Highway and Bypass road(R-1):
Construction of Kundam Bye Pass
(2) State Highway and Other Regional roads(R-2):
Sl.no. Road
Width within
the city
limits(m)
Outsides
the city
limits(m)
1 Mandala marg 30-35 40
2 Damoh Marg 30-45 45
3 Patan Marg 30-45 45
4 Kundam Marg 24-40 40
5 Old Mirzapur Marg 24-40 -
6 Gorakhpur Railway crossing to Gwarighat 24-30 -
7 Agricultural College (Adhartal) to Gwari Ghat
Agriculture college, Damoh Naka chowk, Ranitaal
Chowk, Madan Mahal Station, Chhoti line leveling
Rampur Tiraha and Gwarighat.
50-60 50-60
8 Tilwara Ghat to Khamaria
Medical College, Madan Mahal, Shastri Bridge,
Bus Stand, Naudra Bridge, Chandan Van,
Highcourt, Ghamapur Chowk, Katchghar chowk,
Satpulla, Ranjhi and Khamaria
50-60 50-60

Jabalpur Transport Sector CMP Under JNNURM
Municipal Corporation, Jabalpur R-1
212
3. Construction of M.R-4 Road
Katni bye pass to NH-12 via. Mahara jabalpur, Amkhera, Kachhpura, Garha, Narsinghpur road NH-12
which carries heavy traffic & connects major work center, important health centers & Educatinal centers.
4. Other Roads:
Sl.no. Discription of roads
Roads of 24-30 m R.O.W.
1 Collectrate to R.D.V.V. via Science college
2 Katinga Tiraha to Gwarighat
3 Medical Tiraha to Byepass via Dhanvantari nagar
4 Damoh Naka to I.T.I.
5 Ghamapur chowk to Katinga Tiraha
6 I.T.I. to Byepass via Shukh
7 Circuit house to Gour river
Roads of18- 24 m R.O.W.
1 Chandanvan to Teenpatti chauraha
2 Chhotiline fatak to Bandariya tiraha
3 Circuit house to Russel chowk
4 R.D.V.V. tiraha to Robertsganj via Lohiya Bridge
5 Ghamapur chowk to ranjhi via kanchghar
6 Madan Mahal chowk to Madan mahal thana
7 Railway bridge no. 1 to Kairab guest house
8 Gohalpur police station to Amkhera
9 Adhartall to Sobhapur railway crossing
10 Amkhera to Byepass
11 Ambedkar chowk to Railway bridge no.1
12 Ghamapur chowk to Raddichauki
13 Madanmahal railway station to Ranitall Hanuman Temple
14 Baldev bagh to M.R.4 Ukeri road
15 Ravindra tiraha to Amkhera
Roads of 12-18 m R.O.W.
1 Rampur tiraha to Bergi Hill via Shakti Bhawan
2 R.D.V.V. to Dumna airport
3 Russel chowk to Bus stand via Krishna hotel
4 Shastri bridge to Madan Mahal station
5 Russel chowk to Shastri bridge via Jabalpur hospital

Jabalpur Transport Sector CMP Under JNNURM
Municipal Corporation, Jabalpur R-1
213
6 Sharda chowk to Sainik society
7 Damoh naka to Khemrai via chhota fawvara
8 Corporation chowk to P&T gate no.3
9 Ghamandi chowk to Ranitall via Garha Fatak
5. Intersection and Flyovers, R.O.B’s. & R.U.B’s.
At present 3 R.O.B's, 2 R.U.B's and 3 level crossings provide access across the railway line. Of the
three ROB's, Two are widely used. The two RUB's have low vertical clearance, thus heavy vehicles
are banned at these locations. Poor road surface with water logging is a regular feature during rainy
seasons. Two level crossings at Gorakhpur and on Garha road witness severe congestion due to high
level of activities and presence of intersections on either side of the Railway crossing.
Influence of slow moving traffic is noteworthy on the city road network. Absence of exclusive tracks for
slow moving vehicles has resulted in slow moving vehicles sharing the road space with fast moving
vehicles thereby affecting stream speeds.
To avoid undue hindrance to traffic and to permit free flow traffic, Bridges on major roads are
necessary .The following Projects have been proposed to be taken up in phase I
* CONSTRUCTION OF BRIDGE OVER RIVER NARMADA
1 At Gwariqhat
CONSTRUCTION OF RAILWAY OVER BRIDGE
1 Madan Mahal Railway Station and Chhotiline Crossing near shastri Bridge
* WIDENING OF RAILWAY UNDER BRIDGES AT MADAN MAHAL STATION
1 Shastri Bridge (Over Bridge)
* CONSTRUCTION OF FLY OVERS
1 Khermai to High Court Via Ghamapur Chouk
2 Damoh Naka
3 Ranital Chouk
* DEVELOPMENT OF ROAD INTERSECTION
1 Ranital
2 Raddi Chouki
3 Ghamapur
4 Hiqh Court
5 Naudra bridge
6 Nagar Nigam

Jabalpur Transport Sector CMP Under JNNURM
Municipal Corporation, Jabalpur R-1
214
7 Shastri Bridqe
8 Level Crossing
9 Ambedkar Choraha
10 Tripuri Tiraha
11 Medical Tiraha
12 Bandariya Tiraha
13 Vehicle Factory/Filtration plant tiraha
14 Adhartal Tiraha
15 Gohalpur Police Station Chouk
16 Sai Baba Chouk Civil Lines
19.2.2 Phase II
(1) National Highway and Bypass road(R-1):
Construction of Mandla Bye Pass (Tilwara Ghat Brigde to Gour River via Gwarighat)
(2) State Highway and Other Regional roads(R-2):
Sl.no. Roads
Width within
the city
limits(m)
Outsides
the city
limits(m)
1
Gour Bridge to Railway Station (Railway
Bridge No.4)
Empire Talkies, Kairab Guest house, Railway
Bridge No.- 2, Collectrate Chowk and Railway
station
50-60 50-60
2 Karmeta To Damoh Naka
Via Deen Dayal Chowk 50-60 50-60
3
Deen Dayal Chowk to Nagar Nigam Chowk
Ahinsha Chowk (Vijay Nagar), Ukheri Tiraha,
Labours Chowk, Ranitaal Chowk, Maluiya Chowk.
50-60 50-60
4 Raddi Chowk to Ghamapur Chowk 50-60 50-60
5
Maal Godown to Rani Durgawati University
Rly. Bridge NO.-1, Allahabad Bank Chowk,
Science College.
50-60 50-60
6
Chandanvan to Bandariya Tiraha
Chandanvan Tiraha, Bridge No.3, Shivaji ground,
Katanga Tiraha and Bandariya Tiraha
50-60 50-60

Jabalpur Transport Sector CMP Under JNNURM
Municipal Corporation, Jabalpur R-1
215
3. Primary Arterial Roads (A.R.P.) Construction/ Improvement:
These includes major city roads carrying heavy traffics and connecting sub divisions , Major work
centre , Important Health centres, and Educational centres
PROPOSED PRIMARY ARTERIAL ROAD (50 M.wide) (including Foot path,
central verge, drain, street light)
1 ARP-1
Katni bye pass to Kundum bye pass, Via Maharajpur, Richai, Madai, Mohnia
2 ARP-2
Katni bye pas to ARP4 at Kundum
3 ARP-3
NH-7 Adhartal to ARP-3 at Amkhera
4. Intersection and Flyovers, R.O.B’s. & R.U.B’s.
The following Projects have been proposed to be taken up in phase II
CONSTRUCTION OF RAILWAY OVER BRIDGE
1 Shobhapur Vehicle Estate railway Crossing
2 Gorakhpur Railway Crossing
* WIDENING OF RAILWAY UNDER BRIDGES
1 Railway Bridqe No.1 (Under Bridge)
2 Railway Bridge No.2 (Under Bridge)
3 Railway Bridge No.3 (Under Bridge)
4 Railway Bridqe No.4 (Under Bridge)
5 Satpula Bridge (Over Bridge)
6 Garoha Bridge (Over Bridge)
* CONSTRUCTION,WIDENING AND REHALBITATION OF EXISTING BRIDGES
OVER NALA
BRIDGE WIDENING ON OMTI NALA
1 Ghamapur
2 Chhoti Omti
3 Ghantaghar
4 Naudra Bridge
5 Nav Bharat Press
6 Prabhat Bridqe

Jabalpur Transport Sector CMP Under JNNURM
Municipal Corporation, Jabalpur R-1
216
7 Madan Mahal
8 Sneh Nagar
* CONSTRUCTION OF NEW BRIDGE ON OMTI NALA
1 Nav Adarsh colony
2 Kachnar City Vijay Nagar
3 Wright Town
4 Lohiya Bridge Near MLB School
* DEVELOPMENT OF ROAD INTERSECTION
1 Madan Mahal Chouk
2 Katinga Tiraha
3 Nagrath Chouk
4 Karamchand Chouk
5 Malviya Chouk
6 Ghantaghar
7 Malgodam chouk Opp. S.P. Office
8 Aga Chouka
9 Labour Chouk Near Sneh Naqar
10 Gulaua Chouk
11 Dhanwantri Nagar Chouk
12 Ranmpur Tiraha
13 Baldeo bagh chouk
14 Bada Fowara Chouk
15 Chhota Fowara Chouk
19.2.3 Phase III
1. Secondary Road Construction/ Improvement:
Sector Roads (S.R.):
* PROPOSED SECTOR ROAD (30 M. wide) including Footpath, Central verge,
drain, street Light
Connecting Roads between ARP & Bye pass
1 SR1
2 SR2
3 SR3
4 SR4

Jabalpur Transport Sector CMP Under JNNURM
Municipal Corporation, Jabalpur R-1
217
5 SR5
6 SR6
7 SR7
8 SR8
9 SR9
2. Development of Subway & Road intersections
* DEVELOPMENT OF SUB WAY
1 At Mal Godam near Rly. Station
* DEVELOPMENT OF ROAD INTERSECTION
1 Badi Omti
2 Tularam Chowk
3 Darshan tiraha Ranjhi
4 Gautam Ji Ki Madiya Tiraha
5 Tyab Ali Chowk
6 Income Tax Chowk
7 Shivaji Chowk madam mahal
8 I.T.I ‘Y’ junction
9 Bada Pathar Ramjhi
10 Russel chowk
19.3 Expected Project cost of Projects in Phased Manner :
19.3.1 Phase -I
Sl.No. Name of The Projects
Approx. Cost
(Rs.in Cr.)
1. Roads & services
(i) Improvements of National Highways
Construction of Kundam Bye Pass 5.0 Km 100.00
(ii) Improvements of State Highways 200.00
(iii) B.R.T.S. Corridors
Agricultural College (Adhartal) to Gwari Ghat And
Tilwara Ghat to Khamaria
34.955Km 380.00
(iv) Development of M.R.-4 as Expressway 130.00

Jabalpur Transport Sector CMP Under JNNURM
Municipal Corporation, Jabalpur R-1
218
(v) Other Roads(Feeder Roads)
Roads of 24-30 m R.O.W.
Collectrate to R.D.V.V. via Science college
Katinga Tiraha to Gwarighat
Medical Tiraha to Byepass via Dhanvantari nagar
Damoh Naka to I.T.I.
Ghamapur chowk to Katinga Tiraha
I.T.I. to Byepass via Shukh
Circuit house to Gour river
Roads of18- 24 m R.O.W.
Chandanvan to Teenpatti chauraha
Chhotiline fatak to Bandariya tiraha
Circuit house to Russel chowk
R.D.V.V. tiraha to Robertsganj via Lohiya Bridge
Ghamapur chowk to ranjhi via kanchghar
Madan Mahal chowk to Madan mahal thana
Railway bridge no. 1 to Kairab guest house
Gohalpur police station to Amkhera
Adhartall to Sobhapur railway crossing
Amkhera to Byepass
Ambedkar chowk to Railway bridge no.1
Ghamapur chowk to Raddichauki
Madanmahal railway station to Ranitall Hanuman Temple
Baldev bagh to M.R.4 Ukeri road
Ravindra tiraha to Amkhera
Roads of 12-18 m R.O.W.
Rampur tiraha to Bergi Hill via Shakti Bhawan
R.D.V.V. to Dumna airport
Russel chowk to Bus stand via Krishna hotel
Shastri bridge to Madan Mahal station
Russel chowk to Shastri bridge via Jabalpur hospital
Sharda chowk to Sainik society
Damoh naka to Khemrai via chhota fawvara
Corporation chowk to P&T gate no.3
Ghamandi chowk to Ranitall via Garha Fatak
260.00
Sub Total 1070.00
2. R.O.B.s/BRIDGES/FLYOVERS
(I) Construction of new ROB’s 50.00

Jabalpur Transport Sector CMP Under JNNURM
Municipal Corporation, Jabalpur R-1
219
Chhotiline Crossing near Gwarighat
(ii) Widening of ROB (shastri Bridge) 35.00
(iii) Construction of Railway over Bridge Bridge at Madan
Mahal Railway Station
181.00
(iv)
a.
b.
c.
New Flyovers
Khermai to High Court Via Ghamapur Chouk
Damoh Naka
Rani Tal
135.00
Sub Total 356.00
3. Improvement of Junctions 16Nos. 20.00
4. Construction/ Improvement of BusTerminals/Depot
(i) Upgradation of existing ISBT 1Nos. 15.00
(ii) Construction of new ISBT 1 Nos 75.00
(iii) Construction of new Regional Bus Terminals 100.00
(iv) Construction of new city Bus Terminals 100.00
(v) Construction of new Bus Depot 120.00
Sub Total 410.00
5. Construction/ Improvement of Parkings Facilities 15 Nos. 30.00
6. BRTS Services / Buses 60 Nos. 54.00
7. Development of Transport Nagar 2 Nos. 60.00
Grand Total 2145.00
19.3.2 Phase -II
Sl.No. Name of The Projec
Approx. Cost
(Rs.in Cr.)
1. Roads & services
(i) Improvements of National Highways
Construction of Mandla Bye Pass (Tilwara Ghat Brigde to
Gour River via Gwarighat)
10 Km 200.00
(ii) B.R.T.S. Corridors
Gour Bridge to Railway Station (Railway Bridge No.4)
Karmeta To Damoh Naka
Deen Dayal Chowk to Madan Mahal Railway Station
Raddi Chowk to Ghamapur Chowk
Maal Godown to Rani Durgawati University
30.00Km 360.00

Jabalpur Transport Sector CMP Under JNNURM
Municipal Corporation, Jabalpur R-1
220
Chandanvan to Bandariya Tiraha
(iv) A.R.P. Projects 350.00
Sub Total 910.00
2. R.O.B.s/BRIDGES/FLYOVERS
(I) Construction of new ROB’s 150.00
(ii) Widening of Existing ROB’s 105.00
(iii) Construction of River Bridges( Minor & Major) 66.00
(iv) Bridge Widening on Omti Nala
Ghamapur, Chhoti omit, Ghamtanagar, Naudara Bridge, Nav
Bharat Press, Prabhat Bridge, Nadan Mahal, Sneh Nagar
40.00
Sub Total 361.00
3. Construction/ Improvement of BusTerminals/Depot
(i) Construction of new city Bus Terminals 100.00
4. Improvement of Junction 15 Nos. 15.00
4. Construction/ Improvement of Parkings Facilities 15 Nos. 30.00
5. BRTS Services / Buses 60 Nos. 54.00
6. Development of Transport Nagar 2 Nos. 60.00
Grand Total 1530.00
19.3.3 Phase III
Sl.No. Name of The Projects
Approx. Cost
(Rs.in Cr.)
1. Roads & services
(i) Sector Roads 250.00
2. R.O.B.s/BRIDGES/FLYOVERS
(i) Subways 1 45.00
3. Improvement of Junctions 10 Nos. 10.00
4. Construction/ Improvement of Parkings Facilities 10 Nos. 20.00
5. BRTS Services / Buses 30 Nos. 27.00
6. Development of Transport Nagar 1 Nos. 30.00
Grand Total 382.00

Jabalpur Transport Sector CMP Under JNNURM
Municipal Corporation, Jabalpur R-1
221
Chapter- 20
PREPARING OF PLAN AND VALUATION ASSETS
20.1 Need of Valuation:
The valuation of different Govt. / Private properties are done as per circle rate of Jabalpur and according
to house tax imposed by Nagar Nigam, which are on the main corridors of the B.R.T.S. to meet out the
maintenance cost of corridors for the sustainable system.
The valuation is done for increase on F.A.R. of the building and increase the income of Nagar Nigam by
imposing the as per F.A.R.
20.2 Concept and Methodology:
Land building method of valuation has been adopted in this case. In this method the total plinth area is
multiplied with the respective plinth area rates (based on the rates fixed by C.P.W.D.), and prevailing
market rate for similar type of building and by increasing thereafter taking the present cost of living index
and also making appropriate adjustments for the variation adopted in the construction including
provision for services to arrive at the cost reproduction of the building in 2009.
Depreciated value of the Building is then calculated taking in to account the total economic life of the
building, present age of the building and safe future life.
Additional of the extra items and the value of the land to the total depreciated value of the Building and
other structures which gives the fair market value of the property.
The valuation of the property on the basis of record and also facts figures made available by the owner
of the property, such as Photo copy of the registered sale deed of the Registrar office of the concern
district.
20.3 Valuation of Properties:
20.3.1 The valuation of Different assets along the corridor No. 01 (Agriculture College to Gwarighat):
S.
No.
Location of the Property. Reference Drawing No. Area of the
Property in sqm.
Valuation of the
Property in Lakhs.
1. Front Of Agriculture
College Gate
BRTS/MCJ/01/PP/
PARKING-01 500.00 15.00
2. Adhartal Chowk BRTS/MCJ/01/PP/
PARKING-02 300.00 9.00
3. Adhartal Chowk BRTS/MCJ/01/PP/
PARKING-03 907.50 27.23
4. Beside Anand Nagar Bus
Stand
BRTS/MCJ/01/PP/
PARKING-04 150.00 4.50
5. Raddi Chowk Opposite
Side Of Petrol Pump
BRTS/MCJ/01/PP/
PARKING-05 1000.00 30.00
6. Gohalpur Chowk BRTS/MCJ/01/PP/
PARKING-06 576.00 17.28
7. Near Abhinav Complex BRTS/MCJ/01/PP/
PARKING-07 1300.00 39.00
8. Regional Bus Stand BRTS/MCJ/01/PP/
PARKING-08 700.00 21.00

Jabalpur Transport Sector CMP Under JNNURM
Municipal Corporation, Jabalpur R-1
222
S.
No.
Location of the Property. Reference Drawing No. Area of the
Property in sqm.
Valuation of the
Property in Lakhs.
9. Tagali Chowk BRTS/MCJ/01/PP/
PARKING-09 1260.00 37.80
10. Aga Chowk BRTS/MCJ/01/PP/
PARKING-10 437.50 13.13
11. Malviya Chowk Beside
Traffic Police Station
BRTS/MCJ/01/PP/
PARKING-11 808.00 24.24
12. Nagar Nigam BRTS/MCJ/01/PP/
PARKING-12 625.00 18.75
13. Bus Stand Near Pawar
Hotel
BRTS/MCJ/01/PP/
PARKING-13 1000.00 30.00
14. In Front Of Anmol
Complex
BRTS/MCJ/01/PP/
PARKING-14 550.00 16.50
15. Badariya Tiraha BRTS/MCJ/01/PP/
PARKING-15 300.00 9.00
16. Rampur Chowk Beside
Bus Stand
BRTS/MCJ/01/PP/
PARKING-16 350.00 10.50
17. Ideal Estate BRTS/MCJ/01/PP/
PARKING-17 4150.00 124.50
18. Beside Narmada Classic
Pvt. Ltd.
BRTS/MCJ/01/PP/
PARKING-18 2500.00 75.00
20.3.2 The valuation of Different assets along the corridor No. 02 (Tilwara ghat to Khamaria):
S.
No.
Location of the
Property
Reference Drawing No. Area of the
Property in sqm.
Valuation of the
Property in Lakhs
1. Prince Hostel Of
Medical College
BRTS/MCJ/01/PP/
PARKING-01
1900.00 57.00
2. Forest Check Post BRTS/MCJ/01/PP/
PARKING-02
1250.00 37.50
3. Tripuri Tiraha BRTS/MCJ/01/PP/
PARKING-03
186.00 5.58
4. Near Madan Mahal
Chowk
BRTS/MCJ/01/PP/
PARKING-04
90.00 2.70
5. Chhoti Line Crossing BRTS/MCJ/01/PP/
PARKING-05
1000.00 30.00
6. Over Slab Omti Nala BRTS/MCJ/01/PP/
PARKING-06
1850.00 55.50
7. Naudra Bridge BRTS/MCJ/01/PP/
PARKING-07
2250.00 67.50

Jabalpur Transport Sector CMP Under JNNURM
Municipal Corporation, Jabalpur R-1
223
S.
No.
Location of the
Property
Reference Drawing No. Area of the
Property in sqm.
Valuation of the
Property in Lakhs
8. Collectrate Campus BRTS/MCJ/01/PP/
PARKING-08
2500.00 75.00
9. High Court BRTS/MCJ/01/PP/
PARKING-09
3640.00 109.20
10. Ambedkar Chowk BRTS/MCJ/01/PP/
PARKING-10
3050.00 91.50
11. Ghamapur Chowk BRTS/MCJ/01/PP/
PARKING-11
2000.00 60.00
12. Ramlila Maidan BRTS/MCJ/01/PP/
PARKING-12
1000.00 30.00
13. Near Gyan Bharti
School
BRTS/MCJ/01/PP/
PARKING-13
645.00 19.35
14. Shishu Vidya Peeth BRTS/MCJ/01/PP/
PARKING-14
1250.00 37.50
15. Satpula Bazar BRTS/MCJ/01/PP/
PARKING-15
5040.00 151.20
16. G.C.F. Factory BRTS/MCJ/01/PP/
PARKING-16
1200.00 36.00
17. Ranjhi Vehicle Factory BRTS/MCJ/01/PP/
PARKING-17
1000.00 30.00
20.3.3 The valuation of Different assets along the corridor No. 03 (Railway Plate form No. 04 to Gaur River):
S.
No.
Location of the
Property
Reference Drawing No. Area of the
Property in sqm.
Valuation of the
Property in Lakhs.
1. Before Railway
Bridge No. 02
BRTS/MCJ/03/PP/
PARKING-01 220.00 6.60
2. In Front Of Veterinary
College
BRTS/MCJ/03/PP/
PARKING-02 442.00 13.26
3. In Front Of ST
Analysis College
BRTS/MCJ/03/PP/
PARKING-03 2000.00 60.00
4. Before Bilhari Pump
House
BRTS/MCJ/03/PP/
PARKING-04 600.00 18.00
20.3.4 The valuation of Different assets along the corridor No. 04 (Damoh Naka to Khamaria):
S.
No.
Location of the
Property
Reference Drawing No. Area of the Property
in sqm.
Valuation of the
Property in Lakhs.
1. Deen Dayal Chowk BRTS/MCJ/01/PP/
PARKING-01 1100.00 33.00
2. Just After BRTS/MCJ/01/PP/ 2145.00 64.35

Jabalpur Transport Sector CMP Under JNNURM
Municipal Corporation, Jabalpur R-1
224
S.
No.
Location of the
Property
Reference Drawing No. Area of the Property
in sqm.
Valuation of the
Property in Lakhs.
Amritdham PARKING-02
3. Just Hanuman
Darwar
BRTS/MCJ/01/PP/
PARKING-03 1440.00 43.20
20.3.5 The valuation of Different assets along the corridor No. 05 (Deen dayal Chowk to Madan Mahal
chowk):
S.
No.
Location of the Property Reference Drawing
No.
Area of the
Property in sqm.
Valuation of the
Property in Lakhs.
1. Labour Chowk Slab Over Nala BRTS/MCJ/01/PP/
PARKING-02
60.00 1.80
2. Just After Ranital Chowk Slab
Over Nala
BRTS/MCJ/01/PP/
PARKING-03
150.00 4.50
3. Omti Nala Before Madan Mahal BRTS/MCJ/01/PP/
PARKING-04
2355.00 70.65
20.3.6 The valuation of Different assets along the corridor No. 06 (Raddi Chowk to Ghamapur chowk):
S.
No.
Location of the Property Reference Drawing
No.
Area of the
Property in sqm.
Valuation of the
Property in Lakhs.
1. Bahorabagh Chowk BRTS/MCJ/01/PP/
PARKING-01
200.00
6.00
2. Slab Over Nala BRTS/MCJ/01/PP/
PARKING-02
900.00
27.00
3. Under at O.H.T. BRTS/MCJ/01/PP/
PARKING-03
700.00
21.00
4. Beside at Akansa Hospital BRTS/MCJ/01/PP/
PARKING-04
225.00
6.75
20.3.7 The valuation of Different assets along the corridor No. 07 (Mall Godown to RDVV):
S.
No.
Location of the Property Reference Drawing No. Area of the
Property in sqm.
Valuation of the
Property in Lakhs.
1. Near Central Hospital
W.C.R.
BRTS/MCJ/01/PP/
PARKING-01 72.00 2.16
2. Central Hospital Road BRTS/MCJ/01/PP/
PARKING-02 275.00 8.25
3. Just After Railway Bridge
No. 01 Slab Over Nala
BRTS/MCJ/01/PP/
PARKING-03 100.00 3.00
4. In Front Of Bank Of India BRTS/MCJ/01/PP/
PARKING-04 1250.00 37.50
5. In Front Of Sai Baba
Temple
BRTS/MCJ/01/PP/
PARKING-05 750.00 22.50

Jabalpur Transport Sector CMP Under JNNURM
Municipal Corporation, Jabalpur R-1
225
20.3.8 The valuation of Different assets along the corridor No. 08 (Chandanvan to Teen Patti Chauraha):
S.
No.
Location of the Property Reference Drawing
No.
Area of the
Property in sqm.
Valuation of the
Property in Lakhs.
1. Before Railway Bridge No. 03. BRTS/MCJ/01/PP/
PARKING-01 750.00 22.50
2. After Shivaji Ground Chowk BRTS/MCJ/01/PP/
PARKING-02 2250.00 67.50
3. Bhagat Singh Chowk BRTS/MCJ/01/PP/
PARKING-03 200.00 6.00
20.3.9 The valuation of Different assets along the Feeder roads:
S.
No.
Location of the Property Reference Drawing
No.
Area of the
Property in sqm.
Valuation of the
Property in Lakhs.
1. Feeder Road No. 01 (Adhar
Tal To Shobhapur Railway
Crossing)
FR/MCJ/02/PP/
PARKING-01 770.00 23.10
2. Feeder Road No. 01 (Adhar
Tal To Shobhapur Railway
Crossing) Near M.P. Metal &
Steel Industries
FR/MCJ/02/PP/
PARKING-02 750.00 22.50
3. Feeder Road No. 02
(Gohalpur Police Station To
Amkhera)
FR/MCJ/02/PP/
PARKING-03 200.00 6.00
4. Feeder Road No. 02 (Near
Police Station Chauraha)
FR/MCJ/02/PP/
PARKING-01 2500.00 75.00
5 Feeder Road No. 03
(Damoh Naka To Khairmai
Via Chhota Favvara)
FR/MCJ/02/PP/
PARKING-01 1100.00 33.00
6. Feeder Road No. 03
(Damoh Naka To Khairmai
Via Chhota Favvara) Along
With Hanuman Temple
FR/MCJ/02/PP/
PARKING-02 1250.00 37.50
7. Feeder Road No. 04 (Baldev
Bagh To MR-4 Ukheri Road)
Beside Electric Bus Station
FR/MCJ/02/PP/
PARKING-02 900.00 27.00
8. Feeder Road No. 04 (Baldev
Bagh To MR-4 Ukheri Road)
Slab Over Nala
FR/MCJ/02/PP/
PARKING-01 320.00 9.60
9. Feeder Road No. 05
(Ghamandi Chowk To
Ranital) Slab Over Nala
FR/MCJ/02/PP/
PARKING-02 168.00 5.04

Jabalpur Transport Sector CMP Under JNNURM
Municipal Corporation, Jabalpur R-1
226
S.
No.
Location of the Property Reference Drawing
No.
Area of the
Property in sqm.
Valuation of the
Property in Lakhs.
10. Feeder Road No. 05
(Ghamandi Chowk To
Ranital) Slab Over Nala
FR/MCJ/02/PP/
PARKING-01 120.00 3.60
11. Feeder Road No. 06 (Madan
Mahal Railway Station To
Ranital Hanuman Temple) In
Front Of P & T Gate
FR/MCJ/02/PP/
PARKING-01 125.00 3.75
12. Feeder Road No. 07 (Shastri
Bridge To Madan Mahal
Thana) In Side Home
Science College Campus
FR/MCJ/02/PP/
PARKING-01 1250.00 37.50
13. Feeder Road No. 08
(Russelpur Chowk To
Shastri Bridge) In Side
Bhawartal Garden
FR/MCJ/02/PP/
PARKING-01 125.00 3.75
14. Feeder Road No. 09
(Russelpur Chowk To Bus
Stand) In Side Bhawartal
Garden
FR/MCJ/02/PP/
PARKING-01 800.00 24.00
15. Feeder Road No. 10
(Corporation Chowk To P&T
Gate No. 03) In Side Pd
Dwarika Prashad Mishra
Bus Stand Campus
FR/MCJ/02/PP/
PARKING-01 150.00 4.50
16. Feeder Road No. 10
(Corporation Chowk To P&T
Gate No. 03) Beside Manas
Bhawan Campus
FR/MCJ/02/PP/
PARKING-02 450.00 13.50
17. Feeder Road No. 11 (Madan
Mahal Chowk To Madan
Mahal Thana) Near Madan
Mahal Railway Station
FR/MCJ/02/PP/
PARKING-02 2975.00 89.25
18. Feeder Road No. 11 (Madan
Mahal Chowk To Madan
Mahal Thana) Near Madan
Mahal Railway Station
FR/MCJ/02/PP/
PARKING-01 300.00 9.00
19. Feeder Road No. 12
(Ambedkar Chowk to
Railway Bridge No.1
Existing Parking
Jabalpur High Court 300.00 9.00

Jabalpur Transport Sector CMP Under JNNURM
Municipal Corporation, Jabalpur R-1
227
20.4 CONCLUSION:
Valuation is required for following purposes:
• To promote the PPP mode for developing land / calculate age of building / best suited land use for
earning or to make sustainable system for BRTS.
• To calculate the guideline rates & property cost for increasing house tax at BRTS corridor on the basis
of land use.
• To recommend Nagar Nigam / Town Planning / Development Authority department to increase FAR
Premium Rate of the property.
• So that minimum fair market rate of property & property cost will return to the authority.