[J. Res. Natl. Inst. Stand. Technol. 107 Accelerating ... · animation as a time sequence of 3D...
23
Volume 107, Number 3, May–June 2002 Journal of Research of the National Institute of Standards and Technology [J. Res. Natl. Inst. Stand. Technol. 107, 000–000 (2002)] Accelerating Scientific Discovery Through Computation and Visualization II Volume 107 Number 3 May–June 2002 James S. Sims, William L. George, Steven G. Satterfield, Howard K. Hung, John G. Hagedorn, Peter M. Ketcham, and Terence J. Griffin National Institute of Standards and Technology, Gaithersburg, MD 20899-001 Stanley A. Hagstrom Department of Chemistry, Indiana University, Bloomington, Indiana 47405 Julien C. Franiatte and Garnett W. Bryant National Institute of Standards and Technology, Gaithersburg, MD 20899-001 W. Jasko ´lski Instytut Fizyki UMK, Grudziadzka 5, 87-100 Torun, Poland Nicos S. Martys, Charles E. Bouldin, Vernon Simmons, Oliver P. Nicolas, James A. Warren, and Barbara A. am Ende National Institute of Standards and Technology, Gaithersburg, MD 20899-001 John E. Koontz and B. James Filla National Institute of Standards and Technology, Boulder, CO 80305 Vital G. Pourprix National Institute of Standards and Technology, Gaithersburg, MD 20899-001 Stefanie R. Copley National Institute of Standards and Technology, Boulder, CO 80305 Robert B. Bohn National Institute of Standards and Technology, Gaithersburg, MD 20899-001 Adele P. Peskin National Institute of Standards and Technology, Boulder, CO 80305 and Yolanda M. Parker and Judith E. Devaney National Institute of Standards and Technology, Gaithersburg, MD 20899-001 [email protected] [email protected] [email protected] [email protected] [email protected] [email protected] [email protected] [email protected] [email protected] [email protected] [email protected] [email protected] [email protected] [email protected] [email protected] [email protected] [email protected] [email protected] [email protected] [email protected] [email protected] [email protected] [email protected] This is the second in a series of articles de- scribing a wide variety of projects at NIST that synergistically combine physical sci- ence and information science. It describes, through examples, how the Scientific Ap- plications and Visualization Group (SAVG) at NIST has utilized high performance par- allel computing, visualization, and machine learning to accelerate research. The exam- ples include scientific collaborations in the following areas: (1) High Precision Ener- gies for few electron atomic systems, (2) Flows of suspensions, (3) X-ray absorption, (4) Molecular dynamics of fluids, (5) Nanostructures, (6) Dendritic growth in al- loys, (7) Screen saver science, (8) genetic programming. Key words: discovery science; FEFF; FeffMPI; genetic programming; Hylleraas- Configuration Interaction; immersive envi- ronments; Lennard-Jones; nanostructures; screen saver science; parallel computing; QDPD; scientific visualization. Accepted: May 15, 2002 Available online: http://www.nist.gov/jres 001
Transcript of [J. Res. Natl. Inst. Stand. Technol. 107 Accelerating ... · animation as a time sequence of 3D...

Volume 107, Number 3, May–June 2002Journal of Research of the National Institute of Standards and Technology
[J. Res. Natl. Inst. Stand. Technol. 107, 000–000 (2002)]
Accelerating Scientific Discovery ThroughComputation and Visualization II
Volume 107 Number 3 May–June 2002
James S. Sims, William L. George, StevenG. Satterfield, Howard K. Hung, John G.Hagedorn, Peter M. Ketcham, and TerenceJ. Griffin
National Institute of Standards andTechnology,Gaithersburg, MD 20899-001
Stanley A. Hagstrom
Department of Chemistry,Indiana University,Bloomington, Indiana 47405
Julien C. Franiatte and Garnett W. Bryant
National Institute of Standards andTechnology,Gaithersburg, MD 20899-001
W. Jaskolski
Instytut Fizyki UMK,Grudziadzka 5,87-100 Torun, Poland
Nicos S. Martys, Charles E. Bouldin,Vernon Simmons, Oliver P. Nicolas, JamesA. Warren, and Barbara A. am Ende
National Institute of Standards andTechnology,Gaithersburg, MD 20899-001
John E. Koontz and B. James Filla
National Institute of Standards andTechnology,Boulder, CO 80305
Vital G. Pourprix
National Institute of Standards andTechnology,Gaithersburg, MD 20899-001
Stefanie R. Copley
National Institute of Standards andTechnology,Boulder, CO 80305
Robert B. Bohn
National Institute of Standards andTechnology,Gaithersburg, MD 20899-001
Adele P. Peskin
National Institute of Standards andTechnology,Boulder, CO 80305
and
Yolanda M. Parker and Judith E. Devaney
National Institute of Standards andTechnology,Gaithersburg, MD 20899-001
[email protected]@[email protected]@[email protected]@[email protected]@[email protected]@[email protected]@[email protected]@[email protected]@[email protected]@[email protected]@[email protected]@[email protected]
This is the second in a series of articles de-scribing a wide variety of projects at NISTthat synergistically combine physical sci-ence and information science. It describes,through examples, how the Scientific Ap-plications and Visualization Group (SAVG)at NIST has utilized high performance par-allel computing, visualization, and machinelearning to accelerate research. The exam-ples include scientific collaborations in thefollowing areas: (1) High Precision Ener-gies for few electron atomic systems, (2)Flows of suspensions, (3) X-ray absorption,(4) Molecular dynamics of fluids, (5)Nanostructures, (6) Dendritic growth in al-loys, (7) Screen saver science, (8) geneticprogramming.
Key words: discovery science; FEFF;FeffMPI; genetic programming; Hylleraas-Configuration Interaction; immersive envi-ronments; Lennard-Jones; nanostructures;screen saver science; parallel computing;QDPD; scientific visualization.
Accepted: May 15, 2002
Available online: http://www.nist.gov/jres
001

Volume 107, Number 3, May–June 2002Journal of Research of the National Institute of Standards and Technology
1. Introduction
The process of research may be abstracted into threemajor components as shown in Fig. 1. Increasingly ex-periment means computational experiment as comput-ers increase in speed and memory. Parallel computingassists in this by providing access to more processorsand more memory. Consequently more complex modelsthat run in feasible times become possible. Laboratoryexperiments as well are becoming parallel as combina-torial experiments become more common. Both of theselead to large datasets where analysis benefits greatlyfrom visualization.
Fig. 1. Abstraction of research loop.
In this paper we describe research collaborations, be-tween members of the Scientific Applications and Visu-alization Group (SAVG) and scientists in other labs atNIST, that incorporate parallel computing and visualiza-tion as integral parts of the research process. The paperis organized as follows. First, in Sec. 2 we describe ourimmersive environment. 3D immersion greatly assists inunderstanding data by literally putting the viewer insidetheir data. It is used in almost every project we do. InSec. 3 we describe a computational measurement that isnot only the most accurate in the world but also extensi-ble to larger systems. Following, Sec. 4 describes com-puter simulations of complex fluids like suspensions.We present results for concrete. Parallel computations ofthe near edge structure of clusters of atoms are given inSec. 5. Replicated data parallelizations of molecular dy-namics simulations of fluids are presented in Sec. 6. Wedescribe parallel algorithms for constructing nanostruc-tures as well as visualization of these structures in Sec.7. Section 8 details our simulation of the solidificationprocess of a binary alloy. Screen saver science, Sec. 9,is our name for our distributed computing project, de-signed to harvest the cycles of computers across NISTwhen they are in screen saver mode. Lastly, in Sec. 10,we discuss the NIST genetic programming system. Cur-rently it is being used to automatically generate func-tional forms for measurement errors.
2. Immersive Scientific Visualization
The Immersive Visualization (IV) laboratory plays akey role in accelerating scientific discovery. The NISTscientist views their serial/parallel computation resultsor experimental data with our IV system. The advancedvisualization provided by virtual reality techniques inour IV environment provides greater insight into large,complex data sets by allowing the scientist to interac-tively explore complex data by literally putting the sci-entist inside the data.
Fully immersive scientific visualization includes: oneor more large rear projection screens to encompass pe-ripheral vision, stereoscopic display for increased depthperception, and head tracking for realistic perspectivebased on the user’s viewing direction. The NIST IVlaboratory is configured as an immersive corner withtwo 2.44 m � 2.44 m (8 ft � 8 ft) screens flush to thefloor and oriented 90 degrees to form a corner. Thelarge corner configuration provides a very wide field ofperipheral vision. It is also important for the sense ofimmersion for the screens to be flush with the floor. Thesystem fulfills the other immersive characteristics withstereoscopic displays and head/wand tracking hardware.
Large and complex data sets are becoming more com-monplace at NIST, as high performance parallel com-puting is used to develop high fidelity simulations, andcombinatorial experimental techniques are used in thelaboratory. IV is significantly different from traditionaldesktop visualization and significantly more effective atilluminating such data sets [1]. One analogy for describ-ing this difference is to consider the difference betweenviewing the fish in a fish bowl and swimming with thefish at their scale. However, the benefits of IV can onlybe gained when scientists use it. The key ingredient tomaking IV accessible to scientists is to provide the abil-ity to simply and quickly move their data into the im-mersive environment.
The primary software controlling the NIST IV envi-ronment is an open source system named DIVERSE(Device Independent Virtual Environments—Reconfig-urable, Scalable, Extensible) [2, 3]. The DIVERSE API(Application Programming Interface) facilitates the cre-ation of immersive virtual environments and asyn-chronous distributed simulations by handling the detailsnecessary to implement the immersive environment.The software runs on a variety of display devices fromdesktop systems to multi-wall stereographics displayswith head tracking.
Included with DIVERSE is an extensible applicationcalled Diversifly that allows various techniques for nav-igation through user data loaded from a variety of exter-nal data formats. On top of this DIVERSE/Diversifly
002

Volume 107, Number 3, May–June 2002Journal of Research of the National Institute of Standards and Technology
infrastructure, SAVG has developed additional tools andtechniques for quickly moving research data into the IVenvironment, often with little or no special-purposegraphics programming. The approach used is to applythe classic UNIX1 philosophy [4] of creating small andreusable tools that fit into the immersive environmentand which lend themselves to combination in a variety ofways to perform useful tasks such as moving the resultsof a numerical simulation into the immersive environ-ment.
Using this philosophy, SAVG is providing the keyingredient to making IV accessible to NIST scientists by:
• developing simple and reusable graphics file formatsimplemented as Diversifly file loaders;
• developing application-specific files that are easilytransformed into existing or newly created graphicsfile formats;
• developing filters (scripts, small programs, etc.) toconnect data transformation pipelines.
Diversifly is extensible. Distributed Shared Objects(DSOs) can be written for it to implement a new inputgraphics data format. These DSOs are much like sub-routines (C/C++ functions). However, they are linkedinto the executable code at run time and the main Diver-sifly application need not be modified or recompiled.For the visualization of ellipsoidal objects (e.g., con-crete particles) in suspension discussed in Sec. 4, a fileloader DSO was created. This DSO implemented theanimation as a time sequence of 3D data. For this new.seq file type, each time step of the sequence was madegeneral in order to allow all other possible graphics filetypes to be used. Thus, not only were the requirementsfor this application met, but a wide variety of otherapplications involving animation as a time series of 3Ddata can be quickly implemented by reusing this DSO.
The development of an application-specific file for-mat doesn’t always require a DSO extension to Diver-sify. For example, an application that required the dis-play of colored spheres at random locations was satisfiedby defining an ASCII file to simply list the x , y , zsphere locations, the sphere diameters, and the corre-sponding sphere colors. Using a simple scripting lan-guage, a filter named sphere2iv was created to convertthe sphere list format to an Open Inventor [5] file (.iv )which is one of the many file formats compatible withDIVERSE. While it is possible for a user to directly
1 Certain commercial equipment, instruments, or materials are identi-fied in this paper to foster understanding. Such identification does notimply recommendation or endorsement by the National Institute ofStandards and Technology, nor does it imply that the materials orequipment identified are necessarily the best available for the purpose.
write the .iv file, the approach followed here allows auser to concentrate on their application by simplifyingthe graphics data format to essentially what they arealready doing. Again, the simplicity of this approachprovides quick access to the IV environment for a rangeof applications requiring the display of colored spheres.Now that this tool has been added to the tool box, it canbe combined with the .seq file format to produce othertypes of time series animations.
In addition to using DSOs for adding new graphicsfile loaders, they can also be used to extend the function-ality of Diversifly. Using this capability, interactive fea-tures can be added. For example, Fig. 2 shows a visual-ization of a cloud water dataset (cloudwater.dx) derivedfrom a sample dataset and program provided by theOpen Visualization Data Explorer (OpenDX) softwarepackage [6]. With the addition of a file switcher DSO,an interactive user click can be used to turn on (or off )streamlines as illustrated in Fig. 3. In this case, thefeature is used as a simple on /off switch. The mostappropriate graphics file type can be used for each viewof the visualization. Thus very complex immersive visu-alizations can be created at run time with the addition ofthis very simple tool.
Another DSO that extends the user interface is a vir-tual flashlight . Figure 4 shows the user view of thevirtual flashlight which is attached to the wand. It oper-ates like a hand held flashlight to explore and highlightthe virtual world. This capability is extremely usefulboth for a single user to focus attention on specific areasof the data and for multiple users in a collaborativesession. Just like the real world, a flashlight belongs ineveryone’s tool box.
Fig. 2. Cloud example.
003

Volume 107, Number 3, May–June 2002Journal of Research of the National Institute of Standards and Technology
Fig. 3. Click to turn on streamlines.
Fig. 4. Flashlight DSO enables the user to shine a flashlight on a spotwithin the immersive visualization by merely pointing to it.
The flow diagram in Fig. 5 illustrates how SAVGintegrates IV into a research collaboration with NISTscientists which takes the process from numbers to visu-alization to insight. A typical example will start with ascientist who has developed a model for some scientificresearch purposes. Often this is implemented as a serialprogram on a desktop workstation.
Working in collaboration with SAVG staff who spe-cialize in parallel programming, the model is convertedto a portable parallel code that can run on a variety ofparallel computing platforms. These parallel systemsmay be shared memory parallel machines, non-shared
Fig. 5. Collaboration process.
memory clusters or a combination of both. One obviousadvantage of parallelizing the code is that it will typi-cally execute much faster. However, the experience isthat scientists have a certain turn-around tolerance,meaning, they are willing to wait a certain amount oftime for their results. Rather than using the parallelversion to run the research problem quicker, the scien-tists often use the same amount of time to run a bigger,more complex problem that produces more data.
Once numerical results are obtained, the appropriatetools (described above) are pulled out of the tool box totransform the results into data compatible with Diversi-fly. As necessary, a new tool or application protocol maybe developed in order to minimize the impact on theresearcher. A very straight forward definition for UserFriendly is what the user already knows . The advantageof the software tools approach is that combinations ofexisting tools with occasional small additions can fre-quently match the user’s natural data to the visualizationdata requirements.
After the data is properly transformed, it is thenloaded into the Diversifly application which executes onthe graphics systems. Since the NIST graphics system isphysically located in a secure computer room environ-ment, video display extension hardware is required totransmit the graphics video to the user area where theIV system is located. At this point, the final and mostimportant link in the process is completed when theresearcher experiences data in the immersive environ-ment. Here the researcher visually interacts with thedata (swims with the fish) and gains some new insightinto the research which may then require another looparound the process.
Utilizing a tool box philosophy allows SAVG to visu-alize large numbers of applications with no program-
004
Volume 107, Number 3, May–June 2002Journal of Research of the National Institute of Standards and Technology
ming. For these applications, a toolbox of reusable util-ities, data filters, generalized application protocols anddata formats that feed into a single, well understoodviewing environment can provide almost immediate ac-cess to the virtual environment. The potential of immer-sive visualization to accelerate scientific discovery isrealized not only by its ability to provide new insightsbut also by providing a quick and easy interface to bringscience into the immersive environment.
3. High Precision Energies for Few-Electron Atomic Systems
Impressive advances have been made throughout theyears in the study of atomic structure, at both the exper-imental and theoretical levels. For atomic hydrogen andother equivalent two-body systems, exact analytical so-lutions to the nonrelativistic Schrodinger equation areknown. It is now possible to calculate essentially exactnonrelativistic energies for helium (He) and other three-body systems as well. Even for properties other than thenonrelativistic energy, the precision of the calculationhas been referred to as “essentially exact for all practicalpurposes” [7], i.e., the precision goes well beyond whatcan be achieved experimentally. Once the Bethe loga-rithm for He, long regarded as an unsolved problem, wascalculated accurately by Drake and Goldman [8], he-lium reached the same status as hydrogen in that thelowest order energy and relativistic corrections becameessentially exact for all practical purposes. Nevertheless,the scarcity of information on atomic energy levels isoverwhelming, especially for highly ionized atoms. Theavailability of high precision results tails off as the stateof ionization and the angular momentum state increases.In addition, atomic anions have more diffuse electronicdistributions, and therefore represent more challengingcomputational targets.
In going from He (two electrons) to Li (lithium, threeelectrons) to Be (beryllium, four electrons), the situationvis a vis high precision calculations degrades to the pointthat already at four electrons (Be) there are no calcula-tions of the ground or excited states with an error of lessthan 10�6 a.u.2 The challenge for computational scien-tists is to extend the phenomenal accomplishments onHe to three, four, and more electron atomic systems.
One might wonder why nonrelativistic energies withuncertainties of 1 � 10�20 or better might be desirable.There are essentially two reasons for this.
2 The atomic unit of energy is chosen as�e 4
� 2 = 1 a.u. (of energy),where � = me mN /(me + mN ).
The first is that the physical energies of interest, e.g.,a transition energy or familiar chemical ionization po-tentials and electron affinities involve these nonrelativis-tic energies. So the nonrelativistic energies need to becalculated exceedingly accurately to guarantee the accu-racy of the result. As one example, consider the firstionization potential for lithium. The first ionization po-tential, I1, for the process Li → Li+ + e�, can be deter-mined from [9]
I1 = ENR(Li+) � ENR(Li) + �EREL + �EMASS + �EQED (1)
where the first two terms are the nonrelativistic energiesof Li+ and Li, respectively, and the remaining threeterms refer to the relativistic correction, nuclear massdependent correction, and quantum electrodynamics(QED) shift, respectively. See King [9] for a more de-tailed discussion of these terms and for a discussion oftransition energies in general. The dominant terms arethe nonrelativistic energies. Hence these nonrelativisticenergies can be regarded as fundamental atomic data.Once they have been computed “exactly”, they can beused to obtain more and more accurate ionization poten-tials, electron affinities, etc., as the other (correction)terms become known to increasing precision.
The other reason for seeking a high precision nonrel-ativistic energy is that when a nonrelativistic energy isobtained, a wave function is also obtained which can beused to compute other physical properties like oscillatorstrengths, electric polarizabilities, Fermi contact terms,or nuclear mass polarization corrections. Quantum the-ory tells us that a first order error in the wave functionmanifests itself as a second order error in the energy[10]. Another way to put this is that the properties areaccurate as the square root of the uncertainties of theenergy. This can be understood from the fact that theenergy is a sum of kinetic and potential energy contribu-tions, so there can be cancellation of errors between thetwo energy contributions leading to a precision in theenergy determination that does not carry over to otherproperties. Hence the drive for high accuracy calcula-tions.
Modern computing power drastically changes our at-titudes towards the variational methods employed. In thecase of He, the choices for high accuracy calculationsare the following:
1. One that employs a variational expansion in prod-ucts of exponentials in the problem interparticle dis-tances [11, 12, 13];
2. Standard Hylleraas (Hy) technique [14] calcula-tions as best exemplified by the work of Drake andcollaborators [15, 16, 17], which employ factors of pow-ers of the interparticle distance rij in the wave function;
005

Volume 107, Number 3, May–June 2002Journal of Research of the National Institute of Standards and Technology
3. The combined Hylleraas-Configuration-Interac-tion (Hy-CI) method [18] in which the wave function isexpanded as a linear combination of configurations,each of which contains at most one rij to some power.
While the exponential products approach of Korobov[11] leads to a more compact wave function than eitherof the rij techniques for the He ground state and isstraightforward to implement, it is not clear how usefulit will be for atoms with more than two electrons. Fromthe theoretical work on Li published to date,3 it appearsessential to incorporate rij terms in the wave function, ifthe highest possible precision is desired. This is notsurprising given the monumental two electron calcula-tions of Drake and collaborators [15, 16, 17, 7, 8, 20,21]. But where Li has been done essentially as accu-rately as He, it has only been with a 6000 fold increasein CPU requirements to reach spectroscopic accuracy.This may have been what led Clementi and Corongiu[22], in a review article on Computational Chemistry in1996, to state that using an Hy-CI [18, 23] expansion tosolve the dynamical correlation is nearly impossible formore than three or four electrons. While that may havebeen true in 1996, its validity today is being challengedby the availability of cheap CPUs which can be con-nected in parallel to enhance by orders of magnitudeboth the CPU power and the memory that can bebrought to bear on the computational task.
For He, the close connection between Hy-rij and Hy-CI has been pointed out in a recent article [24]. It seemsto us that the Hy-CI method selects the important termtypes in a more natural manner. Also, the calculation, atleast for He, is easier. This, in conjunction with moderncomputing power, might explain the renewed interest inHy-CI techniques [25, 26, 27, 28, 29, 20]. It was theimpetus for our attempt to come up with a good tech-nique for obtaining very accurate energies for few elec-tron atomic systems using the Hy-CI formalism.
In any attempt to get very accurate energies, largebasis sets have to be employed, which means that lineardependence in the basis set is never very far away. Toproceed to several thousand terms in a wave function,extended precision arithmetic is needed to obviate thelinear dependence problem, which in turn leads tohigher CPU costs. The use of several thousand terms ina wave function leads to memory problems arising fromstorage of the matrix elements prior to the matrix diag-onalization step at least for dense matrices that resultfrom the introduction of interelectronic coordinates intothe wave function.
3 See King [9] for a review, and Godefroid, Froese Fischer andJonsson [19] for the most recent work.
The solution to these problems, for both CPU speedand memory needs, is to parallelize the calculation. Wenow have a working computer program for high preci-sion Hy-CI calculations for the ground state of He andHe-like ions [24]. As far as we know, this is the first highaccuracy calculation for few electron atomic systems toemploy parallel computing. Using the Message PassingInterface (MPI), the problem scales almost perfectly onthe 16 node NIST NT cluster where all the parallel runswere done, i.e, 3 hour runs complete in about 10 minutesto 15 minutes.
This working computer program employs a novelwave function, namely, a wave function consisting of atmost a single r12 raised to the first power combined witha conventional configuration interaction (CI) basis. Webelieve that this technique can be extended to multielec-tron systems [24], where the use of at most a single rij
(to the first power) retains the power of rij in the wavefunction without making the integral evaluation overlycomplicated. We used this technique to determine thenonrelativistic ground state energies for the followingmembers of the He isoelectronic sequence, Li+, Be++,and B+3. Table 1 contains our final energy values inatomic units (a.u.), and compares them with the bestprevious calculations [31, 20].
Table 1. Comparison with previous explicitly correlated calculationsfor 11S He-like ions
Author N Energy (a.u.)
Li+
TK [31] 308 �7.2799 1341 2669 3020Drake [20] 2114 �7.2799 1341 2669 3059 0000This work 4284 �7.2799 1341 2669 3059 6489
Be++
TK [31] 308 �13.6555 6623 8423 5829Drake [20] 2114 �13.6555 6623 8423 5867This work 4648 �13.6555 6623 8423 5867 0206
B+3
TK [31] 308 �22.0309 7158 0242 7777Drake [20] 2114 �22.0309 7158 0242 7815This work 4648 �22.0309 7158 0242 7815 4163
The parallel calculations reported here were carriedout at the National Institute of Standards and Technol-ogy on the instaNT.nist.gov NT Cluster, a 16 nodecluster of Pentium II systems running Microsoft Win-dows NT [Server 4.0] with 100-Mbit Fast Ethernet forinterconnection. We used our Microsoft ASM (MASM)extended precision (�48 digits) package for all of thecalculations.
006

Volume 107, Number 3, May–June 2002Journal of Research of the National Institute of Standards and Technology
We found that the processing speed could be pre-dicted, as a function of cluster size, by the simple scal-ing law T = constant (s + (1 � s )/Nproc), where T is theruntime in s, constant = 6419 in this case, and s is theinherently sequential part of the calculation. This func-tion is plotted in Fig. 6. We find that the sequentialfraction s = 0.022, indicating that the scaling is excellentand we could go to a larger number of processors (if wehad them).
Fig. 6. Hy-CI Scaling with Cluster Size.
As we move on to larger systems, computationaltimes will increase greatly, as well as memory require-ments, so it is imperative to program these routinesusing parallel programming techniques and MPI (forportability). If one restricts the wave function to a singlerij in each term (the rij power n � 1) then the mostdifficult integrals are already dealt with at the four elec-tron level and the calculation is greatly simplified.Hence, our goal is to see how well we can do in the fourelectron case of Be and the isoelectronic Be-like anion,Li�.
Li� is interesting because atomic anions have morediffuse electronic distributions (more “open-shell” likecharacter), and therefore represent more challengingcomputational targets. For example, the He-like isoelec-tronic anion H� is more difficult than He for this reason.In addition, in the four electron case the “open-shell”like nature of the anion would make the “inter”shell rij
terms more important than for closed shell atoms likeBe.
Li� also is the key to calculating the electron affinity(EA) of the ground state of Li. The EA of Li is thenegative of the energy associated with the processLi + e� → Li�. Its calculation requires several factors
which include the nonrelativistic energy of the neutraland anion ground states, specific mass shifts, Breit-Paulirelativistic corrections, and QED corrections. For theneutral atom all of these quantities are known [32, 9,33]. For the anion, if we can determine the nonrelativis-tic energy to high precision, we can make reasonableestimates for the rest. Since Breit-Pauli and QED aresmaller than the other terms, reasonable estimatesshould give satisfactory results. Hy-CI calculations havebeen done previously for Li� [34]. This result repre-sented for more than 15 years the best upper bound forthe ion considered. This result has been considerablyimproved by Chung and Fulbright [35] and others, cul-minating in the recent determination by Komasa, Rych-lewski, and Jankowski [36]. These authors treat othermembers of the Be isoelectronic sequence as well, andare the best results for four electron atoms so far. Theoverall accuracy can be claimed to be on the order of10�4 a.u. for the correlation energies with a nonrelativis-tic energy uncertainty of 10�6 a.u., clearly suggestingthe need for higher accuracy calculations. To this end,we have converted our Microsoft ASM (MASM) ex-tended accuracy (�48 digits) package to IBM AIX as-sembler language so that we can run on the IBM Ter-aflop SP System at Indiana University (616 processors).We are also redoing our integral package [23] so that wecan bring the power of modern parallel and extendedaccuracy techniques to bear on this research.
4. Computational Modeling of the Flow ofSuspensions
The computer simulation of complex fluids like sus-pensions (e.g., colloids, ceramic slurries and concrete)can be greatly limited by computational costs (such ascomputer speed and memory), frequently restrictingstudies to simpler fluids and/or two dimensional sys-tems. To obviate these computational difficulties, wehave developed a quaternion-based dissipative particledynamics (QDPD) approach suitable for a parallel com-puting environment. The parallelization of the algorithmwas done using MPI [37, 38]. The technique, a conven-tional spatial domain decomposition using a parallellink cell algorithm, has some fairly novel features toaccommodate the DPD formalism (which forces sometricky bookkeeping to satisfy Newton’s third law), theuse of arbitrarily shaped rigid body inclusions, and therequirement of a sheared boundary condition. A detaileddiscussion of our implementation will be presented else-where [39]. The calculation and subsequent visualiza-tion of a sheared suspension in different flow environ-ments is one of the applications treated by thistechnique.
007

Volume 107, Number 3, May–June 2002Journal of Research of the National Institute of Standards and Technology
While various quantitative tests are used to help vali-date our algorithms, visualization plays an importantrole in the testing and validation of programs. Evensimple visual checks to make sure the rigid bodies sat-isfy boundary conditions can be helpful.
Figure 7 shows the motion of a suspension of ellip-soids subject to shear. The shearing boundary condi-tions were obtained by applying a constant strain rate tothe right at the top of the figure and to the left at thebottom. Note that all the ellipsoids rotate. This is a wellknown phenomena seen in experiments called Jeffery’sOrbits. The period of rotation was derived by Jeffery,and our simulations were found to be consistent with thistheory, hence serving as a form of validation of ournumerical approach.
Fig. 7. Motion of a suspension of ellipsoids subject to shear. Thesingle ellipsoid rotation is a well known phenomenon called Jeffery’sOrbits.
In contrast, we found that when many ellipsoidal in-clusions were added to the system, and the solid fraction(ratio of solid volume to total volume of the system) ofellipsoids was increased to about 15 % to 20 % (Fig. 8),the Jeffery’s Orbits were suppressed and the ellipsoidshad a tendency to align as their relative motion waspartly stabilized by mutual hydrodynamic interactions.An interesting consequence of this alignment is that theviscosity of the suspension is lower than that of anequivalent sphere system (same number and volume ofspheres). Note that in a dilute concentration regime (Fig.7), an equivalent suspension of spheres has a lower vis-cosity. One way to think about it is that once the ellip-soids align it is “easier” for them to get around eachother. Hence, the viscosity decreases.
Not only does the visualization of data play an impor-tant role in the validation of computer algorithms andthe correctness of the physical ideas used, but visualiza-tion can lead to ideas about new phenomena that might
Fig. 8. Dense suspension of ellipsoids similar to typical aggregatecontribution in concrete. Jeffery’s Orbits are suppressed and the align-ment between ellipsoids is enhanced.
not be deduced from the enormous data sets createdduring a simulation. Also, visualization can help theresearcher design better numerical tests or come up withother, better ways to evaluate the physical behavior ofsystems. For example, the strong ordering seen in thesimulation of ellipsoids under shear (Figure 8 above) athigh solid fractions was unexpected and led to improvedways of quantifying such phenomena.
In the flow and placement of concrete, it is importantthat the fluid concrete have the capability to movearound barriers such as steel concrete reinforcements,known as rebars. Figures 9 and 10 show the flow ofspherical aggregates around stationary cylinders whichrepresent steel rebars. In one case (Fig. 9) the diameterof the spheres is on the order of one-half that of the gapbetween the rebars. Here the sphere becomes “jammed”as a bridge of spheres forms across the rebars obstruct-ing the flow. For comparison (Fig. 10), when the spherediameter is about one fifth the gap spacing (and thesame volume fraction of spheres is maintained), the sus-pension continuously flows. No evidence of the jam-ming is found over the course of the simulation.
Figure 11 shows the motion of a suspension ofspheres in a coaxial geometry. The motion of spheres isdriven by the rotation of the inner cylinder. The viscos-ity of a suspension is often determined in a coaxialrheometer where an inner cylinder rotates as it is subjectto an applied torque. Normally, knowing the torque andthe subsequent rotation rate of the inner cylinder, onecan derive the viscosity of the fluid in this flow geome-try. However, we found that the numerical determinationof viscosity can be influenced by the flow geometry insubtle ways. As can be seen in Fig. 11, the spheres hada tendency to move away from the inner cylinder. As aresult the coupling between the inner cylinder and the
008

Volume 107, Number 3, May–June 2002Journal of Research of the National Institute of Standards and Technology
Fig. 9. Spherical aggregates subject to a downward applied force.Sphere diameter is approximately one-half the gap spacing betweenreinforcing rebars. The “jamming” of the aggregates between cylin-drical rebars (in black) is observed.
Fig. 10. Spherical aggregates moving around stationary cylindricalrebars (in black). Sphere diameter is one-fifth the gap spacing. No“jamming” is observed.
Fig. 11. Coaxial Rheometer. An inner cylinder (in black) subject toan applied torque rotates, causing the motion of the spheres.
sphere suspension was weaker so that the measurementof the viscosity was lower than anticipated. Such infor-mation can help an experimentalist better interpret mea-surements made with rheometers using a similar ge-ometry and can lead to improvements in their design.
The combination of parallel processing and high endvisualization (including virtual environments) has al-lowed us to systematically explore regions of parameterspace (e.g., different solid fractions, broader particlesize and shape distributions) that would be prohibitiveon single processor computers.
5. Rapid Computation of X-RayAbsorption Using ParallelComputation; FeffMPI
Multiple scattering (MS) theory is widely used tocalculate physical properties of solids, ranging fromelectronic structure to optical and x-ray response. X-rayabsorption spectroscopy (XAS) uses energy-dependentmodulations of photoelectron scattering to probe ex-cited states and thus is important for determining elec-tronic and chemical information from x-ray spectra[40]. XAS is usually divided into the extended x-rayabsorption fine structure (EXAFS) with photoelectronenergies above � 70 eV, and the x-ray absorption nearedge structure (XANES) in the 0 eV to 70 eV range.Theoretical calculations of photoelectron scattering arenow an integral part of both EXAFS and XANES anal-
009
Volume 107, Number 3, May–June 2002Journal of Research of the National Institute of Standards and Technology
ysis. These theoretical calculations have grown in so-phistication and complexity over the past twenty years.Fortunately computing power has increased dramati-cally (in accordance with Moore’s law [41]) during thesame time period, and as a result EXAFS calculationsare now fast, accurate and easily executed on inexpen-sive desktop computers [42, 43]. However, XANES cal-culations are even today time consuming for many mate-rials. The photoelectron mean free path is large at thelow photoelectron energies of the XANES region, soaccurate XANES calculations require large atomic clus-ters and remain challenging on even the fastest singleprocessor machines. Furthermore, the photoelectronscattering is strong for low energies, so that full multiplescattering calculations are required. These calculationsrequire repeated inversions of large matrices whichscale as the cube of the size of the atomic cluster [44].Fortunately, parallel processing using MPI, combinedwith modern Lanczos type MS algorithms [45], canspeed real-space XANES and electronic structure calcu-lations by about two orders of magnitude. In particular,FEFF [46], one of the most commonly used programsfor XAS analysis (developed at the University of Wash-ington) has been improved in this manner, leading to aparallel version, FeffMPI [47].
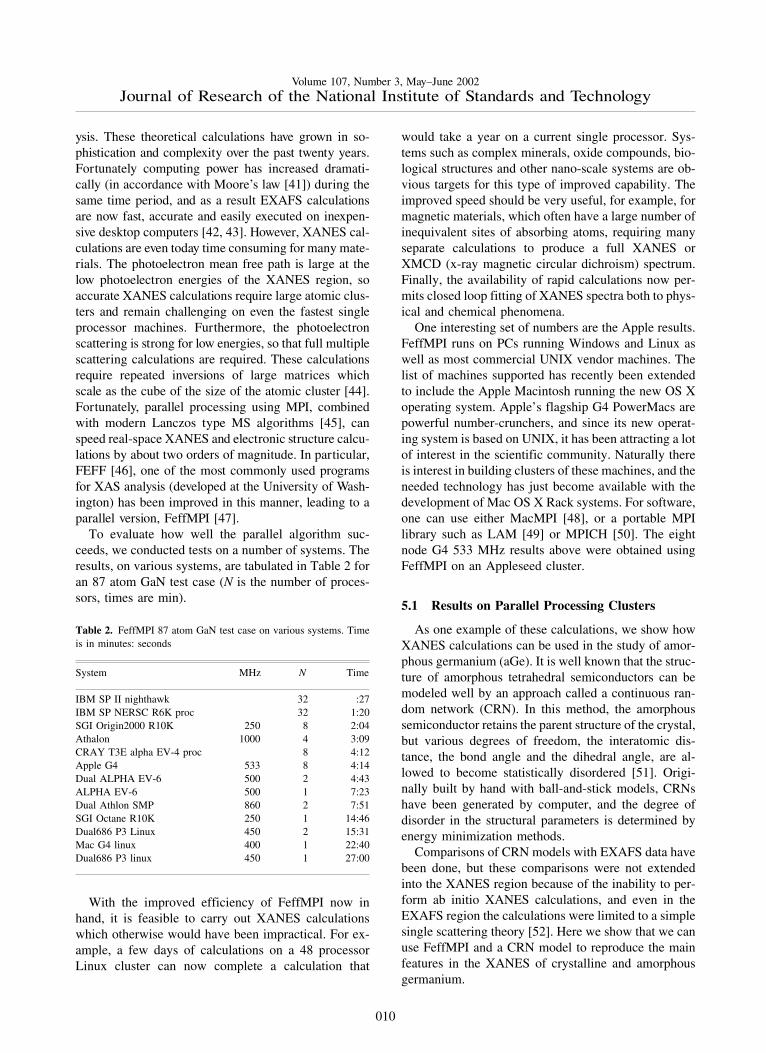
To evaluate how well the parallel algorithm suc-ceeds, we conducted tests on a number of systems. Theresults, on various systems, are tabulated in Table 2 foran 87 atom GaN test case (N is the number of proces-sors, times are min).
Table 2. FeffMPI 87 atom GaN test case on various systems. Timeis in minutes: seconds
System MHz N Time
IBM SP II nighthawk 32 :27IBM SP NERSC R6K proc 32 1:20SGI Origin2000 R10K 250 8 2:04Athalon 1000 4 3:09CRAY T3E alpha EV-4 proc 8 4:12Apple G4 533 8 4:14Dual ALPHA EV-6 500 2 4:43ALPHA EV-6 500 1 7:23Dual Athlon SMP 860 2 7:51SGI Octane R10K 250 1 14:46Dual686 P3 Linux 450 2 15:31Mac G4 linux 400 1 22:40Dual686 P3 linux 450 1 27:00
With the improved efficiency of FeffMPI now inhand, it is feasible to carry out XANES calculationswhich otherwise would have been impractical. For ex-ample, a few days of calculations on a 48 processorLinux cluster can now complete a calculation that
would take a year on a current single processor. Sys-tems such as complex minerals, oxide compounds, bio-logical structures and other nano-scale systems are ob-vious targets for this type of improved capability. Theimproved speed should be very useful, for example, formagnetic materials, which often have a large number ofinequivalent sites of absorbing atoms, requiring manyseparate calculations to produce a full XANES orXMCD (x-ray magnetic circular dichroism) spectrum.Finally, the availability of rapid calculations now per-mits closed loop fitting of XANES spectra both to phys-ical and chemical phenomena.
One interesting set of numbers are the Apple results.FeffMPI runs on PCs running Windows and Linux aswell as most commercial UNIX vendor machines. Thelist of machines supported has recently been extendedto include the Apple Macintosh running the new OS Xoperating system. Apple’s flagship G4 PowerMacs arepowerful number-crunchers, and since its new operat-ing system is based on UNIX, it has been attracting a lotof interest in the scientific community. Naturally thereis interest in building clusters of these machines, and theneeded technology has just become available with thedevelopment of Mac OS X Rack systems. For software,one can use either MacMPI [48], or a portable MPIlibrary such as LAM [49] or MPICH [50]. The eightnode G4 533 MHz results above were obtained usingFeffMPI on an Appleseed cluster.
5.1 Results on Parallel Processing Clusters
As one example of these calculations, we show howXANES calculations can be used in the study of amor-phous germanium (aGe). It is well known that the struc-ture of amorphous tetrahedral semiconductors can bemodeled well by an approach called a continuous ran-dom network (CRN). In this method, the amorphoussemiconductor retains the parent structure of the crystal,but various degrees of freedom, the interatomic dis-tance, the bond angle and the dihedral angle, are al-lowed to become statistically disordered [51]. Origi-nally built by hand with ball-and-stick models, CRNshave been generated by computer, and the degree ofdisorder in the structural parameters is determined byenergy minimization methods.
Comparisons of CRN models with EXAFS data havebeen done, but these comparisons were not extendedinto the XANES region because of the inability to per-form ab initio XANES calculations, and even in theEXAFS region the calculations were limited to a simplesingle scattering theory [52]. Here we show that we canuse FeffMPI and a CRN model to reproduce the mainfeatures in the XANES of crystalline and amorphousgermanium.
010

Volume 107, Number 3, May–June 2002Journal of Research of the National Institute of Standards and Technology
XANES calculations of amorphous materials are agood example of the use of FeffMPI because, in princi-ple, each atomic site in the CRN is inequivalent to everyother site because of the statistical disorder in the model.Therefore, accurate calculations of XANES must ex-plicitly include an ensemble average over a number ofsites in the CRN in order to yield meaningful results.
As a starting point for the XANES calculation of aGe,we first modeled the XANES of crystalline germaniumto determine the cluster size needed to accurately repro-duce the XANES. We found that a cluster of 87 atoms,which includes the first 7 coordination shells, out to adistance of approximately 0.78 nm is sufficient to repro-duce the main features of the experimental data. Theprimary feature that evolves as the cluster size increasesis the shoulder on the high energy side of the “whiteline”, i.e., the first large peak in the spectra.
The aGe XANES calculations were then carried outusing similar clusters of 87 atoms that had nearly thesame size as the crystalline cluster, because the CRNyields a structure that has the same density as crystallineGe, to within a few percent. Amorphous Ge is chemi-cally and structurally very similar to crystalline Ge, sowe made no adjustments in the potential determinationbetween the two structures. The CRN model is con-structed so that the atomic coordinates are expressed inmultiples of the first shell bond length. In convertingthis to absolute distances, we assumed that the first shellGe-Ge distance in aGe is the same as in crystalline Ge;to very high accuracy this assumption has been shown tobe correct [53].
In order to get a good ensemble average over theinequivalent sites of the CRN, we ran the same Feffcalculation over a total of 20 sites in the CRN.
We tested the calculation on a single processor desk-top machine (with a 450 MHz CPU), where a single runtook approximately one hour. We then used a 16 proces-sor cluster (each processor having a 1 GHz CPU) wherea single run took about 3 minutes. Using FeffMPI andthis fairly modest cluster size thus reduced the totalcalculation time from 20 hours to 1 hour. We have previ-ously studied [54] the scaling of Feff with the number ofprocessors and found that the runtime scales as0.03 + (0.97/Np), where Np is the number of processorsin the cluster, and a single processor runtime is normal-ized to 1.0. Thus, we achieve a factor � 11 from the useof 16 1GHhz processors, compared to a single 1 GHzprocessor of the same cluster. The additional factor oftwo (relative to the original desktop machine) comesfrom the increased clockrate of the processors in thecluster.
In Fig. 12(a) we show the 87 atom cluster used tocalculate the XANES of crystalline Ge. In Fig. 12(b) we
show a similar cluster of 87 atoms of aGe from the CRNdisplayed with the same length scale. As shown in thefigure, each cluster is about 1.5 nm across. In Fig. 13 weshow the full 519 atom cluster of aGe from the CRNwith a typical cluster of 87 atoms highlighted in theinterior. Although there are several hundred atoms in theinterior of the 519 atom cluster that are fully coordi-nated by 87 atoms, we obtain an accurate ensembleaverage using just 20 to 30 atoms near the center of thecluster. The convergence occurs quickly since averagingover N sites includes 4N first neighbor atoms, 12N sec-ond neighbor atoms, etc. The disorder in the CRN islarge enough that the separation of the neighboringatoms into separate coordination shells breaks down bythe third or fourth shell.
Fig. 12. (a) The 87 atom cluster used to calculate the XANES ofcrystalline Ge. (b) A similar cluster of 87 atoms of aGe from the CRNdisplayed with the same length scale.
011

Volume 107, Number 3, May–June 2002Journal of Research of the National Institute of Standards and Technology
Fig. 13. The full 519 atom cluster of aGe from the continuous randomnetwork with a typical cluster of 87 atoms highlighted in the interior.
In Fig. 14 we show the results of the crystalline Gecalculation (upper solid line), the ensemble average over20 sites in the aGe CRN (dashed line), and an illustra-tion of the site-to-site variation in the aGe (five offsetsolid lines). The five single sites that are shown from theaGe calculations illustrate that there is considerablevariance in the structure at any given site of the CRN,but that the ensemble-averaged XANES removes muchof the structure from the spectrum, in agreement withwhat is observed experimentally [55].
Fig. 14. Results of the crystalline Ge calculation (upper solid line),the ensemble average over 20 sites in the aGe CRN (dashed line), andan illustration of the site-to-site variation in the aGe (five offset solidlines).
6. Replicated Data Parallelizations of theDynamics of Fluids
Understanding the atomic and molecular basis of afluid’s properties has been greatly aided by the use ofcomputers and is commonly referred to as moleculardynamics (MD). Often the fluid system is modeled as anassembly of rigid molecules, atoms, or ions; the forcesof interaction are derived from continuous potentialfunctions acting between (usually atomic) sites on eachmolecule; and the dynamics are governed by the classi-cal Newtonian equations of motion.
We have written two different sequential programsboth fitting the above model. In both cases, even withvery fast modern computers, there eventually arose aneed for greater speed and memory, i.e., the computersimulations were taking on the order of days for smallsimulations.
It has been predicted since the early 1980s [56] thatparallel computers would offer the very highest perfor-mance for scientific computing. That vision has beensomewhat slow in coming. Nevertheless, molecular dy-namics was one of the earliest applications of parallelcomputers.
The emergence and widespread adoption of the singleprogram, multiple data (SPMD) programming modeland the standardization of parallel communications li-braries in the 1990s have increased the use of parallelcomputers and offered the carrot of the very highestperformance for scientific computing. Another signifi-cant advance has been the availability of the messagepassing interface standard MPI [37, 38]. A program cannow be both parallel and sufficiently independent ofarchitectural details to be portable to a wide range ofparallel environments, including shared-memory anddistributed-memory multiprocessors, networks ofworkstations, and distributed cluster computers. Weused MPI to parallelize both of the programs discussedbelow.
One of the programs is a quaternion-based dissipativeparticle dynamics (QDPD) program which is being usedto study the flow of suspensions and is discussed morethoroughly in Sec. 4.
Another of the programs attempts to model a simpletwo-component Lennard-Jones (L-J) fluid, i.e., definedby a Lennard-Jones potential which will be discussedlater. Among the outputs of the simulation are particledensity profile, potential energy profile, and stress ten-sor components. Since the system has two components,a surface is formed when the system is allowed to run forsome time. The stress tensor components at equilibriumcan be used to calculate the surface tension over thisinterface.
012

Volume 107, Number 3, May–June 2002Journal of Research of the National Institute of Standards and Technology
Both of the programs were originally written in For-tran 77 as serial programs. To accelerate scientific dis-covery, a parallelization of the program was done rela-tively quickly, in MPI [37, 38], using a simplifiedversion of the replicated data approach [57]. The advan-tage of the replicated data approach is, first and fore-most, ease of programming. Most of the parallel pro-gram is identical to the serial program which greatlysimplifies program maintenance. Also, load balancing ismuch more straightforward than with more sophisti-cated methods. Last, but not least, communication con-sists of one global summation per timestep. Our use ofthe replicated data approach is discussed in greater de-tail below.
The starting point for “parallelizing” a serial programis to first determine which parts of the program are themost time consuming (sometimes referred to as hotspots). Before parallelizing the program, tune the hotspots. Then get the profile of the tuned serial program.On UNIX machines, standard utilities can be used toidentify the hot spots. For this purpose we used Speed-Shop, an SGI integrated package of performance toolsthat let you run performance experiments on programsand examine the results of those experiments.
As expected on physical grounds, our profiling testsshowed that the loop to compute forces dominates thetime; over 90 % of the CPU time is spent inside the loopfor both programs.
The basic technique of parallelizing DO loops is todistribute iterations among processes and to let eachprocess do its portion in parallel. Both programs have aforces calculation which uses a link-cell algorithm. TheMD (or QDPD) cell is divided into a number of“subcells” and the linked list structure lists themolecules or atoms belonging to each subcell. The out-ermost loop of the link-cell forces calculation runs overall subcells within the simulation cell. In the serial case,it has the form
do icell = 1, ncell... evaluate forces on particles
in the cellenddo
where ncell is the number of cells. In the parallel case,the iterations of this loop are distributed over processorsby rewriting it as
do icell = this_process+1,ncell,nprocs... evaluate forces on particles
in the cellenddo
where nprocs is the number of processors. The only real
parallel operation needed is a global sum operation toadd the separate contributions to the forces and propa-gate a copy of the complete force array to every proces-sor. That’s all that is needed!
We have just described the replicated data approach[58, 57, 59], which gets its name from the fact that everyprocessor has a complete copy of all the arrays contain-ing dynamical variables for every particle. The compu-tation of forces is distributed over processors on thebasis of either cell indices (as above) or particles. Thisis a very efficient way of implementing parallelism sincethe forces must be summed over processors only onceper timestep, thus minimizing interprocessor communi-cation costs. On shared-memory machines like an SGIOrigin 2000, this approach is very attractive, since allprocessors can share the arrays containing dynamicalvariables.
The biggest disadvantage of the replicated data strat-egy is that every processor must maintain a copy of allof the data, and therefore the data must be updated oneach processor at the end of each time step. This is nota problem in the shared-memory multiprocessor versionif the MPI implementation is smart enough to take ad-vantage of the shared memory (which is the case on theSGI Origins). Using this technique, there is no need todistribute particle data since each processor has a copyof all of the data and updates them all; this approach hasworked well for small to medium sized problems (tens-of-thousands of particles) on the shared-memory SGIs.An example is our Lennard-Jones fluid program whichuses MD simulation to gain insight into the choice ofvarious order parameters and correlation functionswhich are associated with fluid-fluid interfaces, liquidfilms on solid substrates, and surface-tethered monolay-ers of chain molecules.
Dynamics of interfaces are challenging because thewide variety of rate phenomena that are encountered atinterfaces requires a high level of sophistication in deal-ing with them. But the payoff in understanding thesephase changes and fluctuations is a better understandingof rates of evaporation, condensation, absorption anddesorption, dissolution, and precipitation, among otherthings.
Our two-component fluid-fluid interface system con-sists of 2000 (1000 per component) particles interactingby a Lennard-Jones potential
VLJ = 4 � � [( /r )12 � ( /r )6)] (2)
where � and are the energy depth and range parame-ters, respectively. In addition to the Lennard-Jones po-tential, there are three interactions which contribute tosurface or interfacial formation, two for the two differ-ent like-particle attractions and one for unlike particle
013

Volume 107, Number 3, May–June 2002Journal of Research of the National Institute of Standards and Technology
repulsion. The system, which could be, for example, oiland water (or any two relatively immiscible fluids), hasperiodic boundary conditions and is initially configuredas a lattice as shown in Fig. 15. The two components areevenly distributed throughout their separate volumesprior to mixing.
Fig. 15. Snapshot of initial configuration of a two-component fluid-fluid interface system. One component is shown in blue and the othercomponent is shown in yellow.
Though the figure shows particles of distinct size, inthe program the particles are simulated as points. This isequivalent to particle interaction distances being mea-sured from particle centers for particles of distinct size.Once the system is “turned on”, it is allowed to run untilthermal equilibrium is reached (Fig. 16). In our calcula-tions, we consider the system at equilibrium if the ki-netic energy fluctuation is small. At that point (equi-librium), we collect data on the system. Since theinteraction is on the femtosecond (10�15 s) scale, weconsider a run of 10 picoseconds (10�12 s) to be a longone.
Fig. 16. Two-component fluid-fluid interface system at equilibrium.As seen in the figure, equilibrium is characterized by two distinctinterfaces.
In addition to determining the microscopic surfacedensity profiles of various atomic species, we would liketo be able to extract the components of the molecular-level Kirkwood stress tensor [60] from the simulation ofa small selected set of hydrophobic-hydrophilic inter-faces and make comparisons of their relative surfacetensions. Our reason for doing this is that Kirkwoodstress tensor integration is a way to determine surfacetension (another technique is density functional theory[61]). In Fig. 17 the stress tensor profile is shown at
equilibrium. Fig. 18 shows a density profile at equi-librium. A density profile in the initial configuration(Fig. 15) of two separate components would be flat,since the two separate components are completelymixed (and at equilibrium) prior to bringing them to-gether and allowing them to attain the new equilibriumof the two-component system. In contrast, in Fig. 18 thefact that unlike particles do not like to mix is evidentfrom the distinct decrease (the dips in the curve) in theparticle density in the interfacial regions, and providesa quantitative measure of what the visualization in Fig.16 shows.
Fig. 17. Plot of the x , y , and z components of the stress tensor. As canbe seen from the distinct dips in the curves, the greatest change inthese components occurs in the interfacial regions.
Fig. 18. Plot of the particle density. The fact that the unlike particlesdo not like to mix is evident from the distinct decrease (the dips in thecurve) in the particle density in the interfacial regions.
014

Volume 107, Number 3, May–June 2002Journal of Research of the National Institute of Standards and Technology
Kirkwood stress tensors and density functional the-ory are two ways to determine surface tension. Ourplans are to investigate the use of a third method, athermodynamic titration method (a process to connectheat flow for interfacial production or destruction tosurface tension) to derive the surface tension. Thisshould result in a flexible, convenient, and reliablemethod to check experimental as well as theoreticalapproaches to surface tension studies. It should also helpexpand the current data of this area of surface science.
By parallelizing the program, the L-J fluid simulationrun time decreases by a factor greater than six. Thisallows more flexibility in starting, checking, and analyz-ing runs. It also provides a means for more accuratelydetermining the behavior of surface tension, pressure,and potential profiles.
In the case of QDPD, the parallelization using theabove replicated data has been the workhorse for sometime now. However, it has had its disadvantages. Thebiggest disadvantage of the replicated data approach isthat it tends to get communication bound as the numberof processors increases. Scaling to very large numbersof processors in a shared-memory environment is poor(24 is the practical limit for us), and it has turned out tobe almost unusable on distributed memory systems in-cluding those with high speed interconnects like theIBM SP2/SP3 systems.
The solution to these problems is to do a spatial de-composition as we will describe fully in a future publi-cation [39].
7. Nanotechnology and ParallelComputing
Accurate atomic-scale quantum theory of nanostruc-tures and nanosystems fabricated from nanostructuresenables precision metrology of these nanosystems andprovides the predictive, precision modeling tools neededfor engineering these systems for applications includingadvanced semiconductor lasers and detectors, singlephoton sources and detectors, biosensors, and nanoar-chitectures for quantum coherent technologies such asquantum computing. The tight-binding model [62]based upon the Linear Combination of Atomic Orbitals(LCAO) method provides an atomistic theory for nanos-tructures which is accurate and easy to implement [63].The tight-binding method is ideal for modeling smallnanostructures [64], for example the pyramid shown inFig. 19. However, for modeling nanostructures withmore than 25 000 atoms, the method is impractical onsequential computers due to long run times. Significantimprovements in run time can be achieved through par-allelization.
Fig. 19. Pyramid structure.
7.1 Parallelization
There are two parts to parallelizing this problem:creating the structure; and solving the Hamiltonianequation.
The structure is created geometrically. We parallelizethis [65] by dividing the structure into layers. See Fig.20. Communication is across layers. The starting pointis a cubic structure that encompasses the desired nanos-tructure; the structure shape is created by pruning awaythe excess.
Fig. 20. A distribution of the computation via layers.
Once the atom positions are determined, then theHamiltonian is determined. Once the Hamiltonian isknown, it is diagonalized to find the electron eigen ener-gies and eigen states, i.e. the electron energies andcharge distribution at each atom site. This is parallelizedwith PARPACK [66].
We ran the code on the NIST NBS Cluster of 500MhzPentium III processors. Each processor has a Gibibyte,i.e., 230 bytes of memory. Figure 21 shows performancedata for three concentric spheres with diameters 3, 4,and 5 lattice units. This data matches closely the for-mula: T = 655.7 + 3116.0/N . T is execution time (in s),and N is the number of processors. The non-paralleliz-able computation time is 655.7 s; while the paralleliz-able portion of the computation uses 3116.0 s. Thus the
015

Volume 107, Number 3, May–June 2002Journal of Research of the National Institute of Standards and Technology
Fig. 21. Execution time versus number of processors for concentricspheres problem.
portion of the code that was directly parallelizable withPARPACK is almost 83 %.
7.2 Visualization
See Figure 22 for a visualization of a cross section ofa nanostructure (top) with orbitals (bottom). The pro-gram output is transferred to the NIST immersive envi-ronment where the structure is studied interactively. Thisprovides a detailed visualization of the structures andthe atomic scale variation of calculated nanostructureproperties that is not possible with any static graphicalrepresentation. We save the interaction with the structurein the immersive environment as a quicktime movie.The parallel implementation can handle arbitrary nanos-tructure shapes through an input file specification pro-cedure.
8. Dendritic Growth in Alloys
Our simulation of the solidification process for a bi-nary alloy is implemented as a parallel C program, usingMPI for interprocessor communication. The outputfrom this simulator consists of a series of snapshots ofa volume of material, consisting of two metals, taken asit solidifies. This material is initially in a supersaturatedliquid state except for a small seed of solid required toinitiate the solidification process. Detailed descriptionsof this simulator have been previously published [67,68].
Thanks to recent updates to our available computingresources we are now able to extend our simulations touniform finite-difference grids of size 1000 � 1000 �1000 using 70 or more compute nodes from our 128-node Beowulf cluster. This has been a goal of this pro-
Fig. 22. A section of a nanostructure (top) with orbitals (bottom).
ject since smaller simulations do not reveal sufficientdetail or produce dendrites sufficiently developed tofully exhibit relevant properties. Also, prior 2D den-dritic growth simulations on grids of size 1000 � 1000can be directly compared to these results.
At this point, the limiting factor in this project is thevisualization of the resulting 3D snapshots. Currentlyavailable commercial and open source visualization soft-ware has so far been incapable of processing these snap-shots, mostly due to internal array indexing limitationsand memory addressing issues, especially while com-puting isosurfaces. Also, interactive display of full reso-lution rendered images of the dendrites from simula-tions on grids of 3003 or larger has been too slow forpractical use. As part of our research effort, we areexploring techniques to enhance our capabilities in theseareas, for this particular application as well as otherlarge simulations.
To date, the largest dendrite that we have rendered hasbeen from a simulation over a uniform finite-differencegrid of 5003 points. Figure 23 shows one image of thisdendrite taken near the end of the simulation. Typicallythe raw data from the snapshots are reflected across allthree physical dimensions to produce a six-pointed
016

Volume 107, Number 3, May–June 2002Journal of Research of the National Institute of Standards and Technology
Fig. 23. A simulated copper-nickel dendrite computed over a uniform3D grid of 5003 points. Two of the axes have been mirrored resultingin this image of 1000 � 1000 � 500 (x , y , z ) points. The physicaldimensions of this dendrite are approximately 35 �m by 35 �m by17.5 �m. The color of the dendrite indicates the concentration ofcopper in the copper-nickel alloy at each point on the surface.
object. However, because of limitations of the visualiza-tion software, this image has been reflected across onlythe x and y axes, yielding the five-pointed object shown.The surface of the dendrite is colored according to therelative concentration of the two metals that comprisethe alloy, copper and nickel. This aspect of the alloy, therelative concentration of the constituent metals, is animportant factor in determining the final properties ofthe alloy. The key in Fig. 23 indicates the mapping ofsurface color to the percentage of copper in the material.
By taking 2D slices through the dendrite, the internalstructure of the dendrite can be inspected. Figures 24and 25 show some of the detail of the dendrite, specifi-cally the distribution of the constituent materials, with2D slices taken at several points along the z axis. Al-though the images in Fig. 25 are of different sizes, theyare all shown at the same scale as Fig. 24, only thesurrounding area, which is still in the liquid phase, hasbeen clipped to save space.
Further efforts should enable us to render the outputfrom these simulations on 10003 grids and to interac-tively display these images on systems ranging fromhigh-performance graphical workstations to 3D immer-sive environments.
9. Screen Saver Science
The Screen Saver Science (SSS) project is a researchproject to develop a parallel computing environment
Fig. 24. A 2D (x , y ) slice near the base of the dendrite shown in Fig.23.
Fig. 25. Several more 2D slices of the dendrite in Fig. 23. Each zvalue indicates by an integer the position of the slice along the z axis.
using any existing personal computers and scientificworkstations connected to the local network as the com-pute nodes. Each compute node would perform compu-tations, as part of this computing resource, only when itwould normally be idle or running a screen saver pro-gram. Optionally, the screen saver could still be runningin addition to the computation.
In contrast to well known distributed computingprojects, such as SETI@Home [69] (Search for Ex-traterrestrial Intelligence), Folding@Home [70, 71]
017

Volume 107, Number 3, May–June 2002Journal of Research of the National Institute of Standards and Technology
(protein folding), Distributed.net [72] (finding primefactors, cipher cracking), and others, the clients of thissystem, that is, the part that runs on the user’s worksta-tion, will not consist of a dedicated scientific applica-tion. In the SSS system, the client will have no particularcalculation embedded in it at all, but instead will becapable of performing any computation, subject to localresource constraints such as the amount of memoryavailable. This is made possible through the use of appli-cations compiled to portable Java bytecode along withthe Jini and JavaSpaces technologies [73] that have beenenabled by the Java environment. Another fundamentaldifference between SSS and other distributed comput-ing projects is that SSS clients can communicate witheach other during the computation in order to coordi-nate the computation, rather that simply exchangingdata with a central job manager, thus presenting a dis-tributed parallel computing model to the SSS applica-tion programmer.
This parallel coordination between the computenodes is feasible only because the pool of participatingcompute nodes will all reside within the local (NIST)network, which spans the two main campuses atGaithersburg, Maryland and Boulder, Colorado. Thisalso greatly simplifies the design of SSS with respect tosecurity since interprocessor communication will notneed to cross any network firewalls. Compared to otherdistributed computing projects which can potentiallyutilize millions of personal computers connected to theInternet, this will limit the number of available computenodes to a more modest value, possibly up to 3000nodes.
The basic design for this form of a generic distributedcompute server has been described by Freeman, Hupfer,and Arnold in the text JavaSpaces Principles, Patterns,and Practice [73]. The SSS project seeks to expand onthis basic idea to produce a robust production qualitydistributed computing environment. This environmentwill also be used as a testbed for the study of paralleldistributed algorithms for scientific applications.
The high-level design of SSS is shown in Fig. 26. SSSclients access the shared objects (data and programs)held in the JavaSpace services and also have access tofile servers for input and output of large data sets. Thebasic idea is that tasks (requested computations) areplaced in a JavaSpace. Clients take these tasks, one at atime, and complete them. As each task is completed, theclient writes the results back to the JavaSpace. Becausethese shared object spaces are not suitable for holdinglarge amounts of data, one or more file servers are alsoavailable for use during these computations.
This project is in its early stages with initial designand implementation scheduled for the summer of 2002.Many issues will need to be considered in designing the
Fig. 26. A high-level view of the Screen Saver Science architecture.Clients access a shared object space (JavaSpace) to retrieve tasks toperform, return results, send messages to other clients, broadcaststatus messages for general use, and exchange other messages asneeded. Large data sets will be stored on disk with client access tothese files coordinated through entries in the shared object spaces.
application programming interface (API) for the appli-cations programmer to use when, for example, the pro-gram needs to read or write a file, or to return a resultto the shared object space. Many other issues not di-rectly related to the implementation of SSS applicationsneed to be addressed also such as the design of the spaceobjects that will carry information to and from theclients, the interface between the SSS client and thenative screen saver, and supplementary applications formonitoring the status of the environment.
The initial application targeted for this environment isa quantum Monte Carlo (QMC) computation, looselybased on a Fortran 77 QMC application (QuantumMagiC) [74, 75]. This computation was chosen becauseit can be implemented with a highly parallel algorithmthat closely matches the model presented by the SSScomputing environment. Additionally, the size of theindividual tasks in a parallel QMC computation caneasily be tuned to the memory size and processor speedof the available compute nodes. Also, the large number
018

Volume 107, Number 3, May–June 2002Journal of Research of the National Institute of Standards and Technology
of floating-point operations required to complete a typ-ical QMC computation makes this an ideal applicationfor SSS.
10. The NIST Genetic ProgrammingProject
Genetic Programming (GP) is a technique for theautomatic design and implementation of algorithms. Weare building a generic, parallel, genetic programmingsystem that can be used on a variety of real-world scien-tific problems.
The user specifies the problem to be solved and pro-vides the building blocks; the system determines analgorithm that fits the building blocks together into asolution to the specified problem.
10.1 Background
Genetic programming is a technique that is inspiredby the processes of biological evolution. A population ofprograms evolve toward a solution to a given problemunder the pressure of a survival of the fittest mechanism.Genetic programming may be thought of as a type ofmachine learning that automatically can derive an al-gorithm from a relatively simple problem specification.
More specifically, an initial population of randomlyconstructed programs is created and each individualprogram is evaluated to determine how well it solves thegiven problem. In all likelihood, in this initial popula-tion, all of the programs will be very poor solutions tothe given problem, but some will be slightly better thanothers. A new population of programs is then derivedfrom the old population. This is done by creating newindividual programs from the old programs by biologi-cally-inspired transformations referred to as mutation,crossover, and survival. Preference in these operations isgiven to the individual programs that are judged to bebetter solutions to the given problem. It is this preferencefor the fittest programs that causes the population toevolve toward better solutions.
The new population is called the next generation. Thisprocess of evaluation of the fitness of the individualprograms and the creation of the next generation basedon the best programs from the old generation is thenrepeated until a satisfactory solution is found.
It should be noted that the process of measuring howwell a program solves a given problem is of criticalimportance. This fitness measurement procedure em-bodies the problem to be solved. It determines the land-scape that the GP search algorithm traverses and appliesthe force that causes the population of programs to movetoward a solution.
10.2 The NIST GP Implementation
We have implemented our GP system [76] using asomewhat unconventional representation for individual(evolvable) programs. We have used a program represen-tation that is modeled on the higher level programminglanguages typically used by human programmers, suchas C or Fortran. This is in contrast to the LISP-likerepresentation that is often used in genetic programmingsystems [77, 78, 79]. We describe our program represen-tation as a procedural representation in order to denotethe structuring of the program into a hierarchy of rou-tines, each composed of a sequence of calls to otherroutines.
We expect that this representation, with programstructures that are useful to human programmers, mayprove to be useful in evolved programs. Furthermore,although the same programs can be expressed in eitherthe LISP-like syntax or in our procedural structures, theevolutionary characteristics will certainly be different.Hence the procedural representation could yield betterresults for some problems. Of course, by the same token,the procedural representation could yield worse resultsin other cases [80]. This suggests that these two repre-sentations (and perhaps others) might be used togetherin a single system. We are exploring this idea in a relatedproject [81].
10.3 Results
We are studying symbolic regression with our GPsystem. Figure 27 shows the results of a GP run on oneproblem. The function that is being fitted issin(x 2 + x + 1). The figure depicts a portion of the func-tion, and the values of the fitted function at some of thetest points that the GP system used during its fitting.Clearly the GP system closely matched the target func-tion. In fact, our GP system found the function
Fig. 27. Results of an example regression run. Values of the GP-discovered function are shown at points that were used by the GPsystem to determine fitness.
019

Volume 107, Number 3, May–June 2002Journal of Research of the National Institute of Standards and Technology
cos(x 2 + x � 0.570562). Note that the GP system foundand used the constant 0.570562, which is a close approx-imation to /2 � 1. It then exploits the fact thatsin(a ) = cos(a � /2) to fit the data from the originalfunction.
One goal of the regression project is to automaticallyfind functional forms for measurement errors in combi-natorial experiments.
In conjunction with our procedural program represen-tation we have also introduced two new operations, re-pair and pruning , that are designed to work with thepeculiar properties of our program representation. Theseoperations are used much in the manner of mutation orcrossover to generate new programs from existing pro-grams in the evolving population of programs. Both ofthese operations have had substantial, and sometimesunexpected effects on the system’s effectiveness.
The repair operation scans selected programs andlooks for cases of unused variables or results, unsetoutput arguments, and the use of uninitialized variables.When one of these conditions is found, the program isautomatically altered to eliminate the situation. We havefound that these repairs can enable the GP system tomore easily evolve a population toward a solution.
The pruning operation goes through a program andattempts to cut off as many program branches as possi-ble without hurting the fitness of the program. Pruningwas initially implemented to address the problem of pro-gram bloat . This is a common problem in GP systems;it is the situation in which program size grows unman-ageably large, causing extreme slow-down of evolution.Techniques for reducing bloat have been studied [82].
Our pruning operation goes through a selected pro-gram and attempts to cut off as many program branchesas possible without hurting the fitness of the program.This form of pruning seems to be unlike many previousattempts to control program bloat. We found that thisoperation was not only quite effective in controllingprogram size, but that it also improves our GP system’sability to evolve solutions. We have observed cases inwhich the pruning operation has acted as a type ofmutation that produces a program that is substantiallymore fit than the program that it started with. At times,pruning has been observed to produce the most fit indi-vidual of the generation. This is an unexpected and in-triguing result and we will be investigating this effect inmore detail.
10.4 Visualization
In order to understand the operation of our GP systemwe instrumented the system in a variety of ways. Statis-tics are accumulated for program and populations suchas the number of operations and variables used, program
ancestry, and the type of genetic operations used. Thesedata enabled us to gain an understanding of the operat-ing characteristics of the system, but the volume of datais often unwieldy.
This motivated the implementation of a visual repre-sentation of populations and individual programs. Thesevisualizations do not capture all aspects of the programsor all of the statistics mentioned above but they doprovide a way of looking at broad characteristics orpatterns within populations.
Figure 28 shows a visualization of a population of 128individual programs. Each program is represented byone vertical column. As indicated in the figure, threeaspects of each program are represented. The upper partis a visual representation of the content of the program.Each block of color in this section corresponds to aprocedure in the program. The basic operations of thesystem are each given a different grey level and com-posite procedures (which assemble sequences of thebasic operations) are assigned a color that indicates an-cestry. In the middle section, the sequence of geneticoperations that brought each individual into existence ispresented. Each operation, such as crossover and muta-tion, is given a unique color. Finally, the lower portion ofthe image presents a normalized view of the fitness ofeach individual. In Fig. 28, the individuals have beenssorted by fitness with the most fit individuals on the left.
Fig. 28. Visualization of a population.
These visualizations have proven useful in severalways. For example, Fig. 29 shows the same populationas that in Fig. 28 but at a later generation. One observeslarge numbers of programs that have very similar struc-tures and very similar genetic histories. This visual rep-resentation clearly shows a loss of diversity in the popu-lation between the generation represented by Fig. 28 andthe generation shown by Fig. 29. This has prompted usto undertake an ongoing investigation into the issue ofpopulation diversity and its influence on the operationof our GP system.
020

Volume 107, Number 3, May–June 2002Journal of Research of the National Institute of Standards and Technology
Fig. 29. A population showing a substantial loss of diversity.
Acknowledgments
The authors would like to thank:Jack Newmeyer, Carl Spanger, and Hsin Fang and the
other members of the High Performance Systems Grouptheir assistance.
Bob Crosson, Darcy Barnett and Don Koss and theother members of the Enterprise Systems Administra-tion Group for their assistance.
Robert R. Lipman of the Building and Fire ResearchLaboratory for the first version of the Data Explorernetwork that handles ellipsoids referenced in the Com-putational Modeling of the Flow of Suspensions section.
Raymond D. Mountain and Joseph Hubbard of theChemical Science and Technology Laboratory for con-tributions to the programming and analysis of the resultsin the Replicated Data Parallelizations of the Dynamicsof Fluids section.
Barry J. Hershman and Michael D. Indovina of theDistributed Systems Technologies Group for putting to-gether the NT cluster that was used in the High PrecisionEnergies for Few-electron Atomic Systems section.
11. References
[1] Andries van Dam, Andrew S. Forsberg, David H. Laidlaw, Jr.,Joseph J. LaViola, and Rosemany M. Simpson, Immersive VRfor Scientific Visualization: A Progress Report, IEEE ComputerGraphics Appl. 20 (6), 26-52 (2000).
[2] DIVERSE: Device independent virtual environments-reconfigurable, scalable, extensible (online), (url:http://www.diverse.vt.edu/). Accessed 8 April 2002.
[3] John Kelso, Lance E. Arsenault, Steven G. Satterfield, andRonald D. Kriz, DIVERSE: A framework for Building Extensi-ble and Reconfigurable Device Independent Virtual Environ-ments, (2002), Proceedings of the IEEE Virtual Reality 2002
Conference, 24-28 March 2002, Orlando, FL, (url:http://math.nist.gov/mcsd/savg/papers).
[4] Brian W. Kerighan and Rob Pike, The UNIX ProgrammingEnvironment, Prentice Hall, Inc. (1984).
[5] Open Inventor(TM) (online), (url:http://oss.sgi.com/projects/in-ventor/).
[6] OpenDX (online), (url:http://www.opendx.org).[7] G. F. W. Drake and W. C. Martin, Ionization Energies and
quantum electrodynamic effects in the lower 1sns and 1snplevels of neutral helium (4He I), Can. J. Phys. 76, 679-698(1998).
[8] G. F. W. Drake and S. P. Goldman, Bethe logarithms for Ps-, H-,and heliumlike atoms, Can. J. Phys. 77, 835-845 (1999).
[9] F. W. King, High-precision calculations for the ground andexcited states of the lithium atom, Adv. At. Mol. Opt. Phys. 40,57-112 (1999).
[10] F. L. Pilar, Elementary Quantum Chemistry, McGraw Hill(1968).
[11] V. I. Korobov, Coulomb three-body bound-state problem; Vari-ational calculation of nonrelativistic energies, Phys. Rev. A 61,064503 (2000).
[12] A. J. Thakkar and V. H. Smith, Jr., Compact and accurate inte-gral-transform wave functions. I. The 1 1S state of the helium-like ions from H� through Mg10+, Phys. Rev. A 15 (1), 1-15(1977).
[13] A. M. Frolov and V. H. Smith, Jr., Universal variational expan-sion for three-body systems, J. Phys. B: At. Mol. Opt. Phys. 28,L449-L455 (1995).
[14] E. A. Hylleraas, Zeit. Phys. 54, 347 (1929).[15] G. F. W. Drake, in Long-range Casimir Forces: Theory and
Recent Experiments on Atomic Systems, F. S. Levin and D. A.Micha, eds., Plenum, New York (1993) pp. 107-217.
[16] G. F. W. Drake and Z.-C. Yan, Energies and relativistic correc-tions for the Rydberg states of helium: Variational results andasymptotic analysis, Phys. Rev. A 46, 2378-2409 (1992).
[17] G. F. W. Drake and Z.-C. Yan, Variational eigenvalues for theS states of helium, Chem. Phys. Lett. 229, 486-490 (1994).
[18] J. S. Sims and S. A. Hagstrom, Combined Hylleraas-Configura-tion Interaction (Hy-CI) Wave-Function Study of the GroundState of the Beryllium Atom, Phys. Rev. A 4 (3), 908-916(1971).
[19] M. Godefroid, C. Froese Fischer, and P. Jonsson, Non-relativis-tic variational calculations of atomic properties in Li-like ions:Li I to O VI, J. Phys. B 34 (2), 1079-1104 (2001).
[20] G. F. W. Drake, High Precision Theory of Atomic Helium,Phys. Script. T83, 83-92 (1999).
[21] G. F. W. Drake, High Precision Calculations for Helium, inAtomic, Molecular, and Optical Physics Handbook, G. F. W.Drake, ed., API press, New York (1996) pp. 154-171.
[22] E. Clementi and G. Corongiu, From Atoms to Large ChemicalSystems with Computational Chemistry, Revue de l’InstitutFrancais du Petrole 51 (1), 19-35 (1996).
[23] J. S. Sims and S. A. Hagstrom, One-Center rij Integrals OverSlater-Type Orbitals, J. Chem. Phys. 55 (10), 4699-4710 (1971).
[24] J. S. Sims and S. A. Hagstrom, High Precision Hy-CI Varia-tional Calculations for the Ground State of Neutral Helium andHeliumlike ions, Intl. J. Quant. Chem. (2002) in press.
[25] J. Pipin and D. M. Bishop, Accurate variational calculations ofenergies of the 2 2S, 2 2P, 3 2D states and the dipole, quadrupole,and dipole-quadrupole polarizabilities and hyperpolarizabilityof the lithium atom, Phys. Rev. A 45 (5), 2736-2743 (1992).
[26] A. Luchow and H. Kleindienst, Accurate Upper and LowerBounds to the 22S States of the Lithium Atom, Intl. J. Quant.Chem. 51, 211-224 (1994).
021

Volume 107, Number 3, May–June 2002Journal of Research of the National Institute of Standards and Technology
[27] G. Busse and H. Kleindienst, Double-linked Hy-CI calculationfor the nonrelativistic ground-state energy of the Be atom, Phys.Rev. 51 (6), 5019-5020 (1995).
[28] M. Bylecki and G. Pestka, Bound states of He�, J. Phys. B: At.Mol. Opt. Phys. 29, L353-L357 (1996).
[29] G. Pestka and W. Woznicki, Hylleraas-type calculatons forlithium, Chem. Phys. Lett. 255, 281-286 (1996).
[30] G. Busse, H. Kleindienst, and A. Luchow, Non-relativistic Ener-gies for the Be Atom: Double-Linked Hylleraas-CI Calculation,Phys. Rev. 51 (6), 5019-5020 (1995).
[31] A. J. Thakkar and T. Koga, Ground-state energies for the heliumisoelectronic series, Phys. Rev. A 50, 854-856 (1994).
[32] F. W. King, Progress on high precision calculations for theground state of atomic lithium, J. Mol. Struct.(Theochem) 400,7-56 (1997).
[33] Z.-C. Yan and G. W. F. Drake, Relativistic and QED energies inLithium, Phys. Rev. Lett. 81, 774-777 (1998).
[34] J. S. Sims, S. A. Hagstrom, D. Munch, and C. F. Bunge, Nonrel-ativistic energy of the ground state of Li� and the electron affin-ity of lithium, Phys. Rev. A 13 (2), 560-562 (1976).
[35] K. T. Chung and P. Fullbright, Electron Affinity of Lithium,Phys. Script. 45, 445-449 (1992).
[36] J. Komasa, J. Rychlewski, and K. Jankowski, Benchmark energycalculations on Be-like ions, Phys. Rev. A (2002) in press.
[37] Message Passing Interface Forum, MPI: A message-passing in-terface standard, Int. J. Supercomput. Appl. 8 (3/4), 159-416(1994).
[38] W. Gropp, E. Lusk, and A. Skjellum, Using MPI (2nd edition),The MIT Press, Cambridge, Mass. (1999).
[39] J. S. Sims and Nicos Martys, Simulation of Sheared Suspensionswith a Parallel Implementation of QDPD, to be published (2002).
[40] E. A. Stern, Theory of EXAFS, in X-Ray Absorption: Princi-ples, Applications, Techniques of EXAFS, SEXAFS, andXANES, D. C. Koningsberger and R. Prins, eds., volume 92 ofChemical Analysis, chapter 1, pp. 3-51 John Wiley and Sons,New York (1988).
[41] Gordon E. Moore, Electronics magazine, Apr. 1965.[42] J. J. Rehr, R. C. Albers, and S. I. Zabinsky, High-order multiple-
scattering calculations of X-ray-absorption fine structure, Phys.Rev. Lett. 69 (23), 3397-3400 (1992).
[43] S. I. Zabinsky, J. J. Rehr, A. Ankudinov, R. C. Albers, and M.J. Eller, Multiple-scattering calculations of X-ray-absorptionspectra, Phys. Rev. B 52 (4), 2995-3009 (1995).
[44] A. L. Ankudinov, B. Ravel, J. J. Rehr, and S. D. Conradson, RealSpace Multiple Scattering Calculation of XANES, Phys. Rev. B(1998) pp. 7565-7576.
[45] A. L. Ankudinov, C. E. Bouldin, J. J. Rehr, J. Sims, and H. Hung,Parallel calculation of electron multiple scattering using lanczosalgorithms, Phys. Rev. B 65, 104-107 (2002).
[46] FEFF [online], (url:http://leonardo.phys.washington.edu/feff/).[47] C. E. Bouldin and J. S. Sims, Parallel processing enables rapid
computation of x-ray absorption, J. Res. NIST 106, 612-613(2001).
[48] Appleseed [online], (url:http://exodus.physics.ucla.edu/apple-seed/appleseed.html).
[49] LAM [online], (url:http://www.lam-mpi.org/).[50] MPICH[online],(url:http://www-unix.mcs.anl.gov/mpi/mpich/).[51] D. E. Polk and D. S. Boudreaux, Phys. Rev. Lett. 31 (23), 92
(1973).[52] E. D. Crozier, EXAFS with Synchrotron Radiation, in EXAFS
Spectroscopy, B. K. Teo and D. C. Joy, eds., Plenum Press, NewYork (1981) pp. 89-101.
[53] E. A. Stern, C. E. Bouldin, B. von Roedern, and J. Azoulay,Incipient amorphous-to-crystalline transition in Ge, Phys. Rev. B27 (10), 6557 (1983).
[54] C. Bouldin, J. Sims, H. Hung, J. J. Rehr, and A. L. Ankudinov,Rapid calculation of x-ray absorption near edge structure usingparallel computation, X-Ray Spectrom. 30, 431-434 (2001).
[55] C. E. Bouldin, E. A. Stern, B. von Roedern, and J. Azoulay,Structural Study of hydrogenated a-Ge using extended x-rayabsorption fine structure, Phys. Rev. B 30 (8), 4462 (1984).
[56] G. C. Fox, R. D. Williams, and P. C. Messina, Parallel Comput-ing Works!, Morgan Kaufmann (1994).
[57] W. Smith, A replicated-data molecular dynamics strategy for theparallel Ewald sum, Comput. Phys. Commun. 67, 392-406(1992).
[58] W. Smith, Molecular dynamics on hypercube parallel computers,Comput. Phys. Commun. 62, 229-248 (1991).
[59] K. Refson, Moldy User’s Manual (1996).[60] J. G. Kirkwood and F. P. Buff, The Statistical Mechanical Theory
of Surface Tension, J. Chem. Phys. 17 (3), 338-343 (1949).[61] I. Naperi and A. Laaksonen, The effect of potential truncation on
the gas-liquid surface tension of planar interfaces and droplets, J.Chem. Phys. 114 (13), 5796-5801 (2001).
[62] P. Vogl, H. P. Hjalmarson, and J. D. Dow, A Semi-empericalTight-binding Theory of the Electronic-structure of Semicon-ductors, J. Phys. Chem. Solids 44 (5), 365-378 (1983).
[63] G. W. Bryant and W. Jaskolski, Designing quantum dots andquantum-dot solids, Physica E 11 (2-3), 72-77 (2001).
[64] Garnett W. Bryant and W. Jaskolski, Tight-Binding Theory ofquantum-dot Quantum Wells: Single Particle Effects and NearBand-edge Structure, (2002), Submitted to Phys. Rev. B.
[65] Julien C. Franiatte, Steven G. Satterfield, Garnett W. Bryant, andJudith E. Devaney, Parallelization and Visualization of Computa-tional Nanotechnology LCAO Method, (2002), Nanotechnologyat the Interface of Information Technology February 7-9, 2002New Orleans, LA.
[66] K. Maschhoff and D. Sorensen, A portable implementation ofARPACK for distributed memory parallel architectures, PhysicaE, (1996), Proceedings of the Copper Mountain Conference onIterative Methods.
[67] James S. Sims, John G. Hagedorn, Peter M. Ketcham, Steven G.Satterfield, Terence J. Griffin, William L. George, Howland A.Fowler, Barbara A. am Ende, Howard K. Hung, Robert B. Bohn,John E. Koontz, Nicos S. Martys, Charles E. Boulden, James A.Warren, David L. Feder, Charles W. Clark, B. James Filla, andJudith E. Devaney, Accelerating scientific discovery throughcomputation and visualization, J. Res. Natl. Inst. Stand. Technol.105 (6), 875-894 (2000), (url:http://math.nist.gov/mcsd/savg/pa-pers/).
[68] William L. George and James A. Warren, A parallel 3D dendriticgrowth simulator using the phase-field method, Journal of Com-putational Physics, (2002), to appear, (url:http://math.nist.gov/mcsd/savg/papers).
[69] SETI@Home, (url:http://setiathome.ssl.berkeley.edu), Accessed8 Apr. 2002.
[70] Michael Shirts and Vijay S. Pande, Screen savers of the worldunite!, Science 290 (5498), 1903-1904 (2000), (url:http://fold-ing.stanford.edu).
[71] Michael R. Shirts and Vijay S. Pande, Mathematical analysis ofcoupled parallel simulations, Phys. Rev. Lett. 86 (22), 4983-4987(2001).
[72] Distributed Computing Technologies Inc., Distributed.net,(url:http://www.distributed.net), Accessed 8 Apr. 2002.
[73] Eric Freeman, Susanne Hupfer, and Ken Arnold, JavaSpacesPrinciples, Patterns, and Practice, Addison-Wesley (1999).
[74] B. L. Hammond, W. A. Lester Jr., and P. J. Reynolds, MonteCarlo Methods in Ab Initio Quantum Chemistry, World Scien-tific Singapore (1994).
022

Volume 107, Number 3, May–June 2002Journal of Research of the National Institute of Standards and Technology
[75] Brian L. Hammond, Quantum MagiC, (1998), A quantum MonteCarlo program for the electronic structure of atoms andmolecules. (url:http://www.cchem.berkeley.edu/~walgrp/q780/man.html), Accessed 9 April 2002.
[76] John Hagedorn and Judith Devaney, A genetic programmingsystem with a procedural program representation, in Late Break-ing Papers in Genetic and Evolutionary Computation Conference2001, July 2001, pp. 152-159, (url:http://math.nist.gov/mcsd/savg/papers).
[77] John R. Koza, Genetic Programming: On the Programming ofComputers by Means of Natural Selection, MIT Press (1992).
[78] John R. Koza, Genetic Programming II: Automatic Discovery ofReusable Programs, MIT Press May 1994.
[79] John R. Koza, David Andre, Forrest H. Bennett, III, and MartinKeane, Genetic Programming 3: Darwinian Invention and Prob-lem Solving, Morgan Kaufman (1999).
[80] David H. Wolpert and William G. Macready, No free lunchtheorems for optimization, IEEE Trans. Evolution. Comp. 1 (1),67-82 (1997).
[81] Judith Devaney, John Hagedorn, Olivier Nicolas, Gagan Garg,Aurelien Samson, and Martial Michel, A genetic programmingecosystem, in Proceedings 15th International Parallel and Dis-tributed Processing Symposium, IEEE Computer Society April2001, p. 131, (url:http://math.nist.gov/mcsd/savg/papers).
[82] William B. Langdon, Terry Soule, Riccardo Poli, and James A.Foster, Chap. 8 in The evolution of size and shape, in Advancesin Genetic Programming 3, MIT Press (1999) pp. 163-190.
About the authors: James S. Sims, William L. George,Steven G. Satterfield, Howard K. Hung, John G. Hage-dorn, Peter M. Ketcham, Terence J. Griffin, Barbara A.am Ende, John E. Koontz, B. James Filla, Robert B.Bohn, Adele P. Peskin, Yolanda M. Parker, are compu-tational scientists in the Scientific Applications and Vi-sualization Group, Mathematical and ComputationalSciences Division, of the NIST Information TechnologyLaboratory. Stefanie R. Copley is a PREP student in theScientific Applications and Visualization Group. JulienC. Franiatte, Olivier P. Nicolas, and Vital G. Pourprixare Guest Researchers in the Scientific Applicationsand Visualization Group. Judith E. Devaney is GroupLeader of the Scientific Applications and VisualizationGroup. Garnett W. Bryant is a Physical Scientist in thePhysics Laboratory. Vernon Simmons is a Physical Sci-entist in the Chemical Science and Technology Labora-tory. Charles Bouldin and James Warren are PhysicalScientists in the Materials Science and EngineeringLaboratory. Nicos Martys is a Physical Scientist in theBuilding and Fire Research Laboratory. Stanley A.Hagstrom is Professor Emeritus of Chemistry and Com-puter Science at Indiana University. W. Jaskolski is aProfessor of Physics at Instytut Fizyki. The NationalInstitute of Standards and Technology is an agency ofthe Technology Administration, U.S. Department ofCommerce.
023