
J P. R P DM ESZTER HARGITTAI
22
© 2003 Stanford University IT&SOCIETY , VOLUME 1, ISSUE 5, SUMMER 2003, PP. 1-22 http://www.ITandSociety.org NEW S OCIAL SURVEY PERSPECTIVES ON THE DIGITAL DIVIDE JOHN P. ROBINSON P AUL D IMAGGIO E SZTER HARGITTAI ABSTRACT Most studies of the digital divide are concerned with the simple criterion of access, usually in the convenient locale of one’s home. That divide could be exacerbated by usage differences after such access has been achieved, however. This article takes advantage of usage data from the General Social Survey and other surveys to examine whether more highly educated respondents also have such advantages in usage processes after access has been achieved. Education has emerged from the NTIA and other national surveys as a more important multivariate predictor than income. Using a framework developed by DiMaggio and Hargittai (2001), it is found that college-educated respondents possess clear advantages over high-school educated respondents in using the Internet to derive occupational, educational and other benefits. The clearest advantage appears in terms of the types of sites visited, uses made and political discussion. Here, multivariate evidence shows that education—and occasionally income, age and marital status—is associated with consistently more long-term uses related to enhanced life chances via work, education, health or political participation; education is also related to less use for simple, short-term, entertainment or personal purposes. The advantages to the college educated are also evident in their keeping in contact with a wider range of friends and relatives, particularly by email. On the other hand, in several areas (e.g. search strategies employed; receiving assistance from relatives) little gap by education exists. _______________ John P. Robinson is a professor of sociology at the University of Maryland, where he directs the Internet Scholars Program and the Americans’ Use of Time Project. Paul DiMaggio is a professor of sociology at Princeton University, where he conducts research on the sociology of culture. Eszter Hargittai is an assistant professor at Northwestern University, where she conducts research on the social and policy implications of communication and information technologies. Grateful acknowledgement is given to the National Science Foundation, Office of Science and Technology, for support through grants NSF01523184 and NSF0086143.
Transcript of J P. R P DM ESZTER HARGITTAI

© 2003 Stanford University
IT&SOCIETY, VOLUME 1, ISSUE 5, SUMMER 2003, PP. 1-22 http://www.ITandSociety.org
NEW SOCIAL SURVEY PERSPECTIVES ON THE DIGITAL DIVIDE
JOHN P. ROBINSON PAUL DIMAGGIO
ESZTER HARGITTAI
ABSTRACT
Most studies of the digital divide are concerned with the simple criterion of access, usually in the convenient locale of one’s home. That divide could be exacerbated by usage differences after such access has been achieved, however. This article takes advantage of usage data from the General Social Survey and other surveys to examine whether more highly educated respondents also have such advantages in usage processes after access has been achieved. Education has emerged from the NTIA and other national surveys as a more important multivariate predictor than income.
Using a framework developed by DiMaggio and Hargittai (2001), it is found that college-educated respondents possess clear advantages over high-school educated respondents in using the Internet to derive occupational, educational and other benefits. The clearest advantage appears in terms of the types of sites visited, uses made and political discussion. Here, multivariate evidence shows that education—and occasionally income, age and marital status—is associated with consistently more long-term uses related to enhanced life chances via work, education, health or political participation; education is also related to less use for simple, short-term, entertainment or personal purposes. The advantages to the college educated are also evident in their keeping in contact with a wider range of friends and relatives, particularly by email. On the other hand, in several areas (e.g. search strategies employed; receiving assistance from relatives) little gap by education exists. _______________ John P. Robinson is a professor of sociology at the University of Maryland, where he directs the Internet Scholars Program and the Americans’ Use of Time Project. Paul DiMaggio is a professor of sociology at Princeton University, where he conducts research on the sociology of culture. Eszter Hargittai is an assistant professor at Northwestern University, where she conducts research on the social and policy implications of communication and information technologies. Grateful acknowledgement is given to the National Science Foundation, Office of Science and Technology, for support through grants NSF01523184 and NSF0086143.

2 NEW SOCIAL SURVEY PERSPECTIVES ROBINSON, DIMAGGIO, & HARGITTAI
IT&SOCIETY, Vol. 1, Issue 5, Summer 2003 http://www.ITandSociety.org
Much has been written about the “digital divide,” the gap between societal haves and have -nots in their access to the powerful new information technologies, particularly as embodied in the Internet (e.g., Norris 2001; Wilhelm 1999). Originally coined to convey the gap in access in found in government surveys conducted by the National Telecommunication and Information Administration (NTIA 1995; 1997; 1999; 2000; 2002), the term, has spawned a great deal of policy and academic controversy. Digital divide implies that significant minorities of the population are effectively denied access to a technology that, like other public facilities like libraries and superhighways, is thought to be open to anyone.
In this article, results from some recent surveys are reviewed to add broader perspectives on the nature and trends in this form of information inequality. Main evidence comes from the General Social Survey (GSS), which in years 2000 and 2002 contained an Internet module of up to 20 minutes worth of information on respondents' use of the Internet. Respondents were asked not only about their Internet access, but also about what sites they visited, how they drew on their social networks for assistance, their skills and information about how to use the Internet, and how the Internet fit into their usage of previous news media and other sources of information. The analytic value of the GSS lies in the quality of its sample (more than 2500 respondents interviewed in person each year, with a response rate above 70%) and the comprehensiveness of its data, in which time-series data on hundreds of social-trend questions have been asked since 1972. In addition, results from the original NTIA surveys and other surveys are cited to provide additional context on which information gaps do and do not exist.
Earlier Divides: First, some historical perspective is needed about
information divides in American society that have existed long before the Internet came into existence. Indeed, one of the most often replicated results in the social science literature is known as "the increasing knowledge gap hypothesis" (Gaziano 1993; Tichenor et al. 1969; Robinson 1967), which postulates that information media almost invariably increased the gap between the information haves and have-nots. One of the first studies to document the effect was the 1947 "Cincinnati experiment," in which that city was targeted as a testing ground to find ways of increasing public information about the United Nations. After an intensive six-month multimedia campaign, however, the proportion of residents who were familiar with the UN was unchanged from prior to the campaign. Those who were already informed did become better informed, but the have-nots remained have-nots (Hyman and Sheatsley 1950).
A more recent and familiar example concerns the highly popular children's TV program, Sesame Street, created to reduce the gap in preschool children's academic ability and skills using the power of public television to reach all segments of the population. Once again, however, watching Sesame Street was found to increase the preschool knowledge of middle-class children

3 NEW SOCIAL SURVEY PERSPECTIVES ROBINSON, DIMAGGIO, & HARGITTAI
IT&SOCIETY, Vol. 1, Issue 5, Summer 2003 http://www.ITandSociety.org
more than that of the working-class children it was intended to help (Cook et al. 1975). More recently, TV news programs have been found to inform already informed viewers more than those who are less informed (Robinson and Levy 1986).
Thus, it is little surprise to find that the already information rich were most likely to be found cruising the new low-cost information superhighway, and the major beneficiaries of the Internet’s information potential. Nor is it surprising that the demographic factor most related to information acquisition in general, namely education, is the factor most related to access to the Internet in the NTIA studies. Much has been written about the dramatic differences in access by income, including the assumption that lack of income is the most important factor in limiting access, because of the relatively expensive technological equipment involved. Multivariate analysis of the NTIA data, however, demonstrates that education, not income, best predicts whether someone is online (Table 1). There it can be seen that the average highest-minus-lowest difference across rows (income) is 32 percentage points, compared to 56 points down the highest-minus-lowest columns (education) for the population group aged 18-64; that conclusion is reinforced by the MCA regression results in Appendix Table 1. The same patterns emerge from the GSS data described below. Thus the Internet is an information medium that requires education to recognize and realize its full potentials; income is an important predictor but secondary to the related factor of education.
Because education is the main predictor of access, then, the following analyses focus on education. Specifically, the research question is whether one finds GSS education differences in the dynamics of how the Internet is used on a day-to-day basis—as well as on simple access to the technology. Do these usage differences serve to exacerbate the digital divide education differences found in access in Table 1?
DiMaggio and Hargittai (2001) identified five dimensions of Internet use that they posited would influence the benefits that users derive from the medium:
1. The quality of equipment used for access; 2. The user's autonomy in ability to access it; 3. The navigational skills needed to understand how to use the complex Web of
information stored on the Internet; 4. The social support networks that inform some users to become more familiar
with its potentials, and finally; 5. The types of sites the user visits while online.
In the analyses that follow, recent survey measures of these factors are correlated with respondent education to examine the degree to which education shapes not only access, but also use of the Internet. After describing the survey methodology employed to collect data for the GSS Internet module, differences are

4 NEW SOCIAL SURVEY PERSPECTIVES ROBINSON, DIMAGGIO, & HARGITTAI
IT&SOCIETY, Vol. 1, Issue 5, Summer 2003 http://www.ITandSociety.org
TABLE 1: DIFFERENCES IN INTERNET ACCESS BY EDUCATION AND INCOME
SOURCE: YEAR 2001 (NTIA DATA)
[NOTE: SEE APPENDIX: 1 MCA/ANOVA DATA] reported first, in bivariate form and, second, using MCA correction to control for a number of other demographic attributes of the GSS respondents.
SURVEY METHODOLOGY Field procedures: The year 2000 and 2002 GSS surveys were conducted
as personal in-home interviews that took about 90 minutes to complete with national probability samples of 2363 and 2784 respondents aged 18 and older. At each selected household, one adult person was interviewed at random. Interviewing took place between February and June of each year. The GSS survey, which has been conducted at one-to-two year intervals since 1974 by the National Opinion Research Center (NORC) at the University of Chicago, is generally considered the premier social science instrument for monitoring social life and trends in the United States.

5 NEW SOCIAL SURVEY PERSPECTIVES ROBINSON, DIMAGGIO, & HARGITTAI
IT&SOCIETY, Vol. 1, Issue 5, Summer 2003 http://www.ITandSociety.org
Sampling: Like its predecessors, the 2000 national probability sample was selected in two major stages, with Primary Sampling Units (PSUs) consisting of one or more counties selected at the first stage and segments consisting of one or more blocks selected at the second. The sample included 100 first-stage selections.
The PSUs consisted of metropolitan areas or non-metropolitan counties. Prior to the PSU selection, the United States was divided into 2,489 PSUs; the PSUs were then sorted into strata. The major strata again grouped metropolitan and non-metropolitan PSUs within each of the four Census regions. The non-metropolitan PSUs were further sorted by state; then, within state, by percent minority; and, finally, within populations consisting of minority group members. This sorting encompassed everyone but non-Hispanic Whites. The metropolitan PSUs were sorted by Census division, minority quartile and per-capita income. The sample PSUs were selected using systematic selection, with the selection probability for a PSU proportional to the number of housing units.
The second-stage sampling unit in the year 2000 GSS national sample was again the segment, consisting of one or more adjoining blocks. From three to 26 segments were selected in the 19 largest PSUs ; in each of the remaining 81 sample PSUs, three segments were selected. All told, the national sample includes 384 second-stage selections.
About five housing units per segment were selected. Because the sample is a clustered one, then, the effective sample size is lower than the number of respondents actually selected. Because the year GSS instruments were subdivided into six versions spread across segments, the design effect was much lower than if all respondents in a segment answered the same version.
Interviewer training and interviewer procedures: The interviews were
conducted by professional interviewers hired and trained by the National Opinion Research Center NORC. In addition to having participated in a 2 to 3 day general training session before being hired as interviewers, these NORC interviewers went through a mailed training session focusing on the various goals and modules of the year 2000 GSS. To boost response rates, interviewers made repeat visits to households at which no one was home, or the designated household respondent was not available. Enough repeat call-backs were made to such households that the main form of non-response was respondent refusal. Interviewers were able to complete interviews with 70% of designated respondents, compared to earlier GSS response rates that exceeded 75%.
Questionnaire: Five of the six different versions or ballots in the year
2000 GSS, except ballot 3 (n=454), contained some Internet questions. That left 2363 respondents eligible for the Internet module questions on the remaining five ballots, with each ballot representing a separate (and minimally clustered) random sample of the country. All questions about basic or core email and World Wide Web usage were asked of all 2363 respondents across each of the five

6 NEW SOCIAL SURVEY PERSPECTIVES ROBINSON, DIMAGGIO, & HARGITTAI
IT&SOCIETY, Vol. 1, Issue 5, Summer 2003 http://www.ITandSociety.org
ballots. In year 2002, all respondents were asked the core Internet questions, with a little more than half asked the remaining questions. Further details can be found in Kestnbaum et al. (2002).
Adults: The full-probability GSS samples used since 1975 are designed to
give each household an equal probability of inclusion in the sample. Thus for household-level variables, the GSS sample is self-weighing. In those households which are selected, selection procedures within the household give each eligible individual equal probability of being interviewed. The GSS does not calculate any post-stratification weights to adjust for differences in respondent factors with U.S. Census Bureau figures. NTIA and UCLA Surveys: More limited use is made below of data from two other surveys. The first is the 2001 NTIA survey conducted by the U.S. Bureau of the Census, as part of its August CPS survey, which includes all family members over age 3 in samples of almost 50,000 households with response rates above 75%; procedures are described in NTIA (2002). The second is the year 2000 UCLA study, a national RDD telephone survey conducted with over 2000 respondents in the spring of that year (further details can be found in Cole and Robinson 2002). RESULTS
1) Equipment: Although the GSS surveys did not ask questions about equipment, the 2001 NTIA study did ask about access to broadband among Internet users. Broadband, an "always-on" function, is thought to make access easier and less restrictive and its greater connection speed allows dramatically faster processing of online information. Table 2 parallels Table 1 in showing access to broadband by both education and income for those with Internet access in the NTIA study. In contrast to Table 1, Table 2 shows few dramatic differences by either education or income. Indeed, the only significant difference is found in the most affluent income category of over $75,000 household income (across all education groups).
At the same time, if the analysis were to examine broadband users generally—including Internet non-users as well as users in the denominator—the results would be between those shown in Table 1 and Table 2. That is, income in this context emerges as the main predictor of broadband use overall, although education is almost as important. The importance of income probably reflects the fact that home broadband users usually must pay a monthly service fee (usually to a local telephone or cable-television company). 2) Autonomy: The GSS did include a few questions related to autonomy of use, such as whether respondents had access at work, at others’ homes or libraries, as well as at home. Here again, the college-educated possess the advantage of access

7 NEW SOCIAL SURVEY PERSPECTIVES ROBINSON, DIMAGGIO, & HARGITTAI
IT&SOCIETY, Vol. 1, Issue 5, Summer 2003 http://www.ITandSociety.org
TABLE 2: DIFFERENCES IN BROADBAND ACCESS BY EDUCATION AND INCOME
SOURCE: NTIA 2001 DATA
[NOTE: SEE APPENDIX: 2 MCA/ANOVA DATA]
TABLE 3: DIFFERENCES IN AUTONOMY AT WORK
SOURCE: UCLA 2000 DATA

8 NEW SOCIAL SURVEY PERSPECTIVES ROBINSON, DIMAGGIO, & HARGITTAI
IT&SOCIETY, Vol. 1, Issue 5, Summer 2003 http://www.ITandSociety.org
from multiple sources, as well as the advantage of more computers with Internet access in the home.
To examine access at work, the 2000 UCLA national survey asked respondents who had connections at work how closely their employers monitored their usage. As shown in Table 3, less educated workers were significantly more likely to say their use was monitored "very closely." At the same time, there were no education differences in the near majority who said their use at work was not monitored at all.
3) Skills: With regard to the (third) aspect of navigational skills, Table 4
shows the diversity of strategies used by GSS respondents to access Web sites. The most popular way is to use a direct link from the home page (used about 55% of the time), and the second most popular is to type in the address itself (51%) and then to use a search engine (46%). The use of either these two most popular strategies does not consistently or notably differ by education. (It is possible of course that the specific search engine used may vary by education, but this cannot be determined from the available data.) For the next most popular strategy of using bookmarks (37%), however, college graduates are 10 points more likely to use them than the high-school educated; this strategy gained most popularity between 2000 and 2002. With regard to the final two strategies, selecting options from directories (27%) and using hyperlinks (30%), no educ ation differences are again found. As summarized in the last row then, differences in diversity of strategies is not related to education.
Table 5 shows breakouts by education for two relevant skill questions—self-proclaimed ability to learn about software and knowledge of Internet terminology. In (a) looking for online help and (b) using manuals, the more educated do have an advantage over the less educated. More than 75% of college graduates consult online help compared to only 49% of those Internet users with less than a high school degree; for using manuals, the figures are 80% vs. 54%. The “high school incomplete” group is more likely to call the software company for help (c) or consult someone at work for help (d). They are no less likely to ask nonworking colleagues than the college -educated (e), nor are they much less likely to pay someone for help or to say that try to figure software problems out themselves (f, g). The row labeled Internet Term Familiarity, shows differences on familiarity and knowledge questions about specific Internet terms like mp3, e-zines or search engines. While college graduate users scored more than 10 on a scale of familiarity with these terms, users with a high school degree or less had familiarity scores of fewer than 8 on this scale, a difference that is highly significant.

9 NEW SOCIAL SURVEY PERSPECTIVES ROBINSON, DIMAGGIO, & HARGITTAI
IT&SOCIETY, Vol. 1, Issue 5, Summer 2003 http://www.ITandSociety.org
TABLE 4: ESTIMATE OF AVERAGE PERCENT USE* OF VARIOUS INTERNET NAVIGATION STRATEGIES 16. Now I’d like to ask you about how you navigate around the Web. How frequently do you use each of the following ways of getting to the site you visit? High
School Inc High
School Grad
Some College
College Grad
Grad School
TOTAL
2000 ‘02
(n= ) (61) (195) (315) (215) (188) (974)
a. Use a direct link from your starting page (the page that you see when you go onto the Web)
50% 59% 56% 52% 54% 55% 56% 52
b. Type (or paste in) the Web address yourself
47 54 50 52 47 51 55 51
c. Use a search engine 42 40 49 48 48 46 46 47
d. Use a bookmark 27 35 35 41 41 37 32 48
e. Go to a category directory or Web guide and select an option
27 28 28 27 23 27 29 23
f. Go from a hyperlink in another site that you are visiting
30 28 31 30 32
30 30 30
Number used 2.23 2.44 2.49 2.50 2.55 2.46
*Based on a scale from 0%=Never to 100%=Almost always Source: 2000 and 2002 national samples from the General Social Survey (GSS)
4) Social Support: The second part of Table 5 refers to social support (DiMaggio and Hargittai 2001), here in relation to solving software problems. In general, one does not find many education differences in this list among those who use family members for support. However, college graduates are much more likely to cite a fellow worker or supervisor as a source of support, and college graduates are as much as 10 points more likely than those with a high school education or less to cite a close personal friend or other friend as a source of support. More generally, more educated people claim to have a broader range of social contacts than those with less education. Indeed, the data in Table 6 show that college graduates claim to have almost double the number of contacts seen during a year than those who have not completed high school, and they keep in contact with these people, either in person, by phone, by postal mail and in meetings. But the biggest difference is found in email contact, with college

10 NEW SOCIAL SURVEY PERSPECTIVES ROBINSON, DIMAGGIO, & HARGITTAI
IT&SOCIETY, Vol. 1, Issue 5, Summer 2003 http://www.ITandSociety.org
TABLE 5: COMPUTER SOFTWARE SUPPORT AND INTERNET TERM FAMILIARITY BY EDUCATION
35. When you want to learn how to do something new with your software and you need advice on how to do it, which of the following do you do? (Name as many as are correct.) [PROMPT:Anything else?]
High School Inc
High School Grad
Some College
College Grad
Grad School
(n= ) (41) (130) (204) (158) (119)
a. Look in the online “help” provided as part of software
49% 64% 71% 74% 77%
b. Look in a printed manual, book, or CD that tells how to use the software
54 66 77 79 80
c. Call the software company to get help
24 42 45 55 48
d. Ask someone at your workplace or school for help
54 53 64 69 68
e. Ask someone else you know for help
81 86 84 80 77
f. Pay someone to help you 5 12 11 14 13
g. Figure it out yourself 78 81 91 90 87
Internet Term Familiarity 7.6 8.0 9.8 10.5 10.2
II. Do the people ( d or e) you can ask for advice include? (Name as many as are correct):
(n= ) (62) (258) (379) (249) (202)
a. Spouse or partner 35% 45% 45% 39% 42%
b. Son or daughter 26 38 29 24 28
c. Mother or father 31 20 22 23 21
d. Brother or sister (incl in-laws) 40 42 39 44 37
e. Other family 42 38 36 27 28
f. A teacher 20 13 23 20 30
g. A fellow student 25 11 21 22 23
h. A supervisor or trainer at work 20 40 40 53 46
i. Other co-worker 37 54 59 75 77
j. A close personal friend 67 70 70 78 80
k. Other friend or acquaintance 55 59 60 66 70
l. A librarian 10 16 19 16 21

11 NEW SOCIAL SURVEY PERSPECTIVES ROBINSON, DIMAGGIO, & HARGITTAI
IT&SOCIETY, Vol. 1, Issue 5, Summer 2003 http://www.ITandSociety.org
TABLE 6: NUMBER OF SOCIAL CONTACTS BY EDUCATION High
School Incomp.
High School Grad
Some College
College Grad
Grad School
(n= ) (597) (1059) (1032) (508) (414)
4. a. Not counting people at work or family at home, about how many other friends or relatives do you keep in contact with at least once a year?
Number of contacts 19 23 26 35 37
b. Of these __________ friends and relatives, about how many do you stay in contact with by:
(n= ) (613) (1079) (1047) (514) (422)
i. Seeing them socially, face-to-face 10 12 13 17 16
ii. Talking with them on the telephone 9 11 13 15 17
iii. Exchanging cards or letters through U.S. postal mail
5 8 8 12 13
iv. Seeing them at meetings or events related to church, clubs, or other groups
5 7 7 10 10
v. Communicating through electronic mail
1 3 6 10 12
graduates estimating more than five times as many people contacted than those with a high school education.
Much of that difference is due to the fact that less educated people have less access to email. Table 7 examines the estimated number of messages among users, and here the differences by education are minimal, either by messages received or sent, or in terms of personal one -to-one messages. However, the college-educated are about twice as likely to exchange emails with work or business contacts as are the high-school educated, and in the extent of contact with friends and especially group acquaintances is higher among college graduates as well. As in Table 5, in contrast, email contacts with family members are just as likely among the less educated as the more educated.
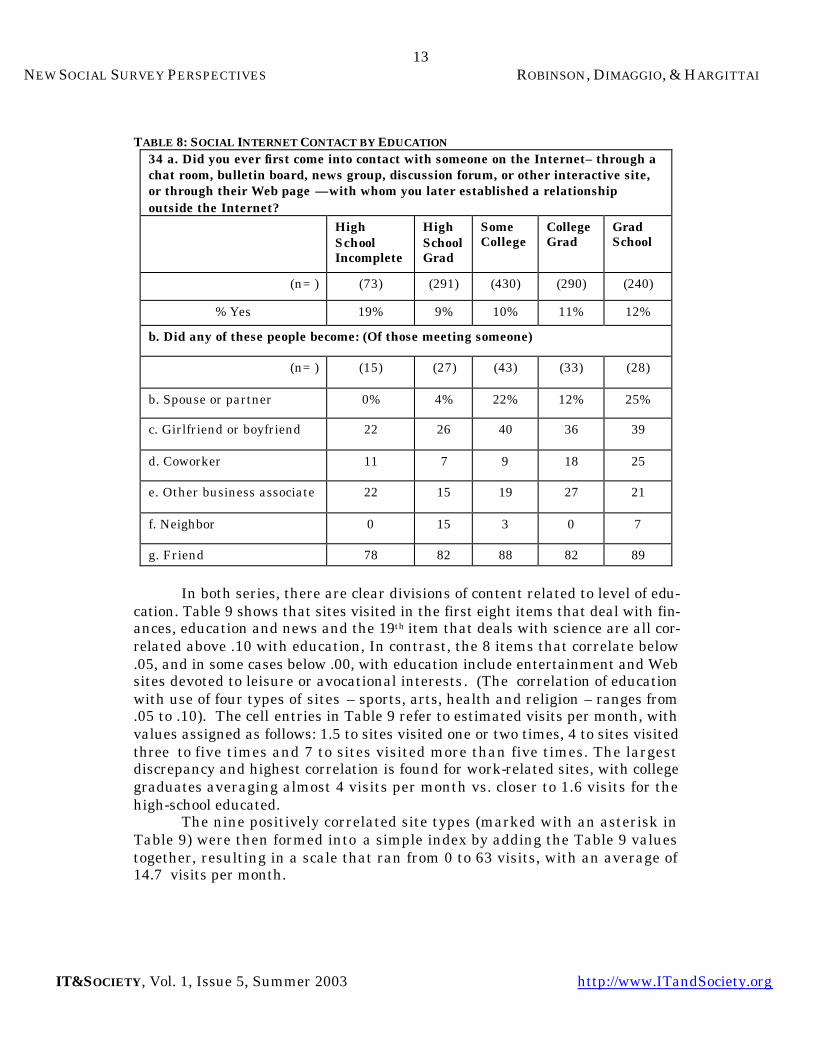
Table 8 also shows minimal difference by education in rates of making new contacts through the Internet. However, college graduates are far more likely to have met a romantic partner or coworker through the Internet than are the high-school educated. Differences in contacts with business associates, friends, neighbors and others are minimal.
5) Sites Visited: Turning to the final concern, types of sites accessed, the
GSS included several questions asked in two separate series shown in Tables 9 and 10. The first asked about frequency of visits to 21 generic types of sites in the last 30 days, the second about 12 types of activities done on the Internet in

12 NEW SOCIAL SURVEY PERSPECTIVES ROBINSON, DIMAGGIO, & HARGITTAI
IT&SOCIETY, Vol. 1, Issue 5, Summer 2003 http://www.ITandSociety.org
TABLE 7: NUMBER OF E-MAIL MESSAGES BY EDUCATION High
School Incomplete
High School Grad
Some College
College Grad
Grad School
(n= ) (50) (178) (306) (215) (178)
14 Thinking now about all your home, work or other computer sites
a. About how many email messages do you send from all these computers on an average day?
10
7
9
15
13
b. About how many of these _____ messages are personal one-to-one, rather than sent to members of a group or e-list?
8
5
5
9
8
c. About how many messages do you receive on all these computers on an Average day?
28
20
22
25
26
d. About how many of these _____ messages are personal one-to-one, rather than ones you receive as a member of a group or e-list?
11
9
8
11
13
Do any of the personal one-to-one messages you receive or send come from:
e. People at your workplace 20% 33% 47% 52% 60%
f. Business or work contacts away from your workplace
24 34 45 58 60
g. Family members who live with you
22 21 17 23 25
h. Other family members 72 74 72 77 77
i. Friends 74 84 86 90 90
j. Members of your church 2 18 20 18 20
k. Members of other groups or associations to which you belong
22 33 39 52 58
the previous year on a simple “yes-no” basis. The correlations in the final columns of Tables 9 and 10 summarize the extent to which the respondents’ education predicts more frequent visits to that site or more frequent uses made.
13 NEW SOCIAL SURVEY PERSPECTIVES ROBINSON, DIMAGGIO, & HARGITTAI
IT&SOCIETY, Vol. 1, Issue 5, Summer 2003 http://www.ITandSociety.org
TABLE 8: SOCIAL INTERNET CONTACT BY EDUCATION 34 a. Did you ever first come into contact with someone on the Internet– through a chat room, bulletin board, news group, discussion forum, or other interactive site, or through their Web page —with whom you later established a relationship outside the Internet? High
School Incomplete
High School Grad
Some College
College Grad
Grad School
(n= ) (73) (291) (430) (290) (240)
% Yes 19% 9% 10% 11% 12%
b. Did any of these people become: (Of those meeting someone)
(n= ) (15) (27) (43) (33) (28)
b. Spouse or partner 0% 4% 22% 12% 25%
c. Girlfriend or boyfriend 22 26 40 36 39
d. Coworker 11 7 9 18 25
e. Other business associate 22 15 19 27 21
f. Neighbor 0 15 3 0 7
g. Friend 78 82 88 82 89
In both series, there are clear divisions of content related to level of edu-cation. Table 9 shows that sites visited in the first eight items that deal with fin-ances, education and news and the 19th item that deals with science are all cor-related above .10 with education, In contrast, the 8 items that correlate below .05, and in some cases below .00, with education include entertainment and Web sites devoted to leisure or avocational interests. (The correlation of education with use of four types of sites – sports, arts, health and religion – ranges from .05 to .10). The cell entries in Table 9 refer to estimated visits per month, with values assigned as follows: 1.5 to sites visited one or two times, 4 to sites visited three to five times and 7 to sites visited more than five times. The largest discrepancy and highest correlation is found for work-related sites, with college graduates averaging almost 4 visits per month vs. closer to 1.6 visits for the high-school educated. The nine positively correlated site types (marked with an asterisk in Table 9) were then formed into a simple index by adding the Table 9 values together, resulting in a scale that ran from 0 to 63 visits, with an average of 14.7 visits per month.

14 NEW SOCIAL SURVEY PERSPECTIVES ROBINSON, DIMAGGIO, & HARGITTAI
IT&SOCIETY, Vol. 1, Issue 5, Summer 2003 http://www.ITandSociety.org
TABLE 9: SITE TYPES VISITED BY EDUCATION (IN ESTIMATED VISITS PER MONTH) 17. In the past 30 days, how often have you visited a Web site for __________?
High School
Incomplete
High School Grad
Some College
College Grad
Grad School
Cor -relation
(n=) (96) (355) (547) (350) (308)
*a. Financial Information 1.2 1.3 1.8 2.4 2.4 .18
*b. Sites related to school .6 .6 .9 .8 .13 .11
*c. Other educational site 1.5 1.4 1.8 1.9 2.4 .13
*d. Sites related to work 1.4 1.7 2.2 3.9 4.0 .31
*e. News, current events 2.5 2.6 31 38 39 .17
*f. Gov’ment information 1.0 9 1.4 1.7 2.1 .19
*g. Political information .5 .6 1.0 1.1 1.2 .13
*h. Travel 1.3 1.6 2.0 2.5 2.6 .15
i. Sports 1.0 1.4 1.5 1.9 1.7 .06
- j. Music/concerts 1.7 1.4 1.6 1.4 1.4 -.03
k. Visual arts/ museums .4 .5 .6 .7 .8 .09
- l. Television or movies .9 1.0 1.1 1.3 1.2 .03
m. Health and fitness 1.0 1.3 1.6 1.6 1.7 .08
n. Religion/church .2 .5 .6 .6 .7 .06
- o. Games computer play 2.7 2.1 1.7 1.2 .8 -.24
- p. Humor 1.8 1.5 1.3 1.1 1.1 -.10
- q. Sexually explicit sites .4 .5 .3 .4 .3 -.04
- r. Personal home pages 1.3 .8 .8 .7 .8 -.03
*s. Science .9 .8 1.2 1.4 1.9 .19
- t. Hobbies and crafts 1.8 1.7 1.6 1.5 1.3 -.06
- u. Cooking, recipes .9 1.1 1.1 1.0 .9 -.03
* Positive correlation with education - Negative or no correlation with education
Similarly, the 8 non-correlating or negatively correlating items (marked
with the negative (-) sign in Table 9) were added together to get a scale with an average of 10.5 monthly visits (out of 56 possible visits).
An MCA regression program was then applied to the two scales, with education, income, age, race, marital status and gender as predictors. Of these

15 NEW SOCIAL SURVEY PERSPECTIVES ROBINSON, DIMAGGIO, & HARGITTAI
IT&SOCIETY, Vol. 1, Issue 5, Summer 2003 http://www.ITandSociety.org
six predictors, only two correlated positively with the positive (education-enhancing) scale, education and gender, with men reporting about 2 more visits than women—far lower than the 7.5 visit spread between college-educated and high-school-educated respondents. There were 2-to-3 visit differences between the middle-aged and the elderly and between highest and lowest income groups, but these differences were not large enough to be statistically significant. Those with more education clearly were more likely to visit Web sites that have work or informational value. With respect to sites devoted to avocational concerns, education and income were negatively related to use, but the differences of 1 to 2 visits were not large enough to be statistically significant. All four other factors, however, were significantly predictive, with non-black minorities, men, the never-married and those under 25 all making almost 2 more monthly visits to such sites than other users.
A very similar pattern emerges for the 12 uses of the Internet in the past year as identified in Table 10. The seven items (a b c d e h i) marked with an asterisk refer to finances and travel. When these seven items related to finances and travel are combined into an index, after MCA adjustment that index is positively and significantly related to both higher education and higher income, as well as to being male, between the ages of 25 and 54, never married and non-black.
The 3-item index for the three games/personal uses in Table 10 is significantly related to lower education and income, and to being male, under age 35 and unmarried; race was unrelated to use of these functions. That is consistent with the predictors of entertainment/personal site usage in Table 9.
Table 11 shows that college educated users are also more likely than the less educated to use the Internet to participate in or inform themselves about politics and policy issues. Education is the major predictor of Internet use for such purposes; age is also a significant predictor, with older users holding the advantage. In response to follow-up questions on political topics discussed, more educated respondents were more likely to report discussing the economy, foreign affairs, environmental issues, political campaigns, taxes and news headlines. When these items are incorporated into an index, education remains the most significant predictor of following such content on the Internet; the highest-income and oldest respondents also report higher use of the Internet for such political content.
Moreover, in surfing political Websites, the college educated are 8 to 13 points more likely to say that they have visited Websites without any particular point of view, or with a point of view that challenged pre-existing political opinions. Finally, they are 3 to 4 times more likely to report that Web political content led to their signing a petition, contacting an elected official or attending a political demonstration.

16 NEW SOCIAL SURVEY PERSPECTIVES ROBINSON, DIMAGGIO, & HARGITTAI
IT&SOCIETY, Vol. 1, Issue 5, Summer 2003 http://www.ITandSociety.org
TABLE 10: INTERNET USES BY EDUCATION LEVEL 19. In the past 12 months, that is, from (INSERT CURRENT MONTH) 1999 through (INSERT CURRENT MONTH) 2000 have you used the Web to do each of these things:
High School
Incomp.
High School Grad
Some College
College Grad
Grad School
Cor -relation
(n=) (32) (100) (180) (139) (138)
*a. Look for information you needed for your work?
42% 45% 56% 74% 84%
.30
*b. Home finances or banking?
34 39 58 59 63 .19
*c. Look for information about a product that you might want to buy?
74 71 80 88 86 .14
*d. Actually buy something? 50 42 56 70 71 .20
*e. Invest money in a stock or mutual fund?
6 9 14 22 21 .16
- f. Tried to meet new people for social purpose?
27 16 15 15 11
-.07
g. Look for information about a health concern or medical problem?
57 55 61 66 69
.10
* h. Make an airplane or other travel reservation?
24 25 42 55 55
.25
i. Locate someone’s phone number, email, or mailing address?
49 50 51 55 66
.12
- j. Play a game with someone on another computer?
32 24 22 17 12
-.13
- k. Look for a new job or explore career opportunities?
37 37 49 50 48
-.07
- l. Go to a chat room, news group, discussion forum, etc. to discuss political/policy issues, current affairs, or political campaigns?
32 20
19 20 22
-.02
*m. Go to a Web site to find info about political/policy issues, current affairs, or campaigns?
18 23 75 39 50 .14

17 NEW SOCIAL SURVEY PERSPECTIVES ROBINSON, DIMAGGIO, & HARGITTAI
IT&SOCIETY, Vol. 1, Issue 5, Summer 2003 http://www.ITandSociety.org
TABLE 11: POLITICAL INTERNET TOPICS BY EDUCATION
20. In the past 12 months, have you used the Web to find out about or discuss?
High School
Incomplete
High School Grad
Some College
College Grad
Grad School
Correlation
(n =) (32) (100) (180) (139) (138)
a. The economy 22% 32% 48% 54% 50% .15
b. Abortion issues 14 10 12 8 9 -.04
c. Morality/family issues
25 30 32 20 30 -.02
d. Foreign affairs 34 31 53 55 57 .16
e. Race relations 22 16 17 20 24 .06
f. Environmental issues
28 36 42 43 48 .09
g. Political campaigns
28 38 43 48 57 .09
h. Gun control 19 18 20 22 20 .02
i. Taxes 31 32 48 49 43 .08
j. Gender/women’s issues
41 37 34 29 34 -.04
k. News headlines 63 67 79 85 86 .16
SUMMARY AND CONCLUSIONS
Most research on the digital divide concerns variation in access to the
Internet by socioeconomic status, gender, race, age and place of residence. This article demonstrates that those who have made it online are also unequal with respect to the ways they use the medium, especially the content they access from the vast stores of information and decision-making guidance the Internet provides. More detailed research on hardware and software, autonomy, and user skill may reveal more such differences. As DiMaggio and Hargittai (2001) hypothesized, college-educated respondents possess clear advantages over high-school educated respondents in using the Internet to derive occupational, educational and other informational benefits.
As shown in Tables 9-11, the clearest advantage appears in terms of sites visited, uses made, and political discussion. Here, multivariate evidence shows that education—and occasionally income, age and marital status—is associated with consistently more uses related to work, education, and political and social

18 NEW SOCIAL SURVEY PERSPECTIVES ROBINSON, DIMAGGIO, & HARGITTAI
IT&SOCIETY, Vol. 1, Issue 5, Summer 2003 http://www.ITandSociety.org
engagement, as well as with fewer entertainment or avocational uses. The advantages to the college educated are also evident in their use of the Internet to maintain broader and more dispersed social networks of friends, co-workers, and participants in social or community groups, both in general and, especially, using email. (These differences disappear when one compares email contacts with family members.)
Users with more education are even advantaged in matters of the heart, as they are more likely to report starting up new romantic relations with persons met online. Their greater skill levels are evident in their greater tendency to report solving software problems using online help and consulting manuals. Social-network advantages are evident in the fact that they are more likely to report that coworkers, other work contacts and friends help them solve software problems.
In contrast, the education gap is not evident in several areas, such as the search strategies that people use to find information online and the ability to get help from family members. Nor do the less educated report sending or receiving fewer email messages.
One final measure of potential inequality concerns two aspects of time, as shown in Table 12—weekly hours of use and years on the Internet. Weekly hours of use of email is highly correlated with years of education, with those with graduate education using email more than twice as much (5.6 hours) as those with only a high school education (2.6 hours). In contrast, weekly hours of Web use are not consistently higher among those with a college degree. However, college graduates again have a marked edge in years of experience (5.6 vs. 4.3) over the high-school educated. Finally, they have a slight edge in self-assessed ability to use the Internet. In each of these respects, then, the college -educated continue to be better able to exploit the new technology of the Internet. Future research will assess the extent to which these temporal factors account for the edge that more educated Internet users possess with respect to the dimensions of use described in this analysis.

19 NEW SOCIAL SURVEY PERSPECTIVES ROBINSON, DIMAGGIO, & HARGITTAI
IT&SOCIETY, Vol. 1, Issue 5, Summer 2003 http://www.ITandSociety.org
TABLE 12: DIFFERENCES IN INTERNET TIME FACTORS BY EDUCATION High
School Inc
High School Grad
Some College
College Grad
Grad School
Correlation
Email Hrs 2.0 2.7 3.7 4.6 5.6 .16
WWW Hrs 6.3 5.2 5.7 5.4 6.1 .02
Years online 4.1 4.3 5.0 5.6 5.6 .30
Ability to Use 3.7 3.6 3.9 4.1 3.9 .14
REFERENCES Cole, J. and Robinson, J. 2002. “Internet Use and Sociability in the UCLA Data:
A Simplified MCA Analysis”, IT and Society. Summer, 1(1), pp. 202-218. Cook, T. D. et al. 1975. "Sesame Street" Revisited. New York, Russell Sage
Foundation. DiMaggio, P. and E. Hargittai. 2001. "From the 'Digital Divide' to 'Digital
Inequality': Studying Internet Use as Penetration Increases." Princeton: Center for Arts and Cultural Policy Studies, Woodrow Wilson School, Princeton University.
Gaziano, C. 1983. The Knowledge Gap: An Analytical Review of Media Effect. Communication Research, 10, pp. 447-486.
Hyman, H. H., & Sheatsley, P. B. 1950. The Current Status of American Public Opinion. In J.C. Payne (Ed.), The Teaching of Contemporary Affairs, pp. 11–34. New York: National Education Association.
Kestnbaum, M., J. P. Robinson, A. Neustadtl, and A. Alvarez. 2002. "Information Technology and Social Time Displacement" IT&Society 1(1), pp. 21 - 37.
Norris, P. 2001. Digital Divide: Civic Engagement, Information Poverty, and the Internet Worldwide. New York: Cambridge University Press.
Robinson, J .1967.“World Affairs Information and Mass Media Exposure” Journalism Quarterly, 44(1), pp. 65 – 82.
Robinson, J.P. & Levy, M.R. 1986. The Main Source: Learning from Television News. Beverly Hills: Sage.
Tichenor, P., Olien, C., and Donohue, G. 1970. Mass Media Flow and Differential Growth in Knowledge. Public Opinion Quarterly, 34: pp. 159-170.
U.S. Department of Commerce. 1995. Falling Through the NET: A Survey of the ‘Have Nots’ in Rural and Urban America. Washington, DC: Economics and Statistics Administration, and the National Telecommunications and Information Administration.

20 NEW SOCIAL SURVEY PERSPECTIVES ROBINSON, DIMAGGIO, & HARGITTAI
IT&SOCIETY, Vol. 1, Issue 5, Summer 2003 http://www.ITandSociety.org
_______. 1997. Falling Through the Net II: New Data on the Digital Divide. Washington, DC: Economics and Statistics Administration, and the National Telecommunications and Information Administration.
_______. 1999. Falling Through the Net III: Defining the Digital Divide. Washington, DC: Economics and Statistics Administration, and the National Telecommunications and Information Administration.
_______. 2000. Falling Through the Net: Towards Digital Inclusion. Washington, DC: Economics and Statistics Administration, and the National Telecommunications and Information Administration.
_______. 2002. A Nation Online: How Americans are Expanding Their Use of the Internet. Washington, DC: Economics and Statistics Administration, and the National Telecommunications and Information Administration.
Wilhelm, Anthony. 2001. From Access To Outcomes. Benton Foundation.

21 NEW SOCIAL SURVEY PERSPECTIVES ROBINSON, DIMAGGIO, & HARGITTAI
IT&SOCIETY, Vol. 1, Issue 5, Summer 2003 http://www.ITandSociety.org
APPENDIX: 1) MCA/ANOVA DATA FOR TABLE 1

22 NEW SOCIAL SURVEY PERSPECTIVES ROBINSON, DIMAGGIO, & HARGITTAI
IT&SOCIETY, Vol. 1, Issue 5, Summer 2003 http://www.ITandSociety.org
2) MCA/ANOVA DATA FOR TABLE 2


