J/ K * wrong flavor decays Discussions of some common analysis techniques in BaBar by Max Baak.
30
J/ J/ K K * wrong flavor decays wrong flavor decays Discussions of some common analysis techniques in BaBar by Max Baak
Transcript of J/ K * wrong flavor decays Discussions of some common analysis techniques in BaBar by Max Baak.
J/J/ K K** wrong flavor decays wrong flavor decays
Discussions of some common analysis techniques
in BaBar
by
Max Baak
OutlineOutline
• Why Why look at J/look at J/ K K** wrong flavor decays? wrong flavor decays?
- Theoretical introductionTheoretical introduction
• BaBar in a nutshellBaBar in a nutshell
• Analysis StrategyAnalysis Strategy
• BaBar data sampleBaBar data sample
• Fit & SystematicsFit & Systematics
• ConclusionConclusion

CP Violation via the CKM matrixCP Violation via the CKM matrix
• The CKM matrix is a complex unitary matrix, coupling between quark generations and W bosons.
• With 3 quark generations, it allows for 4 independent, physical parameters:– 3 real numbers & 1 complex non-trivial phase
• The existence of the complex coupling (phase) gives rise to CP violation.
• All CP violating observables are possible due to interference between different decay amplitudes involving a weak phase.

The CKM Matrix: Wolfenstein The CKM Matrix: Wolfenstein parameterizationparameterization
Complex phase
λ =Vus = sin(cabbibo) = 0.2205 ±0.0018A =Vcb/ λ2 = 0.83±0.06
* * * 0ud ub cd cb td tbV V V V V V
Out of 6 unitarity triangles, this one practically interesting:
•It has all sides O(3)•Large phases potentially large CP asymmetries
=
Wolfenstein parameterization uses the observed hierarchy of the CKM elements and pushes the complex phase to the smallest elements
Unitarity

CP violation in the inference between mixing and CP violation in the inference between mixing and decaydecay
CP
CP
CP
2f
f 2f
1 | λ |
1 | λ |C
CP
CP
CP
ff 2
f
2Im λ
1 | λ |S
CP CP4 ff cos(( , ) e [1 ]in) s ( )tC dP df B f t tt Sm mC
0
0
:
:phys CP
phys CP
f B f
f B f
CP
CP
CP
ff
f
Aqλ
p A Amplitude ratio
Mixing Phase
0 0Prob( ( ) ) Prob( ( ) )
1CP
phys CP phys CP
f
B t f B t f
In order to have CP Violation:
Time evolution of initial B0 (or B0) mesons into a final CP eigenstate
•A single decay amplitude is sufficient-Mixed decay serves as 2nd amplitude-Thus, amplitudes comparable by construction-Large CP asymmetries are possible!
0 0
0 0Mass states L
H
B pB qB
B pB qB

Golden Decay Mode: Golden Decay Mode: BB00 J/y K J/y K00SS
• Theoretically clean way (1%) to measure the phase of (i.e. sin2)
• Clean experimental signature• Branching fraction: O(10-4) - “large” compared to other CP
modes
0L,S
2
J/ Kλ i
CPe
0K
b
c
s
c
d
/J
d
Time-dependent CP asymmetry
sin 2( ) sin( ) CP CPA t m t
u,c,t
0B
u,c,t
W W0
Bd
b 0 0
0 0
/
/CP S
LCP
B J K
B J K
K0 mixing
CP = +1
B0 J/ K0L
CP = -1 B0 J/ K0
S
B0 (2s) K0S
B0 c1 K0
S
“Golden Modes”
Can Can sin2sin2LL and and sin2sin2SS be different? be different?**
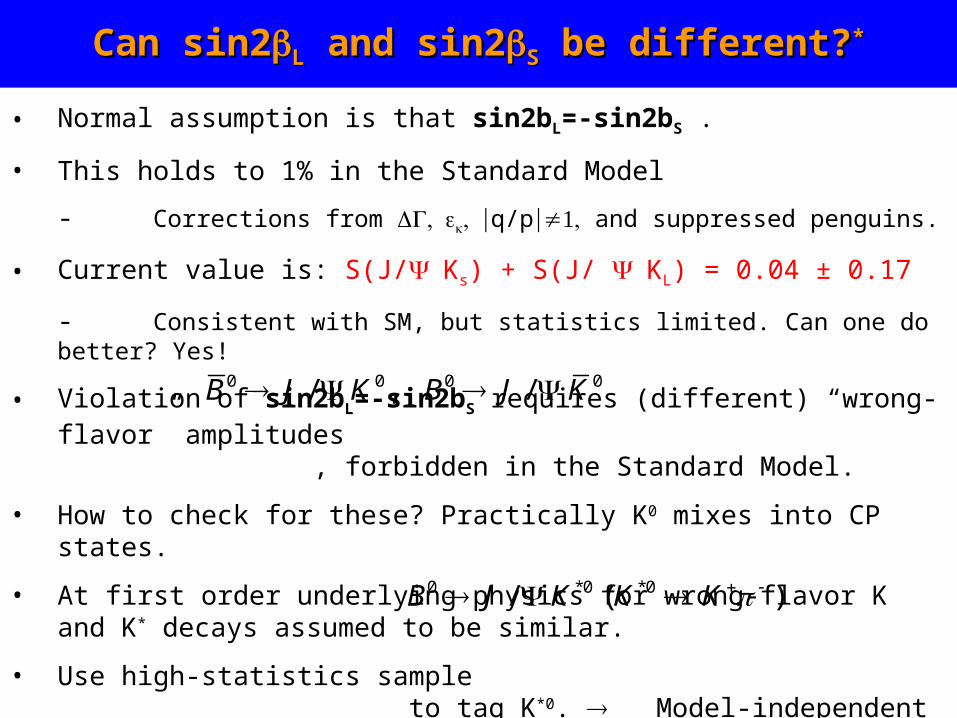
• Normal assumption is that sin2bL=-sin2bS .
• This holds to 1% in the Standard Model
- Corrections from q/p and suppressed penguins.
• Current value is: S(J/Ks) + S(J/ KL) = 0.04 ± 0.17
- Consistent with SM, but statistics limited. Can one do better? Yes!
• Violation of sin2bL=-sin2bS requires (different) “wrong-flavor” amplitudes , forbidden in the Standard Model.
• How to check for these? Practically K0 mixes into CP states.
• At first order underlying physics for wrong-flavor K and K* decays assumed to be similar.
• Use high-statistics sample to tag K*0. Model-independent search for new physics.
* hep-ph/0204212 (Y. Grossman, A. Kagan, Z. Ligeti)
0 0 0 0/ , /B J K B J K
0 *0 *0/ ( )B J K K K

J/J/ Mixing pdf’s Mixing pdf’s• Assume wrong-flavor decays are allowed. How do the pdf’s
change?
• Define the ratios: ,
• For final state J/ K*0 this results in the mixing equations
-
-
Where again: , .
• For final state simply replace by . One gets and .
• Equations add up to pure exponential need to determine initial flavor (t=0 ps) of B meson to differentiate between mixed & unmixed states.
• Time-dependent analysis gives coefficients at few % level.
0 *
0 *
/
/
B J K
B J K
Aqλ
p A
0 *
0 *
/
/
B J K
B J K
Aqλ
p A
*04( / , ) e [1 cos sin(( ) ++ ) ]t
unmixed ddf J Smt m tK C t *0
4( / , ) e [1 cos si- ]n(( )) -tm di dxedf J K tmt SC t m
2
2
1 | λ |
1 | λ |C
2
2Im λ
1 | λ |S
0/J K λ C S
, , ,C S C S
B meson production at BaBarB meson production at BaBar
OffOn
)MeV(ME )S4(CM
PEP-II
BABAR
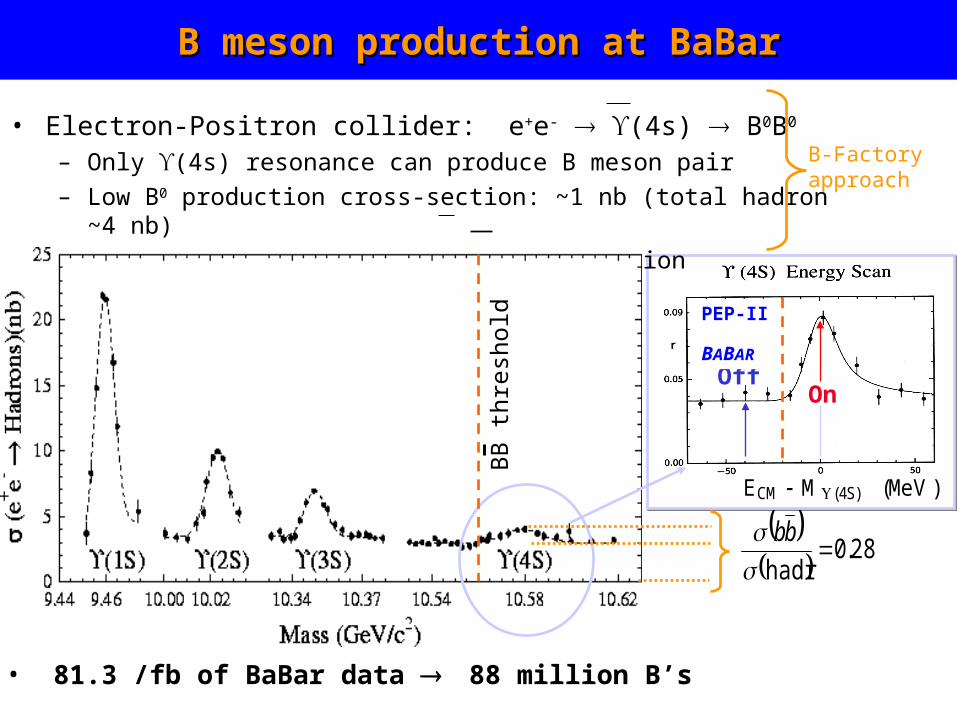
• Electron-Positron collider: e+e- (4s) B0B0
– Only (4s) resonance can produce B meson pair – Low B0 production cross-section: ~1 nb (total hadron ~4 nb)– Clean environment, coherent B0B0 production
B-Factoryapproach
B0B0 threshold
BB
thre
shold
28.0hadr
bb
• 81.3 /fb of BaBar data 88 million B’s
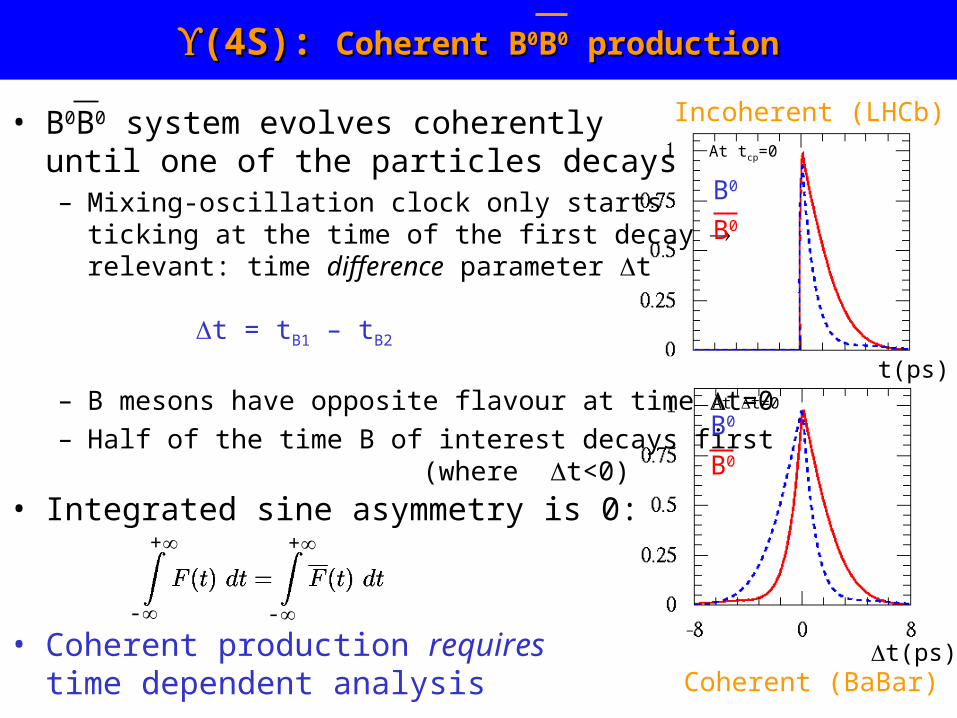
(4S): (4S): Coherent BCoherent B00BB00 production production
• B0B0 system evolves coherentlyuntil one of the particles decays– Mixing-oscillation clock only starts
ticking at the time of the first decay relevant: time difference parameter t
– B mesons have opposite flavour at time t=0– Half of the time B of interest decays first
(where t<0)• Integrated sine asymmetry is 0:
• Coherent production requires time dependent analysis
At tcp=0
B0
B0
At t=0
B0
B0
t = tB1 – tB2
Coherent (BaBar)
Incoherent (LHCb)
-
+ +
-
t(ps)
t(ps)

A(-)symmetric collider for A(-)symmetric collider for (4S) will (not) will (not) work …work …
• Asymmetry is a time-dependent process t between two B decays of O(ps)– In reality one measures decay distance between two B decays
• In symmetric energy e+e- collider, where (4S) produced at rest, daughter B’s travel ~ 20m too small a distance to discern.
• Solution: boost the CMS to increase distances in lab frame. Build an asymmetric collider!
• For BaBar:- High energy e- beam: 9.0 GeV - Low energy e+ beam: 3.1 GeV

+e-e
Coherent BB pair
Δ zΔ tβγ c
B
1B
z
Start the Clock
| | 260Bz c m
This can be measured using a silicon vertex detector!
4s
()(4S) = 0.56
2B
Z
In pictures:In pictures:
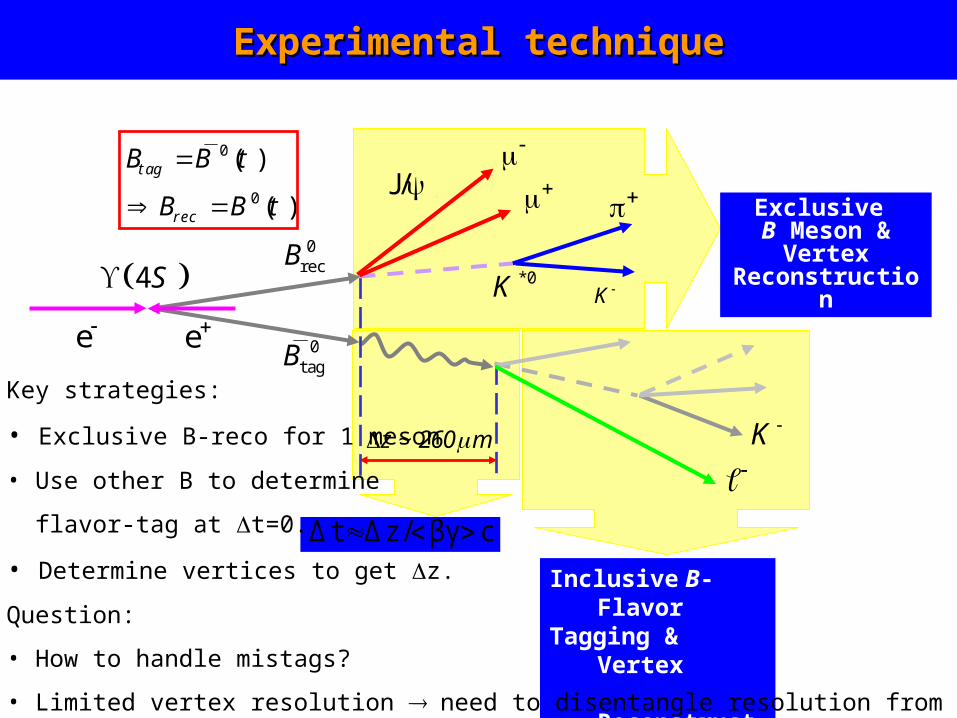
Experimental techniqueExperimental technique
z ~ 260 m
0tagB
ee
4S
K
0recB
Inclusive B-Flavor
Tagging & Vertex
Reconstruction
cβγz/ΔtΔ
Exclusive B Meson &
Vertex Reconstructio
n
K *0K
/J
0
0
( )
( )
tag
rec
B B t
B B t
Key strategies:
• Exclusive B-reco for 1 meson
• Use other B to determine
flavor-tag at t=0.
• Determine vertices to get z.
Question:
• How to handle mistags?
• Limited vertex resolution need to disentangle resolution from physics.
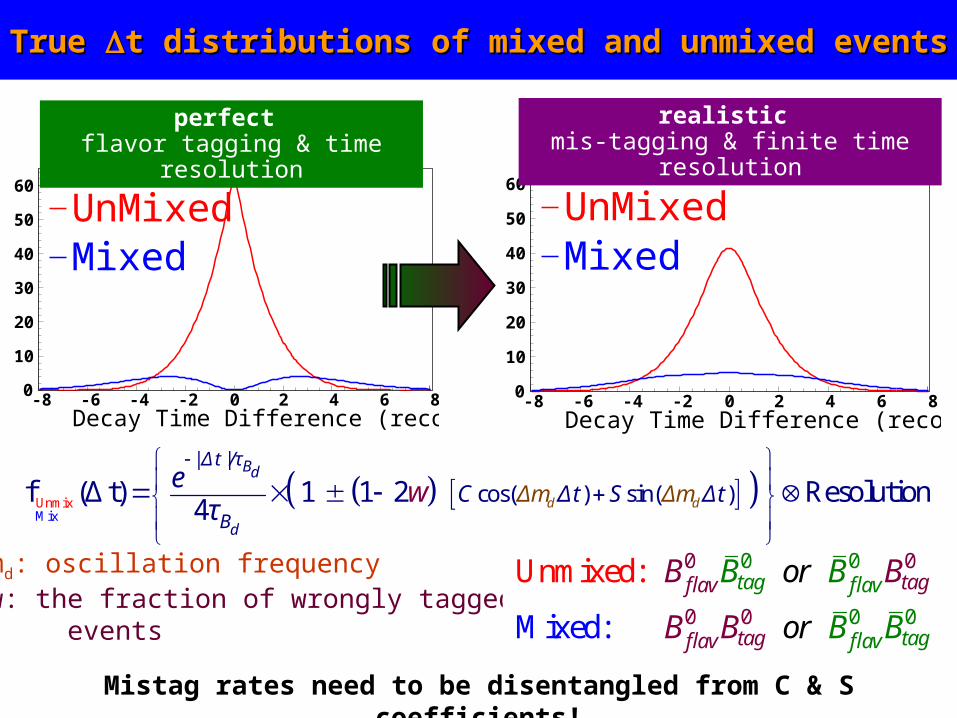
True True t distributions of mixed and unmixed eventst distributions of mixed and unmixed events
x
UnmixMi
1 cos( ) sin( )4
f (Δ t)Bd
d
| Δ t |
d
/τ
dB
eC ΔtΔm S Δtm
τΔ
Decay Time Difference (reco-tag) (ps)
UnMixedMixed
0
10
20
30
40
50
60
-8 -6 -4 -2 0 2 4 6 8
perfect flavor tagging & time
resolution
Decay Time Difference (reco-tag) (ps)
UnMixedMixed
0
10
20
30
40
50
60
-8 -6 -4 -2 0 2 4 6 8
realistic mis-tagging & finite time
resolution
UnmixMix
cos( ) sin( )f (Δ t) 1 1 2 Resolution4 d d
Bd
d
| Δ t |/τ
BΔC Δt S Δtm Δm
eτ
w
w: the fraction of wrongly tagged events
md: oscillation frequency 0 0
0 0
0 0
0 0Mixed:
Unmixed: tagflav
tagflav
tag flav
tagflav
or
or
B B
B B
B B
B B
Mistag rates need to be disentangled from C & S coefficients!
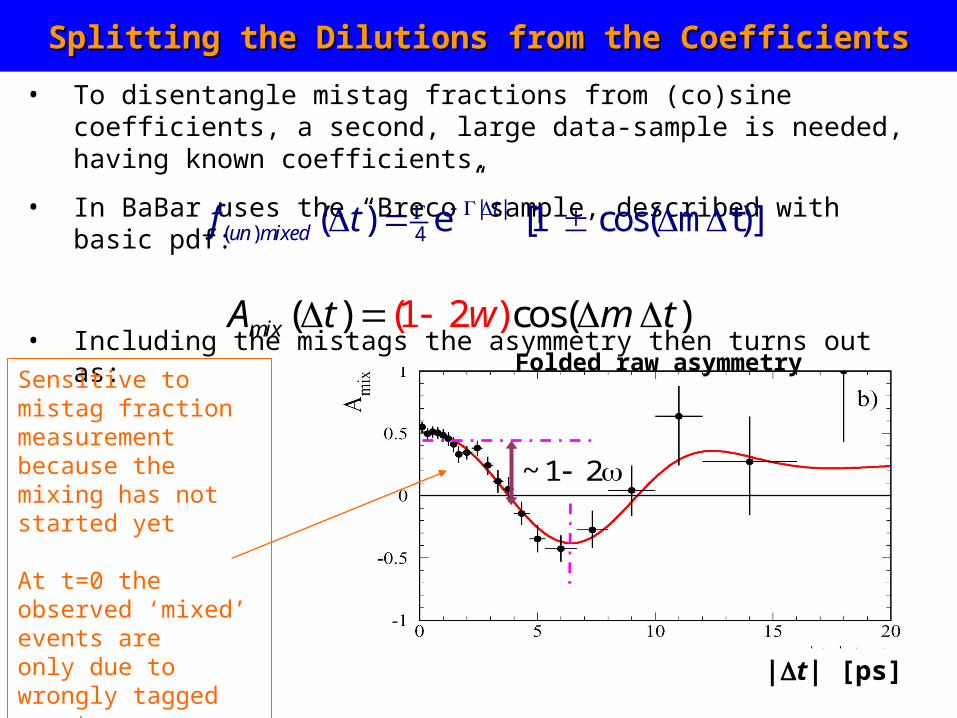
Splitting the Dilutions from the CoefficientsSplitting the Dilutions from the Coefficients
• To disentangle mistag fractions from (co)sine coefficients, a second, large data-sample is needed, having known coefficients.
• In BaBar uses the “Breco” sample, described with basic pdf:
• Including the mistags the asymmetry then turns out as:
| |( ) 4( ) e [1 cos( m t)]tun mixedf t
(1 2 )( ) cos( )mixA t mw t
Sensitive to mistag fraction measurement because the mixing has not started yet
At t=0 the observed ‘mixed’ events are only due to wrongly tagged events
21~
Folded raw asymmetry
|t| [ps]
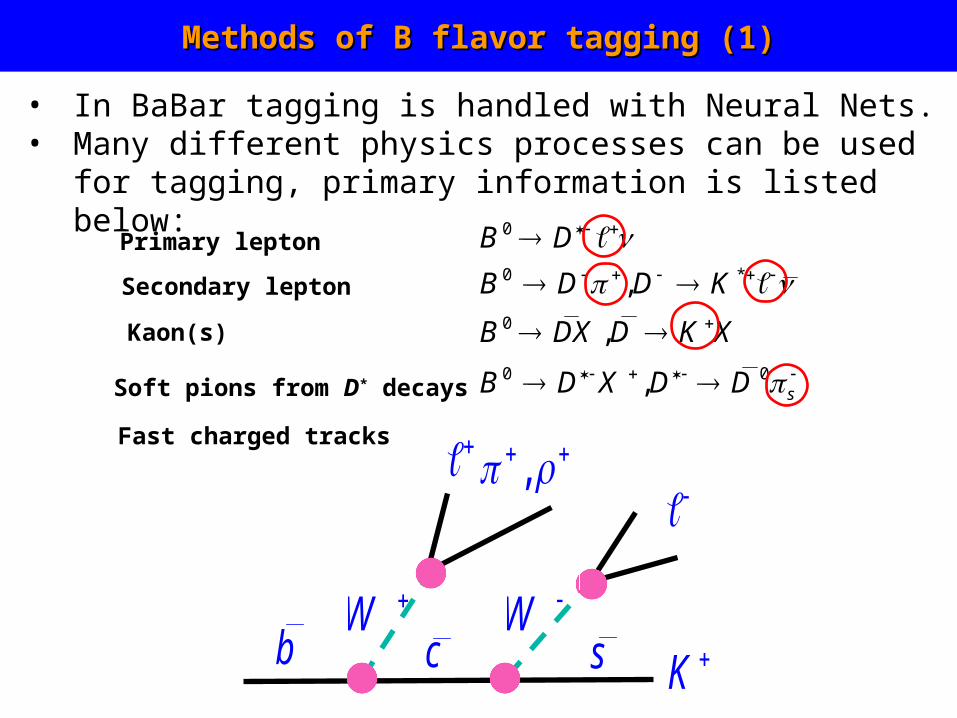
Methods of B flavor tagging (1)Methods of B flavor tagging (1)
• In BaBar tagging is handled with Neural Nets.• Many different physics processes can be used for
tagging, primary information is listed below:
0B D
0 ,B DX D K X
0 0, sB D X D D
0 *,B D D K
Secondary lepton
K
Kaon(s)
Soft pions from D* decays
, Fast charged tracks
Primary lepton
b c sW W

B flavor tagging performance (2)B flavor tagging performance (2)
• 9 sub-taggers, using combinations of the various inputs, are combined in the Tagging Neural Network.
• The NN ‘spits out’ 4 physics categories in which the data is cate-gorized, all with different tagging efficiencies and mistag-fractions.
Tagging category
Fraction of tagged
events(%)
Wrong tag fraction w (%)
Mistag fraction difference w
(%)
Q =
(1-2w)2 (%)
Lepton 9.1 0.2 3.3 0.6 -0.9 0.5 7.9 0.3
Kaon+Kpi 16.7 0.2 9.9 0.7 -0.2 0.5 10.7 0.4
Kaon+Spi 19.8 0.3 20.9 0.8 -2.7 0.6 6.7 0.4
Inclusive 20.0 0.3 31.6 0.9 -3.2 0.6 0.9 0.2
ALL 65.6 0.5 28.1 0.7
BBAABBARAR81.3 fb81.3 fb
BBAABBARAR81.3 fb81.3 fb
Errors on C and S depend on the “quality factor” Q
as: 1sin 2
Q
Why? Number of events is prop. to . Multiplication of C&S
with gives another factor to Q.

Vertex and Vertex and z reconstructionz reconstruction
Brec vertex
Brec daughters
z
1.Reconstruct Brec vertex from Brec daughters
Beam spot
Interaction Point
Brec direction
Btag direction
2.Reconstruct Btag direction from Brec vertex & momentum, beam spot, and (4S) momentum = pseudotrack
Btag Vertex
tag tracks, V0s
3.Reconstruct Btag vertex from pseudotrack plus consistent set of tag tracks
4.Convert from Δz to Δt, accounting for (small) B momentum in (4S) frame
Note: event multiplicity 10-12
Result: σ(Δz)rms ~ 180μm (Δt=0.6ps) versus <|Δz|> ~ βγcτ = 260μm
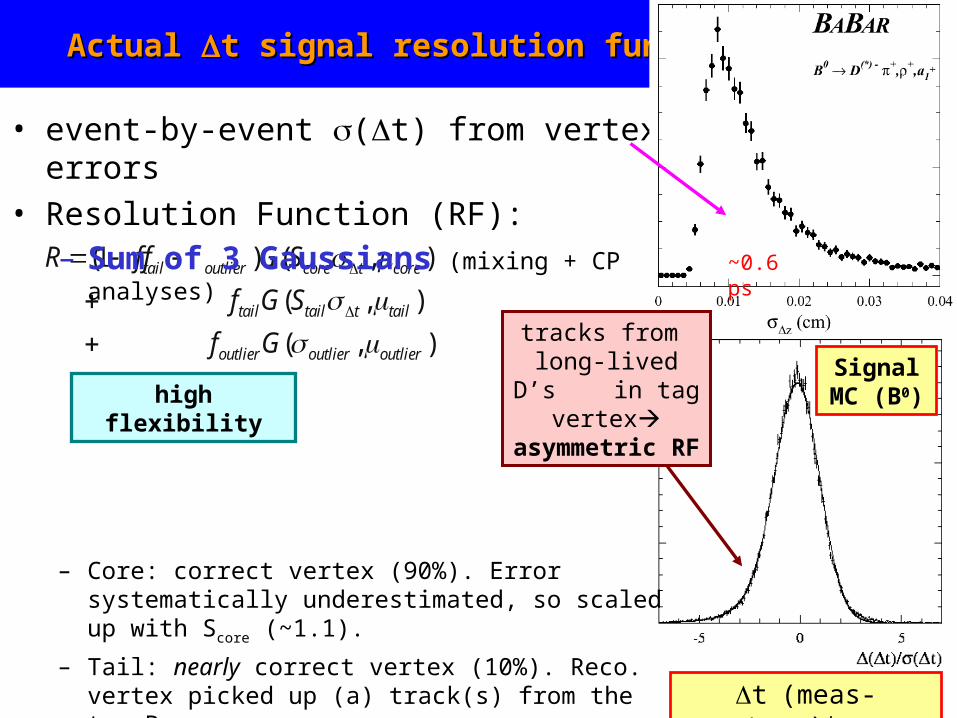
Actual Actual t signal resolution functiont signal resolution function
(1 ) ( , )
( , )
( , )
tail outlier core t core
tail tail t tail
outlier outlier outlier
R f f G S
f G S
f G
high flexibility
z
Signal MC (B0)
t(meas-true)t
• event-by-event (t) from vertex errors
• Resolution Function (RF):– Sum of 3 Gaussians (mixing + CP
analyses)
– Core: correct vertex (90%). Error systematically underestimated, so scaled up with Score (~1.1).
– Tail: nearly correct vertex (10%). Reco. vertex picked up (a) track(s) from the tag B.
– Outliers (< 0.1%): wrong vertex. Outlier component serves as a “vacuum cleaner”.
~0.6 ps
tracks from long-lived D’s in tag vertex asymmetric
RF
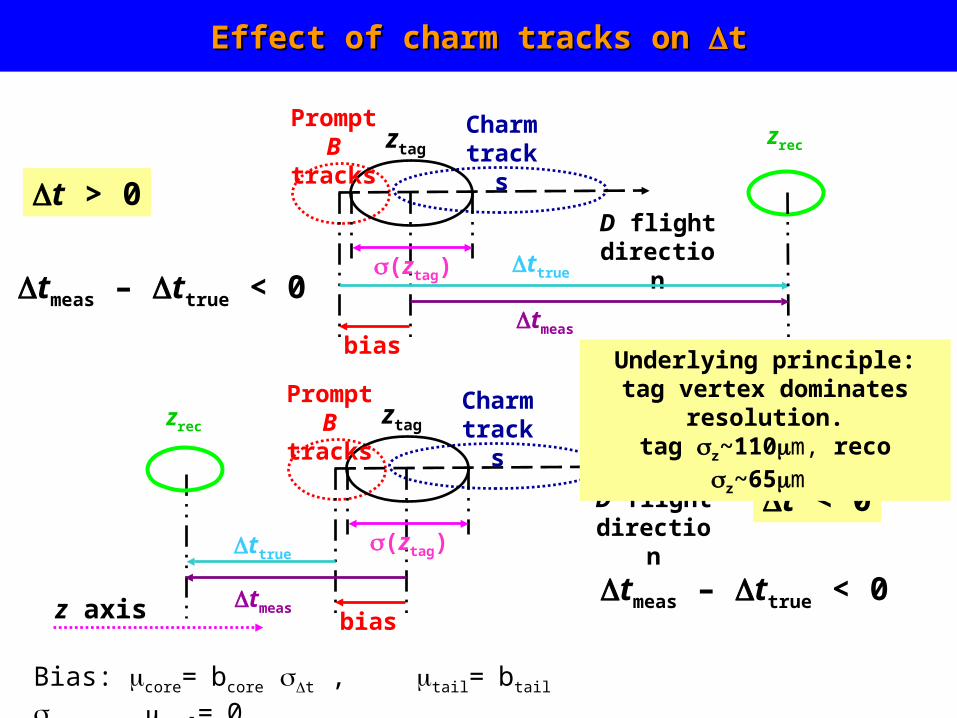
Effect of charm tracks on Effect of charm tracks on tt
D flight direction
bias
(ztag)
Charm
tracks
ztag
Prompt B
tracks
ttrue
tmeas
zrec
tmeas – ttrue < 0
t > 0
z axis
D flight direction
bias
(ztag)
Charm
tracks
ztag
Prompt B
tracks
ttrue
tmeas
zrec
tmeas – ttrue < 0
t < 0
Underlying principle: tag vertex dominates
resolution.tag z~110m, reco
z~65m
Bias: core=bcore t , tail=btail t , outl=0

Correlation: Correlation: ttresidual residual t biast bias
Monte Carlo
z axis
ztag
Prompt B
tracks
Charm
tracks
D flight direction
(t) smallest, t
bias zero
(ztag) D flight direction
bias
(ztag)
Charm
tracks
ztag
Prompt B
tracks
(t) largest, t bias largest

B reconstructionB reconstruction
For exclusive B reconstruction, two nearly uncorrelated kinematic variables are employed to cut on background.
Both use the property that Ebeam is well known:
* *B beamE E E
2 2* *BbeamESm E p
2 2 2 2
2
2 2 2 2
ES
beamE E E
m pbeam beamB
pm
* * *( , ),B B beamE Ep
Signal at E ~ 0
Signal at mES ~ mB
Resolutions
10 40 MeVE
23 MeV/ cESm
Typically, E dominated E (at least 5 times larger than beam)

ExampleExample
mES
E
sidebands
signal region
, 3 ,0 3ESB mES Em E m
Defined outside signal region in
Si
or
Si
de
gnal
r to
Region:
estimat
deb
e b
and Re
ackgro
gion:
unds
mES [GeV/c2]
E [
MeV
]
Typically, E is fit for all events with mES > 5.27 GeV.
The entire mass spectrum is then refit within the energy window to obtain bkg. probablities, to be used as inputs in the likelyhood fit.

Ntag = 30977Purity = 81.6%Sigma = 2.76 MeV
Breco Sample – AllBreco Sample – All
BBAABBARAR81.3 fb81.3 fb
BBAABBARAR81.3 fb81.3 fb
mES [GeV/c2]
* 0 0 0
0
, , , ,,
S
S
D D D K K K KD K K
Charm decay modes
0 (*)1( , , )B D h h a
B open Charm decay modes0( ) 4.1%BF B
The Breco sample contains 24 reconstructed B0 open charm modes.
Prob(sig) ~ 81.6 %
Prob(sig) ~ 0 %
Gaussian
ARGUS function

Breco Sample – Per tagging category (example) Breco Sample – Per tagging category (example)
1097 34(96.0 0.7)%
signalNPurity
798 31(88.9 1.2)%
signalNPurity
3156 63(84.6 0.7)%
signalNPurity
1293 43(79.4 1.3)%
signalNPurity
Lepton KaonLepton
NT2NT1
BBAABBARAR29.7 fb29.7 fb
BBAABBARAR29.7 fb29.7 fb
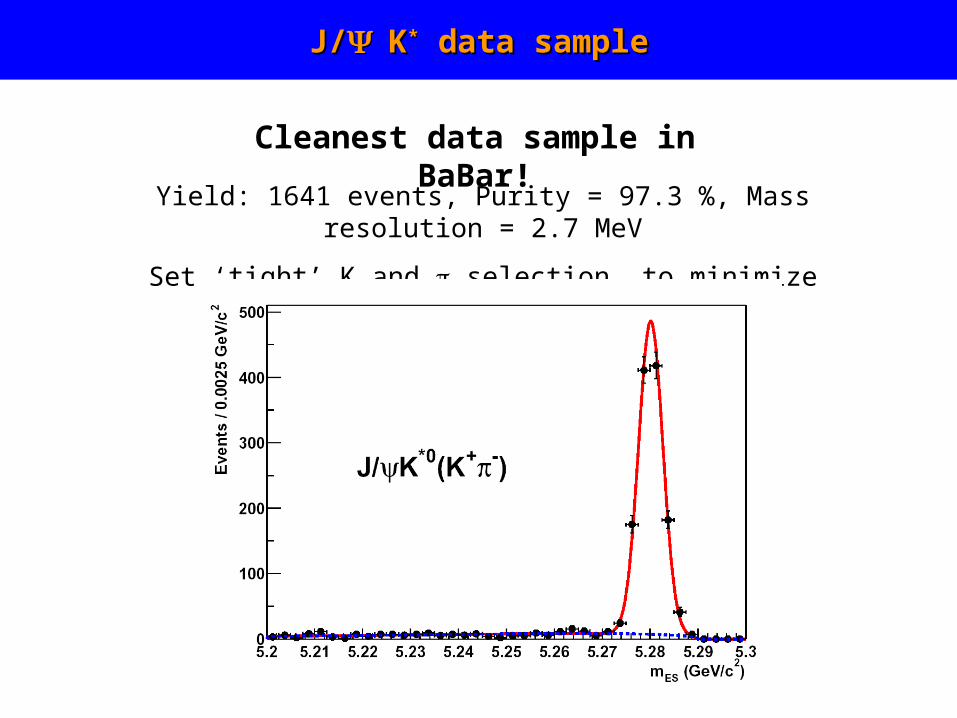
J/J/KK** data sample data sample
Cleanest data sample in BaBar!
Yield: 1641 events, Purity = 97.3 %, Mass resolution = 2.7 MeV
Set ‘tight’ K and selection, to minimize accidental swapping.
Fitting TechniqueFitting Technique
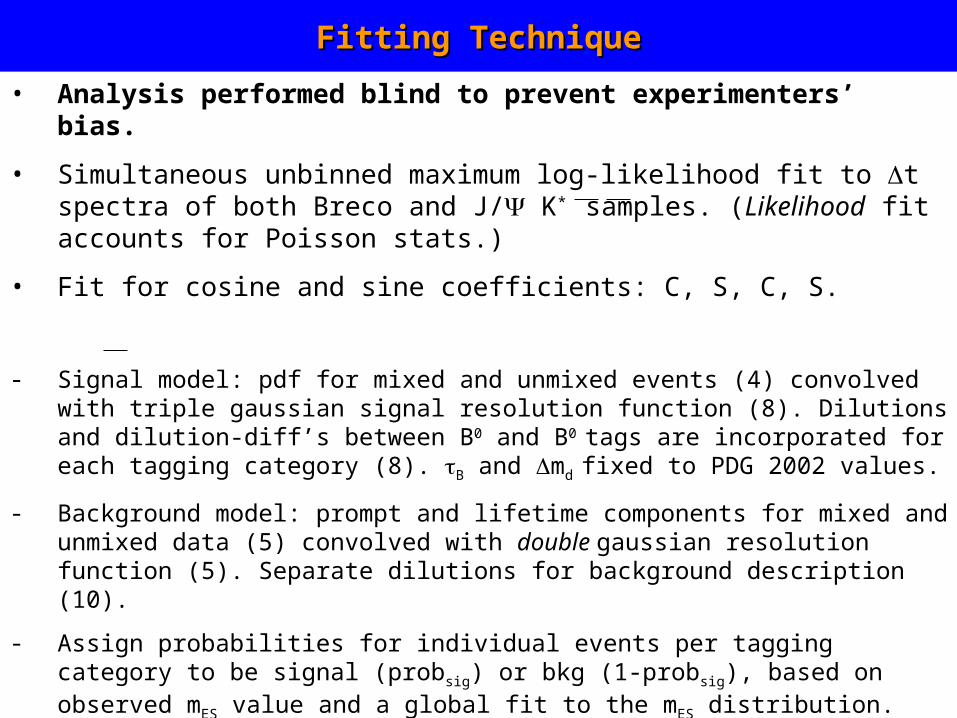
• Analysis performed blind to prevent experimenters’ bias.
• Simultaneous unbinned maximum log-likelihood fit to t spectra of both Breco and J/ K* samples. (Likelihood fit accounts for Poisson stats.)
• Fit for cosine and sine coefficients: C, S, C, S.
- Signal model: pdf for mixed and unmixed events (4) convolved with triple gaussian signal resolution function (8). Dilutions and dilution-diff’s between B0 and B0 tags are incorporated for each tagging category (8). B and md fixed to PDG 2002 values.
- Background model: prompt and lifetime components for mixed and unmixed data (5) convolved with double gaussian resolution function (5). Separate dilutions for background description (10).
- Assign probabilities for individual events per tagging category to be signal (probsig) or bkg (1-probsig), based on observed mES value and a global fit to the mES distribution.
- Likelihood function: Sum all signal and bkg pdf’s for a combined fit with a total of 40 free parameters.
Background descriptionBackground description
MC cocktail
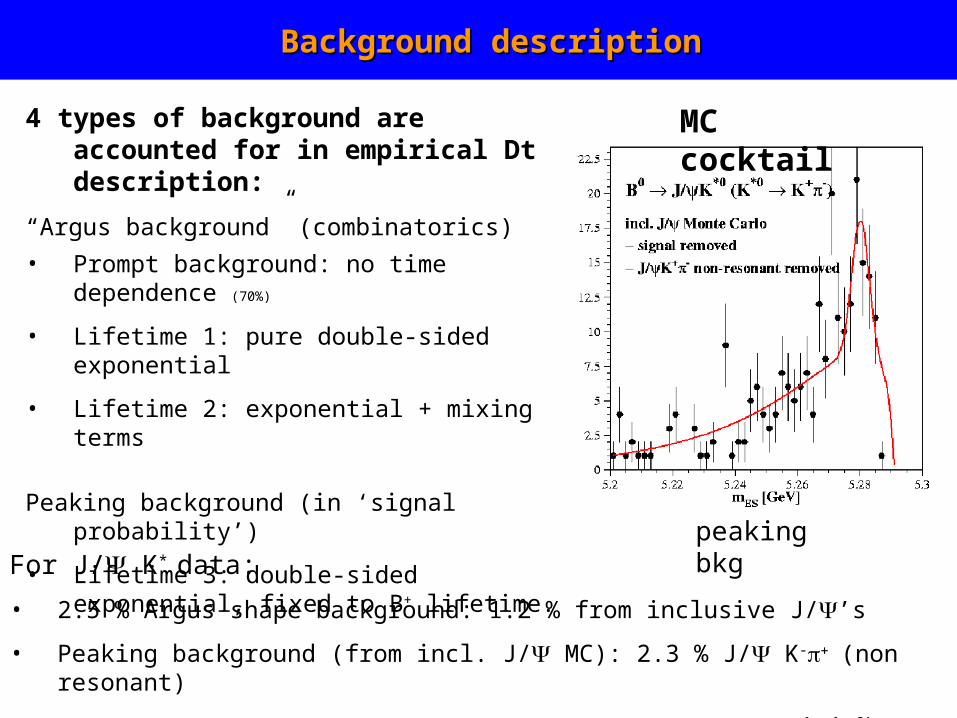
4 types of background are accounted for in empirical Dt description:
“Argus background” (combinatorics)
• Prompt background: no time dependence (70%)
• Lifetime 1: pure double-sided exponential
• Lifetime 2: exponential + mixing terms
Peaking background (in ‘signal probability’)
• Lifetime 3: double-sided exponential, fixed to B+ lifetime. peaking
bkgFor J/ K* data:
• 2.5 % Argus shape background: 1.2 % from inclusive J/’s
• Peaking background (from incl. J/ MC): 2.3 % J/ K-(non resonant)
1.1 % J/S

Systematic errors on C(C) and S(S) (preliminary!)Systematic errors on C(C) and S(S) (preliminary!)
[C] [S]
Description of background events 0.014 0.011
(Co)sine content of background components
Bkg. shape uncertainties, peak. component
t resolution and detector effects 0.019 0.022
Silicon detector residual misalignment
t resolution model (Brecovs BJ/Y K*, tag vs mistag)
Mistag diff’s Breco and BJ/Y K* samples 0.011 0.002
CKM-suppressed decays on tag-side 0.006 0.018
Kswapping 0.012 0.002
Fixed lifetime and oscillation frequency 0.008 0.013
Total 0.031 0.033

ConclusionsConclusions
• No conclusions yet: analysis is still blinded.
• (C) = (C) = 0.0550.031 (S) = (S) = 0.0940.033
• Max C correlation: 29 % max S correlation: 9 %
• Expected error: (S(J/Ks) + S(J/ KL)) = 0.14 (old: 0.17)