j FLIGHT EVALUATION COMPLIANCE TEST TECHNIQUES FOR … · FLIGHT EVALUATION COMPLIANCE TEST...
47
LEVEP 2 USAASTA PROJECT NO. 68-55 j FLIGHT EVALUATION COMPLIANCE TEST TECHNIQUES FOR ARMY HOT DAY HOVER CRITERIA FINAL REPORT KENNETH R. FERRELL PROJECT OFFICER JAMES S. KISHI PROJECT PILOT ALAN C. FREDERICKSON PROJECT ENGINEER DTIC •I•G•ELECTED C) APRIL 1974 C•- JAN8 1982 Approved for public release; distribution unlimited. UNITED STATES ARMY AVIATION SYSTEMS TEST ACTIVITY EDWARDS AIR FORCE BASE, CALIFORNIA 93523 L 8 11 30O1
Transcript of j FLIGHT EVALUATION COMPLIANCE TEST TECHNIQUES FOR … · FLIGHT EVALUATION COMPLIANCE TEST...

LEVEP 2'-USAASTA PROJECT NO. 68-55
j
FLIGHT EVALUATION
COMPLIANCE TEST TECHNIQUESFOR ARMY HOT DAY HOVER CRITERIA
FINAL REPORT
KENNETH R. FERRELLPROJECT OFFICER JAMES S. KISHI
PROJECT PILOTALAN C. FREDERICKSON
PROJECT ENGINEER
DTIC•I•G•ELECTEDC) APRIL 1974C•- JAN8 1982
Approved for public release; distribution unlimited.
UNITED STATES ARMY AVIATION SYSTEMS TEST ACTIVITYEDWARDS AIR FORCE BASE, CALIFORNIA 93523
L 8 11 30O1
D)ISCLAIMER NOTICE
The findings of this report are not to be construed as an official Department ofthe Army position unless so designated by other authorized documents. -
DISPOSITION INSTIRUCTIONS
Destroy this report when it is no longer needed. D)o not return it to the originator.
TRADE NAMES
The use of trade names in this report does not constitute an official endorsementor approval of the use of the commercial hardware and software.

UNCLASSIFIEDSECURITY CLASSIFICATION OF THIS PAGE (When Date Bntorod)
REPORT DOCUMENTATION PAGE READ INSTRUCTIONSBEFORE COMPLETING FORM
REPORT NUMBER 2. GOVT ACCESSION NO. 3. RECIPIENT'S CATALOG NUMBER
USAASTA PRGJeT-CNO. -68-55 14 - Ate c I ('/•114. TITLE (end Subtitle) S. TYPE OF REPORT & PERIOD COVERED
FLIGHT EVALUATION FINAL REPORTCOMPLIANCE TEST TECHNIQUES FOR ARMY November 1970-September 1971HOT DAY HOVER CRITERIA S6. PERFORMING ONG. REPORT NUMBER
USAASTA PROJECT NO. 68-557. AUTHOR(e) S. CONTRACT OR GRANT NUMBER(*e)
KENNETH R. FERRELLALAN C. FREDERICKSONJAMES S. KISHI
9. PERFORMING ORGANIZATION NAME AND ADDRESS 10. PROGRAM ELEMENT, PROJECT, TASKAREA & WORK UNIT NUMBERS*US ARMY AVIATION SYSTEMS TEST ACTIVITY
EDWARDS AIR FORCE BASE, CALIFORNIA 93523 IF121401A237
II. CONTROLLING OFFICE NAME AND ADDRESS 12. REPORT DATE*US ARMY AVIATION SYSTEMS TEST ACTIVITY APRIL 1974
EDWARDS AIR FORCE BASE, CALIFORNIA 93523 13. NUMBER OF PAGES
4714. MONITORING AGENCY NAME & ADDRESS(II different from Controlling Office) IS. SECURITY CLASS. (of thle report)
UNCLASSIFIEDISa. DECL ASSI F ICATION/DOWNGRADING
SCHEDULE NA
16. DISTRIBUTION STATEMENT (of this Report)
Approved for public release; distribution unlimited.
17. DISTRIBUTION STATEMENT (of the abetract entered in Block 20, it different from Report)
I0. SUPPLEMENTARY NOTES
*Redesignated US Army Aviation Engineering Flight Activity (same address)
19. KEY WORDS (Continue on reveree side it neceosery end identify by block number)
Design hover criterionArmy helicoptersAtmospheric conditionsFlight EvaluationYaw maneuverability and Vertical climb capability
20. ABSTRACT (Contlnue on reverse side it neceessry end Identify by block number)
Tests were conducted by the United States Army Aviation Systems Test Activityto determine, tert proce-ýures to be used for compliance verification of the Army's
hot day hover criteria, The effort consisted of determining the procedures forvertical climb and yaw maneuverability tests and recommending the compliancetest procedure. The flight testing was primarily conducted with an AH-IG helicopterat Edwards Air Force Base and the Naval Weapons Center at China Lake,
(continued)FORM
DD I JAN 73 1473 EDITION OF I NOV 65 IS OBSOLETE UNCLASSIFIED/ SECURITY CLASSIFICATION OF THIS PAGE ("on Data Entered)
~.!
E -
S'• . •/UNCLASSIFIED
SECURITY CLASSIFICATION OF THIS PAE(WIenl Date fntefd)
20. Abstract
1 California from November 1970 through September 1971. The te.st results showthat both vertical climb testing and yaw maneuverability testing involve limitingfactors which result in uncertainty in the data. A test procedure was developedto demonstrate the yaw maneuverability and calculate the vertical climb capability,utilizing tethered hover test techniques to reduce the data uncertainty. Thisrecommended procedure provided results which were in good agreement with theflight test results and should be adequate for determination of the hot day hover' ~performance margin.
S T C
SECURITY CLASSIFICATION OF THIS PAOI(*Ywen Daa.t BIonted)
K2

PREFACE
ITechnical and data gathering support was provided by the Naval WeaponsCenter, China Lake, California for the quantitative phases of the project. Duringthe evaluation of the pilot's, ability to perform vertical climbs, space positioningsupport was provided by the Air Force Flight Test Center, Edwards Air ForceBase, California. In addition to those by the project pilot, test flights were alsoaccomplished by Mr. Joseph Watts, Major Ronald Holasek, CW-3 John Thomson,and CW-2 Roscoe Souders. Initial data reduction and analysis were provided byMr. Dominick Lubrano, Mr. Raymond Smith, and Mr. Robert Kyker. The finaldata analysis and report were prepared by Mr. Edward Bailes, Captain
Louis Kronenberger, and Mr. Barclay Boirun. I
Aocession ForNK?! GRAhIDTIC TAB CUnannounced CJustitloaton-
,.Dis#t.ribution/a
Availability Codes
Avail and/or
Dp

4 TABLE OF CONTENTS
INTRODUCTION
Background .. .. ...... ............ .............. .... 5Test Objectives .. .. ............ ............ .......... 6Test Scope. .. .... ............ ............ .......... 7Test Methodology .. .. .......... .............. ........ 7LIVertical Climb Accuracy .. .. .............. ......... 7
Nonvertical Climbs .... .. .... ............ .......... 7iiVertical Climb Performance. .. .... .............. .... 8Directional Controllability During Free Hover .. .... ...... 8
Directional Controllability During Tethered Hover. .. .. .... 8
RESULTS AND DISCUSSION
[1General. .. .......... ............ .............. .... 9Vertical Climb Criterion. .. .......... ............ ...... 9
Vertical Flight Path Accuracy .. .. .......... .......... 9Vertical Climb Angle. .. .. ............ ............. 10Vertical Climb Performance. .. .... .............. .... 14Vertical Climb Time History .. ...... ............ .... 17Recommended Test Techniques for Vertical Climb
Criterion. .. .... ............ ............ .... 17Directional Controllability Criterion .. .. ........ ........... 20
Free Hover .. .. ...... .............. ............. 20Tethered Hover..... ............ ............. 20Recommended Test Techniques for Directional Control
Criterion. .. .. .............. ............ .... 24Safety. .. .... ............ .............. ........... 26Atmospheric Considerations .. .. .......... ............... 26
CONCLUS IONS
General. .. .......... ............ ................ 27Specific Conclusions. .. ...... ............ ............. 27
RECOMMENDATIONS. .. ...... ............ ............... 29
3

Page
APPENDIIXES
A. References. .. .. ............ .............. .......... 30B. Energy Corrections and Analysis of Vertical
Climb Maneuvers. .. ...... .............. .......... 31C. Data Acquisition .. .. .. ............ ............ ...... 39
DISTRIBUTION

INTRODUCTION
BACKGROUND
1. The out-of-ground effect (OGE) design hover criterion of 6000 feet, 95°F,has been used in the procurement of Army helicopters with only a few exceptionssince the mid-1950's. The lack of a substantive basis for this design point hasresulted in questioning as to the need for such a standard. In recent y.-,ars, thisquestioning has resulted in a lowering of the standards to 5000 feet, 901F, and4000 feet, 95"F, in the draft Qualitative Materiel Requirements (QMR) andQualitative Materiel Design Objectives (QMDO) of a number of proposed systems.
2. Pegardless of the atmospheric conditions, a design criterion that requires onlymaximum OGE hover capability is somewhat misleading, in that there is notsufficient power available at the hover ceiling to accomplish any required maneuvers.Additional power is needed to accelerate, maneuver, or perform a vertical climbout.Studies were undertaken by the United States Army Combat DevelopmentsCommand (CDC) (ref 1, app A) and the United States Army Aviation Systems
.! Command (AVSCOM) (ref 2) to determine what power margin is required andhow it should be specified. Based on the results of these studies, the currentDepartment of the Army hot day design hover requirement is stated in reference 3,as follows:
The aircraft shall be capable of hovering out of groundeffect (OGE) at its design or primary mission gross weight;under zero wind, 6000 feet pressure altitude, 95°F, and achievea 500-foot per minute vertical climb at zero airspeed underthese conditions, using military rated power.
However, the design ambient conditions were stated as a goal and several recentexceptions were made by the Department of the Army Staff. Most notable werethe reduction tc 4000 feet and 95"F requirement for the utility tactical transportsystem (UTTAS) and advanced attack helicopter (AAH).
3. The AVSCOM proposed in reference 2. appendix A, that the 500-foot perminute (ft/min) vertical climb rate requirement could be replaced by the OGEhovering directional controllability criterion contained in military specificationMIL-H-8501-A (ref 4) when conducted at the hot day conditions. Therecommended AVSCOM specification is stated as:
5I
1
I ', i

The rotor craft shall be capable of hovering out o1 ground
effect (OGV') at its design or primary mission gross weight withpressure altitude and temperature conditions of 6000 feet,95°F, using normal rated power. At this hover ceiling therotorcraft must also achieve following a full directional controlinput, a yaw angular displacement in either direction from trimin I second of 330/(GW + 1000)1/3 degrees, where GW is thegross weight in pounds.
The reason for this proposed change was the belief that the directionalcontrollability criterion could be more accurately tested, and that compliance wouldstill yield the desired performance margin.
4. In November 1968 AVSCOM requested the United States Army AviationSystems Test Activity (USAASTA) to conduct a comparative flight evaluation ofthe accuracies that could be attained in measuring vertical climb performance andyaw maneuverability in a hover (ref 5, app A). The USAASTA completed thisevaluation using a tandem rotor CH-47C helicopter, and prepared a letter reportfor AVSCOM (ref 6) which indicated that the excess power required to demonstratethe maneuverability requirement was negligible on the aircraft tested. The accuracyof the data from a single 500 ft/min climb was about ± 50 percent and thus manyclimbs and statistical methods would be needed to determine the performance.The AVSCOM review determined that additional testing was required to evaluatesingle rotor helicopters and to obtain more quantitative data for vertical climband directional controllability. On 27 November 1970, USAASTA received anAVSCOM directive to prepare a new test plan for the additional testing (ref 7).
TEST OBJECTIVES
5. The objectives of the hot day hover performance criterion testing were asfollows:
a. To determine the degree of accuracy and repeatability which is possiblein measuring vertical climb performance and yaw angular displacement.
b. To compare power requirements for vertical climb performance andangular displacement.
c. To evaluate the relative merit of these test criteria as performancedemonstration requirements, and recommend a test technique.
!iI
6r
TEST SCOPE
6. Quantitative studies of the power requirements to perform vertical climb andyaw control power tests were conducted at the China Lake Naval Weapons Center(NWC), China Lake, California, using NWC optical space positioninginstrumentation. The tests were accomplished with an AH-IG (Cobra) helicopter.The vertical climb tests were conducted at gross weights between 7200 and8000 pounds at a mid center-of-gravity (cg) location. The average density altitudewas 2200 feet, and the nominal rotor speed was 324 rpm. Approximately 5 hoursof productive flight time were used for the testing at NWC.
7. The tests conducted at Edwards Air Force Base, California, consisted of both
quantitative and qualitative evaluations of the pilot's ability to fly and evaluatethe vertical climb and yaw control power test maneuvers. Two additionalsingle-rotor helicopters (the OH-6A and UH-IM) and five test pilots with varyingdegrees of experience were used to obtain statistical data during vertical climbs.However, performance data from these helicopters were not included since testinstrumentation was not installed. The last test was yaw maneuvers with theAH-IG helicopter tethered at a 50-foot height. Approximately 16 hours ofproductive flight time were expended during the portion of the testing at Edwards.
TEST METHODOLOGY
8. The methods of test were presented in the test plan (ref 8, app A) and aresummarized below.
Vertical Climb Accuracy
9. The vertical accuracy test was a study of a pilot's ability to perform a verticalclimb from an OGE hover. A qualitative portion of this phase determined howaccurately a pilot could judge the vertical component of his flight path. Thequantitative portion was a statistical study of the deviation from the vertical climbas a function of the pilot, aircraft, and amount of power applied. Pilot commentsconcerning the flight path and any influencing factors were recorded. Data wererecorded as the pilot became more proficient so as to evaluate the pilot's "learningcurve." The major factors recorded for the quantitative portion included winds,aircraft type, pilot experience, ground reference, and fatigue. The same test sitewas used throughout the testing, and each pilot flew a series of test points ineach of the three aircraft. The maximum allowable surface winds were 5 knots.A tethered balloon was used to provide a vertical reference to the pilots. Spacepositioning information was obtained from data recorded by two theodolites.
Nonvertical Climbs
1 0. Preliminary evaluations showed that pilots generally recognized deviations fromthe vertical, but that there was time to apply only one correction within the testaltitude range. Therefore, the initial tests flown at the NWC had two parts. The
7
S.i?hi! ..

first part was a quantitative evaluation of the effects of a constant deviation fromthe vertical and the second was a quantitative evaluation of a nonvertical flightpath where one correction toward the vertical was made. The pilot first climbedat 5, 10, and 15-degree deviation angles from the vertical using a constant powersetting. The three different deviation angles were flown In four directions (forward,backward, and towards cach side). The highest number of test points were forwardand to the right. Each climb was initiated and maintained by a collective stepinput. In the second test, the climb was started at an angle and then the pilotmade a correction toward the vertical.
Vertical Climb Performance
11I. To conduct the performance tests, vertical climbs of approximately 20 secondsduration were made from OGE hover at various constAnt collective settings. Theamount of each collective input was controlled by use of a fixture place on thecopilot collective stick. The rates of climb achieved ranged from 400 to1000 ft/mmn with the greatest density of test points being around 1000 ft/mmn.The space positioning data were used to obtain the rate of climb and deviationfrom vertical. Performance parameters were recorded on an osdillograph.
.1Directional Controllability During_ Free Flight Hover
1 2. In these directional controllability tests, the pilot initiated a pedal input whilein an OGE hover and held the input for approximately 2 seconds. The resultinghorizontal and vertical translation were measured by Bowen cameras at the NWC.Angular yaw displacement and time were obtained from the photographs obtainedfrom a vertically positioned Bowen camera. The tests were flown at gross weightsbetween 6500 to 7000 pounds, and a rotor speed of 324 rpm.
Directional Controllability During Tethered Hover,
1 3. This test was an evaluation of the acceptability and advantages of Performingdirectional controllability tests during a tethered hover. The aircraft was tetheredat a 50-foot skid height. The pilot used the same test techniques as stated in
K paragraph 12. While in the hover, the torque setting was such that approximately1000 pounds of tension was maintained on the cable. The cable tension was toensure that the aircraft would not descend should a thrust loss result from thedirectional control input. The tethering mechanism had a quick release at theaircraft for emergency purposes.
RESULTS AND DISCUSSIONI
GENERAL
14. Statistical data were obtained to determine the pilot's ability to perform
accurate vertical climbs in various models of Army helicopters. This evaluationshowed that vertical climbs within an allowable deviation anple could be flownwith satisfactory repeatability and that each pilot's proficiency significantlyimproved with exnerience in the maneuver. [1he measured climb data showedconsiderable scatter and energy corrections for nonsteady flight conditions wereemployed to improve the results. The excess power required for moderate ratesof climb was small. The engine power instrumentation was not sufficiently accurate,which required that a substantial number of data points be generated and anextensive analysis be used to develop suitable climb performance results.
15. A momentum analysis method was developed to predict the vertical climbperformance on the basis of hover power required. The predicted value wassufficiently accurate at rates of climb below 8.3 feet per second (500 ft/mmn). Athigher values, the prediction became increasingly optimistic and requires atest-derived correction factor to obtain desired accuracy. The power required foryaw maneuverability was investigated by free-flight and tethered hover methods.From an instrumentation and aircraft positioning standpoint the tethered hovermethod is preferable. The tethered hover method dictates one less degree of aircraftfreedom, eliminates the need for sophisticated space positioning equipment, andmain 'rotor thrust is measured directly with a load cell. Energy losses due tononvertical motion are also minimized. The test data and analytical calculationsshow that for the AH-IG, more excess power would be required to ineet the yawdisplacement requirement than to climb at 500 ft/mmn. However, this power is onlyrequired for a short period of time and is transient in nature.
available from tethered hover data and calculate the vertical rate of climb from
adjusted momentum analysis. If required, the basic momentum analysis data linecould be corrected to match a best fit test data line by determining a climb powercorrection factor. Also, parameter extrapolation to specified conditions can easilybe made by loading the cable and varying rotor speed until the correspondingtip Mach number and thrust coefficient are attained.
VERTICAL CLIMB CRITERION
Vertical Flight Path Accuracy
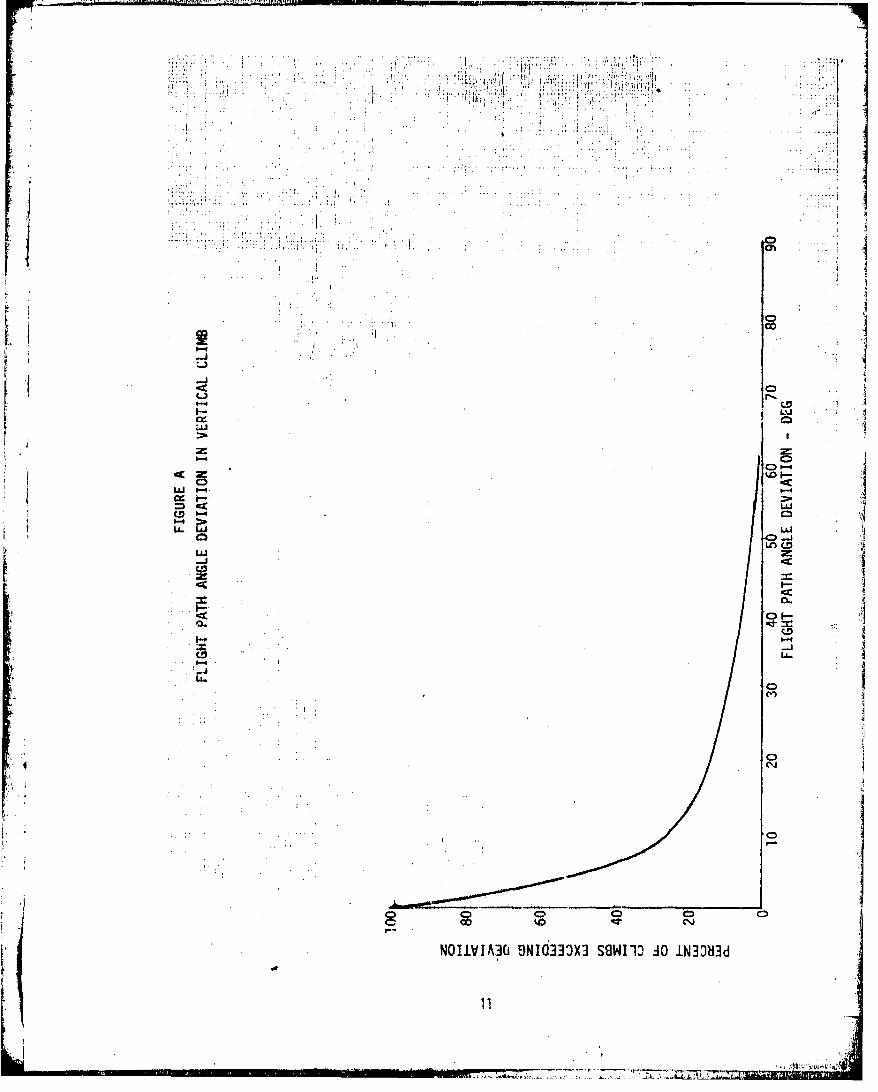
17 During the testing five pilots of varying experience and training were usedin the UH--IM, AH-IG, and OH-6A helicopters to evaluate the capability toaccomplish a vertical climb. Results show that the pilots tended to climb at some

initial angle and then, recognizing it was not vertical, make corrections towardthe vertical. The performance of pdots who were not experienced in vertical climbtesting improved rapidly during the initial portion of the test. Following this I
familiarization phase, there was no appreciable difference in vertical-climb accuracybetween any of the pilots. Figure A shows the mean performance achieved byall the pilots in the different aircraft tested. The figure illustrates the difficultyin maintaining small flight path angle deviations from the vertical. If small flightpath angle deviations are specified, extensive flight time will be be required toobtain a statistically significant sample.
Vertical Climb Angle
18. During the second phase of the vertical climb tests it was planned to determineHit the effect of climb angle (-y) on vertical climb performance. These tests showed,however, that it was not possible to repeatedly select and maintain a given climb1 ~angle. Therefore, it was not possible to determine climb angle effects on4
[ performance from the test data. Because these data could not be obtained, ananalytical approach was used to assess the excess power required to climb. Figure B Jshows power required versus airspeed obtained in low-speed translational flight fora UH-IM helicopter. It is seen that the power decreases approximately 10 to
*1 15 horsepower per knot at airspeeds above 3 knots. Since the accuracy of theinstalled power instrumentation during these tests was approximately ±30 engineshaft horsepower (eshp), a value of ±3 knots was established as the maximumacceptable horizontal speed component for these tests.
19. Figure C illustrates the geometric relationship between the flight path
deviation angle (y), the ground track azimuth (41), and the vertical and horizontalUvelocity compontents (Vv and Vh respectively). In table I the flight path deviationangle is calculated for vertical rate of climb (VROC) values between 500 and3000 ft/mmn based on the horizontal airspeed component (Vh) of 3 knots. It isnoted that the high rates of climb require correspondingly small flight path deviation
* . angles and that the probability of being within these constraints is reduced. Alsoshown in table I is the probability of performing a vertical climb with less thanthe stipulated limit climb angle. These probabilities were determined from figure A.A high probability of conducting the low vertical rate of climb tests within theacceptable accuracy limitations is evident. On the basis of the test conducted herein,near-vertical, 500 ft/mmn climbs can be flown with acceptably low horizontalvelocity components.
10
* rvc.'~.~ .ta~ ~ -- ________________________________________________GO
In -j
L L.
CD
. I- L)
D Q C CD
N011IA30S~ia3OX SGWll, O IL3bJ

71 -- W
VHTW '-I :6
Note: Data based on pytessre altitudeof 2200 fet ~ inbienair
temperatUreebf'200C
1100 3 KTAS limit
1000
p90GW =8500 lb
00 80o
GW =7500 lbi.E 700
LaJ
600GW =6500 lb
50o 2 4 6 8 10 12 1416 1~T
TRUE AIRSPEED KTAS
12
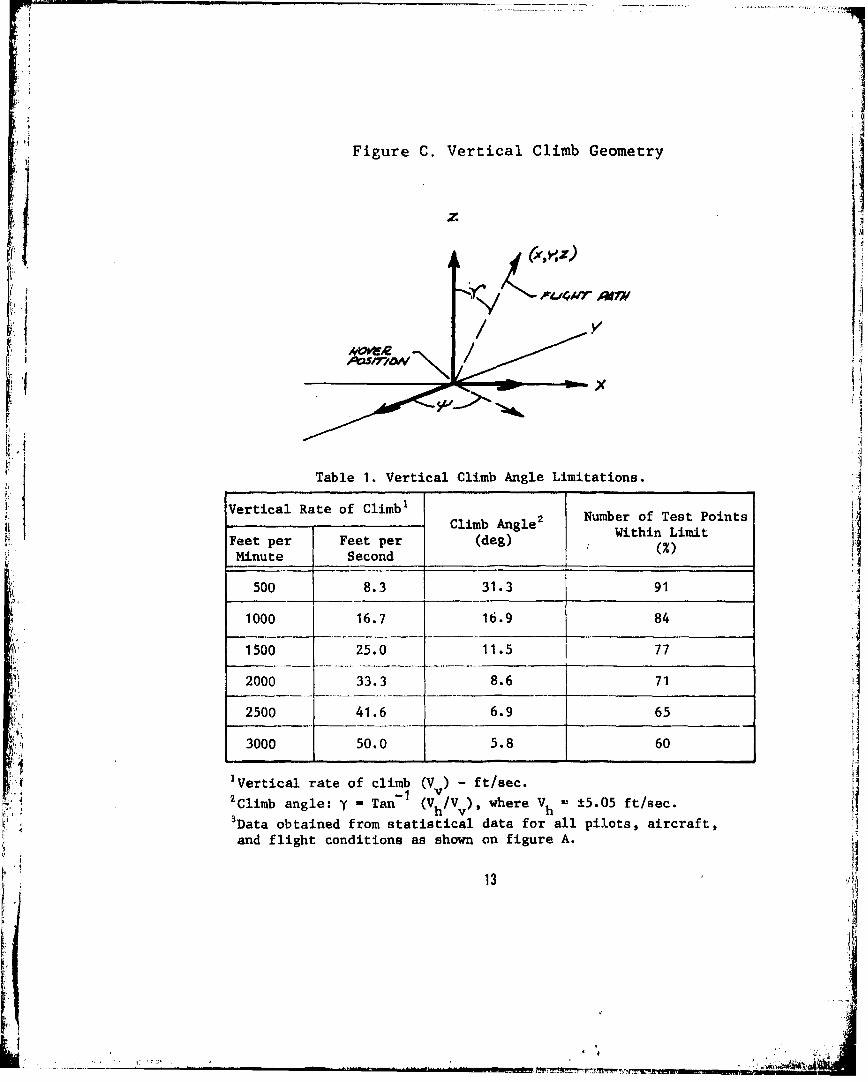
Figure C. Vertical Climb Geometry
Lti
Table 1. Vertical Climb Angle Limitations.
Vertical Rate of Climb'Climb gle2 Number of Test Points
Within LimitFeet per Feet per (deg) itnL)
Minute Second M
500 8.3 31.3 91
1000 16.7 16.9 84
1500 25.0 11.5 77
2000 33.3 8.6 71
2500 41.6 6.9 65
3000 50.0 5.8 60
'Vertical rate of climb (V ) - ft/sec.2 Climb angle: y = Tan-1 (Vh/Vv), where Vh ±5.05 ft/sec.3Data obtained from statistical data for all pilots, aircraft,and flight conditions as shown on figure A.
13
i a
AI
Vertical Climb Performance
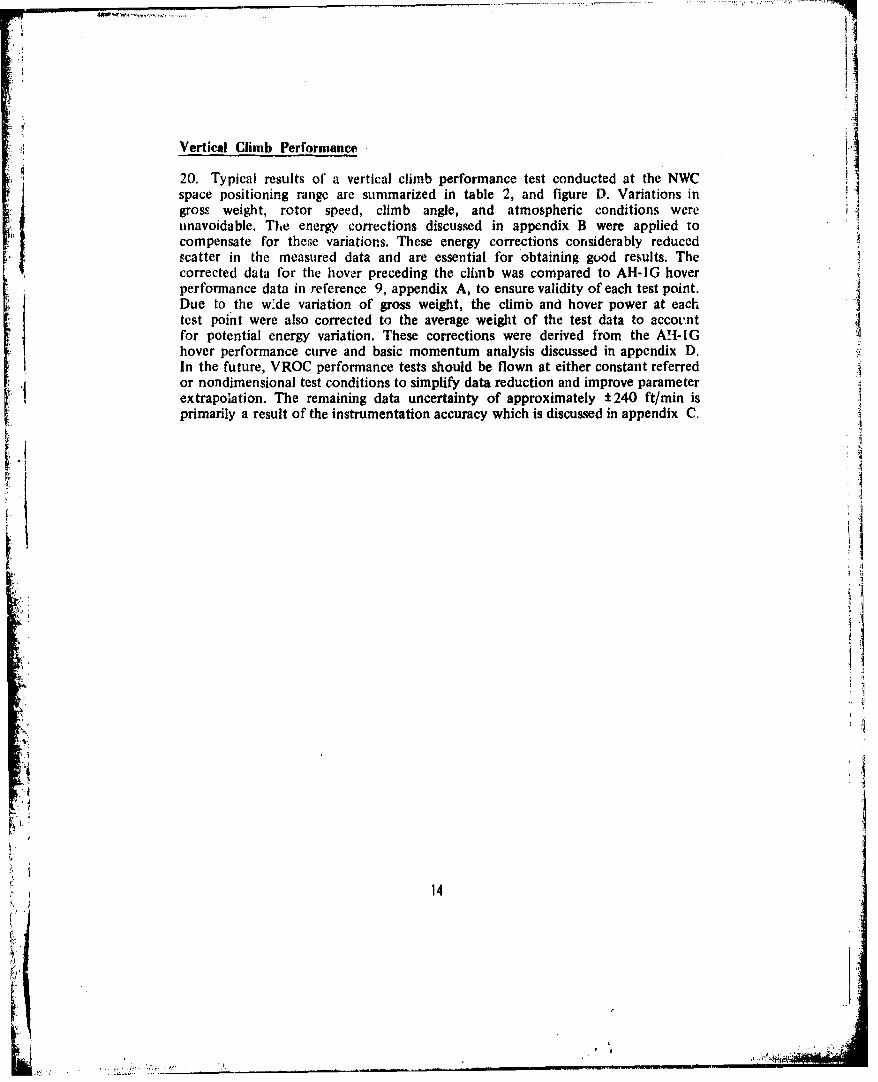
20. Typical results of a vertical climb performance test conducted at the NWCspace positioning range are summarized in table 2, and figure D. Variations ingross weight, rotor speed, climb angle, and atmospheric conditions wereA
f unavoidable. The energy corrections discussed in appendix B were applied tocompensate for these variations. These energy corrections cornsiderably reduced
scatter in the measured data and are essential for obtaining good results. Thecorrected data for the hover preceding the clfimb was compared to AH-IG hover
tuesto poin w'de variation of gross weight, the climb and hover power at eachtes pontwere also corrected to the average weight of the test data to accou'ntforpoentalenergy variation. These corrections were derived from the ATI-IGhvrperformance curve and basic momentum analysis discussed in appendix D.Intefuture, VROC performance tests should be flown at either constant referred
ornondiniensional test conditions to simplify data reduction and improve parameter~ extrapolation. The remaining data uncertainty of approximately ±E240 ft/mmn is
priariy aresult of the instrumentation accuracy which is discussed in appendix C.
14

4.I 41a 43 0%
40~~ W N w0 inLi0NN wm m &M4- : nC 4 'oW M - - - -. - - - - - - C4 -
u rl.06 0. NO N -4 NO Cc 00- N N4.04
~410.8 0l N 4 NN..40 0-
4 '41 w 0 0
Aa 00 0 0 LM 0 Nl N 00 %D N u m 4 M -0 MN -
$441 FA 000 0 0%0 01 0 0%0% 03 0%O 02 -- 0 0 0%
wN 4 ,0 O1- -
41 0-
J0 u1.0 MC m Le N% C4 000%q a N N o 004 m a% 40 N '0n .9w1 w.4 11 m n1.00 0 r'- 41 4 MO MOn. m T0C0 NO l N n NO 04 a
0) 054 00 0 0 00.0 00 00000%D O coG wwa 0% cr 0% 00 00% O 00wIs 0W4'
4.4
0 54.0 . 04 A C m P - h D a m % 0 : 1w1 .44. 0 M ,a NO MN 4, N0 -000 Dww M 04a,0% MON,. Ny o
N~~. N , 'CA ~~00 O 0,
40N01' m '0 - 0Ln W i A4 41
to410 540 bato 4 .4 * 9l 4
4.1 '.444 -- -4 -> '
H0 f" 00 40 000 m% 04 0 M ' 14 N 2 - 0 8 0.4700 7, - 0 41,& 4
I-. 4 , 1 '.4 4141.8. 00 0 O0 O)O O 00 00600. 0N CO ON in '00 -0 0 C4 '. NO N
r'.- '0 '0000444440 N N4 Nqc 0% 0 0 00 ,N
410~~b 0-N 01 000 004 '0 NO00- 04 ~
4 I4

VERTICAL CLIMB PERFORMANCEAH-1G USA S/N 69-16410
JAVG GROSS AVG PRESSURE AVG AVG ROTOR
WEIGHT ALTITUDE OAT SPEEDSYMBOL (LBS) (FEET) (RPM)
7600 2200 20 324
SNOTES: 1. Shaded symbol represents-averagepower for all test points,2. Test data corrected for weightvariation from average.
3. Momentum analysis based onaverage flight conditions*
300
'!. Adjusted Momentum Q 0S200 Theory 0.
LU .4 ~~(A '82t K-19z
-I 0
.00 '-oasic Momentum TheoryLIOO
• 0
1200
I ~~~~Adjusted M~mentum Theory • •--i
i 0Momentum T
0
S900
810080 200 400 600 800 1000 1200 1400
* VERTICAL RATE OF CLIMB '~VROC - FT/MIN
16
U
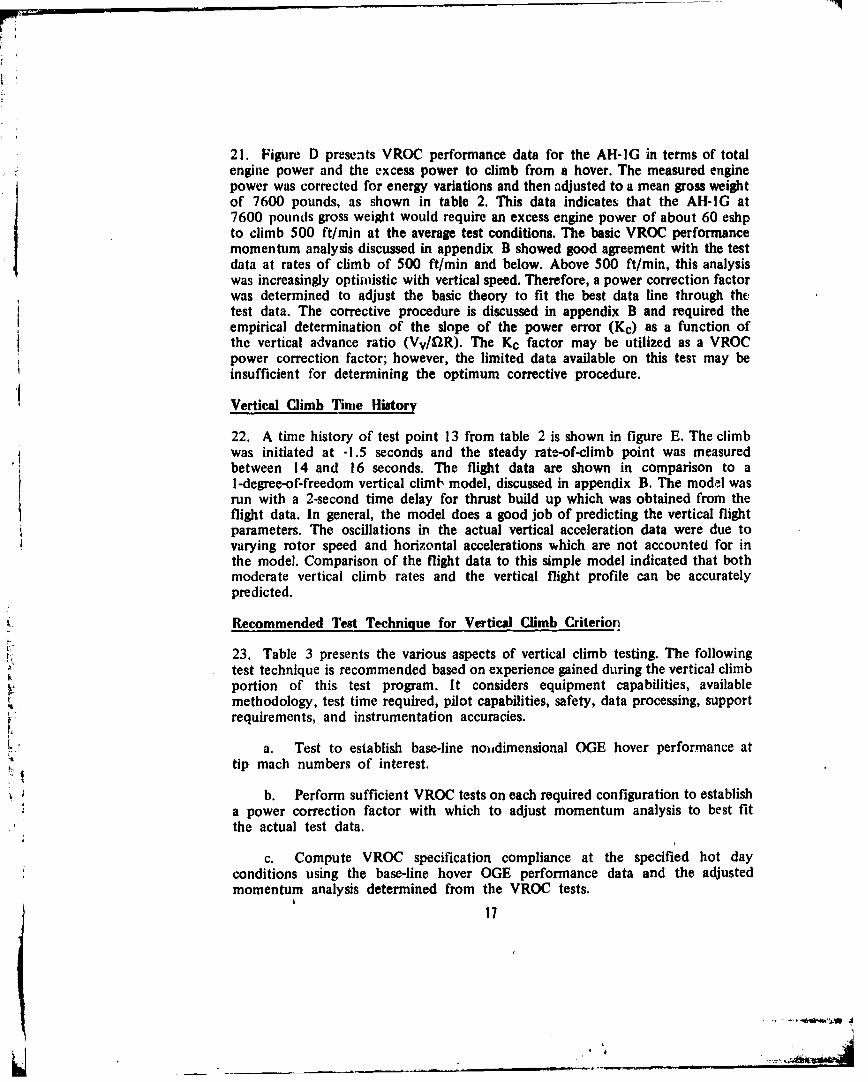
21. Figure D presents VROC performance data for the AH-IG in terms of totalengine power and the excess power to climb from a hover. The measured enginepower was corrected for energy variations and then adjusted to a mean gross weightof 7600 pounds, as shown in table 2. This data indicates; that the AH-IG at7600 pounds gross weight would require an excess engine power of about 60 eshpto climb 500 ft/min at the average test conditions. The basic VROC performancemomentum analysis discussed in appendix B showed good agreement with the testdata at rates of climb of 500 ft/min and below. Above 500 ft/min, this analysiswas increasingly optimistic with vertical speed. Therefore, a power correction factorwas determined to adjust the basic theory to fit the best data line through thetest data. The corrective procedure is discussed in appendix B and required theempirical determination of the slope of the power error (Kc) as a function ofthe vertical advance ratio (Vv/12R). The Kc factor may be utilized as a VROCpower correction factor; however, the limited data available on this test may beinsufficient for determining the optimum corrective procedure.
Vertical Climb Time History
22. A time history of test point 13 from table 2 is shown in figure E. The climbwas initiated at -1.5 seconds and the steady rate-of-climb point was measuredbetween 14 and 16 seconds. The flight data are shown in comparison to a1-degree-of-freedom vertical climti model, discussed in appendix B. The model wasrun with a 2-second time delay for thrust build up which was obtained from theflight data. In general, the model does a good job of predicting the vertical flightparameters. The oscillations in the actual vertical acceleration data were due tovarying rotor speed and horizontal accelerations which are not accounted for inthe model. Comparison of the flight data to this simple model indicated that bothmoderate vertical climb rates and the vertical flight profile can be accuratelypredicted.
Recommended Test Technique for Vertical Climb Criterion
23. Table 3 presents the various aspects of vertical climb testing. The followingtest technique is recommended based on experience gained during the vertical climbportion of this test program. It considers equipment capabilities, availablemethodology, test time required, pilot capabilities, safety, data processing, supportrequirements, and instrumentation accuracies.
a. Test to establish base-line noudimensional OGE hover performance attip mach numbers of interest.
b. Perform sufficient VROC tests on each required configuration to establisha power correction factor with which to adjust momentum analysis to best fitthe actual test data.
c. Compute VROC specification compliance at the specified hot dayconditions using the base-line hover OGE performance data and the adjustedmomentum analysis determined from the VROC tests.
17

'93
4. - -D
I- I
4j a.U. t-
CT L'1'..,; c12
CD~ . I 0D
CD 40 o
L1333
18-

4)
0- 0
'1 H 00 C
0 U)'0 C'410> 1 1.40 H u 4-
0, 26. .0U .0O0 w-4j 0 v-.14 u
w~~O 41-H4 1 11
4.a1 0 000
0 0i
0 v- 4
0 .0 A
44.
41 0 0440u 1 0 0
0 0 ~~9-4 41 $
0 4-1 4. 0 -WO-40 0 0~ I44 > AJ 0
cd9 44 1.
E-4 0- H Uf
0 0) iJO 44 0) 0% 0W0 0 m.1 U1 0
00 0.-H 0 0 4.0 to 9 -q W
4 .1 00 0q4 J H wrI 04 00
) 5 d 44 u 0 -H w u a u 5.
41 19
10 1 )9 44 o "
U)~~ boQr

DIRECTIONAL CONTROLLABILITY CRITERIA
Free Hover
24. The AVSCOM recommendation (ref 2, app A) to measure performancemargin in terms of yaw capability was evaluated with the aircraft in an OGE500-foot free flight hover and in an OGE 50-foot tethered hover. In free flighthover conditions there is not sufficient flight information for the pilot to preciselystabilize the aircraft about all axes. Using ground references and tethered balloons
requires that the pilot devote his attention ouside the cockpit, which complicatesstabilizing the engine parameters. Atmospheric variations were very apparent interms of pilot workload and introduced continual small variations about the hoverpoint. A suitable airspeed reference would a&ow the pilot to maintain zero airspeedand drift with the wind. However, this drift would complicate obtaining verticaldisplacement from existing space positioning systems.
25. the results of the free flight yaw tests are shown in figure F. The yaw criteriais that the aircraft acheve an attitude change of 16 degrees at the end of I second.The power required for this maneuver was about 130 eshp and the pilot usedapproximately I inch of directional control. The scatter in the data is due to theuncertainty of power and attitude measurement. Power required was the differencebetween the measured power in the hover and the measured power during pedalinput. The ±20 eshp scatter is within the accuracy expected of the measuringsystem as discussed in appendix C, and is typical of that experienced during hoverperformance testing.
Tethered Hover
26. The tethered hover results are presented in figure G. The peak engine powerrequired for a 1-inch left pedal input (the amount required to achieve 16 degreesin I second) was 126 eshp, which agrees well with that obtained during the freeflight hover tests. There was no height gain because of the restraining cable orany height loss because of the cable tension. The change in cable tension wasrandom and varied approximately + 70 pounds. This is equivalent to about ± 8 eshpin a hover.
20

AH-1 6 USA S/N 69-16910
10,1
RI 30
20
10
00
20o
LT 30
RT 30
20
1000
20
LT 30
120 100 80 60 40 20 20 40 60 80 100 120DECREASING DELTA SHAFi' HORSEPOWER INCREASING
A*SHP
21

FIGURE GTETHERED TURNS IN AMHOVER
AH-1G USA S/N 69-16910 IISOO1500
owl 100
so
-1 5 0 .. . .... .. . .. .
LEFT RIGHTDIRECTIONAL CONTROL DISPLACEMENT- INCHES
27. The tethered hover could be accomplished more easily and allowed greatercontrol and/or measurement of the test conditions. The pilot could easily stabilizeover a spot and the cable prevented vertical motion. Setting a cable tension allowedeasy determination of thrust changes. Since the cable restricts translation over theground, any horizontal velocity component is from the existing wind. When thewinds are greater than 2 to 3 knots, the test should not be conducted, for thesame reasons discussed in paragraph 18. The wind conditions can be moreaccurately measured for the lower skid height. The lower pilot workload and bettercontrol of flight parameters allows a much greater productivity than during freeflight hover. The pedal input was only held a few seconds and there was littletranslation or change in cable angle.
22
, ,
I
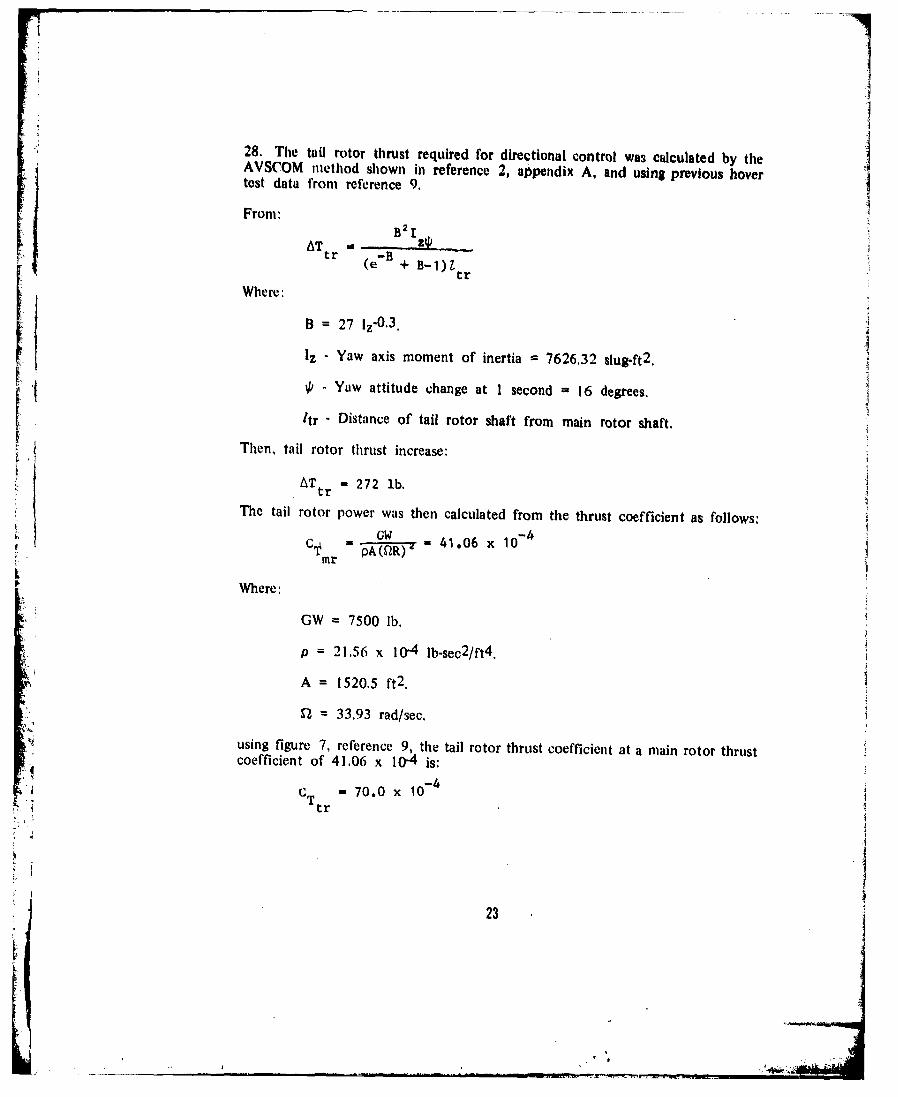
28. The tail rotor thrust required for directional control was ctdculated by theAVSCOM method shown in reference 2, alppendix A, and using previous hovertest data from reference 9.
From:B2 ,
ATtr - B m(e + B-l)lr
tr -BWhere:
B = 27 lz-0. 3.
Iz - Yaw axis moment of inertia 7626.32 slug-ft 2 .
/- Yaw attitude change at 1 second = 16 degrees.
• 'tr - Distance of tail rotor shaft from main rotor shaft.
Then, tail rotor thrust increase.:
AT - 272 lb.
The tail rotor power was then calculated from the thrust coefficient as follows:c• GWmr -41.06 x 10mr
i!Where:
GW 7500 lb.
p = 21.56 x 10⁻⁴ lb-sec 2 /ft 4.
A = 1520.5 ft2 .
E= 33.93 rad/sec.
using figure 7, reference 9, the tail rotor thrust coefficient at a main rotor thrustcoefficient of 41.06 x 10⁻⁴ is:
C -70.0 x 10⁻⁴
Ttr
23
12 J

The delta tail rotor thrust coefficient for a 16 degree yaw displacement in I secondis then determined from Ttr as follows:
AtrACTtCT =r pA(QR)'
Where:
A = 56.74 ft 2 .
R = 4.25 ft.
92 = 173.04 rad/sec.
AC~tr= 41.0 x 10tr
Utilizing figure 12, reference 9, a delta CPtr for the maneuver is determined from
ACTtr by utilizing the portion of the tail rotor CT/CP curve above a CTtr of
70.0 x 10⁻⁴
AC P 9.6 x 10⁻⁴tr
which is used to determine Ashptr as follows:
Ac pA(R) 3p
ASHP trtr 550
ASIIP = 85.20
29. The test data were not corrected for potential or kinetic energy changes duringthe maneuver. Also, in the calculation the tail rotor power values from reference 9,were obtained by extrapolating beyond the majority of the test data and powerrequired could be considerably higher if the relationship becomes more nonlinearthan shown.
Recommended Test Techniques for Directional Control Criterion
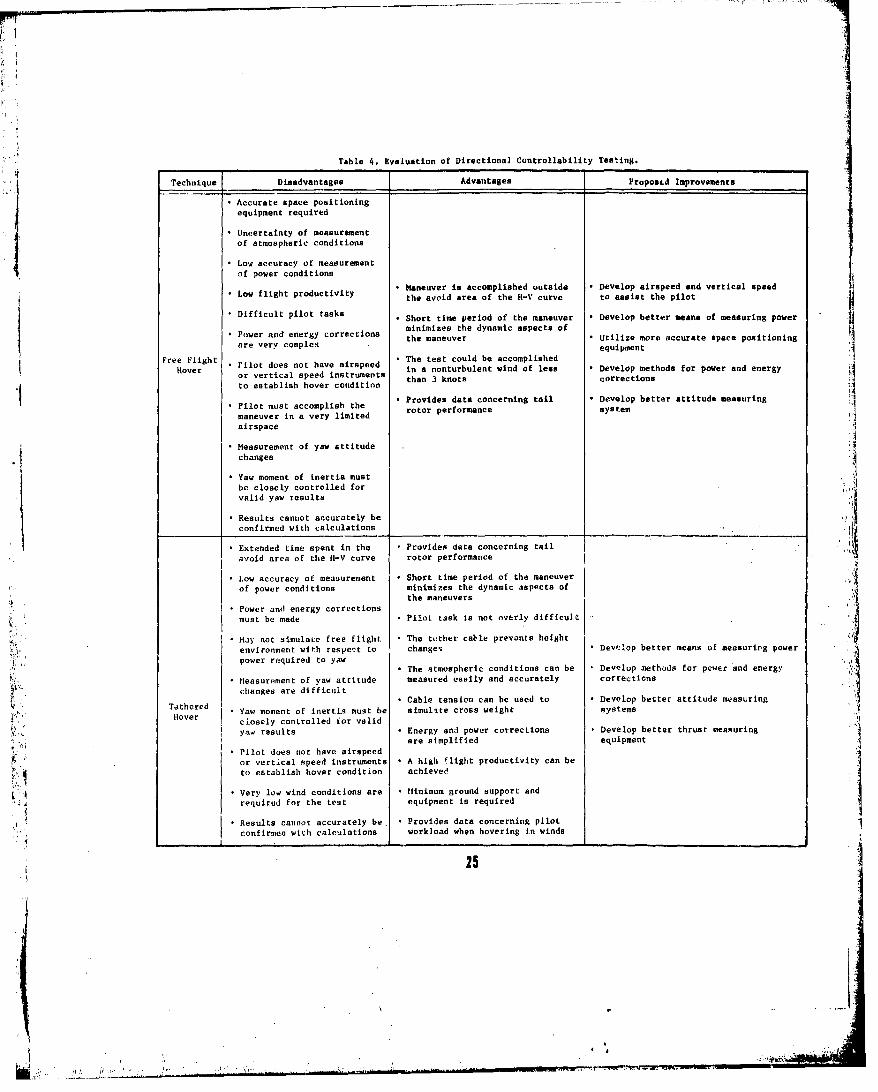
30. Table 4 presents the various aspects of directional controllability testing. Thefollowing test technique is recommended based on experience gained during thedirectional maneuverability portion of this test program.
a. Test aircraft should be at the specified rotor thrust and yaw axis momentof inertia configuration.
24
|
4 4jL
I � 1.
Table 4. Evaluation of Directional Controllability Testing.
Technique Disadvantages Advantages Propoasd Improvements
* Accurate apace positioningequipment required
* Uncertainty of measurement
of atmospheric conditions
Low accuracy of measurement
of power conditions
Maneuver is accomplished outside Develop airspeed and vertical speedLow flight productivity the avoid area of the H-V curve to assist the pilot
* Difficult pilot tasks Short time period of the maneuver Develop better means of measuring power
SPower and energy corrections minimizes the dynamic aspects of
are very comlex othe maneuver Utilize more accurate space positioningare very complex equipment
The test could be accomplishedFree Flight Pilot does not hav airspeed ina nonturbulent wind of less Develop methods for power and energyHover or vertical speed Instruments ihn3knscortos
to establish hover condition
- Provides data concerning tail Develop better attitude measuring•Pilot must accomplish the rtrpromnesse
maneuver in a very limited rotor performance systes
airspace
• Measurement of yaw attitudechanges
* Yaw moment of inertia must
be closely controlled for ____________ _____valid yaw results
Results cannot accurately be
confirmed with calculations
Extended time spent in the Provides data concerning tailavoid area of the H-V curve rotor performance
* Low accuracy of measurement Short time period of the maneuver
of power conditions minimizes the dynamic aspects ofthe maneuvers
Power and energy corrections
must be made • Pilot task is not overly difficult
* May not simulate free flight The tuther cable prevents heightenvironment with respect to changes * Dewlop better means of measurtrg power
power required to yawThe atmospheric conditions can be Develop methods for power and energy
Measurement of yaw attitude measured easily and accurately correctionschanges are difficult
Cable tension can be used to • Develop better attitude measuringTethered Yaw moment of inertia must be simulate cross weight systems
Hover closely controlled for valid
yaý results Energy and power corrections * Develop better thrust meamuringare simplified equipment
* Pilot does not have airspeedor vertical speed instruments • A high fllght productivity can be
to establish hover condition achieved
• Very low wind conditions are M tinimum ground support and
required for the test equipment is required
* Results cannot accurately be , Provides data concerning pilotconfirmco with calculations workload when hovering in winds
25
S. . .
rb. The engine power to produce the directional control required should bedemonstrated in a tethered hover.
c. Energy losses and power variations should be accounted for as shownin Appendix B.
SAFETY
3 1. Any new test method must be considered in terms of potential hazard, degreeof exposure, and emergency procedures. The vertical climb and OGE;tethered hovertests require that the aircraft be operated in the "avoid" area of the height-velocitycurve.
ATMOSPHERIC CONSIDERATIONS
32. The effect of atmospheric conditions on performance is a function oftemperature and pressure. Since it is unlikely that any Army hot day specificationcan be exactly duplicated at test locations, the thrust coefficient (CT) and tipmaclh number (Mtip) corresponding to the test aircraft design gross weight at thehot day condition will be the aim CT and Mtip for testing in atmospheric conditionsother than hot day. Provided test aircraft structural and/or rotor speed limits arenot exceeded, constant CT and Mtip may be flown in existing atmospheric
conditions by varying gross weight and rotor speed.
26

'1
CONCLUSIONS
GENERAL
33. Vertical climb performance is difficult to obtain directly from flight tests.Instrumentation accuracy, atmospheric conditions, and the pilot's ability to climbvertically combine to produce data scatter. The simplest and most accuratetechnique is to calculate vertical climb capability from hover performance dataobtained during tethered hover tests and adjusted momentum theory. Energycorrections must be used to improve the measured data. Vertical climbs at selectedconditions should be flown under ideal weather conditions for vertification of thederived performance.
34. Directional controllability tests were easily performed in tethered hover."However, considerable analysis and corrections are necessary to account for aircraftand rotor transients. The power requirements for the controllability criterion werenot accurately predicted by theory, even though empirical tail rotor data were.available.
SPECIFICCONCLUSIONS '35. The pilots can conduct ,ertical climb performance tesrs within allowabledeviations from the vertical (para 19).36. The vertical climb test results were improved by corrections f.:re rotlr speeddeviations and unsteady flight, conditions (para 20).
37. Momentum theory agreed well with climb performance )esuits for vertical
speeds up to 500 ft/min (para 21).
38. A model was developed which used hover power required and momentumtheory to predict transient vertical climb performance with an accuracy cormpardbleto that which can be attained in flight tests (para 22).
39. For the AH-1G helicopter, more power is required on a transient basis tonmeet the proposed directional controllability criterion than is necessary to conform
with the 500 ft/min VROC criteria (paras 21 and 25).
40. Power required resulting from the AH-IG yaw maneuverability tests did not-J' agree well wiLth calculations based on tail rotor performance data and the method
in the AVSCOM Army hot day design study (para 26).
41. Accuracy of power measurement and rate-of-climb determination introducedan uncertainty of1 :•.240 ft/min in the AH-IG vertical climb performance results(para 20 and app C).
27I, K'

42. InstruLlentation such as radar or radio altimeters, low-airspeed sensor,imagnetostrictive torque transducers, and improved yaw attitude gyros shouldincrease the accuracy of vertical climb or yaw maneuverability test results (paras23, 30, and app C).
43. The spade positioning equipment used did not have sufficient accuracy andresolution to/measure small transient aircraft motions. (para 7, app C).
.28
i-ij[.1
, 28
L. . i . .. : ..• . . . . . . .. . : = -- -" • " " " . .

RECOMMENDATIONSI
44. Improve capability to measure power required, yaw attitude displacement,aircraft position and motion, and atmospheric conditions.
45. Develop improved correction methods to account for energy losses andtransfers during vertical climbs and yaw maneuvers.
46. Usc hover performance test data and adjusted momentum theory to determinecompliance with the vertical climb criteria. The momentum theory adjusment may
include i VROC power correction factor to be determined from test data on eachconfiguration of interest.
47. Future VROC performance tests should be flown at constant referred ornondimensional test conditions to sim.plify data reduction and parameterextrapolation.
29

I!.h
APPENDIX A, REFERENCES
I. Final Report, United States Army Combat Developments Command, VerticalFight Performance Criteria, January 1968.
2. Final Report, AVSCOM, ADS TN 68-1, A Study of the Army Hot Day DesignHover Criteria, August 1970.
3. Letter, Department of the Army, AGAM-P,, 29 October 1968, subject: HotDay Hover Criteria For Army VTOL Aircraft.
4. Military Specification, MIL-H-8501A, Helicopter Flying and Ground HandlingQualities; General Requirements for, 7 September 1961, amended 3 April 1962.
"5. Letter, AVSCOM, AMSAV-R-F, 9 November 1968, subject: Flight TestTechniques for Determining Compliance with Performance Guarantees for NewArmy Hovering Criteria.
6. Letter Report, USAASTA, February 1970, Evaluation of Flight TestTechniques to Determine Compliance with Various Hot Day Hovering Performance jGuarantees, Project No. 68-55.
7. Letter, AVSCOM, AMSAV-R-F, 27 November 1970, subject: Evaluation ofFlight Test Techniques to Determine Compliance with Various Hot Day HoveringPerformance Guarantees, Project No. 68-55.
8. Test Plan, USAASTA, Project No. 68-55, Vertical Climb Program,February 1970.
9. Final Report, USAASTA, Project No. 66-06, Engineering Flight Test AH-1 GHelicopter (Hueycobra), April 1970.
10. Textbook. A. Gesow and G. Meyers, Aerodynamics of the Helicopter,Frederick Ungar Publishing Company, New York, 1967.
11. Textbook, Naval Test Pilot School, USNTPS-T-NOI, Principles of HelicopterPerjbrmance, 8 March 1968.
30Ii-
A

*I
APPENDIX B. e
ENERGY CORRECTIONS AND ANALYSISOF VERTICAL CLIMB MANEUVERS
C(ENIERAL
I. This appendix contains the derivation of equations required to calculate energycorrections to nonsteady flight conditions and vertical climb performance frommomentum analysis. The derivation of a simple one-dimensional vertical climb
model based on the momentum equations is also discussed.
ENERGY CORRECTIONS
2. A general power-energy equation for nonsteady flight conditions may beobtained by adding helicopter and rotor acceleration terms to the classical levelflight power equation derived in reference 10, appendix A, as shown in equation 1.
P =P. + P + P + V GW + M(A.V) +I Q (1)1 o p v r
Where:
P = Total rotor power required ft-lb/sec
Pi = Induced power ft-lb/sec
Po = Profile power ft-lb/sec
Pp Parasite power ft-lb/sec
Vv Vertical velocity ft/sec
GW = Gross weight lb
M = Mass slugs
A = Aircraft acceleration ft/sec 2
V = Aircraft velocity ft/sec
lr = Rotor moment inertia slug-ft 2
4
S2 = Rotor angular velocity rad/sen
.S2 = Rotor angular acceleration rad/sec 2
Corrections for aircraft angular accelerations were assumed to be negligible for thevertical climb tests. Also, the Po terrm is considered to include tail rotor,transmission, and, accessory power reqvirements in addition to the main rotorprofile power.
31
L~.,I

3. The excess power required to generate a given VROC (Pex) can be definedas the difference between the power-required in a hover (Ph) and the power requiredin the vertical climb (Pc). This relationship is shown in equation 2.
P =P -P
ex c h (2)
In a hover the potential, kinetic, and rotor energy terms should be zero. However,it was dilfficult to obtain stabilized hover conditions prior to initiating the vertical -i
climb tests. Therefore, the Ph term was corrected to a hover condition by removingthe energy terms froin the measured power (Pm), as shown in equation 3.Additionally, equation 3 can be used to correct Pc data for any linear or rotorspeed acceleration which may be present in the final vertical climb condition bydeleting the potential energy change term (Vv . GW).
=P - (IQ + V GW + M(A-V)) (3)h m v
4. Energy corrections were not applied to the maneuverability test results.However, the power required to achieve the specified angular displacement inI second following control input should be corrected for the nonsteady powerterms shown in equation 1. Ideally, the maneuverability test should be flown withno change in altitude, rotor speed, or cable tension (when tethered). The loss ofaltitude or rotor speed would add to the power required to perform the maneuverand must be accounted for to determine a correct excess engine power available.First, the hover power must be corrected for any unsteadiness, as discussed inparagraph 2. Then, the measured power during the maneuver should be correctedfor any power change not related to achieving the specified yaw displacement.This corrected power required to yaw is also determined as shown in equation 3.
5. For tethered hover tests, power corrections also have to be made for anysignifican't variation in cable tension. The change in cable tension is used to correctthe thrust. Nondimensional hover performance data are then used to obtain
the corrected power coefficient from which the power is calculated.
VERTICAL CLIMB PERFORMANCE
6. In the past, the climb performance of helicopters has been related to the
rate of change of potential energy by determining a power correction factor (Kp),as shown in equation 4.
AVK v GW (4)
p AP 550
32
V #.

II
This factor has been used with varying degrees of success for helicopters in forwardflight conditions. It was suggested in reference 8, appendix A, that this methodcould also be used for vertical climb analysis. However, Kp will be a functionof both the rate of climb and CT and is undesirable for use in vertical climbanalysis.
7. Momentum analysis allows for the variaion of induced power (Pi) due tothe increased inflow caused by the vertical climb velocity. Vertical climb equationshave been derived in references 10 and 11, appendix A, and are considered tobe accurate for moderate rates of climb. The method used to derive workableequations combines energy relations with momentum analysis to allow for thevariation of induced power (Pi) with vertical speed. The method assumes that otherpower requirements remain constant and are combined in one power (Pt) termand determined from equation 5.
Pt P -P (p + P + IQ2' + M(A.V)) (5)~1 t0 p
Where:
1n = M(V.A) -zero for steady flight conditions.
The induced power variation in climb can then be determined by calculating theinduced velocity in climb (Pv) from equation 6. The derivation of equations 6and 7 is provided in reference 10, appendix A.
2 2c a)2-Vv + Vv + t (
•)2= 2)(6)
The power required in climb can then be determined from the main rotor thrustand gross weight, as shown in equation 7.
p rv + GW V + P (7)
8. Typical VROC power variation from both energy and momentum analysis(ref 11, app A) is shown in figure 1. This figure shows that Kp varies with verticalspeed and considerable test data would be required to obtain the Kp for eachconfiguration of interest. The basic momentum analysis becomes optimistic abovea VROC of 500 to 800 ft/min (ref 10) because of the increased fuselage dragand the other power terms comprising Pt (equation 5). Therefore, the basicmomentum equations require adjustment to match the test data.
33
V
. . . . .. . . . . . . . . . . . ..2.----"

Figure 1. Variation of Vertical Climb Rate withExcess Power Available (reference 11, app A)
MOMENTUM ANALYSIS7,> / " EXPECTED TEST DATA
Ca ADJUSTED MOMENTUM"ENERGY EQUATION THEORY
_ K 2.0
W ENERGY EQUATION Kp= I
EXCESS POWER AVAILABLEI-i
9. The adjusted climb power can be calculated by adding terms for parasite power(Pp) and increased profile power (Po) to equation 7, as shown below. The parasitepower may be added as a function of Vv only because vertical drag is alreadyincluded in the hover power. This term is small at low climb rates, but adds a Isecond-order velocity term which helps to linearize the remaining error source.
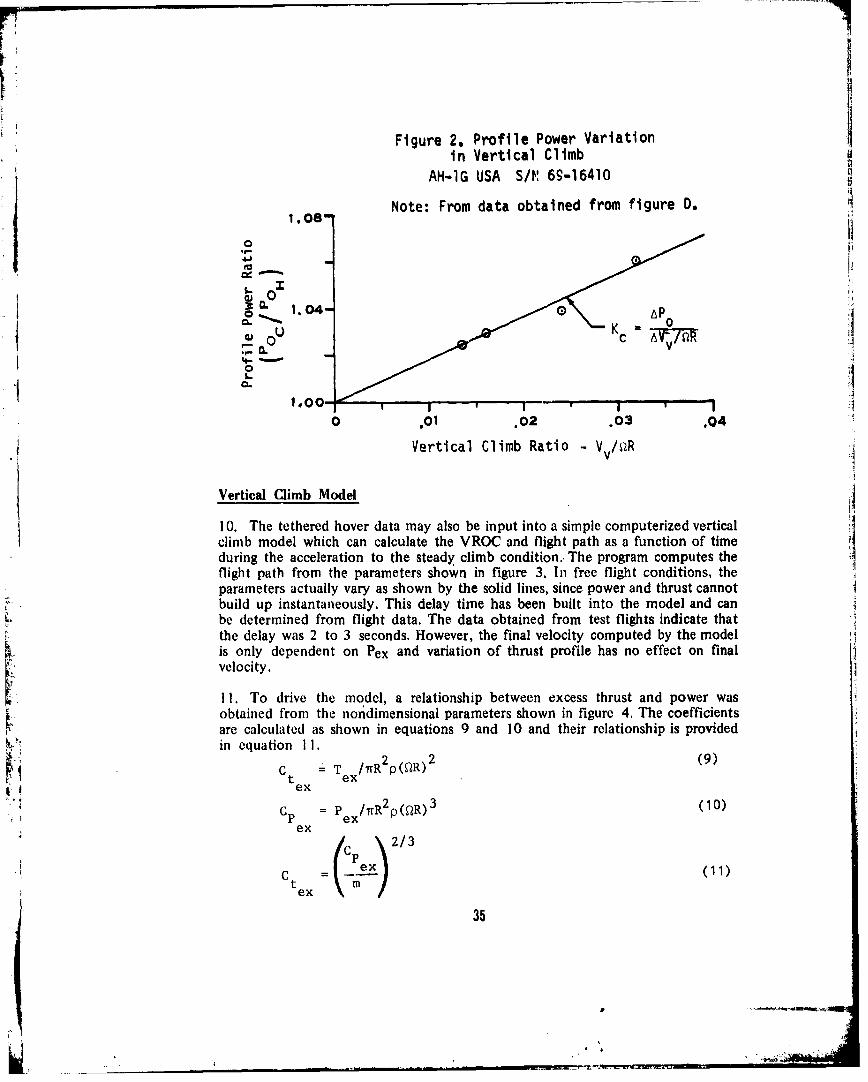
The remaining power difference (Poc) can be plotted from test data in termsof Poc/Poh and the vertical advance ratio (Vv/n2R) to nondimensionalize theparameters, as shown in figure 2. The slope of this data line may then be usedas the VROC power correction factor (Kc) as shown in equation 8. The slopemay also vary with average gross weight, which should be determined from testdata at various weights.
P m *vV + GW V + P + Ph 1 +K VR) (8)
Where:
T GW + I/2pVv 2 Az
PP =/2pVv3 Az
Az Estimated fuselage flat plate area in vertical axis-ft 2 .
J p = Ambient air densiy - slug/ft3 .
Kc= VROC power correction factor as defined in figure 2.
34
i
!I
Figure 2. Profile Power Variationin Vertical Climb
AH-1G USA S/M 69-16410
Note: From data obtained from figure D.1 .08"
4 J1-
" 1.04- 0ASU Kc 0" •! A
4-a0
I .00-
0 .01 .02 .03 .04
Vertical Climb Ratio - /R
Vertical Climb Model ii1 0. The tethered hover data may also be input into a simple computerized verticalclimb model which can calculate the VROC and flight path as a function of time Iduring the acceleration to the steady climb condition.. The program computes theflight path from the parameters shown in figure 3. In free flight conditions, theparameters actually vary as shown by the solid lines, since power and thrust cannotbuild up instantaneously. This delay time has been built into the model and canbe determined from flight data. The data obtained from test flights indicate thatthe delay was 2 to 3 seconds. However, the final velocity computed by the modelis only dependent on Pex and variation of thrust profile has no effect on finalvelocity.
11. To drive the model, a relationship between excess thrust and power wasobtained from the nondimensional parameters shown in figure 4. The coefficientsare calculated as shown in equations 9 and 10 and their relationship is providedin equation I.
2 2 (9)C /T /R p(MR)t exex
= Pex/R R2 p(QlR) 3 (10)
/C Pex2/3Cp
C = (11)Stex
35
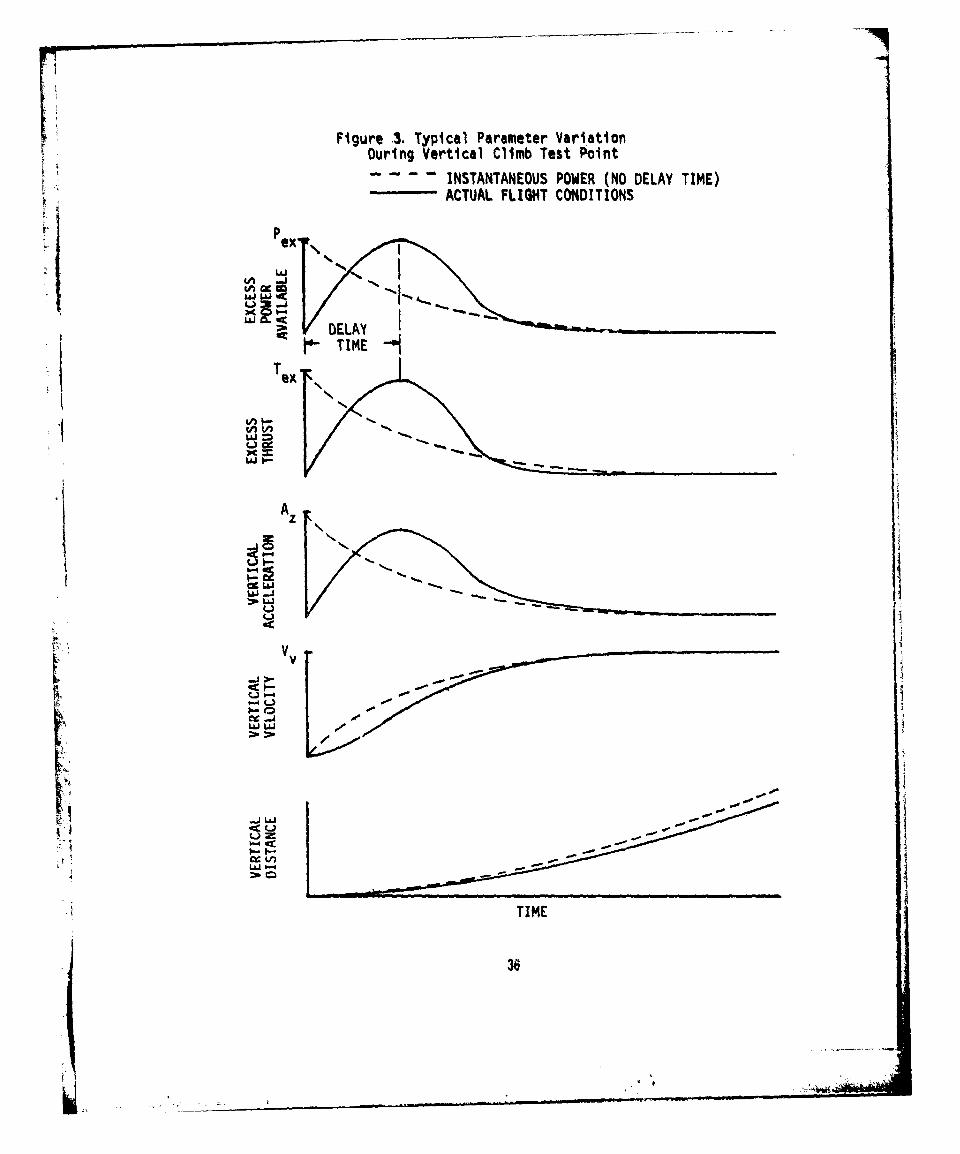
Figure 3. Typical Parameter VariationDuring Vertical Climb Test Point
- -INSTANTANEOUS POWER (NO DELAY TIME)ACTUAL FLIGHT CONDITIONS
w
(A A
* TIME
T

Figure 4. Nondimenslonal Hover Performiance Point
cPt
00
.3/Za eCt
.1t
1 2. A loop for calculating the flight path parameters was then established untilthe excess power was absorbed by the rate of climb and the aircraft is no longeraccelerating as shown in figure 3. The necessary equations for calculating thrust,
~ Iacceleration, velocity, and distance are shown below.
Tex -Ct (7TR p (QR)) (12
TA' -. e2(13z Mass (3
VV =JA dt (14)
Z =fv d (15
13. At each point, the induced velocity in climb can be calculated from*-.1 equation 6, allowing the calculation of the vertical climb power in equation 7.
The excess power would then be decreased by the climb power required and thepower required for vertical acceleration as shown in equation 16.
~ex =M ~C MAV) (16)
The program then loops back to equation 9 to determine the modified thrust untilex converges. When convergence occurs, the time is incremented by a delta time
31
~4
(AT) and calculations for the next point begin again at equation 7. The integration
of acceleration and velocity would continue until Pex is zero, which would simulatethe steady rate of climb condition. Therefore, the model simulation provides boththe time and flight profile required to achieve the final rate of climb.
.ji8

(,,I, .:"
APPENDIX C, DATA ACQUISITION
GENERAL
1. The instrumentation and data acquisition methods used during this evaluationare presented in this appendix. The equipment used did not possess sufficientaccuracy in engine power and space positioning measurement to produce completely
rcpeatable data. This nonrepeatability or data scatter during vertical climbs andhover testing is partially a product of aircraft nonvertical motion and primaril'.inaccuracies in engine power determination. Energy dissipated in the form of aircrafInonyertical, motion was corrected for and reduced the data scatter. Appendix Bshows the necessary energy corrections applied to the vertical flight andmaneuverability test data.
SHAFT HORSEPOWER
2. Engine output shaft power in these tests was calculated from measured valuesof output shaft torque and power turbine speed. The standard engine differentialtorque pressure output was used. Estimates of the uncertainty of this type oftorquemetcr range from ± I percent full scale to ± 15 percent full scale understeady-state conditions. Engine manufacturer specifications claim that each enginetorquemeter shall indicate actual torque developed within ±2.0 percent of theengine torque curve defined by the engine data plate torque constant. This simplymeans that specified torque is supposed to be within ± 2 percent of reading understeady-state conditions, Several studies demonstrate this tolerance is optimistic.
S3. Published data on the hydromechanical torquemeter performance undertransient conditions, such as those encountered in the maneuverability test, arenot available and it car, only be assumed that additional uncertainty will beintroduced by the unknown response characteristics (time lags and possiblyovershooting). Accepting the 2-percent tolerance, additional torque error is stillintroduced by the equipment used to read torque pressure. Instrument panelindicators and oscillograph data such as that obtained during these tests willintroduce an error of approximately ± 1 percent full scale. At a typical powersetting of 1000 shp then, the combination of errors results in an uncertainty ofabout 30 shp due to torque measurement only. It should be noted that improvedtransducers have reduced pressure reading error to a negligible value in currenttests. The turbine speed measurements used during this test provided true speedto ±0.4 percent of reading, which is not a significant error contribution. Thisaccuracy can be improved to ±0.1 percent with current equipment. There is noindication at present that engine torque measurements better than ±1 percent ofreading are to be expected.
39
4. Total thrust measurements in tethered hover can be made with a low levelof uncertainty with current instrumentation. A modern strain gauge load link inseries with the restraining cable can yield cable thrust components havinguncertainties as low as ± 0. 15 percent full scale with good calibrations and a highquality recording system. For UH-l or AH-l type helicopters, using a full scaleof approximately 4000 pounds, tether thrust components are as good as± 6 pounds. Measurements of aircraft gross weight, the other component of thrustin OGE tethered hover, are the limiting factor on thrust accuracy in current tests.Standard Army three-point strain gauge load cell weight and balance kits are usedfor initial empty weights. The kit in use for medium weight helicopters can yieldgross weight errors as small as ± 20 pounds. More modern equipment could reducethis error by a factor of four.
5. Daily fuel loading can be monitored with a tolerance of about ± 10 pounds,using calibrated fuel tanks and daily specific gravity checks. If a good turbineflowmeter is combined with fuel temperature measurements or in-line densitometerreadings, then errors in recording fuel burnoff have a negligible effect on the
~ 4 tethered thrust values.
6. Converting these numbers to equivalent full scale errors on a 6000-poundhelicopter and doing a root-sum-square combination, the total thrust can bemeasured with a tolerance of 0.4 percent.
YAW DISPLACEMENT
7. Attitude data were obtained independently from the space positioningequipment and from the gyros aboard the aircraft. The comparison in figure Ishows that the attitude change from the Bowen cameras is consistently less thanfrom the attitude gyros. The difference becomes greater with greater yaw and isabout 3 degrees as a yaw change of 16 degrees in I second. Errors in spacepositioning data are usually in two categories. Equipment alignment or location,tracking procedure, or images not being in true size, can produce erroneous data.Size of imiage, accuracy of reading, and wrong constants usually produce errorsin the data processing. The increasing error with yaw rate would suggest a timingor tracking error.
40

FIGURE- 3 ,COMPARISON OF YAW ATTITUDE DATA FROM BOWEN CAMERA AND ATTITUDE; ' : GYRO INSTALLATION ,
AH-1G USA S/N 69-16510
16
LI2 OF EQUIVALENCE
4•''0
10
o -42. 0
_1000
I-1
-141
-14-12-10 -8, -6-4-2 0 24 6 810121416LEFT YAW RIGHT YAW
YAW ATTITUDE 1 SEC FROM HOVERAIRCRAFT ATTITUDE GYRtO "DEGS
41
!'
8. Tests at the NWC utilized a precision two-jimbal vertical gyro modified for
use as a two-gimbal gageable free-directional gyro monitor yaw displacement.Gimbal position was measured by the output of a wirewound potentiometer. Forthe stabilized yaw displacement maneuver, basic gyro precision for a 30-secondinterval after gimbal release was +0.5 degree for yaw rates lower than 30 degreesper second and small roll attitude perturbations. This statement includes the effectsof repeatability, hysteresis, precession and drift rate. This figure was increased to±0.75 degree by the stability and resolution of the signal conditioning andrecording equipment used to record gimbal displacements. Nominal event signalrecognition and oscillograph time base uncertainties were used for a final estimatethat yaw displacement produced in 1 second could be determined with a precisionof approximately ±1 degree.
9. The yaw attitude should be more accurate than the Bowen camera equipment.However, this I-degree figure is not the only consideration. Data interpretationand pilot technique could add systematic errors and imprecision to the measureddisplacements that would greatly influence inferred estimates of excess power.
A
42
I j ~.
DISTRIBUTIONii
Director of Defense Research and Engineering 2
Assistant Secretary of the Army (R&D) IChief of Research and Development, DA (DAMA-WSA) 3US Army Materiel Command (AMCPM-UA, AMCPM-AAH-TM-T,
AMCPM-HLS, AMCRD-FQ, AMCSF-A, AMCQA) 16US Army Aviation Systems Command (AMSAV-EF) 12US Army Training and Doctrine Command (USATRA DOC/CDC LnO,
ATCD-CM) 22US Army Test and Evaluation Command (AMSTE-BG, USMC LnO) 3US Army Electronics Command (AMSEL-VL-D) 1US Army Forces Command (AFOP-AV) IUS Army Armament Command (SARRI-LW) 2
US Army Missile Command 1US Army Munitions Command 1
Hq US Army Air Mobility R&D Laboratory (SAVDL-D) 2US Army Air Mobility R&D Laboratory (SAVDL-SR) IAmes Directorate, US Army Air Mobility R&D Laboratory (SAVDL-AM) 2Eustis Directorate, US Army Air Mobility R&D Laboratory (SAVDL-EU-SY) 2
Langley Directorate, US Army Air Mobility R&D Laboratory (SAVDL-LA) 2Lewis Directorate, US Army Air Mobility R&D Laboratory (SAVDL-LE-DD) 1US Army Acromedical Research Laboratory I
US Army Aviation Center (ATZQ-DI-AQ) IUS Army Aviation School (ATST-AAP, ATST-CTD-DPS) 3US Army Aviation Test Board (STEBG-PR-T, STEBG-PO, STEBG-MT) 4US Army Agency for Aviation Safety (FDAR-A) 1US Army Maintenance Management Center (AMXMD-MEA) 1
US Army Transportation School 1US Army Logistics Management Center IUS Army Foreign Science and Technology Center (AMXST-CB4) IUS Military Academy 3US Marine Corps Development and Education Command 2
US Naval Air Test Center IUS Naval %Veapons Center 5US Air Force Aeronautical Systems Division (ASD-ENFDP) IUS Air Force Flight Dynamics Laboratory (TST/Library) I
SUS Air Force Flight Test Center (SSD/Technical Library, DOEE) 3SUS Air Force Special Communications Center (SUR) I
{Department of Transportation Library 2SUS Army Bell Plant Activity (SAVBE-F) 5SUS Army Boeing-Vertol Plant Activity (SAVBV) 2
'1 Bell Helicopter Company 5
Boeing-Vertoi Company 5
AVCO Lycoming Division 5United Aircraft of Canada Ltd 5Defense Documentation Center 12
r-14
II
US Nval ir Tst Cnte
US Nval eapos Ceter