NETZWERKFÄHIGE- VERSION DER DINIERENDEN PHILOSOPHEN M. Monticelli, J. Albrecht.
Upload
justin-baiocchi-cfaCategory
view
103download
1
The Investment Trading Behaviour of Australian Self-Managed Superannuation Fund
Trustees Before, During and After the 2008 Global Financial Crisis
A thesis submitted by
Justin Paul Baiocchi
Bachelor of Business Science, University of Cape Town, South Africa
In fulfilment of the award of
Master of Business (Research)
School of Commerce Faculty of Business, Education, Law and Arts
University of Southern Queensland
2014

ii
ABSTRACT
Self-Managed Superannuation Funds (SMSFs) play an increasingly important
role within Australian retirement planning, with over a third of all superannuation
savings held by SMSFs. This study adds to the relatively limited research on SMSFs
through an examination of the investment decisions of SMSF trustees over the period
prior to, during and after the 2008 global financial crisis.
Anecdotal evidence suggests that SMSFs out-performed other superannuation
providers during the 2008 global financial crisis, largely due to the high cash
weightings within SMSFs. This study investigates whether or not there is evidence of
a consistent and appropriate investment strategy by SMSF trustees over the period
2005 to 2011, a period which encompasses a period of significant financial stress.
The investment transactions of a sample of SMSFs over the period 2005 to 2011
were analysed in order to allow for observations to be made regarding the timing and
nature of SMSF trustee investment decisions. The results of the analyses suggest that
there is little evidence of an appropriate investment approach adopted by SMSF
trustees. SMSFs tended to increase market risk exposure prior to the global financial
crisis, failed to take advantage of lower asset prices during the financial crisis and
adopted a more defensive investment approach in the period following the financial
crisis. The relationship between SMSF size and SMSF risk profile and trustee
investment decision-making was also investigated, finding that smaller SMSFs
tended to adopt the least appropriate investment approach and that only a weak
relationship exists between SMSF risk profile and the investment approach adopted
by the fund’s trustees. SMSFs within the sample also exhibited a number of
behavioural biases and heuristics, including loss aversion, representativeness and
cognitive dissonance.
The findings of this study suggest that greater attention from policymakers
and regulatory authorities on the investment decision-making of SMSF trustees may
be required and that further research on the prevalence and impact of behavioural
biases on SMSF trustees may be warranted.

iii
CERTIFICATION OF THESIS
I certify that the ideas, experimental work, results, analyses, software and
conclusions reported in this dissertation are entirely my own effort, except where
otherwise acknowledged. I also certify that the work is original and has not been
previously submitted for any other award, except where otherwise acknowledged.
……………………………….. ………………………………..
Signature of Candidate Date
ENDORSEMENT
……………………………….. ………………………………..
Signature of Supervisor Date

iv
ACKNOWLEDGEMENTS
I would like to thank my supervisor, Dr Peter Phillips, for his guidance,
encouragement and support throughout the course of my research and the preparation
of this thesis. Dr Phillips’ patience, motivation and deep knowledge of the topic were
essential components in the development of this thesis.
I would also like to thank my family - Liz, Jack and Kate - for being
incredibly patient and understanding during this project. Without your love and
support this undertaking would not have been possible.

v
TABLE OF CONTENTS
Abstract ii
Certification of Thesis iii
Acknowledgements iv
Table of Contents v
List of Tables x
CHAPTER 1 INTRODUCTION 1
1.1 Introduction .............................................................................................. 1
1.2 Existing Research on the SMSF Sector ................................................... 1
1.3 Research Objective................................................................................... 2
1.4 Significance of the Research .................................................................... 3
1.5 Scope of the Study ................................................................................... 5
1.6 Summary of Main Findings ..................................................................... 6
1.7 Structure of the Study .............................................................................. 7
1.8 Conclusion ............................................................................................... 7
CHAPTER 2 LITERATURE REVIEW 9
2.1 Introduction .............................................................................................. 9
2.2 The Australian Superannuation System ................................................. 10
2.2.1 The Superannuation Contributions Guarantee ........................... 10
2.2.2 Superannuation and Choice of Fund .......................................... 11
2.2.3 Active and Passive Investment Management ............................. 12
2.3 The Self-Managed Superannuation Sector ............................................ 13
2.3.1 The Investment Performance of SMSFs .................................... 14
2.3.2 SMSF Risk and Returns ............................................................. 15
2.4 Investor Behaviour ................................................................................. 16
2.4.1 Prospect Theory ......................................................................... 16
2.4.2 Mental Accounting and Other Cognitive Biases ........................ 17
2.4.3 Risk Aversion ............................................................................. 18
2.5 Regulation .............................................................................................. 19
2.5.1 Rules, Risk and Principles-Based Regulation ............................ 19
2.6 Investment Strategies and Theories ....................................................... 21
2.6.1 Modern Portfolio Theory ........................................................... 22

vi
2.6.2 Arbitrage Pricing Theory and the Efficient Market Hypothesis 23
2.7 The 2008 Global Financial Crisis and Trading Activity ........................ 25
2.7.1 The Trading Patterns of Individual Investors............................. 25
2.7.2 Trading Patterns, Investor Wealth and Asset Allocations ......... 26
2.7.3 The Financial Crisis and Changes in Investor Risk Appetites ... 27
2.8 Conclusion ............................................................................................. 28
CHAPTER 3 RESEARCH METHODOLOGY 30
3.1 Introduction ............................................................................................ 30
3.2 Research Questions and Hypotheses ...................................................... 30
3.3 Research Design ..................................................................................... 32
3.4 SMSF Sample Data ................................................................................ 34
3.4.1 The SMSF Sample in Detail ...................................................... 36
3.4.1.1 Sample transaction data in detail ................................... 37
3.4.1.2 Sample fund contents data in detail ............................... 40
3.5 Preparation of the Data........................................................................... 44
3.6 Ethical Considerations ........................................................................... 48
3.6 Summary ................................................................................................ 49
CHAPTER 4 RESULTS: TRADING BEHAVIOUR 2005 TO 2011 50
4.1 Introduction ............................................................................................ 50
4.2 SMSF Trustee Trading Behaviour from 2005 to 2011 .......................... 50
4.2.1 Statistical Differences in SMSF Trading Behaviour on an
Annual Basis .............................................................................. 51
4.2.1.1 Analysis of the variable COUNT on an annual basis .... 52
4.2.1.2 Analysis of the variable COUNT_AGGBUYS on an
annual basis ....................................................................... 54
4.2.1.3 Analysis of the variable COUNT_AGGSALES on an
annual basis ....................................................................... 55
4.2.1.4 Analysis of the variable VALUE_AGGBUYS on an
annual basis ....................................................................... 56
4.2.1.5 Analysis of the variable VALUE_AGGSALES on an
annual basis ....................................................................... 57
4.2.1.6 Analysis of the variable COUNT_DEFBUYS on an
annual basis ....................................................................... 58
4.2.1.7 Analysis of the variable COUNT_DEFSALES on an
annual basis ....................................................................... 59
4.2.1.8 Analysis of the variable VALUE_DEFBUYS on an
annual basis ....................................................................... 60

vii
4.2.1.9 Analysis of the variable VALUE_DEFSALES on an
annual basis ....................................................................... 61
4.2.1.10 Analysis of the variable NET_FLOWDEF on an annual
basis ................................................................................... 62
4.2.1.11 Analysis of the variable TRADE_VALUE on an annual
basis ................................................................................... 63
4.2.2 Statistical Differences in SMSF Trading Behaviour on a Per-
Period Basis ................................................................................ 63
4.2.2.1 Analysis of the variable COUNT on a per-period basis 65
4.2.2.2 Analysis of the variable COUNT_AGGBUYS on a per-
period basis ....................................................................... 67
4.2.2.3 Analysis of the variable COUNT_AGGSALES on a per-
period basis ....................................................................... 68
4.2.2.4 Analysis of the variable VALUE_AGGBUYS on a per-
period basis ....................................................................... 69
4.2.2.5 Analysis of the variable VALUE_AGGSALES on a per-
period basis ....................................................................... 70
4.2.2.6 Analysis of the variable COUNT_DEFBUYS on a per-
period basis ....................................................................... 71
4.2.2.7 Analysis of the variable COUNT_DEFSALES on a per-
period basis ....................................................................... 72
4.2.2.8 Analysis of the variable VALUE_DEFBUYS on a per-
period basis ....................................................................... 73
4.2.2.9 Analysis of the variable VALUE_DEFSALES on a per-
period basis ....................................................................... 74
4.2.2.10 Analysis of the variable NET_FLOWDEF on a per-
period basis ....................................................................... 75
4.2.2.11 Analysis of the variable TRADE_VALUE on a per-
period basis ....................................................................... 76
4.3 Conclusion ............................................................................................. 76
CHAPTER 5 RESULTS: TRADING BEHAVIOUR AND FUND SIZE 80
5.1 Introduction ............................................................................................ 80
5.2 Statistical Differences in SMSF Trading Behaviour Based on Fund
Size ...................................................................................................... 81
5.2.1 Analysis of the Variable COUNT Based on Fund Size ............. 84
5.2.2 Analysis of the Variable COUNT_AGGBUYS Based on Fund
Size ............................................................................................. 86
5.2.3 Analysis of the Variable COUNT_AGGSALES Based on Fund
Size ............................................................................................. 88

viii
5.2.4 Analysis of the Variable VALUE_AGGBUYS Based on Fund
Size ............................................................................................. 90
5.2.5 Analysis of the Variable VALUE_AGGSALES Based On Fund
Size ............................................................................................. 92
5.2.6 Analysis of the Variable COUNT_DEFBUYS Based on Fund
Size ............................................................................................. 94
5.2.7 Analysis of the Variable COUNT_DEFSALES Based on Fund
Size ............................................................................................. 96
5.2.8 Analysis of the Variable VALUE_DEFBUYS Based on Fund
Size ............................................................................................. 98
5.2.9 Analysis of the Variable VALUE_DEFSALES Based on Fund
Size ........................................................................................... 100
5.2.10 Analysis of the Variable NET_FLOWDEF Based on Fund
Size ........................................................................................... 102
5.2.11 Analysis of the Variable TRADE_VALUE Based on Fund
Size ........................................................................................... 104
5.3 Conclusion ........................................................................................... 106
CHAPTER 6 RESULTS: TRADING BEHAVIOUR AND FUND RISK
PROFILE 110
6.1 Introduction .......................................................................................... 110
6.2 Statistical Differences in SMSF Trading Behaviour Based on Risk
Profile ................................................................................................ 111
6.2.1 Analysis of the Variable COUNT Based on Fund Risk
Profile ....................................................................................... 116
6.2.2 Analysis of the Variable COUNT_AGGBUYS Based on Fund
Risk Profile .............................................................................. 118
6.2.3 Analysis of the Variable COUNT_AGGSALES Based on Fund
Risk Profile .............................................................................. 120
6.2.4 Analysis of the Variable VALUE_AGGBUYS Based on Fund
Risk Profile .............................................................................. 122
6.2.5 Analysis of the Variable VALUE_AGGSALES Based on Fund
Risk Profile .............................................................................. 124
6.2.6 Analysis of the Variable COUNT_DEFBUYS Based on Fund
Risk Profile .............................................................................. 126
6.2.7 Analysis of the Variable COUNT_DEFSALES Based on Fund
Risk Profile .............................................................................. 128
6.2.8 Analysis of the Variable VALUE_DEFBUYS Based On Fund
Risk Profile .............................................................................. 130
6.2.9 Analysis of the Variable VALUE_DEFSALES Based on Fund
Risk Profile .............................................................................. 132

ix
6.2.10 Analysis of the Variable NET_FLOWDEF Based on Fund
Risk Profile .............................................................................. 134
6.2.11 Analysis of the Variable TRADE_VALUE Based on Fund
Risk Profile .............................................................................. 136
6.3 Conclusion ........................................................................................... 138
CHAPTER 7 DISCUSSION 141
7.1 Introduction .......................................................................................... 141
7.2 Evidence that SMSF Trustees were Increasing Defensive Investment
Exposure Prior to the Financial Crisis .............................................. 142
7.3 Evidence that SMSF Trustees Increased their Exposure to Riskier
Investments as Markets Recovered Following the Financial Crisis . 143
7.4 Evidence that SMSF Trustees have Become More Conservative in
their Investment Approach Since the Global Financial Crisis .......... 144
7.5 SMSF Trading Behaviour Based on Fund Size ................................... 146
7.5.1 The Trading Behaviour of Small SMSFs ................................. 147
7.5.2 The Trading Behaviour of Medium-Sized SMSFs .................. 147
7.5.3 The Trading Behaviour of Large SMSFs ................................. 147
7.5.4 Summary of Fund Size and Trading Behaviour ....................... 148
7.6 SMSF Trading Behaviour Based on Fund Risk Profile ....................... 149
7.6.1 The Trading Behaviour of Aggressive SMSF Trustees ........... 149
7.6.2 The Trading Behaviour of Moderate Risk SMSF Trustees ..... 150
7.6.3 The Trading Behaviour of Conservative SMSF Trustees ........ 151
7.6.4 Summary of Fund Risk Profile and Trading Behaviour .......... 151
7.7 Conclusion ........................................................................................... 152
CHAPTER 8 CONCLUSION 154
8.1 Introduction .......................................................................................... 154
8.2 Empirical Findings ............................................................................... 155
8.3 Theoretical and Policy Implications..................................................... 158
8.4 Recommendations for Future Research ............................................... 160
8.5 Conclusion ........................................................................................... 161
8.6 References ............................................................................................ 163

x
List of Tables
Table 3.1 List of investment transaction types in SMSF sample data ................................... 38
Table 3.2 Eligible SMSF investment transactions within the sample data ............................ 39
Table 3.3 Summary of eligible transaction types ................................................................... 40
Table 3.4 Asset classes within quarterly SMSF contents data ............................................... 41
Table 3.5 Total SMSF sample assets at the end of each quarter ............................................ 42
Table 3.6 Quarterly totals of individual asset classes within the SMSF data ........................ 43
Table 3.7 Definition of variables used in the analysis ........................................................... 45
Table 3.8 Sample funds grouped according to size as at 1 Jan 2005 ..................................... 47
Table 3.9 Sample funds grouped according to asset allocation as at 1 Jan 2005 ................... 47
Table 4.1 Monthly means of variables for each year from 2005 to 2011 .............................. 51
Table 4.2 Test for statistical differences in the monthly average number of investment
transactions (COUNT) from 2005 to 2011 (p = 0.05) ................................................... 53
Table 4.3 Test for statistical differences in the monthly average number of aggressive
purchase transactions (COUNT_AGGBUYS) from 2005 to 2011 (p = 0.05) .............. 54
Table 4.4 Test for statistical differences in the monthly average number of aggressive sales
transactions (COUNT_AGGSALES) from 2005 to 2011 (p = 0.05) ............................ 55
Table 4.5 Test for statistical differences in the monthly average dollar value of aggressive
purchase transactions (VALUE_AGGBUYS) from 2005 to 2011 (p = 0.05)............... 56
Table 4.6 Test for statistical differences in the monthly average dollar value of aggressive
sales transactions (VALUE_AGGSALES) from 2005 to 2011 (p = 0.05) ................... 57
Table 4.7 Test for statistical differences in the monthly average number of defensive
purchase transactions (COUNT_DEFBUYS) from 2005 to 2011 (p = 0.05) ............... 58
Table 4.8 Test for statistical differences in the monthly average number of defensive sales
transactions (COUNT_DEFSALES) from 2005 to 2011 (p = 0.05) ............................. 59
Table 4.9 Test for statistical differences in the monthly average dollar value of defensive
purchase transactions (VALUE_DEFBUYS) from 2005 to 2011 (p = 0.05) ................ 60
Table 4.10 Test for statistical differences in the monthly average dollar value of defensive
sales transactions (VALUE_DEFSALES) from 2005 to 2011 (p = 0.05) .................... 61
Table 4.11 Test for statistical differences in the monthly average net flow of money into
defensive assets (NET_FLOWDEF) from 2005 to 2011 (p = 0.05) ............................. 62
Table 4.12 Test for statistical differences in the monthly average total trade value of all
investment transactions (TRADE_VALUE) from 2005 to 2011 (p = 0.05) ................. 63
Table 4.13 Monthly means of variables for each period from 2005 to 2011 ......................... 64
Table 4.14 Test for statistical differences in the monthly average number of investment
transactions (COUNT) between Periods 1, 2 and 3 (p = 0.05) ..................................... 66

xi
Table 4.15 Test for statistical differences in the monthly average number of aggressive
purchase transactions (COUNT_AGGBUYS) between Periods 1, 2 and 3 (p = 0.05) . 67
Table 4.16 Test for statistical differences in the monthly average number of aggressive sales
transactions (COUNT_AGGSALES) between Periods 1, 2 and 3 (p = 0.05) ............... 68
Table 4.17 Test for statistical differences in the monthly average dollar value of aggressive
purchase transactions (VALUE_AGGBUYS) between Periods 1, 2 and 3 (p = 0.05) . 69
Table 4.18 Test for statistical differences in the monthly average dollar value of aggressive
sales transactions (VALUE_AGGSALES) between Periods 1, 2 and 3 (p = 0.05) ...... 70
Table 4.19 Test for statistical differences in the monthly average number of defensive
purchase transactions (COUNT_DEFBUYS) between Periods 1, 2 and 3 (p = 0.05) .. 71
Table 4.20 Test for statistical differences in the monthly average number of defensive sales
transactions (COUNT_DEFSALES) between Periods 1, 2 and 3 (p = 0.05) ................ 72
Table 4.21 Test for statistical differences in the monthly average dollar value of defensive
purchase transactions (VALUE_DEFBUYS) between Periods 1, 2 and 3 (p = 0.05) .. 73
Table 4.22 Test for statistical differences in the monthly average dollar value of defensive
sales transactions (VALUE_DEFSALES) between Periods 1, 2 and 3 (p = 0.05) ....... 74
Table 4.23 Test for statistical differences in the monthly average net flow of money into
defensive assets (NET_FLOWDEF) between Periods 1, 2 and 3 (p = 0.05) ................ 75
Table 4.24 Test for statistical differences in the monthly average total trade value of all
investment transactions (TRADE_VALUE) between Periods 1, 2 and 3 (p = 0.05) .... 76
Table 5.1 Monthly means of variables for group 1 funds (small funds) for each year from
2005 to 2011 .................................................................................................................. 81
Table 5.2 Monthly means of variables for group 2 funds (medium funds) for each year from
2005 to 2011 .................................................................................................................. 82
Table 5.3 Monthly means of variables for group 3 funds (large funds) for each year from
2005 to 2011 .................................................................................................................. 83
Table 5.4 Test for statistical differences in the monthly average number of investment
transactions (COUNT) from 2005 to 2011 for group 1 funds (small funds) (p = 0.05) 84
Table 5.5 Test for statistical differences in the monthly average number of investment
transactions (COUNT) from 2005 to 2011 for group 2 funds (medium funds) (p = 0.05)
....................................................................................................................................... 85
Table 5.6 Test for statistical differences in the monthly average number of investment
transactions (COUNT) from 2005 to 2011 for group 3 funds (large funds) (p = 0.05) 86
Table 5.7 Test for statistical differences in the monthly average number of aggressive
purchase transactions (COUNT_AGGBUYS) from 2005 to 2011 for group 1 funds
(small funds) (p = 0.05) ................................................................................................. 87

xii
Table 5.8 Test for statistical differences in the monthly average number of aggressive
purchase transactions (COUNT_AGGBUYS) from 2005 to 2011 for group 2 funds
(medium funds) (p = 0.05) ............................................................................................ 87
Table 5.9 Test for statistical differences in the monthly average number of aggressive
purchase transactions (COUNT_AGGBUYS) from 2005 to 2011 for group 3 funds
(large funds) (p = 0.05) ................................................................................................. 88
Table 5.10 Test for statistical differences in the monthly average number of aggressive sales
transactions (COUNT_AGGSALES) from 2005 to 2011 for group 1 funds (small
funds) (p = 0.05) ............................................................................................................ 89
Table 5.11 Test for statistical differences in the monthly average number of aggressive sales
transactions (COUNT_AGGSALES) from 2005 to 2011 for group 2 funds (medium
funds) (p = 0.05) ............................................................................................................ 89
Table 5.12 Test for statistical differences in the monthly average number of aggressive sales
transactions (COUNT_AGGSALES) from 2005 to 2011 for group 3 funds (large
funds) (p = 0.05) ............................................................................................................ 90
Table 5.13 Test for statistical differences in the monthly average dollar value of aggressive
purchase transactions (VALUE_AGGBUYS) from 2005 to 2011 for group 1 funds
(small funds) (p = 0.05) ................................................................................................. 91
Table 5.14 Test for statistical differences in the monthly average dollar value of aggressive
purchase transactions (VALUE_AGGBUYS) from 2005 to 2011 for group 2 funds
(medium funds) (p = 0.05) ............................................................................................ 91
Table 5.15 Test for statistical differences in the monthly average dollar value of aggressive
purchase transactions (VALUE_AGGBUYS) from 2005 to 2011 for group 3 funds
(large funds) (p = 0.05) ................................................................................................. 92
Table 5.16 Test for statistical differences in the monthly average dollar value of aggressive
sales transactions (VALUE_AGGSALES) from 2005 to 2011 for group 1 funds (small
funds) (p = 0.05) ............................................................................................................ 93
Table 5.17 Test for statistical differences in the monthly average dollar value of aggressive
sales transactions (VALUE_AGGSALES) from 2005 to 2011 for group 2 funds
(medium funds) (p = 0.05) ............................................................................................ 93
Table 5.18 Test for statistical differences in the monthly average dollar value of aggressive
sales transactions (VALUE_AGGSALES) from 2005 to 2011 for group 3 funds (large
funds) (p = 0.05) ............................................................................................................ 94
Table 5.19 Test for statistical differences in the monthly average number of defensive
purchase transactions (COUNT_DEFBUYS) from 2005 to 2011 for group 1 funds
(small funds) (p = 0.05) ................................................................................................. 95

xiii
Table 5.20 Test for statistical differences in the monthly average number of defensive
purchase transactions (COUNT_DEFBUYS) from 2005 to 2011 for group 2 funds
(medium funds) (p = 0.05) ............................................................................................ 95
Table 5.21 Test for statistical differences in the monthly average number of defensive
purchase transactions (COUNT_DEFBUYS) from 2005 to 2011 for group 3 funds
(large funds) (p = 0.05) ................................................................................................. 96
Table 5.22 Test for statistical differences in the monthly average number of defensive sales
transactions (COUNT_DEFSALES) from 2005 to 2011 for group 1 funds (small funds)
(p = 0.05) ....................................................................................................................... 97
Table 5.23 Test for statistical differences in the monthly average number of defensive sales
transactions (COUNT_DEFSALES) from 2005 to 2011 for group 2 funds (medium
funds) (p = 0.05) ............................................................................................................ 97
Table 5.24 Test for statistical differences in the monthly average number of defensive sales
transactions (COUNT_DEFSALES) from 2005 to 2011 for group 3 funds (large funds)
(p = 0.05) ....................................................................................................................... 98
Table 5.25 Test for statistical differences in the monthly average dollar value of defensive
purchase transactions (VALUE_DEFBUYS) from 2005 to 2011 for group 1 funds
(small funds) (p = 0.05) ................................................................................................. 99
Table 5.26 Test for statistical differences in the monthly average dollar value of defensive
purchase transactions (VALUE_DEFBUYS) from 2005 to 2011 for group 2 funds
(medium funds) (p = 0.05) ............................................................................................ 99
Table 5.27 Test for statistical differences in the monthly average dollar value of defensive
purchase transactions (VALUE_DEFBUYS) from 2005 to 2011 for group 3 funds
(large funds) (p = 0.05) ............................................................................................... 100
Table 5.28 Test for statistical differences in the monthly average dollar value of defensive
sales transactions (VALUE_DEFSALES) from 2005 to 2011 for group 1 funds (small
funds) (p = 0.05) .......................................................................................................... 101
Table 5.29 Test for statistical differences in the monthly average dollar value of defensive
sales transactions (VALUE_DEFSALES) from 2005 to 2011 for group 2 funds
(medium funds) (p = 0.05) .......................................................................................... 101
Table 5.30 Test for statistical differences in the monthly average dollar value of defensive
sales transactions (VALUE_DEFSALES) from 2005 to 2011 for group 3 funds (large
funds) (p = 0.05) .......................................................................................................... 102
Table 5.31 Test for statistical differences in the monthly average net flow of money into
defensive assets (NET_FLOWDEF) from 2005 to 2011 for group 1 funds (small funds)
(p = 0.05) ..................................................................................................................... 103

xiv
Table 5.32 Test for statistical differences in the monthly average net flow of money into
defensive assets (NET_FLOWDEF) from 2005 to 2011 for group 2 funds (medium
funds) (p = 0.05) .......................................................................................................... 103
Table 5.33 Test for statistical differences in the monthly average net flow of money into
defensive assets (NET_FLOWDEF) from 2005 to 2011 for group 3 funds (large
funds) (p = 0.05) .......................................................................................................... 104
Table 5.34 Test for statistical differences in the monthly average total trade value of all
investment transactions (TRADE_VALUE) from 2005 to 2011 for group 1 funds
(small funds) (p = 0.05) ............................................................................................... 105
Table 5.35 Test for statistical differences in the monthly average total trade value of all
investment transactions (TRADE_VALUE) from 2005 to 2011 for group 2 funds
(medium funds) (p = 0.05) .......................................................................................... 105
Table 5.36 Test for statistical differences in the monthly average total trade value of all
investment transactions (TRADE_VALUE) from 2005 to 2011 for group 3 funds
(large funds) (p = 0.05) ............................................................................................... 106
Table 6.1 Monthly means of variables for group A funds (aggressive funds) for each year
from 2005 to 2011 ....................................................................................................... 111
Table 6.2 Monthly means of variables for group M funds (moderate funds) for each year
from 2005 to 2011 ....................................................................................................... 113
Table 6.3 Monthly means of variables for group D funds (defensive funds) for each year
from 2005 to 2011 ....................................................................................................... 114
Table 6.4 Test for statistically significant differences in the monthly average number of
investment transactions (COUNT) from 2005 to 2011 for group A funds (aggressive
funds) (p = 0.05) .......................................................................................................... 116
Table 6.5 Test for statistically significant differences in the monthly average number of
investment transactions (COUNT) from 2005 to 2011 for group M funds (moderate
funds) (p = 0.05) .......................................................................................................... 117
Table 6.6 Test for statistically significant differences in the monthly average number of
investment transactions (COUNT) from 2005 to 2011 for group D funds (defensive
funds) (p = 0.05) .......................................................................................................... 117
Table 6.7 Test for statistically significant differences in the monthly average number of
aggressive purchase transactions (COUNT_AGGBUYS) from 2005 to 2011 for group
A funds (aggressive funds) (p = 0.05) ......................................................................... 118
Table 6.8 Test for statistically significant differences in the monthly average number of
aggressive purchase transactions (COUNT_AGGBUYS) from 2005 to 2011 for group
M funds (moderate funds) (p = 0.05) .......................................................................... 119

xv
Table 6.9 Test for statistically significant differences in the monthly average number of
aggressive purchase transactions (COUNT_AGGBUYS) from 2005 to 2011 for group
D funds (defensive funds) (p = 0.05) .......................................................................... 119
Table 6.10 Test for statistically significant differences in the monthly average number of
aggressive sales transactions (COUNT_AGGSALES) from 2005 to 2011 for group A
funds (aggressive funds) (p = 0.05) ............................................................................. 120
Table 6.11 Test for statistically significant differences in the monthly average number of
aggressive sales transactions (COUNT_AGGSALES) from 2005 to 2011 for group M
funds (moderate funds) (p = 0.05) ............................................................................... 121
Table 6.12 Test for statistically significant differences in the monthly average number of
aggressive sales transactions (COUNT_AGGSALES) from 2005 to 2011 for group D
funds (defensive funds) (p = 0.05) .............................................................................. 121
Table 6.13 Test for statistically significant differences in the monthly average dollar value of
aggressive purchase transactions (VALUE_AGGBUYS) from 2005 to 2011 for group
A funds (aggressive funds) (p = 0.05) ......................................................................... 122
Table 6.14 Test for statistically significant differences in the monthly average dollar value of
aggressive purchase transactions (VALUE_AGGBUYS) from 2005 to 2011 for group
M funds (moderate funds) (p = 0.05) .......................................................................... 123
Table 6.15 Test for statistically significant differences in the monthly average dollar value of
aggressive purchase transactions (VALUE_AGGBUYS) from 2005 to 2011 for group
D funds (defensive funds) (p = 0.05) .......................................................................... 123
Table 6.16 Test for statistically significant differences in the monthly average dollar value of
aggressive sales transactions (VALUE_AGGSALES) from 2005 to 2011 for group A
funds (aggressive funds) (p = 0.05) ............................................................................. 124
Table 6.17 Test for statistically significant differences in the monthly average dollar value of
aggressive sales transactions (VALUE_AGGSALES) from 2005 to 2011 for group M
funds (moderate funds) (p = 0.05) ............................................................................... 125
Table 6.18 Test for statistically significant differences in the monthly average dollar value of
aggressive sales transactions (VALUE_AGGSALES) from 2005 to 2011 for group D
funds (defensive funds) (p = 0.05) .............................................................................. 125
Table 6.19 Test for statistically significant differences in the monthly average number of
defensive purchase transactions (COUNT_DEFBUYS) from 2005 to 2011 for group A
funds (aggressive funds) (p = 0.05) ............................................................................. 126
Table 6.20 Test for statistically significant differences in the monthly average number of
defensive purchase transactions (COUNT_DEFBUYS) from 2005 to 2011 for group M
funds (moderate funds) (p = 0.05) ............................................................................... 127

xvi
Table 6.21 Test for statistically significant differences in the monthly average number of
defensive purchase transactions (COUNT_DEFBUYS) from 2005 to 2011 for group D
funds (defensive funds) (p = 0.05) .............................................................................. 127
Table 6.22 Test for statistically significant differences in the monthly average number of
defensive sales transactions (COUNT_DEFSALES) from 2005 to 2011 for group A
funds (aggressive funds) (p = 0.05) ............................................................................. 128
Table 6.23 Test for statistically significant differences in the monthly average number of
defensive sales transactions (COUNT_DEFSALES) from 2005 to 2011 for group M
funds (moderate funds) (p = 0.05) ............................................................................... 129
Table 6.24 Test for statistically significant differences in the monthly average number of
defensive sales transactions (COUNT_DEFSALES) from 2005 to 2011 for group D
funds (defensive funds) (p = 0.05) .............................................................................. 129
Table 6.25 Test for statistically significant differences in the monthly average dollar value of
defensive purchase transactions (VALUE_DEFBUYS) from 2005 to 2011 for group A
funds (aggressive funds) (p = 0.05) ............................................................................. 130
Table 6.26 Test for statistically significant differences in the monthly average dollar value of
defensive purchase transactions (VALUE_DEFBUYS) from 2005 to 2011 for group M
funds (moderate funds) (p = 0.05) ............................................................................... 131
Table 6.27 Test for statistically significant differences in the monthly average dollar value of
defensive purchase transactions (VALUE_DEFBUYS) from 2005 to 2011 for group D
funds (defensive funds) (p = 0.05) .............................................................................. 131
Table 6.28 Test for statistically significant differences in the monthly average dollar value of
defensive sales transactions (VALUE_DEFSALES) from 2005 to 2011 for group A
funds (aggressive funds) (p = 0.05) ............................................................................. 132
Table 6.29 Test for statistically significant differences in the monthly average dollar value of
defensive sales transactions (VALUE_DEFSALES) from 2005 to 2011 for group M
funds (moderate funds) (p = 0.05) ............................................................................... 133
Table 6.30 Test for statistically significant differences in the monthly average dollar value of
defensive sales transactions (VALUE_DEFSALES) from 2005 to 2011 for group D
funds (defensive funds) (p = 0.05) .............................................................................. 133
Table 6.31 Test for statistically significant differences in the monthly average net flow of
money into defensive assets (NET_FLOWDEF) from 2005 to 2011 for group A funds
(aggressive funds) (p = 0.05) ....................................................................................... 134
Table 6.32 Test for statistically significant differences in the monthly average net flow of
money into defensive assets (NET_FLOWDEF) from 2005 to 2011 for group M funds
(moderate funds) (p = 0.05)......................................................................................... 135

xvii
Table 6.33 Test for statistically significant differences in the monthly average net flow of
money into defensive assets (NET_FLOWDEF) from 2005 to 2011 for group D funds
(defensive funds) (p = 0.05) ........................................................................................ 135
Table 6.34 Test for statistically significant differences in the monthly average total trade
value of all investment transactions (TRADE_VALUE) from 2005 to 2011 for group A
funds (aggressive funds) (p = 0.05) ............................................................................. 136
Table 6.35 Test for statistically significant differences in the monthly average total trade
value of all investment transactions (TRADE_VALUE) from 2005 to 2011 for group M
funds (moderate funds) (p = 0.05) ............................................................................... 137
Table 6.36 Test for statistically significant differences in the monthly average total trade
value of all investment transactions (TRADE_VALUE) from 2005 to 2011 for group D
funds (defensive funds) (p = 0.05) .............................................................................. 137

1
CHAPTER 1
INTRODUCTION
1.1 Introduction
The Self-Managed Superannuation sector plays an important role in the
Australian retirement system, with nearly $500 billion of assets held within Self-
Managed Superannuation Funds (SMSFs) (Australian Taxation Office 2013). Given
the importance of the SMSF sector within the context of the Australian retirement
system, it is vital that policymakers, SMSF members and SMSF trustees are fully
informed regarding the ability of SMSFs to meet member retirement needs,
regardless of the prevailing state of the economy and financial markets. Whether or
not SMSFs are able to fulfil the role of meeting member retirement needs depends
largely on the investment decisions of fund trustees. Trustee investment decisions are
of even greater importance during periods of financial stress and volatility, where
inappropriate investment strategies and decisions can result in the erosion of member
retirement assets. This study considers the impact of the 2008 global financial crisis
on the SMSF sector. This study undertakes the first investigation into the investment
trading behaviour of SMSF trustees in the period leading up to, during, and after the
2008 financial crisis.
1.2 Existing Research on the SMSF Sector
The Australian superannuation system has been the subject of relatively
extensive research, although the SMSF sector has received substantially less
attention. This study adds to the growing body of research focused on the SMSF
sector, with a particular focus on SMSF trustee investment decisions and the
outcomes resulting from such decisions. Investor behaviour, decision-making and the
various theories of investment management have a long history of research, however
the SMSF sector has only attracted modest attention with regard to these avenues of
investigation.

2
The individual investment decisions of SMSF trustees are the key
determinant of whether or not SMSFs are able to meet the primary requirement for
SMSFs; that of meeting the retirement income needs of fund members. In this regard
an assessment of the trading behaviour of SMSF trustees provides an approach for
determining the likelihood of fund trustees fulfilling this requirement. This is
particularly relevant over the period 2008 to 2009, which includes the global
financial crisis. Research has shown that other investors traded more frequently
during the crisis (Kallberg, Liu & Wang 2012; Tang et al. 2011), behaviour which
may have been repeated by SMSF trustees. It has also been shown that investor
wealth (Yamaguchi 2006) and the asset allocation decisions by investors have an
impact on the level of investor trading activity (Mitchell et al. 2007). The extensive
literature on the various theories of investment management and investor behaviour
is also relevant to the SMSF sector and this study. This includes investment theories
such as Modern Portfolio Theory, Arbitrage Pricing Theory and the Efficient
Markets Hypothesis; concepts which all offer SMSF trustees potential investment
strategies to adopt in the management of the fund’s assets. Behavioural finance
theories and concepts such as Prospect Theory, loss aversion, overconfidence,
representativeness and risk aversion are also of interest, given that the investment
outcomes of SMSFs are simply a result of the decisions of the individual trustee(s).
This study explores these relationships within the context of the Australian SMSF
industry.
1.3 Research Objective
The objective of this study is to examine the trading behaviour of Australian
SMSFs within the context of the 2008 global financial crisis. Specifically, the study
investigates whether or not SMSF trustee investment decision-making was
appropriate, given the period of substantial investment stress which accompanied the
financial crisis. This is done by comparing the trading behaviour of SMSF trustees
during the crisis with their trading behaviour both prior to and following the crisis.

3
To assist with this process a number of research questions were developed to
be answered through the analysis of SMSF trustee trading behaviour over the period
2005 to 2011. These questions are:
1. Did SMSFs (correctly) increase their exposure to cash and other defensive
investments in the period leading up to the global financial crisis?
2. Did SMSFs (correctly) increase their exposure to market risk assets as stock
markets bottomed and recovered in 2009?
3. Have SMSFs become more conservative in their investment approach since the
global financial crisis?
4. Did larger or less risk-averse SMSFs behave differently as compared to smaller or
more conservative SMSFs over the course of the global financial crisis?
To assist in answering these questions, a number of hypotheses regarding the
trading behaviour of SMSF trustees were developed. These hypotheses are based on
the initial assumption that SMSF trustees within the sample did not make appropriate
investment decisions prior to, during and following the financial crisis, and that there
is no significant difference in the trading behaviour of SMSF trustees based on risk
profile or fund size. These hypotheses are outlined in further detail in Chapter 2.
1.4 Significance of the Research
The level of assets now held within the SMSF sector accounts for over a third
of all Australian superannuation savings (Australian Taxation Office 2013) . Over
the period June 2000 to June 2011 the SMSF sector was the fastest growing segment
within the superannuation system, with an increase in assets over that period of
461% (KPMG ACFS 2011). There is little evidence to suggest any imminent
decrease in the popularity of SMSFs among Australians, with the establishment of
41,017 SMSFs in the 2012 financial year, the second-highest annual number of new
SMSFs since the introduction of legislation permitting SMSFs (Australian Taxation
Office 2013). Given the importance of the SMSF sector within the overall context of
Australian retirement planning, it is desirable that the assets held within the sector
are managed as appropriately as possible. In this regard it is important that the
relevant legislation covering the SMSF sector and the approach taken by the

4
appropriate regulatory bodies act together to ensure the integrity of the SMSF sector.
Academic and other research can play a role in assisting policy-makers to determine
the most appropriate rules, regulations and strictures under which the SMSF sector
must operate, yet to-date there has been comparatively little research into the SMSF
sector. This study seeks to add to the body of literature concerning the SMSF sector,
with a specific emphasis on the behaviour of SMSF trustees in times of financial
stress. This complements other research which has examined the behaviour,
performance, investment approach and activities of SMSFs (Phillips 2007, 2009,
2011a, 2011b; Phillips, Baczynski & Teale 2009a, 2009b; Phillips, Cathcart & Teale
2007).
A distinguishing feature of this study is that it considers the trading decisions
of SMSF trustees over a period of time, a period which includes the 2008 global
financial crisis. While other studies have examined the investment decisions of
SMSF trustees, these have focused on the investment exposure of SMSFs at a point
in time. While such an approach can provide insights into the investment choices of
SMSF trustees at that point in time, it does not allow for conclusions to be drawn
regarding changes in SMSF trustee behaviour or decision-making over time. The
time period covered by this study offers an opportunity to investigate SMSF trustee
behaviour across a varied set of economic and financial circumstances. This period
encompasses the relatively strong market returns in those years leading up to the
financial crisis, the severe bear market of 2008-09 and the gradual recovery in those
years following the financial crisis. This set of varied economic and market
conditions may allow for a robust set of conclusions to be drawn regarding the
investment trading behaviour of SMSF trustees.
SMSFs have been generally viewed as having weathered the financial crisis
better than other superannuation providers such as industry and retail superannuation
funds. This out-performance was largely due to the comparatively larger cash
holdings of SMSFs as compared to the other superannuation structures (Phillips,
Baczynski & Teale 2009b). However there has been no investigation as to whether or
not this high allocation to cash was a result of superior investment decision-making
by SMSF trustees or simply a result of good fortune. The results of this study may

5
provide an insight into the existence or otherwise of appropriate investment choices
by SMSF trustees.
1.5 Scope of the Study
The scope of the study is restricted to the time period 2005 to 2011 and
concerns only the investment transactions of a sample of SMSFs. The impact of the
2008 financial crisis on the wider superannuation sector will not be discussed, nor
will this study address matters such as the relevance of SMSF trustee demographics
or the impact of regulatory change on the SMSF sector.
The study seeks to address the primary research question of whether or not
there is evidence that trustees of Australian SMSFs employed appropriate investment
strategies over the period 2005 to 2011. Appropriate investment strategies would be
those that resulted in decreased investment risk exposure on the eve of the financial
crisis, and those that resulted in increased investment risk exposure as markets
bottomed and subsequently recovered following the financial crisis. Anecdotal
evidence and recent research appears to indicate that SMSFs generally out-performed
other superannuation providers over the period encompassing the financial crisis
(Phillips, Baczynski & Teale 2009b). The results of the study may clarify whether or
not this outperformance was due to luck or the superior investment approach of
SMSF trustees compared to alternative superannuation providers.
The study analyses the investment decisions of SMSF trustees as a whole and
also on the basis of SMSF size and risk profile. In this regard SMSFs within the
sample are segmented according to the level of assets held within each fund on 1
January 2005 (fund size) and the level of exposure of each fund to higher risk assets
as at 1 January 2005 (risk profile). This segmentation allows for conclusions to be
drawn regarding the impact of fund size or risk profile on the investment decisions of
fund trustees and also whether or not trustees of larger or more aggressive funds
behaved differently to trustees of smaller or more defensive funds.

6
1.6 Summary of Main Findings
The results of the analysis of the investment trading behaviour of SMSF
trustees within the sample tends to suggest that trustees were not making appropriate
investment decisions over the period 2005 to 2011. There is little evidence that
trustees acted to reduce market exposure prior to the onset of the financial crisis; nor
is there evidence that trustees acted to take advantage of low asset prices as equity
markets bottomed in early 2009 (although when segmented by size, there is evidence
that medium-sized funds within the sample were more likely to take advantage of
low asset prices). There is also evidence that SMSFs within the sample adopted a
more conservative investment approach in that period following the financial crisis,
behaviour which may not have been appropriate given the recovery in equity markets
following the crisis. The results of the study suggest that the apparent
outperformance by SMSFs over alternative superannuation structures during the
financial crisis may be more a result of good fortune rather than good judgement.
SMSFs within the sample appeared to hold high levels of cash during those years
when market returns were positive leading up to the crisis (in 2005, 2006 and 2007)
but there is little evidence to indicate an increase in cash holdings over that period,
activity which would suggest that SMSF trustees were appropriately reducing their
market exposure in the lead up to a significant bear market. SMSF trustees within the
sample also tended to make investment decisions in a reactive manner; that is, they
adopted a more conservative approach following the crisis, a period which saw most
asset markets record strong growth. When considered on the basis of fund risk
profile, the results indicate that SMSF trustee risk profiles change over time,
seemingly in response to changes in investment conditions. The analysis also
provides information with regards to the ideal size of a SMSF, suggesting that
smaller SMSFs tended to adopt the least appropriate investment strategy over the
period 2005 to 2011.
The results of the analysis also suggest the existence of a number of
behavioural biases within the sample group. These include loss aversion and regret
avoidance, where SMSF trustees appeared unwilling to sell assets which would have
fallen in value during the financial crisis. SMSF trustees within the sample also
exhibited other biases and heuristics such as cognitive dissonance, representativeness

7
and the availability heuristic. SMSFs within the sample tended to behave as though
they expected the prevailing set of market conditions to continue indefinitely and
appeared to place too great a weight on recent events and the likelihood of these
events re-occurring in the future. The findings of this study suggest that greater focus
on the investment related aspects of a trustee’s role may be appropriate, rather than
the existing legislative and regulatory focus on SMSF compliance and
administration.
1.7 Structure of the Study
The study is organised as follows. The next chapter, Chapter 2, presents a
review of the literature relevant to the SMSF sector and this study in particular. This
review includes key concepts and theories such as investor behaviour, theories of
investment management and the impact of the global financial crisis on investor
trading patterns. Chapter 3 describes the data that forms the basis of this study and
outlines the analysis of this data. The study is based on a sample of SMSFs and the
nature of the data and the limitations of the sample data are also outlined in this
chapter. Chapter 3 also outlines the research objective, questions and hypotheses
which form the basis for the study. Chapters 4, 5 and 6 present the results of the
analysis. Chapter 4 presents the results of the analysis of the SMSF sample as a
whole, while Chapters 5 and 6 present the results of the analysis on the basis of fund
segmentation according to size and risk profile respectively. Chapter 7 discusses the
results of the analysis presented in Chapters 4, 5 and 6. The study concludes with
Chapter 8, which summarises the key findings, provides answers to the research
questions identified in Chapter 3, identifies any implications resulting from the study
and outlines areas for potential further research relating to the SMSF sector.
1.8 Conclusion
The SMSF sector is an important component of Australia’s retirement
system, yet there has been comparatively little empirical research into the ability of
SMSFs to meet the requirements of their members and satisfy the policy objectives
of law-makers and regulatory bodies. This study aims to add to the body of
knowledge concerning the SMSF sector, with a specific emphasis on the investment

8
decision-making of SMSF trustees. This is done within the context of the time period
encompassing prior to, during and after the 2008 global financial crisis. Theoretical
areas which are relevant to the study include investment strategies and decision-
making, regulatory theory, and behavioural finance. We now proceed to Chapter 2
where the literature related to these theoretical areas and their relevancy to the SMSF
sector will be surveyed.

9
CHAPTER 2
LITERATURE REVIEW
2.1 Introduction
The Australian superannuation sector is now an entrenched and vital
component of the Australian financial system. With over $1.5 trillion of assets, the
sector is an important source of investment capital and plays a key role in the
retirement funding plans of a majority of retired and working Australians (Cooper
Review 2010). With general support from all major Australian political parties, it is
likely that the sector will only grow in scale and importance in coming years. Given
this significant role within the Australian financial system, it is no surprise that the
sector has attracted a significant level of academic research. On the other hand, the
SMSF sector has attracted far less attention, a surprising situation given that over a
third of superannuation assets are held within SMSFs (Cooper Review 2010).
As is the case with much of the financial sector, SMSFs operate within a
strict regulatory framework, largely underpinned by federal government statute.
These include the Superannuation Guarantee Administration Act 1992 and the
Superannuation Industry (Supervision) Act 1993. It is important that this regulatory
environment is considered when assessing the nature of the SMSF sector or the
behaviour of participants within the industry. As SMSFs are fundamentally the
retirement savings investment vehicle for one or more fund members, the investment
decisions of fund trustees are an important determinant of whether or not SMSFs are
in a position to meet the needs of fund members. The behaviour and decision-making
of SMSF trustees can therefore be assessed with reference to the body of financial
and economic theories and models which seek to explain the investment decision-
making of investors.
This chapter provides the theoretical basis for a study of the investment
decision-making of SMSF trustees, through a review of the literature relevant to

10
SMSFs and investment decision-making. This chapter is organised as follows.
Section 2.2 outlines literature relevant to the general Australian superannuation
system, detailing the history and purpose of superannuation. Section 2.3 details
current research relevant to the SMSF sector in particular. This section serves to
outline both the importance of the SMSF sector, and to illustrate the relevant paucity
of published academic research regarding the SMSF sector. Section 2.4 highlights
the theories of investor behaviour and decision-making that are relevant to the SMSF
sector, while Section 2.5 considers the regulatory framework within which the SMSF
sector operates. Section 2.6 discusses the theoretical investment strategies that may
be utilised by SMSF trustees, and finally, Section 2.7 focuses on those studies which
have considered investor trading purely within periods of financial stress, including
the global financial crisis of 2007-08.
2.2 The Australian Superannuation System
The Australian superannuation sector is now a permanent and important
fixture within the Australian retirement income system. Superannuation in Australia
can be traced as far back as the mid-19th century, although at that stage it was
restricted to certain occupations, most notably banking and the public sector
(Bateman 2002). A National Superannuation Scheme was debated in the years
following World War II and was outlined and recommended in the Hancock Report
(National Superannuation Commission of Enquiry 1976), though this was later
rejected by the Fraser government (Carmichael & Plowman 1985). It was not until
1992 and the implementation of the Superannuation Guarantee Administration Act
(Cwlth) and the subsequent Superannuation Industry (Supervision) Act (Cwlth) that
superannuation became recognisable as the system we know it today (Australian
Treasury 2001). The introduction of superannuation was intended to assist
individuals in saving for their eventual retirement through compulsory employer
contributions to an eligible employee’s superannuation account.
2.2.1 The Superannuation Contributions Guarantee
The defining characteristic of the current Australian superannuation system
is the effective requirement that employers contribute a certain percentage of an

11
eligible employee’s salary, over and above their actual wage, to a specified
superannuation fund, known as the Superannuation Guarantee Charge (SGC)
(Morling & Subbaraman 1995). This was a significant change to the superannuation
system, which until that point had been predominately voluntary in nature and
covered only a small proportion of employees. The SGC effectively penalised those
employers which did not make superannuation contributions for employees at the
minimum prescribed rate. Commencing in 1992-93 at 4 per cent of the salary of
eligible employees of firms with payroll in excess of $1,000,000 (and 3 per cent for
firms with payroll below that level), the minimum contributions rate has increased to
be 9.25 per cent as of 1 July 2013 as per the Superannuation Guarantee
(Administration) Amendment Act (Cwlth). In 1995-96 the federal government had
announced plans to increase the superannuation contributions rate over time,
reaching a minimum of 15 per cent for most employees by 2002-03, however this
pledge was not upheld by subsequent governments (Morling & Subbaraman 1995).
Despite the failure to increase the minimum superannuation contributions rate as
promised, the superannuation sector grew in size as the number of eligible employees
increased over time. As the superannuation industry grew in both size and
importance, it attracted an increasing level of attention from researchers. Not all
conclusions drawn were complimentary to the concept of involuntary
superannuation. Freebairn (1998) considered the impact of superannuation on the
labour market under both a flexible and rigid wage model, concluding that the
minimum superannuation contributions requirement acted much like a tax, with
people on lower incomes worse off than in the absence of the minimum contributions
requirement. A later paper by the same author assessed the long run labour market
effects of the SGC, finding that wages and employment both fall in the presence of
the SGC (Freebairn 2004).
2.2.2 Superannuation and Choice of Fund
Other researchers have focused on the issue of choice of superannuation fund,
which came to the fore following the passage of the Superannuation Legislation
Amendment (Choice of Superannuation Funds) Act 1993 (Cwlth). This legislation
was significant in the development of the superannuation industry, in that it allowed
the majority of employees to select their own superannuation fund, rather than be

12
restricted to a union or employer selected fund. Fry, Heaney and McKeown (2007)
suggested that few fund members would switch their superannuation following
passage of the legislation, a view confirmed by Clare (2006) who found that
switching rates were lower than had been expected prior to the implementation of the
legislation. Fry et al. (2007) did however expect that the SMSF sector would be a
beneficiary of the new freedom of employees to select their superannuation fund,
although this change was downplayed by Clare (2006), who found that the rate of
establishment of SMSFs actually decreased in the years immediately following the
implementation of superannuation choice. Choice of fund in terms of switching from
a defined benefit plan to a defined contribution plan has also been the subject of
investigation, with research showing that fund members did not necessarily act
rationally in making the decision to switch funds and that there was a correlation
between demographics and the choice made by the fund member (Clark-Murphy &
Gerrans 2001, 2004; Clark-Murphy, Kristofferson & Gerrans 2002). It was found
that younger males with lower incomes tended to find the decision to switch
superannuation funds an easy one, while women and older age groups tended to find
the decision comparatively more difficult. Overall the evidence is somewhat mixed
as to whether or not the advent of superannuation choice resulted in better outcomes
for fund members.
2.2.3 Active and Passive Investment Management
As superannuation is essentially a structure for holding and managing assets
set aside to fund retirement, the theoretical and empirical aspects of portfolio
management theory and practice play an important role in the ability of
superannuation to meet the retirement income needs of fund members (Phillips
2007). The question of active versus passive investment management has been of
considerable interest to researchers, not only in the context of superannuation but
also with regards to the management of all tradeable investments (active investment
management involves making deliberate investment decisions so as to outperform an
identified benchmark, while passive management does not try to outperform the
benchmark (Evanson Asset Management 2011)). The literature reports extensive
investigations into the relative merits of active and passive investment strategies,
with arguments made both in favour of active management (Cremers & Petajisto
13
2009; Grauer, Hakansson & Shen 1990) and passive management styles (Barber &
Odean 2000; French 2008; Malkiel 2003b). A related debate concerns the relative
importance of asset allocation as compared to asset selection. It has been argued that
asset allocation is the primary determinant of returns, with asset selection playing a
secondary role (Ibbotson & Kaplan 2000), an argument that has been viewed as
providing support to advocates of passive investment management.
This path of investigation has also been applied to the investment
performance of Australian superannuation funds. Early work by Drew and Stanford
(2001) showed that fund trustees could earn higher risk-adjusted returns with a
passive rather than active asset selection strategy. Later work reinforced the notion
that a passive investment management style was in the fund members’ best interests
(Drew, Stanford & Taranenko 2001). The relationship between past and future
performance has also been considered. Researchers found that there was no
indication that past performance was a useful predictor of future returns (Drew,
Stanford & Taranenko 2001; Drew, Stanford & Veeraraghavan 2002).
2.3 The Self-Managed Superannuation Sector
As a sub-sector of the Australian superannuation industry, SMSFs have not
attracted the same level of research attention as that focused on the retail and
industry superannuation funds. As the level of assets invested through SMSFs has
grown however, so has the interest of researchers, although it was not until 2004 that
the first paper specifically focused on the SMSF sector was published. In this initial
paper Valentine (2004) largely concentrated on the regulation of SMSFs,
recommending that the investment strategies of SMSF be more closely regulated, a
stance somewhat at odds with the raison d’etre of SMSFs.
Phillips (2007) published a more detailed consideration of SMSFs, analysing
the microstructure of a sample of 41 SMSFs. Although the small SMSF sample size
was acknowledged, the analysis still provided the first detailed published
investigation of the contents of SMSFs and of the biases and investment choices of
SMSF trustees. Of particular interest was the observation that SMSFs adopted a ‘buy
and hold’ methodology, which is a variant of a passive investment strategy. This

14
hints that, despite the ‘self-managed’ moniker of SMSFs, few trustees may actually
practice active management of their SMSF assets.
2.3.1 The Investment Performance of SMSFs
The investment performance of SMSFs is important, as the introduction of
SMSFs essentially allowed for the transfer of investment decision-making
responsibility away from professional investment managers in industry and retail
superannuation funds and into the hands of the trustees of each SMSF. As SMSF
trustees are not required to meet any educational qualification requirements or
possess any minimum level of investment expertise, it may be reasonable to assume
that the investment performance of SMSFs would lag their larger counterparts. The
first investigation of the investment performance of SMSFs was undertaken by
Phillips et al. (2007). Based on sample of 40 SMSFs, the authors found that SMSFs
not only suffered from a lack of diversification, but also underperformed the broader
market index on a risk-adjusted basis. Later research considered the performance of
SMSFs specifically over the period 2007-08 (Phillips, Baczynski & Teale 2009b). In
this instance it was found that SMSF investment performance over the period
compared favourably with retail superannuation funds, although the risk-adjusted
equity component of SMSFs underperformed the broader market index. It was
suggested that the high cash levels of SMSFs may have insulated SMSFs from the
steep equity market falls during 2007-08 to a certain extent, although the question of
whether or not this was a deliberate strategy by SMSF trustees leading into the bear
market (being a market fall in excess of 20%) was not addressed. If SMSF trustees
deliberately increased cash levels leading up to the GFC, this would potentially
indicate the existence of a well-timed investment strategy by SMSF trustees to
reduce market exposure immediately prior to a significant bear market. However, if
SMSF trustees have consistently over-weighted cash regardless of the economic
environment and stock market returns, this may indicate that the relatively
favourable investment performance of SMSFs through 2007-08 was largely due to
luck.
This issue forms the rationale for a number of the questions addressed
through this thesis. Firstly, with the benefit of hindsight, were SMSF trustees making
15
appropriate investment decisions leading up to the 2008 financial crisis? For
example, it would have been appropriate for SMSF trustees to be reducing their
equities exposure and increasing their exposure to defensive assets (cash and fixed-
interest investments) in the period prior to the stock market falls in 2008-09. This
leads to a second question to be answered by the dissertation: do SMSF trustee
investment decisions over the period under investigation show evidence of an
appropriate and consistent investment strategy? For example, once the Australian
stock market ‘bottomed’ in 2009, it would have been appropriate at that time for
SMSF trustees to increase their market exposure and reduce their level of defensive
assets, thereby benefiting from the recovery in equity markets in 2009-10.
Given the size of the SMSF sector, where SMSF trustees are now responsible
for the management of over a third of total Australian retirement savings, the issue of
whether or not SMSF trustees are making appropriate investment decisions is worthy
of further consideration. Poor investment decision-making by SMSF trustees
potentially poses a threat to the efficient operation of Australian capital markets,
given the level of assets now controlled by SMSF trustees (Phillips, Baczynski &
Teale 2009b). It is easy to envisage competing superannuation providers such as
retail and industry funds making claims that the largely unregulated investment
decision-making process of SMSF trustees poses a risk to member’s retirement
savings, thereby requiring a greater level of regulatory scrutiny and perhaps the
eventual erosion of the advantages which initially attracted SMSF members to the
sector in the first place.
2.3.2 SMSF Risk and Returns
While the investment performance of SMSFs is important, this must be
assessed within the context of the level of investment risk adopted by SMSF trustees.
The ability of SMSFs to generate returns in excess of the equity risk premium has
been considered, with results showing, inter-alia, that SMSF returns were below the
riskless rate of interest (Phillips, Baczynski & Teale 2009a). This raises important
questions about the rationale for the existence of SMSFs and the ability of SMSF
trustees to adequately manage their assets. The risk/return trade-off and its relevance
within the SMSF sector has also attracted the attention of researchers. Phillips (2009)

16
considered whether larger SMSFs would have a higher allocation to risky assets than
smaller funds, finding that the size of the fund was irrelevant in determining SMSF
allocations to risky assets (this conclusion has a bearing on this study, which
considers whether or not larger SMSFs exhibited a different pattern of investment
trading behaviour as compared to smaller funds. Chapter 5 presents the results of the
analysis of SMSF trustee trading behaviour on the basis of fund size). The high cash
allocations of SMSFs were again noted, tying in with findings from earlier research
(Phillips, Baczynski & Teale 2009b). Phillips (2011a) determined the relative risk
coefficient of the average SMSF trustee, finding that SMSF trustees were too risk
averse, to the point where SMSF trustees would be unable to grow or maintain their
share of economic wealth. This raises further questions about the ability of SMSF
trustees to appropriately manage SMSF assets. A question which has not yet been
considered is the extent to which SMSF trustees receive and follow investment
advice. It may be that SMSF trustees who pay for expert advice regarding their
investment decisions achieve superior results compared to those trustees who opt not
to receive such advice, or it may be that the perceived fee savings of a ‘do-it-
yourself’ superannuation fund more than outweigh any benefit offered by expert
investment advice. This question is as yet unanswered by the existing literature
regarding SMSFs, however it is beyond the scope of this study and potentially
presents an avenue for further research.
2.4 Investor Behaviour
The investment outcomes of SMSFs are a direct consequence of decisions
made by either the trustees or their investment advisors. Behavioural finance, which
seeks to provide explanations and reasons as to why market participants make the
decisions they do (Sewell 2007), can therefore be utilised as a tool for assessing the
decisions of SMSF trustees.
2.4.1 Prospect Theory
One of the earliest contributions to behavioural finance (which is considered
a sub-section of behavioural economics) was Prospect Theory, outlined by
Kahneman and Tversky (1979). Prospect Theory showed how individuals evaluate

17
potential gains and losses from a range of alternatives with varying degrees of
probability. Most importantly they found that individuals tend to discount outcomes
subject to uncertainty in comparison to outcomes of which there is no uncertainty
(Sewell 2007). Through empirical evidence Kahneman and Tversky were able to
show that individuals, far from showing the indifference expected of rational agents,
exhibited loss aversion in that a loss was felt more keenly than a gain of equal
magnitude. Further refinement of Prospect Theory by Kahneman and Tversky
resulted in the development of Cumulative Prospect Theory (Kahneman & Tversky
1992). Cumulative Prospect Theory differed from the original Prospect Theory in
that it allowed for the weighting of the cumulative probability function, rather than
the individual probabilities as under the original Prospect Theory. According to
Kahneman and Tversky (1992), the value of a prospect can be determined as:
𝑉(𝑓) = ∑ πᵢ𝑣(𝑥ᵢ)
𝑛
i=−𝑚
for 𝜋ᵢ = 𝜋ᵢ˖ if i ≥ 0 and 𝜋ᵢ = 𝜋ᵢ
− if i ≤ 0
Therefore the value of a prospect V, is a function of the decision weight (πᵢ)
and the value of each of the prospect's potential outcomes (𝑥ᵢ). See Barberis (2013)
and Edwards (1996) for a review of Prospect Theory and the application of the
theory in mainstream economics. Building on the work by Kahneman and Tversky,
further research showed that loss aversion was also dynamic: losses were felt more
keenly if they were preceded by other losses, but less keenly if preceded by other
gains, otherwise known as the ‘house-money’ effect (Barberis & Huang 2001; Thaler
& Johnson 1990). Loss aversion is closely related to the disposition effect, which
refers to the tendency for investors to sell their winners and hold on to their losers,
first outlined by Shefrin and Statman (1985) and later covered by Odean (1998).
2.4.2 Mental Accounting and Other Cognitive Biases
A further extension of Kahneman and Tversky’s work was outlined by Thaler
(1980), who introduced the notion of ‘mental accounting’, which describes the

18
process whereby households and individuals exhibit multiple attitudes to risk. This
entails compartmentalising financial assets such that assets set aside for different
purposes are treated differently with respect to risk. Other common behavioural
biases of investors which have been identified include regret avoidance (Bell 1982),
‘naïve’ diversification (Benartzi & Thaler 2001), overconfidence (which manifests
itself in over-trading) (Barber & Odean 2000; Glaser & Weber 2007) and herding
(Hong, Kubik & Stein 2005).
An important aspect of behavioural finance is the role of heuristics in
decision-making, which describes the use of ‘rules of thumb’ by investors. Faced
with complex decisions in uncertain environments, investors simplify the decision-
making process according to rules of thumb (Tversky & Kahneman 1974). One of
the more common heuristics is the representative heuristic, which describes the
tendency of people to rely on the categorisation of events as typical or representative
of that type of event (Kahneman & Tversky 1972). Another important heuristic is the
availability heuristic, whereby investors rely on the ease of recalling a specific
incident as an indication of the probability of such an incident repeating itself
(Frieder 2004). The availability heuristic is closely related to the concept of recency
bias, whereby investors place greater emphasis on recent events in framing their
expectations of future events. For a comprehensive review of the literature associated
with behavioural economics, including discussions regarding concepts such as
overconfidence, the endowment effect, framing and choice confusion, see
DellaVigna (2009).
2.4.3 Risk Aversion
As the investment transactions of SMSFs are a function of the decisions of
SMSF trustees, the concept of risk aversion plays an important role in shaping the
decision-making process of SMSF trustees. With respect to investor behaviour, risk
aversion describes an individual’s preference for a lower return with a relatively
known probability as compared to a higher return with an uncertain probability.
Seminal work by Pratt (1964) and Arrow (1965) established the existence of both
relative and absolute risk aversion. Relative risk aversion describes an investor’s
willingness to accept risk based on a percentage of wealth, while absolute risk

19
aversion describes the amount of wealth an investor is willing to expose to risk as
wealth changes. While some have argued otherwise, it is generally accepted that
investors exhibit constant relative risk aversion and decreasing absolute risk aversion
(Chiappori & Paiella 2011; Kihlstrom, Romer & Williams 1981), behaviour which
would be expected to be replicated by SMSF trustees.
Given that SMSFs are commonly managed by trustees without the assistance
of professional advice, it is possible that the investment decisions of trustees exhibit
a number of the cognitive biases explained by behavioural finance (and indeed this is
possibly the case even where trustees have sought professional advice). As yet
SMSFs have not been comprehensively examined within the framework of
behavioural finance, with the exception of work by Phillips (2007) and Phillips et al.
(2007). This suggests an avenue for further research concerning SMSFs. This study
addresses a number of the concepts of behavioural financial within the context of
SMSFs, however a full analysis of the relationship between SMSF trustee investment
decisions and behavioural finance is beyond the scope of the study.
2.5 Regulation
The regulatory regime which applies to any specific industry or sector plays
an important role in setting out the structural framework within which the relevant
industry participants must operate. There are a number of different regulatory
regimes which can be implemented by policymakers, the selection of which depends
on the aims of policymakers and the relevant industry and regulatory authority.
2.5.1 Rules, Risk and Principles-Based Regulation
In terms of the regulatory regime which applies to financial services in
general, the regulatory system chosen by policymakers tends to be a varying mix of
principles, risk or rules-based regulation (Black, Hopper & Band 2007; Black 2008;
Peterson & Fensling 2011). Principles-based regulation relies less on detailed or
prescriptive rules and more on broad or high-level guidance or principles which are
intended to be followed by participants (Black, Hopper & Band 2007). Principles-
based regulation has been viewed as allowing industry flexibility while encouraging

20
innovation and competition, however the global financial crisis of 2008 has led to
questions regarding the effectiveness of such regulation, given that much of the
financial sector in developed economies was subject to principles-based regulation
(Black 2008).
Risk-based regulation focuses on prioritising the activities of regulators and
making the most efficient use of available resources according to evidence-based
assessments of risk. Regulators focus attention on those areas where the risk of a
negative event is highest, according to a pre-determined measure of the event’s
likelihood and its severity (Peterson & Fensling 2011). Criticism of risk-based
regulation has focused on the requirement for accurate measurement of risks, and the
difficulty in validating whether or not the regulation was effective in regulating
behaviour (Danielsson 2003; Peterson & Fensling 2011).
Rules-based regulation is generally viewed as the direct opposite to a
principles-based regulatory system. Rules-based regulatory systems are implemented
on the basis that principles-based systems may lead to situations where good faith
judgments lead to differing outcomes for identical events or circumstance. In
contrast, rules-based regulation is seen as being less ‘grey’, with greater clarity over
allowable or forbidden actions (Benston, Bromwich & Wagenhofer 2006). One of
the reasons commonly cited for favouring rules-based regulatory systems over
principles-based systems is the increasingly litigious nature of modern economies.
The downside of rules-based regulations however, is the propensity for it to lead to a
‘tick-the-box’ approach to compliance, where risks are perhaps not fully understood
or investigated (Anand 2009).
The Australian SMSF sector, in line with much of the Australian financial
sector, is subject to a mixed regulatory regime encompassing both rules and
principles-based regulation (Bateman 2003). The usage of principles-based
regulation within the SMSF sector has tended to focus largely on the investment
selection processes of SMSFs, which is attractive to superannuants who seek
flexibility in managing their retirement assets. Conversely however, the degree of
flexibility allowed by principles-based regulation may also be responsible for some
of the reported failings and abuses of SMSFs. While components of the SMSF sector

21
regulatory regime exhibit a principles-based approach, a proportion of the legislation
adopts a rules-based approach. This includes rules governing trustee eligibility, the
lodgement of SMSF accounts and documents, the treatment of in-house assets and
procedural requirements for receiving and paying member contributions and
withdrawals, as outlined in the Superannuation Industry (Supervision) Act 1993
(Cwlth).
In general the rules-based components of superannuation legislation tend to
focus more on the procedural aspects of SMSFs, while the investment related aspects
of SMSFs are subject to principles-based regulation. This distinction between the
two regulatory approaches is both a reason for the apparent popularity of SMSFs, yet
also explains some of the instances of abuse and mismanagement of SMSFs which
can occur. An important question that as yet remains unanswered, is the extent to
which changes to the financial services regulatory regime, as a consequence of the
2008 global financial crisis, have impacted (or will impact) the SMSF sector. The
predominate regulatory changes to the financial service sector since the crisis are
encapsulated in the Future of Financial Advice bill (Corporations Amendment
(Future of Financial Advice) Act 2012) and the reforms which form part of the
federal government’s Stronger Super program (Australian Treasury 2012). Given the
short time frame that has elapsed since the implementation of these reforms, the
precise impact on the SMSF sector is as yet unclear. This again suggests an avenue
of further research related to the SMSF sector, although this too is beyond the scope
of this study.
2.6 Investment Strategies and Theories
A SMSF is essentially a portfolio of investment assets which must be
managed by fund trustees for the benefit of members. Although the size of SMSFs
may differ from investment portfolios managed by institutions on behalf of their
clients or members, the basic approach of maximising returns while minimising risk
remains the same. In that regard, the different theories and approaches of portfolio
management are highly relevant to the SMSF sector, as they offer trustees a number
of alternative methodologies to follow in the management of SMSF assets.

22
2.6.1 Modern Portfolio Theory
One of the most well-known portfolio management theories available to
SMSF trustees is Modern Portfolio Theory (MPT), which focuses on the use of
diversification as a tool for maximising portfolio returns for a given level of risk.
MPT is based on the principle that the level of risk of a portfolio can be lowered by
taking into account the correlations between the assets which make up the portfolio
(Markowitz 1952). Expected portfolio return for a given level of portfolio risk can be
maximised by careful selection of the weightings of each available asset.
Alternatively, the level of portfolio risk can be minimised for a given level of
expected portfolio return. A number of extensions to MPT have been developed,
however the classical calculation of the expected return of a portfolio can be
expressed as:
𝜇 = 𝐸[𝑅] = ∑ 𝜇𝑖𝑥𝑖
𝑛
𝑖=1
𝜇2 = Var[𝑅] = ∑ ∑ 𝜎𝑖,𝑗 𝑥𝑖𝑥𝑗
𝑛
𝑗=1
𝑛
𝑖=1
∑ 𝑥𝑖 = 1
𝑛
𝑖=1
𝑥𝑖 ≥ 0, 𝑖 = 1, 2, … , 𝑛
According to MPT, the set of all possible portfolio combinations (𝜎2, 𝜇) is
the attainable set. An investor is then able to select that combination which provides
his or her desired risk/return outcome, as long as reasonable values for 𝜇𝑖 and 𝜎𝑖,𝑗 can
be obtained (Markowitz 1952). MPT has been subject to criticism that a number of
the definitions and assumptions underpinning the theory are invalid (Vincent 2011;
Resnik 2010). In particular, MPT’s definition of risk, which focuses on the volatility
of both the investments and the portfolio, has been criticised as being unrealistic
(Vincent 2011). MPT treats all volatility as undesirable, whereas volatility which
results in increasing asset values would be welcomed by SMSF trustees. MPT has
also been criticised for its reliance on historical data, which may not necessarily be
an indication of the future behaviour of particular investments or asset classes
(Vincent 2011). Resnik (2010) argued that MPT failed investors during the global

23
financial crisis of 2008, where diversification based on the principles of MPT still
resulted in significant losses to investors across most asset classes.
Despite the criticism of MPT, the theory continues to have a role in
investment management, being extended to include aspects of behavioural finance
(Curtis 2004; Davies & de Servigny 2012) and as the foundation for further
development of theories of risk and return. For a review of MPT see Elton and
Gruber (1997). While MPT does suffer from some limitations, it does offer SMSF
trustees a framework for the management of their fund assets, although previous
research has shown that the typical SMSF portfolio is most likely not optimised in
terms of mean-variance analysis (Phillips, Cathcart & Teale 2007). Despite concerns
regarding the assumptions underpinning MPT, further extensions to Markowitz’s
work have been published since 1952, most notably Sharpe’s Capital Asset Pricing
Model (CAPM), which focused on the risk of an investment relative to the overall
market (Sharpe 1964). The CAPM itself has been criticised, relying as it does on its
close relationship to MPT and with considerable empirical evidence of the real-world
failure of the CAPM (Bornholt 2013; Brown & Walter 2013; Dempsey 2013). In any
event it is unlikely that many SMSF trustees would be familiar with the CAPM and
therefore be in a position to apply the principles of the CAPM in their investment
approach.
2.6.2 Arbitrage Pricing Theory and the Efficient Market Hypothesis
An alternative investment theory which SMSF trustees may choose to adopt
is Arbitrage Pricing Theory (APT), which involves determining the expected return
of an asset using a linear equation which takes into account a number of different
macro-economic factors, ranging from interest rates and currency levels to changes
in inflation (Roll & Ross 1984; Ross 1976). Similar to MPT, APT is based on the
premise that an asset’s covariance with other assets is more important than the
volatility of the asset itself – how the price of the asset moves in relation to other
assets matters more for portfolio construction than the magnitude of the asset’s own
price movements (Shanken 1982). Taking into account asset covariance and a
number of macro-economic factors, investors are able to use APT to construct
portfolios with the highest expected rate of return. A criticism regarding APT

24
concerns the choice of macro-economic factors - different researchers have proposed
the use of differing factors; this introduces an element of subjectivity into the
application of APT (Roll & Ross 1984). As yet there is no evidence that a significant
proportion of SMSFs utilise APT as a framework for the management of fund assets,
possibly due to a lack of awareness of its existence or the difficulty in applying the
theory in real world situations.
A potentially more useful investment theory, in terms of the approach
adopted by SMSF trustees, is the Efficient Market Hypothesis (EMH). The EMH is
based on the premise that current stock market prices reflect all information relating
to the specific stock, which implies that it is not possible to achieve investment
returns in excess of the market return on a risk-adjusted basis (Fama 1970). Fama
outlined three variations of the EMH: weak - where current stock prices reflect past
publicly-available information; semi-strong - where current stock prices reflect both
current and past publicly known information; and strong - where prices reflect all
public and private current and past information. Later work by Fama (1991)
reviewed the literature associated with the EMH and made slight changes to the
categorisation of the variations of the EMH, although the key principles of the EMH
were retained. A more recent review of capital market efficiency by Valentine
(2010) noted some of the well-known anomalies of the EMH, notably the Weekend
Effect and the Monday Effect. Despite some doubts as to the empirical validity of the
EMH, it holds appeal for those investors who believe that selecting individual
investments or following investment theories such as MPT or APT will not lead to an
outcome which is consistently superior, on a risk-adjusted basis, to holding the
market portfolio. Such investors usually construct their investment approach around
the use of low-cost exchange-traded index funds which aim to replicate a specific
index (Malkiel 2005). Supporters of the EMH are also more likely to advocate the
implementation of a ‘buy and hold’ investment strategy (Malkiel 2003a). Adoption
of the EMH as an investment methodology offers SMSF investors a relatively
straightforward approach to managing fund assets, and one which may also appeal to
the ‘do-it-yourself’ nature of many SMSF trustees.
Whether or not SMSF trustees have adopted the EMH as a core investment
theory may be evident through an analysis of the investment transactions of SMSF

25
trustees. By analysing the investment decisions of SMSF trustees over a given time
period, it should be apparent whether trustees adopted a ‘buy and hold’ investment
strategy as advocated by the EMH, or pursued a more active investment approach.
Evidence of a tendency of SMSFs to follow ‘buy and hold’ strategies would confirm
earlier findings by Phillips (2007), who also noted that a ‘buy and hold’ strategy, in
conjunction with infrequent trading, has been shown to outperform more active
investment management approaches.
2.7 The 2008 Global Financial Crisis and Trading Activity
Of relevance to this study is existing research which focuses on the trading
behaviour of both individuals and institutions during financial crises, including the
2008 financial crisis. With respect to institutional trading decisions during the 2008
financial crisis, it has been found that institutional investors faced a significant
increase in trading costs during the financial crisis, while liquidity decreased more
sharply for smaller, more volatile stocks (Anand et al. 2011). The authors also found
that institutions adjusted their trading toward more liquid stocks at the expense of
less liquid stocks, possibly explaining the change in liquidity experienced by smaller,
more volatile stocks. Researchers have also considered the role of equity funds
(managed funds) in exaggerating the effects of the financial crisis, where it was
found that funds with exposure to financial stocks during the crisis were subject to
large investor redemptions, forcing those funds into asset fire-sales and thus
propagating the effects of the crisis (Hau & Lai 2012). Similar research found that
hedge funds were even more likely than equity funds to sell off their holdings during
the crisis, thereby potentially amplifying the effects of the crisis (Ben-David,
Franzoni & Moussawi 2011).
2.7.1 The Trading Patterns of Individual Investors
While the trading behaviour of institutional investors during the financial
crisis is of some relevance, SMSF trustees more closely resemble the typical retail or
individual investor, as compared to institutional investors, being as they are
essentially ‘do-it-yourself’ funds. Tang et al. (2011) carried out a similar
investigation to that of this study, focusing on the trading patterns of 401(k) plan

26
participants in the United States during the 2008 financial crisis. 401(k) plans bear
many similarities to SMSFs, particularly with regards to allowing a substantial level
of individual control over the investment of available funds. The authors considered
the frequency of trading by 401(k) plan participants, finding that trading increased
during the financial crisis. It was also found that participants exhibited a flight to
safety as the crisis deepened, although this change was not significant enough to be
viewed as panic trading by investors. The demographics of plan participants was also
taken into account, showing that novice traders were more likely to trade than traders
with greater experience and that female and lower-wealth participants were over-
represented in the novice trader category. In a similar vein, a more recent study
found that during the 2008 financial crisis Chinese investors increased their trading
frequency (Kallberg, Liu & Wang 2012). The authors also found that the financial
crisis tended to amplify the disposition effect; that is, during the crisis Chinese
investors were more likely to sell their winners and hang on to their losers. It was
also shown that investors tended to reduce the level of risk within their portfolios
during the crisis. The authors concluded that the investor behaviour was consistent
with two behavioural finance concepts; the disposition effect and loss aversion.
2.7.2 Trading Patterns, Investor Wealth and Asset Allocations
It is reasonable to expect that investor wealth has some bearing on the
investment trading decisions of individual investors. Individuals with a greater level
of wealth (particularly investable wealth) may be either more sophisticated in terms
of investment awareness or experience than less well-off investors, or more likely to
take greater investment risks. The issue of investor wealth and trading activity was
considered by Yamaguchi (2006), who found that wealthier individual investors were
likely to trade more frequently than their counterparts with less wealth, although it is
not clear that this increased level of trading necessarily resulted in a greater level of
exposure to investment risk. It is possible that this finding may be replicated with
respect to SMSFs, with larger funds (taken as an indication of greater wealth)
potentially making a greater number of investment transactions than smaller funds. It
is not obvious however that larger SMSFs would be more active traders under all
market conditions – for example, would larger SMSFs make a greater number of
trades in both rising and falling markets? These questions form the basis of one of

27
the hypotheses to be addressed by this study, where the relationship between SMSF
size and trading behaviour will be investigated under the premise that larger SMSFs
exhibit more frequent trading activity than smaller SMSFs.
The relationship between 401(k) plan trading patterns and the asset allocation
of each plan was explored by Mitchell et al. (2007), who found that investors who
held index funds or lifecycle funds within their 401(k) plans were less likely to trade.
The same study also found that investors holding international funds were also less
likely to trade. This potential relationship between existing asset allocations and the
level of trading activity forms the basis of one of the hypotheses to be addressed by
this study, which is based on the premise that SMSFs with a higher allocation to
equities are likely to trade more frequently. For example, it is possible that a higher
allocation to equities may be an indication of a more sophisticated investment
approach by a SMSF trustee, which would be likely to lead to more frequent trading
activity. On the other hand, a less sophisticated investment strategy might be
evidenced through a higher allocation to defensive assets, with a corresponding
decrease in the expected level of trading activity.
2.7.3 The Financial Crisis and Changes in Investor Risk Appetites
One of the advantages of analysing investor behaviour over the period 2005
to 2011 is that it allows us to determine the impact of a period of acute financial
stress on the risk appetites of investors. Standard investor risk profiling, as used by
financial advisers, is based on the premise that an individual’s risk profile is
relatively stable, although it is likely to change over time as an individual grows
older and approaches retirement. This approach ignores the potential impact on risk
appetite of both rising and falling investment markets. Hoffman et al. (2011)
considered the impact of the 2008 financial crisis on the risk tolerance and risk
perception of investors, assessing how changes in tolerance and perception
subsequently affect both investment performance and risk taking by investors. In
general it was found that there was a significant increase in the level of investor
trading activity, as also reported by Tang et al. (2011) and Kallberg at al. (2012). The
authors concluded that the more successful investors during the crisis traded less
during the period and also took on less risk and that this outperformance was linked
28
to the investor’s lower risk tolerance and higher return expectations. However, it was
also found that after the crisis the successful investors became more risk tolerant,
were more likely to trade and therefore no longer outperformed relative to previously
less-successful investors. It was hypothesised that perhaps the investors had become
over-confident in their abilities and subsequently altered their investment strategy to
their detriment, a behavioural bias previously outlined by Barber and Odean (2000).
The question of the level of risk taken by investors during the financial crisis,
as outlined by Hoffman et al. (2011), has relevance to one of the questions to be
answered by this study. That is, have SMSF trustee investment decisions become
more conservative since the financial crisis? If the financial crisis had no lasting
impact on the risk tolerance of SMSF trustees, an analysis on SMSF trustee
investment decisions since stock markets bottomed in early 2009 should show an
increase in market exposure by SMSFs as markets recovered. Whether or not this
occurred will be evident through an analysis of SMSF trustee investment decisions
over the period March 2009 to the end of 2011. This analysis forms the basis of
testing one of the study’s assumptions, which is that SMSFs have become more
conservative in their investment decision-making since the financial crisis.
2.8 Conclusion
This chapter presented a review of the existing literature relevant to this
study, focusing on the Australian superannuation system and the Self-Managed
Superannuation sector in particular. Areas of literature which are relevant to this
study include investor behaviour, regulation and investment strategies and theories.
Key investment theories such as the Efficient Markets Hypothesis, Modern Portfolio
Theory, the Capital Asset Pricing Model and newer concepts involving behavioural
finance all have an impact, however minor, on the SMSF sector. The review has also
identified a number of further areas for research which are not covered by this study,
but present questions to be potentially addressed through further work. These include
questions regarding the usefulness or otherwise of investment advice in relation to
SMSFs; the prevalence of well-known investor biases amongst SMSF trustees and
the impact of recent financial services sector reforms on the SMSF sector.

29
Given the size and scope of the SMSF sector, it would be expected that the
sector had attracted a concomitant level of attention from researchers. A review of
the literature focusing on the SMSF sector reveals this not to be the case. It may be
that the heterogeneous nature of the sector is a partial cause of this phenomenon,
given that there are over four hundred thousand individual SMSFs with no
centralised or standardised reporting or record-keeping obligations, outside of annual
taxation returns (Cooper Review 2010). This lack of centralised access to the
investment transaction decisions of SMSF trustees potentially acts as a barrier to
detailed analysis of the operation of SMSFs and the decision-making of SMSF
trustees. The SMSF sector should, however, present a fertile field for academic
research, given the relevancy of many topical investment theories and strategies to
the SMSF sector. This study seeks to add to the relatively small body of literature
concerning the SMSF sector, presenting as it does an analysis of the investment
trading decisions of SMSF trustees over the period 2005 to 2011. The next chapter,
Chapter 3, outlines the research questions and hypotheses to be addressed by the
study and describes the data utilised in the analysis component of the study.

30
CHAPTER 3
RESEARCH METHODOLOGY
3.1 Introduction
The previous chapter outlined a number of the key theories of portfolio
management theory and investor trading behaviour. The state of the Australian
superannuation system, and more specifically the Self-Managed Superannuation
sector, and the impact of the various theories of portfolio management on
superannuation were also discussed. Despite the growing importance of SMSFs in
Australian retirement planning, there has been relatively little attention paid to the
investment decisions of SMSF trustees, who collectively are responsible for the
management of over $416 billion of assets (Australian Taxation Office 2012). This
chapter outlines the research methodology adopted in this study of the investing and
trading behaviour of SMSF trustees.
The purpose of this chapter is to identify and outline the research questions
and hypotheses to be addressed by the study and to describe the data used for the
analysis component of the study. Steps taken during the analysis of the data are also
explained and any limitations which may apply to the data or to the analysis are
outlined. Finally any ethical issues which are relevant to the study are considered.
The chapter begins with an outline of the research objective and questions, which are
an outcome of the theoretical discussions outlined in Chapter 2.
3.2 Research Questions and Hypotheses
The research objective of this study is to examine the trading behaviour of
Australian Self-Managed Superannuation Funds within the context of the 2008
global financial crisis. In consideration of the research objective, the research
question may therefore be summarised as follows:
31
Is there evidence that Australian Self-Managed Superannuation Funds employed
appropriate investment strategies leading up to, during and after the 2008 global
financial crisis?
In the context of the study, ‘appropriate investment strategies’ are defined as
the implementation of investment strategies which resulted in an increased allocation
to cash and other defensive assets as markets rose prior to the financial crisis and an
increasing exposure to assets with a higher level of market risk during the period
immediately prior to March 2009 when stock markets bottomed. It is likely that such
a strategy of prudently reducing exposure to market risk assets as stock markets
peaked and then increasing market risk exposure as stock markets neared their lows
in early 2009 would have resulted in superior risk-adjusted investment returns.
Following on from the primary research question, a number of secondary
research questions were developed. These questions focused on specific areas of
investigation of the study, as follows:
1. Did SMSFs (correctly) increase their exposure to cash and other defensive
investments in the period leading up to the global financial crisis?
2. Did SMSFs (correctly) increase their exposure to market risk assets as stock
markets bottomed and recovered in 2009?
3. Have SMSFs become more conservative in their investment approach since the
global financial crisis?
4. Did larger or less risk-averse SMSFs behave differently as compared to smaller or
more conservative SMSFs over the course of the global financial crisis?
A number of hypotheses were developed in order to address the identified
research questions. The null hypothesis was used in testing these hypotheses. That is,
the hypotheses to be investigated are based on the expectation that SMSFs did not
employ appropriate investment strategies leading up to, during and after the financial

32
crisis, and that there was no difference in trading behaviour based on fund size or
risk profile. The hypotheses are:
Hypothesis 1: There was no significant difference in the cash allocations of SMSFs
between the years leading up to the global financial crisis.
Hypothesis 2: There was no significant difference in the exposure to riskier assets by
SMSFs between the years leading up to the global financial crisis and
as stock markets bottomed in 2009.
Hypothesis 3: There was no significant difference in the exposure to riskier assets by
SMSFs between the periods prior to and following the global financial
crisis.
Hypothesis 4: There are no significant differences between the trading behaviour of
large SMSFs and small SMSFs during the period 2005 to 2011.
Hypothesis 5: There are no significant differences between the trading behaviour of
risk-seeking and risk-averse SMSFs during the period 2005 to 2011.
Hypotheses 1, 2 and 3 focus on the specific actions taken by SMSF trustees
during the global financial crisis. Hypotheses 4 and 5 examine more general
behaviours of SMSFs, in particular whether or not specific characteristics of SMSFs
such as size or asset allocation are relevant with regards to the trading behaviour of
SMSFs over the time period 2005 to 2011.
3.3 Research Design
The question of research philosophy plays an important role in the research
design and in the approach taken in data collection. In terms of the paradigm adopted
by this study, it most closely falls within a functionalist paradigm, which is problem
oriented in approach (Saunders, Lewis & Thornhill 2009). The study adopts a
quantitative approach to an investigation of the various attributes of SMSFs; seeking
out rational explanations for SMSF trustee decisions and behaviour and identifying
33
potential opportunities for policymakers to improve the ability of the SMSF sector to
meet fund member needs.
The study primarily follows a deductive approach, although some aspects of
the study may also be seen as inductive in nature. A substantial component of the
study meets a number of the characteristics which define the deductive approach
(Saunders, Lewis & Thornhill 2009). Firstly, causal relationships between variables
are identified; for example, was an over-weight cash position in SMSFs brought
about by deliberate actions by trustees or was it simply a reflection of an
unsophisticated investment strategy? Secondly, the researcher is independent of what
is being observed. That is, the research is based on the analysis of existing historical
SMSF investment data, ensuring researcher independence. Thirdly, concepts will be
operationalised. In this regard SMSF asset weightings, investment decisions and
other concepts are defined such that they can be measured quantitatively. Finally,
generalisations will be made. That is, findings and conclusions are based on an
analysis of a sample of SMSFs, allowing for generalisations of the wider SMSF
sector. Some components of the study however, will be more suited to an inductive
approach, as outlined by Egan (2002). For example, in assessing the impact of the
2008 financial crisis on the asset allocation decisions of SMSFs, the research begins
with observations regarding the change in asset allocations, progresses to the
detection of specific patterns in SMSF allocation decisions, formulates one or more
tentative hypotheses which can be explored and culminates in drawing general
conclusions or hypotheses regarding the impact of the 2008 financial crisis on SMSF
asset allocation decisions.
In regards to the type of research undertaken, this study is most closely
identified as being explanatory research, where causal relationships between a
number of the different variables under consideration are explored (Saunders, Lewis
& Thornhill 2009). The research strategy is primarily one of archival research, based
on the historical data of a sample of SMSFs, utilising quantitative analysis
techniques. An important feature of this study is that it is longitudinal in nature.
Previous research into the SMSF sector has largely been cross-sectional in nature,
focusing on the sector at a point in time, be it the current regulatory regime or current
SMSF microstructure or industry macrostructure. In comparison, this study outlines

34
changes in the composition of a sample of SMSFs and the changing investment
decisions of the funds over a period of time. This will allow for a discussion of the
various factors which influence individual SMSFs and the industry as a whole under
differing market and economic conditions.
3.4 SMSF Sample Data
The study is based on the quantitative analysis of a sample of Australian
SMSFs. The sample consists of two primary data sets: the investment transactions of
a number of SMSFs over the period 1 January 2005 to 31 December 2011, and the
asset allocation of the same SMSFs as at the end of each quarter over the same time
period. One of the advantages of using the SMSF sample data is that it is primary
data and is thus not susceptible to some of the disadvantages of using secondary data,
such as reliability, validity and measurement bias (Saunders, Lewis & Thornhill
2009). The discrepancies that can arise when using multiple secondary data sources
were also outlined by Deininger and Squire (1996) and Atkinson and Brandolini
(2001). The accuracy of the primary data which forms the SMSF sample data is
important, however it can be expected that such data is accurate, being that it forms
the basis of SMSF tax reporting obligations.
The SMSF sample data was provided by a number of financial services firms
involved in the administration and management of SMSFs, with around 180
individual SMSFs initially included in the sample. The financial services firms were
based in Queensland and New South Wales. A number of other organisations and
institutions were approached regarding participation in the study, however time and
resources constraints and perceived privacy concerns were cited as reasons for
precluding their participation in the study. Due to the inability of other organisations
to participate, the sample cannot be said to be random. The sample data will likely
have a bias to the geographical location of the participating financial services firms,
in addition to a socio-economic bias to the typical type of client serviced by each
firm. Due to the nature of the subject matter, a truly random representative sample
would not be possible without access to the investment transaction and asset
allocation data relating to all SMSFs over the period 2005 to 2011. Such access
would not be possible due to the nature of the SMSF industry, specifically the

35
absence of a centralised data repository. This issue is discussed in further detail
below.
The sample is drawn from a wider population of approximately 278,244
SMSFs as at June 2004 (Australian Taxation Office 2009). While the size of the
proposed sample is relatively small when compared to the size of the general
population of SMSFs, the sample will be large enough to draw generalisations as to
the characteristics and nature of the general population of SMSFs. Taking into
account the size of the general population of SMSFs, the number of funds needed to
provide a more representative sample can be calculated using the formula published
by the American National Education Association (Krejcie & Morgan 1970). This
formula can be used where the population size is known, as is the case with the
SMSF sector in 2004-05. The formula is outlined below:
s = X2NP(1 − P) ÷ d2(N − 1) + X2P(1 − P)
Where:
s = required sample size
X2 = the table value of chi-square for 1 degree of freedom at the desired confidence
level
N = the population size
P = the population proportion (assumed to be .50)
d = the degree of accuracy expressed as a proportion (.05)
Based on a population size of 278,244 SMSFs in 2004 and a chi-square value
of 3.841 (representing a 95% confidence level), the ideal sample size can be
calculated as 384 SMSFs. This is a larger sample size than that used in this study.
While a larger sample would be preferable, working with an overly large sample of
SMSFs would be impractical as SMSF data is held across multiple information
technology systems across multiple organisations, without consistent or mandated
record-keeping systems, making data aggregation for many funds unfeasible given
the time and resource constraints of the study. The only current source of aggregated
data regarding SMSFs is the information reported to the Australian Taxation Office
by SMSF trustees on an annual basis as part of their annual taxation obligations.

36
However, this information would not include transaction data and access to the data
is restricted. Furthermore, each individual SMSF may potentially generate hundreds
of individual transactions per year and each transaction must be tracked and taken
into account in analysing asset allocation or selection. An analysis of a large sample
of SMSFs in this manner would likely require a time commitment beyond the scope
of this study. As a result of these factors the study makes use of convenience
sampling, which entails selection of the most easily available data, in this case the
data provided by those firms which agreed to participate in the study. Such an
approach involves less time, cost and resources than other sampling techniques,
however it is likely that the data resulting from such a sample will be less robust than
that provided by other approaches such as surveys or random sampling techniques
(Marshall 1996).
3.4.1 The SMSF Sample in Detail
The initial SMSF sample contained the details of 180 SMSFs which had been
in existence over the period 2005 to 2011. The data was made available in spread
sheet format, with each SMSF assigned a unique fund identifier. The data relevant to
each fund was contained within 29 individual spread sheets. Sheet 1 contained a list
of all the investment transactions for a specific fund from 1 January 2005 to 31
December 2011. Sheets 2 to 29 contained quarterly ‘snapshots’ of the contents of
each fund as at the end of each quarter beginning 1 January 2005. This included the
contents of each fund as at 1 January 2005, which marked the starting asset
allocations for each fund. The funds differed in size, with the smallest fund holding
assets worth $8,217 as at 1 January 2005, while the largest fund at the same time
held total assets of $2,124,200. The data was held on a number of commercially
available portfolio administration software packages which allowed for the recording
of investment transactions and bank account movements within each fund. The
investment transactions and quarterly contents of each fund from 2005 to 2011 was
the only data made available for the study.
The fund data was anonymous and did not disclose any fund-specific data
beyond the investment transactions and allocations. Data regarding each fund which
was not made available included the name of the fund; its domicile; any demographic

37
details regarding the fund trustees or members; the fund’s investment strategy; the
risk profile of the fund trustees and the age of the fund or the extent to which the
fund’s investment decisions were the result of third-party advice. The issue of the
scope or use of third-party advice by the sample SMSFs is particularly relevant given
the primary focus of the study into the investment decisions of SMSFs. The financial
services firms which provided the data indicated that financial advice was provided
to fund trustees where requested, however in all cases the fund trustees were at
liberty to accept or reject any such advice, and all final investment decisions rested
solely with the fund trustees.
While it is reasonable to conclude that some of the investment decisions
made by fund trustees and subsequently included in the study were the result of
advice provided by third-parties such as stockbrokers or financial advisors, this does
not necessarily render any such data unusable with respect to the study. SMSF
trustees likely base their investment decisions on information provided by a number
of different sources, be they professional advisers or brokers, newsletters and the
internet or other forms of media. The investment transactions of each SMSF are
ultimately the sole responsibility of the fund trustees, regardless of how these
investment decisions are reached by the fund trustees. As the study seeks to assess
the investment decisions of fund trustees over time, the source or sources of such
decisions do not detract from any conclusions drawn from the analysis.
3.4.1.1 Sample transaction data in detail
The SMSF transaction data was initially drawn from 180 individual SMSFs.
Of this dataset a number funds were excluded as they were either opened or closed
during the period under investigation, therefore failing to meet a key criterion for
inclusion in the study. This left 93 SMSFs which had existed for the full period from
1 January 2005 to 31 December 2011. The total number of investment transactions
carried out by these SMSFs amounted to 24,651 transactions; however a number of
these transactions were conducted prior to 1 January 2005 or after the period 31
December 2011. After these transactions were excluded, the total number of SMSF
transactions amounted to 22,570 and comprised of nine distinct transaction types.
The nine different types of transactions carried out by the sample SMSFs included

38
asset sales and purchases, investment conversions, capital returns and interest
reinvestment. The total number of each transaction type is shown in Table 3.1.
Table 3.1 List of investment transaction types in SMSF sample data
Transaction type Number of transactions
Call for payment 135
Capital return 8,250
Conversion purchase 758
Conversion sale 638
Dormant sale 33
Purchase 7,754
Purchase (DRP) 872
Restructure of units 70
Sale 4,060
Total transactions 22,570
Of the total investment transactions contained within the SMSF sample data,
the most frequent transaction type was an investment purchase. ‘Call for payment’
was a specific transaction type where the SMSF trustee had purchased an investment
where a subsequent payment at a later date was required to effect full ownership. A
‘capital return’ describes a transaction where a payment to an investor includes a
capital component, thus reducing the investment purchase price by the amount of the
capital return. ‘Conversion purchase’ and ‘conversion sale’ related to the acquisition
or sale of investments due to corporate activity. For example, a share issue
consolidation would result in the ‘conversion sale’ of the original investment and the
‘conversion purchase’ of the new number of securities in the holding undergoing the
share consolidation. A ‘dormant sale’ was the effective sale of a holding where it was
deemed that the securities held no economic value, usually in the case of bankruptcy
of a listed company. ‘Purchase (DRP)’ signified the acquisition of an investment
through a dividend reinvestment process. ‘Restructure of units’ described the process
where additional units where issued to security-holders, usually through the use of
bonus share issues or similar.
Of the nine investment transaction types, capital returns, conversion
purchases and conversion sales were excluded from further analysis as these
transaction types only affected the cost base or the number of units held by the

39
SMSF. Dormant sales were also excluded, as this type of transaction was not a
willing sale of an investment by the SMSF trustee, but merely reflected the
bankruptcy and eventual delisting of an investment. Any transaction types identified
as restructuring of units were also excluded, as this transaction also simply resulted
in a change to the number of units held in a specific investment by the SMSF. Any
investment transactions which resulted in cash being transferred or utilised to invest
in other cash investments were also excluded from the analysis. For example, the
transfer of cash from an at-call savings account to a higher-yielding bank account
would be excluded from the analysis. The reason for this distinction is that the study
investigates whether SMSF trustees were making aggressive or defensive investment
choices at the appropriate time and transferring cash from one account to another is
essentially a shift from one defensive asset to another and would not have any
bearing on the overall risk profile of the portfolio. Once the excluded transactions
were removed from the SMSF sample data, 10,459 eligible transactions were
included in the analysis. This is shown in Table 3.2. Of the 10,459 eligible
investment transactions, 3,485, or 33.32% of the transactions involved the sale of an
investment, with 6,974 or 66.68% of the transactions involving the purchase of an
investment.
Table 3.2 Eligible SMSF investment transactions within the sample data
Transaction type Action Number of transactions
Call for payment Purchase 111
Purchase Purchase 6121
Purchase (DRP) Purchase 742
Sale Sale 3485
Total transactions 10,459
The 10,459 investment transactions covered 484 discrete investments. These
included cash, listed equities, listed corporate bonds and hybrid securities, managed
funds and instalment warrants. Each investment type was designated as either
‘aggressive’ or ‘defensive’ in nature. For example, listed equities are aggressive
investments, in that purchasing equities with cash leads to a relative increase in risk;
while selling equities for cash would lead to a corresponding relative reduction in
risk. Corporate bonds however are classified as defensive investments, as investing
in bonds is seen as a reduction in the risk of capital loss. In the context of the study

40
risk is defined as the risk of loss of the invested capital. In this regard, listed equities
present a greater risk of loss than cash or corporate bonds for example. While this
distinction ignores other types of risk, such as credit risk, interest rate risk, price
volatility or liquidity risk, such a definition of risk is sufficient for the purposes of
the study. Classifying each investment as either aggressive or defensive makes it
possible to track the flow of money into or out of each investment type, thereby
illustrating the investment decision-making outcomes of SMSF trustees. The
breakdown between transactions involving defensive or aggressive assets is
summarised in Table 3.3.
Table 3.3 Summary of eligible transaction types
Transaction type Number of transactions
Aggressive (AGG) transactions 7,248
Defensive (DEF) transactions 3,211
Total 10,459
Transaction type Dollar value ($)
Total dollar value of AGG transactions 71,251,315.01
Total dollar value of DEF transactions 84,856,891.46
Total 156,108,206.47
As shown in Table 3.3, transactions involving aggressive investments
outweighed those involving defensive assets by a substantial margin. Note that this
does not mean that SMSFs were taking on risk in the same proportions, as it is the
direction of the transaction which is important. In terms of the dollar value of the
transactions, more funds were allocated to defensive transactions, though again it is
the direction of the flow funds which matters, not simply the overall total.
3.4.1.2 Sample fund contents data in detail
The data relating to the contents of each SMSF consisted of a list of the
investments held by each fund at quarterly intervals over the period 1 January 2005
to 31 December 2011. As with the investment transaction data, the quarterly
investment holdings of 93 SMSFs were included in the analysis. The first quarterly
period was 31 March 2005 and the final quarterly period was 31 December 2011,
covering 28 end-of-period listings of each SMSF. Across the sample of SMSF
holdings there were 509 individual assets, ranging from cash to listed equities and
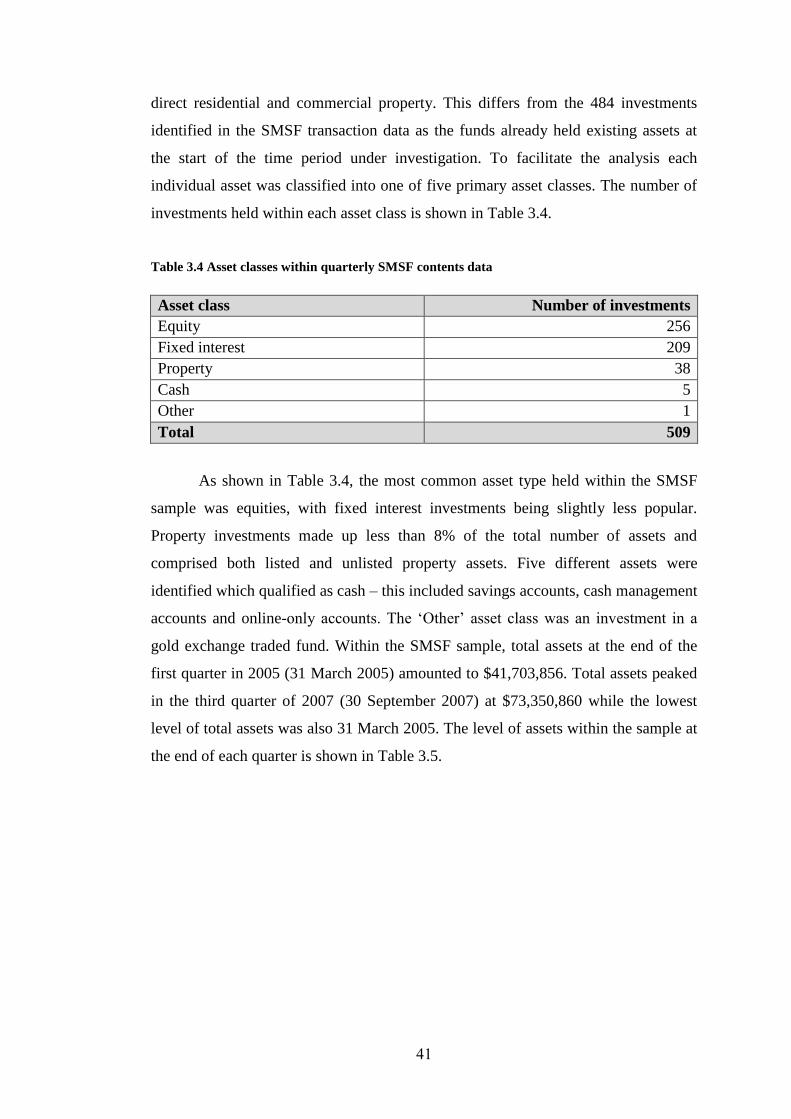
41
direct residential and commercial property. This differs from the 484 investments
identified in the SMSF transaction data as the funds already held existing assets at
the start of the time period under investigation. To facilitate the analysis each
individual asset was classified into one of five primary asset classes. The number of
investments held within each asset class is shown in Table 3.4.
Table 3.4 Asset classes within quarterly SMSF contents data
Asset class Number of investments
Equity 256
Fixed interest 209
Property 38
Cash 5
Other 1
Total 509
As shown in Table 3.4, the most common asset type held within the SMSF
sample was equities, with fixed interest investments being slightly less popular.
Property investments made up less than 8% of the total number of assets and
comprised both listed and unlisted property assets. Five different assets were
identified which qualified as cash – this included savings accounts, cash management
accounts and online-only accounts. The ‘Other’ asset class was an investment in a
gold exchange traded fund. Within the SMSF sample, total assets at the end of the
first quarter in 2005 (31 March 2005) amounted to $41,703,856. Total assets peaked
in the third quarter of 2007 (30 September 2007) at $73,350,860 while the lowest
level of total assets was also 31 March 2005. The level of assets within the sample at
the end of each quarter is shown in Table 3.5.

42
Table 3.5 Total SMSF sample assets at the end of each quarter
Quarter-ending Total assets within SMSF sample ($)
31 Mar 2005 41,703,856
30 Jun 2005 44,450,479
30 Sep 2005 49,027,276
31 Dec 2005 50,869,819
31 Mar 2006 52,985,569
30 Jun 2006 53,855,852
30 Sep 2006 56,592,984
31 Dec 2006 61,561,394
31 Mar 2007 63,277,827
30 Jun 2007 71,436,868
30 Sep 2007 73,350,860
31 Dec 2007 70,000,081
31 Mar 2008 63,058,152
30 Jun 2008 61,477,946
30 Sep 2008 60,665,541
31 Dec 2008 54,112,071
31 Mar 2009 54,131,895
30 Jun 2009 56,824,644
30 Sep 2009 63,869,604
31 Dec 2009 66,582,567
31 Mar 2010 66,183,786
30 Jun 2010 62,723,400
30 Sep 2010 65,124,607
31 Dec 2010 66,186,359
31 Mar 2011 66,597,415
30 Jun 2011 65,708,981
30 Sep 2011 62,322,550
31 Dec 2011 63,586,536
While the change in the level of assets within the SMSF sample can be
expected to reflect changes in market values and the values of other investments held
within the sample, superannuation contributions and withdrawals by fund members
would also have had an impact on the level of assets at the end of each quarter. These
withdrawals and contributions are included in the data in Table 3.5, however it is
likely that any such transactions within the SMSF sample would comprise only a
relatively minor portion of any change in the total assets within the sample and
would be outweighed by market movements and investment transactions over each

43
quarter. The quarterly totals for the primary asset classes of cash, equities, property
and fixed interest within the SMSF sample are shown in Table 3.6.
Table 3.6 Quarterly totals of individual asset classes within the SMSF data
Year Qtr. Cash ($) Equity ($) Property ($) Fixed interest ($)
2005 1 2,715,852 22,484,898 3,593,243 12,903,848
2005 2 3,609,860 24,146,284 3,786,362 12,921,790
2005 3 4,865,129 27,861,653 3,222,359 13,089,078
2005 4 4,762,731 29,005,510 3,214,201 13,852,374
2006 1 3,757,538 31,162,563 3,506,699 14,597,876
2006 2 3,810,518 31,463,149 3,632,134 14,951,222
2006 3 4,843,981 33,039,041 3,953,076 14,778,689
2006 4 4,293,704 36,415,850 4,219,400 16,601,520
2007 1 4,191,428 38,287,462 4,473,095 16,335,796
2007 2 7,543,999 40,516,786 6,156,959 17,228,865
2007 3 5,368,785 42,486,631 6,303,783 19,209,981
2007 4 4,031,295 41,077,277 6,923,053 18,039,718
2008 1 3,598,319 35,634,869 6,778,590 17,066,003
2008 2 5,287,808 34,015,918 6,690,105 15,468,301
2008 3 5,023,424 33,053,427 6,738,809 15,852,506
2008 4 8,120,194 28,531,326 6,039,243 11,423,121
2009 1 7,930,474 29,020,846 5,771,084 11,318,666
2009 2 7,248,608 31,010,663 5,748,724 12,722,762
2009 3 6,340,170 37,315,647 5,754,968 14,200,017
2009 4 5,675,402 39,851,356 5,963,831 15,058,161
2010 1 5,162,936 39,959,366 5,940,869 14,985,556
2010 2 5,084,886 36,499,163 6,238,102 14,790,525
2010 3 6,211,889 37,966,869 6,293,173 14,541,972
2010 4 6,108,977 39,167,564 6,425,400 14,387,288
2011 1 6,966,016 38,029,889 6,543,060 14,942,571
2011 2 6,515,401 38,746,663 5,465,330 14,358,119
2011 3 5,758,776 35,335,693 5,484,227 15,150,333
2011 4 5,683,028 36,470,072 5,427,975 15,978,223
Information regarding the contents of each SMSF at quarterly intervals makes
it possible to identify and track changes in the asset allocations of the funds within
the sample. While this provides similar information to the SMSF transaction data, the
fund contents data presents a more complete picture of the exposure of funds within
the sample at specific points in time. On the other hand the SMSF investment
transaction data allows us to investigate the decision-making of SMSF trustees over a

44
specific time period, which subsequently has an impact on the contents of the funds
within the sample at specific points in time. Taken together the two data sources
present a complete picture of the trading behaviour of SMSF trustees over the time
period under consideration, and how this trading behaviour was both related to and
impacted on the asset allocations of funds within the SMSF sample.
3.5 Preparation of the Data
The first step in the preparation of the SMSF sample data was to remove any
data which related to SMSFs that had not been in existence for the full period from 1
January 2005 to 31 December 2011. Following this, the various investments and
transaction types were identified as being either ‘aggressive’ or ‘defensive’, as
outlined in section 3.4.1.2. In order to allow for analysis of the data a number of
variables were identified. These variables form the basis of the statistical analysis
component of the study and relate to the number and type of transactions carried out
by SMSFs in the sample. The variables were defined as per Table 3.7.

45
Table 3.7 Definition of variables used in the analysis
Variable Definition
COUNT The number of investment transactions in a given time
period
COUNT_AGGBUYS The number of times an ‘aggressive’ investment
purchase was made in a given time period
COUNT_AGGSALES The number of times an ‘aggressive’ investment was
sold in a given time period
VALUE_AGGBUYS The dollar value of ‘aggressive’ investments purchased
in a given time period
VALUE_AGGSALES The dollar value of ‘aggressive’ investments sold in a
given time period
COUNT_DEFBUYS The number of times a ‘defensive’ investment
purchase was made in a given time period
COUNT_DEFSALES The number of times a ‘defensive’ investment was
sold in a given time period
VALUE_DEFBUYS The dollar value of ‘defensive’ investments purchased
in a given time period
VALUE_DEFSALES The dollar value of ‘defensive’ investments sold in a
given time period
NET_FLOWDEF The dollar value of shares sold in a given time period,
less the dollar value of shares purchased in a given
time period. In effect NETFLOW_DEF =
VALUE_AGGSALES – VALUE_AGGBUYS
TRADE_VALUE The total dollar value of all investment types
purchased or sold in a given time period
With the exception of NETFLOW_DEF, the variables are numerical
measures of the number or dollar value of different investment transactions carried
out by the fund trustees over a specified time period. NETFLOW_DEF differs in that
it allows us to determine the net flow of funds into defensive assets for a given time
period. By subtracting the dollar value of shares purchased from the dollar value of
shares sold for a given period of time, we are able to determine whether or not that

46
time period represented a shift into defensive or aggressive assets. If
NETFLOW_DEF is a positive value, then on an overall basis money was moved
from aggressive assets to defensive assets for that given time period and vice versa
when NETFLOW_DEF is a negative value. For the purposes of the study it is
assumed that a share sale represents a shift into defensive assets, while a share
purchase represents a shift into risky assets. By observing the changes in the net flow
into defensive assets it is possible to conclude whether or not SMSFs were increasing
defensive exposure in the period leading up to the financial crisis; the investment
response of SMSF trustees during the actual financial crisis; and whether or not there
was any change in trustee investment decisions after the financial crisis.
The variables listed in Table 3.7 were calculated according to four different
criteria. This was done firstly on a monthly basis over the period January 2005 to
December 2011. For each month the number and dollar value of aggressive and
defensive investment transactions was determined and allocated to each variable
accordingly. The period 1 January 2005 to 31 December 2011 was also split into
three distinct periods in order to allow for an analysis of transactions prior to, during
and after the global financial crisis. Period 1 was from 1 January 2005 to 30 June
2008 and is considered to represent that period of time prior to the financial crisis.
Period 2 covers from 1 July 2008 to 30 June 2009 and represents the time period
during the financial crisis, while Period 3 runs from 1 July 2009 to 31 December
2011 and represents the period after the financial crisis. The variables were also
calculated according to fund size and asset allocation. With regards to fund size, each
fund in the sample was grouped as being small (less than $350,000 in assets),
average (more than $350,000 in assets but less than $750,000 in assets) or large
(greater than $750,000 in assets) as at 1 January 2005. This grouping is based on
information provided by the Australian Taxation Office which showed that the
average SMSF size in 2005 was $560,519 (Australian Taxation Office 2009). Any
fund in the sample which was within a range of $200,000 more or less than the actual
average fund size of $560,519 was included in the ‘average’ group. The average size
of the 24 funds within this group was $501,690, which closely matched the actual
reported average fund size. One hundred and ten funds were included in this data as
any comparative analysis would be done on an annual basis which meant that funds
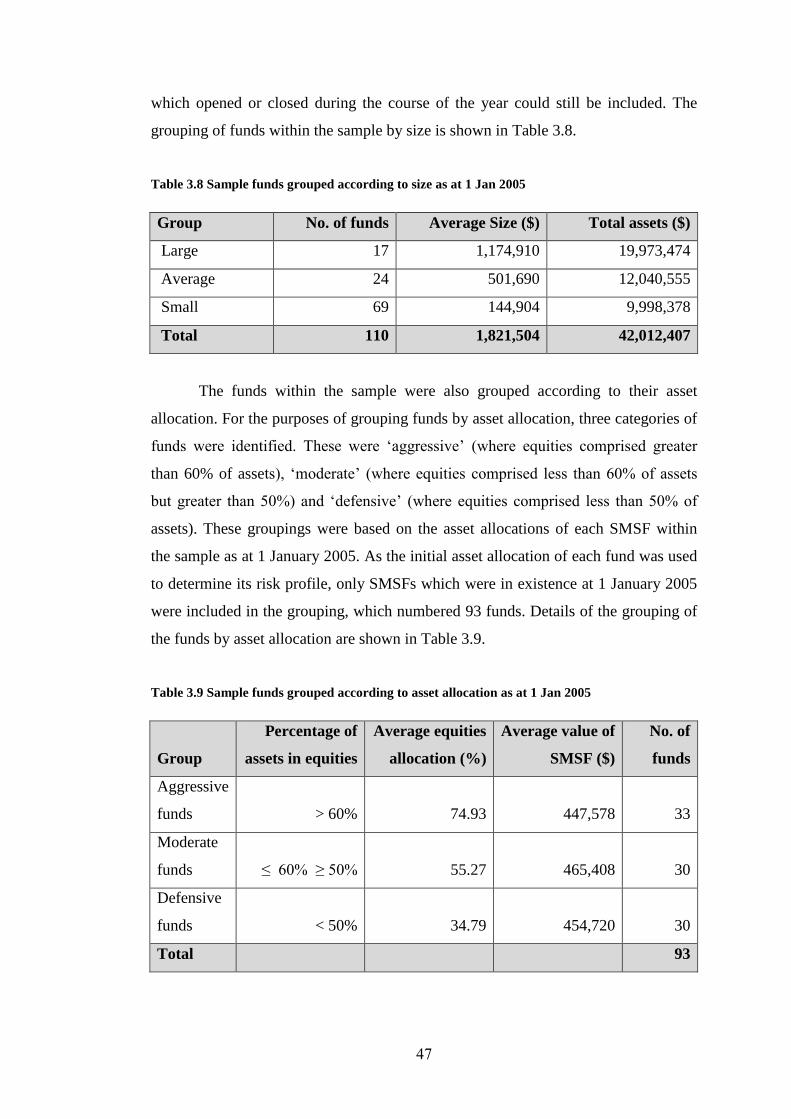
47
which opened or closed during the course of the year could still be included. The
grouping of funds within the sample by size is shown in Table 3.8.
Table 3.8 Sample funds grouped according to size as at 1 Jan 2005
Group No. of funds Average Size ($) Total assets ($)
Large 17 1,174,910 19,973,474
Average 24 501,690 12,040,555
Small 69 144,904 9,998,378
Total 110 1,821,504 42,012,407
The funds within the sample were also grouped according to their asset
allocation. For the purposes of grouping funds by asset allocation, three categories of
funds were identified. These were ‘aggressive’ (where equities comprised greater
than 60% of assets), ‘moderate’ (where equities comprised less than 60% of assets
but greater than 50%) and ‘defensive’ (where equities comprised less than 50% of
assets). These groupings were based on the asset allocations of each SMSF within
the sample as at 1 January 2005. As the initial asset allocation of each fund was used
to determine its risk profile, only SMSFs which were in existence at 1 January 2005
were included in the grouping, which numbered 93 funds. Details of the grouping of
the funds by asset allocation are shown in Table 3.9.
Table 3.9 Sample funds grouped according to asset allocation as at 1 Jan 2005
Group
Percentage of
assets in equities
Average equities
allocation (%)
Average value of
SMSF ($)
No. of
funds
Aggressive
funds > 60% 74.93
447,578 33
Moderate
funds ≤ 60% ≥ 50% 55.27
465,408 30
Defensive
funds < 50% 34.79
454,720 30
Total 93

48
Using SAS 9.2 for Windows statistical software, the variables were tested for
significant differences between each year from 2005 to 2011 and between the three
defined time periods which cover the periods prior to, during and after the financial
crisis. The tests for significance were based on Fisher’s Least Significant Difference
(LSD) test. Fisher’s LSD test is known to minimise Type II errors, but with a
corresponding potential increase in the number of Type I errors (Williams & Abdi
2010). Fisher’s LSD test can be considered to be less conservative than other
statistical approaches, however the accuracy of the test is considered sufficient for
the purposes of the study. The tests of significance allow the study to address the five
hypotheses which form the basis of the study as outlined in section 3.2. The results of
the analysis of the data are presented in Chapters 4, 5, and 6.
3.6 Ethical Considerations
The ethical considerations of research cover a range of issues which must be
taken into account in all stages of the research process. These stages include the
planning, execution and reporting of the research (Spata 2003). As part of this
process responsibility falls on the researcher to ensure that the outcomes from the
research are not intentionally misleading; that the welfare of any participants in the
research process is protected; that any relevant local, state or federal laws are
complied with; that data used in the research is correctly reported and that any
relevant institutions have given their approval for the research to proceed.
One of the key ethical issues in research is that of consent (Fouka &
Mantzorou 2011). As this study entails the use of anonymous data, informed consent
of the trustees or members included in the study was not required. That is, the SMSF
sample data was provided in electronic format with no means to identify the
geographical location or names and contact details of the SMSF trustees and
members. In addition, no other demographic information relating to the SMSFs was
included within the data made available for the study, such as the age of the members
and trustees, their marital status, their employment status or any other identifying
information. As issues such as consent, privacy and confidentiality were not relevant
to the study, key ethical considerations for the study focused on ensuring the accurate
presentation of the data and results of the research.

49
3.6 Summary
This chapter described and discussed the research methodology used in this
study and outlined the research question and hypotheses to be addressed by the
study. The SMSF sample data was described and the key features of the data were
summarised. While the sample size is acknowledged as being smaller than the ideal
sample size based on work by Krejcie and Morgan (1970), the nature of the SMSF
industry means that working with a larger sample size was not feasible. Any
conclusions drawn by the study will therefore need to be made with regard to
limitations of the sample size. A number of variables relating to the investment
actions of SMSF trustees were also defined. These variables form the basis of the
quantitative analysis component of the study and provide the ability to quantitatively
measure changes in the trading behaviour of SMSFs within the sample over the
identified time period. This gives rise to an important characteristic of the study,
which is the longitudinal nature of the study. Key ethical considerations relating to
the study were also discussed, although the nature of the study means that key
concerns focus largely on the accurate presentation and analysis of the data.
The next chapter, Chapter 4, presents the results of the analysis of the SMSF
sample data across the period 2005 to 2011.

50
CHAPTER 4
RESULTS: TRADING BEHAVIOUR 2005 TO 2011
4.1 Introduction
The previous chapter outlined the research methodology adopted by this
study and the research questions and hypotheses to be addressed through this study.
The chapter also described the data which forms the analysis component of this
study. This chapter presents the results of the analysis of the data, focusing on the
trading behaviour of SMSFs over the period 2005 to 2011, which addresses the
question of whether or not SMSF trustees changed their investing behaviour over the
period prior to, during and after the global financial crisis. The results of the analysis
of SMSF transaction data on the basis of fund size and risk profile over the same
period are presented in Chapters 5 and 6 respectively. Chapter 7 discusses the results
of the analysis with regards to addressing the research questions outlined in Chapter
3.
The variables analysed in this portion of the study cover the frequency and
value of SMSF trading activities, the actions of SMSF trustees to increase or
decrease aggressive or defensive investment exposure respectively, and the net flow
of funds into defensive assets for SMSFs within the sample. The intention is to
present a complete picture of SMSF trading activity over the period 2005 to 2011,
both on an annual basis and on a ‘per period’ basis. Generally only those cases where
statistically significant differences in SMSF trading behaviour were found will be
discussed within the text, although the full table of results for each variable are
presented for sake of completeness.
4.2 SMSF Trustee Trading Behaviour from 2005 to 2011
In order to determine whether or not SMSF trustees made appropriate
investment decisions over the period 2005 to 2011, analysis of variance was used to

51
determine whether the type of trading behaviour exhibited a statistically significant
difference from one period to the next. This was done initially on an annual basis,
and then by reference to the three identified time periods, being prior to, during and
after the global financial crisis.
4.2.1 Statistical Differences in SMSF Trading Behaviour on an Annual
Basis
To address the research question of whether or not SMSF trustees were
making appropriate investment decisions over the period 2005 to 2011, the trading
behaviour of SMSF trustees was assessed for each year from 2005 to 2011. This was
done within the context of the variables which were defined in Table 3.7. Each
variable was calculated on a monthly basis and the mean of each variable for each
year is presented in Table 4.1.
Table 4.1 Monthly means of variables for each year from 2005 to 2011
Variable 2005 2006 2007 2008 2009 2010 2011
COUNT 143 145 152 113 114 107 98
COUNT_AGGBUYS 75 78 69 47 64 46 32
COUNT_AGGSALES 32 31 45 18 11 27 29
VALUE_AGGBUYS $465,902 $712,755 $798,580 $376,309 $427,381 $408,052 $416,652
VALUE_AGGSALES $331,148 $391,179 $514,924 $204,385 $119,808 $303,855 $466,682
COUNT_DEFBUYS 28 25 25 25 27 20 19
COUNT_DEFSALES 8 10 13 23 12 15 18
VALUE_DEFBUYS $491,860 $473,669 $655,666 $409,529 $403,905 $653,847 $882,533
VALUE_DEFSALES $176,336 $242,898 $365,694 $503,756 $309,094 $709,273 $793,349
NET_FLOWDEF -$134,754 -$321,576 -$283,656 -$171,924 -$307,573 -$104,197 $50,030
TRADE_VALUE $1,465,245 $1,820,500 $2,334,864 $1,493,978 $1,260,188 $2,075,026 $2,559,216
The data shows the changes in the level of trading activity by SMSFs across
the period, with the number of average monthly trades by SMSFs (COUNT) falling
from 143 in 2005 to just 98 in 2011. Changes in COUNT_AGGBUYS, which
represents the average number of times per month that money was committed to an
‘aggressive’ investment, provides information relating to research question 2. This
considers whether SMSFs have become more conservative in their investment
approach since the global financial crisis. SMSFs within the sample were investing

52
money in aggressive investments on average 78 times per month prior to the
financial crisis (in 2006), but by 2011 this level of aggressive trading behaviour had
fallen to an average of just 32 such trades per month. This is matched by falls in the
number of transactions involving the sale of shares (COUNT_AGGSALES) which
declined from a high of 45 in 2007, to low of 11 in 2009. Differences can also be
observed in the value of share sales and purchases across the period. That is, the
average monthly dollar value of shares purchased (VALUE_AGGBUYS) fell from
$465,902 in 2005 to $376,309 in 2008, before recovering somewhat to $416,652 in
2011. Correspondingly, the average monthly dollar value of share sales
(VALUE_AGGSALES) rose from 2005 ($331,148) to 2011 ($466,682).
The average number of times per month that SMSFs were buying defensive
investments (COUNT_DEFBUYS) also fell across the period, with the highest
number of transactions occurring in 2005 (28) and falling to 19 in 2011. On the other
hand, COUNT_DEFSALES, which represents the average number of times that
SMSFs sold defensive investments, experienced an increase in occurrence over the
period, from 8 such transactions per month in 2005 to 18 transactions per month in
2011. Related to the changes in the number and dollar value of defensive investment
transactions, NET_FLOWDEF, which tracks the net amount of money invested in
defensive assets, was negative for all years from 2005 to 2010 and only turned
positive in 2011 ($50,030). The data also indicates that the overall average monthly
trade value has increased from the periods prior to the financial crisis, with the
exception of 2008 and 2009, where overall average monthly trade value fell sharply,
with a low of $1,260,188 in average monthly trades in 2009.
4.2.1.1 Analysis of the variable COUNT on an annual basis
While Table 4.1 does illustrate changes in the trading behaviour of SMSFs
over the period 2005 to 2011, it does not identify whether or not any such changes, if
present, were statistically significant. A multivariate analysis of variance test was
required to identify those changes in behaviour which were statistically different.
The variables in Table 4.1 were tested for significant differences across each year
using Fisher’s Least Significant Difference (LSD) test, based on a significance level
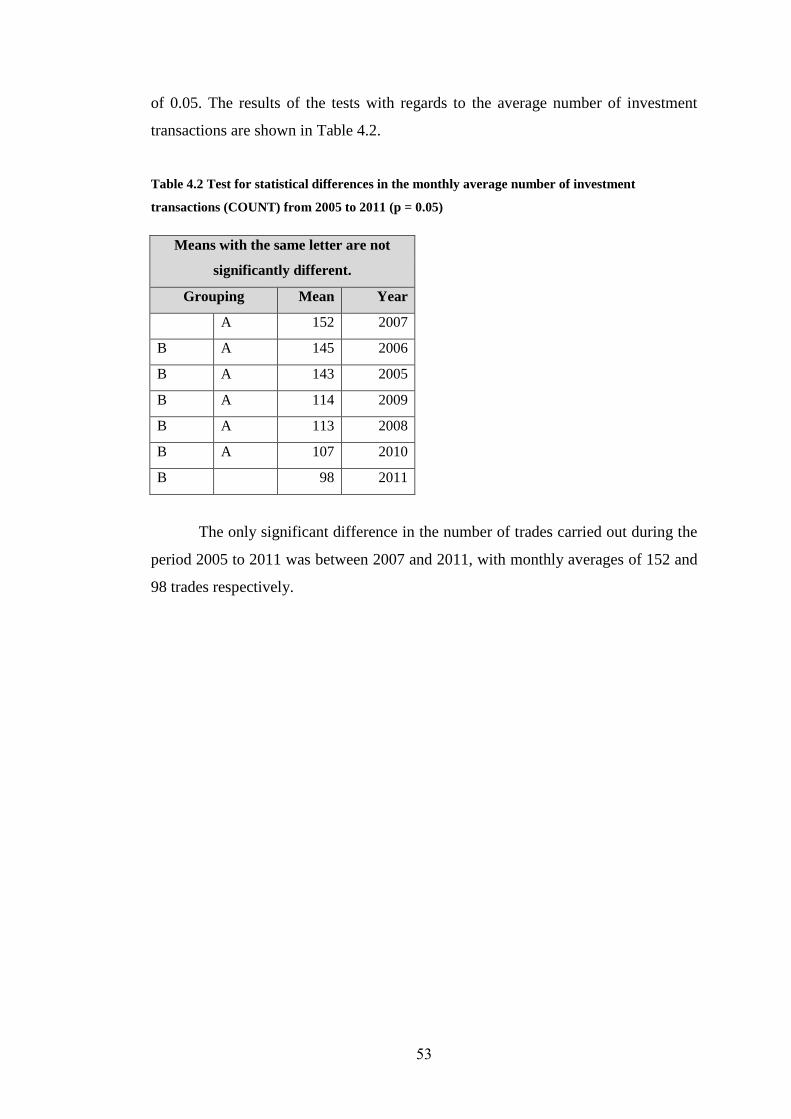
53
of 0.05. The results of the tests with regards to the average number of investment
transactions are shown in Table 4.2.
Table 4.2 Test for statistical differences in the monthly average number of investment
transactions (COUNT) from 2005 to 2011 (p = 0.05)
Means with the same letter are not
significantly different.
Grouping Mean Year
A 152 2007
B A 145 2006
B A 143 2005
B A 114 2009
B A 113 2008
B A 107 2010
B 98 2011
The only significant difference in the number of trades carried out during the
period 2005 to 2011 was between 2007 and 2011, with monthly averages of 152 and
98 trades respectively.

54
4.2.1.2 Analysis of the variable COUNT_AGGBUYS on an annual basis
Table 4.3 shows the results for the monthly average number of aggressive
investment purchases made between the years 2005 to 2011.
Table 4.3 Test for statistical differences in the monthly average number of aggressive purchase
transactions (COUNT_AGGBUYS) from 2005 to 2011 (p = 0.05)
Means with the same letter
are not significantly different.
Grouping Mean Year
A 78 2006
B A 75 2005
B A 69 2007
B A 64 2009
B C 47 2008
B C 46 2010
C 32 2011
The results show that significant differences existed in the number of
aggressive purchase transactions. The year 2006 (78) saw a significantly greater
number of such transactions as compared to 2008 (47), 2010 (46) and 2011 (32). The
year 2011 was also significantly lower than 2005 (75), 2007 (69) and 2009 (64).

55
4.2.1.3 Analysis of the variable COUNT_AGGSALES on an annual basis
Table 4.4 shows the results of the analysis of the monthly average number of
aggressive sales transactions (COUNT_AGGSALES).
Table 4.4 Test for statistical differences in the monthly average number of aggressive sales
transactions (COUNT_AGGSALES) from 2005 to 2011 (p = 0.05)
Means with the same letter are
not significantly different.
Grouping Mean Year
A 45 2007
B A 32 2005
B A 31 2006
B A C 29 2011
B A C 27 2010
B C 18 2008
C 11 2009
The level of sales of aggressive investments showed significant differences
between 2007 and 2009, 2007 and 2008, and 2005/06 and 2009 with the number of
such transactions being significantly higher in the earlier years of 2005 (32), 2006
(31) and 2007 (45).

56
4.2.1.4 Analysis of the variable VALUE_AGGBUYS on an annual basis
The results of the analysis of the variable VALUE_AGGBUYS, which relates
to the monthly average dollar value of purchases of aggressive investments, are
shown in Table 4.5.
Table 4.5 Test for statistical differences in the monthly average dollar value of aggressive
purchase transactions (VALUE_AGGBUYS) from 2005 to 2011 (p = 0.05)
Means with the same letter
are not significantly different.
Grouping Mean Year
A $798,580 2007
B A $712,755 2006
B A $465,902 2005
B $427,381 2009
B $416,652 2011
B $408,052 2010
B $376,309 2008
The only significant difference in the average monthly dollar value of
aggressive purchase transactions was between 2007 ($798,580) and the years from
2008 to 2011 (ranging from $376,309 to $427,381), with the value in 2007 being
significantly greater than the values recorded in 2008 to 2011.

57
4.2.1.5 Analysis of the variable VALUE_AGGSALES on an annual basis
In contrast to the level of aggressive investment purchases, significant differences in
the monthly average dollar value of aggressive investment sales are outlined in Table
4.6.
Table 4.6 Test for statistical differences in the monthly average dollar value of aggressive sales
transactions (VALUE_AGGSALES) from 2005 to 2011 (p = 0.05)
Means with the same letter are
not significantly different.
Grouping Mean Year
A $514,924 2007
A $466,682 2011
B A $391,179 2006
B A C $331,148 2005
B A C $303,855 2010
B C $204,385 2008
C $119,808 2009
The monthly average dollar value of aggressive sales transactions in 2009
($119,808) was significantly lower than the same transaction types in 2006
($391,179), 2007 ($514,924) and 2011 ($466,682). The year 2008 ($304,385) also
saw significantly fewer aggressive sales transactions than 2007 and 2011.

58
4.2.1.6 Analysis of the variable COUNT_DEFBUYS on an annual basis
The monthly average number of defensive investment purchase transactions
is shown in Table 4.7.
Table 4.7 Test for statistical differences in the monthly average number of defensive purchase
transactions (COUNT_DEFBUYS) from 2005 to 2011 (p = 0.05)
Means with the same letter
are not significantly different.
Grouping Mean Year
A 28 2005
A 27 2009
A 25 2006
A 25 2007
A 25 2008
A 20 2010
A 19 2011
There were no statistically significant differences in the monthly average
number of defensive investment purchases. While the years following the crisis
(2010 and 2011) did see a lower level of such transactions, this decline was not
significant at a significance level of 0.05.

59
4.2.1.7 Analysis of the variable COUNT_DEFSALES on an annual basis
The results of the same analysis with regards to the monthly average number
of defensive sales transaction is shown in Table 4.8.
Table 4.8 Test for statistical differences in the monthly average number of defensive sales
transactions (COUNT_DEFSALES) from 2005 to 2011 (p = 0.05)
Means with the same letter
are not significantly different.
Grouping Mean Year
A 23 2008
B A 18 2011
B A 15 2010
B A 13 2007
B A 12 2009
B 10 2006
B 8 2005
Significant differences in the monthly average number of defensive sales
transactions only existed between the year 2008 (23) and 2005 and 2006 (8 and 10
respectively), with a significantly larger number of such transactions occurring in
2008.

60
4.2.1.8 Analysis of the variable VALUE_DEFBUYS on an annual basis
With regards to the monthly average dollar value of defensive investment
purchases, the results of the analysis are detailed in Table 4.9.
Table 4.9 Test for statistical differences in the monthly average dollar value of defensive
purchase transactions (VALUE_DEFBUYS) from 2005 to 2011 (p = 0.05)
Means with the same letter
are not significantly different.
Grouping Mean Year
A $882,533 2011
B A $655,666 2007
B A $653,847 2010
B $491,860 2005
B $473,669 2006
B $409,529 2008
B $403,905 2009
The only significant difference in the monthly average dollar value of
defensive purchase transactions was between 2011 ($882,533) and the years 2005
($491,860), 2006 ($473,669), 2008 ($409,529) and 2009 ($403,905), with 2011
recording a significantly greater monthly average dollar value of defensive purchase
transactions.

61
4.2.1.9 Analysis of the variable VALUE_DEFSALES on an annual basis
The statistical analysis with regards to the average monthly dollar value of
defensive sales transactions is shown in Table 4.10.
Table 4.10 Test for statistical differences in the monthly average dollar value of defensive sales
transactions (VALUE_DEFSALES) from 2005 to 2011 (p = 0.05)
Means with the same letter
are not significantly different.
Grouping Mean Year
A $793,349 2011
A $709,273 2010
B A $503,756 2008
B C $365,694 2007
B C $309,094 2009
B C $242,898 2006
C $176,336 2005
The results of the analysis indicate that significant differences exist with
regards to transactions involving the sale of defensive investments in the years
following the crisis (2011 ($793,349) and 2010 ($709,273)) as compared to the years
prior to and during the crisis (2005 ($176,336), 2006 ($242,898), 2009 ($309,094)
and 2007 ($365,694)) which were significantly lower. The year 2008 ($503,756) was
also significantly greater than 2005.

62
4.2.1.10 Analysis of the variable NET_FLOWDEF on an annual basis
Results of the analysis of the variable NET_FLOWDEF, which indicates the
net flow of funds into defensive assets, are outlined in Table 4.11.
Table 4.11 Test for statistical differences in the monthly average net flow of money into
defensive assets (NET_FLOWDEF) from 2005 to 2011 (p = 0.05)
Means with the same letter
are not significantly different.
Grouping Mean Year
A $50,030 2011
B A -$104,197 2010
B A -$134,754 2005
B A -$171,924 2008
B A -$283,656 2007
B -$307,573 2009
B -$321,576 2006
There was a significantly higher monthly average net flow of funds into
defensive assets in 2011 ($50,030), as compared to both 2006 (-$321,576) and 2009
(-$307,573). The year 2010 (-$104,197) also saw a high monthly average net flow of
funds into defensive assets, but this was not significantly different to the level of
such transactions in other years over the period 2005 to 2011.

63
4.2.1.11 Analysis of the variable TRADE_VALUE on an annual basis
Table 4.12 outlines the results of the comparison in the monthly average total
trade value of all investment transactions.
Table 4.12 Test for statistical differences in the monthly average total trade value of all
investment transactions (TRADE_VALUE) from 2005 to 2011 (p = 0.05)
Means with the same letter are
not significantly different.
Grouping Mean Year
A $2,559,216 2011
A $2,334,864 2007
B A $2,075,026 2010
B A C $1,820,500 2006
B C $1,493,978 2008
B C $1,465,245 2005
C $1,260,188 2009
Significant differences were found in the monthly average total trade value
between 2009 and 2007, 2010 and 2011, with the latter three years all exhibiting a
significantly greater number of monthly average total trade values than 2009. The
years 2007 and 2011 were also significantly greater than 2005 and 2008.
4.2.2 Statistical Differences in SMSF Trading Behaviour on a Per-Period
Basis
The tests for significant differences between the variables covered in Tables
4.2 through 4.12 were based on the monthly averages of SMSF investment
transactions on an annual basis. The next stage of the study was based on the
monthly averages on a ‘per period’ basis. Three distinct time periods were identified:
Period 1: 1 January 2005 to 30 June 2008
Period 2: 1 July 2008 to 30 June 2009
Period 3: 1 July 2009 to 31 December 2011
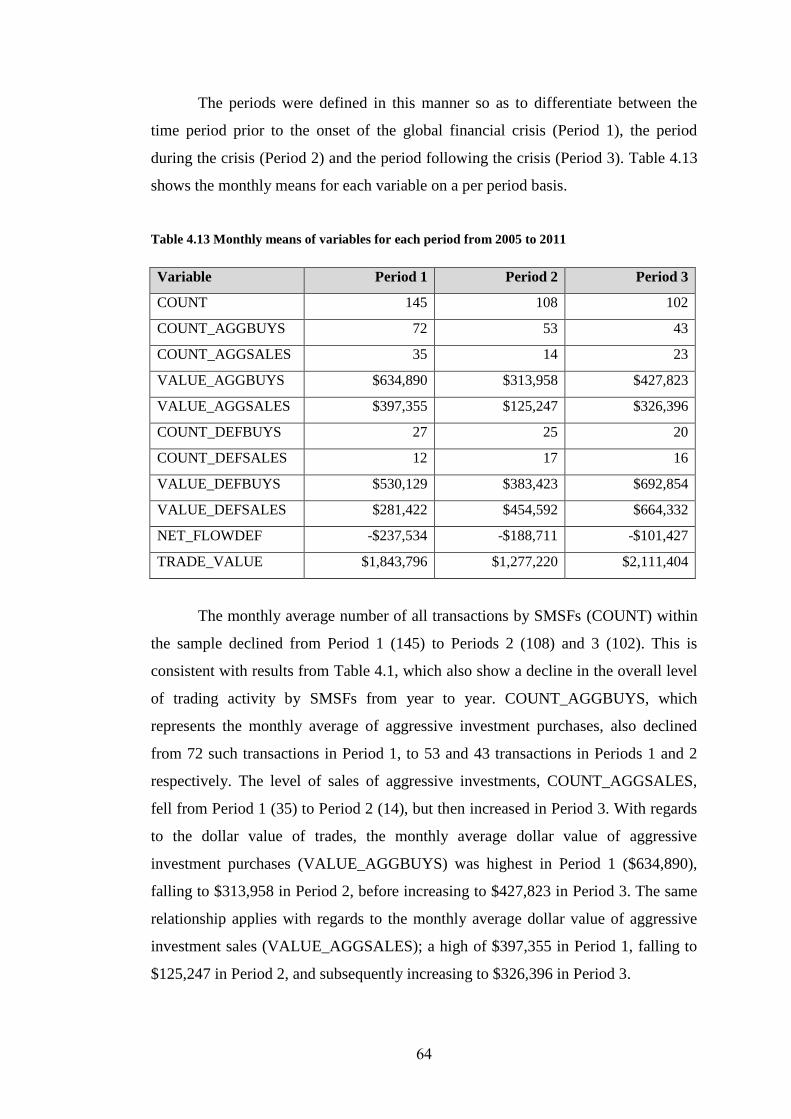
64
The periods were defined in this manner so as to differentiate between the
time period prior to the onset of the global financial crisis (Period 1), the period
during the crisis (Period 2) and the period following the crisis (Period 3). Table 4.13
shows the monthly means for each variable on a per period basis.
Table 4.13 Monthly means of variables for each period from 2005 to 2011
Variable Period 1 Period 2 Period 3
COUNT 145 108 102
COUNT_AGGBUYS 72 53 43
COUNT_AGGSALES 35 14 23
VALUE_AGGBUYS $634,890 $313,958 $427,823
VALUE_AGGSALES $397,355 $125,247 $326,396
COUNT_DEFBUYS 27 25 20
COUNT_DEFSALES 12 17 16
VALUE_DEFBUYS $530,129 $383,423 $692,854
VALUE_DEFSALES $281,422 $454,592 $664,332
NET_FLOWDEF -$237,534 -$188,711 -$101,427
TRADE_VALUE $1,843,796 $1,277,220 $2,111,404
The monthly average number of all transactions by SMSFs (COUNT) within
the sample declined from Period 1 (145) to Periods 2 (108) and 3 (102). This is
consistent with results from Table 4.1, which also show a decline in the overall level
of trading activity by SMSFs from year to year. COUNT_AGGBUYS, which
represents the monthly average of aggressive investment purchases, also declined
from 72 such transactions in Period 1, to 53 and 43 transactions in Periods 1 and 2
respectively. The level of sales of aggressive investments, COUNT_AGGSALES,
fell from Period 1 (35) to Period 2 (14), but then increased in Period 3. With regards
to the dollar value of trades, the monthly average dollar value of aggressive
investment purchases (VALUE_AGGBUYS) was highest in Period 1 ($634,890),
falling to $313,958 in Period 2, before increasing to $427,823 in Period 3. The same
relationship applies with regards to the monthly average dollar value of aggressive
investment sales (VALUE_AGGSALES); a high of $397,355 in Period 1, falling to
$125,247 in Period 2, and subsequently increasing to $326,396 in Period 3.

65
The monthly average dollar value and number of defensive transactions show
slightly different patterns as compared to the aggressive transactions.
COUNT_DEFBUYS, which represents the average monthly number of defensive
investment purchases, decreased slightly from Period 1 (27) to Period 2 (25),
followed by a larger decline in Period 3 (20). When considering the average monthly
dollar value of defensive investment sales (COUNT_DEFSALES) however, this
increased from 12 such transactions in Period 1, to 17 and 16 transactions in Periods
2 and 3 respectively. The average monthly dollar value of defensive investment
purchases, VALUE_DEFBUYS, which indicates the extent to which SMSF trustees
were committing funds to defensive investments, fell from $530,129 in Period 1 to
$383,423 in Period 2, before increasing to $692,854 in Period 3. The average
monthly dollar value of defensive investment sales increased across the three time
periods, from $281,422 in Period 1, to $454,592 in Period 2, and to $664,332 in
Period 3. NET_FLOWDEF, which measures the level of net flow of funds into
defensive investments, remained negative in each period, however the flow of funds
into defensive investments did increase between periods. Period 1 showed
NET_FLOWDEF of -$237,534, increasing to -$188,711 in Period 2, and increasing
again to -$101,427 in Period 3. NET_TRADEVALUE, which shows the total
average monthly dollar value of all transaction per period, fell from Period 1
($1,843,796) to Period 2 ($1,277,220), but increased in Period 3 ($2,111,404).
4.2.2.1 Analysis of the variable COUNT on a per-period basis
As with the variables on an annual basis, the variables in Table 4.13 were
analysed to determine whether or not any differences between the time periods (if
they existed) were statistically significant. Table 4.14 shows the results for the
variable COUNT over the three time periods.

66
Table 4.14 Test for statistical differences in the monthly average number of investment
transactions (COUNT) between Periods 1, 2 and 3 (p = 0.05)
Comparisons significant at the 0.05 level
are indicated by ***.
Difference
Period Between
Comparison Means
1 – 2 37
1 – 3 43 ***
2 – 1 -37
2 – 3 6
3 – 1 -43 ***
3 – 2 -6
A statistically significant difference in the average number of monthly
transactions between Periods 1 and 3 was found, with a higher average number of
monthly transactions in Period 1 (145) compared to Period 3 (102).

67
4.2.2.2 Analysis of the variable COUNT_AGGBUYS on a per-period
basis
Table 4.15 outlines the results of the analysis of the monthly average number
of aggressive purchase transactions (COUNT_AGGBUYS).
Table 4.15 Test for statistical differences in the monthly average number of aggressive purchase
transactions (COUNT_AGGBUYS) between Periods 1, 2 and 3 (p = 0.05)
Comparisons significant at the 0.05 level
are indicated by ***.
Difference
Period Between
Comparison Means
1 - 2 19
1 - 3 29 ***
2 - 1 -19
2 - 3 10
3 - 1 -29 ***
3 - 2 -10
A statistically significant difference was found in the average monthly
number of aggressive purchase transactions between Period 1 (72) and Period 3 (43),
with Period 1 recording a significantly greater number of transactions.

68
4.2.2.3 Analysis of the variable COUNT_AGGSALES on a per-period
basis
Table 4.16 shows the results of the analysis of the monthly average number
of aggressive sales transactions between the three time periods
(COUNT_AGGSALES).
Table 4.16 Test for statistical differences in the monthly average number of aggressive sales
transactions (COUNT_AGGSALES) between Periods 1, 2 and 3 (p = 0.05)
Comparisons significant at the 0.05 level
are indicated by ***.
Difference
Period Between
Comparison Means
1 - 3 12 ***
1 - 2 20 ***
3 - 1 -12 ***
3 - 2 9
2 - 1 -20 ***
2 - 3 -9
Statistically significant differences were found in the monthly average
number of aggressive sales transactions between both Period 1 and Period 2, and
Period 2 and Period 3 (with a difference between the means of 12 and 20
respectively, indicating a significantly greater number of such transactions in Period
1). There was no significant difference in the monthly average number of sales
transactions between Period 2 and Period 3.

69
4.2.2.4 Analysis of the variable VALUE_AGGBUYS on a per-period basis
Table 4.17 shows the results of the analysis of the monthly average dollar
value of aggressive purchase transactions (VALUE_AGGBUYS).
Table 4.17 Test for statistical differences in the monthly average dollar value of aggressive
purchase transactions (VALUE_AGGBUYS) between Periods 1, 2 and 3 (p = 0.05)
Comparisons significant at the 0.05 level
are indicated by ***.
Difference
Period Between
Comparison Means
1 - 3 $207,067 ***
1 - 2 $320,932 ***
3 - 1 -$207,067 ***
3 - 2 $113,865
2 - 1 -$320,932 ***
2 - 3 -$113,865
The monthly average dollar value of aggressive purchase transactions showed
significant differences between Period 1 and both Period 2 and 3. Period 1 recorded a
significantly higher level of such transactions per month; $207,067 greater on
average than Period 3 and $320,932 greater on average than Period 2.

70
4.2.2.5 Analysis of the variable VALUE_AGGSALES on a per-period
basis
The results of the analysis with regards to the monthly average dollar value of
aggressive sales transactions are shown in Table 4.18.
Table 4.18 Test for statistical differences in the monthly average dollar value of aggressive sales
transactions (VALUE_AGGSALES) between Periods 1, 2 and 3 (p = 0.05)
Comparisons significant at the 0.05 level
are indicated by ***.
Difference
Period Between
Comparison Means
1 - 3 $70,960
1 - 2 $272,108 ***
3 - 1 -$70,960
3 - 2 $201,148
2 - 1 -$272,108 ***
2 - 3 -$201,148
An indication of the extent to which SMSF trustees were reducing their
exposure to riskier assets is the monthly average dollar value of aggressive sales
transactions. The analysis of the variable VALUE_AGGSALES over the period 2005
to 2011 showed a significant difference in the level of such transactions between
Period 1 (pre-crisis) and Period 2 (during the crisis). Period 1 exhibited a
significantly higher monthly average dollar value of aggressive sales transactions as
compared to Period 2, with a difference between means of $272,108. No other
significant differences in the monthly average dollar value of such transactions were
found.

71
4.2.2.6 Analysis of the variable COUNT_DEFBUYS on a per-period basis
Table 4.19 shows the analysis of the monthly average number of defensive
purchase transactions (COUNT_DEFBUYS).
Table 4.19 Test for statistical differences in the monthly average number of defensive purchase
transactions (COUNT_DEFBUYS) between Periods 1, 2 and 3 (p = 0.05)
Comparisons significant at the 0.05 level
are indicated by ***.
Difference
Period Between
Comparison Means
1 - 2 2
1 - 3 7
2 - 1 -2
2 - 3 4
3 - 1 -7
3 - 2 -4
The monthly average number of defensive purchase transactions reflects the
extent to which SMSF trustees were increasing their holdings of defensive
investments. No significant differences were detected in the number of defensive
purchase transactions between the three time periods.

72
4.2.2.7 Analysis of the variable COUNT_DEFSALES on a per-period
basis
Table 4.20 shows the analysis of the monthly average number of defensive
sales transactions.
Table 4.20 Test for statistical differences in the monthly average number of defensive sales
transactions (COUNT_DEFSALES) between Periods 1, 2 and 3 (p = 0.05)
Comparisons significant at the 0.05 level
are indicated by ***.
Difference
Period Between
Comparison Means
2 - 3 1
2 - 1 4
3 - 2 -1
3 - 1 4
1 - 2 -4
1 - 3 -4
Similar to the monthly average number of defensive purchase transactions, no
statistically significant differences were detected in the monthly average number of
defensive sales transactions between the three time periods.

73
4.2.2.8 Analysis of the variable VALUE_DEFBUYS on a per-period basis
Table 4.21 shows the analysis of the monthly average dollar value of
defensive purchase transactions between the three time periods.
Table 4.21 Test for statistical differences in the monthly average dollar value of defensive
purchase transactions (VALUE_DEFBUYS) between Periods 1, 2 and 3 (p = 0.05)
Comparisons significant at the 0.05 level
are indicated by ***.
Difference
Period Between
Comparison Means
3 - 1 $162,725
3 - 2 $309,431 ***
1 - 3 -$162,725
1 - 2 $146,706
2 - 3 -$309,431 ***
2 - 1 -$146,706
Period 3 exhibited a statistically significantly higher monthly average dollar
of defensive purchase transactions as compared to Period 2, with a difference of
$309,431 between the mean values for each period.

74
4.2.2.9 Analysis of the variable VALUE_DEFSALES on a per-period
basis
Table 4.22 outlines the results of the analysis with regards to the monthly
average dollar value of defensive sales transactions between the three time periods.
Table 4.22 Test for statistical differences in the monthly average dollar value of defensive sales
transactions (VALUE_DEFSALES) between Periods 1, 2 and 3 (p = 0.05)
Comparisons significant at the 0.05 level
are indicated by ***.
Difference
Period Between
Comparison Means
3 - 2 $209,739
3 - 1 $382,909 ***
2 - 3 -$209,739
2 - 1 $173,170
1 - 3 -$382,909 ***
1 - 2 -$173,170
A statistically significant difference was found in the monthly average dollar
value of defensive sales transactions between Period 1 and Period 3, with Period 3
exhibiting mean monthly dollar values of defensive sales transactions $382,909
greater than Period 1.
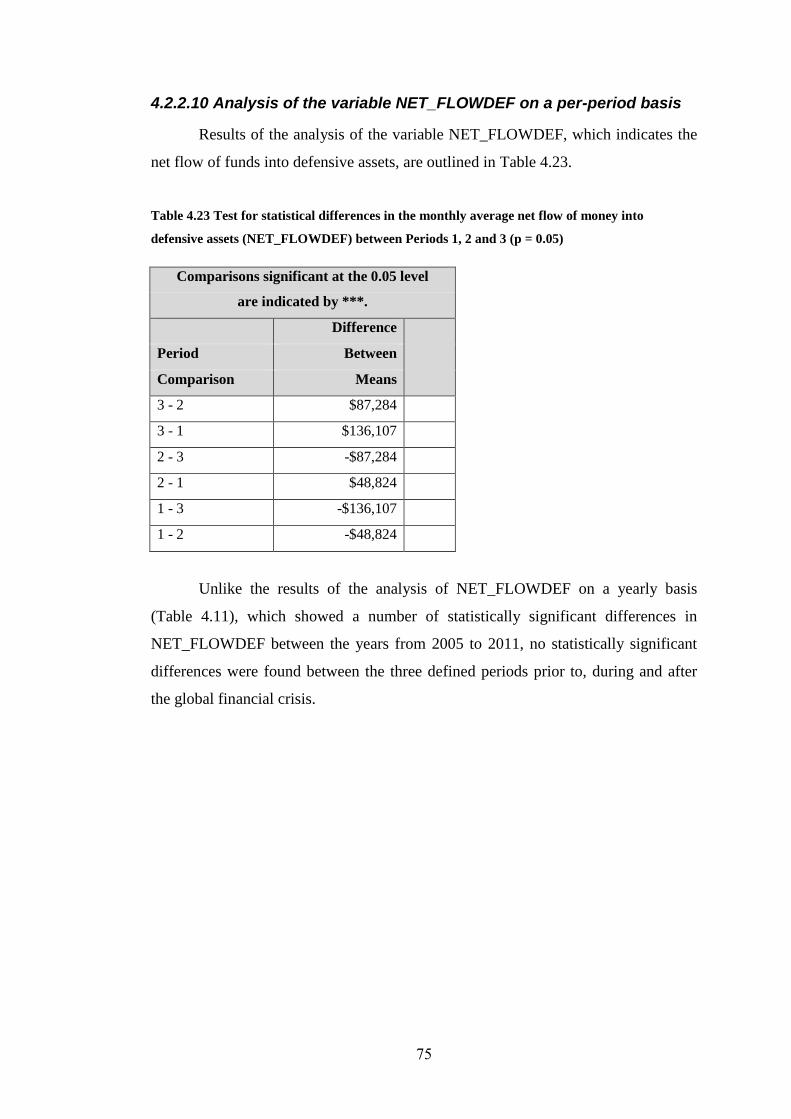
75
4.2.2.10 Analysis of the variable NET_FLOWDEF on a per-period basis
Results of the analysis of the variable NET_FLOWDEF, which indicates the
net flow of funds into defensive assets, are outlined in Table 4.23.
Table 4.23 Test for statistical differences in the monthly average net flow of money into
defensive assets (NET_FLOWDEF) between Periods 1, 2 and 3 (p = 0.05)
Comparisons significant at the 0.05 level
are indicated by ***.
Difference
Period Between
Comparison Means
3 - 2 $87,284
3 - 1 $136,107
2 - 3 -$87,284
2 - 1 $48,824
1 - 3 -$136,107
1 - 2 -$48,824
Unlike the results of the analysis of NET_FLOWDEF on a yearly basis
(Table 4.11), which showed a number of statistically significant differences in
NET_FLOWDEF between the years from 2005 to 2011, no statistically significant
differences were found between the three defined periods prior to, during and after
the global financial crisis.

76
4.2.2.11 Analysis of the variable TRADE_VALUE on a per-period basis
The results of the analysis of the monthly average total trade value between
the three defined time periods are shown in Table 4.24.
Table 4.24 Test for statistical differences in the monthly average total trade value of all
investment transactions (TRADE_VALUE) between Periods 1, 2 and 3 (p = 0.05)
Comparisons significant at the 0.05 level
are indicated by ***.
Difference
Period Between
Comparison Means
3 - 1 $267,607
3 - 2 $834,184 ***
1 - 3 -$267,607
1 - 2 $566,576
2 - 3 -$834,184 ***
2 - 1 -$566,576
Period 3 exhibited a significantly greater monthly average total trade value
than Period 2, with $834,184 greater monthly average trade values than Period 2.
This is consistent with the results in Table 4.12 which showed that 2009 (which
forms part of Period 2) had a significantly lower monthly average total trade value
than the other years from 2005 to 2011.
4.3 Conclusion
This chapter presented the results of the analysis of SMSFs within the sample
on both an annual basis and on a ‘per period’ basis. The analysis on an annual basis
allows for a more ‘granular’ view of SMSF trading activity over the period 2005 to
2011, while the ‘per period’ analysis makes greater allowance for generalisations
regarding the trading behaviour of SMSFs prior to, during and following the 2008
financial crisis.

77
When considering SMSF trading behaviour on an annual basis, trading
frequency decreased considerably over the period 2005 to 2011, while that period
following the financial crisis (Period 3) saw significantly fewer average monthly
trades than that period leading up to the financial crisis (Period 1). These findings
appear to indicate that the financial crisis had a significant negative impact on SMSF
trustee willingness to trade. In contrast however, the dollar value of average monthly
trades by SMSF trustees did not exhibit the same pattern. Those years following the
crisis generally saw greater monthly average trade values as compared to prior to or
during the crisis, while Period 3, which followed the crisis, also exhibited greater
monthly average trade value when compared to both prior to and during the crisis.
SMSF trustees may have traded less following the crisis, but the dollar values they
were willing to commit to each trade was larger in the period following the financial
crisis. Investment transactions which increased SMSF exposure to riskier assets are
those transactions which involved the purchase of aggressive investments or the sale
of defensive investments. The results indicate that SMSFs were, in general,
increasing their exposure to riskier assets immediately prior to the financial crisis.
Conversely, those transactions which involve increasing exposure to defensive assets
tend to indicate that SMSF trustees were more likely to increase defensive asset
exposure in the period following the financial crisis. The variable which measures
the net flow of funds into defensive assets, NET_FLOWDEF, appears to confirm this
result, with a greater net flow of funds into defensive assets in 2010, 2011 and Period
3 (although it must be noted that the result for NET_FLOWDEF in Period 3 was not
significantly greater than in Periods 1 and 2).
The results of the analysis provide an insight into SMSF trustees’ appetite for
risk. It has been shown that an individual’s risk appetite is not fixed, but can vary
over time (Gai & Vause 2005). In particular, it has been found that risk appetite
tends to be stable during economic and market periods of relative calm, but can
fluctuate considerably in response to external shocks. The action taken by SMSF
trustees to increase their exposure to defensive investments in that period
immediately following the 2008 crisis supports this conclusion. Interestingly
however, at the peak of the 2008 financial crisis, during a period of significant falls
on equity markets, there is little evidence that SMSF trustees acted to reduce their
market risk exposure. It was only after the crisis had peaked that there was evidence

78
of a change in the risk appetite of SMSF trustees. This suggests that SMSF trustees
may have been frozen in inaction during the worst of the crisis; concerned about
severe investment losses but too fearful to make significant changes to their market
risk exposure. It was only after the apparent passage of the worst of the crisis that
trustees evidenced a significant change in their appetite for risk, increasing their
exposure to defensive assets long after such a course of action would have been
proven to be prudent. This may indicate the existence of the availability heuristic,
where SMSF trustees overestimated the likelihood of another financial crisis, with
the memory of the 2008 crisis fresh in their minds. This confirms work by Frieder
(2004), who found evidence of the availability heuristic in US investors. The results
also point to the potential for cognitive dissonance within SMSF trustees during the
crisis, which describes a mental tension which exists when an individual holds two
beliefs which are psychologically incompatible (Olsen 2008). SMSF trustees may
have believed that equity markets would continue to provide positive investment
returns, even as markets fell sharply over 2008 and early 2009. SMSF trustees may
have been unwilling to reduce their investment risk exposure even during a
significant bear market, believing that equity markets could not fall further, even in
the face of evidence to the contrary. This behaviour by SMSF trustees also suggests
the presence of loss aversion in trustee trading behaviour. SMSF trustees may have
been unwilling to sell higher risk investments as markets fell, for fear of realising
significant losses on these market linked investments. This type of behaviour closely
matches the description of loss aversion as outlined by Kahneman and Tversky
(1979).
The lack of action by SMSF trustees to reduce their exposure to higher risk
investments in the period leading up to the financial crisis is also a potential
indication of representative bias by SMSF trustees. That is, on the eve of the 2008
financial crisis SMSF trustees acted in a manner which suggests that they expected
the rise in equity markets prior to the crisis to continue in that manner indefinitely.
Were this not the case, SMSF trustees would have been expected to undertake a
significant level of transactions involving the sale of higher risk investments, without
a corresponding number of transactions involving the purchase of higher risk
investments. There is no evidence of this in the results of the analysis. It therefore
appears that SMSF trustees considered the probability of a significant fall in the

79
market to be low, given the lengthy period of positive investment returns in that
period leading up to the 2008 financial crisis, behaviour consistent with
representativeness as outlined by Kahneman and Tversky (1972).
This chapter presented the results of the analysis of the trading behaviour of
SMSFs within the sample for each year from 2005 to 2011 and across the three
identified time periods over the same length of time. The results appear to indicate
that SMSF trustees were not appropriately positioning their portfolios with a more
defensive stance on the eve of the crisis, and that the financial crisis has had an
impact on the willingness of SMSF trustees to increase market risk exposure. There
is also evidence of the existence of a number of behavioural biases of SMSF trustees,
including representativeness, loss aversion and the availability heuristic. This section
of the study focused on the overall level of activity of funds within the sample.
Chapters 5 and 6 which follow present the same analysis of the variables outlined in
Table 4.1, but based on segmenting the funds by size and by risk profile respectively.

80
CHAPTER 5
RESULTS: TRADING BEHAVIOUR AND FUND SIZE
5.1 Introduction
The previous chapter presented the results of the analysis of SMSF
investment transactions over the period 2005 to 2011. This was done on both an
annual basis and by reference to the three time periods prior to, during and after the
global financial crisis. This chapter presents the results of the analysis of the trading
behaviour of SMSFs on the basis of fund size. This analysis seeks to address the
question of whether or not funds of different sizes exhibited the same trading
behaviour over the period 2005 to 2011.
The reasoning behind segmenting SMSFs within the sample based on fund
size is to allow for conclusions to be drawn regarding the relevance of fund size as a
predictor of trustee behaviour. For example, do trustees of larger funds exhibit
different patterns of trading behaviour as compared to smaller funds? Are trustees of
larger (or smaller) funds more likely to adopt an aggressive (or defensive) approach?
As larger funds may be a proxy for overall trustee wealth and potentially investor
sophistication, do such funds exhibit a more sophisticated investment approach than
trustees of smaller funds? These are the types of questions which may be addressed
through an analysis of trustee trading behaviour on the basis of fund size. In order to
allow for a fair comparison, the trading behaviour of each fund size category was
compared with the same funds over the period prior to, during and following the
crisis. A direct comparison between funds of different sizes would not be useful as it
would reasonably be expected, for example, that larger funds would have a higher
dollar value investment turnover than smaller funds. Therefore the trading behaviour
of funds within each identified fund size category are compared across the time
period with one another, rather than being compared across size categories.

81
5.2 Statistical Differences in SMSF Trading Behaviour Based
on Fund Size
The SMSFs within the sample data were segmented into three groups based
on their size as 1 January 2005 and were tested for significant differences in each of
the variables as defined in Table 3.7. The mean values for each of the variables for
funds in group 1 are shown in Table 5.1. Group 1 funds are those funds with less
than $350,000 in assets.
Table 5.1 Monthly means of variables for group 1 funds (small funds) for each year from 2005
to 2011
Year 2005 2006 2007 2008 2009 2010 2011
COUNT 30 34 39 31 33 33 24
COUNT_AGGBUYS 14 17 19 12 18 15 8
COUNT_AGGSALES 9 8 11 5 3 7 6
VALUE_AGGBUYS $86,189 $184,407 $260,106 $136,358 $119,012 $134,894 $104,415
VALUE_AGGSALES $151,248 $149,899 $192,301 $93,164 $55,879 $121,032 $122,980
COUNT_DEFBUYS 5 6 6 8 9 7 5
COUNT_DEFSALES 2 3 3 6 4 5 5
VALUE_DEFBUYS $132,889 $149,927 $184,271 $148,172 $171,433 $378,067 $330,129
VALUE_DEFSALES $63,103 $104,353 $120,670 $177,438 $147,962 $383,818 $337,993
NET_FLOWDEF $65,059 -$34,508 -$67,805 -$43,193 -$63,133 -$13,861 $18,565
TRADE_VALUE $433,429 $588,585 $757,348 $555,132 $494,286 $1,017,811 $895,517
The data shows the frequency of trading activity by small funds was
relatively consistent over the period 2005 to 2011. Those variables which measure
the frequency of each type of trading activity, such as COUNT,
COUNT_AGGBUYS, COUNT_AGGSALES, COUNT_DEFBUYS and
COUNT_DEFSALES, show only minor deviation across the time period under
consideration. Differences in the dollar value of each type of trading activity are
more pronounced however, with VALUE_AGGBUYS peaking at an average of
$260,106 per month in 2007, before falling both during and after the onset of the
financial crisis. A similar change is apparent with regards to VALUE_AGGSALES,
which fell from a monthly average of $192,301 of such trades in 2007 to $55,879 in
2009. NET_FLOWDEF, which measures the net flow of funds into defensive assets
was negative for the majority of the years preceding the financial crisis, as well as

82
during the financial crisis. In 2010 and 2011 however, there was a pronounced
increase in the net flow of finds into defensive assets, with 2010 exhibiting a monthly
mean value of just -$13,861 before NET_FLOWDEF turned positive in 2011 with a
monthly mean of $18,565. This is consistent with the data in Table 4.1 in Chapter 4
which showed a similar change across all funds within the SMSF sample.
Table 5.2 shows the monthly means for each of the variables of group 2
funds, which are those funds with greater than $350,000 but less than $750,000 in
assets as at 1 January 2005.
Table 5.2 Monthly means of variables for group 2 funds (medium funds) for each year from
2005 to 2011
Year 2005 2006 2007 2008 2009 2010 2011
COUNT 37 30 31 21 25 16 19
COUNT_AGGBUYS 17 15 11 8 14 7 5
COUNT_AGGSALES 12 7 11 2 2 2 6
VALUE_AGGBUYS $66,446 $131,289 $94,327 $44,065 $132,317 $43,677 $43,000
VALUE_AGGSALES $113,945 $67,999 $89,544 $19,657 $13,560 $39,546 $115,156
COUNT_DEFBUYS 7 5 5 5 6 4 4
COUNT_DEFSALES 2 2 3 6 4 3 4
VALUE_DEFBUYS $145,416 $93,546 $151,067 $95,104 $126,891 $66,140 $100,773
VALUE_DEFSALES $53,371 $51,398 $119,880 $121,814 $101,309 $71,414 $107,179
NET_FLOWDEF $47,499 -$63,290 -$4,783 -$24,408 -$118,758 -$4,131 $72,157
TRADE_VALUE $379,178 $344,231 $454,818 $280,640 $374,077 $220,777 $366,109
Unlike small funds, medium sized funds within the sample exhibit different
trading activity patterns over the period 2005 to 2011, with those variables which
measure trading frequency (COUNT, COUNT_AGGBUYS, COUNT_AGGSALES,
COUNT_DEFBUYS and COUNT_DEFSALES) varying noticeably in the periods
before, during and after the financial crisis. For example, the variable COUNT,
which measures the average monthly number of investment trades for funds within
the sample group, was above 30 in each of the years preceding the crisis, before
falling to an average of 21 in 2008 and reaching a low of 16 in 2010. In addition to
variations in the frequency of trades, the dollar value of trading activity also varied
over the period 2005 to 2011. VALUE_AGGBUYS, which measures the dollar value
of trades that are associated with the purchase of ‘aggressive’ investments, fell from
$94,327 in 2007 to $44,065 in 2008 as the financial crisis developed, although the

83
variable did record an increase to $132,217 in 2009. NET_FLOWDEF, which
measures the net flow of funds into defensive assets, was negative in the years prior
to the financial crisis, although it did increase from -$63,290 in 2006 to -$4,783 in
2007, which was immediately prior to the financial crisis.
The third sub-set of funds within the sample, large funds, were those funds
which held total assets of greater than $750,000 as at 1 January 2005. As with both
‘small’ and ‘medium’ funds, the transaction variables for these funds were calculated
and are outlined in Table 5.3.
Table 5.3 Monthly means of variables for group 3 funds (large funds) for each year from 2005 to
2011
Year 2005 2006 2007 2008 2009 2010 2011
COUNT 52 57 56 43 36 41 41
COUNT_AGGBUYS 29 31 24 17 20 17 16
COUNT_AGGSALES 10 12 18 9 5 14 12
VALUE_AGGBUYS $141,592 $227,723 $231,930 $134,304 $113,991 $163,270 $192,006
VALUE_AGGSALES $58,696 $85,033 $123,725 $68,323 $34,333 $108,661 $145,788
COUNT_DEFBUYS 10 9 9 9 8 6 8
COUNT_DEFSALES 4 3 5 9 3 4 6
VALUE_DEFBUYS $131,937 $132,927 $180,566 $101,843 $68,173 $109,640 $125,445
VALUE_DEFSALES $57,157 $52,647 $94,426 $127,213 $43,712 $100,052 $121,833
NET_FLOWDEF -$82,897 -$142,690 -$108,205 -$65,981 -$79,658 -$54,610 -$46,218
TRADE_VALUE $389,382 $498,329 $630,646 $431,683 $260,208 $481,623 $585,071
As with medium-sized funds, large funds within the sample also exhibited
differences in the level of transaction activity over the period 2005 to 2011. The
average monthly number of trades (COUNT) peaked two years before the onset of
the financial crisis, with an average of 57 trades per month in 2006. In 2009 the level
of activity dropped to an average of just 36 transactions per month, a 37% reduction
in trading activity. COUNT_AGGBUYS and VALUE_AGGBUYS, which measure
the level of aggressive investment transactions for each period, also peaked prior to
the crisis and declined in the years during and following the crisis.
COUNT_AGGBUYS, which measures the monthly number of aggressive
transactions, peaked the year before the onset of the crisis, with an average of 31
such transactions in 2006, as compared to an average of just 17 such transactions in
2006. NET_FLOWDEF, which measures the net flow of investment funds, remained

84
negative throughout the period 2005 to 2011, although it did increase from -$142,690
in 2006 to -$46,218 in 2011.
While the nominal values of each transaction variable outlined in Tables 5.1,
5.2 and 5.3 are informative, the data as presented does not indicate whether or not
any of the changes, if present, were statistically significant or could be explained by
normal variations in the data. Therefore the next step was to test the variables in
Tables 5.1, 5.2 and 5.3 for significant differences across each year using Fisher’s
Least Significant Difference (LSD) test, based on a significance level of 0.05. The
results of the tests are grouped based on each variable being tested. This begins with
the results of the analysis of the variable COUNT for each of the three fund size
groupings.
5.2.1 Analysis of the Variable COUNT Based on Fund Size
Tables 5.4, 5.5 and 5.6 present the results of the analysis of the variable
COUNT for each of the three different fund size groupings, being small, medium and
large funds respectively.
Table 5.4 Test for statistical differences in the monthly average number of investment
transactions (COUNT) from 2005 to 2011 for group 1 funds (small funds) (p = 0.05)
Means with the same letter
are not significantly different.
Grouping Mean Year
A 39 2007
B A 34 2006
B A 33 2009
B A 33 2010
B A 31 2008
B A 30 2005
B 24 2011

85
For smaller SMSFs within the sample, there was a statistically significant
greater difference in the average number of monthly transactions between the years
2007 and 2011, with respective monthly mean trades of 39 and 24.
Table 5.5 Test for statistical differences in the monthly average number of investment
transactions (COUNT) from 2005 to 2011 for group 2 funds (medium funds) (p = 0.05)
Means with the same letter are
not significantly different.
Grouping Mean Year
A 37 2005
B A 31 2007
B A 30 2006
B A C 25 2009
B C 21 2008
B C 19 2011
C 16 2010
Similar to smaller funds, medium-sized funds within the sample show
significant differences in the level of trading activity across the period prior to,
during and after the financial crisis. 2005 saw a significantly greater level of trading
activity, with a monthly average of 37 transactions, as compared to 2008 (21), 2010
(16) and 2011 (19). The years 2006 (30) and 2007 (31) were also significantly
greater than 2010.

86
Table 5.6 Test for statistical differences in the monthly average number of investment
transactions (COUNT) from 2005 to 2011 for group 3 funds (large funds) (p = 0.05)
Means with the same letter
are not significantly different.
Grouping Mean Year
A 57 2006
A 56 2007
A 52 2005
A 43 2008
A 41 2011
A 41 2010
A 36 2009
Unlike small funds and medium-sized funds, large SMSFs within the sample
showed no significant differences in the overall level of trading activity across the
period 2005 to 2011.
5.2.2 Analysis of the Variable COUNT_AGGBUYS Based on Fund Size
Tables 5.7, 5.8 and 5.9 outline whether the three different fund size groups
showed evidence of significant changes in the monthly average number of aggressive
investment purchase transactions (COUNT_AGGBUYS), which illustrates trustees
acting to increase the level of market risk associated with the fund’s investments.

87
Table 5.7 Test for statistical differences in the monthly average number of aggressive purchase
transactions (COUNT_AGGBUYS) from 2005 to 2011 for group 1 funds (small funds) (p = 0.05)
Means with the same letter
are not significantly different.
Grouping Mean Year
A 19 2007
A 18 2009
A 17 2006
B A 15 2010
B A 14 2005
B A 12 2008
B 8 2011
The results in Table 5.7 show that significant differences in the monthly
average number of aggressive purchase transactions existed between 2011 and the
years 2006, 2007 and 2009, with 2011 having a significantly lower average of only 8
such transactions per month.
Table 5.8 Test for statistical differences in the monthly average number of aggressive purchase
transactions (COUNT_AGGBUYS) from 2005 to 2011 for group 2 funds (medium funds) (p =
0.05)
Means with the same letter are
not significantly different.
Grouping Mean Year
A 17 2005
A 15 2006
B A 14 2009
B A C 11 2007
B D C 8 2008
D C 7 2010
D 5 2011
A number of significant differences in the monthly average aggressive
investment purchase transactions were evident with regards to medium sized funds.
The years following the crisis showed a number of differences, where 2011 and 2010

88
had a significantly lower number of aggressive investment purchase transactions than
2005, 2006, 2007 and 2009. The year 2008 also saw a statistically significant lower
number of such transactions as compared to 2005 and 2006.
Table 5.9 Test for statistical differences in the monthly average number of aggressive purchase
transactions (COUNT_AGGBUYS) from 2005 to 2011 for group 3 funds (large funds) (p = 0.05)
Means with the same letter
are not significantly different.
Grouping Mean Year
A 31 2006
B A 29 2005
B A 24 2007
B A 20 2009
B 17 2008
B 17 2010
B 16 2011
For large SMSFs within the sample, a significant difference in the monthly
average number of aggressive purchase transactions was found between 2006 and the
years 2008, 2010 and 2011. The year 2006 registered a monthly average of 31 such
transactions, compared to 16 in 2011, and 17 in both 2010 and 2008.
5.2.3 Analysis of the Variable COUNT_AGGSALES Based on Fund Size
Tables 5.10, 5.11 and 5.12 show the results of the analysis of the monthly
average number of aggressive investment sales transactions (COUNT_AGGSALES)
for small, medium and large funds respectively.

89
Table 5.10 Test for statistical differences in the monthly average number of aggressive sales
transactions (COUNT_AGGSALES) from 2005 to 2011 for group 1 funds (small funds) (p =
0.05)
Means with the same letter are
not significantly different.
Grouping Mean Year
A 11 2007
B A 9 2005
B A C 8 2006
B A C 7 2010
B A C 6 2011
B C 5 2008
C 3 2009
Table 5.10 shows that there were a significantly higher number of aggressive
sales transactions in 2007 as compared to 2008 and 2009, with respective monthly
means of 11, 5 and 3. The year 2005 (9) also saw a significantly higher number of
such transactions as compared to 2009 (3).
Table 5.11 Test for statistical differences in the monthly average number of aggressive sales
transactions (COUNT_AGGSALES) from 2005 to 2011 for group 2 funds (medium funds) (p =
0.05)
Means with the same letter
are not significantly different.
Grouping Mean Year
A 12 2005
A 11 2007
B A 7 2006
B A 6 2011
B 2 2010
B 2 2008
B 2 2009
The results for medium-sized funds closely match those for small funds, with
an increased level of aggressive sales transactions in the years preceding the financial
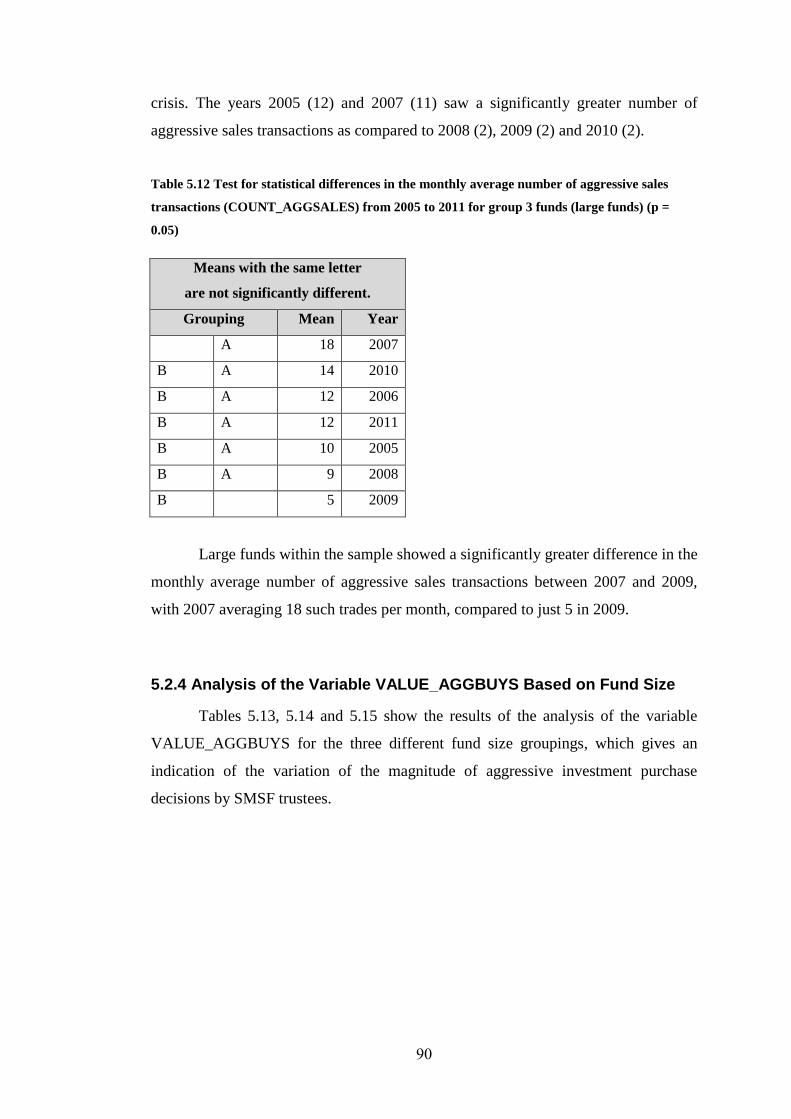
90
crisis. The years 2005 (12) and 2007 (11) saw a significantly greater number of
aggressive sales transactions as compared to 2008 (2), 2009 (2) and 2010 (2).
Table 5.12 Test for statistical differences in the monthly average number of aggressive sales
transactions (COUNT_AGGSALES) from 2005 to 2011 for group 3 funds (large funds) (p =
0.05)
Means with the same letter
are not significantly different.
Grouping Mean Year
A 18 2007
B A 14 2010
B A 12 2006
B A 12 2011
B A 10 2005
B A 9 2008
B 5 2009
Large funds within the sample showed a significantly greater difference in the
monthly average number of aggressive sales transactions between 2007 and 2009,
with 2007 averaging 18 such trades per month, compared to just 5 in 2009.
5.2.4 Analysis of the Variable VALUE_AGGBUYS Based on Fund Size
Tables 5.13, 5.14 and 5.15 show the results of the analysis of the variable
VALUE_AGGBUYS for the three different fund size groupings, which gives an
indication of the variation of the magnitude of aggressive investment purchase
decisions by SMSF trustees.

91
Table 5.13 Test for statistical differences in the monthly average dollar value of aggressive
purchase transactions (VALUE_AGGBUYS) from 2005 to 2011 for group 1 funds (small funds)
(p = 0.05)
Means with the same letter
are not significantly different.
Grouping Mean Year
A $260,106 2007
B A $184,407 2006
B $136,358 2008
B $134,894 2010
B $119,012 2009
B $104,415 2011
B $86,189 2005
Significant differences in the monthly average dollar value of aggressive
purchase transactions of small funds were found between the years 2007 ($260,106)
and the years 2005 ($86,189), 2008 ($136,358), 2009 ($119,012), 2010 ($134,894)
and 2011 ($104,415), with 2007 recording a significantly higher value than the
corresponding years.
Table 5.14 Test for statistical differences in the monthly average dollar value of aggressive
purchase transactions (VALUE_AGGBUYS) from 2005 to 2011 for group 2 funds (medium
funds) (p = 0.05)
Means with the same letter
are not significantly different.
Grouping Mean Year
A $132,317 2009
A $131,289 2006
B A $94,327 2007
B $66,446 2005
B $44,065 2008
B $43,677 2010
B $43,000 2011

92
The results for medium funds found that 2009 and 2006 exhibited a
significantly greater level of investment transactions involving the purchase of
aggressive investments as compared to 2005, 2008, 2010 and 2011. The monthly
means for 2009 ($132,317) and 2006 ($131,289) were significantly in excess of the
means for the other years, which ranged from $66,446 in 2005 to $43,000 in 2011.
Table 5.15 Test for statistical differences in the monthly average dollar value of aggressive
purchase transactions (VALUE_AGGBUYS) from 2005 to 2011 for group 3 funds (large funds)
(p = 0.05)
Means with the same letter
are not significantly
different.
Grouping Mean Year
A $231,930 2007
A $227,723 2006
A $192,006 2011
A $163,270 2010
A $141,592 2005
A $134,304 2008
A $113,991 2009
As shown in Table 5.15, there were no significant differences for large funds
with regards to the level of aggressive purchase transactions across the years 2005 to
2011.
5.2.5 Analysis of the Variable VALUE_AGGSALES Based On Fund Size
In contrast to the average monthly dollar value of aggressive purchase
transactions, VALUE_AGGSALES measures the monthly average dollar value of
monthly aggressive sale transactions. These are investment transactions where SMSF
trustees sold those investments categorised as ‘aggressive’. The results of the
analysis for the 3 different fund sizes are shown in Tables 5.16, 5.17 and 5.18.

93
Table 5.16 Test for statistical differences in the monthly average dollar value of aggressive sales
transactions (VALUE_AGGSALES) from 2005 to 2011 for group 1 funds (small funds) (p =
0.05)
Means with the same letter
are not significantly different.
Grouping Mean Year
A $192,301 2007
B A $151,248 2005
B A $149,899 2006
B A $122,980 2011
B A $121,032 2010
B A $93,164 2008
B $55,879 2009
The results of the analysis for significant differences for the variable
VALUE_AGGSALES showed a significantly greater difference existed between the
years 2007 and 2009, with monthly means of $192,301 and $55,879 respectively.
Table 5.17 Test for statistical differences in the monthly average dollar value of aggressive sales
transactions (VALUE_AGGSALES) from 2005 to 2011 for group 2 funds (medium funds) (p =
0.05)
Means with the same letter
are not significantly different.
Grouping Mean Year
A $115,156 2011
A $113,945 2005
B A $89,544 2007
B A $67,999 2006
B A $39,546 2010
B $19,657 2008
B $13,560 2009
For medium-sized funds within the sample, there was a significantly greater
difference in the level of aggressive investment sales transactions between the years

94
2011 and 2005 with 2008 and 2009, with respective monthly averages of $115,156,
$113,945, $19,657 and $13,560.
Table 5.18 Test for statistical differences in the monthly average dollar value of aggressive sales
transactions (VALUE_AGGSALES) from 2005 to 2011 for group 3 funds (large funds) (p =
0.05)
Means with the same letter
are not significantly different.
Grouping Mean Year
A $145,788 2011
A $123,725 2007
B A $108,661 2010
B A $85,033 2006
B A $68,323 2008
B A $58,696 2005
B $34,333 2009
Large funds showed significant differences in the level of aggressive
investment sales transactions between 2011 and 2009, with 2011 showing a
significantly greater number of such transactions ($145,788 average monthly trade
value in 2011 as compared to $34,333 in 2009).
5.2.6 Analysis of the Variable COUNT_DEFBUYS Based on Fund Size
In addition to considering the frequency of aggressive investment
transactions, the dollar value and frequency of defensive investment transactions
were also analysed. The results of the analysis of COUNT_DEFBUYS, which
measures the monthly average number of defensive asset purchase transactions, are
shown in Tables 5.19, 5.20 and 5.21.

95
Table 5.19 Test for statistical differences in the monthly average number of defensive purchase
transactions (COUNT_DEFBUYS) from 2005 to 2011 for group 1 funds (small funds) (p = 0.05)
Means with the same letter
are not significantly
different.
Grouping Mean Year
A 9 2009
A 8 2008
A 7 2010
A 6 2007
A 6 2006
A 5 2005
A 5 2011
Table 5.19 shows that no statistically significant differences were found in
the monthly average number of defensive purchase transactions for small funds
within the sample.
Table 5.20 Test for statistical differences in the monthly average number of defensive purchase
transactions (COUNT_DEFBUYS) from 2005 to 2011 for group 2 funds (medium funds) (p =
0.05)
Means with the same letter
are not significantly
different.
Grouping Mean Year
A 7 2005
A 6 2009
A 5 2007
A 5 2006
A 5 2008
A 4 2011
A 4 2010
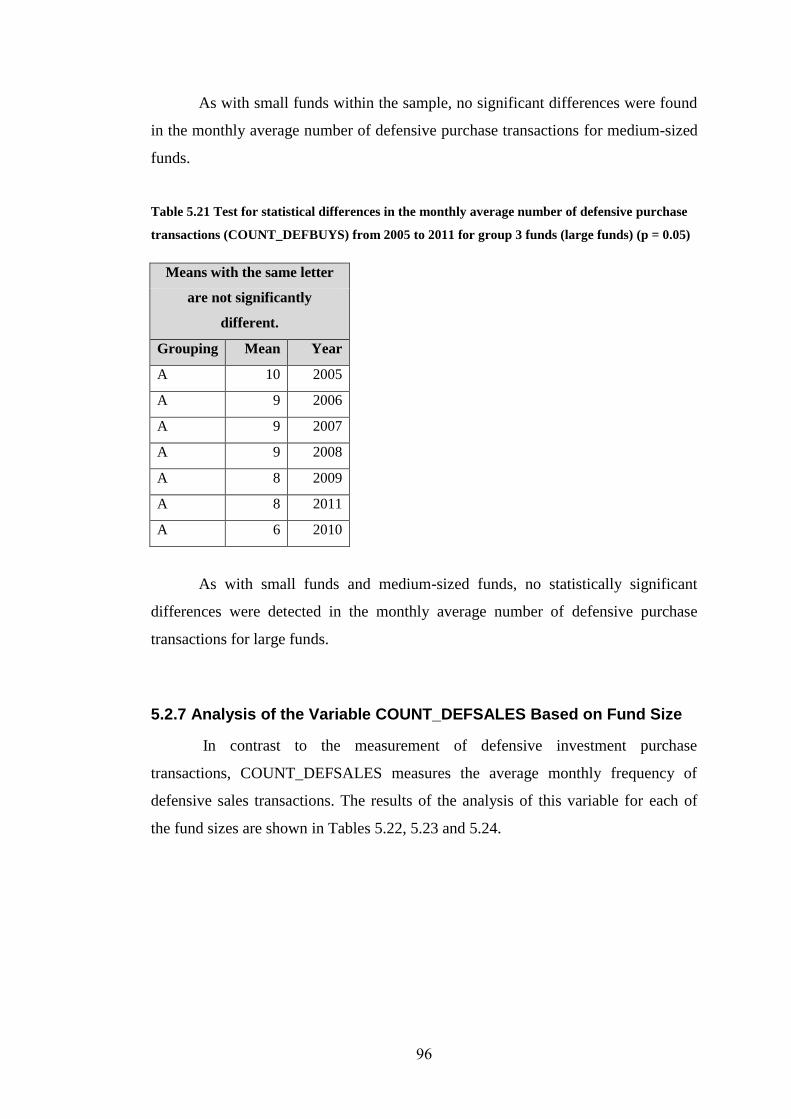
96
As with small funds within the sample, no significant differences were found
in the monthly average number of defensive purchase transactions for medium-sized
funds.
Table 5.21 Test for statistical differences in the monthly average number of defensive purchase
transactions (COUNT_DEFBUYS) from 2005 to 2011 for group 3 funds (large funds) (p = 0.05)
Means with the same letter
are not significantly
different.
Grouping Mean Year
A 10 2005
A 9 2006
A 9 2007
A 9 2008
A 8 2009
A 8 2011
A 6 2010
As with small funds and medium-sized funds, no statistically significant
differences were detected in the monthly average number of defensive purchase
transactions for large funds.
5.2.7 Analysis of the Variable COUNT_DEFSALES Based on Fund Size
In contrast to the measurement of defensive investment purchase
transactions, COUNT_DEFSALES measures the average monthly frequency of
defensive sales transactions. The results of the analysis of this variable for each of
the fund sizes are shown in Tables 5.22, 5.23 and 5.24.

97
Table 5.22 Test for statistical differences in the monthly average number of defensive sales
transactions (COUNT_DEFSALES) from 2005 to 2011 for group 1 funds (small funds) (p =
0.05)
Means with the same letter
are not significantly different.
Grouping Mean Year
A 6 2008
B A 5 2011
B A 5 2010
B A 4 2009
B A 3 2007
B 3 2006
B 2 2005
For small funds within the sample, there were a significantly greater number
of defensive sales transactions in 2008 (6) as compared to 2006 (3) and 2005 (2).
Table 5.23 Test for statistical differences in the monthly average number of defensive sales
transactions (COUNT_DEFSALES) from 2005 to 2011 for group 2 funds (medium funds) (p =
0.05)
Means with the same letter
are not significantly different.
Grouping Mean Year
A 6 2008
A 4 2009
A 4 2011
A 3 2007
A 3 2010
A 2 2006
A 2 2005
Unlike small funds, medium-sized funds within the sample showed no
significant differences in the monthly average number of defensive sales
transactions.

98
Table 5.24 Test for statistical differences in the monthly average number of defensive sales
transactions (COUNT_DEFSALES) from 2005 to 2011 for group 3 funds (large funds) (p = 0.05)
Means with the same letter
are not significantly different.
Grouping Mean Year
A 9 2008
A 6 2011
A 5 2007
A 4 2010
A 4 2005
A 3 2006
A 3 2009
As with medium-sized funds, large funds also showed no significant
differences in the monthly average number of defensive sales transactions between
the years 2005 to 2011.
5.2.8 Analysis of the Variable VALUE_DEFBUYS Based on Fund Size
The next variable analysed was VALUE_DEFBUYS, which represents the
average monthly dollar value of investment transactions which involved the purchase
of a defensive investment. Tables 5.25, 5.26 and 5.27 show the results of the analysis
of the variable VALUE_DEFBUYS for each of the fund size groupings within the
sample.

99
Table 5.25 Test for statistical differences in the monthly average dollar value of defensive
purchase transactions (VALUE_DEFBUYS) from 2005 to 2011 for group 1 funds (small funds)
(p = 0.05)
Means with the same letter
are not significantly different.
Grouping Mean Year
A $378,067 2010
B A $330,129 2011
B A $184,271 2007
B A $171,433 2009
B $149,927 2006
B $148,172 2008
B $132,889 2005
With regards to the level of purchases of defensive assets, 2010 ($378,067)
saw a significantly higher level of such activity as compared to 2005 ($132,889),
2006 ($149,927) and 2008 ($148,172).
Table 5.26 Test for statistical differences in the monthly average dollar value of defensive
purchase transactions (VALUE_DEFBUYS) from 2005 to 2011 for group 2 funds (medium
funds) (p = 0.05)
Means with the same letter
are not significantly
different.
Grouping Mean Year
A $151,067 2007
A $145,416 2005
A $126,891 2009
A $100,773 2011
A $95,104 2008
A $93,546 2006
A $66,140 2010

100
With regards to medium-sized funds, no statistically significant differences in
the monthly dollar average value of defensive purchase transactions between the
years 2005 and 2011 were detected.
Table 5.27 Test for statistical differences in the monthly average dollar value of defensive
purchase transactions (VALUE_DEFBUYS) from 2005 to 2011 for group 3 funds (large funds)
(p = 0.05)
Means with the same letter
are not significantly different.
Grouping Mean Year
A $180,566 2007
B A $132,927 2006
B A $131,937 2005
B A $125,445 2011
B A $109,640 2010
B A $101,843 2008
B $68,173 2009
Large funds within the sample showed a significant difference in the monthly
average dollar value of defensive purchase transactions between 2007 and 2009, with
2007 averaging an additional $112,393 per month in defensive purchase transactions,
compared to the average of $68,173 in 2009.
5.2.9 Analysis of the Variable VALUE_DEFSALES Based on Fund Size
The variable VALUE_DEFSALES, which measures the average monthly
dollar value of sales of defensive investments, was also analysed for the three
different fund size groupings. The results are illustrated in Tables 5.28, 5.29 and
5.30.

101
Table 5.28 Test for statistical differences in the monthly average dollar value of defensive sales
transactions (VALUE_DEFSALES) from 2005 to 2011 for group 1 funds (small funds) (p = 0.05)
Means with the same letter
are not significantly different.
Grouping Mean Year
A $383,818 2010
B A $337,993 2011
B C $177,438 2008
C $147,962 2009
C $120,670 2007
C $104,353 2006
C $63,103 2005
Significant differences were found between 2010 ($383,818) and the years
2005 to 2009 (ranging from $63,103 in 2005 to $147,962 in 2009), while 2011
($337,993) also saw a significantly greater number of defensive sales transactions
than 2005, 2006, 2007 and 2009.
Table 5.29 Test for statistical differences in the monthly average dollar value of defensive sales
transactions (VALUE_DEFSALES) from 2005 to 2011 for group 2 funds (medium funds) (p =
0.05)
Means with the same letter
are not significantly different.
Grouping Mean Year
A $121,814 2008
A $119,880 2007
A $107,179 2011
A $101,309 2009
A $71,414 2010
A $53,371 2005
A $51,398 2006
Unlike small funds, medium-sized funds within the sample showed no
significant differences in the dollar value of average monthly defensive sales
transactions.

102
Table 5.30 Test for statistical differences in the monthly average dollar value of defensive sales
transactions (VALUE_DEFSALES) from 2005 to 2011 for group 3 funds (large funds) (p = 0.05)
Means with the same letter
are not significantly different.
Grouping Mean Year
A $127,213 2008
A $121,833 2011
A $100,052 2010
A $94,426 2007
A $57,157 2005
A $52,647 2006
A $43,712 2009
As with medium-sized funds, large funds within the sample exhibited no
significant differences in the monthly average dollar value of defensive sales
transactions.
5.2.10 Analysis of the Variable NET_FLOWDEF Based on Fund Size
The results of the analysis of the variable NET_FLOWDEF, which indicates
the net flow of funds into defensive assets, are outlined in Tables 5.31, 5.32 and 5.33.

103
Table 5.31 Test for statistical differences in the monthly average net flow of money into
defensive assets (NET_FLOWDEF) from 2005 to 2011 for group 1 funds (small funds) (p = 0.05)
Means with the same letter
are not significantly different.
Grouping Mean Year
A $65,059 2005
A $18,565 2011
A -$13,861 2010
A -$34,508 2006
A -$43,193 2008
A -$63,133 2009
A -$67,805 2007
The variable NET_FLOWDEF indicates the overall direction of flow of
funds, with a positive value signifying a net flow of funds into defensive assets for
that specific period. For small funds within the sample, no significant differences
were found between the years leading up to, during and after the financial crisis.
Table 5.32 Test for statistical differences in the monthly average net flow of money into
defensive assets (NET_FLOWDEF) from 2005 to 2011 for group 2 funds (medium funds) (p =
0.05)
Means with the same letter are
not significantly different.
Grouping Mean Year
A $72,157 2011
B A $47,499 2005
B A C -$4,131 2010
B A C -$4,783 2007
B C -$24,408 2008
D C -$63,290 2006
D -$118,758 2009
With regards to medium-sized funds within the sample, a number of
significant differences were found in the level of net flow into defensive assets. 2011
($72,157) and 2005 ($47,499) saw a significantly greater level of net flow of funds,

104
as compared to 2006 (-$63,290) and 2009 (-$118,758). The year 2011 was also
significantly greater than 2008 (-$24,408), while the value for 2009 was significantly
lower than all other years except for 2006.
Table 5.33 Test for statistical differences in the monthly average net flow of money into
defensive assets (NET_FLOWDEF) from 2005 to 2011 for group 3 funds (large funds) (p = 0.05)
Means with the same letter
are not significantly different.
Grouping Mean Year
A -$46,218 2011
A -$54,610 2010
A -$65,981 2008
A -$79,658 2009
A -$82,897 2005
A -$108,205 2007
A -$142,690 2006
As was found with small funds within the sample, large funds exhibited no
significant differences in the level of net flow of funds into defensive assets across
the period 2005 to 2011.
5.2.11 Analysis of the Variable TRADE_VALUE Based on Fund Size
The final variable analysed in this portion of the study was TRADE_VALUE,
which is the monthly average dollar value of all trades over the period 2005 to 2011,
regardless of the nature of each transaction. This variable measures the overall
trading activity of the funds within the sample. The results of the analysis for the
three fund size groupings are shown in Tables 5.34, 5.35 and 5.36.
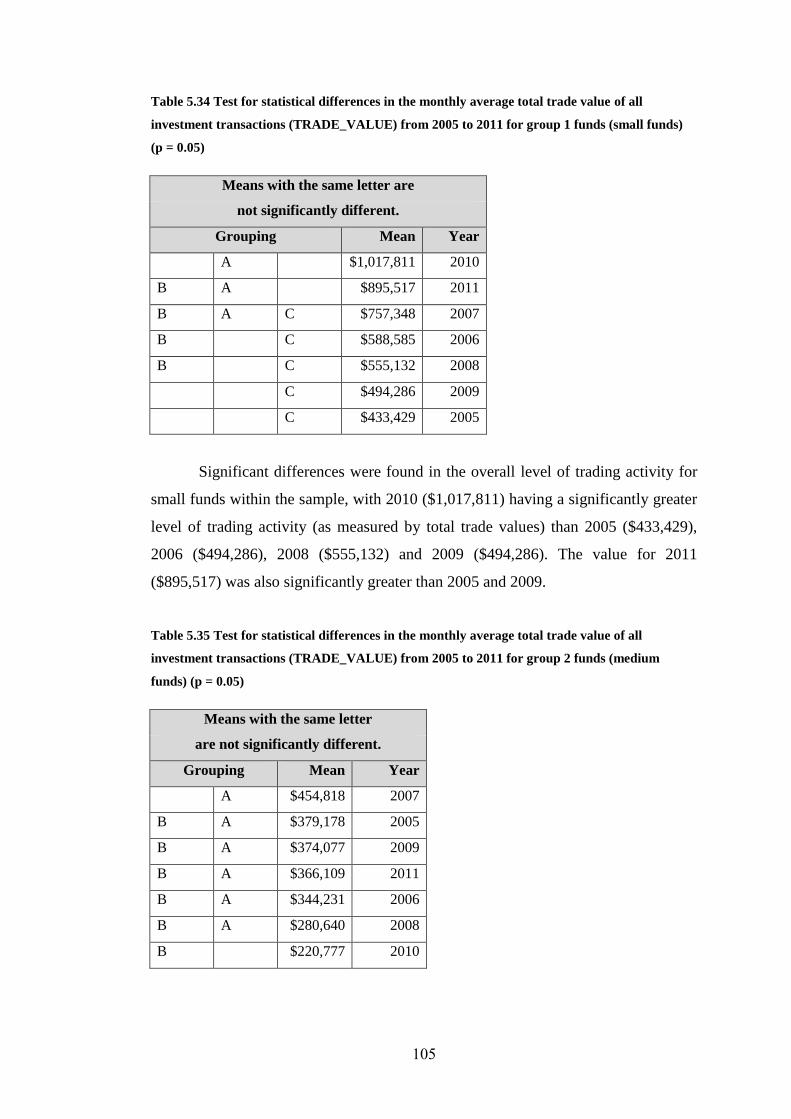
105
Table 5.34 Test for statistical differences in the monthly average total trade value of all
investment transactions (TRADE_VALUE) from 2005 to 2011 for group 1 funds (small funds)
(p = 0.05)
Means with the same letter are
not significantly different.
Grouping Mean Year
A $1,017,811 2010
B A $895,517 2011
B A C $757,348 2007
B C $588,585 2006
B C $555,132 2008
C $494,286 2009
C $433,429 2005
Significant differences were found in the overall level of trading activity for
small funds within the sample, with 2010 ($1,017,811) having a significantly greater
level of trading activity (as measured by total trade values) than 2005 ($433,429),
2006 ($494,286), 2008 ($555,132) and 2009 ($494,286). The value for 2011
($895,517) was also significantly greater than 2005 and 2009.
Table 5.35 Test for statistical differences in the monthly average total trade value of all
investment transactions (TRADE_VALUE) from 2005 to 2011 for group 2 funds (medium
funds) (p = 0.05)
Means with the same letter
are not significantly different.
Grouping Mean Year
A $454,818 2007
B A $379,178 2005
B A $374,077 2009
B A $366,109 2011
B A $344,231 2006
B A $280,640 2008
B $220,777 2010

106
With regards to medium-sized funds within the sample, significant
differences in the level of total trade value were only found between 2007 ($454,818)
and 2010 ($220,777), with 2007 exhibiting a significantly larger average monthly
total trade value than 2010.
Table 5.36 Test for statistical differences in the monthly average total trade value of all
investment transactions (TRADE_VALUE) from 2005 to 2011 for group 3 funds (large funds) (p
= 0.05)
Means with the same letter
are not significantly different.
Grouping Mean Year
A $630,646 2007
A $585,071 2011
B A $498,329 2006
B A $481,623 2010
B A $431,683 2008
B A $389,382 2005
B $260,208 2009
With regards to large funds within the sample, the average monthly total trade
value was significantly greater in 2007 ($630,656) and 2011 ($585,071) as compared
to 2009 ($260,208). No other significant differences across the years 2005 to 2011
were found.
5.3 Conclusion
This chapter presented the results of the analysis of SMSFs within the sample
based on segmentation of the funds according to their size (the total assets held
within each fund as at 1 January 2005). The objective of the analysis was to
determine whether or not fund size can be used as an indicator of trustee trading
behaviour and whether or not trustees reacted differently prior to, during and
following the financial crisis based on the total value of assets under trustee
management.

107
Small funds within the sample tended to trade more frequently prior to the
financial crisis than compared to during and following the crisis, although the
monthly average total trade value was higher in those years following the crisis as
compared to prior to and during the crisis. Smaller funds therefore appear to have
reduced trading activity in response to the crisis, but the average dollar value of these
trades were higher than prior to or during the crisis. Small funds were also engaged
in significantly greater numbers (and dollar values) of aggressive investment
purchase trades immediately prior to the financial crisis, although this was matched
to some extent by a high level of aggressive investment sales transactions prior to the
crisis. The results of the analysis do indicate however, that small funds within the
sample were not significantly increasing defensive asset exposure on the eve of the
crisis, but tended to increase their dollar value commitment to defensive investment
purchase transactions following the financial crisis. While not statistically
significant, changes in the variable NET_FLOWDEF tend to indicate that small
funds within the sample increased defensive investment exposure in those years
following the financial crisis and reduced the same exposure prior to the financial
crisis. There was some evidence of an increase in net aggressive investment exposure
by small SMSFs during the financial crisis.
Medium-sized funds within the sample exhibited significant differences in
trading activity, generally reducing both trading frequency and trade value in the
period following the financial crisis. Medium-sized funds also tended to increase
aggressive investment exposure on the eve of the financial crisis, although trustees of
medium-sized funds were also significantly increasing aggressive investment
exposure in 2009, as markets began to recover following the crisis. Medium-sized
funds tended to make no significant changes to their exposure to defensive assets
over the period 2005 to 2011, although the variable NET_FLOWDEF does indicate
that trustees of medium-sized funds were increasing net defensive investment
exposure following the crisis, particularly when compared to 2009, which saw them
significantly increase aggressive investment exposure.
Large funds within the sample made no significant changes to trade
frequency over the period 2005 to 2011, although average monthly trade value
tended to be higher in both the period prior to and following the financial crisis.

108
Large funds tended to make a greater number of trades involving the purchase of
aggressive investments prior to the financial crisis, although the actual dollar value of
these transactions was not significantly different across the time period under
consideration. As with medium-sized funds, large funds tended to show no
significant differences in the frequency or value of those investment transactions
involving defensive assets. While the variable NET_FLOWDEF revealed that large
funds tended to have greater net exposure to defensive investments in those years
following the crisis, the level of change was not statistically significant when
compared to both prior to and during the financial crisis.
The results of the analysis of fund trading behaviour within this chapter may
have relevance to the concepts of relative and absolute risk aversion. It is generally
assumed that investors exhibit constant relative risk aversion, which implies that the
percentage of wealth that an investor is willing to risk remains unchanged as wealth
increases (Chiappori & Paiella 2011). In a related manner, decreasing absolute risk
aversion suggests that investors increase the absolute amount of wealth invested in in
higher risk assets as wealth increases (Kihlstrom, Romer & Williams 1981). In the
context of this study, this implies that larger SMSFs within the sample would be
expected to have the same investment risk exposure as smaller SMSFs within the
sample on a percentage basis, although the absolute level of aggressive assets held by
larger funds would be greater than smaller funds. Therefore over the period 2005 to
2011 any changes in investment risk exposure across different fund sizes should be
consistent so as to adhere to both constant relative risk aversion and decreasing
absolute risk aversion. This is not evident in the results of the analysis, which
indicates that medium-sized funds were more likely to increase exposure to
aggressive investments as markets bottomed in 2009, trading behaviour not shared
by trustees of small or large funds. Smaller funds were more likely to increase
aggressive investment exposure leading up to the financial crisis, behaviour which is
again not evident in the trading decisions of trustees of larger SMSFs. The only
change in trading activity common to funds of all sizes appears to be an increase in
defensive investment exposure in the period following the financial crisis. Overall
however, it does appear that the trading behaviour of SMSF trustees in this study
does not conform to the general concepts of constant relative risk aversion and
decreasing absolute risk aversion. This suggests that further investigation into

109
relative and absolute risk aversion of SMSF trustees may be warranted, although this
matter is beyond the scope of this study.
This chapter presented the results of the analysis of SMSFs within the sample
based on segmentation according to the size of the fund. The results tend to indicate
that funds of all sizes increased exposure to defensive investments following the
crisis and were not taking active steps to decrease exposure to aggressive
investments prior to the crisis. Of the three fund-size categories, only medium-sized
funds appeared to increase exposure to aggressive investment as markets bottomed
during the financial crisis. The next chapter presents the results of the analysis of
SMSFs within the sample on the basis of fund risk profile.

110
CHAPTER 6
RESULTS: TRADING BEHAVIOUR AND FUND RISK PROFILE
6.1 Introduction
The previous chapter presented the results of the analysis of SMSF
investment transactions over the period 2005 to 2011 based on fund size. This was
done on an annual basis and considered the trading activity of funds within the
sample based on the dollar value of assets held within each fund. This chapter
presents the results of the analysis of the trading behaviour of SMSFs on the basis of
fund risk profile. This analysis seeks to address the question of whether or not funds
with differing risk profiles exhibited the same trading behaviour over the period 2005
to 2011.
Segmenting the SMSFs within the sample based on risk profile should allow
for generalisations to be drawn regarding the behaviour of fund trustees with
differing risk profiles when confronted with the set of circumstances that existed
over the period 2005 to 2011. For example, it would be reasonable to assume that
trustees of those funds with a more aggressive risk profile would have been quick to
take advantage of falling asset prices during the financial crisis, while trustees with a
more defensive risk profile would have been reducing aggressive investment
exposure immediately prior to the financial crisis. The analysis of the variables
outlined in Table 3.7 in Chapter 3 on the basis of fund risk profiles may allow for
answers to be found to these and similar questions regarding SMSF trustee risk
profiles and associated trading behaviour.

111
6.2 Statistical Differences in SMSF Trading Behaviour Based
on Risk Profile
The SMSFs within the sample data were separated into three groups based on
their risk profile as at 1 January 2005 and were tested for significant differences
across each year for each of the variables as defined in Table 3.7. The mean values
for each of the variables for funds in group A are shown in Table 6.1. Group A funds
are those funds with an ‘aggressive’ risk profile (funds with an equities allocation of
greater than 60% as at 1 January 2005).
Table 6.1 Monthly means of variables for group A funds (aggressive funds) for each year from
2005 to 2011
Year 2005 2006 2007 2008 2009 2010 2011
COUNT 37 42 41 37 36 36 25
COUNT_AGGBUYS 20 25 19 17 20 15 11
COUNT_AGGSALES 10 10 14 7 4 12 6
VALUE_AGGBUYS $87,456 $173,276 $197,106 $174,072 $115,396 $157,211 $138,912
VALUE_AGGSALES $109,950 $112,225 $178,226 $110,474 $34,182 $127,374 $82,905
COUNT_DEFBUYS 6 5 6 8 9 6 5
COUNT_DEFSALES 2 2 3 5 3 3 3
VALUE_DEFBUYS $115,714 $76,602 $129,876 $118,171 $88,000 $139,375 $182,452
VALUE_DEFSALES $47,829 $40,336 $89,208 $123,157 $65,145 $141,309 $149,187
NET_FLOWDEF $22,494 -$61,052 -$18,879 -$63,598 -$81,214 -$29,838 -$56,007
TRADE_VALUE $360,949 $402,439 $594,416 $525,874 $302,724 $565,268 $553,456
The data shows that the frequency of trading activity by aggressive funds, as
measured by the variable COUNT, was relatively stable across the period 2005 to
2010, with only 2011 exhibiting a substantially lower average monthly number of
trades. COUNT_AGGBUYS, which measures the average number of aggressive
investment purchase transactions per month, appears to indicate a drop in the level of
such transactions following the financial crisis, with only 15 and 11 such transactions
in 2010 and 2011 respectively. This compares to 20 and 25 such transactions in 2005
and 2006 respectively. COUNT_AGGSALES, which measures the average monthly
number of aggressive investment sales transactions, peaked at 14 such transactions in
2007, with a low point of just four in 2009. VALUE_AGGBUYS, which measures
the average monthly dollar value of aggressive investment purchase transactions, was

112
relatively consistent across the period 2005 to 2011, although 2007 did represent the
highest level of such transactions. VALUE_AGGSALES, representing the average
monthly dollar value of aggressive sales transactions, reached a low of $34,182 per
month in 2009.
With regards to defensive investment transactions, COUNT_DEFBUYS,
which measures the average monthly number of defensive investment purchase
transactions, peaked in 2009 with an average of nine such transactions per month.
COUNT_DEFSALES, which measures the average monthly number of defensive
investment sales transactions, showed little variation over the seven year period,
although 2008 saw the highest number of such transactions, averaging eight per
month. VALUE_DEFBUYS, which measures the average monthly dollar value of
defensive investment purchases, was higher in the years following the crisis. 2011
and 2010 saw monthly averages of this type of transaction of $185,452 and $139,375
respectively, which were the two highest recorded figures over the seven year period.
VALUE_DEFSALES, which measures the monthly average dollar value of
defensive investment sales transactions, tended to be higher in the years following
the crisis, peaking in 2011 with an average monthly value of $149,187 of such trades.
NET_FLOWDEF, which measures the net flow of funds into defensive assets,
reached an average monthly low of -$81,214 in 2009. TRADE_VALUE, which is
simply the average monthly dollar value of all investment decisions, showed some
differences over the seven year period, with a low in 2009 of $302,724 in average
monthly trade value.
Table 6.2 shows the monthly mean for each of the variables for group M
funds, which are moderate risk funds within the sample. These are funds with an
equities allocation of greater than 50% but less than 60% as at 1 January 2005.

113
Table 6.2 Monthly means of variables for group M funds (moderate funds) for each year from
2005 to 2011
Year 2005 2006 2007 2008 2009 2010 2011
COUNT 46 44 53 30 28 29 29
COUNT_AGGBUYS 22 22 22 11 16 13 8
COUNT_AGGSALES 14 9 17 5 2 6 9
VALUE_AGGBUYS $102,226 $206,877 $254,612 $86,372 $111,812 $113,166 $102,656
VALUE_AGGSALES $126,218 $99,546 $147,455 $45,994 $40,730 $82,362 $180,962
COUNT_DEFBUYS 8 9 9 7 6 6 6
COUNT_DEFSALES 3 4 5 8 4 4 6
VALUE_DEFBUYS $158,584 $200,367 $240,449 $114,506 $91,126 $135,366 $119,937
VALUE_DEFSALES $54,127 $122,852 $144,024 $167,855 $84,483 $131,956 $139,765
NET_FLOWDEF $23,992 -$107,331 -$107,156 -$40,379 -$71,082 -$30,804 $78,307
TRADE_VALUE $441,155 $629,643 $786,540 $414,728 $328,152 $462,849 $543,321
With regards to the overall level of trading frequency, measured by the
variable COUNT, moderate risk funds exhibit a similar pattern to funds with a more
aggressive risk profile. That is, the years following the financial crisis tended to have
a lower monthly average trade count when compared to the years leading up to the
crisis. In this regard the monthly average trade count peaked at 53 trades in 2007,
with only 28, 29 and 29 trades in 2009, 2010 and 2011 respectively. The variable
COUNT_AGGBUYS shows a similar pattern, with an average of just eight such
transactions per month in 2011, compared to 22 such transactions per month for the
years 2005, 2006 and 2007. COUNT_AGGSALES, the measure of aggressive sales
transactions, exhibits a different pattern, with an average of just two such
transactions in 2009, compared to 17 in 2007. VALUE_AGGBUYS shows a similar
pattern to COUNT_AGGBUYS, with a greater monthly average dollar value of
aggressive purchase transactions in the years leading up to the financial crisis,
peaking at a monthly average of $254,612 in 2007. As would be expected,
VALUE_AGGSALES shows a similar pattern to COUNT_AGGSALES, with the
monthly average dollar value of aggressive investment sales reaching a low of
$40,730 in 2009.
With regards to defensive investment transactions, COUNT_DEFBUYS,
which shows the average monthly number of defensive purchase transactions, peaked
in 2006 and 2007, averaging nine such transactions per month. Overall however,
there was little differentiation across the period 2005 to 2011, with the lowest

114
monthly average of such trades being 6 in 2009, 2010 and 2011.
COUNT_DEFSALES, which measure the monthly average number of defensive
investment sales transactions, also showed only slight variation across the period.
The lowest monthly average number of this type of transaction occurred in 2005,
with three per month, and the highest number of defensive sales transactions
occurred in 2008, with an average of 8 transactions. VALUE_DEFBUYS, which
measures the monthly average dollar value of defensive investment purchases, varied
from an average of $240,449 in 2007, to $91,126 in 2009. VALUE_DEFSALES
exhibits a similar pattern, although the average monthly dollar value of defensive
investment sales transactions peaked in 2008, at $167,855 per month.
NET_FLOWDEF, which measures the net flow of funds into defensive assets, varied
from $78,307 in 2011, to -$107,156 in 2007. TRADE_VALUE, the measurement of
the overall dollar value of all trades, varied considerably across the period 2005 to
2011, peaking in 2007 with an average monthly trade value of $786,540, and a low
of $328,152 in 2009.
Table 6.3 shows the monthly means for each of the variables for defensive
funds within the sample, or group D funds. These are funds with an equities
allocation of less than 50% as at 1 January 2005.
Table 6.3 Monthly means of variables for group D funds (defensive funds) for each year from
2005 to 2011
Year 2005 2006 2007 2008 2009 2010 2011
COUNT 33 31 29 26 28 22 27
COUNT_AGGBUYS 16 15 12 9 15 9 9
COUNT_AGGSALES 7 8 8 4 3 4 8
VALUE_AGGBUYS $75,047 $140,364 $116,752 $48,820 $130,029 $67,368 $86,693
VALUE_AGGSALES $87,721 $90,232 $72,598 $23,365 $21,802 $55,287 $114,002
COUNT_DEFBUYS 7 6 5 7 7 5 5
COUNT_DEFSALES 4 3 4 7 3 4 5
VALUE_DEFBUYS $120,177 $92,311 $122,705 $110,520 $182,033 $248,143 $236,607
VALUE_DEFSALES $71,676 $45,209 $97,576 $133,666 $142,501 $252,161 $249,373
NET_FLOWDEF $12,674 -$50,132 -$44,154 -$25,455 -$108,227 -$12,080 $27,309
TRADE_VALUE $354,620 $368,115 $409,631 $316,371 $476,366 $622,960 $686,675
The overall level of trading activity of defensive funds is measured by the
variable COUNT. This variable, measuring the monthly average number of all

115
investment transactions, peaked in 2005 with 33 transactions, with a low of 22
transactions in 2010. COUNT_AGGBUYS, which measures the number of
aggressive investment purchase transactions, shows a similar pattern, reaching a high
of 16 transactions in 2005 and a low of 9 transactions in 2008, 2010 and 2011.
COUNT_AGGSALES, the number of monthly aggressive investment sales
transactions, reached a high of 8 in 2006, 2007 and 2011. VALUE_AGGBUYS,
which measures the average monthly dollar value of aggressive investment purchase
transactions, reached an average monthly high of $140,364 in 2006.
VALUE_AGGSALES, similar to COUNT_AGGSALES, recorded high levels in
2005, 2006 and 2007. The highest average monthly dollar of aggressive investment
sales transactions however, was reached in 2011, with an average of $114,002.
COUNT_DEFBUYS, a measure of the average monthly number of defensive
investment purchase transactions, shows little variation across the period 2005 to
2011, ranging from 5 transactions 2007, 2010 and 2011, to 7 transactions in 2005,
2008 and 2009. COUNT_DEFSALES, the measure of defensive investment sales
transactions, shows some variation, from 3 transactions in 2006 and 2009, to 7
transactions in 2008. With regards to VALUE_DEFBUYS, 2010 and 2011 recorded
average monthly defensive investment purchase of $248,143 and $236,607
respectively. This is higher than corresponding figures in 2006 and 2007 of $92,311
and $122,705 respectively. VALUE_DEFSALES shows a similar trend, with a
monthly average of $252,161 of defensive investment sales transactions in 2010, and
just $45,209 in 2006. NET_FLOWDEF, the measure of net flow of funds into
defensive investments, recorded positive values in 2005 and 2011 and a low of
-$108,227 net flow into defensive investments in 2009. TRADE_VALUE, the
measure of average monthly dollar trade value, shows an increase from the years
preceding the crisis to the years following the crisis.
As with Chapter 4 and Chapter 5, the data as presented in Tables 6.1, 6.2 and
6.3 does not indicate whether or not any of the changes in the trading behaviour of
fund trustees (as grouped by risk profile) was statistically significant or could be
explained by normal variations in the data. Once again the next step was to test the
variables in Tables 6.1, 6.2 and 6.3 for significant differences across each year using
Fisher’s Least Significant Difference (LSD) test based on a significance level of
0.05. The results of the statistical analysis are grouped based on each variable tested.

116
6.2.1 Analysis of the Variable COUNT Based on Fund Risk Profile
The results of the analysis of the variable COUNT for the three fund risk
profile groupings are shown in Tables 6.4, 6.5 and 6.6.
Table 6.4 Test for statistically significant differences in the monthly average number of
investment transactions (COUNT) from 2005 to 2011 for group A funds (aggressive funds) (p =
0.05)
Means with the same letter
are not significantly different.
Grouping Mean Year
A 42 2006
A 41 2007
A 37 2005
A 37 2008
A 36 2009
A 36 2010
A 25 2011
In terms of the average monthly number of all investment transactions for
aggressive funds, no statistically significant differences were observed between the
years 2005 and 2011.

117
Table 6.5 Test for statistically significant differences in the monthly average number of
investment transactions (COUNT) from 2005 to 2011 for group M funds (moderate funds) (p =
0.05)
Means with the same letter
are not significantly different.
Grouping Mean Year
A 53 2007
B A 46 2005
B A 44 2006
B 30 2008
B 29 2010
B 29 2011
B 28 2009
Statistically significant differences were found in the number of average
monthly investment transactions for moderate risk funds, with 2007 having a
significantly higher number of transactions than 2008, 2009, 2010 and 2011.
Table 6.6 Test for statistically significant differences in the monthly average number of
investment transactions (COUNT) from 2005 to 2011 for group D funds (defensive funds) (p =
0.05)
Means with the same letter
are not significantly different.
Grouping Mean Year
A 33 2005
A 31 2006
A 29 2007
A 28 2009
A 27 2011
A 26 2008
A 22 2010

118
As with aggressive funds, funds with a defensive risk profile exhibited no
significant differences in the average monthly number of investment transactions
across the period 2005 to 2011.
6.2.2 Analysis of the Variable COUNT_AGGBUYS Based on Fund Risk
Profile
The results of the analysis of the variable COUNT_AGGBUYS for the three
fund risk profile groupings are shown in Tables 6.7, 6.8 and 6.9.
Table 6.7 Test for statistically significant differences in the monthly average number of
aggressive purchase transactions (COUNT_AGGBUYS) from 2005 to 2011 for group A funds
(aggressive funds) (p = 0.05)
Means with the same letter
are not significantly different.
Grouping Mean Year
A 25 2006
B A 20 2009
B A 20 2005
B A 19 2007
B A 17 2008
B A 15 2010
B 11 2011
A statistically significant difference was found in the monthly average
number of aggressive purchase transactions between 2006 and 2011, with an average
of 25 such transactions in 2006, compared to just 11 in 2011.

119
Table 6.8 Test for statistically significant differences in the monthly average number of
aggressive purchase transactions (COUNT_AGGBUYS) from 2005 to 2011 for group M funds
(moderate funds) (p = 0.05)
Means with the same letter
are not significantly different.
Grouping Mean Year
A 22 2006
A 22 2005
A 22 2007
B A 16 2009
B A 13 2010
B 11 2008
B 8 2011
Similar to funds with more aggressive risk exposure, moderate risk funds
exhibited a number of statistically significant differences in the monthly average
number of aggressive purchase transactions, with the mean number of such
transactions in 2005 (22), 2006 (22) and 2007 (22) being significantly greater than
2008 (11) and 2011 (8).
Table 6.9 Test for statistically significant differences in the monthly average number of
aggressive purchase transactions (COUNT_AGGBUYS) from 2005 to 2011 for group D funds
(defensive funds) (p = 0.05)
Means with the same letter
are not significantly different.
Grouping Mean Year
A 16 2005
B A 15 2006
B A 15 2009
B A 12 2007
B A 9 2008
B 9 2010
B 9 2011

120
With regards to the average monthly number of aggressive purchase
transactions by defensive funds, a significantly greater difference was found in the
level of such transactions between 2005 and 2010 and 2011, with respective means
of 16, 9 and 9.
6.2.3 Analysis of the Variable COUNT_AGGSALES Based on Fund Risk
Profile
The results of the analysis of the variable COUNT_AGGSALES for the three
fund risk profile groupings, which measures the average monthly number of sales
transactions of aggressive investments, are shown in Tables 6.10, 6.11 and 6.12.
Table 6.10 Test for statistically significant differences in the monthly average number of
aggressive sales transactions (COUNT_AGGSALES) from 2005 to 2011 for group A funds
(aggressive funds) (p = 0.05)
Means with the same letter
are not significantly different.
Grouping Mean Year
A 14 2007
B A 12 2010
B A 10 2006
B A 10 2005
B A 7 2008
B A 6 2011
B 4 2009
With regards to the monthly average number of aggressive sales transactions
of aggressive funds, the level of activity in 2007 (an average of 14 such transactions)
was found to be significantly greater than in 2009 (an average of 4 such
transactions).

121
Table 6.11 Test for statistically significant differences in the monthly average number of
aggressive sales transactions (COUNT_AGGSALES) from 2005 to 2011 for group M funds
(moderate funds) (p = 0.05)
Means with the same letter are
not significantly different.
Grouping Mean Year
A 17 2007
B A 14 2005
B A C 9 2011
B A C 9 2006
B C 6 2010
B C 5 2008
C 2 2009
For moderate risk funds, 2007 saw a significantly greater number of
aggressive sales transactions (mean of 17) when compared to 2010 (6), 2008 (5) and
2009 (2). The mean number of transactions for 2009 was also significantly lower
than in 2005, with just 2 such transactions in 2009 compared to 14 in 2005.
Table 6.12 Test for statistically significant differences in the monthly average number of
aggressive sales transactions (COUNT_AGGSALES) from 2005 to 2011 for group D funds
(defensive funds) (p = 0.05)
Means with the same letter
are not significantly different.
Grouping Mean Year
A 8 2006
A 8 2011
A 8 2007
A 7 2005
A 4 2010
A 4 2008
A 3 2009

122
Unlike aggressive and moderate risk funds, no statistically significant
differences were found in the monthly average number of aggressive sales
transactions for defensive funds.
6.2.4 Analysis of the Variable VALUE_AGGBUYS Based on Fund Risk
Profile
The results of the analysis of the variable VALUE_AGGBUYS, which
measures the monthly average dollar value of aggressive investment purchase
transactions, are shown in Tables 6.13, 6.14 and 6.15.
Table 6.13 Test for statistically significant differences in the monthly average dollar value of
aggressive purchase transactions (VALUE_AGGBUYS) from 2005 to 2011 for group A funds
(aggressive funds) (p = 0.05)
Means with the same letter
are not significantly different.
Grouping Mean Year
A $197,106 2007
A $174,072 2008
A $173,276 2006
A $157,211 2010
A $138,912 2011
A $115,396 2009
A $87,456 2005
No statistically significant differences in the monthly average dollar value of
aggressive purchase transaction were found for aggressive funds within the sample.

123
Table 6.14 Test for statistically significant differences in the monthly average dollar value of
aggressive purchase transactions (VALUE_AGGBUYS) from 2005 to 2011 for group M funds
(moderate funds) (p = 0.05)
Means with the same letters
are not significantly different.
Grouping Mean Year
A $254,612 2007
B A $206,877 2006
B $113,166 2010
B $111,812 2009
B $102,656 2011
B $102,226 2005
B $86,372 2008
Moderate risk funds within the sample showed a statistically significant
difference in the monthly average dollar value of aggressive purchase transactions
between the years 2007 and 2005, 2008, 2009, 2010 and 2011. The mean value of
aggressive investment purchase transactions in 2007 of $254,612 was more than
double the values recorded for all other years, excluding 2006.
Table 6.15 Test for statistically significant differences in the monthly average dollar value of
aggressive purchase transactions (VALUE_AGGBUYS) from 2005 to 2011 for group D funds
(defensive funds) (p = 0.05)
Means with the same letter
are not significantly different.
Grouping Mean Year
A $140,363 2006
A $130,029 2009
B A $116,752 2007
B A $86,693 2011
B A $75,047 2005
B A $67,368 2010
B $48,820 2008

124
Defensive funds within the sample showed a significantly greater difference
in the monthly average dollar value of aggressive purchase transactions between the
years 2006 ($140,363), 2009 ($130,029) and the year 2008 ($48,820).
6.2.5 Analysis of the Variable VALUE_AGGSALES Based on Fund Risk
Profile
The results of the analysis of the variable VALUE_AGGSALES for the three
fund risk profile groups, which measures the monthly average dollar value of
aggressive investment sales transactions, are shown in Tables 6.16, 6.17 and 6.18.
Table 6.16 Test for statistically significant differences in the monthly average dollar value of
aggressive sales transactions (VALUE_AGGSALES) from 2005 to 2011 for group A funds
(aggressive funds) (p = 0.05)
Means with the same letter
are not significantly different.
Grouping Mean Year
A $178,226 2007
B A $127,374 2010
B A $112,225 2006
B A $110,474 2008
B A $109,950 2005
B A $82,905 2011
B $34,182 2009
For aggressive funds, the monthly average dollar value of aggressive
investment sales transactions was significantly greater in 2007 ($178,226) as
compared to 2009 ($89,905).

125
Table 6.17 Test for statistically significant differences in the monthly average dollar value of
aggressive sales transactions (VALUE_AGGSALES) from 2005 to 2011 for group M funds
(moderate funds) (p = 0.05)
Means with the same letter
are not significantly different.
Grouping Mean Year
A $180,962 2011
B A $147,455 2007
B A $126,218 2005
B A $99,546 2006
B A $82,362 2010
B $45,994 2008
B $40,730 2009
With regards to the variable VALUE_AGGSALES and moderate risk funds,
the value recorded in 2011 ($180,962) was significantly greater than 2008 ($45,994)
and 2009 ($40,730).
Table 6.18 Test for statistically significant differences in the monthly average dollar value of
aggressive sales transactions (VALUE_AGGSALES) from 2005 to 2011 for group D funds
(defensive funds) (p = 0.05)
Means with the same letter
are not significantly different.
Grouping Mean Year
A $114,002 2011
B A $90,232 2006
B A $87,721 2005
B A $72,598 2007
B A $55,287 2010
B $23,365 2008
B $21,802 2009
Defensive funds within the sample showed a significantly greater difference
in the monthly average dollar value of aggressive sales transactions between 2011
($114,002) and the years 2008 ($23,365) and 2009 ($21,802).

126
6.2.6 Analysis of the Variable COUNT_DEFBUYS Based on Fund Risk
Profile
The results of the analysis for the variable COUNT_DEFBUYS, which
measures the monthly average number of defensive investment sales transactions for
the three fund risk profile groupings, are shown in Tables 6.19, 6.20 and 6.21.
Table 6.19 Test for statistically significant differences in the monthly average number of
defensive purchase transactions (COUNT_DEFBUYS) from 2005 to 2011 for group A funds
(aggressive funds) (p = 0.05)
Means with the same letter
are not significantly different.
Grouping Mean Year
A 9 2009
A 8 2008
A 6 2005
A 6 2010
A 6 2007
A 5 2011
A 5 2006
With regards to the variable COUNT_DEFBUYS for aggressive funds, which
represents the monthly average number of aggressive purchase transactions, no
statistically significant differences were found between the years from 2005 to 2011.

127
Table 6.20 Test for statistically significant differences in the monthly average number of
defensive purchase transactions (COUNT_DEFBUYS) from 2005 to 2011 for group M funds
(moderate funds) (p = 0.05)
Means with the same letter
are not significantly different.
Grouping Mean Year
A 9 2006
A 9 2007
A 8 2005
A 7 2008
A 6 2011
A 6 2009
A 6 2010
As with aggressive funds within the sample, no statistically significant
differences were found in the monthly average number of aggressive purchase
transactions for moderate funds between the years 2005 to 2011.
Table 6.21 Test for statistically significant differences in the monthly average number of
defensive purchase transactions (COUNT_DEFBUYS) from 2005 to 2011 for group D funds
(defensive funds) (p = 0.05)
Means with the same letter
are not significantly different.
Grouping Mean Year
A 7 2009
A 7 2005
A 7 2008
A 6 2006
A 5 2007
A 5 2011
A 5 2010
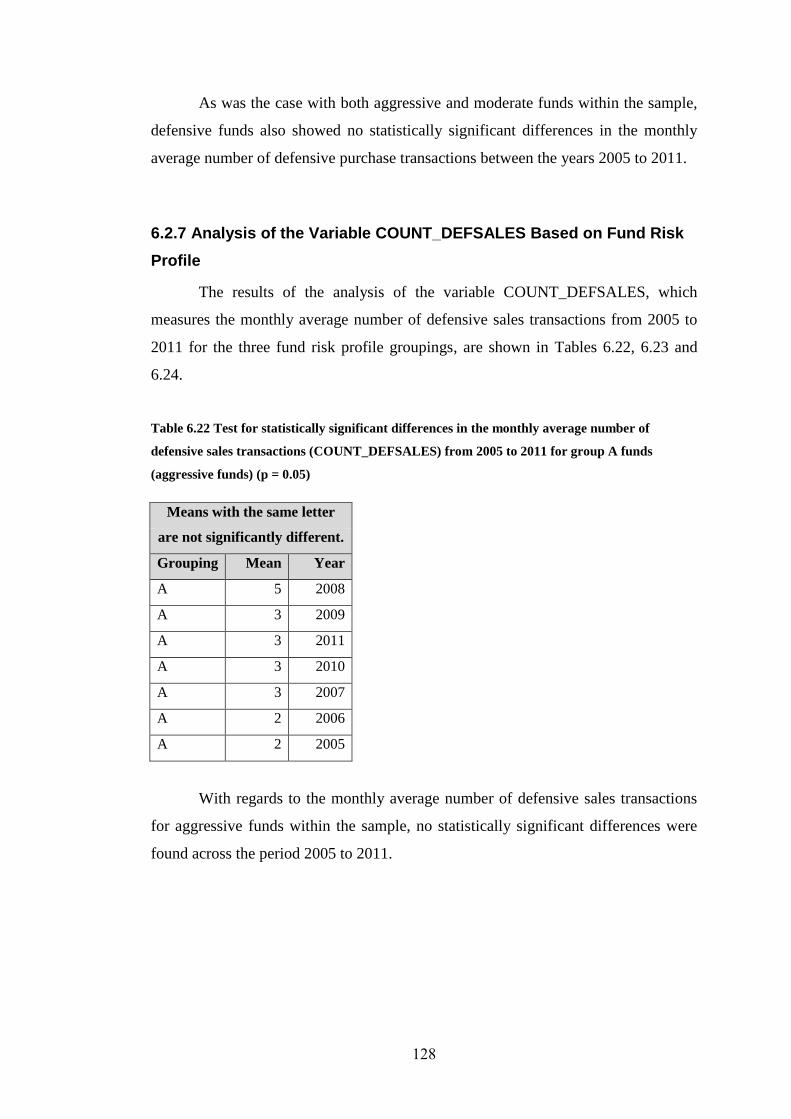
128
As was the case with both aggressive and moderate funds within the sample,
defensive funds also showed no statistically significant differences in the monthly
average number of defensive purchase transactions between the years 2005 to 2011.
6.2.7 Analysis of the Variable COUNT_DEFSALES Based on Fund Risk
Profile
The results of the analysis of the variable COUNT_DEFSALES, which
measures the monthly average number of defensive sales transactions from 2005 to
2011 for the three fund risk profile groupings, are shown in Tables 6.22, 6.23 and
6.24.
Table 6.22 Test for statistically significant differences in the monthly average number of
defensive sales transactions (COUNT_DEFSALES) from 2005 to 2011 for group A funds
(aggressive funds) (p = 0.05)
Means with the same letter
are not significantly different.
Grouping Mean Year
A 5 2008
A 3 2009
A 3 2011
A 3 2010
A 3 2007
A 2 2006
A 2 2005
With regards to the monthly average number of defensive sales transactions
for aggressive funds within the sample, no statistically significant differences were
found across the period 2005 to 2011.

129
Table 6.23 Test for statistically significant differences in the monthly average number of
defensive sales transactions (COUNT_DEFSALES) from 2005 to 2011 for group M funds
(moderate funds) (p = 0.05)
Means with the same letter
are not significantly different.
Grouping Mean Year
A 8 2008
B A 6 2011
B A 5 2007
B A 4 2009
B A 4 2006
B 4 2010
B 3 2005
Moderate funds within the sample showed a number of statistically
significant differences in the monthly average number of defensive sales
transactions, with 2008 (8) having a significantly higher monthly average than 2005
(3) and 2010 (4).
Table 6.24 Test for statistically significant differences in the monthly average number of
defensive sales transactions (COUNT_DEFSALES) from 2005 to 2011 for group D funds
(defensive funds) (p = 0.05)
Means with the same letter
are not significantly different.
Grouping Mean Year
A 7 2008
A 5 2011
A 4 2007
A 4 2010
A 4 2005
A 3 2009
A 3 2006

130
As with aggressive funds within the sample, defensive funds showed no
statistically significant differences in the monthly average number of defensive sales
transactions from 2005 to 2011.
6.2.8 Analysis of the Variable VALUE_DEFBUYS Based On Fund Risk
Profile
The results of the analysis of the variable VALUE_DEFBUYS for the three
fund risk profile groupings, which measures the average monthly dollar value of
investment transactions which involved the purchase of a defensive investment, are
shown in Tables 6.25, 6.26 and 6.27.
Table 6.25 Test for statistically significant differences in the monthly average dollar value of
defensive purchase transactions (VALUE_DEFBUYS) from 2005 to 2011 for group A funds
(aggressive funds) (p = 0.05)
Means with the same letter
are not significantly different.
Grouping Mean Year
A $182,452 2011
B A $139,375 2010
B A $129,876 2007
B A $118,171 2008
B A $115,714 2005
B A $88,000 2009
B $76,602 2006
Aggressive funds within the sample showed a significantly greater difference
in the monthly average dollar value of defensive purchase transactions between the
years 2011 ($182,452) and 2006 ($76,602).

131
Table 6.26 Test for statistically significant differences in the monthly average dollar value of
defensive purchase transactions (VALUE_DEFBUYS) from 2005 to 2011 for group M funds
(moderate funds) (p = 0.05)
Means with the same letter
are not significantly different.
Grouping Mean Year
A $240,449 2007
B A $200,367 2006
B A $158,584 2005
B A $135,366 2010
B $119,937 2011
B $114,506 2008
B $91,126 2009
Significantly greater differences in the monthly average dollar value of
defensive purchase transactions for moderate risk funds were found between 2007
($240,449) and the years 2008, 2009 and 2011 ($114,506, $91,126 and $119,937
respectively).
Table 6.27 Test for statistically significant differences in the monthly average dollar value of
defensive purchase transactions (VALUE_DEFBUYS) from 2005 to 2011 for group D funds
(defensive funds) (p = 0.05)
Means with the same letter
are not significantly different.
Grouping Mean Year
A $248,143 2010
A $236,607 2011
A $182,033 2009
A $122,705 2007
A $120,177 2005
A $110,520 2008
A $92,311 2006

132
Unlike aggressive and moderate risk funds, no statistically significant
differences were found in the monthly average dollar value of defensive purchase
transactions over the period 2005 to 2011 for defensive funds.
6.2.9 Analysis of the Variable VALUE_DEFSALES Based on Fund Risk
Profile
The results of the analysis of the variable VALUE_DEFSALES for the three
fund risk profile groupings, which measures the monthly average dollar value of
defensive investment sales transactions, are shown in Tables 6.28, 6.29 and 6.30.
Table 6.28 Test for statistically significant differences in the monthly average dollar value of
defensive sales transactions (VALUE_DEFSALES) from 2005 to 2011 for group A funds
(aggressive funds) (p = 0.05)
Means with the same letter are
not significantly different.
Grouping Mean Year
A $149,187 2011
B A $141,309 2010
B A C $123,157 2008
B A C $89,208 2007
B A C $65,145 2009
B C $47,829 2005
C $40,336 2006
For aggressive funds within the sample the year 2011 ($149,187) was
significantly greater than both 2005 ($47,829) and 2006 ($40,336), while 2010
($141,309) was significantly greater than 2006 ($40,336).

133
Table 6.29 Test for statistically significant differences in the monthly average dollar value of
defensive sales transactions (VALUE_DEFSALES) from 2005 to 2011 for group M funds
(moderate funds) (p = 0.05)
Means with the same letter
are not significantly different.
Grouping Mean Year
A $167,855 2008
B A $144,024 2007
B A $139,765 2011
B A $131,956 2010
B A $122,852 2006
B A $84,483 2009
B $54,127 2005
With regards to moderate risk funds within the sample there was a
significantly greater difference in the monthly average dollar value of defensive sales
transactions between 2008 and 2005, with 2008 recording an average of $167,855
compared to $54,127 in 2005.
Table 6.30 Test for statistically significant differences in the monthly average dollar value of
defensive sales transactions (VALUE_DEFSALES) from 2005 to 2011 for group D funds
(defensive funds) (p = 0.05)
Means with the same letter
are not significantly different.
Grouping Mean Year
A $252,161 2010
A $249,373 2011
B A $142,501 2009
B A $133,666 2008
B A $97,576 2007
B $71,676 2005
B $45,209 2006
For defensive funds within the sample 2010 recorded a significantly greater
monthly average dollar value of defensive sales transactions than 2005 and 2006,

134
with averages of $252,161, $71,676 and $45,209 respectively. The year 2011 was
also significantly greater than 2005 and 2006, with respective mean values of
$249,373, $71,676 and $45,209.
6.2.10 Analysis of the Variable NET_FLOWDEF Based on Fund Risk
Profile
The results of the analysis of the variable NET_FLOWDEF for the three fund
risk profile groupings, which measures the net flow of funds into defensive assets,
are shown in Tables 6.31, 6.32 and 6.33.
Table 6.31 Test for statistically significant differences in the monthly average net flow of money
into defensive assets (NET_FLOWDEF) from 2005 to 2011 for group A funds (aggressive funds)
(p = 0.05)
Means with the same letter
are not significantly different.
Grouping Mean Year
A $22,494 2005
A -$18,879 2007
A -$29,838 2010
A -$56,007 2011
A -$61,052 2006
A -$63,598 2008
A -$81,214 2009
For aggressive funds within the sample no statistically significant differences
in the monthly average net flow of money into defensive assets were found over the
period 2005 to 2011.

135
Table 6.32 Test for statistically significant differences in the monthly average net flow of money
into defensive assets (NET_FLOWDEF) from 2005 to 2011 for group M funds (moderate funds)
(p = 0.05)
Means with the same letter
are not significantly different.
Grouping Mean Year
A $78,307 2011
B A $23,992 2005
B A -$30,804 2010
B A -$40,379 2008
B -$71,082 2009
B -$107,156 2007
B -$107,331 2006
For moderate risk funds within the sample there was a significantly greater
difference in the variable NET_FLOWDEF between 2011 ($78,307) and 2006
(-$107,331), 2007 (-$107,156) and 2009 (-$71,802).
Table 6.33 Test for statistically significant differences in the monthly average net flow of money
into defensive assets (NET_FLOWDEF) from 2005 to 2011 for group D funds (defensive funds)
(p = 0.05)
Means with the same letter
are not significantly different.
Grouping Mean Year
A $27,309 2011
A $12,674 2005
B A -$12,080 2010
B A -$25,455 2008
B A -$44,154 2007
B A -$50,132 2006
B -$108,227 2009
For defensive funds within the sample there was a significantly greater
difference in NET_FLOWDEF between the years 2011 ($27,309) and 2005
($12,674) with 2009 (-$108,227).

136
6.2.11 Analysis of the Variable TRADE_VALUE Based on Fund Risk
Profile
The results of the analysis of the variable TRADE_VALUE, which measures
the monthly average dollar value of all investment transactions for the three fund risk
profile groupings, are shown in Tables 6.34, 6.35 and 6.36.
Table 6.34 Test for statistically significant differences in the monthly average total trade value
of all investment transactions (TRADE_VALUE) from 2005 to 2011 for group A funds
(aggressive funds) (p = 0.05)
Means with the same letter
are not significantly different.
Grouping Mean Year
A $594,416 2007
B A $565,268 2010
B A $553,456 2011
B A $525,873 2008
B A $402,439 2006
B A $360,949 2005
B $302,724 2009
For aggressive funds within the sample 2007 recorded a significantly greater
monthly average total trade value than 2009, with an average of $594,416 compared
to $302,274.

137
Table 6.35 Test for statistically significant differences in the monthly average total trade value
of all investment transactions (TRADE_VALUE) from 2005 to 2011 for group M funds
(moderate funds) (p = 0.05)
Means with the same letter are
not significantly different.
Grouping Mean Year
A $786,540 2007
B A $629,643 2006
B A C $543,321 2011
B C $462,849 2010
B C $441,155 2005
B C $414,728 2008
C $328,152 2009
For moderate risk funds within the sample a number of statistically
significant differences in the monthly average total trade value of all investment
transactions were found. The monthly average of $786,540 in 2007 was significantly
greater than 2009 ($328,152), 2008 ($414,728), 2005 ($441,155) and 2010
($543,321). 2006, with a monthly average of $629,643, was also significantly greater
than 2009 ($328,152).
Table 6.36 Test for statistically significant differences in the monthly average total trade value
of all investment transactions (TRADE_VALUE) from 2005 to 2011 for group D funds
(defensive funds) (p = 0.05)
Means with the same letter
are not significantly different.
Grouping Mean Year
A $686,675 2011
B A $622,960 2010
B A $476,366 2009
B A $409,631 2007
B A $368,115 2006
B $354,620 2005
B $316,371 2008

138
For defensive funds within the sample 2011 had a significantly greater
monthly average total trade value than 2008 and 2005, with means of $686,675
compared to $316,371 and $354,620 respectively.
6.3 Conclusion
This section of the study outlined the results of the analysis of funds within
the sample based on the relative risk profile of each of the funds. The purpose of the
analysis is to determine whether or not fund risk profile is a differentiating factor
when considering the investment approach adopted by fund trustees.
SMSFs within the sample which were categorised as having an aggressive
investment approach tended to show little difference in the frequency of trades over
the period 2005 to 2011, although the average monthly dollar value of trades was
significantly lower during the financial crisis (2009) when compared to immediately
prior to the crisis (2007), suggesting that trustees of these SMSFs made only slight
changes to the frequency and dollar value of their trading activity. Interestingly,
trustees with an aggressive risk profile generally showed little willingness to
significantly increase aggressive investment exposure in the middle of the financial
crisis as asset markets reached their lows. Furthermore, the same trustees tended to
increase defensive investment exposure after the financial crisis when compared to
those periods prior to and during the crisis. This relatively conservative investment
behaviour would appear to be somewhat at odds with an aggressive investment
approach.
Those funds within the sample with a moderate risk profile tended to trade
less frequently both during and following the financial crisis when compared to the
period leading up to the financial crisis. Trading activity and the monthly average
dollar trade value was particularly low during 2009, a period when equity markets
reached their lows during the financial crisis. In general, moderate risk funds
increased aggressive investment exposure immediately prior to the financial crisis,
rather than the more appropriate strategy of reducing such exposure. There is also
little evidence that trustees of moderate risk funds took advantage of low prices

139
during or following the financial crisis to increase exposure to aggressive
investments.
Those SMSF within the sample with a defensive risk profile made no
significant changes in trading frequency over the period 2005 to 2011, although those
years following the crisis tended to exhibit a greater monthly average total trade
value. Trustees of defensive funds generally increased exposure to aggressive
investments in those years prior to the crisis, although not to a significant degree on
the eve of the crisis in 2007. Interestingly in 2009, during which equity markets
reached their lows, defensive-minded trustees significantly increased their exposure
to aggressive investments, most likely taking advantage of low asset prices at that
time. With regards to those transactions involving increasing exposure to defensive
investments, there were no significant differences in the trading behaviour of
defensive-minded trustees.
The analysis of SMSFs within the sample based on risk profile has
implications for a number of the behavioural finance concepts previously discussed
in this study. In particular, the fact that trustees of both aggressive and moderate risk
funds did not take advantage of lower asset prices during the financial crisis suggests
the existence of loss aversion among those trustees. Given their more aggressive risk
profile, trustees of these funds may have incurred significant losses as markets fell at
the onset of the financial crisis and were therefore unwilling to realise these losses in
order to take advantage of low asset prices as the market bottomed and subsequently
recovered. Trustees with a defensive investment approach however, who likely
suffered lower unrealised losses as markets fell, were more willing to take advantage
of low asset prices as the market bottomed. This is contrary to the expectation that
aggressively-minded trustees would be quick to invest in higher risk assets as
markets reached their lows in early 2009.
The behaviour of aggressive and moderate risk trustees also suggests the
existence of regret avoidance, where trustees were unwilling to sell their losing
investments in order to take advantage of lower prices for other assets. However this
would need to be confirmed by a closer analysis of the individual transactions of
each fund trustee in order to identify the exact investment holdings which were sold

140
by trustees. Such an analysis is beyond the scope of this study but potentially
presents an opportunity for further research. Overall however, this trading behaviour
again suggests that SMSF trustee risk profiles are not constant, but do change as
circumstances change, confirming work by Gai and Vause (2005). This finding has
implications for those who provide investment advice to SMSF trustees, principally
financial advisers and accountants. Their reliance on risk profiling may not be
sufficiently dynamic to take into account changing risk profiles of SMSF trustees
under differing circumstances. The finding that SMSF trustees tended to increase
their exposure to defensive assets after the financial crisis, regardless of trustee risk
profile, again suggests that SMSF trustees exhibit the availability heuristic, as
discussed in Chapter 3. This indicates that regardless of their appetite for risk, SMSF
trustees tended to overestimate the likelihood of another investment bear market in
the period following the financial crisis.
This chapter presented the results of the analysis of the trading behaviour of
SMSFs according to the risk profile of each fund within the sample. In general,
regardless of risk profile, fund trustees tended to increase aggressive investment
exposure prior to the financial crisis. Only trustees with a defensive risk profile
avoided increasing their aggressive investment exposure on the eve of the financial
crisis. Again, only trustees with a defensive risk profile showed any evidence of
being willing to take advantage of lower prices during the financial crisis to increase
their exposure to aggressive investments and most likely benefit from the subsequent
recovery in equity markets. The next section of the study, Chapter 7, discusses the
results of the analysis that has been presented in Chapters 4, 5 and 6. This discussion
is presented within the context of the research questions and hypotheses outlined in
Chapter 3.

141
CHAPTER 7
DISCUSSION
7.1 Introduction
The previous three chapters presented the results of the analysis of SMSF
investment transactions over the period 2005 to 2011. This was done on both an
annual and per period basis and also considered the trading activity of funds within
the sample based on the size of each fund and the level of aggressive or defensive
assets held within each fund. This chapter discusses the results of the analyses which
were outlined in Chapters 4, 5 and 6.
The discussion of the results of the analyses is framed with reference to
addressing the research questions outlined in Chapter 3, which are:
1. Did SMSFs (correctly) increase their exposure to cash and other defensive
investments in the period leading up to the global financial crisis?
2. Did SMSFs (correctly) increase their exposure to market risk assets as
stock markets bottomed and recovered in 2009?
3. Have SMSFs become more conservative in their investment approach since
the global financial crisis?
4. Did larger or less risk-averse SMSFs behave differently as compared to
smaller or more conservative SMSFs over the course of the global financial crisis?
The discussion begins with an assessment of whether or not evidence exists
that SMSF trustees were increasing their exposure to defensive investments on the
eve of the financial crisis, which may indicate whether or not SMSF trustees were
correctly positioning their investment portfolios prior to the significant equity market
falls which occurred during the crisis.
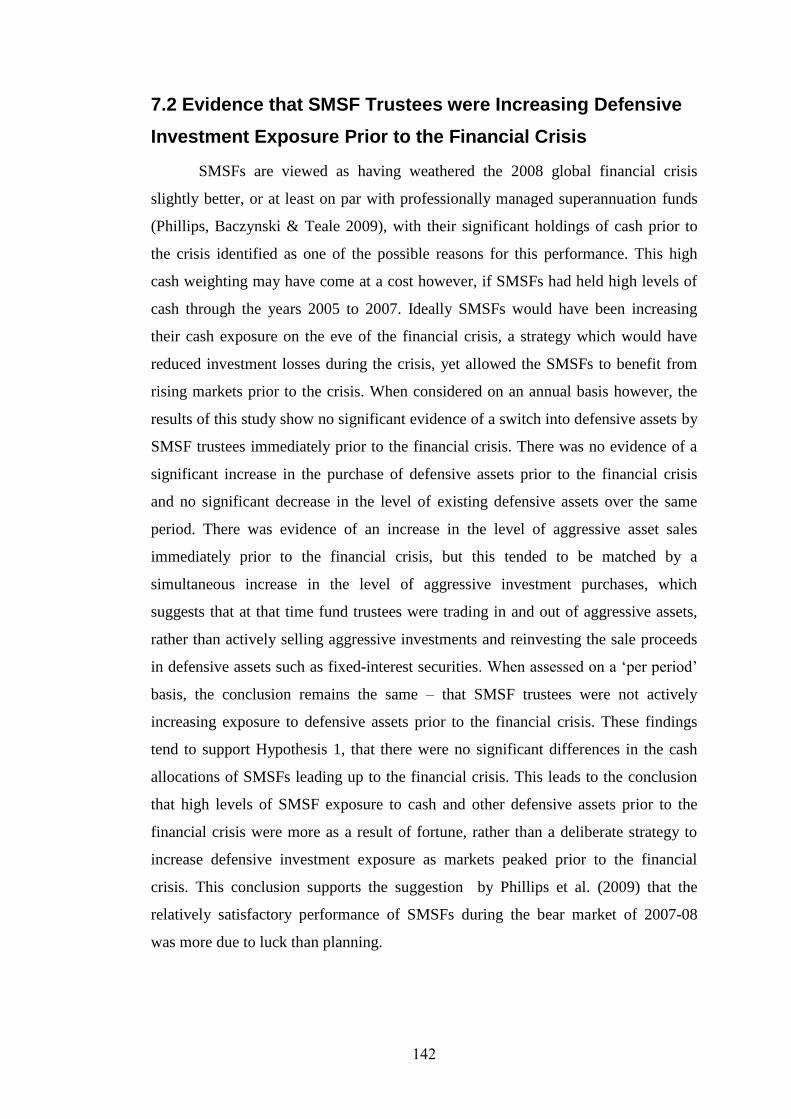
142
7.2 Evidence that SMSF Trustees were Increasing Defensive
Investment Exposure Prior to the Financial Crisis
SMSFs are viewed as having weathered the 2008 global financial crisis
slightly better, or at least on par with professionally managed superannuation funds
(Phillips, Baczynski & Teale 2009), with their significant holdings of cash prior to
the crisis identified as one of the possible reasons for this performance. This high
cash weighting may have come at a cost however, if SMSFs had held high levels of
cash through the years 2005 to 2007. Ideally SMSFs would have been increasing
their cash exposure on the eve of the financial crisis, a strategy which would have
reduced investment losses during the crisis, yet allowed the SMSFs to benefit from
rising markets prior to the crisis. When considered on an annual basis however, the
results of this study show no significant evidence of a switch into defensive assets by
SMSF trustees immediately prior to the financial crisis. There was no evidence of a
significant increase in the purchase of defensive assets prior to the financial crisis
and no significant decrease in the level of existing defensive assets over the same
period. There was evidence of an increase in the level of aggressive asset sales
immediately prior to the financial crisis, but this tended to be matched by a
simultaneous increase in the level of aggressive investment purchases, which
suggests that at that time fund trustees were trading in and out of aggressive assets,
rather than actively selling aggressive investments and reinvesting the sale proceeds
in defensive assets such as fixed-interest securities. When assessed on a ‘per period’
basis, the conclusion remains the same – that SMSF trustees were not actively
increasing exposure to defensive assets prior to the financial crisis. These findings
tend to support Hypothesis 1, that there were no significant differences in the cash
allocations of SMSFs leading up to the financial crisis. This leads to the conclusion
that high levels of SMSF exposure to cash and other defensive assets prior to the
financial crisis were more as a result of fortune, rather than a deliberate strategy to
increase defensive investment exposure as markets peaked prior to the financial
crisis. This conclusion supports the suggestion by Phillips et al. (2009) that the
relatively satisfactory performance of SMSFs during the bear market of 2007-08
was more due to luck than planning.

143
The implication of this finding is that SMSF trustees would most likely have
missed out on the positive market returns enjoyed over the period leading up to the
financial crisis. It may be that forgoing the high returns enjoyed by other
superannuation funds over this period more than offset the relative outperformance
of SMSFs during the financial crisis. This question could be resolved through a
comparison of SMSF returns with other superannuation funds across a longer
timeframe than that canvassed by this study.
The next section considers whether or not evidence exists to support the
notion that SMSF trustees took advantage of lower prices for aggressive assets
during the financial crisis by increasing their exposure to such assets as markets fell
and subsequently bottomed in early 2009, a strategy which would have likely
resulted in higher investment returns. This seeks to address Hypothesis 2, that there
was no significant difference in the exposure to risk assets by SMSFs between those
periods prior to and during the financial crisis.
7.3 Evidence that SMSF Trustees Increased their Exposure to
Riskier Investments as Markets Recovered Following the
Financial Crisis
The global financial crisis and associated falls in market indices in most
countries resulted in steep losses for investors, but also presented an opportunity for
astute investors to invest at or close to the market bottom in early 2009. Such a
strategy would have likely resulted in significant capital growth as markets recovered
in 2009 and 2010. For SMSFs, which typically held a greater allocation to cash than
other superannuation funds, there existed an attractive opportunity to take advantage
of cheap prices for most assets, including listed investments.
In terms of this study, the actions of SMSF trustees to take advantage of such
an opportunity should be evident in the level of aggressive investment purchases
made by trustees over 2008 and 2009. Evidence however, of a deliberate decision by
SMSF trustees to invest at such an opportune time is not confirmed by the results of
the analysis. On both an annual and ‘per period’ basis, there is no evidence of a

144
statistically significant increase in the level of exposure to aggressive investments by
SMSF trustees over that period encompassing the market lows. This conclusion tends
to support Hypothesis 2 that there is no evidence that SMSFs made significant
changes to their exposure to riskier assets during the financial crisis. These findings
support previous research regarding changes in the risk profile of Australian
investors during the financial crisis (Bateman et al. 2010), where it was found that
there was little difference in the risk attitudes of investors between ‘tranquil’ periods
and the financial crisis of 2008. Work by Kallberg et al. (2012) however, found that
Chinese investors tended to reduce risk during the financial crisis, with a reduction in
the standard deviation of portfolios within the sample as compared to the market’s
standard deviation. It may be that SMSF trustees, managing assets held exclusively
for retirement, adopted a longer term perspective than the private investors analysed
in the study by Kallberg et al. (2012) and were more willing to ‘ride out’ the market
falls during the financial crisis. This suggests a further area of research, which could
be to directly compare investment trading decisions of SMSF trustees with those of
private Australian investors.
The results of the analysis of SMSF trading activity prior to and during the
financial crisis would tend support Hypothesis 2, that there was no significant
difference in the exposure to higher risk assets by SMSFs between those periods
prior to and during the financial crisis. The next section seeks to address the third
research question, which asks if the events of the financial crisis have resulted in
fund trustees adopting a more conservative investment approach.
7.4 Evidence that SMSF Trustees have Become More
Conservative in their Investment Approach Since the Global
Financial Crisis
The third research question considers whether the investment approach of
SMSF trustees has been impacted by the events and investment returns experienced
through the financial crisis. That is, have the sharp falls associated with equity
markets and other asset classes had a permanent impact on the investment strategy of
SMSF trustees? Have SMSF trustees responded to the losses experienced through

145
2008 and 2009 by permanently altering their investment approach to a more
conservative style, as compared to their approach prior to the global financial crisis?
This question can be answered by comparing the results of the analysis of a number
of the variables both before and after the financial crisis. If trustees have made
significant changes to their investment approach in response to the financial crisis,
one would expect to see statistically significant differences between the results prior
to and following the crisis for those variables which outline increasing or decreasing
defensive or aggressive investment exposure respectively.
In terms of the results of the analysis of this study, there is some evidence to
suggest that SMSF trustees have become more conservative since the global financial
crisis. While not overwhelming, a number of those variables which measure the rate
of increasing or decreasing exposure to defensive or aggressive assets respectively,
do tend to show a significant change in the investment approach of SMSFs. In
general, fund trustees did not actively reduce their level of aggressive investment
exposure (little or no significant differences in aggressive sales transactions) in the
period following the crisis as compared to prior to the crisis, but there was a
significantly lower level of aggressive investment purchase transactions. In those
years following the crisis, 2010 and 2011, SMSF trustees did increase their dollar
commitment to defensive investment purchases, although only 2011 was statistically
significantly greater than those years prior to the crisis. Overall however, there is
sufficient evidence to suggest that SMSF trustees have adopted a more conservative
investment approach since the financial crisis, as compared to that period prior to the
crisis. This result is similar to findings by Kallberg et al. (2012) who found that
Chinese investors were more likely to reduce aggressive investment exposure within
their portfolios following market falls, although in that instance the analysis
compared the period during the market falls with the period following the market
falls.
The change in investment approach by SMSF trustees across the period 2005
to 2011 is also evident in the trading frequency of the funds within the sample. In
general it was found that fund trustees traded significantly more frequently prior to
the crisis than following the crisis, however the average dollar value of each trade
was highest in that period following the crisis. It was also found that the frequency

146
and dollar value committed per trade was lowest during the financial crisis, which
may indicate reluctance by SMSF trustees to make any form of investment decisions
during the crisis, be they aggressive or defensive in nature. The higher average dollar
value per trade in that period following the crisis may simply reflect that SMSF
trustee’s assets under management had grown over the seven year period covered by
the study. This propensity to reduce trading activity is not matched by 401(k)
participants in the United States, where it was found that investors traded more
frequently during the financial crisis, although the increase was not seen as
significant (Tang et al. 2011).
The results of the analysis of SMSF defensive investment trading behaviour
does not support Hypothesis 3, that there was no significant difference in the
exposure to higher risk assets by SMSFs between the period prior to and following
the financial crisis. There is a significant difference in the trading behaviour of
SMSFs across those two periods, manifesting itself as a change to a more
conservative investment approach following the crisis when compared to prior to the
crisis. The next section discusses the results of the analysis of the trading behaviour
of SMSFs within the sample based on fund size. This analysis was conducted in
order to determine whether or not different sized SMSFs responded differently to the
events occurring prior to, during and after the global financial crisis.
7.5 SMSF Trading Behaviour Based on Fund Size
The issue of SMSF size and how it relates to the trading behaviour of fund
trustees raises a number of questions. It is reasonable to assume that in general,
larger SMSFs (in terms of assets under the management of fund trustees) would
belong to members with a greater overall wealth than members of SMSFs with a
lower level of assets within the fund. Given that most individuals tend to accumulate
wealth later in life, particularly with respect to superannuation, it may also be that
larger SMSFs are managed by trustees who are older or more experienced than
trustees of smaller funds. Analysing the trading behaviour of SMSF trustees on the
basis of fund size may therefore act as a proxy for some of the demographic features
of SMSF trustees, specifically trustee age and overall wealth. In order to determine
whether or not the size of a SMSF is related to the investment decisions of the fund’s

147
trustees, the funds within the sample were grouped by size and their investment
transactions analysed according to the variables outlined in Table 3.7.
7.5.1 The Trading Behaviour of Small SMSFs
As with the SMSF sample as a whole, small funds within the sample
exhibited a greater tendency to trade more frequently and more aggressively prior to
the financial crisis. Small funds also tended to be more conservative in the period
following the crisis, with a greater emphasis on the purchase of defensive
investments in that period. There is little evidence that trustees of small SMSFs
within the sample acted to take advantage of falling or lower asset prices during the
financial crisis.
7.5.2 The Trading Behaviour of Medium-Sized SMSFs
As with small funds, medium-sized funds within the sample also tended to be
more aggressive in the period prior to the financial crisis, as compared to the years
following the crisis. Interestingly however, there is evidence that medium-sized
funds acted to increase their exposure to aggressive investments during the crisis.
Such a strategy of increasing exposure to riskier assets close to or at the bottom of
the bear market may have resulted in medium-sized funds within the sample earning
a higher overall investment return. Medium-sized funds also tended to trade more
frequently prior to the financial crisis.
7.5.3 The Trading Behaviour of Large SMSFs
Large funds within the sample tended to show the least variation in trading
frequency over the period 2005 to 2011 when compared to small and medium-sized
funds, however the nature of the activity did change. Trustees of large SMSFs made
significantly greater average monthly dollar value purchases of defensive
investments immediately prior to the financial crisis. Of the three fund size groupings
within the SMSF sample, only trustees of larger funds appear to have been increasing
defensive investment exposure prior to the crisis. This may be due to the possibility
that trustees of larger SMSFs are older and more experienced than trustees of smaller

148
funds and may have more readily expected the stock market falls during 2008-09.
However, the trading behaviour of large SMSFs differs from the behaviour of other
‘sophisticated’ investors during the financial crisis. Ben-David at el. (2011) showed
that US based hedge funds, professional investors who generally employ complicated
and sophisticated investment trading strategies, sold down nearly a third of their
equity holdings during the early stages of the financial crisis (the first six months of
2008). This suggests that trustees of large SMSFs, while potentially more
sophisticated than their counterparts at smaller funds, do not exhibit the same
investment trading patterns as professional investors.
7.5.4 Summary of Fund Size and Trading Behaviour
The trading behaviour of SMSF trustees does appear to vary according to the
size of the fund. In general, larger funds may have lessened the impact of the
financial crisis by increasing allocations to defensive investments prior to the crisis,
while medium-sized funds were more likely to act to take advantage of falling and
lower stock market prices around 2008-09. Small SMSFs tended to exhibit little
evidence of an appropriate investment strategy. It may be that trustees of such funds
are either less experienced than their counterparts at larger funds, or that the trustees,
potentially being younger and with a longer investment time horizon, may have been
less concerned about the market volatility and kept to their existing investment
strategy regardless of economic and market conditions. The issue of fund size is an
important one, given that much attention has been focused on the optimum size of an
SMSF, although this is usually within the context of fees, not investment returns or
investment strategies. Given their relative inflexibility, it may be that smaller funds
are more likely to have generated lower returns than compared to medium-sized or
larger funds within the sample, which potentially presents an area of further research.
This would add further information to the question of the optimal size of a SMSF.
This section discussed the results of the analysis of fund trading activity
based on fund size. The next section discusses the analysis of the same variables
based on fund risk profile. As outlined in Chapter 3, each fund within the sample was
identified as having an ‘aggressive’, ‘moderate’ or ‘defensive’ approach and
149
segmented accordingly. Each risk profile grouping was then assessed as per the
variables outlined in Chapter 3.
7.6 SMSF Trading Behaviour Based on Fund Risk Profile
The discussion of the analysis of funds within the sample based on fund risk
profile addresses variations in the investment approach of funds with differing risk
profiles. For example, did fund trustees with a lower risk tolerance correctly reduce
market risk exposure prior to the financial crisis? Did fund trustees with higher risk
tolerance levels react more quickly to take advantage of falling asset prices during
the financial crisis, or was there no discernible difference in the behaviour of fund
trustees, regardless of their risk tolerance levels? These are a number of the questions
that may be answered through the analysis of the transaction data on the basis of fund
risk profile.
7.6.1 The Trading Behaviour of Aggressive SMSF Trustees
Funds within the sample with an aggressive investment approach tended to
display the same characteristics of the general SMSF sample. That is, they tended to
invest aggressively immediately prior to the financial crisis, showed only minor
evidence of taking advantage of lower prices for assets during the financial crisis,
and tended to be more conservative following the crisis. Being classified as
‘aggressive’ investors, it is surprising that trustees of these SMSFs did not move to
take advantage of falling or low prices for investment assets over the period 2008-09,
particularly with regards to listed investments. This may indicate that even trustees
with an aggressive investment approach were concerned by economic and financial
events during the financial crisis. This may suggest that the risk profile of SMSF
trustees is not fixed and can change depending on external factors. This is reinforced
by the apparent increase in defensive investment exposure following the crisis by
what are notionally ‘aggressive’ SMSF trustees. It may also be that those funds
classified as ‘aggressive’ may have been fully invested at the onset of the financial
crisis and did not possess the available cash required to invest in ‘cheap’ assets at the
bottom of the bear market, or may have been unwilling to realise losses on existing
holdings in order to invest at the market bottom. The finding that aggressive trustees

150
did not increase exposure to aggressive investment holdings during the financial
crisis differs from work by Ho et al. (2010), who found that 401(k) investors in the
United States with an aggressive investment profile tended to increase their exposure
to aggressive assets as markets fell, particularly through the year 2008. The authors
acknowledged however, that their study had low external validity, being based on the
analysis of the 401(k) investment decisions of employees of one small company.
Other studies have found similar conclusions relating to the trading behaviour of
401(k) participants (Mitchell et al. 2007; Yamaguchi 2006). It may be that the
average participant in the study with a 401(k) plan was less engaged in the
management of their retirement assets than trustees of Australian SMSFs, and were
more likely to simply continue their pre-existing approach to investment allocation,
regardless of economic or market circumstances. The substantial administrative and
regulatory burden associated with acting as trustee of a SMSF may lead to a greater
engagement by the trustees in the management of their assets, and therefore trustees
may be more likely to make changes to their investment approach as economic and
market circumstances change.
7.6.2 The Trading Behaviour of Moderate Risk SMSF Trustees
Moderate risk SMSFs within the sample tended to exhibit trading behaviour
which was very similar to that of aggressive funds – little evidence of reducing
investment risk exposure on the eve of the crisis; little evidence of acting to take
advantage of low asset prices during the crisis and a more conservative approach
following the crisis. One differentiating characteristic is that moderate risk SMSFs
appeared to reduce their defensive investment exposure during the financial crisis,
specifically during 2008. It may be however that trustees were simply taking action
to increase cash holdings at the expense of other investments classified as
‘defensive’, such as corporate bonds or hybrid securities. Compared to SMSFs with
an aggressive risk profile, there was a more significant fall in overall trading activity
and trade value during the crisis however. It appears that SMSF trustees with a
moderate risk profile were more sensitive to falling markets than more aggressive
trustees, and tended to refrain from all types of trading activity during the crisis. This
finding is not wholly unexpected given the differences in risk profile of the trustees.

151
7.6.3 The Trading Behaviour of Conservative SMSF Trustees
The trustees of SMSFs with a conservative risk profile exhibited the most
surprising trading behaviour of the three different risk profile classifications. While
conservative trustees did not act to reduce aggressive investment exposure on the eve
of the financial crisis, they did significantly increase their exposure to aggressive
investments during 2009, just as equity markets bottomed and began to recover from
the financial crisis. This shift into aggressive investments during this period was
more pronounced for conservative trustees than for aggressive or moderate risk
trustees, which is an unexpected finding. It may be that conservative trustees, more
so than the other trustees, had the ability to take advantage of low asset prices during
this period due to larger cash (or other defensive investment) holdings than
aggressive or moderate risk trustees. The ability to buy when prices are low usually
requires the cash to do so, a situation which may have escaped those SMSF trustees
with more aggressive risk profiles. This finding again differs from conclusions drawn
by Ho et al. (2010), who found that 401(k) investors in the United States with a
conservative investment profile tended to continue to increase their exposure to
defensive assets as markets fell during the financial crisis. As outlined in section
7.6.1, it may be that SMSF trustees are more engaged in the management of their
assets within the fund when compared to 401(k) investors, and therefore more likely
to adjust their investment strategy as required. This fits with other conclusions drawn
by Ho et al. (2010), that 401(k) participants rebalanced their investment infrequently
and tended to leave the asset allocation of their monthly contributions to the plan in
place, regardless of changes in the economy and stock market. Other characteristics
of defensive SMSF trustees were as expected, including a more defensive investment
approach in that period following the financial crisis (the willingness to increase risk
during the financial crisis notwithstanding).
7.6.4 Summary of Fund Risk Profile and Trading Behaviour
The analysis of the relationship between fund risk profile and trading
behaviour revealed a number of interesting insights. The most surprising finding was
that conservative SMSF trustees were the group most likely to take advantage of low
asset prices during the financial crisis. Trustees with an aggressive risk profile,
whom would have been expected to be investing aggressively during the financial

152
crisis, showed little evidence of such an inclination. As discussed, it may simply be
that significant losses on existing higher risk holdings left aggressive trustees in a
position that did not allow them to fully benefit from low asset prices at the bottom
of the bear market, or they had no available cash to take advantage of these
opportunities. Given this finding, it is possible that the investment performance of
conservative SMSF trustees since the financial crisis has been better than that of
moderate or aggressive minded trustees. A comparison of investment returns
between SMSFs with varying risk profiles across differing time periods is beyond the
scope of this study but may be an area for further investigation.
In general however, there were few other significant differences between the
trading behaviour of SMSF trustees with differing risk profiles. All trustees,
regardless of risk profile, tended to increase their exposure to aggressive assets prior
to the financial crisis, an inappropriate strategy given the steep falls in asset prices
during the financial crisis. All trustees, again regardless of risk profile, tended to
become more conservative in that period following the crisis, mimicking the findings
of the analysis of the sample as a whole. Again, this differs from work by Bateman et
al. (2010), who found only a slight decrease in investor risk profile in 2008. As
mentioned earlier, it may be that SMSF trustee risk profiles are not static but can and
do change according to current economic and market conditions. Hoffman et al.
(2011) similarly found that risk tolerance fluctuates over periods of crisis when
compared to non-crisis periods. Unfortunately the evidence suggests that, regardless
of the perceived risk profile of SMSF trustees, SMSF trustees tended to be too
aggressive during periods of rising markets, when investment caution may have been
a more appropriate strategy. Furthermore, most SMSF trustees, with the exception of
those with a conservative risk profile, also tended to be too conservative during those
periods during and after bear markets, when an aggressive approach may have been a
more appropriate strategy.
7.7 Conclusion
The analysis of the trading behaviour of SMSF trustees over the period prior
to, during and after the financial crisis of 2008-09 provides a number of insights into
the investment decision-making process of fund trustees. In general, SMSFs

153
exhibited little evidence of an increase in exposure to defensive assets leading up to
the financial crisis, which suggests that the relative outperformance of SMSFs during
the financial crisis, when compared to other superannuation funds, was more a result
of good fortune rather than good planning. SMSFs on the whole also tended to miss
the opportunity to take advantage of low prices for assets during the financial crisis,
although those funds with a conservative risk profile did show some evidence of
increasing their exposure to higher risk assets during the crisis, a strategy which may
have resulted in higher investment returns than other SMSFs over the same period.
There is also evidence that SMSFs have adopted a more conservative investment
approach since the financial crisis, indicating that the risk profiles of SMSF trustees
are sensitive to existing economic and market conditions. Unfortunately this shift to a
more conservative approach may have resulted in SMSFs forgoing the positive
investment returns enjoyed as asset prices recovered following the crisis.
SMSF size also was found to be an important determination in trading
behaviour, with large and medium-sized funds making more significant changes to
their investment approach when compared to small funds. There was some evidence
that large funds were correctly increasing defensive investment exposure prior to the
financial crisis, while medium-sized funds were more likely to take advantage of low
prices for assets during the crisis. Small SMSFs appeared to lack any of the optimal
changes to investment strategy which may have resulted in improved investment
returns over the period 2005 to 2011. Overall the analysis suggests that larger-sized
SMSFs with a conservative investment approach were more likely to adopt the most
appropriate investment strategy given the set of economic and market circumstances
encountered over the time period under consideration.
The next and final chapter, Chapter 8, concludes this study with a summary
of the main findings, interpretations and insights gained from the study, in addition to
suggestions for further research to improve awareness of the investment trading
behaviour of SMSFs.

154
CHAPTER 8
CONCLUSION
8.1 Introduction
Over a third of all Australian superannuation assets are now managed through
SMSFs, yet comparatively little empirical research has been undertaken to determine
whether or not SMSFs are meeting the needs and objectives of their members,
policy-makers and the public in general. In particular, knowledge of the investment
decision-making and trading behaviour of SMSF trustees is limited, with only a
relatively small number of investigations into the theoretical and practical investment
approaches adopted by SMSF trustees (Phillips 2007; Phillips, Baczynski & Teale
2009a, 2009b; Phillips, Cathcart & Teale 2007). With this background, this study set
out to investigate the investment trading behaviour of SMSF trustees over the period
2005 to 2011. This is the first study to consider the investment decisions of SMSF
trustees over a period of time, as compared to a specific point in time. The time
period under investigation includes events occurring prior to, during and after the
2008 global financial crisis. This presents an opportunity to assess the investment
decision-making of SMSF trustees in periods of both relative financial calm and
significant stress.
The study sought to answer a number of questions regarding the investment
decision-making of SMSF trustees:
1. Did SMSFs (correctly) increase their exposure to cash and other defensive
investments in the period leading up to the global financial crisis?
2. Did SMSFs (correctly) increase their exposure to market risk assets as stock
markets bottomed and recovered in 2009?
3. Have SMSFs become more conservative in their investment approach since the
global financial crisis?

155
4. Did larger or less risk-averse SMSFs behave differently as compared to smaller or
more conservative SMSFs over the course of the global financial crisis?
The research questions were structured in order to allow for an assessment of the
appropriateness or otherwise of SMSF trustee investment decision-making. There is
anecdotal evidence that SMSFs out-performed other superannuation alternatives
during the 2008 global financial crisis, largely attributed to their significant holdings
of cash. If SMSF trustees acted to increase their cash holdings in the period leading
up to the financial crisis, this may indicate the existence of a sophisticated or
appropriate investment strategy by SMSFs. If the large cash holdings on the eve of
the financial crisis were simply due to good fortune however, with little or no
evidence of deliberate decisions by trustees, this raises questions over the investment
strategy of SMSFs and the potential outcomes in the event of another significant bear
market.
The next section of this chapter outlines the empirical findings from the study,
followed by a discussion of the theoretical and policy implications of the results of
the study. Recommendations for future research are then discussed and the chapter
concludes with a final comment regarding the study.
8.2 Empirical Findings
The main empirical findings were summarised in each of the chapters which
presented the results of the analysis, being Chapters 4, 5 and 6. This section will
summarise the results within the context of the research questions outlined in
Chapter 3 and listed in Section 8.1 of this chapter.
1. Did SMSFs (correctly) increase their exposure to cash and other defensive
investments in the period leading up to the global financial crisis?
There is no conclusive evidence that SMSFs increased their exposure to cash
and other defensive assets prior to the global financial crisis. SMSFs tended hold
large cash balances during those years prior to the financial crisis, but there was little
indication of a deliberate strategy to increase those balances as stock markets rose in
those years preceding the crisis. This indicates that the relative out-performance of

156
SMSFs during the 2008 global financial crisis when compared to alternative
superannuation approaches was more a result of good fortune than careful planning.
This supports Hypothesis 1, which was that there were no significant differences in
the cash balances of SMSFs in the period leading to the 2008 global financial crisis.
2. Did SMSFs (correctly) increase their exposure to market risk assets as stock
markets bottomed and recovered in 2009?
There is no conclusive evidence that SMSFs acted to take advantage of lower
priced assets during the 2008-09 bear market by increasing their exposure to higher
risk assets. This supports Hypothesis 2, that there was no significant difference in
SMSF exposure to higher risk assets in that period prior to and during the financial
crisis. It appears that SMSFs missed an opportunity to generate higher investment
returns by investing at or close to the market low in early 2009.
3. Have SMSFs become more conservative in their investment approach since the
global financial crisis?
There is evidence that, in response to the 2008 global financial crisis, SMSF
trustees have adopted a more conservative investment approach. SMSF trustees were
less likely to increase their investment exposure to higher risk assets in that period
following the crisis, when compared to the period prior to the crisis. These findings
do not support Hypothesis 3, that there is no significant difference in the exposure of
SMSFs to riskier assets between the periods prior to and following the crisis. SMSF
trustees have responded to the events of the global financial crisis by adopting a
more conservative investment approach. This conservative investment approach has
persisted in the years following the financial crisis which are covered by this study.
4. Did larger or less risk-averse SMSFs behave differently as compared to smaller or
more conservative SMSFs over the course of the global financial crisis?
Larger SMSFs were more likely to increase allocations to defensive
investments prior to the financial crisis, thereby potentially limiting investment
losses during the crisis. Medium-sized funds were more likely to take advantage of
low asset prices during the bear market, potentially increasing their investment
returns as markets recovered. Small funds did not act to change their investment
exposure either prior to or during the financial crisis, potentially indicating the lack
157
of an appropriate investment strategy. These findings do not support Hypothesis 4,
that there were no significant differences in the trading behaviour between funds
based on fund size. The evidence suggests that a relationship exists between SMSF
size (as measured by assets under management) and the investment approach adopted
by the fund’s trustees. The results also suggest that smaller SMSFs tend to exhibit the
least desirable investment behaviour, with little or no change in investment patterns
regardless of changes in economic and market conditions.
A number of minor differences were found in the investment strategies
between funds of differing risk profiles. More aggressive funds tended to be the least
responsive, in terms of their trading behaviour, to changes in market and economic
conditions. Conservative-minded fund trustees were more likely to take advantage of
cheaper asset prices during the 2008 bear market, though this may have simply been
due to these types of funds having available cash at hand to invest at that point in the
market cycle. All SMSFs within the sample, regardless of risk profile, adopted a
more conservative investment approach following the financial crisis. Although not
conclusive, these findings tend not to support Hypothesis 4, that there were no
significant differences in the trading behaviour between funds based on fund risk
profile. The evidence suggests that a weak relationship exists between SMSF risk (as
measured by exposure to higher risk assets) and the investment approach adopted by
the fund’s trustees.
The results of the analyses suggest that, in general, SMSFs did not adopt
appropriate investment strategies in the period prior to, during and following the
2008 global financial crisis. SMSFs within the sample also exhibited a number of
behavioural biases in their investment approach. SMSF trustees appeared unwilling
to realise losses on their investments, an indication of the existence of loss aversion.
SMSF trustees within the sample did not however conform to general expectations of
constant relative risk aversion and decreasing absolute risk aversion. Their
expectations of consistently increasing investment returns prior to the crisis suggest
the presence of representativeness, while their switch to a defensive investment
strategy after the financial crisis potentially indicates the existence of the availability
heuristic. The apparent inaction on the part of SMSF trustees as asset prices fell
during the crisis further suggests the presence of cognitive dissonance. Faced with

158
evidence to the contrary, trustees within the sample appeared reluctant to make
significant changes to their investment holdings as asset prices fell, perhaps in the
belief that any falls were only temporary.
The study’s findings, which have shown that SMSF trustees within the
sample did not in general make appropriate investment decisions prior to, during and
following the global financial crisis, coupled with the existence of a number of
behavioural biases, has both theoretical and policy implications. These are outlined
in section 8.3.
8.3 Theoretical and Policy Implications
The theoretical implications of this study primarily relate to evidence that
SMSF trustees exhibit a number of investment biases which have already been
identified in other groups of investors. SMSF trustees appear to closely match
Kahneman and Tversky’s (1979) concept of loss aversion, apparently unwilling to
realise losses in order to take advantage of lower asset prices during the global
financial crisis. SMSF trustees also exhibit the existence of another of Kahneman and
Tversky’s (1972) behavioural traits, that of representativeness. Based on their trading
behaviour prior to the financial crisis and during that period following the crisis,
SMFS investors expected future investment outcomes to be the same as past
investment outcomes. This behaviour also confirms the existence of both the
availability heuristic and recency bias – SMSF trustees placed too much weight on
the likelihood of recent events to re-occur in the future.
With regards to risk aversion, the behaviour of SMSF trustees does not
generally support notions of constant relative risk aversion and decreasing absolute
risk aversion. SMSF trustees within the sample did not make consistent changes in
investment risk exposure regardless of SMSF size, indicating the lack of constant
relative risk aversion and decreasing relative risk aversion. This may be explained by
the possibility of the existence (or otherwise) of significant investment assets held
outside of superannuation. When taking all SMSF trustee investment assets into
account, not just those held within superannuation, it may be that trustee investment

159
choices conform to expectations of constant relative risk aversion and decreasing
absolute risk aversion.
The results of the study present a number of implications for policy relating
to the SMSF sector and Australian retirement planning more broadly. Firstly, the
finding that SMSF trustees tended not to exhibit desirable investment trading patterns
over the periods prior to, during and following the financial crisis, suggests that
many SMSF trustees have not developed or implemented appropriate investment
strategies. Current legislation requires SMSF trustees to develop and review their
investment strategy on an annual basis, though this requirement is largely a
compliance matter and does not necessarily have a bearing on the resulting
investment decisions of SMSF trustees.
Secondly, the apparent lack of appropriate SMSF investment strategies raises
the question of SMSF trustee education, training or support. It may be that the
appointment of a SMSF trustee should include a mandatory education component,
specifically focusing on the investment decision-making process. Current legislative
and regulatory guidance tends to concentrate on assisting SMSF trustees in meeting
their compliance related objectives, with the investment aspect of managing a SMSF
left almost entirely to the trustee’s own discretion. It may be that a minimum
education requirement for SMSF trustees, specifically in the area of investment
decision-making, will lead to more appropriate investment decisions by SMSF
trustees. The findings also suggest that the current regulatory emphasis on
compliance related matters is insufficient and should be expanded to include
oversight of the investment decision-making of SMSF trustees. Indeed, it may be
appropriate that, contrary to the very name ‘self-managed’, trustees are required to
enlist some form of professional assistance in the development and oversight of their
investment strategy. This requirement could take a form similar to the existing audit
requirement for SMSFs, where an annual review and approval of the SMSF
investment strategy and decision-making would be required. Such a requirement
would increase the ongoing cost of managing a SMSF, although it would not be
expected to be prohibitively expensive, particularly given the size of the average
SMSF in terms of funds under management.

160
This leads to a further policy implication regarding the ideal size of a SMSF.
The findings in this study suggest that smaller SMSFs tend to be more likely to lack
evidence of appropriate investment decision-making. This lends itself to the existing
debate over the minimum size of a SMSF and whether there should be regulatory
guidance regarding the allowable minimum fund size. Although this debate is usually
framed in terms of the cost of running a SMSF, which can be significantly higher for
smaller SMSFs on a percentage of funds under management basis, the potential for
inappropriate investor behaviour by trustees of smaller funds may also need to be
taken into account. It may be that SMSF size (in terms of assets under management)
is an accurate proxy for trustee wealth, education and investing experience, which
leads back to the issues raised earlier in terms of improving SMSF trustee investing
knowledge or the requirement for professional assistance. In the absence of such
initiatives, it may be that a minimum SMSF size is required in order to reduce the
likelihood of the erosion of the retirement savings of those trustees responsible for
managing relatively smaller SMSFs.
The existence of a number of investor biases within the SMSF sample,
coupled with a general lack of appropriate investor decision-making or investment
strategies, suggests that greater emphasis should be placed on assisting SMSF
trustees with the investment related aspects of their role. This may include minimum
education requirements, professional assistance or stricter criteria for the
appointment of an SMSF trustee. It also suggests that the current regulatory focus on
compliance and administration related matters is too narrow and should be expanded
to include the investment related matters of SMSF management. The next section of
this chapter outlines a number of potential areas for future research, based on the
findings of this study.
8.4 Recommendations for Future Research
Given the general conclusion in this study, that SMSFs within the sample
tended to lack evidence of appropriate investment decision-making, the most
appropriate area for further research relating to SMSFs would be in the area of
investor behaviour. In particular, a more detailed analysis of the individual
investment transactions carried out by SMSF trustees would allow for confirmation

161
(or otherwise) of the existence of a number of behavioural traits, such as regret
aversion and loss avoidance. This would require information regarding the details of
each investment transaction carried by SMSF trustees, including the gain or loss on
any investment sale and the length of ownership. It would also be of interest to
compare the investment decision-making of SMSF trustees with those of other
Australian investors. This could be achieved through a comparison of the investment
transactions of private or institutional investors with those of SMSF trustees,
preferably across a period of time which allows for a meaningful comparison. This
type of study would provide evidence of the relative capability of SMSF trustees to
manage their retirement savings appropriately.
A further area of research would be to consider the investment decisions of
SMSF trustees in relation to trustee demographics. While this study did segment
SMSFs (and therefore each fund’s trustees) both by risk profile and funds under
management, awareness of the demographic nature of fund trustees would provide
insight into the background of the trustees of SMSFs and how this influences their
investment decisions. Information such as household income, postcodes, age,
education levels and occupation would allow for greater segmentation of fund
trustees and may provide deeper insights into the ‘ideal’ SMSF trustee and how this
relates to current policy settings regarding SMSF trustee education and experience.
Given the relative paucity of research concerning the SMSF sector, any additional
work which deepens our understanding of the sector and the behaviour of fund
trustees is likely to be of value.
8.5 Conclusion
This study set out to investigate whether or not SMSF trustees made
appropriate investment decisions over the period 2005 to 2011, a period which
included the volatile market and economic conditions associated with the 2008-09
global financial crisis. The evidence suggests that SMSF trustees did not make
appropriate investment decisions, given the set of financial and economic
circumstances prevailing at the time. The findings of this study suggests that
anecdotal evidence of out-performance by SMSFs when compared to alternative

162
superannuation arrangements, may be more a result of good fortune than good
planning.
Given the importance of the SMSF sector within the context of the Australian
retirement system, where more than a third of superannuation assets are managed
through SMSFs, these findings suggest that under current legislative and regulatory
arrangements, mismanagement of SMSF assets potentially poses a risk to member
retirement assets and perhaps the broader retirement system. While wholesale
changes to the SMSF sector are not necessarily required, a greater emphasis on
SMSF trustee education, training or expert assistance may reduce the likelihood of
SMSF trustees making inappropriate investment choices during the next period of
severe financial stress.

163
8.6 References
Anand, A, Puckett, A, Irvine, PJ & Venkataraman, K 2011, 'Market Crashes and
Institutional Trading', <http://ssrn.com/abstract=1524845>.
Anand, AI 2009, 'Rules v. Principles as Approaches to Financial Market Regulation',
Harvard International Law Journal, vol. 47, pp. 111-5.
Arrow, K 1965, 'The Theory of Risk Aversion', in Aspects of the Theory of Risk
Bearing, Yrjo Jahnssonin Saatio, Helsinki.
Atkinson, AB & Brandolini, A 2001, 'Promise and Pitfalls in the Use of "Secondary"
Data-Sets: Income Inequality in OECD Countries as a Case Study', Journal of
Economic Literature, vol. 39, no. 3, pp. 771-99.
Australian Taxation Office 2009, Self-Managed Super Fund Statistical Report,
Commonwealth of Australia, viewed 20 August 2011,
<http://www.ato.gov.au/superfunds/content.aspx?menuid=49150&doc=/content/002
14157.htm&page=6&H6>.
Australian Taxation Office 2012, Self-Managed Super Fund Statistical Report
Commonwealth of Australia, viewed 13 January 2013,
<http://www.ato.gov.au/superfunds/content.aspx?menuid=0&doc=/content/0031962
7.htm&page=8&H8>.
Australian Taxation Office 2013, Self-Managed Super Fund Statistical Report,
Commonwealth of Australia, viewed 8 March 2014, <http://www.ato.gov.au/About-
ATO/Research-and-statistics/In-detail/Super-statistics/SMSF/Self-managed-super-
fund-statistical-report---June-2013/>.
Australian Treasury 2001, 'Towards higher retirement incomes for Australians: a
history of the Australian retirement income system since Federation', Economic
Roundup, Centenary 2001, pp. 65-92.
Australian Treasury 2012, Stronger Super, The Treasury, viewed 3 April 2012,
<http://strongersuper.treasury.gov.au/content/Content.aspx?doc=reforms.htm>.
Barber, BM & Odean, T 2000, 'Trading Is Hazardous to Your Wealth: The Common
Stock Investment Performance of Individual Investors', The Journal of Finance, vol.
55, no. 2, pp. 773-806.
Barberis, N 2013, 'Thirty Years of Prospect Theory in Economics: A Review and
Assessment', Journal of Economic Perspectives, vol. 27, no. 1, pp. 173-96.
Barberis, N & Huang, M 2001, 'Mental Accounting, Loss Aversion, and Individual
Stock Returns', Journal of Finance, vol. 56, no. 4, pp. 1247-92.
Bateman, H 2003, 'Regulation of Australian Superannuation', Australian Economic
Review, vol. 36, no. 1, pp. 118-27.

164
Bateman, H & Ablett, J 2000, 'Compulsory Superannuation and Australian
Generational Accounts', Economic Analysis and Policy, vol. 30, no. 1, pp. 33-48.
Bateman, H, Louviere, JJ, Satchell, SE, Islam, T & Thorp, S 2010, 'Retirement
Investor Risk Tolerance in Tranquil and Crisis Periods: Experimental Survey
Evidence', <http://ssrn.com/abstract=1665948>.
Bell, DE 1982, 'Regret in Decision Making under Uncertainty', Operations Research,
vol. 30, no. 5, pp. 961.
Ben-David, I, Franzoni, FA & Moussawi, R 2011, ‘Hedge Fund Stock Trading in the
Financial Crisis of 2007-2009’, <http://ssrn.com/paper=1550240>.
Benartzi, S & Thaler, RH 2001, 'Naive Diversification Strategies in Defined
Contribution Saving Plans', American Economic Review, vol. 91, no. 1, pp. 79-98.
Benston, GJ, Bromwich, M & Wagenhofer, A 2006, 'Principles- versus rules-based
accounting standards: the FASB's standard setting strategy', Abacus, vol. 42, no. 2,
pp. 165-88.
Black, J 2008, 'Forms and paradoxes of principles-based regulation', Capital Markets
Law Journal, vol. 3, no. 4, pp. 425-57.
Black, J, Hopper, M & Band, C 2007, 'Making a success of Principles-based
regulation', Law and Financial Markets Review, pp. 191-206.
Bornholt, G 2013, 'The Failure of the Capital Asset Pricing Model (CAPM): An
Update and Discussion', Abacus, vol. 49, pp. 36-43.
Brown, P & Walter, T 2013, 'The CAPM: Theoretical Validity, Empirical
Intractability and Practical Applications', Abacus, vol. 49, pp. 44-50.
Carmichael, J & Plowman, K 1985, 'Income Provision in Old Age', Australian
Economic Review, no. 71, pp. 130.
Castillo, J 2009, 'The Rise and Rise of Self Managed Superannuation in Australia',
Journal of the Law Society of Tasmania, vol. 105, pp. 24-6.
Chiappori, P-A & Paiella, M 2011, 'Relative Risk Aversion is Constant: Evidence
from Panel Data', Journal of the European Economic Association, vol. 9, no. 6, pp.
1021-52.
Clare, R 2006, 'The Introduction of Choice of Superannuation Fund: Results to Date',
Australian Accounting Review, vol. 16, no. 40, pp. 7-13.
Clark-Murphy, M & Gerrans, P 2001, 'Choices and retirement savings: some
preliminary results on superannuation fund member decisions', Economic Papers: A
journal of applied economics and policy, vol. 20, no. 3, pp. 29-42.

165
---- 2004, 'Apparently contradictory superannuation choices among younger fund
members: a misunderstanding of risk?', Economic Papers: A journal of applied
economics and policy, vol. 23, no. 2, pp. 101-13.
Clark-Murphy, M, Kristofferson, I & Gerrans, P 2002, 'What makes superannuation
decisions difficult?', International Journal of Business Studies, vol. 10, no. 1, pp. 73.
Cooper Review – see – Review into the governance, efficiency, structure and
operation of Australia's superannuation system (2010).
Corporations Amendment (Future of Financial Advice) Act, 2012.
Cremers, KJM & Petajisto, A 2009, 'How Active Is Your Fund Manager? A New
Measure That Predicts Performance', Review of Financial Studies, vol. 22, no. 9, pp.
3329-65.
Curtis, G 2004, 'Modern Portfolio Theory and Behavioral Finance', Journal of
Wealth Management, vol. 7, no. 2, pp. 16-22.
Davies, GB & de Servigny, A 2012, 'Updating Modern Portfolio Theory for Investor
Behavior', AAII Journal, vol. 34, no. 4, pp. 21-5.
Danielsson, J 2003, ‘On the Feasibility of Risk Based Regulation’, London School of
Economics, <http://www.riskresearch.org/files/JD-02-9-13-1031919709-13.pdf>.
DellaVigna, S 2009, 'Psychology and Economics: Evidence from the Field', Journal
of Economic Literature, vol. 47, no. 2, pp. 315-72.
Deininger, K & Squire, L 1996, 'A New Data Set Measuring Income Inequality', The
World Bank Economic Review, vol. 10, no. 3, pp. 565-91.
Dempsey, M 2013, 'The Capital Asset Pricing Model (CAPM): The History of a
Failed Revolutionary Idea in Finance?', Abacus, vol. 49, pp. 7-23.
Drew, M & Stanford, J 2001, 'Asset Selection and Superannuation Fund
Performance: A Note for Trustees', Economic Papers, pp. 57-66.
Drew, M, Stanford, J & Taranenko, P 2001, 'Hot Hands and Superannuation Fund
Performance: A Second Note for Trustees', Economic Papers, pp. 18-25.
Drew, ME, Stanford, JD & Veeraraghavan, M 2002, 'Selecting Australian equity
superannuation funds: A retail investor's perspective', Journal of Financial Services,
vol. 7, no. 2, pp. 115-28.
Edwards, KD 1996, 'Prospect theory: A literature review', International Review of
Financial Analysis, vol. 5, no. 1, pp. 19-38.
Egan, M 2002, 'Grounded Theory Research and Theory Building', Advances in
Developing Human Resources, vol. 4, no. 3, pp. 277-95.

166
Elton, E & Gruber, M 1997, 'Modern Portfolio Theory, 1950 to date', Journal of
Banking and Finance, vol. 21, pp. 1743-59.
Evanson Asset Management 2011, A Comparison of Active and Passive Investment
Strategies, viewed 29 October 2011,
<http://www.evansonasset.com/index.cfm?Page=2>.
Fama, EF 1970, 'Efficient Capital Markets: A Review of theory and Empirical
Work', Journal of Finance, vol. 25, no. 2, pp. 383-417.
---- 1991, 'Efficient Capital Markets: II', Journal of Finance, vol. 46, no. 5, pp. 1575-
617.
Fouka, G & Mantzorou, M 2011, 'What are the Major Ethical Issues in Conducting
Research? Is there a Conflict between the Research Ethics and the Nature of
Nursing?', Health Science Journal, vol. 5, no. 1, pp. 3-14.
Freebairn, J 1998, 'Compulsory Superannuation and Labour Market Responses',
Australian Economic Papers, vol. 37, no. 1, pp. 58.
---- 2004, 'Some Long-Run Labour Market Effects of the Superannuation Guarantee',
Australian Economic Review, vol. 37, no. 2, pp. 191-7.
French, KR 2008, 'Presidential Address: The Cost of Active Investing', The Journal
of Finance, vol. 63, no. 4, pp. 1537-73.
Frieder, L 2004, 'Evidence on Behavioral Biases in Trading Activity', EFA 2004
Maastricht Meetings Paper No. 5085, European Finance Association.
Fry, T, Heaney, R & McKeown, W 2007, 'Will investors change their
superannuation fund given the choice?', Accounting & Finance, vol. 47, no. 2, pp.
267-83.
Gai, P & Vause, N 2005, 'Measuring investors' risk appetite', Bank of England
Quarterly Bulletin, vol. 45, no. 4.
Glaser, M & Weber, M 2007, 'Overconfidence and trading volume', The GENEVA
Risk and Insurance Review, vol. 32, no. 1, pp. 1-36.
Grauer, RR, Hakansson, NH & Shen, FC 1990, 'Industry rotation in the U.S. stock
market: 1934–1986 returns on passive, semi-passive, and active strategies', Journal
of Banking and Finance, vol. 14, no. 2-3, pp. 513-38.
National Superannuation Committee of Enquiry 1976 (Hancock Report), ‘Final
Report, Part One, A National Superannuation Scheme for Australia’, AGPS,
Canberra.
Hau, H & Lai, S 2012, 'The Role of Equity Funds in the Financial Crisis
Propagation', <http://ssrn.com/abstract=1742065>.
167
Ho, R, Kehoe, WJ & Whitten, LK 2010, 'How does a financial crisis affect 401(k)
participants’ investment behavior? An exploratory study', ASBBS E Journal, vol. 6,
no. 1, pp. 62-70.
Hoffmann, AOI, Post, T & Pennings, JM 2011, ‘Individual Investors and the
Financial Crisis: How Perceptions Change, Drive Behavior, and Impact
Performance’, <http://ssrn.com/paper=1816455>.
Hong, H, Kubik, JD & Stein, JC 2005, 'Thy Neighbor's Portfolio: Word-of-Mouth
Effects in the Holdings and Trades of Money Managers', Journal of Finance, vol. 60,
no. 6, pp. 2801-24.
Ibbotson, RG & Kaplan, PD 2000, 'Does Asset Allocation Policy Explain 40, 90, or
100 Percent of Performance?', Financial Analysts Journal, vol. 56, no. 1, pp. 26-33.
Kahneman, D & Tversky, A 1972, 'Subjective probability: A judgment of
representativeness', Cognitive Psychology, vol. 3, no. 3, pp. 430-54.
---- 1979, 'Prospect Theory: An Analysis of Decision under Risk', Econometrica, vol.
47, no. 2, pp. 263-91.
---- 1992, 'Advances in Prospect Theory: Cumulative Representation of Uncertainty',
Journal of Risk and Uncertainty, vol. 5, no. 4, pp. 297-323.
Kallberg, JG, Liu, CH & Wang, N 2012, ‘Individual Investors and the Financial
Crisis’, <http://ssrn.com/paper=1567943>.
Kihlstrom, RE, Romer, D & Williams, S 1981, 'Risk Aversion with Random Initial
Wealth', Econometrica, vol. 49, no. 4, pp. 911-20.
KPMG and the Australian Centre for Financial Studies 2011, Superannuation trends
and implications, Sydney.
Krejcie, RV & Morgan, DW 1970, 'Determining Sample Size for Research
Activities', Educational and Psychological Measurement, vol. 30, pp. 607-10.
Malkiel, BG 2003a, 'The Efficient Market Hypothesis and Its Critics', Journal of
Economic Perspectives, vol. 17, no. 1, pp. 59-82.
---- 2003b, 'Passive Investment Strategies and Efficient Markets', European
Financial Management, vol. 9, no. 1, pp. 1-10.
---- 2005, 'Reflections on the Efficient Market Hypothesis: 30 Years Later', Financial
Review, vol. 40, no. 1, pp. 1-9.
Markowitz, H 1952, 'Portfolio Selection', The Journal of Finance, vol. 7, no. 1, pp.
77-91.
Marshall, MN 1996, 'Sampling for qualitative research', Family Practice, vol. 13, no.
6, pp. 522-6.

168
Mitchell, OS, Mottola, GR, Utkus, SP & Yamaguchi, T 2007, ‘The Inattentive
Participant: Portfolio Trading Behavior in 401(k) Plans’, University of Michigan
Retirement Research Center, Working Paper 2006-05.
Morling, S & Subbaraman, R, Superannuation and saving, 1995, RBA.
Odean, T 1998, 'Are Investors Reluctant to Realize Their Losses?', Journal of
Finance, vol. 53, pp. 1775-98.
Olsen, RA 2008, 'Cognitive Dissonance: The Problem Facing Behavioral Finance',
Journal of Behavioral Finance, vol. 9, no. 1, pp. 1-4.
Peterson, D & Fensling, S 2011, 'Risk-based regulation: good practice and lessons
for the Victorian context', Victorian Competition and Efficiency Commission
Regulatory Conference, Melbourne, pp. 1-33.
Phillips, PJ 2007, 'Self managed superannuation funds: theory and practice', Journal
of Law and Financial Management, vol. 6, no. 1, pp. 8-22.
---- 2009, 'Are Larger Self-Managed Superannuation Funds Riskier?', Asian Journal
of Finance & Accounting, vol. 1, no. 1, pp. 54-75.
---- 2011a, 'Will Self-Managed Superannuation Fund Investors Survive?', Australian
Economic Review, vol. 44, no. 1, pp. 51-63.
---- 2011b, 'Sin stocks in self managed superannuation funds', Australasian
Accounting, Business and Finance Journal, vol. 5, no. 2, pp. 39-51.
Phillips, PJ, Cathcart, A & Teale, J 2007, 'The diversification and performance of
self managed superannuation funds', Australian Economic Review, vol. 40, no. 4, pp.
339-52.
Phillips, PJ, Baczynski, MP & Teale, J 2009a, 'Can Self Managed Superannuation
Fund trustees earn the equity risk premium?', Accounting Research Journal, vol. 22,
no. 1, pp. 27-45.
---- 2009b, 'Self managed superannuation funds and the bear market of 2007-2008',
Australasian Accounting, Business and Finance Journal, vol. 3, no. 1, pp. 38-56
Pratt, JW 1964, 'Risk Aversion in the Small and in the Large', Econometrica, vol. 32,
no. 1/2, pp. 122-36.
Resnik, BL 2010, 'Did Modern Portfolio Theory Fail Investors in the Credit Crisis?',
CPA Journal, vol. 80, no. 10, pp. 10-2.
Review into the governance, efficiency, structure and operation of Australia's
superannuation system 2010, Super System Review, (Jeremy Cooper, chairman),
AGPS, Canberra.

169
Roll, R & Ross, SA 1984, 'The Arbitrage Pricing Theory Approach to Strategic
Portfolio Planning', Financial Analysts Journal, vol. 40, pp. 14-26.
Ross, SA 1976, 'The arbitrage theory of capital asset pricing', Journal of Economic
Theory, vol. 13, no. 3, pp. 341-60.
SAS 9.2 2008, computer software, North Carolina, United States.
Saunders, M, Lewis, P & Thornhill, A 2009, Research methods for business students,
Fifth edn, Prentice Hall.
Sewell, M 2007, ‘Behavioural Finance’, University of Cambridge,
<http://www.behaviouralfinance.net/behavioural-finance.pdf>.
Shanken, JAY 1982, 'The Arbitrage Pricing Theory: Is it Testable?', Journal of
Finance, vol. 37, no. 5, pp. 1129-40.
Sharpe, WF 1964, 'Capital Asset Prices: A Theory of Market Equilibrium Under
Conditions of Risk', Journal of Finance, vol. 19, no. 3, pp. 425-42.
Shefrin, H & Statman, M 1985, 'The Disposition to Sell Winners Too Early and Ride
Losers Too Long: Theory and Evidence', Journal of Finance, vol. 40, no. 3, pp. 777-
90.
Spata, A 2003, 'Ethical Considerations in Research', in Research Methods: Science
and Diversity, John Wiley and Sons Inc.
Superannuation Guarantee Administration Act 1992 (Cwlth).
Superannuation Guarantee (Administration) Amendment Act 2012 (Cwlth).
Superannuation Legislation Amendment Act (No.3) 1999 (Cwlth).
Superannuation Industry (Supervision) Act 1993 (Cwlth).
Tang, N, Olivia, S, Mitchell, O & Utkus, S 2011, 'Trading Behavior of 401(k)
Pension Plan Participants in Times of Financial Turmoil', in R Maurer, O Mitchell &
M Warshawsk (eds), Retirement Security: Lessons from the Global Financial Crisis,
Oxford University Press.
Thaler, R 1980, 'Toward a positive theory of consumer choice', Journal of Economic
Behavior & Organization, vol. 1, no. 1, pp. 39-60.
Thaler, RH & Johnson, EJ 1990, 'Gambling with the House Money and Trying to
Break Even: The Effects of Prior Outcomes on Risky Choice', Management Science,
vol. 36, no. 6, pp. 643-60.
Tversky, A & Kahneman, D 1974, 'Judgment under Uncertainty: Heuristics and
Biases', Science, vol. 185, no. 4157, pp. 1124-31.

170
Valentine, T 2004, 'Regulation of DIY Superannuation Funds', Australian Economic
Review, vol. 37, no. 2, pp. 215-21.
Valentine, R 2010, 'The Theory of Efficient Capital Markets: A Review of
Literature', Feature Edition, vol. 2010, no. 3, pp. 116-34.
Vincent, S 2011, Is Portfolio Theory Harming Your Portfolio?,
<http://ssrn.com/paper=1840734>.
Williams, L & Abdi, H 2010, 'Fisher’s Least Significant Difference (LSD) test', in N
Salkind (ed.), Encyclopedia of Research Design, Sage, Thousand Oaks.
Yamaguchi, T 2006, 'Understanding Trading Behavior in 401(K) Plans', University
of Michigan Retirement Research Center, Working Paper. WP 2006-125.