IXM MANUFACTURING PROCESS POLYMERS STACK E1 … · program. Provide representative emissions data....
76
IASDATA\CHEMOURS\15418.002.004\E1 EMISSIONS TEST REPORT-LW 12/4/2018 IXM MANUFACTURING PROCESS POLYMERS STACK E1 EMISSIONS TEST REPORT TEST DATE: 17 MAY 2018 THE CHEMOURS COMPANY FAYETTEVILLE, NORTH CAROLINA Prepared for: THE CHEMOURS COMPANY 22828 NC Hwy 87 W Fayetteville, North Carolina 28306 Prepared by: WESTON SOLUTIONS, INC. 1400 Weston Way P.O. Box 2653 West Chester, Pennsylvania 19380 4 December 2018 W.O. No. 15418.002.004
Transcript of IXM MANUFACTURING PROCESS POLYMERS STACK E1 … · program. Provide representative emissions data....

IASDATA\CHEMOURS\15418.002.004\E1 EMISSIONS TEST REPORT-LW 12/4/2018
IXM
MANUFACTURING PROCESS POLYMERS STACK
E1 EMISSIONS TEST REPORT TEST DATE: 17 MAY 2018
THE CHEMOURS COMPANY
FAYETTEVILLE, NORTH CAROLINA
Prepared for:
THE CHEMOURS COMPANY 22828 NC Hwy 87 W
Fayetteville, North Carolina 28306
Prepared by:
WESTON SOLUTIONS, INC. 1400 Weston Way
P.O. Box 2653 West Chester, Pennsylvania 19380
4 December 2018
W.O. No. 15418.002.004

IASDATA\CHEMOURS\15418.002.004\E1 EMISSIONS TEST REPORT-LW 12/4/2018 i
TABLE OF CONTENTS
Section Page
1. INTRODUCTION..............................................................................................................1
1.1 FACILITY AND BACKGROUND INFORMATION ...........................................1
1.2 TEST OBJECTIVES ...............................................................................................1
1.3 TEST PROGRAM OVERVIEW .............................................................................1
2. SUMMARY OF TEST RESULTS ...................................................................................4
3. PROCESS DESCRIPTIONS ............................................................................................5
3.1 POLYMERS ............................................................................................................5
3.2 PROCESS OPERATIONS AND PARAMETERS .................................................5
4. DESCRIPTION OF TEST LOCATIONS .......................................................................6
4.1 POLYMERS STACK ..............................................................................................6
5. SAMPLING AND ANALYTICAL METHODS .............................................................8
5.1 STACK GAS SAMPLING PROCEDURES ...........................................................8
5.1.1 Pre-Test Determinations ...........................................................................8
5.2 STACK PARAMETERS .........................................................................................8
5.2.1 E1 ..............................................................................................................8 5.2.2 Flue Gas Velocity Measurements .............................................................9 5.2.3 Gas Composition .......................................................................................9
6. DETAILED TEST RESULTS AND DISCUSSION .....................................................12 APPENDIX A PROCESS OPERATIONS DATA APPENDIX B RAW AND REDUCED TEST DATA APPENDIX C LABORATORY ANALYTICAL REPORT APPENDIX D SAMPLE CALCULATIONS APPENDIX E EQUIPMENT CALIBRATION RECORDS APPENDIX F LIST OF PROJECT PARTICIPANTS

IASDATA\CHEMOURS\15418.002.004\E1 EMISSIONS TEST REPORT-LW 12/4/2018 ii
LIST OF FIGURES
Title Page
Figure 4-1 Polymers Stack Test Port and Traverse Point Location ............................................... 7
Figure 5-1 WESTON Sampling System ...................................................................................... 10

IASDATA\CHEMOURS\15418.002.004\E1 EMISSIONS TEST REPORT-LW 12/4/2018 iii
LIST OF TABLES
Title Page
Table 1-1 Sampling Plan for Polymers Stack ................................................................................. 3
Table 2-1 Summary of E1 Test Results ......................................................................................... 4
Table 6-1 Summary of E1 Test Data and Test Results Polymers Stack (17 May 2018) ............. 13

IASDATA\CHEMOURS\15418.002.004\E1 EMISSIONS TEST REPORT-LW 12/4/2018 1
1. INTRODUCTION
1.1 FACILITY AND BACKGROUND INFORMATION
The Chemours Fayetteville Works (Chemours) is located in Bladen County, North Carolina,
approximately ten miles south of the city of Fayetteville. Chemours operating areas on the site
include the Fluoromonomers, IXM and Polymer Processing Aid (PPA) manufacturing areas,
Wastewater Treatment, and Powerhouse.
Chemours contracted Weston Solutions, Inc. (WESTON) to perform E1 (CAS No. 3330-15-2)
emission testing on a single source at the facility IXM Resins Polymers stack (Polymers).
Testing was performed on 17 May 2018 and generally followed the procedures provided to the
North Carolina Department of Environmental Quality (NCDEQ). This report provides the results
from the emission test program.
1.2 TEST OBJECTIVES
The specific objectives for this test program were as follows:
Measure the emissions concentrations and mass emissions rates of EI from the Polymers Stack which is located in the IXM process.
Monitor and record process and emissions control data in conjunction with the test program.
Provide representative emissions data.
1.3 TEST PROGRAM OVERVIEW
During the emissions test program, the concentrations and mass emissions rates of E1 were
measured at the Polymers Stack.
Table 1-1 provides a summary of the test location and the parameters that were measured along
with the sampling/analytical procedures that were followed.

IASDATA\CHEMOURS\15418.002.004\E1 EMISSIONS TEST REPORT-LW 12/4/2018 2
Section 2 provides a summary of test results. A description of the process is provided in Section
3. Section 4 provides a description of the test location. The sampling and analytical procedures
are provided in Section 5. Detailed test results and discussion are provided in Section 6.
Process operating data, raw and reduced test data, laboratory analytical reports, sample
calculations, equipment calibration records, and a list of WESTON project participants are
provided in Appendices A through F, respectively.
Appendix C includes the summary reports for the laboratory analytical results. The full
laboratory data package is provided in electronic format and on CD with each hard copy.

IASDATA\CHEMOURS\15418.002.004\E1 EMISSIONS TEST REPORT-LW 12/4/2018 3
Table 1-1 Sampling Plan for Polymers Stack
Sampling Point & Location Polymers Stack Number of Tests: 3 Parameters To Be Tested: E1 Volumetric
Flow Rate and Gas Velocity
Carbon Dioxide
Oxygen Water Content
Sampling or Monitoring Method EPA Modified
Method 18 (M-18)
EPA M1, M2, M3A, and M4 in conjunction
with M-18 tests
EPA M3A Wet bulb dry bulb in
conjunction with M-18
tests Sample Extraction/ Analysis Method(s): GC/MS NA6 NA NA Sample Size > 0.4 ft3 NA NA NA NA Total Number of Samples Collected1 3 3 3 3 3 Reagent Blanks (Solvents, Resins)1 1 set 0 0 0 0 Field Blank Trains1 1 0 0 0 0 Proof Blanks1 1 set 0 0 0 0 Trip Blanks1,2 1 set 0 0 0 Lab Blanks 2 per fraction3 0 0 0 0 Laboratory or Batch Control Spike Samples (LCS)
2 per fraction3 0 0 0 0
Laboratory or Batch Control Spike Sample Duplicate (LCSD)
2 per fraction3 0 0 0 0
Media Blanks 2 sets4 0 0 0 0 Isotope Dilution Internal Standard Spikes Each sample 0 0 0 0 Total No. of Samples 75 3 3 3 3
Key: 1 Sample collected in field. 2 Trip blanks include one methanol sample per sample shipment. 3 Lab blank and LCS/LCSD includes one set per analytical fraction. 4 One set of media blank archived at laboratory at media preparation. 5 Actual number of samples collected in field. 6 Not applicable.

IASDATA\CHEMOURS\15418.002.004\E1 EMISSIONS TEST REPORT-LW 12/4/2018 4
2. SUMMARY OF TEST RESULTS
During the E1 test program on 17 May 2018, a total of three test runs were performed on the
Polymers Stack. Table 2-1 provides a summary of the E1 emission test results. Detailed test
results summaries are provided in Section 6.
Table 2-1
Summary of E1 Test Results
Source Run No. Emission Rates
lb/hr g/sec
Polymers Stack (5/17/18)
1 ≤ 3.69E-5 ≤ 4.65E-6 2 6.80E-5 8.56E-6 3 7.96E-5 1.00E-5
Average ≤ 6.15E-5 ≤ 7.75E-6

IASDATA\CHEMOURS\15418.002.004\E1 EMISSIONS TEST REPORT-LW 12/4/2018 5
3. PROCESS DESCRIPTIONS
The IXM area is included in the scope of this test program.
3.1 POLYMERS
The polymers area consists of a polymerization process, Finishing and Recycle. There are two
types of polymer produced, using products made in the Fluoromonomers and IXM Precursors
areas: SR polymer and CR polymer. Both SR and CR polymerization processes take place in a
solvent. The reaction is initiated and sustained by continuous addition of Dimer Peroxide
initiator. There is a Recycle Still that takes solution and removes any impurities, allowing the
solution to be used again. The finishing area takes the polymer produced during polymerization
and transforms it into pellets.
3.2 PROCESS OPERATIONS AND PARAMETERS
Testing during the following operations provided “normal” conditions while running products
and operations that were expected to result in the most conservative (i.e., highest) emissions for
the target compound.
Source Operation/Product Batch or Continuous Polymer Stack
SR Polymer Continuous – Polymerization Batch – Recycle Still Batch – Line Four extrusion
During the test program, the operations parameters were monitored by Chemours and are
included in Appendix A.

IASDATA\CHEMOURS\15418.002.004\E1 EMISSIONS TEST REPORT-LW 12/4/2018 6
4. DESCRIPTION OF TEST LOCATIONS
4.1 POLYMERS STACK
The Polymers stack is a 30 inch ID fiberglass stack located near the roof edge. Vent lines enter
the stack at various points and a significant straight run of vertical stack without flow
disturbances is not available. Two sample ports are installed in the stack 30 inches down from
the stack exit and 58 inches up from the last vent line entry point. Per EPA Method 1, twenty-
four traverse points, 12 per port, were used for volumetric flow rate measurements. Figure 4-2
provides a schematic of the test port and traverse point locations. All dimensions were verified
on site prior to sampling.

30 "
•••• 30 "••
••~• •• •••• •• O••••
~ 58 ~~
PROCESSVENT
PROCESSVENT -~
DRAWING NOT TO SCALE
FIGURE 4-1POLYMERS STACK TEST PORT
AND TRAVERSE POINT LOCATIONS
TRAVERSEPOINTNUMBER
DISTANCE FROMINSIDE NEARWALL (INCHES)
1 12 23 3 1/24 5 1/45 7 1/26 10 5/87 19 3/88 22 1 /29 24 3/410 26 1/211 2812 29
7 IASDATA\CHEMOURS115418.002.004\FIGURE 4-1 POLYMERS STACK

IASDATA\CHEMOURS\15418.002.004\E1 EMISSIONS TEST REPORT-LW 12/4/2018 8
5. SAMPLING AND ANALYTICAL METHODS
5.1 STACK GAS SAMPLING PROCEDURES
The purpose of this section is to describe the stack gas emissions sampling trains and to provide
details of the stack sampling and analytical procedures utilized during the emissions test
program.
5.1.1 Pre-Test Determinations
Preliminary test data were obtained at each test location. Stack geometry measurements were
measured and recorded, and traverse point distances verified. A preliminary velocity traverse
was performed utilizing a calibrated "S" type pitot tube and an inclined manometer to determine
velocity profiles. Flue gas temperatures were observed with a calibrated direct readout panel
meter equipped with a chromel-alumel thermocouple. Preliminary water vapor content was
estimated by wet bulb/dry bulb temperature measurements.
A check for the presence or absence of cyclonic flow was previously conducted at the test
location. The cyclonic flow checks were negative (< 20°) verifying that the source was
acceptable for testing.
Calibration of pitot tubes, metering systems, and temperature measurement devices was
performed as specified in Section 5 of EPA Method 5 test procedures.
5.2 STACK PARAMETERS
5.2.1 E1
For all E1 tests, the sample train was a modified EPA Method 18 train using midget impingers.
During the tests on 17 May 2018 the sample run included six impingers. The first impinger was
of a modified short stem design. Impingers 1 through 6 each contained 20 milliliters of methanol.
The midget impingers were maintained in an ice bath. Each test was 60 minutes in duration
collecting at a rate of approximately 0.5 liters per minute.
Each impinger was recovered and included a methanol rinse of each impinger and connector.
The impinger contents and rinses were collected separately.

IASDATA\CHEMOURS\15418.002.004\E1 EMISSIONS TEST REPORT-LW 12/4/2018 9
Each sample was analyzed by EPA SW-846 Method 8260B procedures by Gas Chromatography
(GC) Mass Spectrometry (MS). All results were non detect (ND) for all samples. TestAmerica
reran the samples in the Selective Ion Monitoring (SIM) mode which provides a significantly
lower detection limit. These results are provided in Appendix C.
5.2.2 Flue Gas Velocity Measurements
The stack gas velocity was measured at the stack locations according to the procedures outlined
in EPA Methods 1 and 2. A S-type pitot and inclined manometer, or electronic pressure
transducer, were used to measure the velocity pressure at each traverse point. The traverse points
are selected in accordance to EPA Reference Method 1 on the basis of stack dimensions,
geometry and upstream and downstream disturbances. The traverse points for the stack locations
are presented on Figure 4-1.
One velocity traverse was conducted prior to and one conducted following each 60-minute test
run. The average of each velocity traverse was used to calculate the volumetric flow rate for
calculating mass rates for that rest run.
Stack gas moisture content was calculated by wet bulb/dry bulb measurement in conjunction
with each velocity traverse.
5.2.3 Gas Composition
The WESTON mobile laboratory equipped with instrumental analyzers was used to measure
carbon dioxide (CO2) and oxygen (O2) concentrations. A diagram of the WESTON sampling
system is presented in Figure 5-1.

0
STACK WALLSAMPLE VENT
CONDITIONING O
HEATED FILTER SYSTEM
HOLDER a~ ~i -iii
S MPLE HEATED SAMPLE LINE ~ O CO2 ~
MOISTURE ~PROBE ~ ~ - - iREMOVAL SAMPLE ~
PUMP O i02 i
~~ - -i
iiCALIBRATION BIAS LINE O i ANALOG
~a - -~ SIGNAL~ LINE
~~ - -~i
i
~~ -
~_ ~
i
GAS ~iANALYZERS i
iii
CALIBRATION e - - _ - iGASES ~_ ~
~= ON /OFF VALVE COMPUTER FOR DATAACQUISITION AND ACQUISTION
REDUCTION INTERFACE
FIGURE 5-1WESTON SAMPLING SYSTEM
IASDATAICHEMOURS115418.002.0041FIGURE 5-1 WESTON SAMPL~JG SYSTEM

IASDATA\CHEMOURS\15418.002.004\E1 EMISSIONS TEST REPORT-LW 12/4/2018 11
The sample was collected through the probe and a sample conditioner. At the end of the line, a
tee permitted the introduction of calibration gas. The output from the sampling system was
recorded electronically, and one-minute averages were recorded and displayed on a data logger.
Each analyzer was set up and calibrated internally by introduction of calibration gas standards
directly to the analyzer from a calibration manifold. The calibration manifold is designed with an
atmospheric vent to release excess calibration gas and maintains the calibration at ambient
pressure. The direct calibration sequence consisted of alternate injections of zero and mid-range
gases with appropriate adjustments until the desired responses were obtained. The high range
standards were then introduced in sequence without further adjustment.
The sample line integrity was verified by performing a bias test before and after each test period.
The sampling system bias test consisted of introducing the zero gas and one up range calibration
standard in excess to the valve at the probe end when the system was sampling normally. The
excess calibration gas flowed out through the probe to maintain ambient sampling system
pressure. Calibration gas supply was regulated to maintain constant sampling rate and pressure.
Instrument bias check response was compared to internal calibration responses to insure sample
line integrity and to calculate a bias correction factor after each run using the ratio of the
measured concentration of the bias gas certified by the calibration gas supplier.
The oxygen and carbon dioxide content of each stack gas was measured according to EPA
Method 3A procedures which incorporate the latest updates of EPA Method 7E. A Servomex
Model 4900 analyzer (or equivalent) was used to measure oxygen content. A Servomex Model
4900 analyzer (or equivalent) was used to measure carbon dioxide content of the stack gas. Both
analyzers were calibrated with EPA Protocol gases prior to the start of the test program and
performance was verified by sample bias checks before and after each test run.

IASDATA\CHEMOURS\15418.002.004\E1 EMISSIONS TEST REPORT-LW 12/4/2018 12
6. DETAILED TEST RESULTS AND DISCUSSION
Table 6-1 provides detailed test data and test results for the Polymers Stack.
The Method 3A sampling indicated that the O2 and CO2 concentrations were at ambient air
levels (20.9% O2, 0% CO2), therefore, 20.9% O2 and 0% CO2 values were used in all
calculations.
As discussed in Section 5.2.1, the samples were originally analyzed by standard GC/MS
procedures and all of the results were ND. TestAmerica reran the samples using the SIM mode.
As footnoted on Table 6-1, the first five impinger samples for run 1 were still ND and ½ the DL
was used in the calculation. All of the other sample fractions for all runs were detected above the
DL. Note that the SIM analysis was performed beyond the 14 day holding time; however, all
samples were maintained under chain of custody and were kept cool (≤ 4°C).

Table 6-1Chemours -Fayetteville, NC
Summary of E1 Test Data and Test ResultsPolymer Stack (May 17th, 2018)
TEST DATATest run number I 2 3Location Polymers Polymers PolymersTest date 5/17/2018 5117/18 5/17/18Test time period 1043-1143 1204-1304 1352-1452
SAMPLING DATADuration, minutes 60 60 60Average dry gas meter press. in. H2O 0.98 1.00 0.98Average dry gas meter temp. deg. F 74.7 77.8 77.9Average absolute meter temp. deg. R 534.7 537.8 537.9Sample vol. at meter cond., dcl 30.000 30.005 30.000Meter box calibration, Y 1.0150 1.0150 1.0150Barometric pressure, in. Hg 29.88 29.88 ?9.89
Sample volume, dscl ~~~ 30.090 29.924 29.918
Sample volume, dscf~~~ 1.063 1.057 1.056
STACK GAS COMPOSITIONTemperature, deg F 71.6 74.4 0.4Moisture, % 2.54 2.82 2.77COZ Concentration, % 0.0 0.0 0.0OZ Concentration, % 20.9 20.9 20.9Molecular Weight, lb/lb-mole 28.8 28.8 28.8
VOLUMETRIC FLOW RATEStack duct cross sectional area, sq.ft. 4.910 4.910 4.910Avg. gas stream volumetric flow, wacf/min. 10,919 10,937 10,964
Avg. gas stream volumetric flow, dscf/min. ~~~ 10,546 10,477 10,479
El LABORATORY REPORT DATAImpinger-1, ug. 5 0.00530 0.00864 0.01100Impinger-2, ug. 5 0.00476 0.01000 0.01260Impinger-3, ug. 5 0.00382 0.01000 0.00915Impinges-4, ug. 5 0.00354 0.00708 0.00824Impinger-S, ug. 5 0.00327 0.00812 0.00714Impinger-6, ug. 0.00744 0.00798 0.00988Total catch, ug. 5 0.02813 0.05182 0.05801
Ei EMISSIONS RESULTS~Z~El, ug/sample < 0.02813 0.05182 0.05801Concentration, lb/dscf 5 5.84E-I1 1.08E-10 1.21E-10Emission Rate, lb/hr 5 3.69E-OS 6.80E-OS 7.96E-OSEmission Rate, g/sec 5 4.65E-06 8.56E-06 1.00E-OS
(I) Standard conditions = 68 deg. F. (20 deg. C.) and 29.92 inches Hg (?60mm Hg).(2) The reported laboratory values were non-detect for nn I impingers 1 through 5. The values entered for impingers I through 5represent 1/2 of the detection limit value and are noted as less than or equal to (5).
13
APPENDIX APROCESS OPERATIONS DATA
IASDATA\CHEMOURS\15418.002.0041Et EMISSIONS TEST REPORT-LW 8/10/2018
14

IXM Polymers
Date 5/17/2018
Time 900 1600 1100 1200
Stack Testing 1043 -1143 1204 -1304
Recycle Still
Polymerization Standard SR Polymer Production
Line 4 Extrusion
1300 1400 1500
1352-1452
IXM Polymers takes the following raw materials to produce the Suifonic Resin (polymer) —that then goes to the IXM Products area to make film and membrane:
PSEPVE
TFE/CO2
E2Dimer Peroxide
15

APPENDIX BRAW AND REDUCED TEST DATA
IASDATAICHEMOURS\15418.002.004\E1 EMISSIONS TEST REPORT-LW 8/10/2018
16

FIELD DATA SHEET Modified Method 18 - E1Polymer Stack
Client GHEMO[3RS Run No. ~1" ~~ Meter Box ID
~W.O.# 15418~02.003_000II Test Method M18 Meter Box Y
Project ID CHEMOURS Date ~ ~ Probe ID/Length
Source POLYMER Baro. Press (in Hg) Probe Material
Samp. Type. Stack Ambient Temp (°F) '-''
Samp. Location R[JN2 Operator
Sample Time
Comments:
'~ 5̀ 1 Leak Checks
Initial ~ . ~0 ~ Z)
~, ~ _ ~~ TRAIN a.l~ ~ liters/min (m ~ in Hg Vac
Final + ~' (~
TRAIN 7( ~~~ 1 liters/min (a~ ~~ in Hg Vac
Post Test Purge [~I~IO
5 c~ •sue ..~~ ~ ~ 2.~o c~,5 3 '~~ s t'~ , ~ ~ C'jZo S~ ~J D ~ 1 ~ c~ 22s 030 ~ S~ t ~ 1 l7
35 ~ ~ ~ ~ ~
45 J., , Q ~ ~j
so , S ~ Z ~ ~ Dss ~60 M ~
nrK Lc~iu iu~ vuiwi~c tiV~ lm rviax temp M3X V8C n~ax temp
17

FIELD DATA SHEET Modified Method 18 - E1Polymer Stack
Client CHEMpURS' Run No. a ~ Me[er Box ID
W.O.# 15418:002:003.0001 Test Method 8 Meter Box YProject ID CHEMOURS Date Probe ID/Length
Source POLYMER Baro. Press (in Hg) Probe Material
Samp. Type. Stack Ambient Temp (°F) ~+
Samp. Lceation RtJN 3' Operator
Sample Time ,~ 'b'V
Comments:Final
TRAIN _ D6 f liters/min Ccil rU in Hg Vac
Post Test Purge O
o ~ L. . ~ ~l a C.~
s b.~" f~ ~S 7 ~ Oio ~ ~ ~~ ~ 5 , -0 7 ~ ~ O1s ~ ~ I 0 —I~~ 7'7 '~t7 (~O So20 ~ 5~ (~~ / (~25 / O
30 ~ J ~ ~ 7' ~i~
35 ? ~'~ ~ ,7
ao . l'V ~ d (. O45
50 _ ~ ~i
55 / ~ ~JQ
60 ~ ~
~•7 ̂~ Leak Checks
Initial ~~ ~1 ~ ~ ~ L
~7-L/~}S'J TRAIN ~ ~~ liters/min (a~(~ 2~in Hg Vac
_ ' - ~+y ,..K ~./..~+~ ~~aJ~~~~~a I r,vg ~m ~ I ivi~emp I n~ax vac I n~ax temp
,,
18

FIELD DATA SHEET Modified Method 18 - E1Polymer Stack
Client CH~IviQURS Run No. rY ✓ Meter Box ID
W.O.# ' 15418.OD2003,0001 TestMethad MIS Meter Box Y
Project ID CHEMOURS Date .s ~D Probe ID/L,ength
Source POLYMER Bazo. Press (in Hg) Probe Material
5amp. Type. Stack Ambient Temp (~F)
Samp. Location RIJN 7 ,Operator
Sample Time l~
Comments:Final ~
TRAIN ~ pp ~ liters/min CD_ ~i Vac
Post Test Purge S
~-~~~ ~ ~ ~~~~7 ~ ~~~-
~~~~ t~~~Ti~ 1 ~1~ ~~i ~~~ ~►~~i'~~~~
-~_~~~ ~~~ii~7 f ~ -_~-
-~~I~iT~t'll~~ • '~ ~~~ ~ -_-_~- _- -_--_- -_ -_---- -_ --
--_- -- -_---- -- -_--_- -- -_
.~,,,r .p~: P Leak Checks
~ Initial i'Sj..~~ ~ ~ ~ l7~I'J ~~~ TRAIN ~}tt~ ~ liters/min @ ~ l7 in H9 Vac
V .~ I JH~~' J I ~j~~,C~.~~ I ~g~ ~ I ~e~1P I ~ ~ I ~oemp
F~~
19

Determination of Stack Gas Velocity -Method 2Client Operator ~w Pitot Coeff (Cp)~
Location/Plant ~r~V~~[2Ui ~~~ ; NL Date ~~ Stack Area,ft2(/ls)~
Source ~~ iyltr ~Fi,~.(~ W.O. Number ~s~~$, ap`Z.m y Pkot TubelThertno ID ~~~ y~
w~~ ~ ~b~~ ~ ~~
~2 ~ 7 3{~3 ~ 7 ~
•:
-_
•::
~r ~ "' ~ ~ ••
r ~ ~ ~~; ; ~ ~ .,I ~ I v
~: :
•'. I~~I~~I~~I~~~~i~.~vi~~~~c-~ir~r~ir~ rr~~~~i~oi~~z~~~ir~r~~ir~r~~~~~~~~rr~~~~~■~~«~~~~I~Dlrir~i~iii~I~'~a~I Y i ~~~~I~Ei~I~'.'j'iirf~71 ~,,i~l~lr~'f►7i►Z~~~I~DI~i~~~i~.71rr~'L~~I~'`► iZyi~~I~01` . ~il~71~i~~~iZ'71~~~~i~~~I~~I«'i'~il~I~17i~11~~r7iT~~~I~~I~'L'~~il:~Ifi~L'iiL~'il~~ix~~~I~ml~~.~~'lia~l~"L~~~~~It~~i'1~7~i~~~I~~Irrlr~l~~~~ir~~si ~ c ■r~i~~~i . c~rz~~~I~~~I~~~l~ll~~~~l~~~~~~I~~'il~~i~l~+ ''k~ir~~l i • Cl.~~~I~~iil ~ ~ f~l w ~ irZ'~I~'~ri~~~I~t~I~~~I~~~Q~l~~~~~~i~oi~~■r~■i~r~~i~~r~~~~~~~~~ r ~■~~~~~~~~~~~~~~~~~~~ir~Ji~~~r~~
- - - --
~ ~~ ~~ ~
MWd = (0.32 ~ oZ)+ (o.aa • coZ)+(o.za ~ (goo-(coz+o2)))NIWs = (MWd' (1- (RIMS/100))+ (18' (BIAIS/100)
Tsa = Ts+ 460Ps = Pb+ (Pstetic113.B~
Vs=85.49'Cp"svg DQReP ` Tae/ Ps•MWsQs(act)= 80' Vs' AsQs(std~ = 17.64' (1— (BVVS/ 100~~"(Ps/Tsa~`Qs(act~
Comments
method2.xls
where:MWd =Dry molecular weight source gas, Ib/Ib-mole.MWs =Wet molecular weight source gas, Ib/Ib-mole.Tsa =Source Temperature, absolute(oR)Ps =Absolute stack static pressure, Inches Hg.Vs =Average gas stream velocity, ff/sec.Qs(act) =Volumetric flow rate of wet stack gas at actual, wecf/minQs(std) =Volumetric flow rate of dry stack gas at standard
-~~~;SC3l..L;T f~h:6
~/ 20

~~.~ ~~6~y~~~
Determination of Stack Gas Velocity -Method 2CBent an..~.~ OperaWr ~'w L ~~ Pitot Coe1f ~Cp) 1~a eQ
LocaUoNP1aM ~~~y~.1~. i1 ~ Date [Z Ne Sfack Area, il~ (Asii--l_` LJ
Source d~ ~ W.O. Number ~►~~1 Pitot TubeRhwmo ID___
' ~~
~~~■~~i~■~~i
~_-1_
i i~~~u~ii~ . ,I' I,
icy... ....I~
,~~ . I .. , . ,
~ ` - -•
'I~~I •~~I~~I~~~ ~
__I~~I~~~~I~~I-___I~~I~~I-~I~-__I_~ItMJ~~I-_~-_~_I-~I~~~I-~I-_~~ia~i~~i~~~i~~~~~i~oi~mi~~~~~~~~~~~rr~~~~~~~■~~!~-~~Ie~~I~E~~I~~l~~~~I~`~I~~~~I~~I~~~~I~~I~i~i~~l~~~_I~~~I •C~I~~I~~~~1~~7I~~~I~~I~~~si~~i~~~i~~i~~~~i~~~~~mi~~i~~~~—i~~i~~~~i~~i~~~~~is~i~~i—~i~~~~i~~i~a~i~~i~~~~~i~oi~s~a~i~~i~~s~i~~ir~~~~i~~~i■~~~~~ie~~~~i~~i~~
~~~~i ~ ■~~~i~~~ie~~
MWd =(0.32*p2~+(0.44 *CO2~+(0.28 *100-(CO2+0~~~MWs = (MVVd* (1- (BViIS/ 100~~~+(18 * (BVVS/100~~Tsa = Ts+460Ps = Pb+ (PstaticJ 13.6)Vs = 85.49 * Cp* avg DeltaP ̀ Tsa/ Ps" M~Qs~z~c~~= 6th ̀ Vs• AsQs(std~ =17.64 "' (1- (BWS/100))"(PslTsa)* Qs(act)comrneMs
7
where:MWd =Dry mdecular wdght source pas, IWib-mole.MWs = UVet moleculaY weigh source gas, Iblib-mole.Tea =Source Temperatwe, absolute(oR)Ps =Absolute stack static pressure, inches Hg.Vs =Average gas stream veloaly, fUsec.~s(act) = Vdumetric flow rate of v~rei stack gas at actual,Qs(sld) = Vdumetric flow rate of dry stack gas ffi standardcondHlons, decf/min
:~rr̀.
~~ 21

Determination of Stack Gas Velocity -Method 2Client Chemours Operator MW Pitot Coeff (Cp) 0.84
Location/Plant Fayetteville NC Date 17-May-18 Stack Area, ftZ (As) 4.910
Source Polymer W.O. Number Pitot Tube/Thermo ID
Run Number
Time
Barometric Press, in Hg (Pb)
Static Press, in HZO (Pstatic)
Source Moisture, % (BWS)
Oy,
CO2, °~
Cyclonic FlowDetermination
AngieDelta P at yeilding zeroO° Delta P
Traverse Location
A 1
2
3
4
5
6
7
8
9
10
11
12
B 1
2
3
4
5
6
7
8
9
10
11
12
~ ( Avg Delta P &Temp
Avg SQRT Delta P
Average gas stream velocity, ft/sec.
Vol. flow rate @actual conditions, wacf/minVol. flow rate at standard conditions, dscf/min
Average Vol. flow rate at standard conditions, dscf/min
Comments
Pre 1 Post 1
1018-1028 1151-1201
29.88 29.88
-0.22 -0.22
2.38 2.71
20.9 20.9
0.0 0.0
Zero Check good ?
Y/ NZero Check good ?
Y/ NZero Check good ?
Y! N
Delta P
Source
Temp, F°Ts Deita P
SourceTemp, F°
Ts Delta P
Source
Temp, F°Ts
0.33 69 0.27 74
0.34 69 0.35 74
0.46 70 0.46 74
0.50 70 0.44 74
0.48 70 0.45 74
0.48 70 0.47 74
0.44 70 0.47 74
0.48 70 0.49 74
0.50 70 0.49 74
0.48 70 0.50 74
0.44 70 0.44 74
0.39 70 0.37 74
0.34 69 0.34 74
0.33 69 0.34 73
0.39 70 0.39 74
0.43 70 0.43 74
0.40 69 0.40 74
0.46 70 0.46 74
0.45 69 0.46 74
0.48 68 0.50 73
0.49 68 0.50 73
0.48 69 0.47 73
0.41 69 0.42 73
0.39 68 0.34 73
0.432083 69.42 0.42708 73.75
0.65592 0.65166
37.10 37.03
10929 1090910677 10475
1 546
polymer stack 051718.x1s Copyright Roy F Weston Inc October 1998 22

Determination of Stack Gas Velocity -Method 2Client Chemours
Location/Plant Fayetteville NC
Source Polymer
Ave
Operator JM
Date 17-May-18
W.O. Number
Pitot Coeff (Cp) 0.84
Stack Area, ftZ (As) 4.910
Pitot Tubeffhermo ID
Run Number
Time
Barometric Press, in Hg (Pb)
Static Press, in HZO (Pstatic)
Source Moisture, ~o (BWS)
OZ, %
COZ, %
Pre 2 Post 2
1151-1201 1313-1326
29.88 29.88
-0.22 -0.20
2.71 2.93
20.9 20.9
0.0 0.0
Cyclonic FIoW
Determination Traverse LocationZero Check good ?
Y/ NZero Check good ?
Y/ NZero Check good ?
Y/ N
Delta P atO°
Angleyeilding zeroDelta P Port Point Delta P
Source
Temp, F°Ts Delta P
Source
Temp, F°Ts Delta P
Source
Temp, F°Ts
A 1 0.27 74 0.28 75
2 0.35 74 0.33 75
3 0.46 74 0.41 75
4 0.44 74 0.47 75
5 0.45 74 0.50 75
6 0.47 74 0.48 75
7 0.47 74 0.47 75
8 0.49 74 0.48 75
9 0.49 74 0.52 75
10 0.50 74 0.50 75
11 0.44 74 0.44 75
12 0.37 74 0.40 75
B 1 0.34 74 0.32 76
2 0.34 73 0.38 75
3 0.39 74 0.42 75
4 0.43 74 0.40 75
5 0.40 74 0.42 75
6 0.46 74 0.42 75
7 0.46 74 0.47 75
8 0.50 73 0.51 75
9 0.50 73 0.49 75
10 0.47 73 0.46 75
11 0.42 73 0.39 75
12 0.34 73 0.36 75
Avg Delta P &Temp
Avg SQRT Delta P
Average gas stream velocity, ft/sec.
Vol. flow rate @actual conditions, wacflminVol. flow rate at standard conditions, dscf/min
rage Vol. flow rate at standard conditions, dscf/min
0.42708 73.75 0.43000 75.04
0.65166 0.65388
37.03 37.22
10909 1096410475 10479
10477
Comments
polymer stack 051718.x1s Copyright Roy F Weston Inc October 1998 23

Determination of Stack Gas Velocity -Method 2Client Chemours
Location/Plant Fayetteville NC
Source Polymer
Ave
Operator JM
Date 17-May-18
W.O. Number
Pitot Coeff (Cp) 0.84
Stack Area,ft~(As) 4.910
Pitot TubefThermo ID
Run Number
Time
Barometric Press, in Hg (Pb)
Static Press, in HZO (Pstatic)
Source Moisture, °k (BWS)
02, %
COZ, °~
Pre 3 Post 3
14313-1326 1500-1515
29.88 29.89
-0.20 -0.22
2.93 2.62
20.9 20.9
0.0 0.0
Cyclonic Flow
Determination Traverse LocationZero Check good ?
Y! NZero Check good ?
Y/ NZero Check good ?
Y/ N
Delta P at
O°
Angieyeilding zeroDelta P Port Point Delta P
SourceTemp, F°
Ts Delta P
SourceTemp, F°
Ts Delta P
Source
Temp, F°Ts
A 1 0.28 75.0 0.34 72
2 0.33 75.0 0.34 72
3 0.41 75.0 0.43 72
4 0.47 75.0 0.45 72
5 0.50 75.0 0.52 72
6 0.48 75.0 0.46 72
7 0.47 75.0 0.52 72
8 0.48 75.0 0.45 72
9 0.52 75.0 0.50 72
10 0.50 75.0 0.49 72
11 0.44 75.0 0.46 72
12 0.40 75.0 0.41 72
B 1 0.32 76.0 0.33 72
2 0.38 75.0 0.34 74
3 0.42 75.0 0.40 74
4 0.40 75.0 0.43 74
5 0.42 75.0 0.41 74
6 0.42 75.0 0.44 74
7 0.47 75.0 0.51 74
8 0.51 75.0 0.51 74
9 0.49 75.0 0.49 74
10 0.46 75.0 0.46 74
11 0.39 75.0 0.41 74
12 0.36 75.0 0.39 74
Avg Delta P 8~ Temp
Avg SQRT Delta P
Average gas stream velocity, ft/sec.
Vol. flow rate @actual conditions, wacf/minVol. flow rate at standard conditions, dscf/min
rage Vol. flow rate at standard conditions, dscf/min
0.43000 75.0 0.43708 72.92
0.65388 0.65960
37.22 37.44
10964 1103010479 10621
1Q550
Comments
polymer stack 051718.xis Copyright Roy F Weston Inc October 1998 24

Determination of Moisture Content in Stack Gases -Method 4Wet Bulb /Dry Bulb
Client Chemours Source Polymer Operator
Location/Plant Fayetteville, NC W.O.
Run Number
Locatior
Barometric Press, in. Hg (Pb;
Static Press, in. HZO (Pstatic;
Dry Bulb Temperture,°F (Td;
Wet Bulb Temperture,°F (Tw
Delta T = Td-Tw, (~ TVapor Press H2O at Tw (Vp), from table
Absolute stack static pressure, inches Hg (PsJPartial Press of HZO (PP)
Moisture, % (BWSJ
Date
MW
5/17/2018
1 2 3 4
Polymer Polymer Polymer Polymer
29.88 29.88 29.88 29.88
-0.22 -0.22 -0.22 -0.20
69.4 73.8 75.0 72.9
69.0 73.0 75.0 72.0
0.4 0.8 0 0.94.7144 0.8183 0.875 0.7912
29.864 29.864 29.864 29.8650.7101 Q.8097 0.8750 0.7815
2.38% 2.71% 2.93% 2.62%
Vapor Pressure of Water
°F "H9 °F "H9 °F °H9 F "H9 F "H9 °F "H9.041 47 4 0 1.0 .8 179 14.
4 0.0463 48 0.3364 81 1.066 2.911 7.024 180 15296 0.0517 49 0.3493 82 1.102 2.995 7202 181 15.638 0.0571 50 0.3626 83 1.138 3.081 7.384 182 15.9810 0.0631 51 0.3764 84 1.175 3.169 7.569 183 16.3412 0.0696 52 0.3906 85 1.273 3.259 7.759 t84 16.714 0.0768 53 0.4052 86 1253 3.351 7.952 185 17.0716 0.0846 54 0.4203 87 1293 3.446 8.15 786 17.4418 0.0932 55 0.4359 88 1.335 3.543 8.351 187 17.8220 0.1205 56 0.452 89 1.378 3.642 8.557 188 18.2122 0.1127 57 0.4686 90 1.422 3.744 8.767 189 18.6124 0.1248 58 0.4858 91 1.467 3.848 8.981 190 19.0126 0.137 59 0.5035 92 1.513 3.954 9.2 1gt 19.4227 0.1429 60 0.5218 93 1.561 4.063 9.424 192 19.8428 0.1502 61 0.5407 94 1.61 4.174 9.652 193 20.2729 0.7567 62 0.5601 95 1.66 4.289 9.885 194 2~.730 0.1647 63 0.5802 96 1.772 4.406 10.12 195 21.1431 0.1716 64 0.6009 97 1.765 4.525 10.3fi 196 21.5932 0.1803 65 0.6222 98 1.819 4.647 10.61 197 22.0533 0.1878 66 0.6442 99 1.875 4.772 10.86 198 22.5234 0.1955 67 0.6669 100 1.932 4.9 71.12 199 22.9935 02035 68 0.6903 101 1.992 5.031 11.38 200 23.4736 02188 69 0.7144 102 2.052 5.165 11.65 201 23.9637 02203 70 0.7392 103 2.114 5.302 11.92 202 24.4638 02292 71 0.7648 104 2.178 5.442 122 203 24.9739 02383 72 0.7912 105 2243 5.585 12.48 204 25.4840 02478 73 0.8183 106 2.31 5.732 12.77 205 2641 02576 74 0.8462 107 2.379 5.881 13.07 206 26.5342 02677 75 0.875 108 2.449 6.034 13.37 207 27.0743 02782 76 0.9046 109 2.521 6.19 13.67 208 27.6244 0.2891 77 0.9352 110 2.596 6.35 13.98 209 28.1845 0.3004 78 0.9666 111 2.672 6.513 14.3 210 28.7546 0.312 79 0.9989 112 2.749 6.68 14.62 211 29.33
212 29.92
Ps = Pb + (Pstatic / 13.6) Comments:
PP=VP- 800-(1.3*Tw)
BWS=(PP/Ps)*100
~~tiiW~tiT~- _ N
polymer stack 051718.x1s Copyright Roy F. Weston Inc. March 1999 PV
25

METHODS AND ANALYZERS
Client: Chemours Project Number:Location: Fayetteville, nc Operator: SDRSource: Polymer Date: 17 May 2018
File: C:\Users~Administrator.WSWCEQUIP2\Desktop\DATA\Chemours\051718 polymers.cemProgram Version: 2.0, built 21 Feb 2015 File Version: 2.02
Computer: WSWCEQUIP2 Trailer: 26Analog Input Device: MCC USB-1608G
Channel 1AnalyteMethodAnalyzer Make, Model &Serial No.Full-Scale Output, myAnalyzer Range,Span Concentration,
Channel 2AnalyteMethodAnalyzer Make, Model &Serial NoFull-Scale Output, myAnalyzer Range,Span Concentration,
OzEPA 3A, Using BiasServomex 1440
100025.021.0
COsEPA 3A, Using BiasServomex 1440
100020.016.6
y
V'V'~T ..:;SOLUTIONS
26

CALIBRATION DATANumber 1
Client: Chemours Project Number:Location: Fayetteville, nc Operator: SDRSource: Polymer Date: 17 May 2018
Start Time: 08:47
02Method: EPA 3A
Calibration Type: Linear Zero and High Span
Calibration StandardsCylinder ID
12.0 SG916461821.0 SG9169108
Calibration ResultsZero -2 my
Span, 21.0 % 841 my
Curve CoefficientsSlope Intercept40.14 -2
COzMethod: EPA 3A
Calibration Type: Linear Zero and High Span
Calibration StandardsCylinder ID
8.9 SG916461816.6 SG9169108
Calibration ResultsZero 0 my
Span, 16.6 % 833 my
Curve CoefficientsSlope Intercept50.24 0
v~~- ::::SOLUTIONS.
27

CALIBRATION ERROR DATANumber 1
Client: Chemours Project Number:Location: Fayetteville, nc Operator: SDRSource: Polymer Calibration 1 Date: 17 May 2018
Start Time: 08:47
OsMethod: EPA 3ASpan Conc. 21.0
Slope 40.14 Intercept -2.0
Standard Result Difference ErrorStatus
Zero 0.0 0.0 0.0 Pass12.0 12.1 0.1 0.5 Pass21.0 21.0 0.0 0.0 Pass
CO2Method: EPA 3ASpan Conc. 16.6
Slope 50.24 Intercept 0.0
Standard Result Difference ErrorStatus
Zero 0.0 0.0 0.0 Pass8.9 9.0 0.1 0.6 Pass16.6 16.6 0.0 0.0 Pass
v~-~- ~::~SOlUT10NS
28

BIASNumber 1
Client: Chemours Project Number:Location: Fayetteville, nc Operator: SDRSource: Polymer Calibration 1 Date: 17 May 2018
Start Time: 08:53
02Method: EPA 3ASpan Conc. 21.0
Bias ResultsStandard Cal. Bias Difference ErrorGas % % % % StatusZero 0.0 -0.1 -0.1 -0.5 Pass
COsMethod: EPA 3ASpan Conc. 16.6
Bias ResultsStandard Cal. Bias Difference ErrorGas % % % % StatusZero 0.0 0.1 0.1 0.6 PassSpan 9.0 9.0 0.0 0.0 Pass
V11~s1' ::.;SOLUTIONS
29

RUN DATANumber 1
Client: Chemours Project Number:Location: Fayetteville, nc Operator: SDRSource: Polymer Calibration 1 Date; 17 May 2018
Time 02 COs/o /o
10:44 21.1 0.210:45 21.1 0.210:46 21.1 0.210:47 21.0 0.210:48 21.0 0.210:49 21.0 0.210:50 21.0 0.210:51 21.0 0.210:52 21.0 0.210:53 21.0 0.110:54 21.0 0.110:55 21.0 0.110:56 21.0 0.110:57 21.0 0.110:58 21.0 0.110:59 21.0 0.111:00 21.0 0.111:01 21.0 0.111:02 21.0 0.111:03 21.0 0.111:04 21.0 0.111:05 21.0 0.211:06 21.0 0.111:07 21.0 0.211:08 21.0 0.211:09 21.0 0.211:10 21.0 0.211:11 21.0 0.111:12 21.0 0.211:13 21.0 0.111:14 21.0 0.111:15 21.0 0.111:16 21.0 0.111:17 21.0 0.111:18 21.0 0.111:19 21.0 0.111:20 21.0 0.111:21 21.0 0.111:22 21.0 0.111:23 21.0 0.111:24 21.0 0.111:25 21.0 0.1
~vnV:`~~~~~~ 30

RUN DATANumber 1
Client: Chemours Project Number:Location: Fayetteville, nc Operator: SDRSource: Polymer Calibration 1 Date: 17 May 2018
Time OZ CO2/o /o
11:26 21.0 0.111:27 21.0 0.111:28 21.0 0.111:29 21.0 0.111:30 20.9 0.211:31 21.0 0.211:32 21.0 0.211:33 21.0 0.211:34 21.0 0.211:35 21.0 0.111:36 21.0 0.111:37 21.0 0.111:38 21.0 0.111:39 21.0 0.111:40 21.0 0.111:41 21.0 0.111:42 21.0 0.111:43 21.0 0.1Avgs 21.0 0.1
..=~T ;;SOLUTIONS
31

RUN SUMMARYNumber 1
Client: Chemours Project Number:Location: Fayetteville, nc Operator: SDRSource: Polymer Calibration 1 Date: 17 May 2018
02 CO2Method EPA 3A EPA 3AConc. Units
Time: 10:43 to 11:43
Run Averages
21.0 0.1
Pre-run Bias at 08:53
Zero Bias -0.1 0.1Span Bias 12.0 9.0Span Gas 12.0 8.9
Post-run Bias at 11:46
Zero Bias 0.0 0.2Span Bias 12.0 8.7Span Gas 12.0 8.9
Averages corrected for the average of the pre-run and post-run bias
20.9 0.0
32

BIAS AND CALIBRATION DRIFTNumber 2
Client: Chemours Project Number:Location: Fayetteville, nc Operator: SDRSource: Polymer Calibration 1 Date: 17 May 2018
Start Time: 11:46
02Method: EPA 3ASpan Conc. 21.0
Bias ResultsStandard Cal. Bias Difference ErrorGas % % % % StatusZero 0.0 0.0 0.0 0.0 Pass;~~~.
Calibration DriftStandard Initial* Final Difference DriftGas % % % % StatusZero -0.1 0.0 0.1 0.5 PassSpan 12.0 12.0 0.0 0.0 Pass
*Bias No. 1
CO2Method: EPA 3ASpan Conc. 16.6
Bias ResultsStandard Cal. Bias Difference ErrorGas % % % % StatusZero 0.0 0.2 0.2 1.2 PassSpan 9.0 8.7 -0.3 -1.8 Pass
Calibration DriftStandard Initial* Final Difference DriftGas % % °/a % StatusZero 0.1 0.2 0.1 0.6 PassSpan 9.0 8.7 -0.3 -1.8 Pass
*Bias No. 1
V'V'F~T :;SOLUTIONS
33

RUN DATANumber 2
Client: Chemours Project Number:Location: Fayetteville, nc Operator: SDRSource: Polymer Calibration 1 Date: 17 May 2018
Time Oz CO2/o /o
12:05 20.9 0.112:06 21.0 0.112:07 21.0 0.112:08 21.0 0.112:09 21.0 0.112:10 21.0 0.112:11 21.0 0.112:12 21.0 0.112:13 21.0 0.112:14 21.0 0.112:15 21.0 0.112:16 21.0 0.112:17 21.0 0.112:18 21.0 0.112:19 21.0 0.112:20 21.1 0.112:21 21.1 0.112:22 21.1 0.112:23 21.1 0.112:24 21.1 0.112:25 21.1 0.112:26 21.1 0.112:27 21.1 0.112:28 21.1 0.112:29 21.1 0.112:30 21.1 0.112:31 21.1 0.112:32 21.1 0.112:33 21.1 0.112:34 21.1 0.112:35 21.1 0.112:36 21.1 0.112:37 21.1 0.112:38 21.0 0.112:39 21.0 0.112:40 21.0 0.112:41 21.1 0.112:42 21.0 0.112:43 21.0 ~ 0.112:44 21.1 0.112:45 21.1 0.112:46 21.1 0.1
V'V'F~T'SOLUTIONS
34

RUN DATANumber 2
Client: Chemours Project Number:Location: Fayetteville, nc Operator: SDRSource: Polymer Calibration 1 Date: 17 May 2018
Time 02 COs/o /o
12:47 21.1 0.112:48 21.1 0.112:49 21.1 0.112:50 21.1 0.112:51 21.1 0.112:52 21.1 0.112:53 21.1 0.112:54 21.1 0.112:55 21.1 0.112:56 21.0 0.112:57 21.0 0.112:58 21.0 0.112:59 21.0 0.113:00 21.0 0.113:01 21.0 0.113:02 21.0 0.113:03 21.0 0.113:04 21.0 0.1Avgs 21.1 0.1
..=1 T" :;SOLUTIONS
35

RUN SUMMARYNumber 2
Client: Chemours Project Number:Location: Fayetteville, nc Operator: SDRSource: Polymer Calibration 1 Date: 17 May 2018
02 CO2Method EPA 3A EPA 3AConc. Units
Time: 12:04 to 13:04
Run Averages
21.1 0.1
Pre-run Bias at 11:46
Zero Bias 0.0 0.2Span Bias 12.0 8.7Span Gas 12.0 8.9
Post-run Bias at 13:24
Zero Bias -0.1 0.2Span Bias 12.1 8.6Span Gas 12.0 8.9
Averages corrected for the average of the pre-run and post-run bias
20.9 0.0
V'V'F~T ::::SOLUTIONS
36

BIAS AND CALIBRATION DRIFTNumber 3
Client: Chemours Project Number:Location: Fayetteville, nc Operator: SDRSource: Polymer Calibration . 1 Date: 17 May 2018
Start Time: 13:24
OzMethod: EPA 3ASpan Conc. 21.0
Bias ResultsStandard Cal. Bias Difference ErrorGas % % % % StatusZero 0.0 -0.1 -0.1 -0.5 PassSpan 12.1 12.1 0.0 0.0 Pass
Calibration DriftStandard Initial* Final Difference DriftGas % % °/a % StatusZero 0.0 -0.1 -0.1 -0.5 Pass
*Bias No. 2
COsMethod: EPA 3ASpan Conc. 16.6 °/a
Bias ResultsStandard Cal. Bias Difference ErrorGas % % % % StatusZero 0.0 0.2 0.2 1.2 PassSpan 9.0 8.6 -0.4 -2.4 Pass
Calibration DriftStandard Initial* Final Difference DriftGas % % % % StatusZero 0.2 0.2 0.0 0.0 PassSpan 8.7 8.6 -0.1 -0.6 Pass
*Bias No. 2
v~-r :::;SOLUTIONS
37

RUN DATANumber 3
Client: Chemours Project Number:Location: Fayetteville, nc Operator: SDRSource: Polymer Calibration 1 Date: 17 May 2018
Time Os CO2/o /o
13:53 21.0 0.013:54 21.0 0.013:55 21.0 0.013:56 21.0 0.013:57 21.0 0.013:58 21.0 0.013:59 21.0 0.014:00 21.0 0.014:01 21.0 0.014:02 21.0 0.014:03 21.0 0.014:04 21.0 0.014:05 21.0 0.014:06 21.0 0.014:07 21.0 0.014:08 21.0 0.014:09 21.0 0.014:10 21.0 0.014:11 21.0 0.014:12 21.0 0.014:13 21.0 0.014:14 21.0 0.014:15 21.0 0.014:16 21.0 0.014:17 21.0 0.014:18 21.0 0.014:19 21.0 0.014:20 21.0 0.014:21 21.0 0.014:22 21.0 0.014:23 21.0 0.014:24 21.0 0.014:25 21.0 0.014:26 21.0 0.014:27 21.0 0.014:28 21.0 0.014:29 21.0 0.014:30 21.0 0.014:31 21.0 0.014:32 21.0 0.014:33 21.0 0.014:34 21.0 0.0
c~~ U\J 38

RUN DATANumber 3
Client: Chemours Project Number:Location: Fayetteville, nc Operator: SDRSource: Polymer Calibration 1 Date: 17 May 2018
Time Oz COs/o /o
14:35 21.0 0.014:36 21.0 0.014:37 21.0 0.014:38 21.0 0.014:39 21.0 0.014:40 21.0 0.014:41 21.0 0.014:42 21.0 0.014:43 21.0 0.014:44 21.0 0.014:45 21.0 0.014:46 21.0 0.014:47 21.0 0.014:48 21.0 0.014:49 21.0 0.014:50 21.0 0.014:51 21.0 0.014:52 21.0 0.0Avgs 21.0 0.0
.,~ T~ :;SOLUTIONS
39

RUN SUMMARYNumber 3
Client: Chemours Project Number:Location: Fayetteville, nc Operator: SDRSource: Polymer Calibration 1 Date: 17 May 2018
Oz COsMethod EPA 3A EPA 3AConc. Units
Time: 13:52 to 14:52
Run Averages
21.0 0.0
Pre-run Bias at 13:24
Zero Bias -0.1 0.2Span Bias 12.1 8.6Span Gas 12.0 8.9
Post-run Bias at 14:55
Zero Bias 0.1 -0.2Span Bias 12.0 8.5Span Gas 12.0 8.9
Averages corrected for the average of the pre-run and post-run bias
20.9 0.0
V1l'~T :::;SOLUTIONS.
40

BIAS AND CALIBRATION DRIFTNumber 4
Client: Chemours Project Number:Location: Fayetteville, nc Operator: SDRSource: Polymer Calibration 1 Date: 17 May 2018
Start Time: 14:55
OzMethod: EPA 3ASpan Conc. 21.0
Bias ResultsStandard Cal. Bias Difference ErrorGas % % % % StatusZero _ 0.0 0.1 0.1 0.5 Pass
_ _ ~ ,~ '_ '' i __ _ _ _ _ _ .
Calibration DriftStandardGasZeroSpan
Initial*%-0.112.1
*Bias No. 3
Final Difference% %0.1 0.212.0 -0.1
Drift%1.0-0.5
StatusPassPass
COsMethod: EPA 3ASpan Conc. 16.6
Bias ResultsStandard Cal. Bias Difference ErrorGas % % % % StatusZero 0.0 -0.2 -0.2 -1.2 PassSpan 9.0 8.5 -0.5 -3.0 Pass
Calibration DriftStandard Initial* Final Difference DriftGas % % % % StatusZero 0.2 -0.2 -0.4 -2.4 PassSpan 8.6 8.5 -0.1 -0.6 Pass
*Bias No. 3
:;cni u-rinnis...
41

a APPENDIX CLABORATORY ANALYTICAL DESCRIPTION AND
ANALYTICAL REPORTS
Note: The full analytical reports are included on the attached CD.
IASDATAICHEMOURS\15418.002.004\Et EMISSIONS TEST REPORT-LW 8!10!2018
42

~-.$ ~ ._ _
Test~4mericaTHE LEADER IN ENVIRONMENTAL TESTING --- ~,~.:.,, .=~-~t~
ANALYTICAL REPORTJob Number: 140-11587-2
Job Description: E-1 Field Test Low Level Re-analysis
Contract Number: LBIO-67p48
For:Chemours Company FC, LLC The
c/o AECOMSabre Building, Suite 3004051 Ogletown RoadNewark, DE 19713
Attention: Michael Aucoin
~~~,8.r~.~'~~31~+~M~(1~ CauAney M AdkinsProject Me~eper 18114@018 3:05 PM
Courtney M Adkins, Project Manager5815 Middlebrook Pike, Knoxville, TN, 37921
(865)[email protected]
08/14/2018Revision: 1
This report may not be reproduced except in full, and with written approval from the laboratory. For questions pleasecontact the Project Manager at the e-mail address or telephone number listed on this page.
TestAmerica Laboratories, Inc.
TestAmerica Knoxville 5815 Middlebrook Pike, Knoxville, TN 37921
Tel (865) 2913000 Fax (865) 584-4315 ~nntvw.testamericainc.com
Page 1 of 258 08/14/2018
43

Table of ContentsCover Title Page .......................................... 1
Data Summaries .......................................... 4
Definitions ..................................................... 4
Method Summary ................................................ 5
Sample Summary .................... ........................... 6
Case Narrative .................................................. 7
QC Association ................................................. g
Client Sample Results ............................................ 10
Default Detection Limits ........................................... ~ 7
Surrogate Summary .............................................. 18
QC Sample Results .............................................. 19
Chronicle ...................................................... 22
Certification Summary ............................................ 30
Manual Integration Summary ....................................... 31
Organic Sample Data ...................................... 33
GC/MS VOA .................................................... 33
Method 82608 SIM ....................................................... 33
Method 82608 SIM QC Summary .........................................................34
Method 82608 SIM Sample Data ......................................................... 50
Standards Data .......................................................................~ 74
Method 82608 SIM ICAL Data ....................................................... ~ 74
Method 82608 SIM CCAL Data ...................................................... 1 9 O
Raw QC Data .........................................................................~ 9 9
Method 82606 SIM Blank Data ...................................................... 1 9 9
Method 82608 SIM LCS/LCSD Data ..................................................2~7
Method 82608 SIM MS/MSD Data ....................................................2 ~ 5
Page 2 of 258 08/14/2018
44

Table of ContentsMethod 82606 SIM Run Logs ............................................................
2 3 9
Method 82606 SIM Prep Data ............................................................ 24 8
Shipping and Receiving Documents ........................... 251
Page 3 of 258 08/14/2018
45

Definitions/GlossaryClient: Chemours Company FC, LLC The TestAmerica Job ID: 140-11587-2Project/Site: E-1 Field Test Low Level Re-analysis
Qualifiers
GC/MS VOAQualifier Qualifier Description
H Sample was prepped or analyzed beyond the specified holding time
G~OS
Abbreviation These commonly used abbreviations may or may not be present in this report.
a Listed under the "D" column to designate that the result is reported on a dry weight basis
%R Percent Recovery
CFL Contains Free Liquid
CNF Contains No Free Liquid
DER Duplicate Error Ratio (normalized absolute difference)
Dil Fac Dilution Factor
DL Detection Limit (DoD/DOE)
DL, RA, RE, IN Indicates a Dilution, Re-analysis, Re-extraction, or additional Initial metals/anion analysis of the sample
DEC Decision Level Concentration (Radiochemistry)
EDL Estimated Detection Limit (Dioxin)
LOD Limit of Detection (DoD/DOE)
LOQ Limit of Quantitation (DoD/DOE)
MDA Minimum Detectable Activity (Radiochemistry)
MDC Minimum Detectable Concentration (Radiochemistry)
MDL Method Detection Limit
ML Minimum Level (Dioxin)
NC Not Calculated
ND Not Detected at the reporting limit (or MDL or EDL if shown)
PQL Practical Quantitation Limit
QC Quality Control
RER Relative Error Ratio (Radiochemistry)
RL Reporting Limit or Requested Limit (Radiochemistry)
RPD Relative Percent Difference, a measure of the relative difference between two points
TEF Toxicity Equivalent Factor (Dioxin)
TEQ Toxicity Equivalent Quotient (Dioxin)
TestAmerica Knoxville
Page 4 of 258 08/14/2018
46

Method SummaryClient: Chemours Company FC, LLC TheProject/Site: E-1 Field Test Low Level Re-analysis
TestAmerica Job ID: 140-11587-2
Method Method Description Protocol Laboratory82608 SIM Volatile Organic Compounds (GC/MS) SW846 TAL KNX
McOH Prep Methanol Impinger Preparation None TAL KNX
Protocol References:
None =None
SW846 = "Test Methods For Evaluating Solid Waste, Physical/Chemical Methods", Third Edition, November 1986 And Its Updates.
Laboratory References:
TAL KNX = TestAmerica Knoxville, 5815 Middlebrook Pike, Knoxville, TN 37921, TEL (865)291-3000
TestAmerica Knoxville
Page 5 of 258 08/14/2018
47

Sample SummaryClient: Chemours Company FC, LLC TheProject/Site: E-1 Field Test Low Level Re-analysis
Lab Sample ID Client Sample ID Matrix140-11587-1 0-2460 R1 IMPINGER #1 WITH MEOH RINSE Air
140-11587-2 0-2461 R1 IMPINGER #2 WITH MEOH RINSE Air
140-11587-3 0-2462 R1 IMPINGER #3 WITH MEOH RINSE Air
140-11587-4 0-2463 R1 IMPINGER #4 WITH MEOH RINSE Air
140-11587-5 0-2464 R1 IMPINGER #5 WITH MEOH RINSE Air
140-11587-6 0-2465 R1 IMPINGER #6 WITH MEOH RINSE Air
140-11587-7 0-2466 R2 IMPINGER #1 WITH MEOH RINSE Air
140-11587-8 0-2467 R2 IMPINGER #2 WITH MEOH RINSE Air
140-11587-9 0-2468 R2 IMPINGER #3 WITH MEOH RINSE Air
140-11587-10_. _.
0-2469 R2 IMPINGER #4 WITH MEOH RINSE Air
140-11587-11 0-2470 R2 IMPINGER #5 WITH MEOH RINSE Air
140-11587-12 0-2471 R2 IMPINGER #6 WITH MEOH RINSE Air
140-11587-13 0-2472 R3 IMPINGER #1 WITH MEOH RINSE Air
140-11587-14 0-2473 R3 IMPINGER #2 WITH MEOH RINSE Air
140-11587-15 0-2474 R3 IMPINGER #3 WITH MEOH RINSE Air
140-11587-16 0-2475 R3 IMPINGER #4 WITH MEOH RINSE Air
140-11587-17 0-2476 R3 IMPINGER #5 WITH MEOH RINSE Air
140-11587-18 0-2477 R3 IMPINGER #6 WITH MEOH RINSE Air
140-11587-19 O-Y478 QC IMPINGER #1 WITH MEOH RINSE BT Air
140-11587-20 0-2479 QC IMPINGER #2 WITH MEOH RINSE BT Air
140-11587-21 0-2480 QC IMPINGER #3 WITH MEOH RINSE BT Air
140-11587-22 0-2481 QC IMPINGER #4 WITH MEOH RINSE BT Air
140-11587-23 0-2482 QC IMPINGER #5 WITH MEOH RINSE BT Air
140-11587-24 0-2483 QC IMPINGER #6 WITH MEOH RINSE BT Air
140-11587-25 0-2484 QC MEOH RB Air
140-11587-26 0-2485 QC MEOH TB Air
140-11587-27 0-2486 QC MEOH PB Air
TestAmerica Job ID: 140-11587-2
Collected Received05/17/18 00:00 05/18/18 09:53
05/17/18 00:00 05/18/18 09:53
05/17/18 00:00 05!18/18 09:53
05/17/18 00:00 05/18/18 09:53
05/17/18 00:00 05/18/18 09:53
05/17/18 00:00 05/18/1 S 09:53
05/17/18 00:00 05118/18 09:53
05/17/18 00:00 05/18/1 S 09:53
05/17/18 00:00 05/18/1 S 09:53
05/17/18 00:00 05/18!18 09:53
05/17/18 00:00 05/18/18 09:53
05/17/18 00:00 05/18/18 09:53
05!17/18 00:00 05/18/18 09:53
05/17/18 00:00 05/18/18 09:53
05/17/18 00:00 05/18/18 09:53
05/17!18 00:00 05/18/18 09:53
05/17/18 00:00 05/18/18 09:53
05/17/18 00:00 05/18/1 S 09:53
05/17/18 00:00 05/18!18 09:53
05/17/18 00:00 05/18/18 09:53
05!17/18 00:00 05/18/18 09:53
05!17/18 00:00 05/18/18 09:53
05/17/18 00:00 05/18/18 09:53
05/17/18 00:00 05/18/18 09:53
05/17/18 00:00 05/18/18 09:53
05/17/18 00:00 05/18/1 S 09:53
05/17/18 00:00 05/18/1 S 09:53
TestAmerica Knoxville
Page 6 of 258 08/1412018
48

Job Narrative140-11587-2
Sample Receipt
The samples were received on May 18, 2018 at 9:53 AM in good condition and properly preserved. The temperature of the cooler atreceipt was 0.1 ° C.
Quality Control and Data Interpretation
Unless otherwise noted, all holding times, and QC criteria were met and the test results shown in this report meet all applicable NELACrequirements.
GC/MS VOA
Impinger Sample Preparation and Analysis: Impinger samples were originally analyzed for the volatile organic target analytes by purgeand trap GCMS using TestAmerica Knoxville standard operating procedure KNOX-MS-0015, based on the following method:
SW 846 82608, "Volatile Organic Compounds by Gas Chromatography/ Mass Spectrometry (GC/MS)"
To enhance the detectability of the EPA 8260 Method the lab employed a selective ion monitoring analysis mode to use for the E-1samples. The methanol impinger samples were reprocessed using the more aggressive analytical technique. Samples processed by thismethod were run outside of the standard fourteen (14) day holding time, but were stored refrigerated in their original method solvent andcontainers.
Each sample is prepared by adding a known amount of sample to the purge water in a purge and trap vessel and spiking with internalstandards, surrogates, and matrix spike analytes (as needed). Volatile compounds are introduced into the gas chromatograph by thepurge and trap method. The components are separated using a gas chromatograph and detected using a mass spectrometer, whichprovides both qualitative and quantitative information.
Impinger sample results were calculated using the following equation:
Concentration, ~g/sample = (C x DF x W x Vt) / (Va)Where:C = On-column concentration, ~g/LDF =Dilution factorW =Volume of water purged, LVt =Methanol extract final volume, NLVa =Volume of e~ract analyzed, ~L
The volumes of each sample are initially measured for the calculation of the total mass of Fluoroether E-1 in the sample. Results arereported in total micrograms (ug).
No additional analytical or quality issues were noted, other than those described above or in the Definitions/Glossary page.
Page 7 of 258 ~ 08/14/2018
49
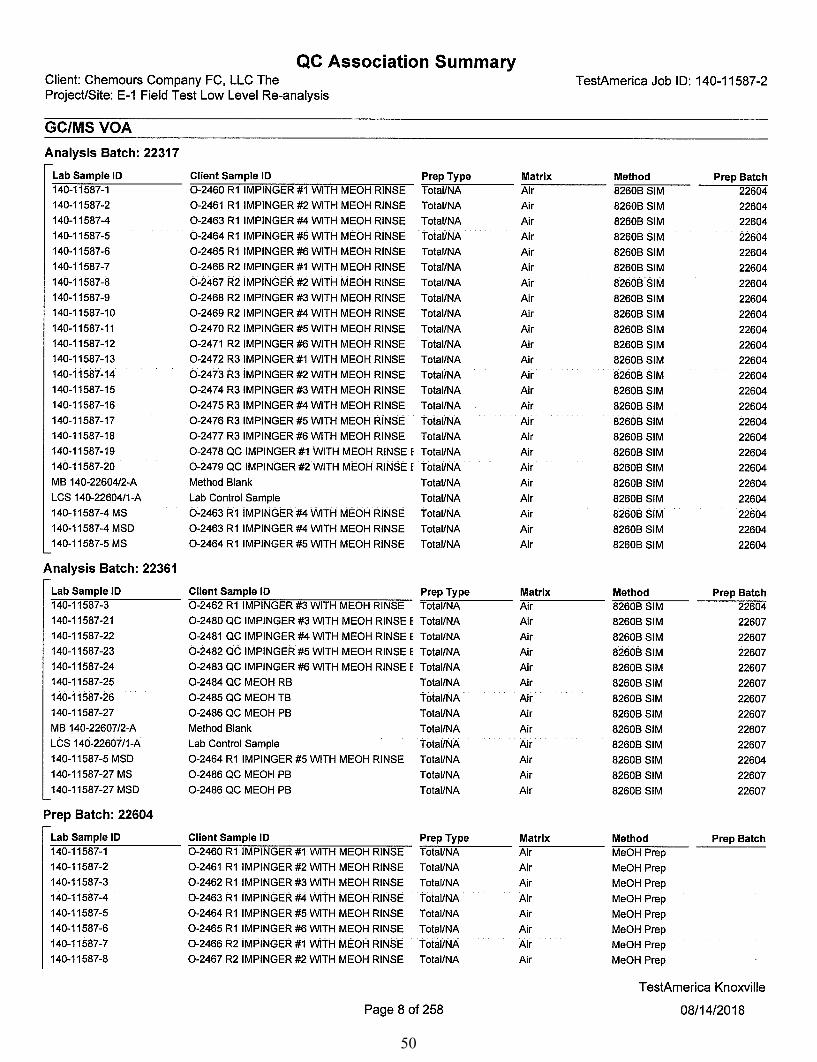
QC Association SummaryClient: Chemours Company FC, LLC The TestAmerica Job ID: 140-11587-2Project/Site: E-1 Field Test Low Level Re-analysis
GC/MS VOA
Analysis Batch: 22317
Lab Sample ID Client Sample ID Prep Type Matrix Method Prep Batch140-11587-1 0-2460 R1 IMPINGER #1 WITH MEOH RINSE TotallNA Air 82606 SIM 22604140-11587-2 0-2461 R1 IMPINGER #2 WITH MEOH RINSE Total/NA Air 82606 SIM 22604140-11587-4 0-2463 R1 IMPINGER #4 WITH MEOH RINSE Total/NA Air 82606 SIM 22604
140-11587-5_.
0-2464 R1 IMPINGER #5 WITH MEOH RINSE Total/NA Air 82608 SIM 22604
140-11587-6 0-2465 R1 IMPINGER #6 WITH MEOH RINSE Total/NA Air 82608 SIM 22604140-11587-7 0-2466 R2 IMPINGER #1 WITH MEOH RINSE Total/NA Air 82606 SIM 22604
140-11587-8 0-2467 R2 IMPINGER #2 WITH MEOH RINSE Total/NA Air 82608 SIM 22604140-11587-9 0-2468 R2 IMPINGER #3 WITH MEOH RINSE Total/NA Air 82606 SIM 22604140-11587-10 0-2469 R2 IMPINGER #4 WITH MEOH RINSE Total/NA Air 82606 SIM 22604140-11587-11 0-2470 R2 IMPINGER #5 WITH MEOH RINSE Total/NA Air 82606 SIM 22604140-11587-12 0-2471 R2 IMPINGER #6 WITH MEOH RINSE Total/NA Air 82608 SIM 22604140-11587-13 0-2472 R3 IMPINGER #1 WITH MEOH RINSE Total/NA Air 82608 SIM 22604140-11587-14 0-2473 R3 IMPINGER #2 WITH MEOH RINSE Total/NA Air 82608 SIM 22604140-11587-15 0-2474 R3 IMPINGER #3 WITH MEOH RINSE Total/NA Air 82608 SIM 22604
140-11587-16 0-2475 R3 IMPINGER #4 WITH MEOH RINSE Total/NA Air 82608 SIM 22604140-11587-17 0-2476 R3 IMPINGER #5 WITH MEOH RINSE Total/NA Air 82606 SIM 22604140-11587-18 0-2477 R3 IMPINGER #6 WITH MEOH RINSE Total/NA Air 82606 SIM 22604140-11587-19 0-2478 QC IMPINGER #1 WITH MEOH RINSE E Total/NA Air 82608 SIM 22604140-11587-20 0-2479 QC IMPINGER #2 WITH MEOH RINSE E Total/NA Air 82608 SIM 22604
MB 140-22604/2-A Method Blank Total/NA Air 82608 SIM 22604
LCS 140-22604/1-A Lab Control Sample Total/NA Air 82608 SIM 22604140-11587-4 MS 0-2463 R1 IMPINGER #4 WITH MEOH RINSE TotaUNA Air 82606 SIM 22604140-11587-4 MSD 0-2463 R1 IMPINGER #4 WITH MEOH RINSE Total/NA Air 82606 SIM 22604140-11587-5 MS 0-2464 R1 IMPINGER #5 WITH MEON RINSE Total/NA Air 82606 SIM 22604
Analysis Batch: 22361
Lab Sample ID Client Sample ID Prep Type Matrix Method Prep Batch140-11587-3 0-2462 R1 IMPINGER #3 WITH MEOH RINSE Total/NA Air 82608 SIM 22604140-11587-21 0-2480 QC IMPINGER #3 WITH MEOH RINSE E Total/NA Air 82608 SIM 22607140-11587-22 0-2481 QC IMPINGER #4 WITH MEOH RINSE E Total/NA Air 82606 SIM 22607140-11587-23 0-2482 QC IMPINGER #5 WITH MEOH RINSE E Total/NA Air 82608 SIM 22607140-11587-24 0-2483 QC IMPINGER #6 WITH MEOH RINSE E Total/NA Air 82608 SIM 22607
140-11587-25 0-2484 QC MEOH RB Total/NA Air 82608 SIM 22607
140-11587-26 0-2485 QC MEON TB Total/NA Air 82606 SIM 22607
140-11587-27 0-2486 QC MEOH PB Total/NA Air 82606 SIM 22607
MB 140-22607/2-A Method Blank Total/NA Air 82606 SIM 22607LCS 140-22607!1-A Lab Control Sample Total/NA Air 82608 SIM 22607
140-11587-5 MSD 0-2464 R1 IMPINGER #5 WITH MEOH RINSE Total/NA Air 82608 SIM 22604
140-11587-27 MS 0-2486 QC MEOH PB Total/NA Air 82608 SIM 22607
140-11587-27 MSD 0-2486 QC MEOH PB Total/NA Air 82606 SIM 22607
Prep Batch: 22604
Lab Sample ID Client Sample ID Prep Type Matrix Method Prep Batch140-11587-1 0-2460 R1 IMPINGER #1 WITH MEOH RINSE Total/NA Air McOH Prep
140-11587-2 0-2461 R1 IMPINGER #2 WITH MEOH RINSE Total/NA Air McOH Prep
140-11587-3 0-2462 R1 IMPINGER #3 WITH MEOH RINSE Total/NA Air McOH Prep
140-11587-4 0-2463 R1 IMPINGER #4 WITH MEOH RINSE Total/NA Air McOH Prep
140-11587-5 0-2464 R1 IMPINGER #5 WITH MEOH RINSE Total/NA Air McOH Prep
140-11587-6 0-2465 R1 IMPINGER #6 WITH MEOH RINSE Total/NA Air McOH Prep
140-11587-7_. __
0-2466 R2 IMPINGER #1 WITH MEOH RINSE_
Total/NA_.
Air McOH Prep
140-11587-8 0-2467 R2 IMPINGER #2 WITH MEOH RINSE TotallNA Air McOH Prep
TestAmerica Knoxville
Page 8 of 258 08/14/2018
50

QC Association SummaryClient: Chemours Company FC, LLC The TestAmerica Job ID: 140-11587-2Project/Site: E-1 Field Test Low Level Re-analysis
GCIMS VOA (Continued)
Prep Batch: 22604 (Continued)
Lab Sample ID Client Sample ID Prep Type Matrix Method Prep Batch140-11587-9 0-2468 R2 IMPINGER #3 WITH MEOH RINSE Total/NA Air McOH Prep140-11587-10 0-2469 R2 IMPINGER #4 WITH MEOH RINSE Total/NA Air McOH Prep140-11587-11 0-2470 R2 IMPINGER #5 WITH MEOH RINSE Total/NA Air McOH Prep140-11587-12 0-2471 R2 IMPINGER #6 WITH MEOH RINSE Total/NA Air McOH Prep140-11587-13 0-2472 R3 IMPINGER #1 WITH MEOH RINSE Totai/NA Air McOH Prep140-11587-14 0-2473 R3 IMPINGER #2 WITH MEOH RINSE Total/NA Air McOH Prep140-11587-15 0-2474 R3 IMPINGER #3 WITH MEOH RINSE Total/NA Air McOH Prep140-11587-16
_.0-2475 R3 IMPINGER #4 WITH MEOH RINSE TotaUNA Air McOH Prep
140-11587-17 0-2476 R3 IMPINGER #5 WITH MEOH RINSE Total/NA Air McOH Prep140-11587-18 0-2477 R3 IMPINGER #6 WITH MEOH RINSE Total/NA Air McOH Prep140-11587-19
__0-2478 QC IMPINGER #1 WITH MEOH RINSE E Total/NA Air McOH Prep
140-11587-20 0-2479 QC IMPINGER #2 WITH MEOH RINSE E Total/NA Air McOH PrepMB 140-22604!2-A Method Blank Total/NA Air McOH PrepLCS 140-22604/1-A Lab Control Sample Total/NA Air McOH Prep140-11587-4 MS 0-2463 R1 IMPINGER #4 WITH MEOH RINSE Total/NA Air McOH Prep140-11587-4 MSD 0-2463 R1 IMPINGER #4 WITH MEOH RINSE Total/NA Air McOH Prep140-11587-5 MS 0-2464 R1 IMPINGER #5 WITH MEOH RINSE Total/NA Air McOH Prep140-11587-5 MSD 0-2464 R1 IMPINGER #5 WITH MEOH RINSE Total/NA Air McOH Prep
Prep Batch: 22607
Lab Sample ID Client Sample ID Prep Type Matrix Method Prep Batch140-11587-21 0-2480 QC IMPINGER #3 WITH MEOH RINSE E Total/NA Air McOH Prep140-11587-22 0-2481 QC IMPINGER #4 WITH MEOH RINSE E Total/NA Air McOH Prep140-11587-23 0-2482 QC IMPINGER #5 WITH MEOH RINSE E Total/NA Air McOH Prep140-11587-24 0-2483 QC IMPINGER #6 WITH MEOH RINSE E Total/NA Air McOH Prep
', 140-11587-25 0-2484 QC MEOH RB TotaUNA Air McOH Prep140-11587-26 0-2485 QC MEOH TB Total/NA Air McOH Prep140-11587-27 0-2486 QC MEOH PB Total/NA Air McOH PrepMB 140-22607/2-A Method Blank Total/NA Air McOH PrepACS 140-22607/1-A Lab Control Sample Total/NA Air McOH Prep140-11587-27 MS 0-2486 QC MEOH PB Total/NA Air McOH Prep140-11587-27 MSD 0-2486 QC MEOH PB Total/NA Air McOH Prep
TestAmerica Knoxville
Page 9 of 258 08/14/2018
51

Client Sample ResultsClient: Chemours Company FC, LLC The TestAmerica Job ID: 140-11587-2Project/Site: E-1 Field Test Low Level Re-analysis
Client Sample ID: 0-2460 R1 IMPINGER #1 WITH MEOH RINSE Lab Sample ID: 140-11587-1Date Collected: 05/17/18 00:00 Matrix: AirDate Received: 05/18/18 09:53Sample Container: Plastic 125m~ - unpreserved
Method: 82608 SIM -Volatile Organic Compounds (GC/MS)Analyte Result Qualifier RL MDL Unit D Prepared Analyzed Dil Fac
Heptafluoropropyl ND H 0.0106 0.0106 ug/Sample 05/18/1812:08 07/27/1813:59 11,2,2,2-tetrafluoroethyl ether
Surrogate %Recovery Qualifier Limits Prepared Ana/yzed Dii Fac
Dibromofluoromethane (Burr) 84 50-150 05/18/18 12:08 07/27/18 13:59 1
1,2-Dichloroethane-d4 (Burr) 92 50-150 0 18/18 12:08 0727/18 13:59 1
Client Sample ID: d-2461 R1 IMPINGER #2 WITH MEOH RINSE Lab Sample ID: 140-11587-2Date Collected: 05/17/18 00:00 Matrix: AirDate Received: 05/18/18 09:53Sample Container: Plastic 125mL - unpreserved
Method: 82608 SIM -Volatile Organic Compounds (GC/MS)Analyte Result Qualifier Rl MDL Unit D Prepared Analyzed Dil Fac
Heptafluoropropyl ND H 0.00952 0.00952 ug/Sample 05!18/1812:08 07/27/1814:24 11,2,2,2-tetrafluoroethyl ether
Surrogate %Recovery Qualifier Limifs Prepared Analyzed Dil FacDibromofluoromethane (Burr) 83 50-150 Ofi/18/18 12:08 07/27/18 14:24 11,2-Dich/oroethane-d4 (Burr) 92 50-150 0 18/18 12:08 0727/18 14:24 7
Client Sample ID: 0-2462 R1 IMPINGER #3 WITH MEOH RINSE Lab Sample ID: '140-11587-3Date Collected: 05/17/18 00:00 Matrix: AirDate Received: 05/18/18 09:53Sample Container: Plastic 125mL - unpreserved
Method: 82608 SIM -Volatile Organic Compounds (GC/MS)Analyte Result Qualifies RL MDL Unit D Prepared Analyzed Dil Fac
Heptafluoropropyl ND H 0.00764 0.00764 ug/Sample 05/18/1812:08 07/30/1815:34 11,2,2,2-tetrafluoroethyl ether
Surrogate %Recovery Qualifier Limits Prepared Analyzed Dil FacDibromof/uoromethane (Burr) 93 50_ 150 05/18/18 12:08 07/30/18 75:34 11,2-Dichloroethane-d4 (Sun) 98 50 _ 150 05✓18/18 12:08 07/30/18 75:34 1
Client Sample ID: 0-2463 R1 IMPINGER #4 WITH MEOH RINSE Lab Sample ID: 1 40-1 1 587-4Date Collected: 05/17/18 00:00 Matrix: AirDate Received: 05/18/18 09:53Sample Container: Plastic 125mL - unpreserved
Method: 82608 SIM -Volatile Organic Compounds (GCIMS)Analyte Result Qualifier RL MDL Unit D Prepared Analyzed Dil Fac
Heptafluoropropyl ND H 0.00708 0.00708 ug/Sample 05/18/1812:08 07/27/1815:13 11,2,2,2-tetrafluoroethyl ether
Surrogate %Recovery Qualifier Limits Prepared Analyzed Dil FacDibromofluoromethane (Burr) 77 50_ 150 05/18/18 12:08 07/27/18 15:13 11,2-Dichloroethane-d4 (Burr) 89 50-150 05/18/18 12:08 07/27/18 15:13 7
TestAmerica Knoxville
Page 10 of 258 08/14/2018
52

Client Sample ResultsClient: Chemours Company FC, LLC The TestAmerica Job ID: 140-11587-2Project/Site: E-1 Field Test Low Level Re-analysis
Client Sample IQ: 0-2464 R1 IMPINGER #5 WITH MEOH RINSE Lab Sample ID: 140-11587-5Date Collected: 05/17/18 00:00 Matrix: AirDate Received: 05/18/18 09:53Sample Container: Plastic 125mL - unpreserved
Method: 82606 SIM -Volatile Organic Compounds (GC/MS)Analyte Result Qualifier RL MDL Unit D Prepared Analyzed DiI Fac
Heptafluoropropyl ND H 0.00654 0.00654 ug/Sample 05/18/1812:08 07/27/1815:37 11,2,2,2-tetrafluoroethyl ether
Surrogate %Recovery Qualifier Limits Prepared Analyzed Dil FacDi6romofluoromethane (Burr) 87 50-150 05/18/18 12:08 07/27/18 15:37 11,2-Dich/oroethane-d4 (Burr) 94 50-150 05/18/18 12:08 07/27/18 15:37 1
Client Sample ID: 0-2465 R1 IMPINGER #6 WITH MEOH RINSE Lab Sample ID: 140-11587-6Date Collected: 05/17/18 00:00 Matrix: AirDate Received: 05/18/'18 09:53Sample Container: Plastic 125mL - unpreserved
Method: 82608 SIM -Volatile Organic Compounds (GC/MS)Analyte Result Qualifier RL MDL Unit D Prepared Analyzed Dil Fac
Heptafluoropropyl 0.00744 H 0.00672 0.00672 ug/Sample 05/18/1812:08 07/27/1816:02 11,2,2,2-tetrafluoroethyl ether
Surrogate %Recovery Qualifier Limits Prepared Analyzed Dil FacDibromof/uoromethane (Burr) 97 50-150 05/18/18 72:08 07/27/18 76:02 1
1,2-Dich/oroethane-d4 (Burr) 95 50- 150 05/18/18 12:08 07/27/18 16:02 1
Client Sample ID: 0-2466 R2 IMPINGER #1 WITH MEC?H RINSEDate Collected: 05/17/18 00:00Date Received: 05/18/18 09:53Sample Container: Plastic 1Z5m~ - unpreserved
Lab Sample ID: 14Q-1'1587-7Matrix: Air
Method: 82608 SIM -Volatile Organic Compounds (GC/MS)Analyte Result Qualifier RL MDL Unit D Prepared Analyzed DII Fac
Heptafluoropropyl 0.00864 H 0.00760 0.00760 uglSample 05/18/1812:08 07/27/1816:26 11,2,2,2-tetrafluoroethyl ether
Surrogate %Recovery Qualifier Limits Prepared Analyzed Dil FacDibromofluoromethane (Burr) 93 50-150 05/18/18 12:08 07/27/18 16:26 11,2-Dichloroethane-d4 (Burr) 97 50.150 05/18/18 12:08 07/27/18 16:26 1
Client Sample ID: 0-2467 R2 IMPINGER 2 WITH MEOH RINSE Lab Sample ID: 14Q-11587-8Date Collected: 05/17/18 00:00 Matrix: AirDate Received: 05/18/18 09:53Sample Container: Plastic 125mL - unpreserved
Method: 82608 SIM -Volatile Organic Compounds (GC/MS)Analyte Result Qualifier RL MDL Unit D Prepared Analyzed Dil Fac
Heptafluoropropyl 0.0100 H 0.00682 0.00682 ug/Sample 05/18/1812:08 07/27/1816:50 11,2,2,2-tetrafluoroethyl ether
Surrogate %Recovery Qualifier Limits Prepared Analyzed Dil FacDibromof/uoromethane (Burr) 92 50-150 05/18/18 12:08 07/27/18 16:50 11,2-Dich/oroethane-d4 (Burr) 97 50-150 05/18/18 12:08 07/27/18 16:50 1
TestAmerica Knoxville
Page 11 of 258 08/14/2018
53

Client Sample ResultsClient: Chemours Company FC, LLC The TestAmerica Job ID: 140-11587-2Project/Site: E-1 Field Test Low Level Re-analysis
Client Sample ID: 0-2468 R2 IMPINGER #3 WITH MEOH RINSE Lab Sample ID: 1 40-1 1 587-9Date Collected: 05/17/18 00:00 Matrix: AirDate Received: 05/18/18 09:53Sample Container: Plastic 125mL - unpreserved
Method: 82608 SIM -Volatile Organic Compounds (GC/MS)Analyte Result Qualifier R~ MDL Unit D Prepared Analyzed Dil Fac
Heptafluoropropyl 0.0100 H 0.00750 0.00750 ug/Sample 05/18/1812:08 07/27/1817:15 11,2,2,2-tetrafluoroethyl ether
Surrogate %Recovery Qualifier Limits Prepared Analyzed Dil FacDibromofluoromethane (Burr) 94 50-150 05/18/18 12:08 07/27/18 17:15 11,2-Dich/oroethane-d4 (Burr) 107 50-150 05/18/18 72:08 0727/18 17:15 1
Client Sample ID: d-2469 R2 IMPINGER #4 WITH MEOH RINSEDate Collected: 05/17/18 00:00Date Received: 05!18/18 09:53Sample Container: Plastic 125mL - unpreserved
Lab Sample ID: 14A-11587-10Matrix: Air
Method: 82608 SIM -Volatile Organic Compounds (GC/MS)Analyte Result Qualifier RL MDL Unit D Prepared Analyzed Dil Fac
Heptafluoropropyl 0.00708 H 0.00680 0.00680 ug/Sample 05/18/1812:08 07/27/1817:39 11,2,2,2-tetrafluoroethyl ether
Surrogate %Recovery Qualifier Limits Prepared Analyzed Dil FacDibromofluoromethane (Burr) 94 50-150 0/18/18 12:08 07%27/18 1T.39 11,2-Dich/oroethane-d4 (Burr) 100 50-150 05/18/18 12:08 07/27/18 17:39 7
Client Sample ID: 0-2470 R2 IMPINGER #5 WITH MEOH RINSE Lab Sample ID: 140-71587-11Date Collected: 05/17/18 00:00 Matrix: AirDate Received: 05/18/18 09:53Sample Container: Plastic 125mL - unureserved
Method: 82606 SIM -Volatile Organic Compounds (GC/MS)Analyte Result Qualifier RL MDL Unit D Prepared Analyzed Dil Fac
Heptafluoropropyl 0.00812 H 0.00663 0.00663 ug/Sample 05/18/1812:08 07/27/1818:04 11,2,2,2-tetrafluoroethyl ether
Surrogate %Recovery Qualifier Limits
Dibromofluoromethane (Burr) 92 50-150
1,2-Dich/oroethane-d4 (Burr) 97 50-150
Prepared Analyzed Dil Fac
Oa/18/1812:08 07/27/1818:04 1
05/18/1812:08 07/27/1818:04 1
Glient Sample ID: 0-2471 R2 IMPINGER #6 WITH MEQH RINSE Lab Sample ID: 140-11587-12Date Collected: 05/17/18 00:00 Matrix: AirDate Received: 05/18/18 09:53Sample Container: Plastic 125mL - unpreserved
Method: 82608 SIM -Volatile Organic Compounds (GC/MS)Analyte Result Qualifier RL MDL Unit D Prepared Analyzed Dil Fac
Heptafluoropropyl 0.00798 H 0.00749 0.00749 ug/Sample 05/18/1812:08 07/27/1818:28 11,2,2,2-tetrafluoroethyl ether
Surrogate %Recovery Qualifier Limits Prepared Analyzed Dil FacDibromofluoromethane (Burr) 93 50- 150 0 18/18 12:08 07/27/18 18:28 11,2-Dich/oroethane-d4 (Burr) 99 50-150 05/18/18 12:08 07/27/18 78:28 1
TestAmerica Knoxville
Page 12 of 258 08/14/2018
54

Client Sample ResultsClient: Chemours Company FC, LLC The TestAmerica Job ID: 140-11587-2Project/Site: E-1 Field Test Low Levei Re-analysis
Client Sample Id: Q-2472 R3 IMPINGER #1 WITH MEOH RINSE Lab Sample ID: 140-11587-13Date Collected: 05/17/18 00:00 Matrix: AirDate Received: 05i18J18 09:53Sample Container: Plastic 125mL - unpreserved
Method: 82608 SIM -Volatile Organic Compounds (GC/MS)Analyte Result Qualifier RL MDL Unit D Prepared Analyzed Dil Fac
Heptafluoropropyl 0.0110 H 0.0109 0.0109 ug/Sample 05/18/18 12:08 07/27/18 18:52 ' 11,2,2,2-tetrafluoroethyl ether
Surrogate %Recovery Qualifier Limits Prepared Analyzed Dil FacDibromofluoromethane (Burr) 93 50-150 05/18/18 12:08 07/27/18 18:52 11,2-Dich/oroethane-d4 (Sun) 99 50-150 05/18/18 72:08 07/27/18 18:52 1
Client Sample ID: 0-2473 R3 IMPINGER #2 WITH MEOH RINSE Lab Sample ID: 140-11587-14Date Collected: 05/17/18 00:00 Matrix: AirDate Received: 05/18/18 09:55Sample Container: Plastic 125mL - unpreserved
Method: 82606 SIM -Volatile Organic Compounds {GC/MS)Analyte Result Qualifier RL MDL Unit D Prepared `Analyzed Dii Fac
Heptafluoropropyl 0.0126 H 0.0104 0.0104 ug/Sample 05/18/1812:08 07/27/1819:17 11,2,2,2-tetrafluoroethyl ether
Surrogate %Recovery Qualifier Limits Prepared Analyzed Dil FacDibromofluoromethane (Burr) 93 50-150 05/18/18 12:08 07/27/18 19:17 11,2-Dichloroethane-d4 (Burr) 99 50-150 Ofi/18/18 12:08 07/27/18 19:17 1
Client Sample ID: Q-2474 R3 IMPINGER #3 WITH MEOH RINSE Lab Sample ID: 140-11587-15Date Collected: 05/17/18 00:00 Matrix: AirDate Received: 05/18/18 09:53Sample Container: Plastic 125mL - unpreserved
Method: 82606 SIM -Volatile Organic Compounds (GC/MS)Analyte Result Qualifier RL MDL Unit D Prepared Analyzed Dil Fac
Heptafluoropropy) 0.00915 H 0.00705 0.00705 ug/Sample 05/18/1812:08 07/27/1819:41 11,2,2,2-tetrafluoroethyl ether
Surrogate %Recovery Qualifier Limits Prepared Analyzed Dil FacDibromof/uoromethane (Burr) 91 50 _ 150 05/18/18 12:08 07/27/18 19:41 11,2-Dich/oroethane-d4 (Burr) 97 50. 150 05✓18/18 12:08 07/27/18 19:41 1
Client Sample ID: 0-2475 R3 IMPINGER #4 WITH MEOH RINSE Lab Sample ID: '140-11587-16Date Collected: 05/17/18 00:00 Matrix: AirDate Received: 05/18/18 09:53Samgle Container: Plastic 125mL - ungreserved
Method: 82608 SIM -Volatile Organic Compounds (GC/MS)Analyte Result Qualifier RL MDL Unit D Prepared Analyzed Dil Fac
Heptafluoropropy) 0.00824 H 0.00744 0.00744 ug/Sample 05/18/18 12:08 07/27/18 20:06 11,2,2,2-tetrafluoroethyl ether
Surrogate %Recovery Qualifier Limits Prepared Analyzed Dil FacDibromofluoromethane (Sun) 91 50 - 750 05/18/18 72:08 07/"17/18 20:06 11,2-Dichloroethane-d4 (Burr) 98 50-150 0 18/18 12:08 07/27/18 20:06 1
TestAmerica Knoxville
Page 13 of 258 08/14/2018
55

Client Sample ResultsClient: Chemours Company FC, LLC TheProject/Site: E-1 Field Test Low Level Re-analysis
TestAmerica Job ID: 140-11587-2
Client Sample ID: 0-2476 R3 IMPINGER #5 WITH MEOH RINSE Lab Sample ID: 140-11587-17Date Collected: 05/17/18 00:00 Matrix: AirDate Received: 05/18/18 09:53Sample Container: Plastic 125mL - unpreserved
Method: 82608 SIM -Volatile Organic Compounds (GC/MS)Analyte Result Qualifier RL
Heptafluoropropyl 0.00714 H 0.007081,2,2,2-tetrafluoroethyl ether
Surrogate %Recovery Qualifier Limits
Dibromof/uoromethane (Suer) 90 50-150
1,2-Dich/oroethane-d4 (Burr) 97 50- 150
MDL Unit D Prepared Analyzed Dil Fac
0.00708 ug/Sample 05!18/18 12:08 07/27/18 20:30 1
Prepared Analyzed Dil Fac
05/18/18 12:08 07/27/18 20:30 7
05/18/18 12:08 07/27/18 20:30 1
Client Sample ID: 0-2477 R3 IMPINGER #6 WITH MEOH RINSE Lab Sample ID: 140-11587-18Date Collected: 05/17/18 00:00 Matrix: AirDate Received: 05/18/18 09:53Sample Container: Plastic 125mL - unpreserved
Method: 82608 SIM -Volatile Organic Compounds (GC/MS)Analyte Result Qualifier R~ MDL Unit D Prepared Analyzed Dil Fac
Heptafluoropropyl 0.00988 H 0.00711 0.00711 ug/Sample 05/18/18 12:08 07/27!18 20:55 11,2,2,2-tetrafluoroethyl ether
Surrogate %Recovery Qualifier Limits Prepared Analyzed Dil FacDibromofluoromethane (Burr) 94 50- 150 Ofi/18/18 12:08 07/27/18 20:55 11,2-Dichloroethane-d4 (Burr) 99 50-150 05/18/18 ?2:08 07/27/18 20:55 1
Client Sample ID: 0-2478 QC IMPINGER #1 WITH MEOH RINSE Lab Sample ID: 140-11587-19BTDate CoBlected: 05/17/18 00:00 Matrix: AirDate Received: 05/18/18 09:53Sample Container: Plastic 125mL - unpreserved
Method: 82606 SIM -Volatile Organic Compounds (GC/MS)Analyte Result Qualifier RL MDL Unit D Prepared Analyzed DII Fac
Heptafluoropropyl ND H 0.00668 0.00668 ug/Sample 05/18/18 12:08 07/27/18 21:19 11,2,2,2-tetrafluoroethyl ether
Surrogate %Recovery Qualifier Limits Prepared Analyzed Dil FacDibromof/uoromethane (Burr) 94 50_ 150 Ofi/18/18 12:08 07/27/18 27:19 11,2-Dichloroethane-d4 (Burr) 98 50- 150 05/18/18 12:08 07/27/18 21:19 1
Glient Sample ID: 0-2479 QC IMPINGER 2 WITH MEOH RINSE Lab Sample ID: 140-11587-20BTDate Collected: 05/17/18 00:00 Matrix: AirDate Received: QS/'18/18 09:53Sample Container: Plastic 125mL - unpreserved
Method: 82606 SIM -Volatile Organic Compounds (GC/MS)Analyte Result Qualifier RL MDL Unit D Prepared
Heptafluoropropyl ND H 0.00738 0.00738 ug/Sample 05/18/1812:081,2,2,2-tetrafluoroethyl ether
Surrogate %Recovery Qualifier Limits
Dibromof/uoromethane (Burr) 94 50.150
1,2-Dichloroethane-d4 (Burr) 97 50- 150
Analyzed Dil Fac
07/27/18 21:43
Prepared Analyzed Dil Fac
05/18/18 12:08 07/27/18 21:43 7
05/18/18 12:08 07/27/18 21:43 1
TestAmerica Knoxville
Page 14 of 258 08/14/2018
56

Client Sample ResultsClient: Chemours Company FC, LLC The TestAmerica Job ID: 140-11587-2Project/Site: E-1 Field Test Low Level Re-analysis
Client Sample ID: 0-2480 QC IMPINGER #3 WITH MEOH RINSE Lab Sample ID: 140-11587-21BTDate Collected: 05!17/18 OQ:00 Matrix: AirDate Received: 45/18/18 09:53Sample Container: Plastic '125mL - unpreserved
Method: 82608 SIM -Volatile Organic Compounds (GC/MS)Analyte Result Qualifier RL MDL Unit D Prepared Analyzed Dil Fac
Heptafluoropropyi ND H 0.00785 0.00785 ug/Sample 05/18/1812:11 07/30/1812:40 11,2,2,2-tetrafluoroethyl ether
Surrogate %Recovery Qualifier Limits Prepared Analyzed Dil FacDibromofluoromethane (Burr) 79 50-150 05/18/18 12:11 07/30/18 12:40 11,2-Dich/oroethane-d4 (Burr) 87 50-150 05/18/18 12:11 07/30/18 12:40 1
Client Sample ID: 0-2481 QC IMPINGER #4 WITH MEOH RINSE Lab Sample ID: 140-11587-22BTDate Collected: 05/17/18 00:00 Matrix: AirDate Received: 05/18/18 09:53Sample Container: Plastic 125mL - unpreserved
Method: 82608 SIM -Volatile Organic Compounds (GC/MS)Analyte Result Qualifier RL MDL Unit D Prepared Analyzed Dil Fac
Heptafluoropropyl ND H 0.00776 0.00776 ug/Sample 05/18/1812:11 07/30/1813:05 11,2,2,2-tetrafluoroethyl ether
Surrogate %Recovery Qualifier Limits Prepared Analyzed Dil FacDibromofluoromethane (Burr) 82 50-150 05/18/18 12:17 07/30/18 13:05 11,2-Dichloroethane-d4 (Burr) 89 50-150 _ 05/18/18 12:11 07/30/18 13:05 1
Client Sample ID: 0-2482 QC IMPINGER #5 WITN MEOH RINSE Lab Sample ID: 140-11587-23BTDate Collected: 05/17/18 OO:OQ Matrix: AirDate Received: 05/18/18 09:53Sample Container: Plastic 125mL - unpreserved
'Method: 82606 SIM -Volatile Organic Compounds (GC/MS)Analyte Result Qualifier RL MDL Unit D Prepared Analyzed Dil Fac
Heptafluoropropyl ND H 0.00678 0.00678 ug/Sample 05/18/1812:11 07/30/1813:29 11,2,2,2-tetrafluoroethyl ether
Surrogate %Recovery Qualifier Limits Prepared Analyzed Dil FacDibromofluoromethane (Burr) 84 50-150 05/18/18 12:11 07/30/18 13:29 11,2-Dich/oroethane-d4 (Sun) 90 50-150 05/18/18 12:11 07/30/18 13:29 1
Client Sample ID: 0-2483 QC IMPINGER #6 WITH MEOH RINSE Lab Sample ID: 140-11587-24BTDate Collected: 05/17/18 OO:QO Matrix: AirDate Received: 05/18/18 09:53Sample Container: Plastic 125rnL - unpreserved
Method: 82606 SIM -Volatile Organic Compounds (GClMS)Analyte Result Qualifier RL MDL Unit D Prepared Analyzed Dil Fac
Heptafluoropropyl ND H 0.00687 0.00687 ug/Sample 05/18/1812:11 07130/1813:56 11,2,2,2-tetrafluoroethyl ether
TestAmerica Knoxville
Page 15 of 258 08/14/2018
57

Client Sample ResultsClient: Chemours Company FC, LAC The TestAmerica Job ID: 140-11587-2Project/Site: E-1 Field Test Low Level Re-analysis
Client Sample ID: 0-2483 QC IMPINGER #6 WITH MEOH RINSE Lab Sample ID: 140-11587-24BTDate Collected: 05/17/18 00:00 Matrix: AirDate Received: 05/18/18 09:53Sample Container: Plastic 125mL - unpreserved
Surrogate %Recovery Qualifier Limits Prepared Analyzed Dil FacDibromofluoromethane (Burr) 88 50.150 05/i8/18 12:11 07/30/18 13:56 11,2-Dich/oroethane-d4 (Burr) 95 50-150 05/18/18 12:11 07/30/18 73:56 1
Client Sample ID: 0-2484 QC MEOH RB Lab Sample ID: 140-11587-25Qate Collected: 05/17/18 00:00 Matrix: AirDate Received: 05!18/18 09:53Sample Container: Plastic 125mL - unpreserved
Method: 82608 SIM -Volatile Organic Compounds (GC/MS)Analyte Result Qualifier RL MDL Unit D Prepared Analyzed Dil Fac
Heptafluoropropyl ND H 0.0145 0.0145 ug/Sample 05/18/1812:11 07/30/1814:20 11,2,2,2-tetrafluoroethyl ether
Surrogate %Recovery Qualifier
Dibromofluoromethane (Burr) 97
1,2-Dich/oroethane-d4 (Burr) 98
50-150
50 -150
Prepared Analyzed Di/ Fac
05/18/1812:11 07/30/1814:20 7
05✓18/18 12:11 07/30/18 14:20 1
Client Sample ID: 0-2485 QC EOH TB Lab Sample ID: 140-11587-26Date Collected: 05/17/18 00:00 Matrix: AirDate Received: 05/18/18 09:53Sample Container: Plastic 125mL - unpreserved
Method: 82608 SIM -Volatile Organic Compounds (GC/MS)Analyte Result Qualifier RL MDL Unit D Prepared Analyzed Dil Fac
Heptafluoropropyl ND H 0.0104 0.0104 ug/Sample 05/18/1812:11 07/30/1814:45 11,2,2,2-tetrafluoroethyl ether
Surrogate %Recovery Qualifier Limits Prepared Analyzed Dil FacDibromof/uoromethane (Burr) 93 50- 150 05/18/18 12:11 07/30/18 14:45 11,2-Dichloroethane-d4 (Burr) 97 50-150 ~ 05✓18/18 12:11 07/30/18 14:45 1
Client Sample ID: 0-2486 QC MEOH PB Lab Sample ID: 140-11587-27Date Collected: 05/17/18 00:00 Matrix: AirDate Received: 05/18/18 09:53Sample Cantainer: Plastic 125mL - unpreserved
Method: 82608 SIM -Volatile Organic Compounds (GC/MS)Analyte Result Qualifier RL MDL Unit 0 Prepared Analyzed Dil Fac
Heptafluoropropyl ND H 0.0141 0.0141 ug/Sample 05/1811812:11 07/30/1815:09 11,2,2,2-tetrafluoroethyl ether
Surrogate %Recovery Qualifier Limits Prepared Analyzed Dil FacDibromofluoromethane (Burr) 94 50- 150 0 18/18 12:11 07/30/18 15:09 11,2-Dichloroethane-d4 (Burr) 99 50- 150 05✓18/18 12:11 07/30/18 15:09 7
TestAmerica Knoxville
Limits
Page 16 of 258 08/14/2018
58

Default Detection LimitsClient: Chemours Company FC, LLC The TestAmerica Job ID: 140-11587-2Project/Site: E-1 Field Test Low Level Re-analysis
Method: 82606 SIM -Volatile Organic Compounds (GC/MS)Prep: McOH Prep
CAnalyte R~ MDL Units MethodHeptafluoropropyl 1,2,2,2-tetrafluoroethyl ether 0.00250 0.00250 ug/Sample 82608 SIM
TestAmerica Knoxville
Page 17 of 258 08/14/2018
59

APPENDIX DSAMPLE CALCULATIONS
IASDATA\CHEMOURS\15418.002.004\E1 EMISSIONS TEST REPORT-LW 8/10/2018
60

SAMPLE CALCULATIONS FORVOLUMETRIC FLOW &MOISTURE
Client: Chemours Plant Fayetteville, NCTest Number. Run 1 Pre Test Test Date: 5/U/2018Test Location: Polymer Stack Test Period: 1043-t t43
1. Moisture Content
BWS = (PP/Ps)*100
BWS = 0.710/29.864=2.38
Where;
BWS = Moisture,
PP = Partial Press of H2O
Ps = Absolute stack static pressure, inches Hg (Ps)
2. Mole Traction of dry gas.
Md = 1 - Bws
Md = 1 - 0.0238 = 0.976
Where:
Md = Mole fraction of dry gas, dimensionless.
3. Dry molecular weight of gas stream, Ibflb-mole.
MWd = (0.440x%COZ)+(0320x%OZ)+(0280x(%N2+%CO))
MWd = (0.440x0.00)+(0320x20.90)+(0.280x(79.10+0.00))
= 28.84
Where:
MWd = Drymoleculazweigh[,Ibllb-mole.
COZ = Percent cazbon dioxide by volume, dry basis.
OZ = Percent oxygen by volume, dry basis.
NZ = Percent nitrogen by volume, dry basis.
CO = Percent carbon monoxide by volume, dry basis.
0.440 = Molecular weight of cazbon dioxide, divided by 100.
0320 = Molecular weight of oxygen, divided by (00.
0280 = Moleculaz weight of nitrogen or carbon monoxide,divided by 100.
4. Actual molecular weight of gas stream (wet basis), Ibflb-mole.
MWs = (MWdxMd)+(18x(1-Md))
MWs = (28.84x0.976)+(~8x (1-0.976))=28.58
Where:
MWs = Molecular weight of wet gas, lb/Ib-mole.
18 = Molecular weight of water, Ib/]b-mole.
811 B/207 89:18 AM polymer stack 051718.xis
61

5. Average velocity of gas stream at actual conditions, ft/sec.
Ts (avg)Vs = 85.49 x Cp x ((dell p)^I!2)avg x (-------------)^1/2
Ps x MWs
529Vs = 85.49 x 0.84 x 0.655924 x (----------------------)^l /2 = 37.
29.86 x 28.58Where:
Vs = Average gas stream velocity, ft/sec.
(16/16-mole)(in. Hg)^U285.49 = Pitot tube constant, fi/sec x ---________________________.___
(deg R)(in H20)
Cp = Pitot tube coefficient, dimensionless.
Ts = Absolute gas stream temperature, deg R = Ts, deg F + 460.
P(ststic)Ps = Absolute gas stack pressure, in. Hg. = Pb + ------------
13.6
delt p = Velocity head oFstack, in. HZO
6. Average gas stream volumetric flowrate at actual conditions, wacUmin.
Qs(ect) = 60 x Vs x As
Qs(act) = 60 x 37.10 x 4.91 = 10929
Where:
Qs(act) = Volumetric flowrate of wet stack gas at actualconditions, wacf/min.
As = Cross-sectional area oFs[ack, R^2.
7. Average gas stream dry volumetric flowrate at standard conditions, dscf/min.
PsQs(std) = 17.64 x Md x ---------- x Qs(act)
Ts
29.864Qs(std) = 17.64 x 0.976 x ------------ x 10929
529
= 10617
Where:
Qs(std) = VolumeVic flowrate of dry stack gas at standardconditions, dscf/min.
8 71 612 01 8 9:18 AM polymer stack 051718.xis
62

SAMPLE CALCULATIONS FORE-1
Clienh Chemours Plant: Favetteville.NCTest Number: Run 1 Test Date: 5/17/2018Test Location: Polymers Test Period: 1043-1143
1. E-1 concentretion, lbs/dscf.
W x 22046 x 10"9
Conci = -------------------~Vm(std)
5 0.0281 x 2.2046 x 10e-9
Cone _ ------------------------t.063
Conc~ = 5 5.84E-1t
Where:
W = Weight of E-1 wllected in sample in ug.
Conc~ _ E-1 concentration, lbs/dscF.
22046x10"9 Conversion factor from ug to Ihs.
Vm(s[d) = Volume of gas sample measured by the dry gfls meter,
wrrected to standazd conditions, dscf.
2. E-i concentration, ug/dscm.
Conc2 = W / (Vm(std) x 0.02832)
ConcZ = 5 0.0281 / (1.063 x 0.02832 )
Cancz = <_ 66.8
Where:
ConcZ = E-1 concenhation,ug/dscm.
0.02832 = Conversion factor from cubic Feet to cubic meters.
3. E-1 mass emission rate, Ibs/hr.
Ivfass Rates = Conc~ x Qs(std) x 60 min/hr
Mass Rates _ _< 5.84E-1 I x 10546 x 60
Mass Rates = 5 3.69E-OS
Where:
Mess Rates _ E-1 mass emission rate, Ibs/lu.
4. E-1 mass emission rate, g/sec.
Mass Ftate2 = Mass Rates x 453.59 / 3600
Mass RateZ = 5 3.69E-0S x 453.59 /3600
Mass Rate2 = 5 4.65E-06
Where:
Mass RateZ = E-1 mass emission rate, g/sec.
453.6 = Conversion factor from pounds to grams.
3600 = Conversion factor from hours to seconds.
8/IS/20183:07 PM polymer stack 051718.x1s 63

APPENDIX EEQUIPMENT CALIBRATION RECORDS
IASDATA\CHEMOURSN54t8.002.604\Et EMISSIONS TEST REPORT-LW 8/10/2018
64

Long Cal and Temperature Cai Datasheet for VOST Dry Gas Meter ConsoleCalibrator PM VOST Box Number VOST 8 Ambient Temp 72
Thermocouple SimulatorDate 28-Jul-17 Wet Test Meter Number 10BB-1 Temp Reference Source (accuracy +/- ~°F)
Dry Gas Meter Number 3602380
Setting Gas Volume Temperatures Baro Press, inHg (Pb)
2g.64
Liters perminute
Roto-meter
OrificeManometer
Wet Test Dry gas Meter
MeterWet Test
Dry Gas MeterMeter Resultsin HZO
OH)liters(Vw)
liters(Vd
°FTw)
Outlet, °C(Tdo)
Inlet, °C(Tdi)
Average, °F(Td
Time, min(0)
Y
0.50 0.50 0.30 5.00.000
72.523.90 23.90
75.0 8.9 1.01474.947 23.90 23.904.947 23.90 23:90
0.50 0.50 0.30 5.00.000
72.523.90 23.90
75.0 8.9 1.01224.959 23.90 23.904.959 23.90 23.90
1.0 1.0 0.65 10.0O.000
72.523.90 23.90
75.5 9.9 1.01759.867 24.50 24.509.867 24.20 24.20
1.0 1.0 0.65 10.00.000
72.524.50 24.50
76.0 10.0 1.01549.897 24.50 24.509.897 24.50 24.50
Average 1.0150... - ._.~...~ ~ v~u~ ~ ~c Nu~an iy u n vuyi i u ~c vvci icai ~ i ~ciC~
Vd -Gas Volume passing through the dry gas meterTw - Temp of gas in the wet test meterTdi -Temp of the inlet gas of the dry gas meterTdo -Temp of the outlet gas of the dry gas meterTd -Average temp of the gas in the dry gas meter
1 -Channel Temps must agree with +/- 5°F or 3°C2 -Acceptable Temperature Difference less than 1.5
u - ~ ime of calibration run ~/~y * Pb * (td + 460 )Pb -Barometric Pressure Y = r0H -Pressure differential across Vd * LPb + ~H ~ * ~tw + 460orifice 13.6
Y -Ratio of accuracy of wet test 0.0317 * O H ~tw + 460 ~ O 2meter to dry gas meter ~H Pb * ~td + 460 ~] * [ Vw ]
ReferenceTemperature Temperature Reading from Individual Thermocouple Input' Average
TemperatureReading
Temp2
Difference (%)Select Temperature
~ °C ~ °F Channel Number1 2 3 4 5 6
32 32 32 32 32 32.0 0.0%212 213 213 213 213 212.0 0.0%932 932 932 932 932 931.0 0.0%1832 1829 1829 1829 1829 1830.0 0.1
Temp Diff = l Reference Temp(°F~+ 460 -Test Temp°F~+ 460~~
L Reference Tem °F + 460
Long Cal Vost Box #8 7-28-17 65

Post Test Wet Test Meter Calibration Datasheet for VOST Dry Gas Meter ConsoleCalibrator MDW VOST Box Number 8 Client Chemours
Date 15-Aug-18 Wet Test Meter Number 1066-1 Location/Plant Fayetteville, NC
Dry Gas Meter Number 3602380 PreTest Y 1.015
Setting Gas Volume Temperatures Baro Press, inHg (Pb)
2g.75
Liters perminute
Roto-meter
OrificeManometer
Wet Test Dry gas Meter
MeterWet Test
Dry Gas MeterMeter Results
in H2O
(DH)
liters
(Vw)litersVd
°FTw
Outlet, °C
(Tda)Inlet, °C(Td;)
Average, °FTd
Time, min
(0)Y
0.50 0.50 1.00 10.00.000
72.0 24.00 24.00 75.0' 11.8 0.993210.10010.100
0.50 0.50 1.00 10.00.000
72.0 24.00 24.00 75.0 11.7 1.003110.00010.001
0.50 0.50 1.00 10.00.000
72.0 24.00 24.00 75.0 11.5 1.00349.9989,998
1 -Tolerance for Y is less than 0.0500 Average 0.9999
Difference O.Q151
vw -vas volume passing through the wet test meterVd -Gas Volume passing through the dry gas meterTw -Temp of gas in the wet test meterTdi -Temp of the inlet gas of the dry gas meter
Tdo -Temp of the outlet gas of the dry gas meterTd -Average temp of the gas in the dry gas meter
0 -Time of calibration run
Pb -Barometric Pressure
0H -Pressure differential acrossorifice
Y -Ratio of accuracy of wet testmeter to dry gas meter
Y _ Vw *Pb *(td+460)
Vd * LPb + ~H~l * (finr + 46013.6
0.0317 * D H (tw + 460 ~ * O Z
~H - [Pb * (td + 460 ~] * [ ~/~v
• • • ~ • '-~ - a'',~~
6 sc~►.~~ir` r~s
66

Type S Pitot Tube Inspection Data FormPitot Tube Identification Number: P-558
Inspection Date 1/31/18 Individual Conducting Inspection KS
"-S~`P'a"` ~~~'~~~~~ Distance to A Plane (PA) -inches 0.47B Pe Distance to B Plane (PB) -inches 0.47
as~a~e~ •--•••-~- --~~.~~~~--~ Pitot OD (D~) -inches 0.3751.05 D~< P < 1.5 D, PA must Equal PB
If all Criteria PASSCp is equal to 0.84
PASS/FAILPASSPASS
Are Open Faces Aligned OYES O NOPerpendicular to the Tube Axis PASS
Face Op~ing+— Planes —r/~
Q1, . ~C~ ,Q2,
s~;
Q1 and Q2 must be < 10°
Angle of Q1 from vertical ATube- degrees (absolute)Angle of Q2 from vertical BTube- degrees (absolute)
B ~w~ B ~W t Angle of 61 from.... .............-..-. -... ..-~ ...~ vertical A Tube-A ..... A
--•---•-~~~~~'•'~~~-- -..-..... ~,.1..__. degrees (absolute)
.... Angle of B1 fromT..~~...~ ~~~::.~ B2~+or-) vertical B Tube-... A .. ___........::..
........._._... >~~~:.~.~~(+o~-~ degrees (absolute)
Bi or B2 must be < 5°
2 PASS
2 PASS
1 PASS
1 PASS
i—z::::. _. _..__......__........_.......__. .,.,..,.;:_. __... orizontal offset between A and'~B B Tubes (Z) -inches 0.008 PASS
Z A _ .s
..,.._._-.. ~:~-:~:: Vertical offset between A and B"" ""~ ~'~-'~"""~~" ~~'~' ~'~~"''~ Tubes (W) -inches 0.016 PASSW must be < 0.03125 inches
X Distance between Samples,~~ ~ p "~W~~~~ Noale and Pitot (X) -inches NA
X must be > 0.75 inches
'"~~p~~ Im act Pressure°pG010~ P'a"~ p Q YES p NOOpening Plane is
.__ _ ...~~~~~M~'` above the NoaleNoak Enty Plane
O NA~,....._.... ._._.._....... Entry Planei~ incn i
icrtpaahue
ThermocoupleT s~`°`T"~` meets the Distance
OYES p NO
Criteria in theS~~P̀ °~` ~ adjacentfigure ~ NA
~-3 irch —~i
t~a~~~ ~ Thermocouple p YES p NO3 4 inchmeets the Distance
T sP"°`T"~ Criteria in theadjacent figure 0 NA
Sampk Probe
P-558.7ft.VP.~ds
67

Type S Pitot Tube Inspection Data FormPitot Tube Identification Number: P-698
Inspection Date 3/30/18 Individual Conducting Inspection
If all Criteria PASS
SR Cp is equal to 0.84
PASS/FAILA-Side Plane ....................D~ ~~~~~~ ~~~~rA~ Distance to A Plane (PA} -inches 0.475 PASS
~~~~~~~~~~"~'~~~Pg~ Distance to B Plane (PB) -inches 0.475 PASSs-s~aer~~,e .................... ...... ........... Picot OD (Dt) -inches 0.375
1.05 D,< P < 1.5 D, PA must Equal PB
................. ... ."~~~~ • ~•• ~ • ~• ~~~8~~~~~~~ -•~~-•~.••• Are Open Faces AlignedOO YES O NOF,~h~,;~g _ _ Perpendicular to the Tube Axis PASS
:~— Plies
QI; AEQ1 B Qz.
B ~ Angle of Q1 from vertical A Tube-~~~~••~~~~••~~•~~ ~~-~~ ~~~~~~•~••-••••••• degrees (absolute) 0 PASS
.........`......... ....., .................. ...........~~ ~~ Angle of Q2 from vertical B Tube-degrees (absolute) 0 PASS
Q1 and Q2 must be < 10°
J~ B F~oJt Angle of B1 fromB ~°W .......... ..~.~....~.~..,.~,.,`
....:.......~7 A ......~,~~~ ................... vertical A Tube-A..................~1::::....._.
B~~-~~'.............~:~......... degrees (absolute) 0B~~+~ 1 PASS
......................~:::::::.::::........... Angle of B1 from... ......................._~...:::':::.. vertical B Tube-
~~~~~~ de rees absolute 0 PASS
81 or B2 must be < 5° +— z
A ~ Horizontal offset between A andBB B Tubes (Z) -inches 0.009 PASS
q~e~~.u...~.y,.,.~.. ~-__--7. . ~::::::::::.
Vertical offset between A and BTubes (W) -inches 0.005 PASS
W must be < 0.03125 inches
Sampling
Distance between SampleNozzle and Pitot (X) -inches N/A
Impact Pressure AYES ~ NO
Opening Plane is ~above the Nozzle QQ NAEntry Plane I
PASS
Pressure2 Plane
Entry
~ ~~b .
Temperature Sevsor
t-3 inc6 —►~
Saznple~r ~e~rure Sensor ~j ~;~~,Dt _ _ _. _ .
L~
Sample Probe
Thermocouple meets Q YES Q NO Ithe Distance Criteriain the adjacent figure Q NA
Thermocouple meets QQ YES Q NO '.the Distance Criteriain the adjacent figure (~ NA i
P-698.7FT VEL
68

Airgas.an Air Liquide company
CERTIFICATE OF ANALYSISGrade of Product: EPA Protocol
Part Number: E03N162E15A0224 Reference Number:Cylinder Number: SG9169108 Cylinder Volume:Laboratory: 124 -Riverton (SAP) - NJ Cylinder Pressure:PGVP Number: 652017 Valve Outlet:Gas Code: CO2,02,BALN Certification Date:
Airgas Specialty GasesAirgas USA, LLC60o Union Landing RoadCinnaminson, NJ o8oT7-0000Airgas.com
82-401044874-1157.2 CF2015 PSIG590Nov 18, 2017
Expiration Date: Nov 18, 2025Certification performed in accordance with "EPA Traceability Proto~l for Assay and Certification of Gaseous Calibratlon Standards (May 2012)" document EPA600/R-12/531, using the assay procedures listed. Analytical Methodology does not require correction for analytical interFerence. This cylinder has a total analyticical
uncertainty as stated below with a confidence level of 95%. There are no significant impurities which affect the use of this calibration mixture. All concentrations are on avolumelvolume basis unless otherwise noted.
Do Not Use This tinder below 100 si , i.e. 0.7 me a ascals.
ANALYTICAL RESULTSComponent Requested Actual Protocol Total Relative Assay
Concentration Concentration Method Uncertainty DatesCARBON DIOXIDE 17.00 % 16.58 % G1 +/- 0.7% NIST Traceable 11/18/2017OXYGEN 21.00 °/a 21.00 % G1 +!- 0.5% NIST Traceable 11/18/2017NITROGEN Balance -
CALIBRATION STANDARDSType Lot ID Cylinder No Concentration Uncertainty Eupiration DateNTRM 12061336 CC360792 11.002 %CARBON DIOXIDElNITROGEN +/- 0.6% Jan 11, 2018NTRM 09061415 CC273526 22.53 %OXYGEN/NITROGEN +/- 0.4% Mar OS, 2019
ANALYTICAL EQUIPMENTInstrument/Make/Model Analytical Principle Last Multipoint CalibrationHoriba VIA 510-0O2-19GYCXEG NDIR Oct 30, 2017Horiba MPA 510-02-7TWMJ041 Paramagnetic Oct 27, 2017
Triad Data Available Upon Request
Signature on fie
Approved for Release Page 1 of 82-401044874-1
69

Airgas.en Air Liquide company
CERTIFICATE OF ANALYSISGrade of Product: EPA Protocol
Part Number: E03N179E15AOOE4 Reference Number:Cylinder Number: SG9164618 Cylinder Volume:Laboratory: 124 -Riverton (SAPj - NJ Cylinder Pressure:PGVP Number: 652018 Valve Outlet:Gas Code: CO2,02,BALN Certification Date:
Airgas Specialty Gasean~~ trsn, itc60o Union landing Road(tinnaminaoII, NJ 080~'j-0000Airgas.com
82-401151034-1150.5 CF2015 PSIG590Mar 16, 2018
Expiration Date: Mar 16.2026Certlflcatlon performed In accordance wlth 'EPA Traceab(Ifty Protocol for Assay and Certlflcatlon of Gaseous Calibration Standartis (May 2012)' document EPA600lR-12/531, using the assay procedures listed. AnalyBpl Methodology does not require cortectlon for analytical inteAerence. This cylinder has e total anatytical
uncertainty as stated below with a confidence level of 95%. There are no significant impurfdes which affect the use of this calibratlon mixture. All concentrations ars on avolume/volume basis unless otherwise noted.
Do Not Use Thfs inder below 100 s i.e. 0.7 m a scats.
ANt~I.i'TI~:AI. RE'.Si7I.TS►Component Requested Actual Protocol Total Relative Assay
Concentration Concentration Method Uncertainty DatesCARBON DIOXIDE 9.000 % 8.948 % G1 +/- 0.7% NIST TrdCeable 03/16/2018OXYGEN 12.Q0 % 11.98 % G1 +/- 0.4% NIST Traceable 03/16/2018NITROGEN Balance _
CALIBRATION STANDARDSType Lot ID Cylinder No Concentration Uncertainty F~cpiration DateNTRM 13060609 CC413575 13.359 %CARBON DIOXIDE/fVITROGEN +/- 0.6% May 09, 2019NTRMpIus 09060208 CC262337 9.961 % OXYGENMITROGEN +/- 0.3% Nov 08, 2018
ANALYTICAL EQUIPMENTInstrument/Make/Model Analytical Principle Last Multipoint CalibrationHoriba VIA 510-0O2-19GYCXEG NDIR Feb 23, 2018Horiba MPA 510-02-71WMJ041 Paramagnetic Feb 23, 2018
Triad Data Available Upon Request
Signature on fileApproved for Release Page 1 of 82.401151034-1
70

APPENDIX FLIST OF PROJECT PARTICIPANTS
IASDATA\CHEMOURS\15418.002.004\E1 EMISSIONS TEST REPORT-LW 8 /1 012 01 8
71

The following WESTON employees participated in this project.
Paul Meeter Senior Project Manager
Steve Rathfon Team Leader
Kyle Schweitzer Team Member
Matt Winkeler Team Member
Jack Mills Team Member
IASDATA\CHEMOURSN5418.002.004\E1 EMISSIONS TEST REPORT-LW 8/10/2018
72