IXIA - · PDF fileManagement ’s Discussion and Analysis of Financial Condition and...
70
FORM 10-K IXIA (Annual Report) Filed 3/26/2002 For Period Ending 12/31/2001 Address 26601 W AGOURA RD CALABASAS, California 91302 Telephone 818-871-1800 CIK 0001120295 Industry Electronic Instr. & Controls Sector Technology Fiscal Year 12/31
Transcript of IXIA - · PDF fileManagement ’s Discussion and Analysis of Financial Condition and...

FORM 10-K
IXIA
(Annual Report)
Filed 3/26/2002 For Period Ending 12/31/2001
Address 26601 W AGOURA RD
CALABASAS, California 91302
Telephone 818-871-1800
CIK 0001120295
Industry Electronic Instr. & Controls
Sector Technology
Fiscal Year 12/31


Table of Contents
UNITED STATES SECURITIES AND EXCHANGE COMMISSION
Washington, DC 20549
FORM 10-K
(Mark One)
For the Fiscal Year Ended December 31, 2001
OR
For the transition period from ________ to ________
Commission File Number 000-31523
IXIA
(Exact name of registrant as specified in its charter)
26601 West Agoura Road, Calabasas, CA 91302 (Address of principal executive offices, including zip code)
(818) 871-1800 (Registrant’s telephone number, including area code)
Securities registered pursuant to Section 12(b) of the Act: None
Securities registered pursuant to Section 12(g) of the Act: Common Stock, without par value
Indicate by check mark whether the registrant (1) has filed all reports required to be filed by Section 13 or 15 (d) of the Securities Exchange Act of 1934 during the preceding 12 months (or for such shorter period that the registrant was required to file such reports), and (2) has been subject to such filing requirements for the past 90 days. Yes [X] No [ ]
Indicate by check mark if disclosure of delinquent filers pursuant to Item 405 of Regulation S-K is not contained herein, and will not be contained, to the best of registrant’s knowledge, in definitive proxy or information statements incorporated by reference in Part III of this Form 10-K or any amendment to this Form 10-K. [ ]
The aggregate market value of the Registrant’s Common Stock held by non-affiliates of the Registrant was $150,947,679 based on the closing sales price of the Registrant’s Common Stock on the Nasdaq National Market on March 5, 2002.
As of March 5, 2002, the number of shares of the Registrant’s Common Stock outstanding was 56,514,868.
[X]
ANNUAL REPORT PURSUANT TO SECTION 13 OR 15(d) OF THE SECURITIES EXCHANGE ACT OF 1934
[ ]
TRANSITION REPORT PURSUANT TO SECTION 13 OR 15(d) OF THE SECURITIES EXCHANGE ACT OF 1934
California 95-4635982
(State or other jurisdiction of incorporation or organization) (I.R.S. Employer Identification No.)

DOCUMENTS INCORPORATED BY REFERENCE
Portions of the registrant’s Proxy Statement to be delivered to shareholders in connection with their Annual Meeting of Shareholders to be held on May 9, 2002 are incorporated by reference into Part III of this Annual Report.

TABLE OF CONTENTS
PART I Item 1. Business Item 2. Properties Item 3. Legal Proceedings Item 4. Submission of Matters to a Vote of Security Holders
PART II Item 5. Market For Registrant’s Common Equity and Related Shareholder Matters Item 6. Selected Financial Data Item 7. Management’s Discussion and Analysis of Financial Condition and Results of Operations Item 7A. Quantitative and Qualitative Disclosures About Market Risk Item 8. Financial Statements and Supplementary Data Item 9. Changes in and Disagreements with Accountants on Accounting and Financial Disclosure
PART III Item 10. Directors and Executive Officers of the Registrant Item 11. Executive Compensation Item 12. Security Ownership of Certain Beneficial Owners and Management Item 13. Certain Relationships and Related Transactions
PART IV Item 14. Exhibits, Financial Statement Schedules, and Reports on Form 8-K
SIGNATURES Consolidated Balance Sheets Consolidated Statements of Income Consolidated Statements of Shareholders’ Equity Consolidated Statements of Cash Flows
Exhibit 10.13 Exhibit 21.1 Exhibit 23.1

Table of Contents
IXIA
FORM 10-K
TABLE OF CONTENTS
2
Page
PART I Item 1. Business 3 Item 2. Properties 14 Item 3. Legal Proceedings 14 Item 4. Submission of Matters to a Vote of Security Holders 15
PART II Item 5. Market for Registrant’s Common Equity and Related Shareholder Matters 15 Item 6. Selected Financial Data 16 Item 7. Management’s Discussion and Analysis of Financial Condition and Results of Operations 17 Item 7A. Quantitative and Qualitative Disclosures About Market Risk 33 Item 8. Financial Statements and Supplementary Data 33 Item 9. Changes in and Disagreements with Accountants on Accounting and Financial Disclosure 33
PART III Item 10. Directors and Executive Officers of the Registrant 33 Item 11. Executive Compensation 33 Item 12. Security Ownership of Certain Beneficial Owners and Management 33 Item 13. Certain Relationships and Related Transactions 33
PART IV Item 14. Exhibits, Financial Statement Schedules, and Reports on Form 8-K 34 SIGNATURES 38

Table of Contents
PART I
Item 1. Business
Overview
We are a provider of systems that allow our customers to measure the performance of their data communications equipment and networks. Our systems generate and analyze data traffic, including Voice over IP traffic, which sends voice communication over data networks using a protocol known as the Internet Protocol, or IP. The networks our systems analyze include advanced optical networks, such as Packet Over SONET networks, which transmit packets of information over high-speed optical networks. Other networks include Gigabit Ethernet networks, which carry data traffic over optical fiber as well as over electrical cable and are typically used within a single building or a group of buildings. In the year ended December 31, 2001, optical interface cards accounted for 61.6% of our net revenues. Our systems are highly modular, scalable and easy to use.
Since our inception in May 1997, we have sold our systems to approximately 370 customers. Based on revenues for the year ended December 31, 2001, our largest customers by category include:
We intend to expand our business by focusing on high-growth markets such as advanced optical networks which route data traffic throughout the Internet, as well as networks that provide high-speed access to the Internet, known as broadband access networks. We intend to maintain our focus on technology leadership, expanding and further penetrating our customer base and expanding our international presence.
The Increasing Need for Network Analysis and Measurement
The performance of the Internet and other networks such as local, metropolitan and wide area networks and the analysis and measurement of their performance are important to the following groups:
3
• Leading network equipment manufacturers such as Cisco Systems, Intel, Extreme Networks and CIENA; • Internet and network service providers such as AT&T, Qwest, WorldCom and Verizon; • Communications chip manufacturers such as Broadcom and National Semiconductor; and • Network users such as Wells Fargo Bank and Home Depot.
• Network Users . Network users such as large corporations increasingly use specialized systems in order to verify that they are receiving the level of service that they have contracted to receive from Internet and network service providers. They also increasingly use these systems to measure the performance of equipment before deployment in the network.
• Internet and Network Service Providers . Internet and network service providers seek to provide network users with the high quality
network services they demand. Failure to provide satisfactory service can be costly and may result in the loss of customers. To ensure these desired service levels are met, Internet and network service providers must verify the performance of network equipment and systems prior to deployment and during operation. In addition, as more complex network and transmission protocols are developed and implemented, the need to measure live system performance will increase.
• Equipment Manufacturers . To meet the higher standards specified by network operators and end users, equipment manufacturers who
provide infrastructure equipment and systems must ensure the quality of their products during development and manufacturing and prior to shipping. Failure to ensure the consistent performance of their products may result in the loss of customers, increased research and development costs, customer service charges and losses resulting from the return of products.

Table of Contents
The following characteristics are used to evaluate the performance of network infrastructure equipment and systems:
Characteristics Demanded of Network Performance Analysis and Measurement Equipment
Performance requirements of network equipment and systems are becoming increasingly demanding. As a result, precise performance verification is becoming more important throughout the design, development, production, deployment and operation of network equipment and systems. Because this performance verification must take place across multiple layers of the network infrastructure and across all optical and electrical technologies, network performance verification systems are required to be highly flexible and modular. In order to address multi-port switches and routers, performance verification systems must also be highly scalable and capable of generating and analyzing large amounts of data at high speeds over increasingly complex configurations. The rapid evolution of complex network technologies and protocols, including the emergence of new, highly complex protocols such as Packet Over SONET and Gigabit Ethernet, has also resulted in the need for performance verification systems that are easy to use with minimal training and set-up.
The Ixia Solution
We are a provider of multi-port traffic generation and performance analysis systems for the high-speed data communications market, including the Internet infrastructure and local, metropolitan and wide area networks. Our systems address the need for accurate and reliable performance verification of optical and electrical networks. The optical and electrical interfaces these networks use include Packet Over SONET OC-192c, OC-48c, OC-12c and OC-3c, 10 Gigabit Ethernet, Gigabit Ethernet, 10/100 megabits per second Ethernet and USB. Our systems meet the requirements of a wide variety of customers, including network equipment manufacturers, Internet and network service providers, communications chip manufacturers and network users.
Our systems provide the following key benefits to our customers:
High Performance. Our systems generate and receive data traffic at wire speed, which is the maximum rate that data traffic can be transmitted over the network. Our systems provide accurate analysis across multiple layers of the overall network and of individual network components in real-time, that is, as the transmission is actually occurring. Our systems can be configured to generate either packets of data or pseudo random bit streams. When configured to generate packets of data, our systems analyze each discrete packet of information on a packet-by-packet basis, allowing our customers to precisely measure the performance of their networks and individual network
4
• Communications Chip Manufacturers . Communications chip manufacturers require equipment to evaluate and analyze the performance of their chips during the design and development phase.
• Throughput is the maximum rate at which a network device or network can transmit distinct units of data, called packets, without loss of packets;
• Latency is the time that it takes a packet to travel through a network device or network; • Loss is the percentage of packets lost during transmission through a network device or network; • Jitter is the variation in the time intervals between packets transmitted through a network device or network; • Integrity checking confirms that the user information transmitted through a network device or network has not been corrupted; and • Sequence checking verifies that packets are received in the same order in which they were sent through a network device or network.

Table of Contents
components. This precision allows customers to accurately measure critical quality of service parameters such as throughput, latency, loss and jitter and check data integrity and packet sequence throughout the network, as well as to locate various network problems. When configured to generate pseudo random bit streams, our systems analyze each individual bit to measure the bit error rate of test sequences, allowing our customers to precisely measure critical physical transport characteristics of their networks. Our systems also allow users to precisely repeat complex test scenarios in order to evaluate the impact of changes made to network equipment and systems.
Highly Scalable. Each of our interface cards provides one or more ports through which our systems generate and receive data traffic. Our customers can easily increase port density, which is the number of ports in an individual chassis, by inserting additional interface cards. By connecting multiple chassis and synchronizing up to thousands of ports to operate simultaneously, our customers can simulate large-scale networks. We believe that our systems offer our customers the highest port density and therefore the most scalable systems available. In addition, our client server architecture allows multiple users in the same or different geographic locations to simultaneously access and operate different interface cards contained in the same chassis without affecting one another.
Highly Modular. Our hardware products consist of stackable and portable chassis, which can be configured, with any mix of up to 16 of our optical and electrical interface cards. This modular design allows our customers to quickly and easily create complex and custom test configurations. Our systems also allow for the convenient integration of additional network technologies into existing systems through the addition of specific interface cards.
Flexibility. Our customers can easily reconfigure our systems to address changing technologies, protocols and applications without changing system hardware or replacing interface cards. For example, a customer can reconfigure our systems through software changes downloaded from our Web site. A customer might download these changes to test new network protocols or types of equipment.
Ease of Use. We have designed our systems so that users can install and operate them with minimal training and set-up. Our systems are easy to use and offer our customers a wide range of readily accessible pre-designed test configurations. These tests include industry standard and application-specific tests. Users can easily configure and operate our systems to generate and analyze data traffic over any combination of interface cards or ports through our graphical user interface that features a familiar Microsoft Windows point-and-click environment. Our systems also support the commonly used tool command programming language, or Tcl, software which allows users to create custom and automated testing applications tailored to meet their specific requirements.
Strategy
Our objective is to be the industry leader in multi-port traffic generation and performance analysis systems for the high-speed data communications market, including the Internet infrastructure and local, metropolitan and wide area networks. Key elements of our strategy to achieve this objective include the following:
Continue to Expand Our Addressable Markets. We plan to further expand our addressable markets into areas of network growth, such as metropolitan area networks, content-aware routing and switching, and real-time monitoring, characterization and optimization of live networks. We believe that we can leverage our core competencies in high-speed transmission protocols into leadership positions as these markets expand and mature.
Maintain Focus on Technology Leadership. We intend to continue to focus on research and development in order to maintain our technology leadership position and to offer performance analysis systems that address new and evolving network technologies. We intend to maintain an active role in industry standards committees such as the Internet Engineering Task Force and to continue our active involvement in industry forums such as the 10 Gigabit Ethernet Alliance. We also plan to continue to work closely with customers who are developing emerging network technologies, including Cisco Systems, Extreme Networks, CIENA and Intel, as well as leading edge start-up companies, to enhance the performance and functionality of our existing systems and to design future products that specifically address our customers’ needs as they evolve.
Expand and Further Penetrate Customer Base. We plan to strengthen and further penetrate our existing customer relationships, particularly those with network equipment manufacturers and Internet and network service
5
Table of Contents
providers, and to pursue sales to new customers. For example, AT&T and Qwest currently use our systems to verify the performance and reliability of network equipment before deployment. We believe we have the potential to increase sales to Internet and network service providers as they focus on maximizing their return on investment from existing networks as well as from new networks being deployed by utilizing our Ixia NetOps suite of service turn-up, performance monitoring and traffic optimization products. We plan to strengthen our customer relationships and to expand our customer base by:
We also plan to continue our focus on customer support by maintaining and expanding the capabilities of our highly qualified and specialized internal customer engineering group. This group of technically trained professionals provides our customers with extensive support and assistance, including assistance with customized requirements and on-site training and support.
Perform key technology acquisitions. We plan to continue our strategy of acquiring key technologies that expand our product offering, address urgent customer needs, and fill gaps in our existing product portfolio. These acquisitions will be made in the form of partnering with other industry leaders, acquiring product lines, or merging with or acquiring other companies.
Expand International Market Presence . We plan to pursue sales in key international markets, including Europe and the Asia Pacific region. In order to pursue sales in these markets, we intend to continue to develop and expand our relationships with key customers and distributors. In April 2001, we established a sales support office based in Shanghai, China.
Products
Our product line is made up of network traffic generation and performance analysis systems that simulate large-scale networks. Our systems consist of interchangeable optical and electrical interface cards, multi-slot chassis, which are metal cases that incorporate a computer, a power supply and a backplane, which is a hardware component used to connect the interface cards to the computer. The interface cards generate, receive and analyze data traffic. The software for these systems includes management software and application-specific test suites.
The operator can utilize our analysis systems in either test labs or within networks. Our systems are operated through standard computer peripheral devices. These devices include a monitor, keyboard and mouse. The operator of our systems sets up test parameters for the performance analysis by inputting data using the keyboard and mouse. The operator observes the results of the performance analysis using the monitor.
The operator configures our systems based on the specific interfaces of the network equipment being tested. For example, if the operator wanted to analyze the performance of a router with Ethernet interfaces, the operator would insert Ethernet interface cards into our system.
Chassis
Our primary chassis, the IXIA 1600T and the IXIA 400, are highly scalable and can be configured with any combination of optical and electrical interface cards. Any mix of up to 256 IXIA 1600Ts and IXIA 400s can be linked together and time-synchronized to support a diverse range of complex test configurations. The IXIA 1600T is a 19-inch rack-mountable 16-slot chassis, and the IXIA 400 is a compact portable four-slot chassis.
6
• developing and offering new and innovative systems that meet our existing and potential customers’ needs; • expanding our sales and marketing efforts; and • building our reputation and brand name recognition.

Table of Contents
Our highest port density chassis, the Optixia, also can be configured with any combination of optical and electrical interface cards and can be similarly linked together and time-synchronized with other chassis. The Optixia is a 19-inch rack-mountable 10-slot chassis which can support up to 480 ports of 10/100 megabits per second Ethernet.
For our Ixia NetOps product suite, we also offer the IXIA 100 chassis which features an integrated global positioning system, or GPS, receiver that provides a precise time stamp for each packet that it generates. Internet service providers are able to deploy IXIA 100 chassis in multiple geographic locations in their networks and synchronize all of these chassis by utilizing the GPS-provided time stamp. By doing so, they are able to accurately validate network performance and measure the quality of service parameters specified in service level agreements with their customers. We also offer the IXIA 150 traffic generation and collection agent, a powerful dual-processor platform that collects routing and traffic flow information from deployed networks.
Interface Cards
Each one of our optical and electrical interface cards contains from one to eight independent traffic generation and analysis ports. These ports operate at wire speed, the maximum rate that data traffic can be transmitted over the network. Each port on each interface card has a unique transmit stream engine that is used to generate either packets of information or pseudo random bit streams, and a real-time receive analysis engine capable of analyzing the packets or bit streams as they are being received. The transmit stream engine generates millions of Internet protocol data packets or continuous test sequences at wire speed that are transmitted through the network and received by the analysis engine. When data packets have been generated, the analysis engine then measures throughput, latency, loss and jitter, and checks data integrity and packet sequence on a packet-by-packet basis. When bit streams have been generated, the analysis engine measures the bit error rate of test sequences. In addition, our systems measure the effectiveness of networks in prioritizing different types of traffic. Our 10/100 megabits per second Ethernet interfaces also include a processor per port that is used to generate and analyze sophisticated routing protocols, such as MPLS and OSPF as well as web traffic such as TCP/IP and HTTP.
The following tables describe our optical and electrical interface cards. In the “Optical Interface Cards” table, the “Fiber Type” column distinguishes between optical interface cards capable of transmitting data traffic over distances typically longer than one kilometer, known as single-mode cards, and optical interface cards used for transmitting data traffic over distances typically shorter than one kilometer, known as multi-mode cards. In both the “Optical Interface Cards” table and the “Electrical Interface Cards” table, the “Transmission Speed” column identifies the speed at which data is sent out of and received by each port on the interface cards, and the “Number of Ports per Interface Card” column identifies how many ports are contained on a single card.
Optical Interface Cards
7
Our Product Names Fiber Type Transmission Speed Number of Ports per
Interface Card
Packet Over SONET/SDH OC-12c/3c Multi -mode 622/155 Mbps 2 OC-12cSM/3cSM Single-mode 622/155 Mbps 2 OC-48c Single-mode 2.488 Gbps 1 OC-192c Single-mode 9.953 Gbps 1 or 2 Bit Error Rate Testing OC-48c Single-mode 2.488 Gbps 1 OC-192c Single-mode 9.953 Gbps 1 or 2 10 Gigabit Ethernet 10GBASE-R Single-mode 10.3 Gbps 1 10GBASE-W Single-mode 9.953 Gbps 1 XENPAK (with modular Multi -mode fiber-type transceivers) Single-mode 10.3 Gbps 1

Table of Contents
Optical Interface Cards (continued)
Electrical Interface Cards
System Management Software
Our systems are managed through graphical user interfaces which consist of two proprietary applications and the commonly used tool command language, or Tcl, programming environment. Our graphical user interfaces allow users to configure our hardware chassis and interface cards in order to generate and analyze traffic. In addition, our graphical user interfaces allow our users to execute a variety of industry standard and application-specific tests written by us. Tcl allows users to create custom and automated test applications tailored to meet their specific requirements.
Application Specific Test Suites
We have a large suite of software applications that measure equipment and network performance, including throughput, latency, loss, jitter, integrity checking and sequence checking. These measurements allow network equipment manufacturers and Internet and network service providers to evaluate the performance of the equipment before and after the equipment is deployed in a network. These performance measurements also allow network users and Internet and network service providers to validate network performance and to verify that the requirements of service level agreements, or SLAs are being met. Our application-specific test suites include the following:
Internet Backbone Router Tester. Our Internet Backbone Router Tester offers a complete system for validation of advanced routers that route data traffic throughout the Internet and are being deployed by Internet service providers. It provides the ability to generate and receive data traffic at wire speed. The Internet Backbone Router Tester provides an integrated mix of Packet Over SONET and Gigabit Ethernet interfaces. Utilizing routing protocol emulation software based on BGP-4 and OSPF, both standard industry routing protocols, our tester can simulate the data traffic of millions of users to automatically configure the routing table within a single router or within a network of routers. Our system thereby provides performance and reliability testing of the router or network of routers in realistic conditions.
Cable Modem Automated Test Suite. Our Cable Modem Automated Test Suite addresses many of the verification requirements of cable modem and cable modem termination system vendors to obtain Data Over Cable
8
Our Product Names Fiber Type Transmission Speed Number of Ports per
Interface Card
Gigabit Ethernet 1000LX Single-mode 1.25 Gbps 2 1000SX Multi -mode 1.25 Gbps 2 1000GBIC (with modular Multi -mode fiber-type transceivers) Single-mode 1.25 Gbps 2 Ethernet and Fast Ethernet 100FX Multi -mode 100 Mbps 4
Our Product Names Transmission Speed Number of Ports per
Interface Card
10 Gigabit Ethernet XAUI 10.3 Gbps 1 Gigabit Ethernet 1000T5 10/100/1000 Mbps 2 Ethernet and Fast Ethernet 100TX 10/100 Mbps 4 100TXS 10/100 Mbps 8 Ethernet and Universal Serial Bus USB1 10/12 Mbps 4

Table of Contents
Service Interface Specifications, or DOCSIS, certification for their equipment from CableLabs, a cable industry organization, and from EuroDOCSIS, the European cable standards organization.
Benchmarking Methodology for Network Interconnect Devices (RFC-2544) Test Suite . Our RFC-2544 Test Suite offers the complete benchmarking validation tests defined by the Internet Engineering Task Force’s Request for Comments 2544. These tests include throughput, latency and loss tests. These tests can be readily applied to any device or network utilizing any mix of Packet Over SONET, 10 Gigabit Ethernet, Gigabit Ethernet or 10/100 megabits per second Ethernet interfaces. These tests provide the basic industry accepted benchmarking metrics to qualify a router or switch before network deployment.
LAN Switching Devices (RFC-2285) Test Suite . Our RFC-2285 Test Suite complements our RFC-2544 Test Suite by offering a number of additional tests to qualify the behavior of switching devices for local area networks. These tests can be readily applied to any device or network utilizing any mix of 10 Gigabit Ethernet, Gigabit Ethernet and 10/100 megabits per second Ethernet interfaces.
Quality of Service (QoS) Test Suite. Our Quality of Service, or QoS, Test Suite offers a comprehensive set of tools designed to verify how effectively a router distinguishes between different types of data traffic and then routes the traffic through the network based on those distinctions. The QoS routing technique assigns a higher priority to some traffic types and a lower priority to other traffic types, which enables a user to determine the quality of service of a given traffic type. This test suite supports many combinations of Packet Over SONET, 10 Gigabit Ethernet, Gigabit Ethernet and 10/100 megabits per second Ethernet interfaces.
IP Multicast Test Suite . IP Multicast is a protocol that allows a single computer to distribute data traffic to multiple recipients. For example, a single Web server could transmit an audio or video broadcast to millions of users simultaneously. Our IP Multicast Test Suite provides a comprehensive set of tests designed to evaluate the behavior of Internet protocol multicast routers, switches and networks. This test suite supports Packet Over SONET, 10 Gigabit Ethernet, Gigabit Ethernet and 10/100 megabits per second Ethernet interfaces.
IxWeb Web Stress Test Suite. The IxWeb Web Stress Test Suite offers large scale traffic generation and analysis designed to verify the behavior and performance of application aware routers, web switches and server load balancers through the establishment of millions of concurrent transmission control protocol, or TCP, sessions, from thousands of simulated users and servers. This test suite is supported on our 10/100 megabits per second Ethernet interface cards with local processor per port.
Ixia NetOps Network Monitoring and Optimization Test Suite. The Ixia NetOps suite of products is designed to monitor and optimize the performance of deployed networks. The Ixia NetOps suite includes a service turn-up application that helps service providers deploy managed Ethernet and Gigabit Ethernet networks. Ixia NetOps also includes monitoring applications that allow carriers and service providers to measure and enforce service level agreements, or SLAs. The suite also includes a traffic optimization application that analyzes the network cost of peering agreements between service providers. The Ixia NetOps products utilize the IXIA 150 traffic generation and collection agent, and support many combinations of Packet Over SONET, 10 Gigabit Ethernet, Gigabit Ethernet and 10/100 megabits per second Ethernet interfaces.
Products in Development
We are currently developing a number of new products, which we plan to introduce to the market within the next several months. These new products include multi-rate Bit Error Rate Test, or BERT, interface cards, a Gigabit per second Ethernet interface card with a processor per port, and a 40 Gigabit per second BERT interface card.
We may delay or cancel the introduction of these, or any other, new products to the market as a result of a number of factors, some of which are beyond our control. For more information regarding these factors, see “Business — Research and Development” on page 13 and “Risk Factors — If we are unable to successfully introduce new products to keep pace with the rapid technological changes that characterize our market, our results of operations will be significantly harmed “ on page 24.
9

Table of Contents
Technology
The design of all of our systems requires a combination of sophisticated technical competencies, including design of field programmable gate arrays, or FPGA’s, which are integrated circuits that can be repeatedly reprogrammed to perform different sets of functions as required. The design of all of our systems also requires high-speed digital hardware design, software engineering and optical and mechanical engineering. We have built an organization of professional staff with skills in all of these areas. The integration of these technical competencies enables us to design and manufacture performance analysis systems with optical and electrical interfaces and easy-to-use user interface software meeting the needs of our customers.
Complex Logic Design . Our systems use field programmable gate arrays that are programmed by the host personal computer and therefore can be reconfigured for different applications. Our newest products have clock frequencies, which are the timing signals that synchronize all components within our system, of up to 300 megahertz, and logic densities, which are the number of individual switching components, or gates, of more than one million gates per chip. Our customers can download new features and enhancements from our Web site using a Web browser that runs on our system, thereby allowing rapid updates of the system. Almost all of our logic is designed in VHDL hardware description language, which is a unique programming language tailored to the development of logic chips. This language enables the easy migration of the hardware design to application specific integrated circuits as volumes warrant. We develop VHDL code in a modular fashion for reuse in logic design, which comprises a critical portion of our intellectual property. This reusable technology allows us to reduce the time-to-market for our new and enhanced products.
Software Technology . We devote substantial engineering resources to the development of software technology for use in our product lines. We have developed software to control our systems, analyze data collected by our systems, and monitor, maintain and self-test our hardware and field programmable gate array subsystems. A majority of our software technology and expertise is focused on the use of object-oriented development techniques to design software subsystems that can be reused across multiple product lines. These objects are client and server independent allowing for distributed network applications. This software architecture allows all of the software tools developed for our existing products to be utilized in all of our new products with very little modification. Another important component of our software technology is our graphical user interface design. Customer experience with our test products has enabled us to design a simple yet effective method to display complex configurations in clear and concise graphical user interfaces for intuitive use by engineers.
Customers
During the period from our inception in May 1997 through December 31, 2001, we shipped our systems to over 370 customers. No customer other than Cisco Systems accounted for more than 10% of our net revenues in 2001 or 2000. Our five largest customers collectively accounted for 37.2% of our net revenues in 2001 and 48.3% of our net revenues in 2000. To date, we have sold our systems primarily to network equipment manufacturers.
Our customers may reduce or discontinue their purchases at any time.
Customers who purchased more than $250,000 of our products during the 12-month period ended December 31, 2001 included:
10

Table of Contents
Competition
The market for network performance measurement and analysis systems for use in the high-speed data communications industry is highly competitive, and we expect this competition to increase in the future. We currently compete with test equipment manufacturers such as Agilent Technologies and Spirent Communications. We also compete with start-up companies, such as Antara and gnubi, which are focused on network performance measurement. In the network monitoring and optimization market, we expect to compete with test equipment manufacturers such as EXFO as well as with start-up companies, such as Brix and Adlex. In addition, we compete with network equipment manufacturers that have developed or may develop in-house performance analysis products for their own use or for sale to others.
We believe that the principal competitive factors in our market include:
We believe that we compete favorably in the key competitive factors that impact our markets, including technical expertise, new product introductions and product features, services and support. We intend to remain competitive through ongoing research and development efforts to enhance existing systems and to develop new systems. We will also seek to expand our market presence through marketing and sales efforts. However, our market is still evolving and we may not be able to compete successfully against current or future competitors.
We expect competition to increase significantly from existing providers of network performance measurement and analysis products and from companies that may enter our existing or future markets. These companies may develop similar or substitute solutions that may be more cost-effective or provide better performance or functionality than our systems. Also, as we broaden our product offerings, we may move into new markets in which we will have to compete against companies already established in those markets. Some of our existing and
11
Alcatel Genuity ONI Systems Allied Telesyn International Hewlett Packard Qwest AT&T IBM Redback Networks Atoga Systems Intel Riverstone Networks BellSouth Jedai Broadband Networks Samsung Electronics Broadcom Juniper Networks Sprint Cable & Wireless Lantern Communications Tellium Caspian Networks Lucent Technologies Terabeam CIENA LuxN Terayon Communications Systems Cisco Systems Mahi Networks Unisphere Networks Electro Rent Maple Optical Systems Verizon Enterasys Networks Network Elements Vivace Networks EPIK Communications Nexsi World Wide Packets Extreme Networks Nokia WorldCom Force10 Networks Nortel Networks Zaffire Foundry Networks
• timeliness of new product introductions; • product quality, reliability and performance; • ease of installation, integration and use; • breadth of product offerings and features; • price and overall cost of product ownership; • customer service and technical support; and • company reputation and size.

Table of Contents
potential competitors have longer operating histories, significantly greater financial, marketing, service, support, technical and other resources, significantly greater name recognition and a larger installed base of customers than we do. In addition, many of our competitors have well established relationships with our current and potential customers and have extensive knowledge of our industry. It is possible that new competitors or alliances among competitors will emerge and rapidly acquire market share. Moreover, our competitors may consolidate with each other, or with other companies, giving them even greater capabilities with which to compete against us.
To be successful, we must continue to respond promptly and effectively to the challenges of changing customer requirements, technological advances and competitors’ innovations. Accordingly, we cannot predict what our relative competitive position will be as the market evolves for network performance measurement and analysis systems.
Sales, Marketing and Technical Support
Sales . Our direct sales force and manufacturers’ representatives market and sell our systems primarily in the United States. Our distributors market and sell our systems primarily outside of the United States. Our net revenues from international product shipments were $13.3 million in 2001, $12.1 million in 2000 and $3.2 million in 1999. Our direct sales force maintains close contact with our customers and provides technical support to our manufacturers’ representatives and distributors.
Marketing . We have a number of marketing programs to support the sale and distribution of our systems and to inform existing and potential customers and our manufacturers’ representatives and distributors about the capabilities and benefits of our systems. Our marketing efforts also include promoting our business in the following ways:
Technical Support . We maintain a technically knowledgeable and responsive customer service and support staff that is critical to our development of long-term customer relationships. This highly qualified and specialized internal customer engineering group:
Manufacturing
Our manufacturing operations consist primarily of materials planning and procurement, quality control, logistics, final assembly and testing and distribution. We outsource the manufacture and assembly of printed circuit boards to third party contract manufacturers and assembly companies. This manufacturing process enables us to operate without substantial space and personnel dedicated to manufacturing operations. As a result, we can conserve a significant portion of the working capital and capital expenditures that would be required for funding inventory and manufacturing processes.
12
• participating in industry trade shows and technical conferences; • sponsoring technical seminars that highlight our solutions; • advertising in trade journals; and • communicating through our corporate Web site.
• offers our customers customized solutions for their performance validation needs; • develops custom applications at our company headquarters; • can be deployed to customer sites on short notice; and • provides our customers with the training necessary to optimally utilize our systems.
Table of Contents
We are dependent upon sole or limited source suppliers for key components and parts used in our systems, including field programmable gate arrays, chips, oscillators and optical modules. We and our contract manufacturers purchase components through purchase orders and have no guaranteed or long-term supply arrangements with our respective suppliers. In addition, the availability of many components is dependent in part on our ability and the ability of our contract manufacturers and assembly companies to provide suppliers with accurate forecasts of future requirements. Any extended interruption in the supply of any of the key components currently obtained from a sole or limited source, or delay in transitioning to a replacement supplier’s product or replacement component into our systems could disrupt our operations and significantly harm our business in any given period.
Lead times for materials and components ordered by us and by our contract manufacturers vary and depend on factors such as the specific supplier, contract terms and demand for a component at a given time. We and our contract manufacturers acquire materials, complete standard subassemblies and assemble fully-configured systems based on sales forecasts and historical purchasing patterns. If orders do not match forecasts or substantially deviate from historical patterns, we and our contract manufacturers may have excess or inadequate inventory of materials and components.
Research and Development
We believe that research and development is critical to our business. We focus our research and development efforts on developing new products and on further enhancing existing products. Our development efforts include anticipating and addressing the performance analysis needs of network equipment manufacturers, Internet and network service providers, communications chip manufacturers and network users and focusing on emerging high growth network technologies.
Our future success depends on our ability to continue to enhance our existing products and to develop products that address the needs of our customers. We closely monitor changing customer needs by communicating and working directly with our customers and distributors. We also receive input from active participation in industry groups responsible for establishing technical standards.
Development schedules for technology products are inherently difficult to predict, and we cannot assure you that we will introduce any proposed new products in a timely fashion. Also, we cannot assure you that our product development efforts will result in commercially successful products or that our products will not contain software errors or other performance problems or be rendered obsolete by changing technology or new product announcements by other companies.
We plan to continue to make significant investments in research and development. Our research and development expenditures, excluding stock-based compensation, were $13.4 million in 2001, $7.2 million in 2000 and $2.8 million in 1999.
Intellectual Property and Proprietary Rights
Our success and ability to compete is dependent in part upon our ability to protect and maintain our proprietary rights to our intellectual property. We currently rely on a combination of trademark, trade secret and copyright laws and restrictions on disclosure to establish and protect our intellectual property. We also expect to rely on patents to protect some of our proprietary technology. We have filed applications for four U.S. patents but cannot assure you that the patents will be issued or that the patents will be upheld if they are issued. We also cannot assure you that such patents, if issued, will be effective in protecting our proprietary technology. We have registered our Ixia logo and other Ixia trademarks in the United States and have filed for registration of several trademarks in other jurisdictions. We are also in the process of filing applications for registration of additional Ixia trademarks.
We generally enter into confidentiality agreements with our officers, employees and consultants. We also generally limit access to and distribution of our source code and further limit the disclosure and use of other proprietary information. However, these measures provide only limited protection of our intellectual property rights. In addition, we may not have signed agreements containing adequate protective provisions in every case, and the
13

Table of Contents
contractual provisions that are in place may not provide us with adequate protection in all circumstances. Further, we have not included copyright notices on all of our copyrightable intellectual property.
Despite our efforts to protect our proprietary rights, unauthorized parties may attempt to copy or otherwise obtain or use technology that we regard as proprietary. We cannot assure you that the steps taken by us to protect our proprietary rights will be adequate to prevent misappropriation of our technology or that our competitors will not independently develop technologies that are similar or superior to our technology. In addition, the laws of some foreign countries do not protect our proprietary rights to the same extent as do the laws of the United States. Any infringement of our proprietary rights could result in significant litigation costs, and any failure to adequately protect our proprietary rights could result in our competitors offering similar products, potentially resulting in loss of competitive advantage and decreased revenues. Litigation may be necessary to enforce our intellectual property rights or to determine the validity and scope of the proprietary rights of others. Litigation of this type could result in substantial costs and diversion of resources and could significantly harm our business.
The data communications industry is characterized by the existence of a large number of patents and frequent litigation based on allegations of patent infringement. From time to time, third parties may assert patent, copyright, trademark and other intellectual property rights to technologies that are important to our business. We have not conducted a search to determine whether the technology we have in our products infringes or misappropriates intellectual property held by third parties. In addition, because patent applications in the United States are not publicly disclosed until the patent is issued, applications may have been filed which could relate to our products. Any claims asserting that our systems infringe or may infringe proprietary rights of third parties, if determined adversely to us, could significantly harm our business.
Employees
As of December 31, 2001 we had 204 full-time employees. We also from time to time hire temporary and part-time employees and independent contractors. Our future performance depends, to a significant degree, on our continued ability to attract and retain highly skilled and qualified technical, sales and marketing and senior management personnel. Our employees are not represented by any labor unions. We consider our relations with our employees to be good.
Business Risk Factors
The statements that are not historical facts contained in the above “Business” discussion in this Item 1 are forward-looking statements within the meaning of the Private Securities Litigation Reform Act of 1995 and reflect the current belief, expectations or intent of the Company's management. These statements are subject to and involve certain risks and uncertainties. See “Management’s Discussion and Analysis of Financial Condition and Results of Operations — Risk Factors” in Item 7 of this Annual Report on form 10-K.
Item 2. Properties
Our corporate headquarters are located in Calabasas, California, where currently we lease an approximately 50,000 square-foot facility which houses our research and development, sales and marketing, finance and administration and manufacturing operations. The lease expires in May 2007. We also lease office space for our sales offices in Santa Clara, California and Richardson, Texas and for our sales support offices in the United Kingdom and China. We also lease research and development facilities in Ann Arbor, Michigan. We believe that our current facilities will be adequate to meet our needs for at least the next 12 months, and that we will be able to obtain additional space when and as needed on acceptable terms.
Item 3. Legal Proceedings
None
14

Table of Contents
Item 4. Submission of Matters to a Vote of Security Holders
None
PART II
Item 5. Market For Registrant’s Common Equity and Related Shareholder Matters
Ixia’s common stock has traded on the Nasdaq National Market since October 18, 2000 under the symbol “XXIA.” The following table sets forth the high and low closing sales prices of our common stock as reported on the Nasdaq National Market.
On March 5, 2002 the closing sales price reported for our common stock was $7.99 per share, and as of that date there were approximately 51 shareholders of record.
We have never declared or paid cash dividends on our common stock and do not anticipate paying any dividends in the foreseeable future.
15
High Low
2000 Fourth quarter (from October 18, 2000) $ 30.75 $ 16.00 2001 First quarter $ 35.56 $ 11.25 Second quarter 20.00 10.25 Third quarter 15.60 5.45 Fourth quarter 14.00 5.90

Table of Contents
Item 6. Selected Financial Data
The following selected consolidated financial data should be read in conjunction with “Management’s Discussion and Analysis of Financial Condition and Results of Operations” and our consolidated financial statements and the notes to those consolidated financial statements. The statement of income data set forth below for the years ended December 31, 2001, 2000 and 1999 and the balance sheet data as of December 31, 2001 and 2000 are derived from, and are qualified by reference to, the Company’s audited consolidated financial statements included elsewhere in this Annual Report on Form 10-K. The statement of income data for the years ended December 31, 1998 and 1997 and the balance sheet data as of December 31, 1999, 1998 and 1997 are derived from audited financial statements not included herein, but which were previously filed with the SEC.
16
May 27, 1997 (Inception) Year Ended December 31, through
December 31, 2001 2000 1999 1998 1997
Statement of Income Data (in thousands, except per share data):
Net revenues $ 77,157 $ 76,044 $ 24,499 $ 4,916 $ — Cost of revenues(1) 16,610 14,825 4,944 1,309 — Gross profit 60,547 61,219 19,555 3,607 — Operating expenses(1): Research and development 19,412 14,421 3,449 1,672 513 Sales and marketing 19,557 17,411 4,892 1,002 — General and administrative 8,643 8,709 2,389 509 110 Total operating expenses 47,612 40,541 10,730 3,183 623 Income (loss) from operations 12,935 20,678 8,825 424 (623 ) Interest income, net 4,035 1,552 88 14 7 Income (loss) before income taxes 16,970 22,230 8,913 438 (616 ) Income tax expense (benefit) 7,221 14,245 4,103 118 (294 ) Net income (loss) $ 9,749 $ 7,985 $ 4,810 $ 320 $ (322 ) Earnings (loss) per share: Basic $ 0.18 $ 0.17 $ 0.11 $ 0.01 $ (0.01 ) Diluted $ 0.16 $ 0.15 $ 0.10 $ 0.01 $ (0.01 ) Weighted average number of common and common
equivalent shares outstanding: Basic 54,550 47,244 43,574 43,200 43,041 Diluted 61,977 53,777 45,970 44,576 43,041
_____________________ (1) Stock-based compensation included in:
Cost of revenues $ 729 $ 948 $ 38 $ 8 $ — Research and development 6,055 7,182 669 92 — Sales and marketing 3,245 4,695 449 62 — General and administrative 2,159 3,807 729 — — $ 12,188 $ 16,632 $ 1,885 $ 162 $ —

Table of Contents
The following discussion contains forward-looking statements that involve risks and uncertainties. Our actual results could differ materially from those anticipated in these forward-looking statements as a result of many factors. The results of operations for the years ended December 31, 2001, 2000 and 1999 are not necessarily indicative of the results that may be expected for any future period. The following discussion should be read in conjunction with the consolidated financial statements and the notes thereto included in Item 8 of this Annual Report on Form 10-K and in conjunction with the “Risk Factors” described below.
Overview
We develop, market and sell high-speed, multi-port network performance analysis systems for advanced optical communications equipment and networks, as well as electrical communications equipment and networks. Our products address a broad range of network equipment and systems that are used throughout the Internet and local, metropolitan and wide area networks. Our products allow customers to generate network and Internet protocol traffic and analyze the performance, accuracy and reliability of equipment and systems that they either manufacture for sale to others or purchase for use in their own networks. Our customers include manufacturers of network equipment, Internet and network service providers, communications chip manufacturers and network users.
Our product offerings include a variety of interface cards, chassis that can hold up to 16 interface cards each and related software products. Our interface cards can generate traffic over a variety of optical and electrical interfaces such as Packet Over SONET and Gigabit Ethernet. The following table sets forth, for the periods indicated, our net revenues by principal product category in dollars and as a percentage of total net revenues:
Sales to our five largest customers collectively accounted for approximately $28.7 million, or 37.2%, of our net revenues in 2001, $36.7 million, or 48.3%, in 2000 and $12.5 million, or 51.0%, in 1999. To date, we have sold our systems primarily to network equipment manufacturers. While we expect that we will continue to have some customer concentration for the foreseeable future, we have sold our systems to a wide variety of customers. Through December 31, 2001, we had shipped our systems to approximately 370 customers. To the extent we develop a broader and more diverse customer base, we anticipate that our reliance on any one customer will diminish.
Net revenues . Our revenues consist primarily of product sales. The hardware and software components of our products are sold as an integrated system. The software component of our products does not require significant modification or customization, and our sales do not involve any significant future obligations or customer acceptance terms. Accordingly, revenue from product sales is recognized upon shipment. We warrant our products for one year after sale. At the time of sale we defer that portion of our revenues that relates to our post-contract support and recognize it ratably over the 12-month service period. Revenues from maintenance contracts are deferred and recognized ratably over the term of the contracts.
17
December 31,
2001 2000 1999 1998 1997
Balance Sheet Data (in thousands): Cash and cash equivalents $ 116,643 $ 96,066 $ 8,733 $ 1,124 $ 304 Working capital 128,206 104,025 7,500 1,232 691 Total assets 144,166 121,682 15,822 3,266 669 Total shareholders’ equity 137,821 108,051 8,610 1,760 578
Item 7. Management’s Discussion and Analysis of Financial Condition and Results of Operations
Year Ended December 31,
Products 2001 2000 1999
(in thousands, except percentages) Optical interface cards $ 47,564 61.6 % $ 46,132 60.7 % $ 12,672 51.7 % Electrical interface cards 18,905 24.5 21,222 27.9 8,757 35.8 Chassis, software and other products 10,688 13.9 8,690 11.4 3,070 12.5 Total $ 77,157 100.0 % $ 76,044 100.0 % $ 24,499 100.0 %

Table of Contents
Cost of Revenues . Our cost of revenues consists of materials, payments to third party manufacturers, salaries and related expenses for manufacturing personnel and the warranty cost of hardware to be replaced during the one-year warranty period. We outsource the majority of our manufacturing operations, and we conduct final assembly, supply chain management, quality assurance, documentation control and shipping at our facility. Accordingly, a significant portion of our cost of revenues consists of payments to our contract manufacturers. In addition, cost of revenues includes a non-cash component related to the amortization of deferred stock-based compensation allocated to manufacturing personnel.
Gross Margins . Excluding the effects of stock-based compensation, the gross margins of our various interface cards have generally been consistent and have exceeded the gross margins of our chassis. In general, our gross margins are primarily affected by the following factors:
Operating Expenses . We generally recognize our operating expenses as we incur them in three general operational categories: research and development, sales and marketing, and general and administrative.
Research and development expenses consist primarily of salaries and related personnel and consulting costs related to the design, development, testing and enhancements of our systems. We expense our research and development costs as they are incurred. We also capitalize and depreciate over a two-year period some costs of our systems used for internal purposes. We expect research and development expenses to increase as we seek to attain our strategic product development objectives and to meet changing customer requirements and technological advances.
Sales and marketing expenses consist primarily of salaries, commissions and related expenses for personnel engaged in sales and marketing and customer support functions, as well as costs associated with promotional and other marketing activities. We expect sales and marketing expenses to increase in line with revenue increases.
General and administrative expenses consist primarily of salaries and related expenses for executive, finance, human resources, information technology and administrative personnel, as well as recruiting and professional fees, insurance costs and other general corporate expenses, including rent. We expect modest sequential increases in general and administrative expenses as the Company continues to grow.
In connection with the grant of stock options and warrants and the sale of restricted stock, we recorded deferred stock-based compensation of $36.2 million in 2000 and $6.6 million in 1999. These amounts represent the difference between the deemed fair value of our common stock for accounting purposes and (1) the exercise price of the options or warrants at the date of grant or (2) the purchase price of the restricted stock. Deferred stock-based compensation is presented as a reduction of shareholders’ equity, with amortization recorded over the vesting period, which is typically four years. In 2001, we reduced the deferred stock-based compensation balance by $1.7 million as a result of the forfeitures of stock options and changes in the market value of the Company’s common stock that affected certain equity instruments which received variable accounting treatment. We amortized to the respective operating expense categories $12.2 million of deferred stock-based compensation in 2001, $16.6 million in 2000 and $1.9 million in 1999. Based on the unvested options, warrants and stock subject to repurchase as of December 31,
18
• the mix of our products sold; • the pricing we are able to obtain from our component suppliers and contract manufacturers; • new product introductions by us and by our competitors; • changes in our pricing policies and those of our competitors; • demand for our products; • production volume; and • the mix of sales channels through which our products are sold.

Table of Contents
2001 we expect to record additional stock-based compensation expense relating to deferred stock-based compensation approximately as follows: $6.1 million during 2002, $2.7 million during 2003 and $523,000 during 2004. The amount of deferred stock-based compensation expense to be recorded in future periods could decrease if options and stock subject to repurchase for which unearned compensation has been recorded are forfeited or repurchased. Changes in the market value of the Company’s common stock could also affect future stock-based compensation expense related to equity instruments, which receive variable accounting treatment.
Critical Accounting Policies and Estimates
Management’s discussion and analysis of financial condition and results of operations is based upon our consolidated financial statements, which have been prepared in accordance with accounting principles generally accepted in the United States of America. The preparation of these financial statements requires us to make estimates and judgments that affect the reported amounts of assets, liabilities, revenues and expenses, and related disclosure of contingent assets and liabilities. On an on-going basis, we evaluate our estimates, including those related to revenue recognition, allowance for doubtful accounts, allowance for obsolete inventory, deferred taxes, impairment of long-lived assets and contingencies and litigation. We base our estimates on historical experience and on various other assumptions that are believed to be reasonable under the circumstances, the results of which form the basis for making judgments about the carrying values of assets and liabilities that are not readily apparent from other sources. Actual results may differ from these estimates.
We apply the following critical accounting policies in the preparation of our consolidated financial statements:
19
• Revenue Recognition Policy . We recognize revenue as discussed in the “Overview” section. • Allowance for Doubtful Accounts . We maintain an allowance for doubtful accounts for estimated losses resulting from the inability of
our customers to make required payments. If the financial condition of our customers were to deteriorate, resulting in an impairment of their ability to make payments, additional allowances may be required.
• Allowance for Obsolete Inventory. We write down inventory for estimated obsolescence or unmarketable inventory equal to the
difference between the cost of inventory and the estimated market value based upon assumptions about future demand and market conditions. If actual future demand is less favorable than those projected by management, additional inventory write-downs may be required.
• Deferred Taxes . Deferred taxes are determined based on the differences between the financial statement and tax bases of assets and
liabilities, using enacted tax rates in effect for the year in which the differences are expected to reverse. Valuation allowances are established when necessary to reduce deferred tax assets to the amounts expected to be realized. In assessing the need for a valuation allowance we consider estimates of future taxable income and ongoing prudent and feasible tax planning strategies.
• Impairment of Long-Lived Assets . We evaluate the recoverability of our identifiable intangible assets, goodwill and other long-lived
assets in accordance with SFAS 121 which generally requires us to assess these assets for recoverability when events or circumstances indicate a potential impairment by estimating the undiscounted cash flows to be generated from the use and ultimate disposition of these assets. Upon implementation of SFAS 142 on January 1, 2002, we will use the fair value method to assess our goodwill annually and the undiscounted cash flows method will continue to be used for qualifying identifiable intangible assets and other long-lived assets.
• Contingencies and Litigation . We evaluate contingent liabilities including threatened or pending litigation in accordance with SFAS 5,
“Accounting for Contingencies” and record accruals when the outcome of these matters is deemed probable and the liability is reasonably estimable. We make these

Table of Contents
Results of Operations
The following table sets forth certain statement of income data as a percentage of net revenues for the periods indicated:
Comparison of the Years Ended December 31, 2001 and 2000
Net Revenues . In 2001, net revenues increased 1.5% to $77.2 million from the $76.0 million recorded in 2000. Net revenues in 2001 were positively affected by sales to new customers and the introduction of new product lines during the year. This increase was offset by a significant reduction in customer orders across all product lines due to the slowdown in the economy and in telecommunications spending. Sales to our five largest customers collectively accounted for approximately $28.7 million or 37.2% of our net revenues in 2001 compared to $36.7 million or 48.3% of net revenues in 2000.
Gross Profit . Gross profit decreased 1.1% to $60.5 million in 2001 from $61.2 million in 2000. Our gross margin decreased to 78.5% in 2001 from 80.5% in 2000. This decrease in gross margin primarily reflects changes in the product mix of products sold in 2001 as compared to 2000.
Research and Development Expenses. Research and development expenses increased to $19.4 million in 2001 from $14.4 million in 2000. Stock-based compensation included in research and development expense decreased to $6.1 million in 2001 from $7.2 million in 2000. Excluding stock-based compensation, research and development expense increased to $13.4 million in 2001 from $7.2 million in 2000. This increase was primarily due to higher compensation and related benefit costs as a result of the addition of engineering personnel and increased prototype costs associated with new product development.
Sales and Marketing Expenses. Sales and marketing expenses increased to $19.6 million in 2001 from $17.4 million in 2000. Stock-based compensation included in sales and marketing expense decreased to $3.2 million
assessments based on the facts and circumstances and in some instances based in part on the advice of outside legal counsel.
Year Ended December 31,
2001 2000 1999
Statement of Income Data: Net revenues 100.0 % 100.0 % 100.0 % Cost of revenues(1) 21.5 19.5 20.2 Gross profit 78.5 80.5 79.8 Operating expenses(1): Research and development 25.2 19.0 14.1 Sales and marketing 25.3 22.9 20.0 General and administrative 11.2 11.4 9.7 Total operating expenses 61.7 53.3 43.8 Income from operations 16.8 27.2 36.0 Interest income, net 5.2 2.0 0.4 Income before income taxes 22.0 29.2 36.4 Income tax expense 9.4 18.7 16.8 Net income 12.6 % 10.5 % 19.6 % ________________ (1) Stock-based compensation included in: Cost of revenues 0.9 % 1.2 % 0.2 % Research and development 7.9 9.4 2.7 Sales and marketing 4.2 6.2 1.8 General and administrative 2.8 5.0 3.0 15.8 % 21.8 % 7.7 %

20

Table of Contents
in 2001 from $4.7 million in 2000. Excluding stock-based compensation, sales and marketing expense increased to $16.3 million in 2001 from $12.7 million in 2000. This increase was primarily due to increases in the number of direct sales and marketing personnel and fixed asset depreciation on demonstration and evaluation equipment. These increases were partially offset by a reduction in the amount of commissions paid in 2001 as compared to 2000.
General and Administrative Expenses. General and administrative expenses decreased to $8.6 million in 2001 from $8.7 million in 2000. Stock-based compensation included in general and administrative expense decreased to $2.2 million in 2001 from $3.8 million in 2000. Excluding stock-based compensation, general and administrative expense increased to $6.5 million in 2001 from $4.9 million in 2000. This increase is due to higher facility rental and utility costs, increased expenses for professional services, primarily legal and accounting, and increased business insurance expenses. These increases were offset by a decrease in recruiting expenses in 2001 as compared to 2000.
Interest Income, Net . Interest income, net increased to $4.0 million in 2001 from $1.6 million in 2000. This increase was the result of an increase in cash and cash equivalents. We incurred minimal interest expense in 2001 and 2000.
Income Tax Expense . Income tax expense decreased to $7.2 million in 2001 from $14.2 million in 2000. Income tax expense was based on an annual effective tax rate of 42.6% in 2001 and 64.1% in 2000. The annual effective tax rate in 2001 and 2000 differs from the statutory rate primarily due to nondeductible stock-based compensation charges and state taxes offset by research and development tax credits. Excluding the effects of deferred stock-based compensation, the effective tax rate in 2001 would have been 34.6% and the effective tax rate in 2000 would have been 38.2%.
Comparison of the Years Ended December 31, 2000 and 1999
Net Revenues . In 2000, net revenues increased 210% to $76.0 million from the $24.5 million recorded in 1999. This increase reflects increased unit sales across our product lines and sales to new customers. Sales to our five largest customers collectively accounted for approximately $36.7 million or 48.3% of our net revenues in 2000 compared to $12.5 million or 51.0% of net revenues in 1999.
Gross Profit . Gross profit increased 213% to $61.2 million in 2000 from $19.6 million in 1999. Our gross margin increased to 80.5% in 2000 from 79.8% in 1999. This increase in gross margin primarily reflects purchasing and volume manufacturing efficiencies as production and sales volumes increased.
Research and Development Expenses. Research and development expenses increased to $14.4 million in 2000 from $3.4 million in 1999. Stock-based compensation included in research and development expense increased to $7.2 million in 2000 from $669,000 in 1999. Excluding stock-based compensation, research and development expense increased to $7.2 million in 2000 from $2.8 million in 1999. This increase was primarily due to higher compensation and related benefit costs due to the addition of engineering personnel.
Sales and Marketing Expenses. Sales and marketing expenses increased to $17.4 million in 2000 from $4.9 million in 1999. Stock-based compensation included in sales and marketing expense increased to $4.7 million in 2000 from $449,000 in 1999. Excluding stock-based compensation, sales and marketing expense increased to $12.7 million in 2000 from $4.4 million in 1999. This increase was primarily due to increases in commissions paid and increases in the number of direct sales and marketing personnel.
General and Administrative Expenses. General and administrative expenses increased to $8.7 million in 2000 from $2.4 million in 1999. Stock-based compensation included in general and administrative expense increased to $3.8 million in 2000 from $729,000 in 1999. Excluding stock-based compensation, general and administrative expense increased to $4.9 million in 2000 from $1.7 million in 1999. This increase is due to increased staffing and increased expenses for professional services, primarily legal, recruiting and accounting.
Interest Income, Net . Interest income, net increased to $1.6 million in 2000 from $88,000 in 1999. This increase was the result of an increase in cash and cash equivalents. We incurred minimal interest expense in 2000 and 1999.
21

Table of Contents
Income Tax Expense . Income tax expense increased to $14.2 million in 2000 from $4.1 million in 1999. Income tax expense was based on an annual effective tax rate of 64.1% in 2000 and 46.0% in 1999. The annual effective tax rate in 2000 and 1999 differs from the statutory rate primarily due to nondeductible stock-based compensation charges and state taxes offset by research and development tax credits. Excluding the effects of deferred stock-based compensation, the effective tax rate in 2000 and 1999 would have been 38.2%.
Liquidity and Capital Resources
As of December 31, 2001 we had cash and cash equivalents of $116.6 million, compared to $96.1 million as of December 31, 2000.
Net cash provided by operating activities was $26.1 million in 2001, $16.3 million in 2000 and $9.0 million in 1999. Net cash generated from operations in 2001, 2000 and 1999 was primarily provided by net income adjusted for significant non-cash expenses and changes in working capital requirements. Additionally, for 1999, $4.5 million of the $9.0 million of cash provided by operations relates to the timing of payments for our 1999 estimated income tax liability. Due to the method in which estimated income tax payments are made, in 1999 we paid only $66,000 in estimated taxes during the year and, as of December 31, 1999, we had accrued $4.5 million in income taxes payable. During March 2000, we made an estimated income tax payment of $4.6 million relating to the 1999 liability. Had this payment been made in 1999, net cash provided by operations would have been $4.4 million in 1999 and $20.9 million in 2000.
Cash used in investing activities was $8.1 million in 2001, $3.7 million in 2000 and $1.0 million in 1999. Cash used in investing activities in 2001 consisted of approximately $2.0 million in connection with the acquisition of the outstanding capital stock of Caimis, Inc., which was completed in November 2001, and capital expenditures for property and equipment. Cash used in investing activities in 2000 and 1999 consisted exclusively of capital expenditures for property and equipment.
Financing activities provided net cash of $2.6 million in 2001, $74.8 million in 2000 and used net cash of $336,000 in 1999. Financing activities in 2001 consisted of proceeds from the exercise of stock options and the proceeds from related party receivables. In 2000, financing activities included $74.4 million from the completion of our initial public offering in October 2000, proceeds from option exercises and proceeds from a related party receivable. Financing activities in 1999 consisted of repayment of a $500,000 note issued to a shareholder and cash proceeds from the sale of common stock and stock option exercises.
As of December 31, 2001 we had no material commitments for capital expenditures. As of December 31, 2001 we had total minimum lease obligations of $7.0 million through May 31, 2007 under non-cancelable operating leases. We do not have any capital leases.
On February 14, 2002, the Company completed the acquisition from Empirix, Inc. of the assets associated with the production and sale of the ANVL (Automated Network Validation Library) product line. The purchase price was $5.0 million in cash. In addition, a contingent cash payment of up to $1.0 million may be paid based upon our sales through March 31, 2003 of ANVL products and services.
We believe that our existing balances of cash and cash equivalents and cash flow expected to be generated from our operations will be sufficient to meet our cash needs for at least the next 12 months, although we could be required, or could elect, to seek additional funding prior to that time. Our capital requirements will depend on many factors, including the growth rate of our net revenues, our profitability, our capital expenditures, acquisition of key technology, working capital requirements, the timing and extent of spending to support product development efforts and the expansion of our sales, marketing and technical support efforts.
Recent Accounting Pronouncements
In June 2001, the Financial Accounting Standards Board (“FASB”) issued Statement of Financial Accounting Standards 141 (“SFAS 141”), “Business Combinations.” SFAS 141 requires the purchase method of
22

Table of Contents
accounting for business combinations initiated after June 30, 2001 and eliminates the pooling-of-interests method. The Company has accounted for the acquisition of Caimis, Inc. in accordance with the provisions of SFAS 141.
In June 2001, the FASB issued Statement of Financial Accounting Standards 142 (“SFAS 142”), “Goodwill and Other Intangible Assets,” which is effective January 1, 2002. SFAS 142 changes the accounting for goodwill from an amortization method to an impairment only approach. In addition, the standard includes provisions for the reclassification of certain existing recognized intangibles as goodwill, reassessment of the useful lives of existing recognized intangibles, reclassification of certain intangibles out of previously reported goodwill and the identification of reporting units for purposes of assessing potential future impairments of goodwill. SFAS 142 also requires the Company to complete a transitional goodwill impairment test six months from the date of adoption and annually or whenever events or circumstance occur indicating that goodwill might be impaired. The Company has accounted for the acquisition of Caimis, Inc. in accordance with the provisions of SFAS 142. Under the transition provisions of SFAS 142, the Company has not recorded amortization of goodwill relating to the Caimis, Inc. acquisition.
In August 2001, the FASB issued Statement of Financial Accounting Standards 144 (“SFAS 144”), “Accounting for the Impairment or Disposal of Long-Lived Assets,” which supersedes SFAS 121, “Accounting for the Impairment of Long-Lived Assets and for Long-Lived Assets to be Disposed of,” and the accounting and reporting provisions of APB 30, “Reporting the Results of Operations — Reporting the Effects of Disposal of a Segment of a Business, and Extraordinary, Unusual and Infrequently Occurring Events and Transactions.” SFAS 144 addresses financial accounting and reporting for the impairment or disposal of long-lived assets and is effective for fiscal years beginning after December 15, 2001, and interim periods within those fiscal years. The Company believes the adoption of SFAS 144 will not have a material impact on its financial statements.
Risk Factors
The statements that are not historical facts contained in this Annual Report on Form 10-K are forward-looking statements within the meaning of the Private Securities Litigation Reform Act of 1995. These statements reflect the current belief, expectations or intent of the Company’s management and are subject to and involve certain risks and uncertainties. Many of these risks and uncertainties are outside of our control and are difficult for us to forecast or mitigate. In addition to the risks described elsewhere in this Annual Report on Form 10-K and in certain of our other Securities and Exchange Act Commission filings, the following important factors, among others, could cause our actual results to differ materially from those expressed or implied by us in any forward-looking statements contained herein or made elsewhere by or on behalf of Ixia.
Our quarterly and annual operating results may fluctuate significantly as a result of new product introductions and other factors which could cause our stock price to decline significantly
Our quarterly and annual operating results may fluctuate significantly due to a variety of factors, most of which are outside of our control. Some of the factors that could cause our quarterly and annual operating results to fluctuate include the other risks discussed in this “Risk Factors” section.
We may experience a shortfall or delay in generating or recognizing revenues for a number of reasons. Orders on hand at the beginning of a quarter and orders generated in a quarter do not always result in the shipment of products and the recognition of revenues for that quarter. Failure to ship products by the end of the quarter in which they are ordered may adversely affect our operating results for that quarter. Our customer agreements typically provide that the customer may delay scheduled delivery dates and cancel orders within specified time frames without penalty. Because we incur operating expenses based on anticipated revenues trends and a high percentage of our expenses are fixed in the short term, any delay in generating or recognizing forecasted revenues could significantly harm our quarterly results of operations.
Additionally, our operating results may vary as a result of the timing of our release of new products. The introduction of a new product in any quarter may cause an increase in revenues in that quarter that may not be sustainable in subsequent quarters.
23

Table of Contents
If we are unable to successfully introduce new products to keep pace with the rapid technological changes that characterize our market, our results of operations will be significantly harmed
The market for our products is characterized by:
We expect that new technologies will continue to emerge as the need for higher and more cost-effective bandwidth increases. Our performance will depend on our successful development, introduction and market acceptance of new and enhanced performance analysis products that address these new technologies and changes in customer requirements. If we experience any delay in the development or introduction of new products or enhancements to our existing products, our operating results may suffer. For instance, undetected software or hardware errors, which frequently occur when new products are first introduced, could result in the delay or loss of market acceptance of our products and the loss of credibility with our customers. In addition, if we are not able to develop, or license from third parties, the underlying core technologies necessary to create new products and enhancements, our existing products are likely to become technologically obsolete over time and our operating results will suffer. If the rate of development of new technologies and transmission protocols by our customers is delayed, the growth of the market for our products and therefore our sales and operating results may be harmed.
Our ability to successfully introduce new products in a timely fashion will depend on several factors, including our ability to:
The development of new, technologically advanced products is a complex and uncertain process requiring high levels of innovation and highly skilled engineering and development personnel, as well as the accurate anticipation of technology and market trends. We cannot assure you that we will be able to identify, develop, manufacture, market or support new or enhanced products successfully, if at all, or on a timely or cost-effective basis. Further, we cannot assure you that our new products will gain market acceptance or that we will be able to respond effectively to technological changes, emerging industry standards or product announcements by our
24
• rapid technological change such as the recent development of optical fiber and wireless technologies; • frequent new product introductions such as higher speed and more complex routers; • evolving industry standards such as new Internet protocols; • changing customer needs such as the increase in the levels of service agreed to between network service providers and their customers;
and • short product life cycles as a result of rapid changes in our customers’ products.
• anticipate technological changes and industry trends; • properly identify customer needs; • innovate and develop new technologies and applications; • hire and retain necessary technical personnel; • successfully commercialize new technologies in a timely manner; • timely obtain key components for the manufacture of new products; • manufacture and deliver our products in sufficient volumes and on time; • price our products competitively; and • differentiate our offerings from our competitors’ offerings.

Table of Contents
competitors. If we fail to respond to technological change and the needs of our markets, we will lose revenues and our competitive position will suffer.
We depend on sales of a narrow range of products and if customers do not purchase our products, our revenues and results of operations would be significantly harmed
Our business and products are concentrated in the market for systems that analyze and measure the performance of network equipment and systems. This market is in an early stage of development and there is uncertainty regarding its size and scope. Our performance will depend on increased sales of our existing systems and the successful development, introduction and market acceptance of new and enhanced products. We cannot assure you that we will be successful in increasing these sales or in developing and introducing new products. Our failure to do so would significantly harm our revenues and results of operations.
Some key components in our products come from sole or limited sources of supply, which exposes us to potential supply shortages that could disrupt the manufacture and sale of our products
We and our contract manufacturers currently purchase a number of key components used to manufacture our products from sole or limited sources of supply for which alternative sources may not be available. From time to time, we have experienced shortages of key components, including chips, oscillators and optical modules. We and our contract manufacturers have no guaranteed or long-term supply arrangements for these or other components, including field programmable gate arrays, or FPGA’s, which are integrated circuits that can be repeatedly reprogrammed to perform different sets of functions as required. Financial or other difficulties faced by our suppliers or significant changes in market demand for necessary components could limit the availability to us and our contract manufacturers of these components. Any interruption or delay in the supply of any of these components could significantly harm our ability to meet scheduled product deliveries to our customers and cause us to lose sales.
In addition, the purchase of these components on a sole source basis subjects us to risks of price increases and potential quality assurance problems. Consolidation involving suppliers could further reduce the number of alternatives available to us and affect the cost of components. An increase in the cost of components could make our products less competitive and result in lower margins.
There are no substitute supplies available for many of these components, including field programmable gate arrays. All of these components are critical to the production of our products, and competition exists with other manufacturers for these key components. In the event that we can no longer obtain materials from a sole source supplier, we might not be able to qualify or identify alternative suppliers in a timely fashion, or at all.
Competition in our market could significantly harm our results of operations
The market for our products is highly competitive. We face competition primarily from test equipment manufacturers such as Agilent Technologies and Spirent Communications. We also compete with start-up companies such as Antara and gnubi, which are focused on network performance analysis and measurement. In the network monitoring and optimization market we expect to compete with test equipment manufacturers such as EXFO as well as with start-up companies, such as Brix and Adlex. Additionally, some of our network equipment manufacturer customers have developed, or may develop, in-house performance analysis products for their own use or for sale to others. For example, Cisco Systems, our largest customer, has used internally developed test products for a number of years. Although Cisco Systems has always accounted for a significant portion of our net revenues, we cannot assure you that it will continue to do so.
As we broaden our product offerings, we may move into new markets and face additional competition. Moreover, our competitors may have more experience operating in these new markets and be better established with the customers in these new markets.
Some of our competitors and potential competitors have greater brand name recognition and greater financial, technical, marketing, sales and distribution capabilities than we do. Moreover, our competitors may
25

Table of Contents
consolidate with each other, or with other companies, giving them even greater capabilities with which to compete against us.
Increased competition in the network performance analysis and measurement market could result in increased pressure on us to reduce prices and could result in a reduction in our revenues and/or a decrease in our margins, each of which could significantly harm our results of operations. In addition, increased competition could prevent us from increasing our market share, or cause us to lose our existing market share, either of which would harm our revenues and profitability.
We cannot predict whether our current or future competitors will develop or market technologies and products that offer higher performance or more features or are more cost-effective than our current or future products. To remain competitive, we must continue to develop cost-effective products and product enhancements which offer higher performance and more functionality. Our failure to do so will harm our revenues and results of operations.
If we do not diversify our customer base, we may not be able to grow our business or increase our profitability
Our growth depends in part on our ability to diversify our customer base by increasing sales to Internet and network service providers, communications chip manufacturers and network users. To effectively compete for the business of these customers, we must develop new products and enhancements to existing products and expand our sales, marketing and customer support capabilities, which will result in increases in operating costs. If we cannot offset these increases in costs with an increase in our revenues, our net income and our stock price may fall. Some of our existing and potential competitors have existing relationships with many Internet and network service providers, communications chip manufacturers and network users. We cannot assure you that we will be successful in increasing our sales presence in these markets. Any failure by us to increase sales in these markets would adversely affect our growth.
Because we depend on a limited number of network equipment manufacturers for a majority of our revenues, any cancellation, reduction or delay in purchases by these customers could significantly harm our revenues and results of operations
Historically, a small number of network equipment manufacturing customers has accounted for a significant portion of our net revenues. Sales to our five largest customers represented 37.2% of our net revenues in 2001, 48.3% of our net revenues in 2000 and 51.0% our net revenues in 1999. Sales to Cisco Systems, our largest customer, accounted for 24.4% of our net revenues in 2001, 29.5% of our net revenues in 2000 and 30.8% of our net revenues in 1999. We expect that significant customer concentration will continue for the foreseeable future and that our operating results will continue to depend to a significant extent upon revenues from a small number of customers.
Our dependence on large orders from a limited number of network equipment manufacturers makes our relationships with these manufacturers critical to the success of our business. We cannot assure you that we will be able to retain our largest customers, that we will be able to increase our sales to our other existing customers or that we will be able to attract additional customers. From time to time, we have experienced delays and reductions in orders from some of our major customers. In addition, our customers have sought price concessions from us and may continue to do so. We do not have long-term contracts with our customers, and our major customers can stop purchasing our products at any time without penalty and are free to purchase products from our competitors. The loss of one or more of our largest customers, any reduction or delay in sales to these customers, our inability to successfully develop and maintain relationships with existing and new customers or requirements that we make price concessions could significantly harm our revenues and results of operations.
26

Table of Contents
As our customers consolidate, they may reduce purchases of our products and demand more favorable terms and conditions from us, which would harm our revenues and profitability
Consolidation of our customers could reduce the number of customers to whom our products could be sold. Some of our customers have recently merged. These merged customers could obtain products from a source other than us or demand more favorable terms and conditions from us, which would harm our revenues and profitability. In addition, our network equipment manufacturer customers may merge with or acquire our competitors and discontinue their relationships with us.
If we are unable to expand our sales and distribution channels or are unable to successfully manage our expanded sales organization, our revenues and results of operations will be harmed
Historically, we have relied primarily on a limited direct sales organization, supported by third-party manufacturers’ representatives and distributors, to sell our products. Our distribution strategy focuses primarily on developing and expanding our direct sales organization and our network of manufacturers’ representatives and distributors. We may not be able to successfully expand our sales and distribution channels, and the cost of any expansion may exceed the revenues that we generate. To the extent that we are successful in expanding our sales and distribution channels, we cannot assure you that we will be able to compete successfully against the significantly larger and better-funded sales and marketing operations of many of our current or potential competitors. We have granted exclusive rights to substantially all of our distributors and manufacturers’ representatives to market our products in their specified territories. Our distributors and manufacturers’ representatives may not market our products effectively or devote the resources necessary to provide us with effective sales, marketing and technical support. Our inability to effectively manage the expansion of our sales and support staff, or to maintain existing or establish new relationships with successful manufacturers’ representatives and distributors, would harm our revenues and results of operations.
If we are unable to expand our international sales and distribution channels or manage them effectively, our results of operations would be harmed
Historically, a significant portion of our sales have been made to customers in the United States. Sales in the United States accounted for 82.8% of our net revenues in 2001, 84.1% of our net revenues in 2000 and 86.9% of our net revenues in 1999. In the past, we have depended on distributors for the substantial majority of our international sales. The loss of one or more of our international distributors or their failure to sell our products would limit our ability to sustain and grow our revenues in international markets. We intend to expand or enter into additional international markets, including Europe and the Asia Pacific region, by adding distributors and international sales and support personnel. Our failure in these efforts could significantly harm our results of operations and decrease the value of our stock. We only have limited international sales experience and believe that the growth of our sales outside of the United States will be subject to a number of additional risks and uncertainties, including:
27
• adoption of different local technical and regulatory standards; • the need to maintain and establish new relationships with distributors and the sales performance of these distributors, who may not be as
effective or loyal as our employees; • the costs and complexity of staffing and managing more widely dispersed foreign sales activities, including the ability to identify, attract
and retain qualified managers and sales personnel, overcoming cultural, linguistic and nationalistic barriers and adapting to foreign business practices;
• longer payment cycles of foreign customers compared with customers in the United States; • seasonal reductions in business activities in some parts of the world, such as during the summer months in Europe; • legal uncertainties regarding liability, export and import restrictions, tariffs and other trade barriers;

Table of Contents
Any of these factors could significantly harm our international sales or significantly impair our ability to expand into international markets.
Our international sales currently are U.S. dollar-denominated. As a result, an increase in the value of the U.S. dollar relative to foreign currencies could make our products less cost-effective in international markets.
If we fail to accurately forecast our manufacturing requirements, we could incur additional costs and experience manufacturing delays
We provide our contract manufacturers with rolling forecasts based on anticipated product orders to determine our manufacturing requirements. Some of the components used in our products have significant lead times or lead times which may unexpectedly increase depending on factors such as the specific supplier, contract terms and the demand for components at a given time. Because of these long lead times, we are often forced to forecast and order products before we know what our specific manufacturing requirements will be. If we overestimate our product orders, our contract manufacturers may have excess inventory of completed products which we would be obligated to purchase. This will lead to increased costs and the risk of obsolescence. If we underestimate our product orders, our contract manufacturers may have inadequate inventory, which could result in delays in shipments, the loss or deferral of revenues and higher costs of sales. It may also add costs to our products to expedite delivery of our products to customers or those components with long lead times to our contract manufacturers. We cannot assure you that we will be able to accurately forecast our product orders and may in the future carry excess or obsolete inventory, be unable to fulfill customer demand, or both, thereby harming our revenues, results of operations and customer relationships.
Failure by our contract manufacturers to provide us with adequate supplies of high-quality products could harm our revenues, results of operations, competitive position and reputation
We currently rely on a limited number of contract manufacturers to manufacture and assemble our products. We may experience delays in receiving product shipments from contract manufacturers or other problems, such as inferior quality and insufficient quantity of product. We cannot assure you that we will be able to effectively manage our contract manufacturers or that these manufacturers will meet our future requirements for timely delivery of products of sufficient quality and quantity. We intend to introduce new products and product enhancements, which will require that we rapidly achieve volume production by effectively coordinating with our suppliers and contract manufacturers. We do not have any long-term contracts with our contract manufacturers. The inability of our contract manufacturers to provide us with adequate supplies of high-quality products or the loss of any of our contract manufacturers would cause a delay in our ability to fulfill customer orders while we obtain a replacement manufacturer and would harm our revenues, results of operations, competitive position and reputation.
We may not be able to expand our contract manufacturing capacity or our internal testing or quality assurance functions as required to keep up with demand for our products. Any such failure would in turn hinder our growth. If we do not expand these capacities and functions effectively or in a timely manner, we may experience disruptions in product flow which could limit our revenues, adversely affect our competitive position and reputation and result in additional cost, cancellation of orders or both.
Because of intense competition for technical personnel, we may not be able to recruit or retain necessary personnel on a cost-effective basis
Our success will depend in large part upon our ability to identify, hire, retain and motivate highly skilled employees. We plan to increase the number of our research and development, marketing, sales, customer support
28
• potential political and economic instability; and • inadequate protection of intellectual property in some countries.

Table of Contents
and operations employees. Competition for highly skilled employees in our industry is intense. In addition, employees may leave our company and subsequently compete against us. Our failure to attract and retain these qualified employees could significantly harm our ability to develop new products and maintain customer relationships. The loss of the services of any of our qualified employees, the inability to attract or retain qualified personnel in the future or delays in hiring required personnel could hinder the development and introduction of new and enhanced products and harm our ability to sell our products. Moreover, companies in our industry whose employees accept positions with competitors frequently claim that those competitors have engaged in unfair hiring practices. We may be subject to such claims as we seek to retain or hire qualified personnel, some of whom may currently be working for our competitors. Some of these claims may result in material litigation. We could incur substantial costs in defending ourselves against these claims, regardless of their merits. Such claims could also discourage potential employees who currently work for our competitors from joining us.
The loss of any of our key personnel could significantly harm our results of operations and competitive position
Our success depends to a significant degree upon the continuing contributions of our key management, technical, marketing and sales employees, particularly Errol Ginsberg, our President and Chief Executive Officer. There can be no assurance that we will be successful in retaining our key employees or that we can attract or retain additional skilled personnel as required. Failure to retain key personnel could significantly harm our results of operations and competitive position.
Continued rapid growth will strain our operations and require us to incur costs to maintain and upgrade our management and operational resources
We have experienced and are continuing to experience a period of growth. Unless we manage our growth effectively, we may have difficulty in operating our business. As a result, we may inaccurately forecast sales and materials requirements, fail to integrate new personnel or fail to maintain adequate internal controls, which may result in fluctuations in our operating results and cause the price of our stock to decline. We plan to continue to expand our operations which may place a significant strain on our management and operational resources. In order to manage our growth effectively, we must implement and improve our operational systems, procedures and controls on a timely basis. If we cannot manage growth effectively, our profitability could be significantly harmed.
Our products may contain defects which may cause us to incur significant costs, divert our attention from product development efforts and result in a loss of customers
Our existing products and any new or enhanced products we introduce may contain undetected software or hardware defects when they are first introduced or as new versions are released. These problems may cause us to incur significant damages or warranty and repair costs, divert the attention of our engineering personnel from our product development efforts and cause significant customer relation problems or loss of customers and reputation, all of which would harm our results of operations. A successful claim against us for an amount exceeding the limit on our product liability insurance policy would force us to use our own resources, to the extent available, to pay the claim, which could result in an increase in our expenses and a reduction of our working capital available for other uses, thereby harming our profitability and capital resources.
Our failure to protect our intellectual property may significantly harm our results of operations and reputation
Our success and ability to compete is dependent in part on our ability to protect and maintain our proprietary rights to our intellectual property. We currently rely on a combination of trade secret, trademark and copyright laws to establish and protect our intellectual property. We also expect to rely on patents to protect some of our proprietary technology. To date, we have relied primarily on trade secret laws to protect our proprietary processes and know-how. Although we have filed applications for two U.S. patents, we cannot assure you that either
29

Table of Contents
of these applications will issue into patents or that, if issued, the patents will be upheld. We also cannot assure you that such patents, if issued, will be effective in protecting our proprietary technology.
We generally enter into confidentiality agreements with our officers, employees and consultants. We also generally limit access to and distribution of our source code and further limit the disclosure and use of our other proprietary information. However, these measures provide only limited protection of our intellectual property rights. In addition, we may not have signed agreements containing adequate protective provisions in every case, and the contractual provisions that are in place may not provide us with adequate protection in all circumstances. Further, we have not included copyright notices on all of our copyrightable intellectual property. Any infringement of our proprietary rights could result in significant litigation costs, and any failure to adequately protect our proprietary rights could result in our competitors offering similar products, potentially resulting in loss of one or more competitive advantages and decreased revenues.
Despite our efforts to protect our proprietary rights, existing trade secret, copyright, patent and trademark laws afford us only limited protection. In addition, the laws of some foreign countries do not protect our proprietary rights to the same extent as do the laws of the United States. Others may attempt to copy or reverse engineer aspects of our products or to obtain and use information that we regard as proprietary. Accordingly, we may not be able to prevent misappropriation of our technologies or to deter others from developing similar technologies. Further, monitoring the unauthorized use of our products and our proprietary rights is difficult. Litigation may be necessary to enforce our intellectual property rights or to determine the validity and scope of the proprietary rights of others. Litigation of this type could result in substantial costs and diversion of resources and could significantly harm our results of operations and reputation.
Claims that we infringe third-party intellectual pr operty rights could result in significant expenses or restrictions on our ability to sell our products
From time to time, other parties may assert patent, copyright, trademark and other intellectual property rights to technologies and in various jurisdictions that are important to our business. We cannot provide assurance that others will not claim that we are infringing their intellectual property rights or that we do not in fact infringe those intellectual property rights. We have not conducted a search to determine whether the technology we have in our products infringes or misappropriates intellectual property held by third parties. In addition, because patent applications in the United States are not publicly disclosed until the patent is issued, applications may have been filed which could relate to our products.
Any claims asserting that our products infringe or may infringe proprietary rights of third parties, if determined adversely to us, could significantly harm our results of operations. Any claims, with or without merit, could:
30
• be time-consuming; • result in costly litigation; • divert the efforts of our technical and management personnel; • require us to develop alternative technology, thereby causing product shipment delays and the loss or deferral of revenues; • require us to cease selling the products containing the infringing intellectual property; • require us to pay substantial damage awards; • damage our reputation; or • require us to enter into royalty or licensing agreements which, if required, may not be available on terms acceptable to us, if at all.

Table of Contents
In the event a claim against us were successful and we could not obtain a license to the relevant technology on acceptable terms or license a substitute technology or redesign our products to avoid infringement, our revenues, results of operations and competitive position would be harmed.
We are exposed to general economic and market conditions
Our business is subject to the effects of general economic conditions in the United States and globally, and, in particular, market conditions in the telecommunications industry. In recent quarters, our operating results have been adversely affected as a result of unfavorable economic conditions and reduced capital spending in the United States, Europe and Asia. In particular, sales to network equipment manufacturers in North America were adversely affected during fiscal 2001. If the economic conditions do not improve, or if there is a worsening in the global economic slowdown, we may continue to experience material adverse impacts on our business, operating results and financial condition.
Some of our customers may not have the resources to pay for our products or to order our products as a result of the current economic environment
With the recent economic slowdown, some of our customers are forecasting that their revenue for the foreseeable future will generally be lower than anticipated. Some of these customers are experiencing, or are likely to experience, serious cash flow problems, and they are finding it increasingly difficult to obtain financing on attractive terms, if at all. As a result, if some of these customers are not successful in generating sufficient revenue or securing alternate financing arrangements, they may not be able to pay, or may delay payment for the amounts that they owe us. Furthermore, they may not order as many products from us as originally forecast or any products at all. The inability of our customers to pay us for our products will adversely affect our cash flow and the timing of our revenue recognition and harm our results of operation. The failure of our customers to order product will also result in decreased revenues.
If we fail to maintain our relationships with industry experts, our products may lose industry and market recognition and sales could decline
Our relationships with industry experts in the field of performance analysis and measurement of networks and network equipment are critical for maintaining our industry credibility and for developing new products and testing methodologies in a timely fashion. These experts have established standard testing methodologies that evaluate new network equipment products and technologies. We provide these experts and their testing labs with our products and engineering assistance to perform tests on these new network equipment products and technologies. These industry experts refer to our products in their publications which has given our products industry recognition. In addition, these labs offer us the opportunity to test our products on the newest network equipment and technologies, thereby assisting us in developing new products that are designed to meet evolving technological needs. We cannot assure you that we will be able to maintain our relationships with industry experts or that our competitors will not obtain similar or superior relationships with industry experts. If we are unable to maintain our relationships with industry experts, our products may lose industry and market recognition which could harm our reputation and competitive position and cause our sales to decline.
Acquisitions undertaken and any that we may undertake could be difficult to integrate, disrupt our business, dilute shareholder value and significantly harm our operating results
On November 5, 2001, we completed the acquisition of all of the outstanding capital stock of Caimis, Inc., and on February 14, 2002, we completed the acquisition from Empirix, Inc. of the assets associated with the producing of the ANVL (Automated Network Validation Library) product line. We expect to continue to review opportunities to acquire other businesses or technologies that would complement our current products, expand the breadth of our markets, enhance our technical capabilities or otherwise offer growth opportunities. While we have no current agreements or negotiations underway, we may acquire additional businesses, products or technologies in the future. If we make any further acquisitions, we could issue stock that would dilute existing shareholders’ percentage
31

Table of Contents
ownership, incur substantial debt or assume contingent liabilities. We have limited experience in acquiring other businesses and technologies and believe acquisitions could involve the following risks:
We cannot assure you that we would be successful in overcoming problems in connection with our past or future acquisitions, and our inability to do so could significantly harm our revenues and results of operations.
Our headquarters, many of our customers and some of our contract manufacturers and suppliers are located in California where natural disasters may occur
Currently, our corporate headquarters, many of our customers and some of our contract manufacturers and suppliers are located in California. California historically has been vulnerable to natural disasters and other risks, such as earthquakes, fires and floods, which at times have disrupted the local economy and posed physical risks to our property. We and some of our customers, contract manufacturers and suppliers do not have redundant, multiple site capacity. In the event of a natural disaster, our ability to conduct business could be significantly disrupted, thereby harming our results of operations.
Provisions of our articles of incorporation, bylaws and an agreement with our principal shareholder may make it difficult for a third party to acquire us, despite the possible benefits to our shareholders
Our board of directors has the authority to issue up to 1,000,000 shares of preferred stock and to determine the price, rights, preferences, privileges and restrictions, including voting rights, of those shares without any further vote or action by the shareholders. The rights of the holders of our common stock are subject to, and may be adversely affected by, the rights of the holders of any preferred stock that we may issue. The issuance of preferred stock could have the effect of making it more difficult for a third party to acquire a majority of our outstanding voting stock. Furthermore, some provisions of our articles of incorporation and bylaws could delay or make more difficult a merger, tender offer or proxy contest involving us.
Technology Capital Group S.A., our principal shareholder, has agreed that for a period of three years beyond October 2001 or until any earlier time that it owns less than 25% of the outstanding shares of our common stock, it will provide us with at least 30 days advance notice before agreeing to a sale or other disposition of one percent or more of our outstanding shares in a private transaction. This notice requirement may delay a third party’s acquisition of the shares of our common stock held by Technology Capital Group and also provide us with an opportunity to propose other buyers for the shares who may be more acceptable to us, to propose to repurchase the shares proposed to be sold or to propose to register the shares for sale in an underwritten public offering. This notice requirement may also discourage third parties from attempting to acquire the shares of our common stock held by Technology Capital Group during that period.
These provisions of our articles of incorporation and bylaws and this agreement may have the effect of delaying, deferring or preventing a change in our control despite possible benefits to our shareholders, may discourage bids at a premium over the market price of our common stock and may harm the market price of our common stock and the voting and other rights of our shareholders.
32
• problems assimilating the acquired operations, technologies or products; • unanticipated costs associated with the acquisition; • diversion of management’s attention from our core business; • adverse effects on existing business relationships with suppliers, contract manufacturers, customers and industry experts; • risks associated with entering markets in which we have no or limited prior experience; and • potential loss of the acquired organization’s or our own key employees.

Table of Contents
Item 7A. Quantitative and Qualitative Disclosures About Market Risk
We do not hold financial instruments for trading or speculative purposes. Our financial instruments have short maturities and therefore are not subject to significant interest rate risk. We generally place funds that are in excess of our current needs in high credit quality instruments with maturities of less than one year, such as money market accounts and commercial paper. We do not have any financial liabilities that are subject to interest rate risk. We do not expect any material loss from our investments and therefore believe that our potential interest rate exposure is not material. We do not use any derivatives or similar instruments to manage our interest rate risk.
Item 8. Financial Statements and Supplementary Data
The financial statements and supplementary data of the Company required by this Item are provided in the consolidated financial statements of the Company included in this Annual Report on Form 10-K as listed in Item 14(a) of this Annual Report on Form 10-K.
None
PART III
Item 10. Directors and Executive Officers of the Registrant
The information required by this Item is incorporated herein by reference to information appearing in the Company’s definitive Proxy Statement for its Annual Meeting of Shareholders to be held on May 9, 2002, which information appears under the captions entitled “Election of Directors,” “Executive Officers” and “Section 16(a) Beneficial Ownership Reporting Compliance.” Such Proxy Statement will be filed with the Commission within 120 days after the Company’s last fiscal year-end, December 31, 2001.
Item 11. Executive Compensation
The information required by this Item is incorporated herein by reference to information appearing in the Company’s definitive Proxy Statement for its Annual Meeting of Shareholders to be held on May 9, 2002, which information appears under the captions “Election of Directors — Compensation of Directors,” “Executive Compensation and Other Information,” “Board of Directors and Compensation Committee Reports on Executive Compensation” and “Performance Graph.” Such Proxy Statement will be filed with the Commission within 120 days after the Company’s last fiscal year-end, December 31, 2001.
Item 12. Security Ownership of Certain Beneficial Owners and Management
The information required by this Item is incorporated herein by reference to information appearing in the Company’s definitive Proxy Statement for its Annual Meeting of Shareholders to be held on May 9, 2002, which information appears under the caption “Common Stock Ownership of Principal Shareholders and Management.” Such Proxy Statement will be filed with the Commission within 120 days after the Company’s last fiscal year-end, December 31, 2001.
Item 13. Certain Relationships and Related Transactions
The information required by this Item is incorporated herein by reference to information appearing in the Company’s definitive Proxy Statement for its Annual Meeting of Shareholders to be held on May 9, 2002, which
33
Item 9. Changes in and Disagreements with Accountants on Accounting and Financial Disclosure

Table of Contents
information appears under the caption “Certain Relationships and Related Transactions.” Such Proxy Statement will be filed with the Commission within 120 days after the Company’s last fiscal year-end, December 31, 2001.
PART IV
Item 14. Exhibits, Financial Statement Schedules, and Reports on Form 8-K
(a) The following documents are filed as part of this Report:
(1) Consolidated Financial Statements
(2) Financial Statement Schedule
Schedules which are not listed above have been omitted because they are not applicable or the information required to be set forth therein is included in the consolidated financial statements or notes thereto.
(3) Exhibits
34
The consolidated financial statements listed in the accompanying Index to Consolidated Financial Statements are filed as part of this report.
The financial statement schedule listed in Schedule II is filed as part of this report.
3.1 Amended and Restated Articles of Incorporation, as amended(1) 3.2 Bylaws, as amended(2) 10.1* 1997 Stock Option Plan, as amended(3) 10.1.1* Amendment No. 4 to 1997 Stock Option Plan(4) 10.1.2* Amendment No. 5 to 1997 Stock Option Plan(5) 10.2* Director Stock Option Plan(6) 10.3* Employee Stock Purchase Plan(7) 10.4* Officer Severance Plan(8) 10.5* Form of Indemnity Agreement between Ixia and its directors and executive officers(9) 10.6* Subscription Agreement dated September 8, 1999 between Ixia and Mark MacWhirter(10) 10.7
Office Lease Agreement dated November 5, 1999 between Malibu Canyon Office Partners, LLC and Ixia
and First Amendment to Office Lease dated as of March 22, 2000(11) 10.8* Warrants dated August 2, 2000 to Purchase 80,000 Shares of Common Stock issued to Robert W. Bass(12) 10.9
Registration Rights and Stock Transfer Restriction Agreement dated as of September 1, 2000 among Ixia,
Technology Capital Group S.A. and Stéphane Ratel(13) 10.10* 2000 Bonus Plan(14) 10.11
Promissory Note dated July 7, 2000, in the principal amount of $78,433.33 issued by Mark MacWhirter in
favor of Ixia(15) 10.12* Agreement dated as of September 26, 2000 between Ixia and Eran Karoly(16) 10.13* Employment offer letter agreement dated October 27, 2001 between Ixia and David Anderson 21.1 Subsidiaries of the Registrant 23.1 Consent of PricewaterhouseCoopers LLP
* Constitutes a management contract or compensatory plan or arrangement required to be filed as an exhibit to this Annual Report on Form 10-K.
(1) Incorporated by reference to Exhibit No. 3.1 to Amendment No. 1 to the Registrant’s Registration Statement on Form S-1 (Reg. No. 333-42678) filed with the Commission on September 5, 2000.
(2) Incorporated by reference to Exhibit No. 3.2 to Amendment No. 2 to the Registrant’s Registration Statement on Form S-1 (Reg. No. 333-42678) filed with the Commission on September 19, 2000.

Table of Contents
(b) Reports on Form 8-K
The Company did not file any Reports on Form 8-K during the quarter ended December 31, 2001.
(c) Exhibits
See the list of Exhibits under Item 14(a)(3) of this Annual Report on Form 10-K.
(d) Financial Statement Schedules
See the Schedule under Item 14(a)(2) of this Annual Report on Form 10-K.
35
(3) Incorporated by reference to Exhibit No. 10.1 to the Registrant’s Registration Statement on Form S-1 (Reg. No. 333-42678) filed with the Commission on July 31, 2000.
(4) Incorporated by reference to Exhibit No. 10.1.1 to Amendment No. 3 to the Registrant’s Registration Statement on Form S-1 (Reg. No. 333-42678) filed with the Commission on September 27, 2000.
(5) Incorporated by reference to Exhibit No. 4.1 to the Registrant’s Registration Statement on Form S-8 (Reg. No. 333-66382) filed with the Commission on July 31, 2001.
(6) Incorporated by reference to Exhibit No. 10.2 to Amendment No. 1 to the Registrant’s Registration Statement on Form S-1 (Reg. No. 333-42678) filed with the Commission on September 5, 2000.
(7) Incorporated by reference to Exhibit No. 10.3 to Amendment No. 1 to the Registrant’s Registration Statement on Form S-1 (Reg. No. 333-42678) filed with the Commission on September 5, 2000.
(8) Incorporated by reference to Exhibit No. 10.4 to Amendment No. 1 to the Registrant’s Registration Statement on Form S-1 (Reg. No. 333-42678) filed with the Commission on September 5, 2000.
(9) Incorporated by reference to Exhibit No. 10.5 to Amendment No. 1 to the Registrant’s Registration Statement on Form S-1 (Reg. No. 333-42678) filed with the Commission on September 5, 2000.
(10) Incorporated by reference to Exhibit No. 10.13 to the Registrant’s Registration Statement on Form S-1 (Reg. No. 333-42678) filed with the Commission on July 31, 2000.
(11) Incorporated by reference to Exhibit No. 10.14 to the Registrant’s Registration Statement on Form S-1 (Reg. No. 333-42678) filed with the Commission on July 31, 2000.
(12) Incorporated by reference to Exhibit No. 10.15 to Amendment No. 1 to the Registrant’s Registration Statement on Form S-1 (Reg. No. 333-42678) filed with the Commission on September 5, 2000.
(13) Incorporated by reference to Exhibit No. 10.17 to Amendment No. 3 to the Registrant’s Registration Statement on Form S-1 (Reg. No. 333-42678) filed with the Commission on September 27, 2000.
(14) Incorporated by reference to Exhibit No. 10.16 to Amendment No. 2 to the Registrant’s Registration Statement on Form S-1 (Reg. No. 333-42678) filed with the Commission on September 19, 2000.
(15) Incorporated by reference to Exhibit No. 10.18 to Amendment No. 2 to the Registrant’s Registration Statement on Form S-1 (Reg. No. 333-42678) filed with the Commission on September 19, 2000.
(16) Incorporated by reference to Exhibit No. 10.19 to Amendment No. 3 to the Registrant’s Registration Statement on Form S-1 (Reg. No. 333-42678) filed with the Commission on September 27, 2000.

Table of Contents
Report of Independent Accountants on Financial Statement Schedule
To the Board of Directors and Shareholders of Ixia:
Our audits of the consolidated financial statements of Ixia and its subsidiary referred to in our report dated January 30, 2002, included in this Annual Report on Form 10-K, also included an audit of the financial statement schedule listed in Item 14 of this Form 10-K. In our opinion, the financial statement schedule presents fairly, in all material respects, the information set forth therein when read in conjunction with the related consolidated financial statements.
/s/ PricewaterhouseCoopers LLP
Los Angeles, California January 30, 2002
36
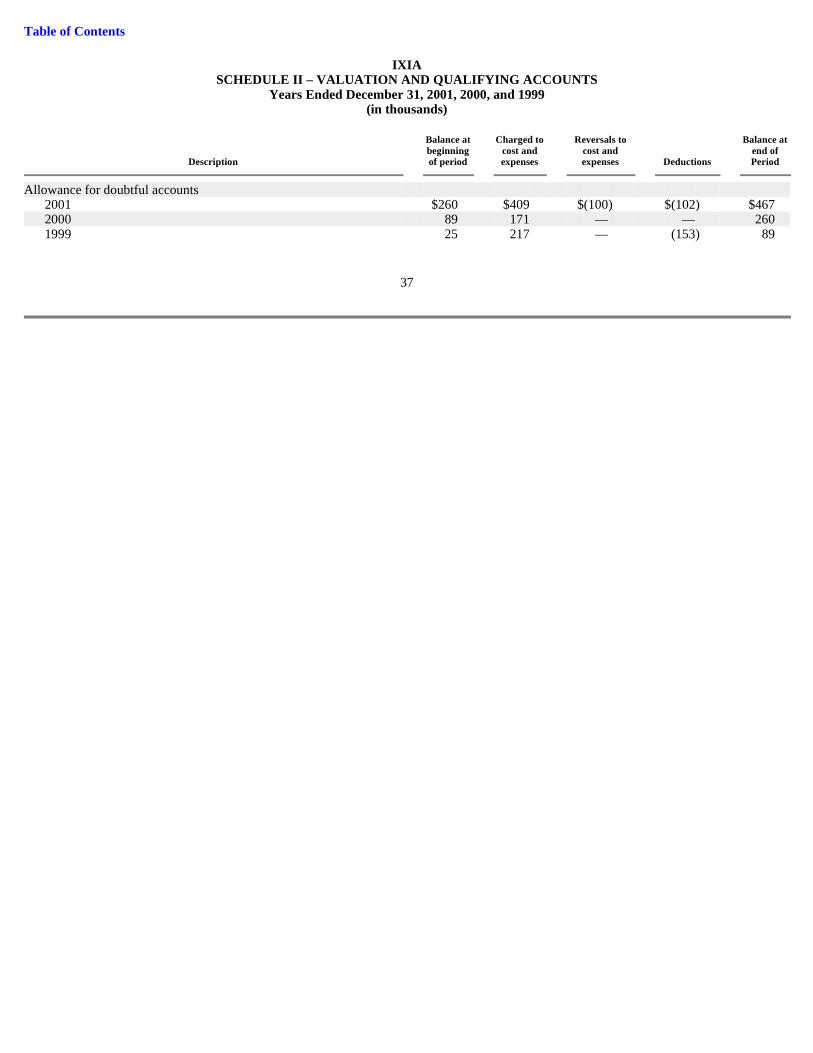
Table of Contents
IXIA SCHEDULE II – VALUATION AND QUALIFYING ACCOUNTS
Years Ended December 31, 2001, 2000, and 1999 (in thousands)
37
Balance at Charged to Reversals to Balance at beginning cost and cost and end of
Description of period expenses expenses Deductions Period
Allowance for doubtful accounts 2001 $ 260 $ 409 $ (100 ) $ (102 ) $ 467 2000 89 171 — — 260 1999 25 217 — (153 ) 89

Table of Contents
SIGNATURES
Pursuant to the requirements of Section 13 or 15(d) of the Securities Exchange Act of 1934, the Registrant has duly caused this report to be signed on its behalf by the undersigned, thereunto duly authorized.
Pursuant to the requirements of the Securities Exchange Act of 1934, this Report has been signed below by the following persons on behalf of the Registrant and in the capacities and on the dates indicated.
38
Dated: March 22, 2002 IXIA /s/ Errol Ginsberg
Errol Ginsberg
President and Chief Executive Officer
Name Title Date
/s/ Errol Ginsberg
Errol Ginsberg
President, Chief Executive Officer and Director (Principal Executive Officer)
March 22, 2002
/s/ Thomas B. Miller
Thomas B. Miller
Chief Financial Officer (Principal Financial and Accounting Officer)
March 22, 2002
/s/ Jean-Claude Asscher
Chairman of the Board
March 22, 2002
Robert W. Bass
Director
/s/ Howard Oringer
Howard Oringer
Director
March 22, 2002
/s/ Jon F. Rager
Jon F. Rager
Director
March 22, 2002

Table of Contents
IXIA
INDEX TO CONSOLIDATED FINANCIAL STATEMENTS
39
Page
Report of Independent Accountants 40 Consolidated Balance Sheets as of December 31, 2001 and 2000 41 Consolidated Statements of Income for the years ended December 31, 2001, 2000 and 1999 42 Consolidated Statements of Shareholders’ Equity for the years ended December 31, 2001, 2000 and 1999 43 Consolidated Statements of Cash Flows for the years ended December 31, 2001, 2000 and 1999 44 Notes to Consolidated Financial Statements 45

Table of Contents
Report of Independent Accountants
To the Board of Directors and Shareholders of Ixia:
In our opinion, the accompanying consolidated balance sheets and the related consolidated statements of income, shareholders’ equity and cash flows present fairly, in all material respects, the financial position of Ixia and its subsidiary at December 31, 2001 and 2000, and the results of their operations and their cash flows for each of the three years in the period ended December 31, 2001, in conformity with accounting principles generally accepted in the United States of America. These financial statements are the responsibility of the Company’s management; our responsibility is to express an opinion on these financial statements based on our audits. We conducted our audits of these statements in accordance with auditing standards generally accepted in the United States of America, which require that we plan and perform the audit to obtain reasonable assurance about whether the financial statements are free of material misstatement. An audit includes examining, on a test basis, evidence supporting the amounts and disclosures in the financial statements, assessing the accounting principles used and significant estimates made by management, and evaluating the overall financial statement presentation. We believe that our audits provide a reasonable basis for our opinion.
/s/ PricewaterhouseCoopers LLP
Los Angeles, California January 30, 2002, except for subsequent event described in Note 12, as to which the date is February 14, 2002
40

Table of Contents
IXIA Consolidated Balance Sheets
(in thousands)
The accompanying notes are an integral part of these consolidated financial statements
41
December 31, December 31, 2001 2000
Assets Current assets: Cash and cash equivalents $ 116,643 $ 96,066 Accounts receivable, net 7,534 11,874 Inventories 3,316 5,589 Deferred income taxes 3,520 3,321 Income taxes receivable 2,598 — Prepaid expenses and other current assets 940 806 Total current assets 134,551 117,656 Property and equipment, net 6,821 3,561 Deferred income taxes 51 263 Goodwill and other intangible assets, net 2,536 — Other assets, net 207 202 Total assets $ 144,166 $ 121,682 Liabilities and Shareholders’ Equity Current liabilities: Accounts payable $ 1,482 $ 4,641 Accrued expenses 3,317 5,492 Deferred revenue 1,546 1,469 Income taxes payable — 2,029 Total liabilities 6,345 13,631 Commitments and contingencies (Note 7) Shareholders’ equity: Preferred stock, no par value; 1,000 shares authorized and none
outstanding — — Common stock, no par value; 200,000 shares authorized at
December 31, 2001 and December 31, 2000, respectively, 55,810 and 53,883 shares issued and outstanding as of December 31, 2001 and December 31, 2000, respectively 77,764 75,454
Additional paid-in capital 46,933 44,007 Deferred stock-based compensation (9,418 ) (23,941 ) Notes receivable from shareholders — (262 ) Retained earnings 22,542 12,793 Total shareholders’ equity 137,821 108,051 Total liabilities and shareholders’ equity $ 144,166 $ 121,682

Table of Contents
IXIA
Consolidated Statements of Income (in thousands, except per share data)
The accompanying notes are an integral part of these consolidated financial statements
42
Year Ended December 31,
2001 2000 1999
Net revenues $ 77,157 $ 76,044 $ 24,499 Cost of revenues(1) 16,610 14,825 4,944 Gross profit 60,547 61,219 19,555 Operating expenses(1): Research and development 19,412 14,421 3,449 Sales and marketing 19,557 17,411 4,892 General and administrative 8,643 8,709 2,389 Total operating expenses 47,612 40,541 10,730 Income from operations 12,935 20,678 8,825 Interest income, net 4,035 1,552 88 Income before income taxes 16,970 22,230 8,913 Income tax expense 7,221 14,245 4,103 Net income $ 9,749 $ 7,985 $ 4,810 Earnings per share: Basic $ 0.18 $ 0.17 $ 0.11 Diluted $ 0.16 $ 0.15 $ 0.10 Weighted average number of common and common
equivalent shares outstanding: Basic 54,550 47,244 43,574 Diluted 61,977 53,777 45,970 _____________ (1) Stock-based compensation included in: Cost of revenues $ 729 $ 948 $ 38 Research and development 6,055 7,182 669 Sales and marketing 3,245 4,695 449 General and administrative 2,159 3,807 729 $ 12,188 $ 16,632 $ 1,885

Table of Contents
IXIA Consolidated Statements of Shareholders’ Equity
(in thousands)
The accompanying notes are an integral part of these consolidated financial statements
43
Notes Common Stock Additional Deferred Receivable Retained
Paid-In Stock-based From Earnings Shares Amount Capital Compensation Shareholders (Deficit) Total
Balance as of December 31, 1998 43,200 $ 300 $ 1,722 $ (260 ) $ — $ (2 ) $ 1,760 Exercise of stock options 776 15 15 Issuance of common stock 1,650 468 (319 ) 149 Deferred stock-based compensation 6,572 (6,572 ) — Amortization of deferred stock-based compensation 1,885 1,885 Interest receivable from shareholders (9 ) (9 ) Net income 4,810 4,810 Balance as of December 31, 1999 45,626 783 8,294 (4,947 ) (328 ) 4,808 8,610 Exercise of stock options 1,932 239 239 Deferred stock-based compensation 36,169 (36,169 ) — Amortization of deferred stock-based compensation 16,783 16,783 Forfeiture of stock options (543 ) 392 (151 ) Stock option tax benefit 87 87
Issuance of common stock in conjunction with initial
public offering (net of issuance costs of $7,793) 6,325 74,432 74,432 Repayment of note receivable 90 90 Interest receivable from shareholders (24 ) (24 ) Net income 7,985 7,985 Balance as of December 31, 2000 53,883 75,454 44,007 (23,941 ) (262 ) 12,793 108,051
Exercise of stock options and employee stock purchase
plan options 1,927 2,310 2,310 Deferred stock-based compensation (858 ) 858 — Amortization of deferred stock-based compensation 12,787 12,787 Forfeiture of stock options (1,477 ) 878 (599 ) Stock option tax benefit 5,261 5,261 Repayment of note receivable 270 270 Interest receivable from shareholders (8 ) (8 ) Net income 9,749 9,749 Balance as of December 31, 2001 55,810 $ 77,764 $ 46,933 $ (9,418 ) $ — $ 22,542 $ 137,821

Table of Contents
IXIA Consolidated Statements of Cash Flows
(in thousands)
The accompanying notes are an integral part of these consolidated financial statements
44
Year Ended December 31,
2001 2000 1999
Cash flows from operating activities: Net income $ 9,749 $ 7,985 $ 4,810 Adjustments to reconcile net income to net cash provided by operating
activities: Depreciation 2,915 1,097 452 Allowance for doubtful accounts 207 171 64 Stock-based compensation 12,188 16,632 1,885 Interest receivable from shareholders (8 ) (24 ) (9 ) Deferred income tax (246 ) (2,972 ) (422 ) Changes in operating assets and liabilities: Accounts receivable 4,167 (7,688 ) (3,295 ) Inventories 2,273 (4,843 ) (342 ) Income taxes receivable 2,663 — — Prepaid expenses and other current assets (125 ) (515 ) (271 ) Other assets 5 (71 ) (112 ) Accounts payable (3,339 ) 3,554 595 Accrued expenses (2,340 ) 4,110 955 Deferred revenue (25 ) 1,199 197 Income taxes payable (2,029 ) (2,357 ) 4,459 Net cash provided by operating activities 26,055 16,278 8,966 Cash used in investing activities: Purchases of property and equipment (6,068 ) (3,706 ) (1,021 ) Payments in connection with acquisition (1,990 ) — — Cash used in investing activities (8,058 ) (3,706 ) (1,021 ) Cash flows from financing activities: Issuance of common stock, net of issuance costs — 74,432 149 Exercise of stock options 2,310 239 15 Proceeds from related-party note receivable 270 90 — Repayment of related-party note payable — — (500 ) Net cash provided by (used in) financing activities 2,580 74,761 (336 ) Net increase in cash and cash equivalents 20,577 87,333 7,609 Cash and cash equivalents at beginning of period 96,066 8,733 1,124 Cash and cash equivalents at end of period $ 116,643 $ 96,066 $ 8,733 Supplemental disclosure of cash flow information: Cash paid during the period for: Income taxes $ 7,895 $ 19,557 $ 66 Supplemental disclosure of noncash transactions: Issuance of shareholder notes receivable $ — $ — $ 319

Table of Contents
IXIA
NOTES TO CONSOLIDATED FINANCIAL STATEMENTS
1. Business and Summary of Significant Accounting Policies
Business
Ixia (the “Company”) was incorporated on May 27, 1997, as a California corporation. The Company designs and markets high-speed, multi-port network performance analysis systems that generate and analyze data traffic over optical and electrical networks.
On October 17, 2000, the Company sold 6,325,000 shares of common stock in an initial public offering, including 825,000 shares sold upon exercise of the underwriters’ over-allotment option. Net proceeds to the Company totaled approximately $74.4 million, net of offering costs of approximately $7.8 million.
Use of Estimates
In the normal course of preparing financial statements in conformity with accounting principles generally accepted in the United States, management is required to make estimates and assumptions that affect the reported amounts of assets and liabilities and disclosure of contingent assets and liabilities at the date of the financial statements and the reported amounts of revenue and expenses during the reporting period. Actual results could differ from those estimates.
Consolidation
All subsidiaries are consolidated. All significant intercompany transactions and accounts are eliminated in consolidation.
Cash and Cash Equivalents
The Company considers all highly liquid investments with an original maturity of three months or less to be cash equivalents. Cash and cash equivalents are carried at cost, which approximates fair value. We generally place funds that are in excess of our current needs in high credit quality instruments such as money market accounts and commercial paper.
Fair Value of Financial Instruments
The Company’s financial instruments, including cash and cash equivalents, accounts receivable, accounts payable and other liabilities are carried at cost, which approximates their fair values because of the short-term maturity of these instruments and the relative stability of interest rates.
Inventories
Inventories are stated at the lower of cost (first-in, first-out) or market. Appropriate consideration is given to obsolescence and other factors in evaluating net realizable value.
Property and Equipment
Property and equipment are stated at cost less accumulated depreciation. Depreciation is computed using the straight-line method based upon the estimated useful lives of the assets, ranging from two to seven years. Useful lives are evaluated regularly by management in order to determine recoverability in light of current technological conditions. Repairs and maintenance are charged to expense as incurred while renewals and improvements are capitalized. Upon the sale or retirement of property and equipment, the accounts are relieved of the cost and the related accumulated depreciation, with any resulting gain or loss included in the Statement of Income.
45

Table of Contents
IXIA
NOTES TO CONSOLIDATED FINANCIAL STATEMENTS (Continu ed)
Amortization of Intangible Assets and Goodwill Impairment
The Company applies Statement of Financial Accounting Standards 142 (“SFAS 142”), “Goodwill and Other Intangible Assets,” which was effective for acquisitions after June 30, 2001. Purchased intangible assets are carried at cost less accumulated amortization. Amortization is computed using the straight-line method over the economic lives of the respective assets. Goodwill is carried at cost and is tested for impairment annually or whenever events or circumstances occur indicating that goodwill might be impaired. Impairment losses are recorded to the extent that the carrying value of the goodwill exceeds the fair value.
Long-Lived Assets
The Company identifies and records impairment losses on long-lived assets when events and circumstances indicate that such assets might be impaired. In the event the expected undiscounted future cash flow attributable to the asset is less than the carrying amount of the asset, an impairment loss equal to the excess of the asset’s carrying value over its fair value is recorded. To date, no such impairment has been recorded.
Hardware Product Warranty Costs
The Company generally warrants its products for one year after sale and provides for estimated future warranty costs at the time revenue is recognized. Accrued hardware product warranty costs are included as a component of accrued expenses on the accompanying balance sheets.
Revenue Recognition
The software component of the Company’s products is an integral part of its functionality. As such, the Company applies the provisions of the American Institute of Certified Public Accountants (“AICPA”) Statement of Position (“SOP”) 97-2, “Software Revenue Recognition.”
The Company’s products are fully functional at the time of shipment. The software components of the Company’s products do not require significant production, modification or customization. As such, revenue from product sales is recognized upon shipment provided that (1) a purchase order has been received or a contract has been executed; (2) title has transferred; (3) the fee is fixed and determinable; and (4) collectibility is deemed probable. Revenue associated with multiple-element arrangements (products and post-contract customer support (“PCS”), is allocated to each element based on vendor-specific objective evidence of fair value. Revenue related to future PCS is initially deferred and subsequently recognized ratably over the term of the service period. Extended warranty and other service revenues are recognized ratably over the respective service periods. Such service revenue has not been significant to date.
Research and Development
Costs related to research and development of products are expensed as incurred. Costs incurred to establish the technological feasibility of a software product are considered research and development costs and are expensed as incurred. Once technological feasibility is established, all development costs incurred until general product release are subject to capitalization. To date, the establishment of technological feasibility of the Company’s products and general release have substantially coincided. As a result, the Company has not capitalized any software development costs.
Software Developed for Internal Use
The Company capitalizes costs of software, consulting services, hardware and payroll-related costs incurred to purchase or develop internal-use software. The Company expenses costs incurred during preliminary project assessment, research and development, re-engineering, training and application maintenance phases. To date, capitalized internal use software costs have not been significant.
46

Table of Contents
IXIA
NOTES TO CONSOLIDATED FINANCIAL STATEMENTS (Continu ed)
Advertising
Advertising costs are expensed as incurred. Advertising costs were $876,000, $484,000 and $256,000 for the years ended December 31, 2001, 2000 and 1999, respectively.
Stock-Based Compensation
The Company applies Accounting Principles Board (“APB”) Opinion 25, “Accounting for Stock Issued to Employees,” and related interpretations in accounting for its stock and stock options issued. Accordingly, any compensation expense is recognized over the vesting period and represents the difference between the deemed fair value for accounting purposes of the underlying stock and the purchase price or the exercise price at the date of grant. The Company has provided additional disclosures required by Statement of Financial Accounting Standards (“SFAS”) 123, “Accounting for Stock-Based Compensation.” The Company accounts for stock issued to non-employees in accordance with the provisions of SFAS 123 and Emerging Issues Task Force (“EITF”) 96-18.
Income Taxes
The Company accounts for income taxes using the liability method. Deferred taxes are determined based on the differences between the financial statement and tax bases of assets and liabilities, using enacted tax rates in effect for the year in which the differences are expected to reverse. Valuation allowances are established when necessary to reduce deferred tax assets to the amounts expected to be realized.
Earnings Per Share
Earnings per share are computed using the weighted average number of shares outstanding and dilutive common stock equivalents (options and restricted stock) in accordance with SFAS 128, “Earnings per Share.”
Comprehensive Income
The Company has adopted the provisions of SFAS 130, “Reporting Comprehensive Income.” SFAS 130 establishes standards for reporting comprehensive income and its components in financial statements. Comprehensive income, as defined, includes all changes in equity (net assets) during a period from non-owner sources. To date, the Company has not had any transactions that are required to be reported in comprehensive income, other than net income.
Segments
The Company has adopted the provisions of SFAS 131, “Disclosures about Segments of an Enterprise and Related Information.” SFAS 131 establishes standards for the way companies report information about operating segments in annual financial statements. It also establishes standards for related disclosures about products and services, geographic areas and major customers. The Company has determined that it did not have any separately reportable business segments as of, and for the years ended, December 31, 2001, 2000 and 1999. The amount of the Company’s long-lived assets located outside of the United States as of December 31, 2001, 2000 and 1999 were not significant.
Reclassifications
Certain reclassifications have been made to the 2000 and 1999 financial statements to conform to the 2001 presentation.
47

Table of Contents
IXIA
NOTES TO CONSOLIDATED FINANCIAL STATEMENTS (Continu ed)
Recent Accounting Pronouncements
In June 2001, the Financial Accounting Standards Board (“FASB”) issued Statement of Financial Accounting Standards 141 (“SFAS 141”), “Business Combinations.” SFAS 141 requires the purchase method of accounting for business combinations initiated after June 30, 2001 and eliminates the pooling-of-interests method. The Company has accounted for the acquisition of Caimis, Inc. in accordance with the provisions of SFAS 141 (see Note 4).
In June 2001, the FASB issued SFAS 142, “Goodwill and Other Intangible Assets,” which is effective January 1, 2002. SFAS 142 changes the accounting for goodwill from an amortization method to an impairment only approach. In addition, the standard includes provisions for the reclassification of certain existing recognized intangibles as goodwill, reassessment of the useful lives of existing recognized intangibles, reclassification of certain intangibles out of previously reported goodwill and the identification of reporting units for purposes of assessing potential future impairments of goodwill. SFAS 142 also requires the Company to complete a transitional goodwill impairment test six months from the date of adoption. The Company has accounted for the acquisition of Caimis, Inc. in accordance with the provisions of SFAS 142. Under the transition provisions of SFAS 142, the Company has not recorded amortization of goodwill relating to the Caimis, Inc. acquisition.
In August 2001, the FASB issued SFAS 144, “Accounting for the Impairment or Disposal of Long-Lived Assets,” which supersedes SFAS 121, “Accounting for the Impairment of Long-Lived Assets and for Long-Lived Assets to be Disposed of,” and the accounting and reporting provisions of APB 30, “Reporting the Results of Operations — Reporting the Effects of Disposal of a Segment of a Business, and Extraordinary, Unusual and Infrequently Occurring Events and Transactions.” SFAS 144 addresses financial accounting and reporting for the impairment or disposal of long-lived assets and is effective for fiscal years beginning after December 15, 2001, and interim periods within those fiscal years. The Company believes the adoption of SFAS 144 will not have a material impact on its financial statements.
2. Concentrations
Credit Risk
Financial instruments that subject the Company to concentrations of credit risk consist primarily of cash and cash equivalents and trade accounts receivable. The Company maintains its cash and cash equivalents with reputable financial institutions, and at times, cash balances may be in excess of FDIC insurance limits. The Company extends differing levels of credit to customers, does not generally require collateral, and maintains reserves for potential credit losses based upon the expected collectibility of accounts receivable. Credit losses to date have been within management’s expectations and have not been significant.
For the years ended December 31, 2001, 2000 and 1999, only one customer comprised more than 10% of net revenues as follows (in thousands, except percentages):
As of December 31, 2001, 2000 and 1999 the Company had receivable balances from the customer approximating 18%, 31% and 16%, of total accounts receivable, respectively.
International Revenues
Net revenues from international product shipments were $13.3 million in 2001, $12.1 million in 2000 and $3.2 million in 1999.
48
Year Ended December 31,
2001 2000 1999
Amount of net revenues $ 18,799 $ 22,426 $ 7,549 As a percentage of total net revenues 24 % 30 % 31 %

Table of Contents
IXIA
NOTES TO CONSOLIDATED FINANCIAL STATEMENTS (Continu ed)
Sources of Supply
The Company currently buys a number of key components of its products from a limited number of suppliers. Although there are a limited number of manufacturers of these components, management believes that other suppliers could provide similar components on comparable terms. A change in suppliers, however, could cause a delay in manufacturing and a possible loss of sales, which could affect operating results adversely.
3. Selected Balance Sheet Data (in thousands)
Accounts Receivable, Net
Accounts receivable, net consisted of the following:
Inventories
Inventories consisted of the following:
Property and Equipment, Net
Property and equipment, net consisted of the following:
49
December 31, December 31, 2001 2000
Trade accounts receivable $ 8,001 $ 12,134 Allowance for doubtful accounts (467 ) (260 ) $ 7,534 $ 11,874
December 31, December 31, 2001 2000
Raw materials $ 1,502 $ 2,612 Work in process 1,510 2,039 Finished goods 304 938 $ 3,316 $ 5,589
December 31, December 31, 2001 2000
Computer equipment $ 1,155 $ 770 Computer software 735 382 Demonstration equipment 6,173 2,470 Furniture and other equipment 2,845 1,365 Leasehold improvements 434 237 11,342 5,224 Accumulated depreciation (4,521 ) (1,663 ) $ 6,821 $ 3,561


Table of Contents
IXIA
NOTES TO CONSOLIDATED FINANCIAL STATEMENTS (Continu ed)
Accrued Expenses
Accrued expenses consisted of the following:
4. Acquisition
On November 5, 2001, the Company completed the acquisition of all of the outstanding capital stock of Caimis, Inc., a company that develops software products for routing optimization and network performance that are targeted at major carriers, internet service providers and large enterprises. The results of Caimis’ operations have been included in the consolidated financial statements since the acquisition date. Proforma results of operations have not been presented because the effect of this acquisition was not material.
The aggregate cash purchase price, net of acquisition costs, was $1,990,000. In addition, a contingent payment of up to $3.5 million may be paid in 2003 based upon sales through December 31, 2002 of certain Caimis products. The following table summarizes the estimated fair values of the assets acquired and liabilities assumed at the date of acquisition (in thousands):
Of the $1,746,000 of acquired intangible assets, $1,482,000 was assigned to unpatented technology and $264,000 was assigned to the non-compete covenant. The unpatented technology and the non-compete covenant will be amortized using a straight-line method over their expected useful lives of seven and two years, respectively.
5. Goodwill and Other Intangible Assets
As of December 31, 2001, intangible assets consisted of goodwill, unpatented technology and a non-compete agreement with a gross carrying amount of $848,000, $1,482,000 and $264,000, respectively. The aggregate amortization expense for the year ended December 31, 2001 was $58,000. Annual amortization of the intangible assets is expected to be $344,000, $322,000, $212,000, $212,000 and $598,000 for the years ending December 31, 2002, 2003, 2004, 2005 and thereafter, respectively.
50
December 31, December 31, 2001 2000
Accrued payroll $ 388 $ 277 Accrued commissions 403 811 Accrued bonuses 397 2,456 Accrued warranty 160 334 Accrued sales tax 180 752 Accrued vacation 603 357 Other 1,186 505 $ 3,317 $ 5,492
Current assets $ 51 Property and equipment 50 Intangible assets 1,746 Goodwill 848 Total assets acquired 2,695 Current liabilities assumed (705 ) Net assets acquired $ 1,990

Table of Contents
IXIA
NOTES TO CONSOLIDATED FINANCIAL STATEMENTS (Continu ed)
6. Income Taxes
Income tax expense consisted of the following (in thousands):
The net effective income tax rate differed from the federal statutory income tax rate as follows (in thousands):
The primary components of temporary differences that gave rise to deferred taxes were as follows (in thousands):
Realization of the December 31, 2001 deferred tax assets is dependent on the Company generating sufficient taxable income in the future. Although realization is not assured, the Company believes it is more likely than not that the deferred tax assets will be realized. The amount of the deferred tax assets considered realizable, however, could be reduced in the future if estimates of future taxable income are reduced.
Year Ended December 31,
2001 2000 1999
Current: Federal $ 7,509 $ 13,973 $ 3,685 State (41 ) 3,219 840 Deferred: Federal (148 ) (2,544 ) (445 ) State (99 ) (403 ) 23 $ 7,221 $ 14,245 $ 4,103
Year Ended December 31,
2001 2000 1999
Federal statutory expense: $ 5,940 $ 7,781 $ 3,030 State taxes, net of federal benefit 441 1,277 520 Research and development credits (1,339 ) (970 ) (156 ) Nondeductible stock-based compensation 2,120 6,049 702 Other 59 108 7 Income tax expense $ 7,221 $ 14,245 $ 4,103 Net effective income tax rate 42.6 % 64.1 % 46.0 %
December 31, December 31, 2001 2000
Deferred tax assets: State income taxes $ 76 $ 978 Allowance for doubtful accounts 192 114 Depreciation and amortization (384 ) 82 Research and development credit carryforward — 145 Warranty accruals 66 147 Deferred revenue 609 644 Stock-based compensation 2,008 692 Inventory adjustments 508 320 Net operating loss 388 — Other 108 462 Total deferred tax assets 3,571 3,584 Current 3,520 3,321 Non-current $ 51 $ 263

51

Table of Contents
IXIA
NOTES TO CONSOLIDATED FINANCIAL STATEMENTS (Continu ed)
As of December 31, 2001, the Company had net operating losses for both federal and state income tax purposes of approximately $945,000, which expire at various dates between 2009 and 2019, respectively. These net operating losses can be carried forward to offset future taxable income, if any. Section 382 of the Internal Revenue Code imposes an annual limitation on the utilization of net operating loss carryforwards based on a statutory rate of return (usually the “applicable federal funds rate”, as defined in the Internal Revenue Code) and the value of the corporation at the time of a “change in ownership” as defined by Section 382. The annual limitation under Section 382 of the Internal Revenue Code is approximately $125,000.
7. Commitments and Contingencies
Leases
The Company leases its facilities and certain computer equipment under noncancelable operating leases for varying periods through January 2007, excluding options to renew. The following are the future minimum commitments under these leases (in thousands):
Rent expense for the years ended December 31, 2001, 2000 and 1999 was approximately $1,387,000, $871,000 and $67,000, respectively.
Litigation
From time to time, certain legal actions may arise in the ordinary course of the Company’s business. To date, such legal actions have not had a material adverse effect on the Company’s financial position, results of operations or cash flows.
8. Shareholders’ Equity
Stock Splits
In January 1998, the Board of Directors authorized a five-for-one split of the Company’s common stock, effected in the form of a stock dividend paid to shareholders of record on March 16, 1998. In February 2000, the Board of Directors authorized a three-for-one split of the Company’s common stock, effected in the form of a stock dividend paid to shareholders of record on March 21, 2000. The share information in the accompanying financial statements and related notes for all periods prior to these stock splits has been adjusted to reflect the stock splits.
Common Stock
In June 1999, the Company issued 225,000 shares of common stock to a director in exchange for services and $64,000. The deemed fair value of these shares for accounting purposes was determined to be $243,000, of which the intrinsic value of $179,000 was recognized as stock-based compensation expense for the year ended December 31, 1999.
52
Year Ending December 31,
2002 $ 1,353 2003 1,283 2004 1,252 2005 1,282 2006 1,313 Thereafter 556 $ 7,039

Table of Contents
IXIA
NOTES TO CONSOLIDATED FINANCIAL STATEMENTS (Continu ed)
In August 1999, the Company issued 900,000 shares of common stock to its two employee founders in exchange for services and notes receivable totaling $255,000. The shares were subject to a lapsing repurchase right with vesting in eight equal quarterly installments commencing on September 30, 1999, subject to acceleration provisions for certain employment termination situations. The deemed fair value of these shares for accounting purposes was determined to be $1,287,000, resulting in deferred stock-based compensation totaling $1,032,000, of which approximately $150,000, $559,000 and $323,000 was recognized as stock-based compensation expense for the years ended December 31, 2001, 2000 and 1999, respectively. As of December 31, 2001, all of these shares were vested.
In September 1999, the Company issued 225,000 shares of common stock to a non-employee shareholder in exchange for services and note receivable totaling $64,000. The shares were subject to a lapsing repurchase right with vesting in eight equal quarterly installments commencing on September 30, 1999, subject to acceleration provisions for certain service termination situations. This stock award is a variable award and resulted in a reduction to deferred stock-based compensation of approximately $391,000 during the year ended December 31, 2001. During the years ended December 31, 2000 and 1999, deferred stock-based compensation increase by approximately $2,044,000 and $1,002,000 respectively. Stock-based compensation expense for the years ended December 31, 2001, 2000, and 1999 was approximately $726,000, $1,654,000 and $275,000. As of December 31, 2001, all of these shares were vested.
In September 1999, the Company issued 300,000 shares of common stock to an employee in exchange for $85,000. The shares are subject to a lapsing repurchase right which allows the Company at its option to repurchase any unvested shares at the original purchase price of $0.28 per share. 75,000 of the shares vested on September 30, 2000 with the remaining shares vesting in twelve equal quarterly installments commencing on December 31, 2000. The deemed fair value of these shares for accounting purposes was determined to be $462,000, resulting in deferred stock-based compensation totaling $377,000, of which stock-based compensation expense for the years ended December 31, 2001, 2000 and 1999 was $79,000, $149,000 and $98,000, respectively. As of December 31, 2001, approximately 131,000 of these shares were unvested.
Notes Receivable from Shareholders
In August 1999, the Company received promissory notes from the Company’s two employee founders and a non-employee shareholder which totaled $319,000 for the issuance of 1,125,000 shares of common stock. As of December 31, 2001, the notes were paid in full. As of December 2000, the promissory notes totaled $262,000. The notes bore interest at 8% per annum and were due at various dates through September 2002. The notes, which were classified as a component of shareholders’ equity, were full recourse and were collateralized by the related shares of the Company. For the year ended December 31, 2001, 2000 and 1999, the Company recorded interest income related to these notes receivable of approximately $8,000, $24,000 and $9,000, respectively.
Warrants
In August 2000, the Company issued warrants to purchase 80,000 shares of common stock to a director. The warrants have an exercise price of $7.00 and vest in sixteen equal quarterly installments commencing September 30, 2000. The deemed fair value of these warrants for accounting purposes was determined to be $777,000, resulting in deferred stock-based compensation totaling $217,000, of which approximately $92,000 and $108,000 was recognized as stock-based compensation expense for the year ended December 31, 2001 and 2000, respectively. As of December 31, 2001, approximately 50,000 of these shares were unvested.
Stock Options
The Company’s 1997 Stock Option Plan, as amended (the “1997 Plan”), provides for the issuance of stock-based awards to qualified employees, employee directors and consultants of the Company. The stock-based awards may include incentive stock options or nonqualified stock options. Options become exercisable over a vesting period as determined by the Board of Directors and expire over terms not exceeding 10 years from the date of grant. The exercise price for options granted under the 1997 Plan may not be granted at less than 100% of the fair market value of the Company’s common stock on the date of grant (110% if granted to an employee who owns more than 10% of
53

Table of Contents
IXIA
NOTES TO CONSOLIDATED FINANCIAL STATEMENTS (Continu ed)
the voting shares of the outstanding stock). Options generally vest 25% on the first anniversary of the grant date with the remaining options vesting in 12 equal quarterly installments with the first installment vesting on the last day of the first full calendar quarter following the first anniversary. In the event the holder ceases to be employed by the Company, all unvested options are forfeited and all vested options may be exercised within a period of up to 30 days after optionee’s termination for cause, up to three months after termination other than for cause or death or disability, or up to six months after termination by disability or death. As of December 31, 2001, the Company has reserved 19,000,000 shares of its common stock for issuance under the 1997 Plan, 3,593,000 of which were available for future grant as of such date.
The Company’s Director Plan (the “Director Plan”) was approved by our shareholders in September 2000 and provides for the issuance of stock-based awards to Company non-employee directors. The Company has reserved a total of 200,000 shares of common stock for issuance under the plan. The option grants under the plan are automatic and non-discretionary, and the exercise price of the options is 100% of the fair market value of our common stock on the grant date. The plan provides for an initial grant to a non-employee director of an option to purchase 10,000 shares of common stock upon the director’s initial election or appointment to the board. The plan also provides for each non-employee director to be granted an option to purchase 5,000 shares of common stock upon the director’s re-election to the board at an annual meeting of shareholders, provided the director has served as a non-employee director for at least six months preceding the date of the annual meeting. The grants become exercisable in four equal quarterly installments commencing on the last day of the calendar quarter in which the option is granted. The plan will terminate in September 2010, unless terminated sooner by the Board of Directors. As of December 31, 2001, the Director Plan had 180,000 shares available for future grant.
The following table summarizes information relating to stock option activity under the above plans for the years ended December 31, 2001, 2000 and 1999 (in thousands, except per share data):
Options granted for the years ended December 31, 2000 and 1999 resulted in total deferred stock-based compensation of $33,908,000 and $3,982,000, respectively, which was recorded as deferred compensation in shareholders’ equity. The deferred stock-based compensation represented the difference between the exercise price of the options and the deemed fair value of the Company’s common stock for accounting purposes at the date of grant. The deferred stock-based compensation is recognized as stock-based compensation expense in the statements of income over the related vesting periods of the options. Deferred stock-based compensation at December 31, 2001 decreased from deferred stock-based compensation at December 31, 2000 by $1,736,000 as a result of the forfeiture of stock options and changes in the market value of the Company’s common stock that affected certain equity instruments which received variable accounting treatment.
54
Outstanding Weighted Average Options Number Exercise Price of Shares Per Share
Options Outstanding as of December 31, 1998 3,815 $ 0.05 Granted 3,300 0.29 Exercised (776 ) 0.02 Canceled (91 ) 0.28 Options Outstanding as of December 31, 1999 6,248 0.18 Granted 6,636 4.30 Exercised (1,932 ) 0.12 Canceled (179 ) 3.79 Options Outstanding as of December 31, 2000 10,773 2.67 Granted 2,644 11.91 Exercised (1,861 ) 0.86 Canceled (698 ) 4.36 Options Outstanding as of December 31, 2001 10,858 $ 5.13

Table of Contents
IXIA
NOTES TO CONSOLIDATED FINANCIAL STATEMENTS (Continu ed)
For the years ended December 31, 2001, 2000 and 1999, stock-based compensation expense related to stock option grants included in the accompanying statements of income was approximately $11,141,000, $14,162,000 and $1,010,000, respectively. Annual amortization of deferred stock-based compensation as of December 31, 2001 is expected to be $6,148,000, $2,747,000 and $523,000 for the years ending December 31, 2002, 2003 and 2004, respectively. The amount of deferred stock-based compensation expense to be recorded in future periods could decrease if options and stock subject to repurchase for which unearned compensation has been recorded are forfeited or repurchased. Changes in the market value of the Company’s common stock could also affect future stock-based compensation expense related to equity instruments, which receive variable accounting treatment.
Additional information with respect to stock options outstanding as of December 31, 2001 is as follows (in thousands, except per share data):
The average fair value for accounting purposes of options granted was $11.91, $11.64 and $1.69 per share for the years ended December 31, 2001, 2000 and 1999, respectively. There were no options exercised subject to repurchase as of December 31, 2001.
The Company calculated the fair value of each option grant on the respective dates of grant using the Black-Scholes option pricing model as prescribed by SFAS 123 using the following assumptions:
Had compensation costs been determined based upon the Black-Scholes methodology prescribed under SFAS 123, the Company’s net income and basic and diluted net income per share would approximate the following pro forma amounts (in thousands, except per share data):
55
Options Outstanding Options Exercisable
Weighted Average Weighted Weighted Remaining Average Average
Range of Number Contractual Exercise Number Exercise Exercise Price Outstanding Life Price Outstanding Price
$0.01 to $0.28 1,973 6.75 $ 0.16 1,213 $ 0.13 0.32 to 0.36 2,491 8.00 0.35 818 0.35 0.37 to 7.00 2,701 8.47 4.34 595 3.77 8.61 to 10.25 2,184 9.29 9.81 241 9.82 11.00 to 20.00 1,359 9.37 13.39 148 13.89 21.50 to 21.50 150 9.01 21.50 — — $0.01 to $21.50 10,858 8.34 $ 5.13 3,015 $ 2.36
Year Ended December 31,
2001 2000 1999
Expected lives (in years) 4 10 10 Risk-free interest rates 4 % 6 % 6 % Dividend yield 0 % 0 % 0 % Expected volatility 95 % 80 % 0 %

Table of Contents
IXIA
NOTES TO CONSOLIDATED FINANCIAL STATEMENTS (Continu ed)
Employee Stock Purchase Plan
The employee stock purchase plan was adopted and approved in September 2000. The plan became effective upon the closing of the Company’s initial public offering in October 2000. The Company has reserved a total of 300,000 shares of common stock for issuance under the plan, together with the potential for an annual increase in the number of shares reserved under the plan on May 1 of each year. As of December 31, 2001, 66,000 shares were issued under the plan and 234,000 shares were available for future grant. As of December 31, 2000, there were no shares issued under the plan.
The plan permits eligible employees to purchase common stock, subject to limitations as set forth in the plan agreement, through payroll deductions, which may not exceed the lesser of 15% of an employee’s compensation or $25,000 per annum.
Unless the Board of Directors determines otherwise, the plan is implemented in a series of overlapping 24-month offering periods with new offering periods commencing on May 1 and November 1 of each year. Each offering period is divided into four consecutive six-month purchase periods. All participants in an offering period are granted an option on the first day of the offering period, and the option is automatically exercised on the last day of each purchase period throughout the offering period. The purchase price of the Company’s common stock for each purchase period within an offering period is 85% of the lesser of the fair market value per share on the first trading day of the offering period or on the last trading day of the applicable purchase period, whichever is lower.
9. Earnings Per Share
The following table sets forth the computation of basic and diluted net income (loss) per share for the periods indicated (in thousands, except per share data):
56
Reported Pro Forma
For the year ended December 31, 1999: Net income $ 4,810 $ 4,664 Earnings per share – Basic $ 0.11 $ 0.11 Earnings per share – Diluted $ 0.10 $ 0.10 For the year ended December 31, 2000: Net income $ 7,985 $ 6,011 Earnings per share – Basic $ 0.17 $ 0.13 Earnings per share – Diluted $ 0.15 $ 0.11 For the year ended December 31, 2001: Net income $ 9,749 $ 1,408 Earnings per share – Basic $ 0.18 $ 0.03 Earnings per share – Diluted $ 0.16 $ 0.02

Table of Contents
IXIA
NOTES TO CONSOLIDATED FINANCIAL STATEMENTS (Continu ed)
The diluted per share computations for the years ended December 31, 2001 and 2000, excludes 309,000 and 161,000 options, respectively, which were antidilutive. There were no antidilutive shares excluded from the diluted earnings computation for the year ended December 31, 1999.
10. Retirement Plan
The Company provides a 401(k) Retirement Plan (the “Plan”) to eligible employees who may authorize up to 15% of their compensation to be invested in employee elected investment funds. As determined annually by the Board of Directors, the Company may contribute matching funds of up to 6% of the employee’s compensation. These matching contributions vest based on the employee’s years of service with the Company. For the years ended December 31, 2001, 2000 and 1999, the Company expensed and made contributions to the Plan in the amount of approximately $349,000, $143,000 and $59,000, respectively.
11. Related Party Transactions
In June 1998, the Company received $500,000 from a director/shareholder of the Company in exchange for a note. In September 1999, the Company repaid the note in full.
Revenues from companies in which a director/shareholder of the Company is a significant shareholder or in which certain directors of the Company are directors of a parent company, totaled $2,165,000, $1,820,000 and $436,000 for the years ended December 31, 2001, 2000 and 1999, respectively. Related party accounts receivable as of December 31, 2001 and 2000 were $168,000 and $66,000, respectively.
12. Subsequent Event
On February 14, 2002, the Company completed the acquisition of the ANVL product line from Empirix, Inc. ANVL (Automated Network Validation Library) protocol conformance testing products are used by network equipment manufacturers in the development of networking devices to validate protocol implementation. The purchase price was $5,000,000 in cash. In addition, a contingent cash payment of up to $1,000,000 may be paid based upon sales through March 31, 2003 of ANVL products and services.
57
Year Ended December 31,
2001 2000 1999
Basic Presentation Numerator: Net income $ 9,749 $ 7,985 $ 4,810 Denominator: Weighted average common shares 54,789 48,060 44,029 Adjustment for common shares subject to repurchase (239 ) (816 ) (455 ) Adjusted weighted average common shares 54,550 47,244 43,574 Basic net income per share $ 0.18 $ 0.17 $ 0.11 Diluted presentation Denominator: Shares used above 54,550 48,060 44,029 Weighted average effect of dilutive securities: Stock options 7,188 4,901 1,486 Common shares subject to repurchase 239 816 455 Denominator for diluted calculation 61,977 53,777 45,970 Diluted net income per share $ 0.16 $ 0.15 $ 0.10

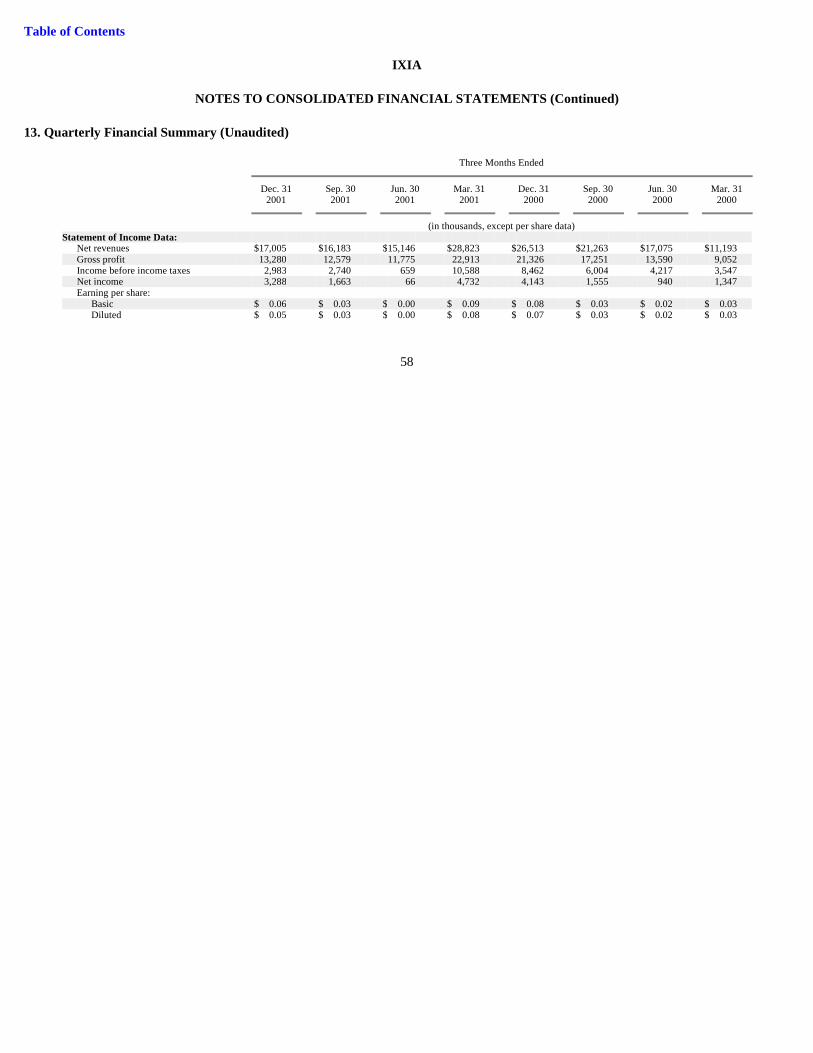
Table of Contents
IXIA
NOTES TO CONSOLIDATED FINANCIAL STATEMENTS (Continu ed)
13. Quarterly Financial Summary (Unaudited)
58
Three Months Ended
Dec. 31 Sep. 30 Jun. 30 Mar. 31 Dec. 31 Sep. 30 Jun. 30 Mar. 31 2001 2001 2001 2001 2000 2000 2000 2000
(in thousands, except per share data) Statement of Income Data: Net revenues $ 17,005 $ 16,183 $ 15,146 $ 28,823 $ 26,513 $ 21,263 $ 17,075 $ 11,193 Gross profit 13,280 12,579 11,775 22,913 21,326 17,251 13,590 9,052 Income before income taxes 2,983 2,740 659 10,588 8,462 6,004 4,217 3,547 Net income 3,288 1,663 66 4,732 4,143 1,555 940 1,347 Earning per share: Basic $ 0.06 $ 0.03 $ 0.00 $ 0.09 $ 0.08 $ 0.03 $ 0.02 $ 0.03 Diluted $ 0.05 $ 0.03 $ 0.00 $ 0.08 $ 0.07 $ 0.03 $ 0.02 $ 0.03

Exhibit 10.13
October 27, 2001
Mr. David Anderson XXXX XXXX
Dear David,
On behalf of Ixia (“Ixia” or the “Company”), I am pleased to offer you employment as Senior Vice President, Worldwide Sales and Business Development Operations, on the terms and conditions set forth in this letter. As Senior Vice President, Worldwide Sales and Business Development Operations, you will report directly to the President and Chief Executive Officer of Ixia, will be principally responsible for worldwide sales and business development, and will have such other duties and responsibilities as may be delegated to you from time to time by the Company’s Chief Executive Officer and/or Board of Directors.
You agree to devote your full-time attention and best efforts to the performance and discharge of such duties and responsibilities and to perform and discharge such duties and responsibilities faithfully, diligently and to the best of your abilities.
Effective as of the date upon which you accept this offer (“your start date”), your compensation and benefits will be as follows:
FY2002 Quarterly and Annual Quota will be finalized at budget meetings prior to January 2002. If quota is exceeded in any given quarter, the commission rate will be increased by .5% for sales over quota. The terms of your commission plan for post-2002 periods will be subject to change and the approval of the Ixia Board of Directors.
1. Your annual base salary will be $250,000 USD (i.e. $9,615.38 per bi-weekly period). 2. For the period from your start date through December 31, 2002, you will earn a commission based on all sales of the Company’s
products as detailed below to customers through all channels.
Period Sales Budget Commission Rate
Q4/01 If quota is exceeded, the commission rate is .2% for sales over quota $ 17,500,000 .187 % FY 2002 Annual Budget on Ixia products with the exception of the Ixia 100 and other NetOps products $ 90,000,000 .167 % FY 2002 Annual Budget on the Ixia 100 and other NetOps Products $ 8,000,000 .625 %
3. You will be entitled to three weeks Personal-Time-Off and ten holidays per year.

You reserve the right to terminate your employment with the Company at any time for any reason, and we reserve the right to terminate your employment at any time, for any reason.
This letter contains our entire understanding with respect to your continuing employment with Ixia and replaces and supercedes in its entirety the employment offer letter dated July 23, 2001. The provisions of this letter may be amended only by a writing signed by you and the Chief Executive Officer of Ixia. This letter agreement shall be construed under the laws of California.
Please acknowledge your acceptance of this offer by signing and dating the enclosed copy of this letter where indicated below and returning such signed copy to me for receipt no later than October 30, 2001.
Accepted:
4. You will receive applicable benefits, including health insurance, long-term disability as well as life insurance, as are generally provided to Ixia’s executive officers, except for the officer bonus plan.
5. You will be covered by Ixia’s Officer Severance Plan (a copy of which is enclosed). For purposes of the Severance Plan, your Annual
Compensation (as such term is defined in the Severance Plan) for the period from your start date through December 31, 2002 shall be $450,000.
6. Ixia will reimburse you for the cost of purchasing a cellular telephone and the monthly service charges incurred in using such telephone
for business purposes and all out-of-pocket costs related to operating Ixia company business from your home office. You will also receive 32.5 cents for each business mile to cover your car expenses. Reimbursement requests must be submitted in accordance with Ixia policy.
7. In addition to the Options granted to you on August 3, 2001, I will recommend that the Company’s Compensation Committee grant to
you effective on the date of your acceptance of this offer with Ixia, a stock option (incentive stock options to the maximum extent permitted under law, with the balance being nonstatuatory (stock options) under the Company’s stock option plan (the “Plan”), to purchase 200,000 shares of Ixia Common Stock at an exercise price equal to the closing sales price of Ixia’s Common Stock on the date of the option grant (the “Option”). Your Option will vest and become exercisable, cumulatively, in 16 equal quarterly installments commencing on the last day of the first full calendar quarter following the date of the Option grant, as long as you remain an employee of the Company. In addition, your Option will be subject in all respects to the terms and provisions of the Plan and the Stock Option Agreement evidencing the grant of your Option. Your Option will expire, to the extent previously unexercised, upon the earlier of ten years from the date of grant or 30 days (at a minimum) after you cease to be an employee of the Company. In addition to the foregoing principal terms, your Option will include such other terms and conditions that are customarily included in options granted to employees of the Company.
8. To assist with your relocation to Michigan, Ixia will pay you up to a maximum of $50,000 to reimburse you for you accountable out-of-
pocket costs incurred in (i) packing and shipping your personal items and cars to Michigan and (ii) coach airline tickets to Michigan for you and your family.
Sincerely,
/s/ Errol Ginsberg
Errol Ginsberg President and Chief Executive Officer
/s/ David Anderson
Date:
October 30, 2001
David Anderson

Exhibit 21.1
SUBSIDIARIES OF THE REGISTRANT STATE OR OTHER JURISDICTION OF NAME OF SUBSIDIARY* INCORPORATION OR ORGANIZATION
Caimis, Inc. Delaware
* The subsidiary of the Registrant does not do business under any name other than as listed above.

Exhibit 23.1
Consent of Independent Accountants
We hereby consent to the incorporation by reference in the Registration Statements on Forms S-8 (No.’s 333-48814 and 333-66382) of Ixia of our reports dated January 30, 2002, except for the subsequent event described in Note 12 to the financial statements, as to which the date is February 14, 2002, relating to the consolidated financial statements and consolidated financial statement schedule, which appears in this Form 10-K.
/s/ PricewaterhouseCoopers LLP
Los Angeles, California March 21, 2002
End of Filing
© 2005 | EDGAR Online, Inc.