IVUS and PCI, optimizing the final results (2007,2,10)
48
Myeong-Ki Hong, MD, PhD Cardiac Center, Asan Medical Center University of Ulsan College of Medicine, Seoul, Korea Myeong Myeong - - Ki Ki Hong, MD, PhD Hong, MD, PhD Cardiac Center, Cardiac Center, Asan Asan Medical Center Medical Center University of Ulsan College of Medicine, University of Ulsan College of Medicine, Seoul, Korea Seoul, Korea IVUS and PCI: Optimzing the Final Results
Transcript of IVUS and PCI, optimizing the final results (2007,2,10)

Myeong-Ki Hong, MD, PhDCardiac Center, Asan Medical Center
University of Ulsan College of Medicine, Seoul, Korea
MyeongMyeong--KiKi Hong, MD, PhDHong, MD, PhDCardiac Center, Cardiac Center, AsanAsan Medical Center Medical Center
University of Ulsan College of Medicine, University of Ulsan College of Medicine, Seoul, KoreaSeoul, Korea
IVUS and PCI: Optimzing the Final Results

• Lesion with Intermediate or short length• Stent size and length ?
Coronary angiography
(1)(2)
(3)

IVUS : Practical Uses in the Cath Lab
Size
Plaque Length
Plaque Type

Impact of preintervention IVUS on TCT strategies in 313 lesions
Change in therapy (n=124, 40%)1.Assessment of lesion severity leading to
revascularization when none had been planned (6%)2.Avoidance of surgery or TCT that had originally been
planned (7%)3.Assessment of lesion composition leading to a change
in TCT (6%)4.Selection of the revascularization strategy (20%)
Mintz GS et al, Am J Cardiol 1994
Key Roles of IVUS in PCIKey Roles of IVUS in PCI
Pre-intervention imagingPlaque morphology and calciumPost-intervention evaluationComplicationsRestenosis

IVUS in the BMS era

Studies supporting IVUS-guided Bare metal stenting is better?
XOPTICUS (Circulation 2001;104:1343-9)XBEST (Circulation 2003;107:545-551)XTULIP (Circulation 2003;107:62-7)XRESIST (JACC 1998;32:320-8)
XXGaster et al (Heart 2003;89:1043-9)XAVID (Circulation 1999;100:I-234)
XXSIPS (Circulation 2000;102:2497-502)XCRUSE (Circulation 2000;102523-30)XChoi et al (AHJ 2001;142:112-8)
IVUS also
Cheaper
IVUS Better
AngioBetter

Combined Endpoints (Death & MI)Meta-analysis
Gianni Casella et al, Gianni Casella et al, CathetCathet CardiovascCardiovasc InterventIntervent 2003;59:3142003;59:314--321321
69/1,524 (4.5)28/606 (4.6%)19/270 (7%)4/178 (2.2%)5/18 (3.1%)
41/918 (4.4%)1/73 (1.3%)
25/372 (6.7%)9/273 (3.3%)1/79 (1.2%)
5/121 (4.1%)
IVUS-guided
60/1,448 (4.1%)Total17/483 (3.5%)Subtotal16/229 (7%)CRUISE. 20001/100 (1%)Choi et al. 19970.154 (0%)Albiero et al. 1995
Registries
43/965 (4.4%)Subtotal
5/77 (6.5%)TULIP. 200117/387 (4.4%)AVID. 199910/277 (3.6%)OPTICUS. 1998
1/76 (1.3%)RESIST. 19970/148 (6.7%)SIPS. 1996
Randomized trials
Angio-guided Study
1.13 (0.79-1.61)1.37 (0.74-2.54)1.01 (0.51-2.01)
2.28 (0.25-20.65)11.07 (0.61-201.97)
1.02 (0.65-1.57)0.20 (0.02-1.75)1.57 (0.83-2.95)0.91 (0.36-2.28)
0.96 (0.06-15.65)0.59 (0.20-1.79)
0.01 0.2 1 5 10IVUS-guided better Angio-guided better
Odds ratios and 95% CI Fixed

Binary RestenosisMetaMeta--analysisanalysis
Gianni Gianni CasellaCasella et al, et al, CathetCathet CardiovascCardiovasc InterventIntervent 2003;59:3142003;59:314--321321
186/806 (23%)51/263 (19%)
22/105 (20.9%)29/158 (18.3%)
135/539 (25%)15/73 (20.5%)56/229 (24.4%)16/71 (22.5%)48/166 (29%)
IVUS-guided
239/829 (28.8%)
Total72/261 (27.5%)Subtotal32/107 (29.9%)Blasini et al. 199540/154 (26%)Albiero et al. 1995
Registries
167/568 (29%)Subtotal
28/77 (36.4%)TULIP. 200152/228 (22.8%)OPTICUS. 199821/73 (28.7%)RESIST. 1997
66/190 (34.7%)SIPS. 1996Randomized trials
Angio-guided Study
0.75 (0.60-0.94)0.63 (0.42-0.95)0.62 (0.33-1.16)0.64 (0.37-1.10)
0.81 (0.62-1.06)0.45 (0.22-0.94)1.10 (0.71-1.69)0.72 (0.34-1.53)0.76 (0.49-1.20)
Odds ratios and 95% CI Fixed
0.01 0.2 1 5 10IVUS-guided better Angio-guided better

CRUISE: 9-Month TLRCRUISE: 9-Month TLR
0
5
10
15
20
IVUS (-)
8.5%8.5%
P=0.03P=0.03
15.3%15.3%
IVUS (+)
%N=499
Fitzgerald PJ, et al. Circulation 2000;1002:523Fitzgerald PJ, et al. Circulation 2000;1002:523

0
10
20
30
IVUS (+)
24.5%24.5%
P=NSP=NS
22.8%22.8%
IVUS (-)
% N=550
OPTICUS: 6-month angiographic restenosis rateOPTICUS: 6-month angiographic restenosis rate
HaraldHarald MudraMudra et al, Circulation. 2001;104:1343et al, Circulation. 2001;104:1343--99

The RESIST Randomized Trial
0
5
10
15
20
25
30
35
IVUS (n=79)IVUS (n=79)
AngioAngio (n=76)(n=76)
22.522.5
3131
2121
28.828.8
66--month angiographic month angiographic restenosis (%)restenosis (%)
1818--month TLR (%)month TLR (%)
SchieleSchiele et al, JACC 1998;32:320et al, JACC 1998;32:320--8 and Circulation 2000;102:II8 and Circulation 2000;102:II--547547
P=NS

Value of IVUS in simple or relatively simple lesions?
How about use of IVUS in complex lesions?
acorn
There is more or less on the same level and no one is outstanding in simple lesions

Impact of IVUS after Stenting of Long Coronary Lesion: TULIP Trial
0
10
20
30
40
50
ISR (6M)
2323
%
4545
P=0.008P=0.008P=0.026P=0.026
MACE (12M)10102323 12122727
TLR (12M)
P=0.018P=0.018
IVUS (n=73)Angio. (n=71)
OemrawsinghOemrawsingh et al, Circulation 2003;107:62et al, Circulation 2003;107:62--6767

0
10
20
30
40
50
< 20 20-40 > 40
Res
teno
sis
rate
(%)
P <0.0001
Stent length (mm)
0
10
20
30
40
50
<2.5 2.5-2.9 3.0-3.4 >3.5
Res
teno
sis
rate
(%)
P <0.0001
Reference MLD (mm)
0
10
20
30
40
50
<2.5 2.5-2.9
3.0-3.4
3.5-3.9
>4.0
Res
teno
sis
rate
(%)
P <0.0001
Final MLD (mm)
0
10
20
30
40
50
<6.0 6.0-8.9 9.0-11.9 >12
Res
teno
sis
rate
(%)
P <0.0001
Stent lumen CSA (mm2)
BMS

0
0.2
0.4
0.6
7.5 10
35
60
Stent L
engt
h, mm
Stent Lumen CSA, mm212.0
ISR(%)
4.0
IVUS predictors of ISR (BMS)
De Feyter, et al. Circulation 1999;100:1777

0
20
40
60
80< 20 mm > 20 mm
38382424
ISR
(%)
<5 5≤ <7 ≥ 71010 1313
73733333
P=0.049P=0.049P=0.409P=0.409
P=0.770P=0.770
Angiographic ISR According to Stent Lumen CSA and Stent Length (BMS)Angiographic ISR According to Stent Lumen CSA and Stent Length (BMS)
Stent CSA mm2
Hong MK, et al. 2000 AJC;85:441-445
p=0.001p=0.001

Seven IVUS CriteriaStent CSA at lesion segment1. > 100% of distal ref. lumen CSA. 2. > 90% of distal ref. lumen CSA. 3. > 80% of average ref. lumen CSA. 4. > 90% of average ref. lumen CSA. 5. > 55% of average ref. EEM CSA. 6. > 7 mm2. 7. > 9 mm2.
Relative
Absolute
Hong MK, Cathet Cardiovasc Intervent 2002; 56: 178-183

0
15
30
MetNot met
24.0%(50/208)
20.5% (72/352)
23.6%(75/318)
19.4%(47/242)
> 100% of distal Ref. Lumen CSA
Ang
iogr
aphi
c re
sten
osis
rate
(%)
P=0.321
> 90% of distal Ref. Lumen CSA
P=0.237
Hong MK, Cathet Cardiovasc Intervent 2002; 56: 178-183

0
15
30
MetNot met
22.3%(81/364)
20.9% (41/196)
24.4%(52/213)
20.2%(70/347)
> 80% of average Ref. Lumen CSA
Ang
iogr
aphi
c re
sten
osis
rate
(%)
P=0.715
> 90% of average Ref. Lumen CSA
P=0.238
Hong MK, Cathet Cardiovasc Intervent 2002; 56: 178-183

0
20
40
MetNot met22.4%
(43/192)21.5% (79/368)
14.8%(47/317)
30.9%(75/243)
> 55% of average Ref. EEM CSA
Ang
iogr
aphi
c re
sten
osis
rate
(%)
P=0.801
> 7 mm2
P=0.001
> 9 mm2
13.5%(19/141)
24.6%(103/419)
P=0.006
Hong MK, Cathet Cardiovasc Intervent 2002; 56: 178-183

Stent under-expansion,Plaque prolapse within
the stent
Edge dissectionIncomplete stent apposition
Problems after Stenting

Overall: 26.2% (91/ 348)With dissection29.9% (20/67)
Without dissection25.3% (71/281) P=0.540
0
10
20
30
Minor edge dissection vs. angiographic restenosis (BMS)Minor edge dissection vs. angiographic restenosis (BMS)
(%)
Overall Dissection (+)Dissection (-)
Hong MK, Am J Cardiol 2000; 86: 791-795

A
DC
BMinorPlaque
Prolapse
The extent of plaque prolapse < 25% of stent CSA

Overall: 23.1%With prolapse
21.3%Without prolapse
23.6%P=0.80615
20
25
Minor plaque prolapse vs. angiographic restenosis (BMS)Minor plaque prolapse vs. angiographic restenosis (BMS)
(%)
Overall With Without
Hong MH, Cathet Cardiovasc Intervent 2000; 51: 22-26

IVUS in the DES era


Are the minimal stent area by IVUS and stent length still important in the era of DES?
Minimal Stent CSA and Stent Length

00101020203030404050506060707080809090
100100
3.5
3.5
4.0
4.0
4.5
4.5
5.5
5.5
6.0
6.0
6.5
6.5
7.0
7.0
7.5
7.5
8.0
8.0
8.5
8.5
(%) (%) F/U MLA >4.0mmF/U MLA >4.0mm22
CypherCypher
5.0**5.0**
sensitivitysensitivityspecificityspecificity
00101020203030404050506060707080809090
100100
3.5
3.5
4.0
4.0
4.5
4.5
5.0
5.0
5.5
5.5
6.0
6.0
7.0
7.0
7.5
7.5
8.0
8.0
8.5
8.5
(%) (%) F/U MLA >4.0mmF/U MLA >4.0mm22
Bare Metal StentsBare Metal Stents
6.5*6.5*Minimum stent area (mmMinimum stent area (mm22)) Minimum stent area (mmMinimum stent area (mm22))
**predictive value=56%predictive value=56% ****predictive value=90%predictive value=90%
“Optimal” MSA (from SIRIUS)
Sonoda et al. JACC 2004;43:1959-63

Optimal Stent ExpansionTotal 219 patients
2.9
0 00
1
2
3
4
5
<6 6-7.5 >7.5
%
P=0.068
4.4
2.2 2.2
0
1
2
3
4
5
<6 6-7.5 >7.5
P=0.54
Final minimal stent area (mm2) Cheneau E et al. Am J Cardiol 2005
TLR MACE

Independent predictors by multivariate logistic regression analysis
1. IVUS minimum stent CSA (odds ratio=0.584, 95% CI 1. IVUS minimum stent CSA (odds ratio=0.584, 95% CI 0.3850.385––0.885, p=0.011),0.885, p=0.011),
2.Total stent length measured by IVUS (odds 2.Total stent length measured by IVUS (odds ratio=1.028, 95% CI 1.002ratio=1.028, 95% CI 1.002––1.055, p=0.038). 1.055, p=0.038).
IVUS predictors of angiographic restenosis after SES.
Hong MK, et al. Eur Heart J 2006; 27: 1305-1310

Angiographic restenosis rate
<0.001<0.001<0.001p
0.1166/70 (8.6%)11/62 (17.7%)17/132 (12.9%)> 40 mm
0.0901/284 (0.4%)3/127 (2.4%)4/411 (1.0%)< 40 mm
0.0027/354 (2.0%)14/189 (7.4%)21/543 (3.9%)Total
p> 5.5 mm2< 5.5 mm2TotalStent length
Stent CSA
IVUS predictors of angiographic restenosis after SES.
Hong MK, et al. Eur Heart J 2006; 27: 1305-1310

Importance of Full-lesion CoverageSIRIUS
0.03048.8±11.560.5±9.0Maximum reference plaque area, %
No (n=162)Yes (n=6)
1.0002 (1%)0Edge teat or dissection
0.3587.3±2.16.8±3.2Edge stent area, mm2
0.04986.4±2.34.7±2.3Reference minimum lumen area, mm2
0.8917.0±3.26.7±3.3Reference plaque, mm2
0.15610.7±3.810.7±3.8Reference area, mm2
pEdge Stenosis
Sakurai R et al. Am J Cardiol 2005;96:1251

IVUS analysis of DES failure- 121 patients, >30days after Cypher stent implantation• Angiographic restenosis in 20 lesions in 19 pts
- Proximal edge restenosis in 6 lesions- Intra-stent restenosis in 14 lesions
• Of 14 intra-stent restenosis lesions, IVUS analysis in 8 lesions- 2 Stent underexpansion- 4 Strut fractures
Lemos et al., Circulation 2003

Contribution of Stent Underexpansion to Recurrence After SES Implantation for ISR
•• 41 pts with ISR treated with SES and IVUS41 pts with ISR treated with SES and IVUS•• Recurrence in 11 lesions (all focal)Recurrence in 11 lesions (all focal)•• Stent underexpansion by IVUS compared with 16pts (19 lesions) wiStent underexpansion by IVUS compared with 16pts (19 lesions) without thout
recurrence as documented by angiography recurrence as documented by angiography -- 9/11 recurrent lesions had MSA <5.0mm9/11 recurrent lesions had MSA <5.0mm22 in in vsvs 5/19 non5/19 non--recurrent recurrent lesions (p=0.003)lesions (p=0.003)-- 7/11 recurrent lesions had MSA <4.0mm7/11 recurrent lesions had MSA <4.0mm22 in in vsvs 4/19 non4/19 non--recurrent recurrent lesions (p=0.02)lesions (p=0.02)-- 4/11 recurrent lesions had MSA <3.0mm4/11 recurrent lesions had MSA <3.0mm22 in in vsvs 1/19 non1/19 non--recurrent recurrent lesions (p=0.03)lesions (p=0.03)
•• Gap between multiple stents: 3/11 recurrent lesions Gap between multiple stents: 3/11 recurrent lesions vsvs 1/19 non1/19 non--recurrent recurrent lesion (p=0.005)lesion (p=0.005)
-> Complete lesion coverage and adequate stent expansion are important in the DES treatment of ISR
FujiiFujii et al. Circulation 2004et al. Circulation 2004

IVUS predictors of Cypher Thrombosis
00112233445566778899
1010
Minimum stentMinimum stentCSA (mmCSA (mm22))
Stent expansionStent expansion(%)(%)
Residual edgeResidual edgestenosis (%)*stenosis (%)*
SES Thrombosis (n=15)SES Thrombosis (n=15)
Matched controls (n=45)Matched controls (n=45)
00101020203030404050506060707080809090
100100
••2,575 patients were treated with 4,722 Cypher stents. 2,575 patients were treated with 4,722 Cypher stents. ••21 (0.8%) had stent thrombosis of whom 15 had IVUS 21 (0.8%) had stent thrombosis of whom 15 had IVUS ••12/15 SES thrombosis lesions has stent CSA <5.0mm12/15 SES thrombosis lesions has stent CSA <5.0mm22 (vs 13/45 controls)(vs 13/45 controls)
A
DC
B
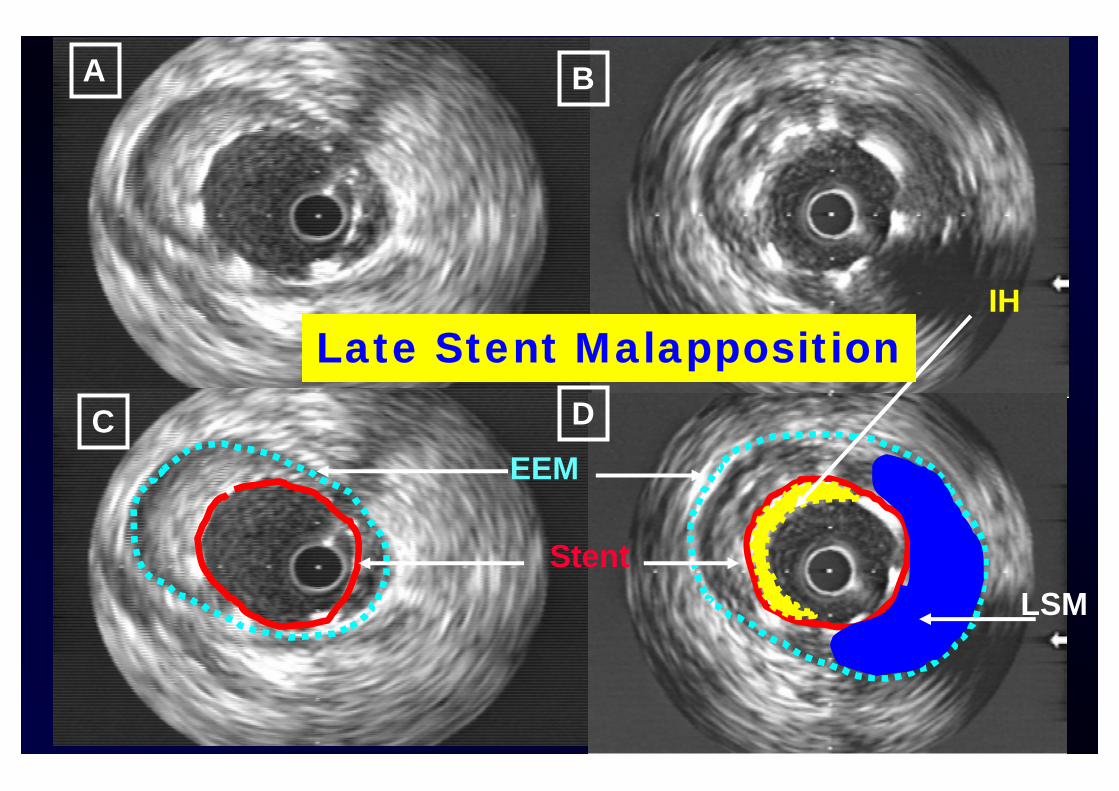
EEM
Stent
IH
LSM
Late Stent Malapposition

Stent malapposition in SIRIUS
0 (0%)0 (0%)7 (8.7%)*7 (8.7%)*New late New late malappositonmalappositon
6666PersistentPersistent
3377ResolvedResolved
9 (14.7%)9 (14.7%)13 (16.3%)13 (16.3%)Baseline malappositionBaseline malapposition
Bare Stent (n=61)
Cypher Stent (n=80)
**p<0.05, but without events at 6p<0.05, but without events at 6--monthsmonths
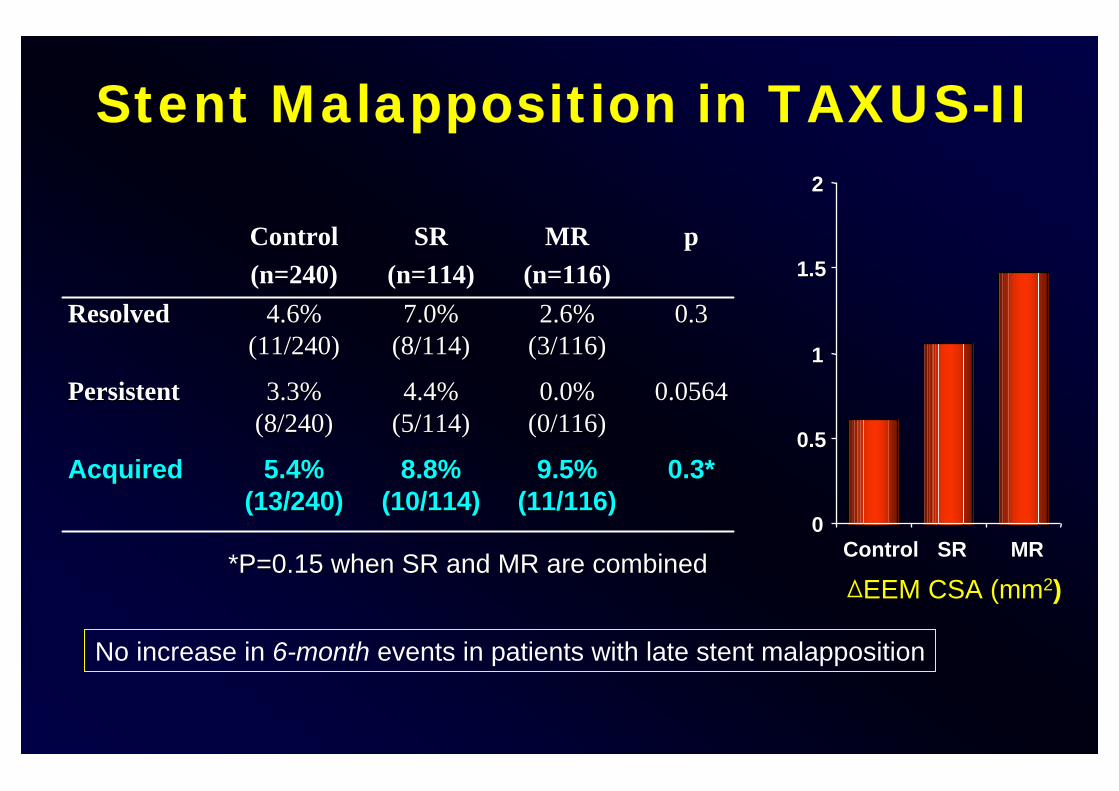
Stent Malapposition in TAXUS-II
0.3*0.3*9.5% 9.5% (11/116)(11/116)
8.8% 8.8% (10/114)(10/114)
5.4% 5.4% (13/240)(13/240)
AcquiredAcquired
0.05640.05640.0% 0.0% (0/116)(0/116)
4.4% 4.4% (5/114)(5/114)
3.3% 3.3% (8/240)(8/240)
PersistentPersistent
0.30.32.6% 2.6% (3/116)(3/116)
7.0% 7.0% (8/114)(8/114)
4.6% 4.6% (11/240)(11/240)
ResolvedResolved
pMR(n=116)
SR(n=114)
Control(n=240)
00
0.50.5
11
1.51.5
22
ControlControl SRSR MRMR
∆∆EEM CSA (mmEEM CSA (mm22))
No increase in 6-month events in patients with late stent malapposition
**P=0.15 when SR and MR are combinedP=0.15 when SR and MR are combined

0
5
10
15
Overall
Incidence (%)
Incidence of LSM after DES
TaxusCypher
12.1% 12.1% (85/705)(85/705)
13.2% 13.2% (71/538)(71/538)
8.4% 8.4% (14/167)(14/167)
P=0.095P=0.095
Hong MK, et al. Circulation 2006;113:414-419

• TLR at 6-month: in 20 patients with 22 lesions in the non-LSM group, but in none of the LSM patients (p=0.095).
• Mean duration of long-term clinical follow-up after 6-month angiogram was 10.9+4.4 and 10.1+3.9 months in LSM and non-LSM group, respectively (p=0.100).
• Death from cardiac origin in 1 patient in the non-LSM group (sudden death at 2.6 months after the 6-month follow-up angiogram).
• Except for only one death in non-LSM group, no MACE occurred in both LSM and non-LSM groups during a mean 10.2 months follow-up after detection of LSM.
LongLong--term clinical followterm clinical follow--up: MACE up: MACE after detection of LSM after DES after detection of LSM after DES
Hong MK, et al. Circulation 2006;113:414-419

How to treat coronary lesions with DES and IVUS guidance ?
• Full lesion coverage covering the adjacent diseased segment with IVUS guidance
• Achievement of the optimal final lumen area at least 5-5.5mm2 and/or stent length <40 mm

DES implantation with angiographic guidance
Pre-DES
Post-DES
6-month follow-up

DES implantation with IVUS guidance
Pre-DES
Post-DES
6-month follow-up

DES implantation with IVUS guidance
Pre-DES
Post-DES
6-month follow-up
3 × 33 mm cypher

DES implantation with angiographic guidance
Pre-DES
Post-DES
6-month follow-up
3 × 33 mm cypher

DES Stenting with IVUS • Select a stent length based upon the “diseased zone” and not the >50%
stenosis -full lesion coverage
• Stent from “disease free” to “disease free” (or proximal to distal normal reference)
• Choose a “safe landing zone”, 3-5 mm outside the shoulders of the lesion, to position the stent edges
• Expect that overall stent lengths will be 5-10 mm longer than with previous bare stent techniques
• IVUS are helpful tool to select optimal stent length

Conclusion: IVUS-Guided Intervention in the world of DES
• Simple lesion (type A lesions): IVUS-guidance may not be necessary.
• Complex lesions (type B2/C lesions) including very long lesions, CTO lesions, bifurcation lesions, LM lesions, ISR lesions and diabetic patients: IVUS-guidance may be very helpful to reduce long-term restenosis rate and MACE rate.