IVOA Document Templatewiki.ivoa.net/internal/IVOA/ObsCoreRFC/PR-ObsCore-v1.… · Web...
75
ObsTAP International Virtual Observatory Alliance Observation Data Model Core Components and its Implementation in the Table Access Protocol Version 1.0 IVOA Proposed Recommendation, May 2 2011 This version: PR- ObsCore -v1.0-20110502.pdf Latest version: http://www.ivoa.net/internal/IVOA/ObsTAPdraftDiscussion/WD-ObsCore-v1.0- 20110305-2.pdf Previous version(s): http://www.ivoa.net/internal/IVOA/ObsTAPdraftDiscussion/WD-ObsCore-v1.0- 20110228-1.docx Editors: Doug Tody, Alberto Micol, Daniel Durand, Mireille Louys Authors: Mireille Louys, Francois Bonnarel, David Schade, Patrick Dowler, Alberto Micol, Daniel Durand, Doug Tody, Laurent Michel, Jesus Salgado, Igor Chilingarian, Bruno Rino, Juan de Dios Santander - 1 -
-
Upload
phunghuong -
Category
Documents
-
view
220 -
download
1
Transcript of IVOA Document Templatewiki.ivoa.net/internal/IVOA/ObsCoreRFC/PR-ObsCore-v1.… · Web...

ObsTAP
International
Virtual
Observatory
Alliance
Observation Data Model Core Components and its Implementation in the Table Access Protocol
Version 1.0IVOA Proposed Recommendation, May 2 2011
This version:PR- ObsCore -v1.0-20110502.pdf
Latest version:http://www.ivoa.net/internal/IVOA/ObsTAPdraftDiscussion/WD-ObsCore-v1.0-20110305-2.pdf
Previous version(s):http://www.ivoa.net/internal/IVOA/ObsTAPdraftDiscussion/WD-ObsCore-v1.0-20110228-1.docx
Editors:Doug Tody, Alberto Micol, Daniel Durand, Mireille Louys
Authors:Mireille Louys, Francois Bonnarel, David Schade, Patrick Dowler, Alberto Micol, Daniel Durand,Doug Tody, Laurent Michel, Jesus Salgado, Igor Chilingarian, Bruno Rino, Juan de Dios Santander
AbstractThis document defines the core components of the Observation data model that are necessary to perform data discovery when querying data centers for observations of interest. It exposes use-cases to be carried out, explains the model and provides guidelines for its implementation as a data access service based on the Table Access Protocol (TAP). It aims at providing a simple model easy to understand and to implement by data providers that wish to publish their data into the Virtual Observatory. This interface
- 1 -

ObsTAP
integrates data modeling and data access aspects in a single service and is named ObsTAP. It will be referenced as such in the IVOA registries. There will be a separate document to cover the full Observation data model. In this document, the Observation Data Model Core Components (ObsCoreDM) defines the core components of queryable metadata required for global discovery of observational data. It is meant to allow a single query to be posed to TAP services at multiple sites to perform global data discovery without having to understand the details of the services present at each site. It defines a minimal set of basic metadata and thus allows for a reasonable cost of implementation by data providers. The combination of the ObsCoreDM with TAP is referred to as an ObsTAP service. As with most of the VO Data Models, ObsCoreDM makes use of STC, Utypes, Units and UCDs. The ObsCoreDM can be serialized as a VOTable. ObsCoreDM can make reference to more complete data models such as ObsProvDM, Characterisation DM, Spectrum DM or Simple Spectral Line Data Model (SSLDM).
Status of this documentThis document has been produced by the IVOA Data Model (DM) working group, in coordination with partners involved in the definition of data access protocols (DAL) and of the ADQL language. It describes the core components of the Observation data model and the metadata to be attached to an astronomical observation, and contains a guide for implementing this model within the Table Access Protocol (TAP) framework. Due to the DM and DAL aspects of this document, this will circulate and be reviewed by both Working Groups. The document content has been worked out as working draft in a previous stage (2009-2010) and is now proposed for IVOA recommendation.
A list of current IVOA Recommendations and other technical documents can be found at http://www.ivoa.net/Documents/
AcknowledgementsThis work has been partly funded by Euro-VO AIDA project that we acknowledge here. SSC XMM Catalog service supported the implementation of the SAADA version of ObsTAP at Strasbourg Observatory. The US-VAO project contributed to developing this specification and is prototyping the use of ObsTAP in the VAO portal. The CANFAR project also contributed for the implementation of ObsTAP at CADC, Victoria.
- 2 -

ObsTAP
Contents
List of Acronyms 7
1. Introduction 7
1.1. First building block: Data Models 7
1.2. Second building block: the Table Access Protocol (TAP) 8
1.3. The goal of this effort 8
2. Use cases 9
3. Observation Core Components Data Model 10
3.1. UML description of the model 10
3.2. Main Concepts of the ObsCore Data Model 13
3.3. Specific Data Model Elements 143.3.1. Data Product Type 14
3.3.2. Calibration level 15
3.3.2.1. Examples of datasets and their calibration level 16
3.3.3. Observation 16
3.3.4. File Content and Format 17
4. Implementation of ObsCore in a TAP Service 17
4.1. Data Product Type (dataproduct_type) 19
4.2. Calibration Level (calib_level) 19
4.3. Collection Name (obs_collection) 19
4.4. Observation Identifier (obs_id) 19
4.5. Publisher Dataset Identifier (obs_publisher_did) 20
4.6. Access URL (access_url) 20
4.7. Access Format (access_format) 20
4.8. Estimated Download Size (access_estsize) 22
4.9. Target Name (target_name) 22
4.10. Central Coordinates (s_ra, s_dec) 22
4.11. Spatial Extent (s_fov) 22
4.12. Spatial Coverage (s_region) 22
4.13. Spatial Resolution (s_resolution) 23
4.14. Time Bounds (t_min, t_max) 23
4.15. Exposure Time (t_exptime) 23
4.16. Time Resolution (t_resolution) 24
4.17. Spectral Bounds (em_min, em_max) 24
- 3 -

ObsTAP
4.18. Spectral Resolving Power (em_res_power) 24
4.19. Observable Axis Description (o_ucd) 24
4.20. Additional Columns 25
5. Registering an ObsTAP Service 25
6. Implementation Examples 25
7. Changes from Earlier Versions 25
References 27
Appendix A: Use Cases in detail 29
Simple Examples 29Simple Query by Position 29
Query by both Spatial and Spectral Attributes 29
A.1 Discovering Images 30A.1.1. Use case 1.1 30
A.1.2. Use case 1.2 30
A.1.3. Use case 1.3 31
A.1.4. Use case 1.4 31
A.1.5. Use case 1.5 32
A.1.6. Use case 1.6 32
A.2. Discovering spectral data 32A.2.1. Use case 2.1 32
A.2.2. Use case 2.2 33
A.2.3. Use case 2.3 33
A.3. Discover multi-dimensional observations 33
A.3.1. Use case 3.1 33A.3.2. Use case 3.2 33
A.3.4. Use case 3.4 34
A.3.5. Use case 3.5 34
A.3.6. Use case 3.6 34
A.3.7. Use case 3.7 35
A.3.8. Use case 3.8 35
A.3.9. Use case 3.9 35
A.4. Discovering time series 35A.4.1. Use case 4.1 35
A.5. Discovering general data 36A.5.1. Use case 5.1 36
A.5.2. Use case 5.2 36
- 4 -
ObsTAP
A.5.3. Use case 5.3 36
A.6. Other Use Cases 36A.6.1. Use case 6.1 36
A.6.2. Use Case 6.2 36
A.6.3. Use case 6.3 37
Appendix B: ObsCore Data Model Detailed Description 38
B.1. Observation Information 40B.1.1. Data Product Type (dataproduct_type) 40
B.1.2. Data Product Subtype (dataproduct_subtype) 41
B.1.3. Calibration level (calib_level) 41
B.2. Target 41B.2.1. Target Name (target_name) 42
B.2.2. Class of the Target source/object (target_class) 42
B.3. Dataset Description 42B.3.1. Creator name (obs_creator_name) 42
B.3.2. Observation Identifier (obs_id) 42
B.3.3. Dataset Text Description (obs_title) 42
B.3.4. Collection name (obs_collection) 43
B.3.5. Creation date (obs_creation_date) 43
B.3.6. Creator name (obs_creator_name) 43
B.3.7. Dataset Creator Identifier (obs_creator_did) 43
B.4. Curation metadata 43B.4.1. Publisher Dataset ID (obs_publisher_did) 43
B.4.2. Publisher Identifier (publisher_id) 43
B.4.3. Bibliographic Reference (bib_reference) 43
B.4.4. Data Rights (data_rights) 44
B.4.5. Release Date (obs_release_date) 44
B.5. Data Access 44B.5.1. Access Reference (access_url) 44
B.5.2. Access Format (access_format) 44
B.5.3. Estimated Size (access_estsize) 44
B.6. Description of physical axes: Characterisation classes 44B.6.1. Spatial axis 45
B.6.1.1. The observation reference position: (s_ra and s_dec) 45
B.6.1.2. The covered region 45
B.6.1.3. Spatial Resolution (s_resol ) 46
B.6.1.4. Astrometric Calibration Status: (s_calib_status) 46
- 5 -

ObsTAP
B.6.1.5. Astrometric precision (s_stat_error) 46
B.6.1.6. Spatial sampling (s_pixel_scale) 46
B.6.2. Spectral axis 46
B.6.2.1. Spectral calibration status (em_calib_status) 47
B.6.2.2. Spectral Bounds 47
B.6.2.3. Spectral Resolution 47
a) A reference value for Spectral Resolution (em_resol) 47
b) A reference value for Resolving Power (em_res_power) 47
c) Resolving Power limits (em_res_power_min, em_res_power_max) 47
B.6.2.4. Accuracy along the spectral axis (em_stat_error) 48
B.6.3. Time axis 48
B.6.3.1. Time coverage (t_min, t_max, t_exptime) 48
B.6.3.2. Time resolution (t_resolution) 48
B.6.3.3. Time Calibration Status: (t_calib_status) 48
B.6.3.4. Time Calibration Error: (t_stat_error) 48
B.6.4. Redshift Axis: 48
B.6.5. Observable Axis: 48
B.6.5.1. Nature of the observed quantity (o_ucd) 48
B.6.5.2. Calibration status on observable (Flux or other) (o_calib_status) 49
B.6.6. Polarisation measurements (o_ucd :mandatory and pol_states: optional) 49
B.7. Provenance 50B.7.1. Facility (facility) 50
B.7.2. Instrument name (instrument) 50
B.7.3. Proposal (proposal_id) 50
Appendix C: TAP_SCHEMA tables and usage 50
C.1. Implementation Examples 50
C.2. List of data model fields in TAP_SCHEMA 50
- 6 -

ObsTAP
List of Acronyms
ADQL Astronomical Data Query Language
DAL Data Access Protocol
DM Data Model
ObsCoreDM Observation Core components Data Model
ObsTAP TAP interface to Observation Data Model
TAP Table Access Protocol
SIA Simple Image Access
SSA Simple Spectral Access
STC Space-Time Coordinates
UCD Unified Content Descriptor
1. IntroductionThis work originates from an initiative of the IVOA Take Up Committee that, in the course of 2009, collected a number of use cases for data discovery (see Appendix A). These use cases address the problem of an astronomer posing a world-wide query for scientific data with certain characteristics and eventually retrieving or otherwise accessing selected data products thus discovered. The ability to pose a single scientific query to multiple archives simultaneously is a fundamental use case for the Virtual Observatory. Providing a simple standard protocol such as the one described in this document increases the chances that a majority of the data providers in astronomy will be able to implement the protocol, thus allowing data discovery for almost all archived astronomical observations.
This effort (version 1) is focused on public data. Provision to cover proprietary data is already in preparation (e.g. obs_release_date and data_rights in the list of optional fields), but is not part of this release. Future versions might cover that in detail.
In the following are described the fundamental building blocks which are used to achieve the goal of global data discoverability and accessibility.
1.1. First building block: Data ModelsModeling of observational metadata has been an important activity of the IVOA since its creation in 2002. This modeling effort has already resulted in a number of integrated and approved IVOA standards such as the Resource Metadata, Space Time Coordinates (STC), Spectrum and SSA, and the Characterisation data models that are currently used in IVOA services and applications.
- 7 -

ObsTAP
Figure 1. How the Observation data model Core Components fits into the overall IVOA architecture. Highlighted blocks in red are data models or specifications that are used by this model.
1.2. Second building block: the Table Access Protocol (TAP)TAP defines a service protocol for accessing tabular data such as astronomical catalogues, or more generally, database tables. TAP allows a client to (step 1) browse through the various tables and columns (names, units, etc.) in an archive to collect the information necessary to pose a query, then (step 2) actually perform a table query. The Table Access Protocol (TAP) specification was developed and reached recommendation status in March 2010 (Dowler, Tody, & Rixon, 2010).
1.3. The goal of this effortBuilding on the work done on data models and TAP, it becomes possible to define a standard service protocol to expose standard metadata describing available datasets. In general, any data model can be mapped to a relational database and exposed directly with the TAP protocol. The goal of ObsTAP is to provide such a capability based upon an essential subset of the general observational data model.
Specifically, this effort aims at defining a database table to describe astronomical datasets (data products) stored in archives that can be queried directly with the TAP protocol. This is ideal for global data discovery as any type of data can be described in a straightforward and uniform fashion. The described datasets can be directly downloaded, or IVOA Data Access Layer (DAL) protocols such as for accessing images (SIA) or spectra (SSA) can be used to perform more advanced data access operations on the referenced datasets.
- 8 -

ObsTAP
The final capability required to support uniform global data discovery and access, with a client sending one and the same query to multiple TAP services, is the stipulation that a uniform standard data model is exposed (through TAP) using agreed naming conventions, formats, units, and reference systems. Defining this core data model and associated query mechanism is what this document is for.
Thus the purpose of this document is twofold: (1) to define a simple data model to describe observational data, and (2) to define a standard way to expose it through the TAP protocol to provide a uniform interface to discover observational science data products of any type.
This document is organized as follows:
Section 2 briefly presents the types of the use cases collected from the astronomical community by the IVOA Uptake committee.
Section 3 defines the core components of the Observation data model. The elements of the data model are summarized in Figure 1. Mandatory ObsTAP fields are summarized in Table 1.
Section 4 specifies the required data model fields as they are used in the TAP service: table names, column names, column data type, UCD, Utype from the Observation Core components data model, and required units.
Section 5 describes how to register an ObsTAP service in a Virtual Observatory registry. More detailed information is available in the appendices.
Section 7 summarizes updates of this document.
Appendix A describes all the use cases as defined by the IVOA Take Up Committee.
Appendix B contains a full description of the Observation data model Core Components.
Appendix C shows the detailed content of the TAP_SCHEMA tables and how to build up and fill them for the implementation of an ObsTAP service.
2. Use casesOur primary focus is on data discovery. To this end a number of use-cases have been defined, aimed at finding observational data products in the VO domain by broadcasting the same query to multiple archives (global data discoverability and accessibility). To achieve this we need to give data providers a set of metadata attributes that they can easily map to their database system in order to support queries of the sort listed below.
The goal is to be simple enough to be practical to implement, without attempting to exhaustively describe every particular dataset.
The main features of these use-cases are as follows:
Support multi-wavelength as well as positional and temporal searches.
Support any type of science data product (image, cube, spectrum, time series, instrumental data, etc.).
Directly support the sorts of file content typically found in archives (FITS, VOTable, compressed files, instrumental data, etc.).
- 9 -

ObsTAP
Further server-side processing of data is possible but is the subject of other VO protocols. More refined or advanced searches may include extra knowledge obtained by prior queries to determine the range of data products available.
The detailed list of use cases proposed for data discovery is given in Appendix A.
3. Observation Core Components Data ModelThis section highlights and describes the core components of the Observation data model. The term “core components” is meant to refer to those elements of the larger Observation Data Model that are required to support the use cases listed in Appendix A. In reality this effort is the outcome of a trade-off between what astronomers want and what data providers are ready to offer. The aim is to achieve buy-in of data providers with a simple and "good enough" model to cover the majority of the use cases.
The project of elaborating a general data model for the metadata necessary to describe any astronomical observation was launched at the first Data Model WG meeting held in Cambridge, UK at the IVOA meeting in May 2003. The Observation data model was sketched out relying on some key concepts: Dataset, Identification, Curation, physical Characterisation and Provenance (either instrumental or software). A description of the early stages of this development can be found in (Mc Dowell & al., 2005) (Observation IVOA note). Some of these concepts have already been elaborated in existing data models, namely the Spectrum data model (McDowell, Tody, & al, 2007)) for general items such as dataset identification and curation, and the Characterisation data model (Louys &DataModel-WG., 2008) for the description of the physical axes and properties of an observation, such as coverage, resolution, sampling, and accuracy. The Core Components data model reuses the relevant elements from those models. Generalization of the observational model to support data from theoretical models (e.g., synthetic spectra) is possible but is not addressed here in order to keep the core model simple.
3.1. UML description of the modelThis section provides a graphical overview of the Observation Core Components data model using the unified modeling language (UML). The UML class diagram shown in Figure 2 depicts the overall Observation Data Model, detailing those aspects that are relevant to the Core Components, while omitting those not relevant. The Characterisation classes describing how the data span along the main physical measurement axes are simplified here showing only the attributes necessary for data discovery. This is also the case for the DataID and Curation classes extracted from the Spectrum/SSA data model where only a subset of the attributes are actually necessary for data discovery. For our purposes here we show Characterisation classes only down to the level of the Support class (level 3).
- 10 -

ObsTAP
Figure 1. Depicted here are the classes used to organize observational metadata. Classes may be linked either via association or aggregation. The minimal set of necessary attributes for data discovery is shown in brown.
For the sake of clarity, the SpatialAxis, SpectralAxis and TimeAxis classes on the diagram are not expanded on the main class diagram. Details for these axes are shown in Figure 1 for the spatial axis, Figure 1 for the spectral axis and Figure 2 for the time axis.
- 11 -
ObsTAP
Figure 1. Details of the classes linked to the description of the spatial axis for an Observation. All axes in this model inherit the main structure from the CharacterisationAxis class, but some peculiar attributes are necessary for Space coordinates.
Details on the ObsCoreDM axes definitions are available in the Characterisation data model standard document (Louys & DataModel-WG., 2008). The hypertext documentation of the model is available (a preliminary version) in the IVOA site under the ObsCore wiki page (http://www.ivoa.net/internal/IVOA/ObsDMCoreComponents/may2011.zip).
Figure 1. Spectral axis: details of the classes necessary to describe the spectral properties of an Observation. UCD and units are essential to disentangle various possible spectral quantities.
- 12 -

ObsTAP
Figure 2. The classes from the Characterisation DM used to describe time metadata.
3.2. Main Concepts of the ObsCore Data ModelThe ObsCore data model is the result of the analysis of the data discovery use cases introduced in Chapter 2. Two sets of elements have been identified: those necessary to support the provided use cases, and others that are generally useful to describe the data but are not immediately required to support the use cases. In this section only the first set is described. That set coincides with the set of parameters that any ObsTAP service must support. Please refer to appendix B for the detailed description of all model elements.
Table 1 lists the data model elements that any ObsTAP implementation must support (i.e. a column with such name must exist, though, in some cases, it could be nillable). Provision of these mandatory fields ensures that any query based on these parameters is guaranteed to be understood by all ObsTAP services.
NB: Data model fields are listed here with their TAP column names rather than the IVOA data model element identifiers (Utype) to ease readability. See the associated Utypes in Appendix C.
Column Name Unit Type Description
dataproduct_type unitless string Logical data product type (image etc.)calib_level unitless enum integer Calibration level {0, 1, 2, 3}obs_collection unitless string Name of the data collectionobs_id unitless string Observation IDobs_publisher_did unitless string Dataset identifier given by the
publisheraccess_url unitless string URL used to access (download)
- 13 -

ObsTAP
datasetaccess_format unitless string File content format (FITS,
VOTable,etc.)access_estsize kbyte integer Estimated size of dataset in kBtarget_name unitless string Astronomical object observed, if anys_ra deg double Central right ascension, ICRSs_dec deg double Central declination, ICRSs_fov deg double Diameter (bounds) of the covered
regions_region unitless AstroCoordArea Region covered as specified in STC or
ADQLs_resolution arcsec float Spatial resolution of data as FWHMt_min d double Start time in MJDt_max d double Stop time in MJDt_exptime s float Total exposure timet_resolution s float Temporal resolution FWHMem_min m double Start in spectral coordinatesem_max m double Stop in spectral coordinatesem_res_power unitless double Spectral resolving powero_ucd unitless string UCD of observable (e.g.
phot.flux.density)
Table 1. Mandatory fields of the Observation core components data model.
3.3. Specific Data Model ElementsIn order to support the global data discoverability and accessibility requirements, some new concepts previously not covered by any other data model have to be introduced. This section describes those, which are: the data product type, a classification of the various levels of calibration and processing applied to the data, the file content and format enriched and extended from the concept described in the SSA protocol (Tody & Dolensky, 2008). In addition, a clarification of how the terms Observation and Data Product are used in the ObsTAP context is provided.
3.3.1. Data Product TypeThe model defines a data product type attribute to describe the high level scientific classification of the data product being considered. This is coded as a string that conveys a general idea of the content and organization of a dataset. We consider a coarse classification of the types of dataset interesting for science usage, covering: image, cube, spectrum, SED, time series, visibility data, and event data.
image. An astronomical image, typically a 2D image with two spatial axes, e.g., a FITS image. The image content may be complex, e.g., an objective-grism observation would be considered a type of image, even though an extracted spectrum would be a Spectrum data product.
cube. A multidimensional astronomical image with 3 or more image axes, e.g., a spectral image cube, a polarization cube, a full Stokes radio data cube, a time image
- 14 -

ObsTAP
cube, etc. The most common format for astronomical “cube” data products is a multidimensional FITS image, however other formats are allowed so long as they are adequately described.
spectrum. Any dataset for which spectral coverage is the primary attribute, e.g., a 1D spectrum or a long slit spectrum.
sed. A spectral energy distribution, an advanced data product often produced by combining data from multiple observations.
timeseries. A one dimensional array presenting some quantity as a function of time. A light curve is a typical example of a time series dataset.
visibility. A visibility (radio) dataset of some sort. Typically this is instrumental data, i.e., "visibility data". A visibility dataset is often a complex object containing multiple files or other substructures. A visibility dataset may contain data with spatial, spectral, time, and polarization information for each measured visibility, hence can be used to produce higher level data products such as image, spectra, timeseries, and so forth.
event. An event-counting (e.g. X-ray or other high energy) dataset of some sort. Typically this is instrumental data, i.e., "event data". An event dataset is often a complex object containing multiple files or other substructures. An event dataset may contain data with spatial, spectral, and time information for each measured event, although the spectral resolution (energy) is sometimes limited. Event data may be used to produce higher level data products such as images or spectra.
Classification of astronomical data by data product type is inherently ambiguous hence the classification scheme defined here is intentionally kept as simple as possible. The data provider should pick the primary category most appropriate for their data. Values must be specified in lower-case (in order to simplify queries). One of the defined dataproduct_type values must be used if appropriate for the data product in question, otherwise a NULL value is permitted and a more precise definition of the data product type should be given in dataproduct_subtype. Combination of data product types is not allowed, i.e., either one of the above values or NULL must be specified.
Further information on the specific content and format of a data product can be provided by the dataproduct_subtype data model field defined in the data model appendix B.1.2 , and by the related obs_title (B.3.3) and access_format attributes (section 3.3.1). The intent of dataproduct_type is to provide only a general indication of the category to which the data product belongs to facilitate global data discovery.
3.3.2. Calibration levelThe calibration level concept conveys to the user information on how much data reduction/processing has been applied to the data. It is up to the data providers to consider how to map their own internal classification to the suggested scale here.
Level 0: Raw instrumental data, in a proprietary or internal data-provider defined format, that needs instrument specific tools to be handled.
Level 1: Instrumental data in a standard format (FITS, VOTable, SDFITS, ASDM, etc.) which could be manipulated with standard astronomical packages.
Level 2: Calibrated, science ready data with the instrument signature removed.
- 15 -

ObsTAP
Level 3: Enhanced data products like mosaics, resampled or drizzled images, or heavily processed survey fields. Level 3 data products may represent the combination of data from multiple primary observations.
The examples in the following section should help illustrate use of the calib_level attribute. It is left to the data provider to decide for ambiguous cases.
3.3.2.1. Examples of datasets and their calibration levelHere are examples of various datasets, classified according to scheme defined above.
Data product type Data collection Calibration Level Comments
image IRAS/NASA 2 Science ready dataimage IRIS/IRSA 3 Recalibrated from infrared
IRAS images with removal of the sensor memory effect.
image HDFS/ACS GOODS data
3 Image associations mosaicking/stacking
spectrum XMM-Newton EPIC spectra
1 Raw instrumental spectrum.
cube EVLA spectral data cube
2 Radio spectral data cube in FITS format
sed NED SED 3 NED spectral energy distribution
event ROSAT/HEASARC 1 Instrumental datavisibility ALMA, Merlin, etc. 1 Instrumental data
Table 1. Examples of datasets with calibration level.
3.3.3. ObservationObsTAP and the Observation data model describe observations in a broad sense (exactly what comprises an "observation" is not well defined within astronomy and is left up to the data provider to define for their data). ObsTAP also describes archive data products (e.g., actual archive files). In general an "observation" may be composed of multiple individual data products. In this case all the data products comprising an observation should share the same observation identifier (obs_id). The form of the obs_id string is up to the data provider so long as it uniquely identifies an observation within the archive. The individual data products comprising an observation may have different data product types, calibration levels, and so forth. ObsTAP only directly supports the description of science data products, i.e., data products which contain science data having some physical (spatial, spectral, temporal) coverage.
In general for instrumental data there are two different approaches for exposing the data from an observation. One can either expose the individual science data products comprising the observation, all sharing the same obs_id, or one can expose the entire observation as a single complex instrumental data product. Combinations of the two approaches are also possible.
If the data products comprising an observation are exposed individually then attributes such as the calibration level can vary for different data products, e.g., the raw instrumental data as observed might be level 1, a standard pipeline data product might be level 2, and a
- 16 -

ObsTAP
custom user-processed data product subsequently published back to the archive might be level 3. All such data products would share the same obs_id.
If on the other hand all data from an observation is exposed as a single data product via ObsTAP this will likely be an aggregate of some sort (tar file, directory, etc.) containing multiple files. This latter approach is limited to instrumental data (level 0 or 1), even if objects within the aggregate observation file are higher level. From the perspective of ObsTAP this would be instrumental data, and it is up to the user or client application consuming the data to interpret the meaning of the data elements within the observation.
Which approach is best depends upon the anticipated scientific usage and is up to the data provider to determine. For example if the observational data provided is most commonly used for multi-wavelength analysis, exposing individual high level data products is likely to be the best approach. If the anticipated usage is dominated by complex analysis of instrumental data, then exposing the entire observation as a standard package of instrumental data may be the best approach.
3.3.4. File Content and FormatWhile dataproduct_type specifies at a high level what a specific data product is, the access_format attribute specifies what is actually in the file. For example, an "image" could be a FITS image, an image embedded in a FITS multi-extension format (MEF) file, a JPEG, etc. A "spectrum" could be represented in the VO-compliant Spectrum format, or in some instrument-specific FITS binary table format. A visibility dataset could be in FITS or ASDM format, or a variety of other radio data formats. A ROSAT or Chandra observation might be presented as a ‘tar’ file or directory containing instrument-specific observational files. There are many such examples; we give only a few here to illustrate the concept.
Specifying the content and format of a data product is important as special software may be required to do anything useful with the data. The user needs to know exactly what the data product is before deciding to download it for analysis.
See section 4.7 for more details and implementation requirements.
4. Implementation of ObsCore in a TAP ServiceThe ObsCore model must be implemented within Table Access Protocol (TAP) services such that all valid queries can be executed unchanged on any service that implements the model. Additional optional or provider-defined columns are permitted (4.20) so long as all mandatory columns are provided. The protocol does not specify any specific ordering of fields in the query response so long as the mandatory parameters are present in the output stream.
Here we specify an explicit mapping of the model to relational database tables; in the context of TAP this means we are specifying the logical tables as described in the TAP_SCHEMA (the TAP-required database schema where the tables and columns exposed by the service are described). This does not necessarily imply that the underlying database will have the identical structure (what is exposed through TAP could be, for example, a database view of the underlying database tables), but in most cases the relationship between TAP_SCHEMA description and the underlying tables is straightforward.
- 17 -

ObsTAP
schema_name table_name Description
ivoa ivoa.ObsCore ObsCore 1.0
Table 1. TAP_SCHEMA.tables for implementation of the ObsCore model.
table_name column_name data type units constraint
ivoa.ObsCore dataproduct_type adql:VARCHARivoa.ObsCore calib_level adql:INTEGER not nullivoa.ObsCore obs_collection adql:VARCHAR not nullivoa.ObsCore obs_id adql:VARCHAR not nullivoa.ObsCore obs_publisher_did adql:VARCHAR not nullivoa.ObsCore access_url adql:CLOBivoa.ObsCore access_format adql:VARCHARivoa.ObsCore access_estsize adql:INTEGER kBivoa.ObsCore target_name adql:VARCHARivoa.ObsCore s_ra adql:DOUBLE degivoa.ObsCore s_dec adql:DOUBLE degivoa.ObsCore s_fov adql:DOUBLE degivoa.ObsCore s_region adql:REGION degivoa.ObsCore s_resolution adql:DOUBLE arcsecivoa.ObsCore t_min adql:DOUBLE divoa.ObsCore t_max adql:DOUBLE divoa.ObsCore t_exptime adql:DOUBLE sivoa.ObsCore t_resolution adql:DOUBLE sivoa.ObsCore em_min adql:DOUBLE mivoa.ObsCore em_max adql:DOUBLE mivoa.ObsCore em_res_power adql:DOUBLEivoa.ObsCore o_ucd adql:VARCHAR
Table 1. List of the minimal set of data model fields to implement for an ObsTAP service. See tables on page 52 in Appendix C for the full description of the TAP_SCHEMA.columns table.
Table 3 and Table 4 provide the primary information needed to describe the ObsCore model in terms of TAP_SCHEMA tables and columns. The “constraint” specified in Table 4 above is not part of the TAP_SCHEMA.columns description, but is required by the ObsCore model and specified here to make this clear to implementers. Additional standard content for the individual columns is specified below.
- 18 -

ObsTAP
4.1. Data Product Type (dataproduct_type)The dataproduct_type column contains a simple string value describing the primary nature of the data product. It should assume one of these string values: image, cube, spectrum, sed, timeseries, visibility, or event. These values are described in section 3.3.1. A NULL value is permitted, but only in the event that none of the proposed values can be used to describe the dataset. The optional field dataproduct_subtype (B.1.2) may be used to more precisely define the nature of the dataset. Values in the dataproduct_type column must be written in lower case. Specifying this field along with the desired spatial and spectral coverage will be enough to discover data of interest in many common cases.
Usage: select * from ivoa.ObsCore where dataproduct_type=’image’ returns only image data.
4.2. Calibration Level (calib_level)The calib_level column tells the user the amount of calibration processing that has been applied to create the data product. calib_level must assume one of the following integer values: 0 (instrumental or raw data in a non-standard/proprietary format), 1 (instrumental data in a standard format, e.g. FITS), 2 (calibrated data in standard format, with instrument signature removed), and 3 (more highly processed data product). Please refer to section 3.3.2 for a full description. Data providers decide which value best describes their data products.
Values in the calib_level column must not be NULL.
Usage: select * from ivoa.ObsCore where calib_level > 2 returns enhanced data products.
4.3. Collection Name (obs_collection)The obs_collection column identifies the data collection to which the data product belongs. A data collection is any logical collection of datasets which are alike in some fashion. Typical data collections might be all the data from a particular telescope, instrument, or survey. The value is either the registered shortname for the data collection, the full registered IVOA identifier for the collection, or a data provider defined shortname for the collection. Often the collection name will be set to the name of the instrument that generated the data. In that case we suggest specifying the collection name as a string composed of the facility name, followed by a slash, followed by the instrument name.
Examples : HST/WFPC2, VLT/FORS2, CHANDRA/ACIS-S.
There are other cases where it makes no sense to use the instrument name, may be because the data product used data from different instruments or facilities, or for other reasons. Examples: SDSS-DR7, etc.
In practice this is not a very precisely defined field. What is important is for the data provider to use a collection name which is familiar to astronomers and discriminative to point easily on datasets of interest.
Values in the obs_collection column must not be NULL.
4.4. Observation Identifier (obs_id)The obs_id column defines a unique identifier for an observation. In the case where multiple data products are available for an observation (e.g. with different calibration levels), the obs_id value will be the same for each data product comprising the observation. This is equivalent to the dataset name for many archives where dataset name could have many
- 19 -

ObsTAP
files associated with them. The returned obs_id for an archival observation should remain identical through time for future reference.
In the case of some advanced data products (with calib_level =3), the data product may be the result of combining data from multiple primary (physical) observations. In this case the resulting data product is a new processed “observation” to which a new unique observation identifier should be assigned. If the advanced processing results in several associated data products they should share the same obs_id. Describing the provenance of such an advanced data product is possible, but is out of scope for ObsTAP.
Values in the obs_id column must not be NULL.
4.5. Publisher Dataset Identifier (obs_publisher_did)The obs_publisher_did column contains the IVOA dataset identifier (Plante & al., 2007) for the published data product. This value must be unique within the namespace controlled by the dataset publisher (data center). The value will also be globally unique since each publisher has a unique IVOA registered publisher ID. The same dataset may however have more than one publisher dataset identifier if it is published in more than one location; the creator DID, if defined for the given dataset, would be the same regardless of where the data is published.
The returned obs_publisher_did for a static data product should remain identical through time for future reference.
Values in the obs_publisher_did column must not be NULL.
4.6. Access URL (access_url)The access_url column contains a URL that can be used to download the data product (as a file of some sort).
We specify the data type as CLOB (character large object) in the TAP service so that users will know they can only use the access_url column in the SELECT clause of a query. That is, users cannot specify this column as part of a condition in the WHERE clause and implementers are free to generate the URL on the fly during output (rather than being forced to store it statically in the database).
More details are given on the use of CLOB data types for the TAP SCHEMA in the TAP Standard document (Dowler, Tody, & Rixon, 2010), section 2.5 Table upload.
Access URLs are not guaranteed to remain valid and unchanged indefinitely. To access a specific data product after a period of time (e.g., days or weeks) a query should be performed (e.g., using obs_publisher_did) to obtain a fresh access URL.
4.7. Access Format (access_format)The access_format column specifies the format of the data product if downloaded as a file. This data model field is important both for data discovery and for the client to evaluate whether it will be able to actually use the data product if downloaded.
MIME types are often used to specify file formats in existing protocols such as HTTP(Authority Internet Assigned Numbers, 2007). However when dealing with astronomical observations as in ObsTAP services, more information about the format of the data is required than can be specified by conventional MIME types. For instance we might want to distinguish between various formats like multi-extension FITS (e.g. for CCD mosaic
- 20 -

ObsTAP
instruments or MUSE IFU data), or ASDM (e.g. for ALMA or other interferometry observations). Even for something as fundamental to astronomy as FITS binary table there is currently no standardized MIME type other than the generic application/FITS.
While standard MIME types are limited when it comes to describing the many data formats actually in use within astronomy, they are ideal for specifying common file types such as HTML and XML, the various graphics file types, text, PDF, and so forth, all of which can be used to describe aspects of observational data. Furthermore the MIME type scheme is extensible, allowing new formats which are not yet standardized to be specified. Hence what we propose here is to adopt the MIME type mechanism to describe the file format of a science data product, defining new custom types as needed. Note this is distinct from the science content which is specified by the data product type and subtype. The same content can potentially be represented in multiple formats hence these are distinct.
The following table illustrates some common astronomical file formats. This list is by no means intended to be comprehensive; rather it illustrates the approach while defining standard values for some common formats. Some randomly selected formats are included to illustrate the approach. We can extend this list as experience is gained using ObsTAP to describe actual data archives.
MIME-type Shortname Definitionimage/fits fits Any multidimensional regularly sampled FITS image or cube
image/jpeg jpeg A 2D JPEG graphic image (likewise for GIF, PNG, etc.)
application/fits fits Any generic FITS file
application/x-fits-bintable bintable A FITS binary table (single BINTABLE extension)
application/x-fits-mef mef A FITS multi-extension file (multiple extensions)
application/x-fits-uvfits uvfits A FITS file in UVFITS format (likewise SDFITS etc.)
application/x-fits-euro3d euro3d A FITS file in Euro3D format (multiobject spectroscopy)
application/x-votable+xml votable Any generic VOTable file
application/x-asdm asdm ALMA science data model (final export format still TBD)
application/pdf pdf Any PDF file
text/html html Text in HTML format
text/xml xml Any generic XML file
text/plain txt Any generic text file
text/csv csv Tabular data in comma separated values format
text/tab-separated-values tsv Tabular data in tab separated values format
application/x-tar tar Multiple files archive in TAR format
application/zip zip Multiple files archive in ZIP format
application/x-directory dir Multiple files archive returned as a text list (format TBD)
image/x-fits-gzip fits A GZIP-compressed FITS image
image/x-fits-hcompress fits A FITS image using HCOMPRESS compression
application/x-tar-gzip gtar A GZIP-compressed TAR file (x-gtar also sometimes used)
- 21 -

ObsTAP
The value of access_format should be a MIME type, either a standard MIME type, an extended MIME type from the above table, or a new custom MIME type defined by the data provider. The short names suggested here are not used directly by access_format.
Custom file formats should be specified using a MIME type such as "application/x-<whatever>". This can be used for any file format including custom binary file formats.
Compression is inherent in some file formats, e.g., ZIP or JPEG. In other formats it is optional and is indicated by having multiple versions of the format, e.g. image/fits or image/x-fits-gzip for a GZIP-compressed FITS image (the "x-" prefix is required for anything which is not a registered standard MIME type).
4.8. Estimated Download Size (access_estsize)The access_estsize column contains the approximate size (in kilobytes) of the file available via the access_url. This is used only to gain some idea of the size of a data product before downloading it, hence only an approximate value is required. Provision of dataset size estimates is important whenever it is possible that datasets can be very large.
4.9. Target Name (target_name)The target_name column contains the name of the target of the observation, if any. This is typically the name of an astronomical object, but could be the name of a survey field.
The target name is most useful for output, to identify the target of an observation to the user. In queries it is generally better to refer to astronomical objects by position, using a name resolver to convert the target name into a coordinate (when possible).
4.10. Central Coordinates (s_ra, s_dec)The coordinate system in which coordinates are expressed is ICRS. The s_ra column specifies the ICRS Right Ascension of the center of the observation. The s_dec column specifies the ICRS Declination of the center of the observation.
4.11. Spatial Extent (s_fov)The s_fov column (1D size of the field of view) contains the approximate size of the region covered by the data product. For a circular region, this is the diameter (not the radius). For most data products the value given should be large enough to include the entire area of the observation; coverage within the bounded region need not be complete, for example if the specified FOV encompasses a rotated rectangular region. For observations which do not have a well-defined boundary, e.g. radio or high energy observations, a characteristic value should be given.
The s_fov attribute provides a simple way to characterize and use (e.g. for discovery computations) the approximate spatial coverage of a data product. The spatial coverage of a data product can be more precisely specified using the s_region attribute (4.12).
4.12. Spatial Coverage (s_region)The s_region column can be used to precisely specify the covered spatial region of a data product.
It is often an exact, or almost exact, representation of the illumination region of a given observation defined in a standard way by the concept of Support in the Characterisation data model.
- 22 -

ObsTAP
We specify the data type as the logical type adql:REGION so that users can specify spatial queries using a single column and in a limited number of ways. If included in the select list of the query, the output is always an STC-S string as described in (Dowler, Tody, & Rixon,2010) [section 6]. In the WHERE clause, the s_region column can be used with the ADQL geometry functions (INTERSECTS, CONTAINS) to specify conditions; the service will generally have to translate these into native SQL that enforces the same conditions or a suitable approximation. Implementers may approximate the spatial query conditions by translating the INTERSECTS and CONTAINS function calls in the query.
In addition, ADQL specifies several functions, which may take the s_region column as an argument: AREA, CENTROID, and COORDSYS. The AREA function returns the area (in sq. deg.) of the observed the region. In cases where the s_region itself is an approximation (a bounding box, for example), this function should still return the actual value. This may be implemented by computing and storing the area in a separate column and converting the AREA (s_region) function call into a column reference in the query. The CENTROID function returns an ADQL POINT value; if used in the select list the output is always an STC-S string as described in (Dowler, Tody, & Rixon, 2010) [section 6]. The coordinates must be the same as those found in the s_ra and s_dec columns, which are provided for convenience. The COORDSYS function returns the coordinate system used for the s_region; in the ObsCore model implementation here this is restricted to ICRS, so this can be implemented by converting the COORDSYS (s_region) function call to a constant in the query.
Region computations are an advanced query capability which may not be supported by all services. Services should however specify s_region when possible to more precisely specify the spatial coverage of an observation.
4.13. Spatial Resolution (s_resolution)The s_resolution column specifies the best spatial resolution of the data product in arcseconds. This refers to the smallest spatial feature in the observed signal that can be resolved.
In cases where the spatial resolution varies across the field the best spatial resolution (smallest resolvable spatial feature) should be specified. In cases where the spatial frequency sampling of an observation is complex (e.g., interferometry) a best spatial resolution estimate should be given; additional characterization may be necessary to fully specify the spatial characteristics of the data.
4.14. Time Bounds (t_min, t_max)The t_min column contains the start time of the observation specified in MJD. The t_max column contains the stop time of the observation specified in MJD. In case of data products result of the combination of multiple frames, t_min must be the minimum of the start times, and t_max as the maximum of the stop times.
4.15. Exposure Time (t_exptime)The t_exptime column contains the exposure time. For simple exposures, this is just t_max - t_min expressed in seconds. For data where the detector is not active at all times, (e.g. data products made by combining exposures taken at different times), the t_exptime will be smaller than t_max - t_min. For data where the t_exptime is not constant over the entire data product, the median exposure time per pixel is a good way to characterize the typical
- 23 -

ObsTAP
value. In some cases, t_exptime is generally used as an indicator of the relative sensitivity (depth) within a single data collection (e.g. obs_collection); data providers should supply a suitable relative value when it is not feasible to define or compute the true exposure time.
In case of targeted observations, on the contrary the exposure time is often adjusted to achieve similar signal to noise ratio for different targets.
4.16. Time Resolution (t_resolution)The t_resolution column is the minimal interpretable interval between two points along the time axis. This can be an average or representative value. For products with no sampling along the time axis, the t_resolution could be set to the exposure time or could be null. That way one could compose a WHERE clause like:
WHERE t_resolution < t_exptime
to find those products which are time resolved.
This implementation preference avoids dealing with undefined data model fields as originally considered in the Characterisation data model for unresolved time axis.
4.17. Spectral Bounds (em_min, em_max)The em_min column specifies the minimum spectral value observed, expressed as a vacuum wavelength in meters.
The em_max column contains the maximum spectral value observed, expressed as a vacuum wavelength in meters.
As mentioned in the data model in Appendix B, at least 3 physical quantities could in principle be used to represent the spectral axis: energy, wavelength or frequency; which is most appropriate depends upon the observation domain. For ObsTAP we are less concerned with how to present data to the user than with providing a simple and uniform way to describe astronomical data, hence we restrict the spectral bounds units to wavelength in meters in vacuum. Conversion to other quantities could be performed either on the client side for an application encapsulating queries, and/or on the server side, for a data provider to expose its data from other regimes to ObsTAP queries.
4.18. Spectral Resolving Power (em_res_power)The em_res_power column contains the typical or characteristic spectral resolving power defined as . The value is dimensionless.
4.19. Observable Axis Description (o_ucd)The o_ucd column specifies a UCD (Preite Martinez, Derriere, Delmotte, Gray, & al., 2007) describing the nature of the observable within the data product. The observable is the measured quantity, for example photon counts or flux density stored in the pixel value within an image. Often for optical astronomical images the value would be phot.count; for fully flux calibrated data a value such as phot.flux.density (usually specified in Jy) would be used. Any valid UCD is permitted. If no appropriate UCD is defined the field should be left NULL (the IVOA provides a process by which new UCDs can be defined).
- 24 -

ObsTAP
4.20. Additional ColumnsService providers may include additional columns in the ivoa.ObsCore table to expose additional metadata. These columns must be described in the TAP_SCHEMA.columns table and in the output from the VOSI-tables resource ([VOSI] Grid and Web service WG,2010). Users may access these columns by examining the column metadata for individual services and then using them explicitly in queries or by selecting all columns in the query (e.g. “select * from ivoa.ObsCore ...” in an ADQL query). In order to provide homogeneity in the keywords used as optional fields, we recommend where possible to use the items defined in the full data model (Appendix B) and flagged as optional. ObsTAP compliant services will support all columns defined as mandatory and possibly some of the optional ones. Queries built up using additional columns defined specifically for a given archive might not be portable.
5. Registering an ObsTAP ServiceTAP services that implement the ObsCore model should be registered to indicate this fact so that users can easily find all services that accept ObsCore queries. Initially, this can be done by using the keyword “ObsCore” to describe the service. Fine-grained registries may include the complete VODataService tableset description, but this is not available through all searchable registries. The TAP extension schema allows service providers to specify which IVOA data models are used within a TAP service. Services that implement the ObsCore model should use the registry extension schema mechanism to publicize their support with:
standardID=”ivo://ivoa.net/std/ObsCore/v1.0”
placed (somewhere) in the TAP Registry extension schema (Demleitner, Plante, Dowler,Rixon, & Taylor, 2011) where ivo://ivoa.net/std/ObsCore/v1.0 is the IVOA identifier of the StandardRegExt [REF] defined in this document.
6. Implementation ExamplesObsTAP implementations are described in a separate IVOA Note .[add url]
Material to help implementers to fill in the TAP_SCHEMA tables is available on the IVOA wiki at [add url] ?
Examples of supported use-cases are also provided at the following URL: http://www.cadc.hia.nrc.gc.ca/cvo/ObsCore
7. Changes from Earlier VersionsVersion 0.2 to 1.0 Spring 2010:
Include implementation part in section 3
Fix underscore character in most places
Include data model summary table for all fields in appendix A
Add a status column for each field M or R or O
Update tables em_domain moved up (minimal change)
- 25 -

ObsTAP
Version 1.0 May 2010:
Section 5: re-write XMM SSC ObsTAP service description
Introduce use case shortly at beginning and point to appendix
Moved data model summary table back to data model section
Version 1.0 Dec 2010 to February 2011:
Converted document from Latex to Word
Revised data model column names to make more consistent
Moved table showing full data model to an appendix
Added a short table of only the mandatory fields to the DM intro
Many small edits to make text more readable and correct
Edit Use-case part and provide query examples
Added references and citations
Added figure for time Axis
Changed appendix C for a data modeling orientation
Version 1.0-20110227:
Merged appendix A and B into A
Flesh out appendix B for a data modeling orientation
Update Utype syntax in all tables
Re-organize appendix C and D for TAP_SCHEMA.columns and example of table initialization
Version 1.0-20110415:
Insert updates after mailing list and wiki discussion.
Use Camel Case for Utypes in this document
Version 1.0-20110415:
Version 1.0-2011 May
D.Tody updates and fixes all the formatting of the document (Toc, section numbers, etc.)
M.Louys updates bibliographic references and cross-referencing between sections within the document
References
- 26 -

ObsTAP
[VOSI] Grid and Web service WG. (2010). IVOA Support Interfaces. In M. Graham, & G. Rixon (Ed.), http://www.ivoa.net/Documents/VOSI/index.html. IVOA Standards.
Authority Internet Assigned Numbers. (2007). MIME Media Types., http://www.iana.org/assignments/media-types/.
Bonnarel, F., Chilingarian, I., & Louys, M. ((in prep.)). Characterisation Data model v2.0: variability and complex observations. IVOA Standards.
Demleitner, M., Plante, R., Dowler, P., Rixon, G., & Taylor, M. (2011). TAPRegExt: a VOResource Schema Extension for Describing TAP Services. http://www.ivoa.net/Documents/TAPRegExt/index.html. IVOA Standards.
Derrière, S. (2010). Providing Photometric data measurements description in VOTable v0.1. IVOA Notes.
Dowler, P., Tody, D., & Rixon, G. (2010). Table Access Protocol. http://www.ivoa.net/Documents/TAP/20100327/REC-TAP-1.0.pdf. IVOA Standards.
Greisen, E. W., & Calabretta, M. (2002). Representations of world coordinates in FITS. Astronomy & Astrophysics, 395, 1061-1075.
Hanisch, R. (2007). Resource Metadata for the Virtual Observatory. In I. Standards (Ed.). http://www.ivoa.net/Documents/latest/RM.html.
Louys, M., & Bonnarel, F. (2010). List of UCD for observable quantities. http://www.ivoa.net/internal/IVOA/ObsTap/ListForObservable25Oct2010.pdf. IVOA wiki site.
Louys, M., & DataModel-WG. (2008). Data Model for Astronomical DataSet Characterisation. In M. Louys, A. Richards, F. Bonnarel, J. McDowell, & al. (Ed.), http://www.ivoa.net/Documents/latest/CharacterisationDM.html. IVOA Standards.
Mc Dowell, J., & al. (2005). Data Model for Observation. In J. McDowel, F. Bonnarel, D. David Giaretta, G. Lemson, M. Louys, & A. Micol (Ed.), http://www.ivoa.net/Documents/Notes/DMObs/DMObs-20050421.pdf. IVOA Note.
McDowell, J., Tody, D., & al. (2007). IVOA Spectral Data Model. http://www.ivoa.net/Documents/latest/SpectrumDM.html. IVOA Standards.
Plante, R., & al. (2007). IVOA Identifiers. http://www.ivoa.net/Documents/latest/IDs.html. IVOA Standards.
Plante, R., & al. (2010). VODataService : a VOResource schema extension for describing collections and services. http://www.ivoa.net/Documents/latest/VODataService/. IVOA Standards.
Preite Martinez, A., Derriere, S., Delmotte, N., Gray, N., & al. (2007). The UCD1+ controlled vocabulary. http://www.ivoa.net/Documents/latest/UCDlist.html. IVOA standards.
Richards, A., & Bonnarel, F. (2010). Note on the description of polarisation data v1.0. http://www.ivoa.net/Documents/Notes/Polarization/. IVOA Note.
Rots, A. (2007). Space-Time Coordinate Metadata for the Virtual Observatory. http://www.ivoa.net/Documents/REC/DM/STC-20071030.pdf. IVOA Standards.
Tody, D., & Dolensky, M. (2008). Simple Spectral Access Protocol. In D. Tody, & M. Dolensky (Ed.), http://www.ivoa.net/Documents/REC/DAL/SSA-20080201.pdf. IVOA Standards.
- 27 -

ObsTAP
- 28 -

ObsTAP
Appendix A: Use Cases in detailThe ability to discover data of a certain kind (images, spectra, cubes, etc.) according to scientific criteria (e.g., a given sky position, spectral coverage including spectral line X, spatial resolution better than Y, resolving power greater than Z) is central to archival astronomy. A special Take Up Committee of the IVOA was formed in 2009 to stimulate IVOA work in the area of catalogue-based science data access to allow astronomers to easily query and access scientific data. This committee came up with a list of data discovery use cases expressed as a set of constraints on selected scientific parameters to be used to query for datasets of interest. The full list of use cases is summarized below.
Please note that for most science cases, a full TAP implementation is required for them to work as well as STC regions support. (Rots, 2007)
Some of the use-cases listed by the committee require advanced functionalities like “search by type”, “query from an input list”, and have not been fully developed here.
Once a full TAP implementation is available, we will expand these science cases into working examples so they could be used as template and/or teaching examples.
Simple Examples
Simple Query by PositionShow me a list of all data that satisfies:
I. Datatype=anyII. contains RA=16.0 and DEC=40.0
These data would be searched on all VO services by sending the following query:SELECT * FROM ivoa.Obscore WHERECONTAINS(POINT(‘ICRS’,16.0,40.0),s_region)=1
This query could be submitted to a remote TAP service using the curl application as follows (in this example a CADC TAP service is referenced):
curl -v -L -d "REQUEST=doQuery&LANG=ADQL&QUERY=select * from ivoa.ObsCore where CONTAINS(POINT('ICRS',16.0,40.0 ),s_region)=1" "http://wa.nrc.gc.ca/caom/sync"
More constraints are added in the following use-case (1.3).
Query by both Spatial and Spectral AttributesShow me a list of all data that satisfies:
I. DataType=ImageII. Spatial resolution better than 0.3 arc secondsIII. Filter = J or H or KIV. RA between 16 hours and 17 hoursV. DEC between 10 degrees and 11 degrees
Such a query needs to compute RA in degrees, extract information from Filter and adjust spectral intervals for search.
SELECT * FROM ivoa.ObscoreWHERE dataproduct_type=’image'AND s_resolution < 0.3 AND s_ra > 240 AND s_ra < 255
- 29 -

ObsTAP
AND s_dec > 10 AND s_dec < 11AND (em_min > 2.1e-06 AND em_max < 2.4e-06)OR(em_min >= 1.6e-06 AND em_max <= 1.8e-06)OR(em_min >= 1.2e-06 AND em_max <= 1.4e-06)
This query could be submitted to a remote TAP service using the curl application as follows (in this example a CADC TAP service is referenced):
curl -v -L -d "REQUEST=doQuery&LANG=ADQL&QUERY=select * from ivoa.ObsCore where dataproduct_type='image' AND s_resolution < 1 AND s_ra >_ra < 255 AND s_dec > 10 AND s_dec < 11 AND em_min > .61e-06" http://www.cadc.hia.nrc.gc.ca/caom/sync
A.1 Discovering Images
A.1.1. Use case 1.1Show me all observations satisfying:
I. DataType = anyII. Energy includes 5 keVIII. RA includes 16.00IV. DEC includes +10V. Exposure time > 10 ks
SELECT * FROM ivoa.ObscoreWHERE em_min < 2:48E10 AND em_max > 2.48 E-10AND CONTAINS(POINT('ICRS',16.0,10.0),s_region) = 1AND t_exptime > 10000
A.1.2. Use case 1.2Let me input a list of RA and DEC coordinates and show me spatially coincident observations satisfying:
I. Imaging or spectroscopy dataII. Includes one or more of the RA,DEC values in the list (LIST=SERVICE REQ)III. Includes both a wavelength in the range 5000-900 angstroms AND an X-ray image
(AND=SERVREQ)
Part 1: Find XRAY data of interest:SELECT obs_id, obs_publisher_did, s_region, access_url INTOxray_user_table FROM ivoa.ObscoreWHERE dataproduct_type IN ('image', 'spectrum')AND em_min < 1E-8 AND em_max> 0.01E-8AND CONTAINS(POINT('ICRS', user_ra, user_dec), s_region) = 1
Part 2: Find optical data of interest:SELECT obs_id, obs_publisher_did, s_region, access_url INTOoptical_user_table FROM ivoa.ObscoreAND dataproduct_type IN ('image', 'spectrum')AND em_min < 9E-9 AND em_max > 5E-9AND CONTAINS(POINT('ICRS', user_ra, user_dec), s_region) = 1
- 30 -

ObsTAP
Part 3 : Compute overlap :SELECT * FROM xray user table AS xray, optical user table AS optWHERE INTERSECTS( xray.s region, opt.s region ) = 1
A.1.3. Use case 1.3Show me a list of all observations satisfying:
I. DataType=ImageII. Spatial resolution better than 0.3 arcsecondsIII. Filter = J or H or KIV. RA between 16 hours and 17 hoursV. DEC between 10 degrees and 11 degrees
SELECT * FROM ivoa.ObscoreWHERE dataproduct_type='image'AND s resolution < 0.3AND (( -- J band approximated(em_min + em_max)/2 BETWEEN 1.234E-6 - 162E-9 AND 1.234E-6 + 162E-9AND(em_max - em_min) BETWEEN 0.5 * 162E-9 AND 1.5 * 162E-9)OR( -- H band approximated(em_min + em_max)/2 BETWEEN 1.662E-6 - 251E-9 AND 1.662E-6 + 251E-9AND(em_max - em_min) BETWEEN 0.5 * 251E-9 AND 1.5 * 251E-9)OR( -- J band approximated(em_min + em_max)/2 BETWEEN 2.159E-6 - 262E-9 AND 2.159E-6 + 262E-9AND(em_max – em_min) BETWEEN 0.5 * 262E-9 AND 1.5 * 262E-9)AND s_ra BETWEEN 16*15 AND 17*15AND s_dec BETWEEN 10 and 11
A.1.4. Use case 1.4Show me a list of all observations that satisfying:
I. DataType=ImageII. Wavelength=V or I or ZIII. Spatial Resolution < 0:7 arcseconds FWHMIV. Exposure Time > 1000 secondsV. Data Quality: Fully Calibrated
SELECT * FROM ivoa.ObscoreWHERE dataproduct_type='image'AND ( ( -- V band approximated(em_min + em_max)/2 BETWEEN 5.5E-8 - 89E-9 AND 5.5E-8 + 89E-9AND(em_max – em_min) BETWEEN 0.5 * 89E-9 AND 1.5 * 89E-9)OR
- 31 -

ObsTAP
( -- I band approximated(em_min + em_max)/2 BETWEEN 9E-8 - 240E-9 AND 9E-8 + 240E-9AND(em_max – em_min) BETWEEN 0.5 * 240E-9 AND 1.5 * 240E-9)OR( -- Z band approximated (Using correct values???)(em_min + em_max)/2 BETWEEN 8.8E-8 - 95E-9 AND 8.8E-8 + 95E-9AND(em_max – em_min) BETWEEN 0.5 * 95E-9 AND 1.5 * 95E-9)AND s_resolution < 0.7AND t_exptime > 1000.AND calib_level > 1
A.1.5. Use case 1.5Show me all data that satisfies:
I. DataType=IFUII. DataQuality: Fully CalibratedIII. ObjectClass=quasar (SERVIC REQ + NEEDS ANOTHER SERVICE (CATALOGUE)IV. Redshift > 3:V. Radio flux > 1 mJy
We assume here that data providers will expose IFU data using dataproduct_type=’cube’.
SELECT * FROM ivoa.ObscoreWHERE dataproduct_type='cube'AND calib_level > 1AND CONTAINS(POINT('ICRS', quasar_ra, quasar_dec), s_region) = 1
A.1.6. Use case 1.6For an input list of RA, DEC, Mean Julian Date (MJD), show me all data that satisfies (LIST=SERVREQ)
I. DataType=imagingII. RA,DEC include the value and the list and Observation date is within 1 day of the
MJD value
SELECT * FROM ivoa.ObscoreWHERE dataproduct_type='image'AND CONTAINS(POINT('ICRS',user_ra,user_dec), s_region) = 1AND | (t_max + t_min)/2 – user_date | < 1 day
A.2. Discovering spectral data
A.2.1. Use case 2.1 Show me a list of all data that satisfies:
I. DataType=SpectrumII. Energy spans 1 to 5 keVIII. Total counts in spectrum > 100IV. Exposure time > 10000 seconds
- 32 -
ObsTAP
V. Data Quality: Fully Calibrated
A.2.2. Use case 2.2Show me a list of all data that satisfies:
I. DataType=SpectrumII. Wavelength includes 6500 angstromsIII. Spectral Resolution better than 15 angstromsIV. Spatial Resolution better than 2 arcseconds FWHMV. Exposure Time > 3600 secondsVI. Data Quality = Any
SELECT * from ivoa.ObscoreWHERE dataproduct_type='spectrum'AND em_min < 650E-9AND em_max > 650E-9AND em_res_power > 6500/15.AND s_resolution < 2AND t_exptime > 3600
A.2.3. Use case 2.3 Show me a list of all data that satisfies:
I. Emission line width Halpha > 2000 km/s FWHM (SERVICEREQ+NEEDS OTHER SERVICE)
A.3. Discover multi-dimensional observations
A.3.1. Use case 3.1 Show me a list of data with:
I. DataType=cube (IFU spectroscopy?)II. RA,DEC includes value RA1,DEC1III. Field size > 100 square arcsecondsIV. DataSensitivity = deepV. Spectral resolution better than 5 angstroms FWHM
A.3.2. Use case 3.2 Show me a list of all data that satisfies:
I. DataType=Cube with 3 dimensionsII. Axes includes VelocityIII. Axes includes RAIV. Axes includes DECV. Velocity Resolution better than 50 km/sVI. RA includes 16.000VII. Dec includes +41.000
NB: in this case optional data model fields related to redshift axis can be used using redshift_ucd=spect.DopplerVeloc, for instance.
A.3.3. Use case 3.3
- 33 -

ObsTAP
Show me a list of all data that satisfies:
I. DataType=cubeII. RA includes 16.00III. Dec includes +41.00IV. Wavelength includes 6500 angstromsV. Wavelength includes 4000 angstromsVI. Spectral resolution better than 5 angstromsVII. Exposure time more than 3600 secondsVIII. Data Quality: Fully Calibrated
SELECT * from ivoa.ObscoreWHERE dataproduct_type='cube'AND CONTAINS(POINT('ICRS',16, 41), s_region) = 1AND em_res_power > 6500./5.AND t_exptime > 3600 ?AND em_min < 650E-9AND em_max > 650E-9
A.3.4. Use case 3.4 Show me a list of all data that satisfies:
I. DataType=Cube with 3 dimensionsII. Axes includes FREQIII. Axes includes RAIV. Axes includes DECV. Velocity Resolution better than 1 km/sVI. RA includes 83.835000VII. Dec includes -5.014722VIII. Rest Frequency = 345.795990 GHzIX. VLSRK in the range [6.0, 10.0]
A.3.5. Use case 3.5 Show me a list of all data that satisfies:
I. DataType=Cube with 3 dimensionsII. Axes includes FREQIII. Axes includes RA with > 100 pixelsIV. Axes includes DEC with > 100 pixelsV. Frequency extent > 500 MHzVI. Rest Frequency = 345.795990 GHz appears in bandVII. The redshift is not specified, but should default to zsource for the target.
NB: I to V are supported in ObsTAP; VI and VII need target redshift properties extracted from catalogs
A.3.6. Use case 3.6 Show me a list of all data that satisfies:
I. DataType=Cube with 3 dimensionsII. Axes includes FREQIII. Axes includes RAIV. Axes includes DEC
- 34 -

ObsTAP
V. Frequency resolution < 10 MHzVI. Rest Frequency = 337.2966 GHz appears in bandVII. Any observation that could have detected a line at this rest frequency from
any target, using the nominal redshift for the target.
A.3.7. Use case 3.7 Show me a list of all data that satisfies :
I. DataType=Cube with 3 dimensionsII. Axes includes FREQIII. Axes includes RAIV. Axes includes DECV. Frequency resolution < 10 MHzVI. Rest Frequency in (213.36053, 256.0278, 298.6908925, 341.350826, 384.0066819,
426.6579505, 469.3041221, 511.944687, 554.5791355) GHz appears in bandVII. Any observation that could have detected HCS+ (list of transition rest
frequencies given above) from any target, using the nominal redshift for the target.
A.3.8. Use case 3.8 Show me a list of all data that satisfies:
I. DataType=Cube with 4 dimensionsII. Axes includes FREQIII. Axes includes RA with > 100 pixelsIV. Axes includes DEC with > 100 pixelsV. Axes includes STOKESVI. Frequency resolution < 1 MHzVII. Rest Frequency = 345.795990 GHz appears in band
NB: Need for a polarisation axis
A.3.9. Use case 3.9 Looking for moving targets:
I. Show me the names of all the objects that have moving coordinates (i.e. no fixed RA, Dec position).
A.4. Discovering time series
A.4.1. Use case 4.1Show me a list of all data which satisfies:
I. DataType=TimeSeriesII. RA includes 16.00 hoursIII. DEC includes +41.00IV. Time resolution better than 1 minuteV. Time interval (start of series to end of series) > 1 weekVI. Observation data before June 10, 2008VII. Observation data after June 10, 2007
SELECT * from ivoa.Obscore
- 35 -

ObsTAP
WHERE dataproduct_type='timeseries'AND CONTAINS(POINT('ICRS',16, 41), s region) = 1AND t resolution < 60.AND t_max - t_min > 7 * 86400AND t_max < 54627.5 -- mjd for June 10, 2008AND t_min > 54261.5 -- mjd for June 10, 2007
A.5. Discovering general data
A.5.1. Use case 5.1 Show me a list of all data that satisfies:
I. Optical imagingII. In the M81 groupIII. With area greater than 0.5 square degreesIV. With sensitivity > 10 _ _ for point source m=25V. I also want X-ray data with cutouts 5 arcmin on a side of all the detected galaxiesVI. I also want Radio data cutouts 5 arcmin on a side around detected galaxies
A.5.2. Use case 5.2Show me a list of all data that satisfies:
I. DataType=Imaging or SpectroscopyII. RA includes 16.00 hoursIII. DEC includes +41.00 degreesIV. SDSS images and spectra AND CFHTLS images and spectra
SELECT * from ivoa.ObscoreWHERE dataproduct_type IN ('image','spectrum')ANDobs_collection IN ('SDSS','CFHTLS')AND CONTAINS(POINT('ICRS',16, 41), s region) = 1
A.5.3. Use case 5.3In Virgo cluster show me imaging and X-ray data for all galaxies that are cluster members and have B < 21.
A.6. Other Use Cases
A.6.1. Use case 6.1Given COSMOS (or other survey) X-Ray source catalogue give me all the sources with photoZ > X, and spiral galaxy counterpart and produce radio - to -X-ray SEDs.
Comment: Requires source/object catalogues to drive data query (for SED info which may be catalogue or data).
A.6.2. Use Case 6.2Given a list of Abell clusters, give me all their Chandra images with exposure time > X, after I select regions occupied by the diffuse emission, give me all the Chandra point sources in these regions, and find their redshift (I want to find background quasars because I am
- 36 -

ObsTAP
interested in lensing and I have no idea where to go to find z). For the quasars, give me high resolution (< 0:5") optical and radio images, and build SEDs.
Comment: Requires source/object catalogues and interactive image interactions (applications/interfaces), further query, and more catalogues to drive data query.
A.6.3. Use case 6.3Find me all the variable Chandra sources with optical counterpart and redshift. If redshift is not available, give me an SED to compare with source templates (I also would like to run a tool or obtain a library of such templates from a theory database, which I expect the VO to provide). My aim is to separate stars from variable quasars.
Comment: Complicated, including templates and theory as well as catalogues.
- 37 -

ObsTAP
Appendix B: ObsCore Data Model Detailed DescriptionThis section provides a full description of all data model elements including both mandatory and optional elements (specified by the value in the “MAN” column). The full Utype for all elements of the Observation Core Components data model includes an “obscore:”prefix (defining the namespace for ObsCoreDM) which has been elided here for brevity.
Column Name Utype Unit Type Description MAN
OBSERVATION INFORMATION (section B.1)
dataproduct_type Obs.dataproductType unitless enum Data product (file content) primary type
YES
dataproduct_subtype
Obs.dataproductSubtype
unitless string Data product specific type NO
calib_level Obs.calibLevel unitless enumint
Calibration level of the observation: in {0, 1, 2, 3}
YES
TARGET INFORMATION (section B.2B.2)
target_name Target.Name unitless string Object of interest YES
target_class Target.Class unitless string Class of the Target object as in SSA NO
DATA DESCRIPTION (section B.3)
obs_id DataID.observationID unitless string Internal ID given by the obs/tap service
YES
obs_title DataID.Title unitless string Brief description of dataset in free format
NO
obs_collection DataID.Collection unitless string Name of the data collection YES
obs_creation_date DataID.Date unitless date Date when the dataset was created NO
obs_creator_name DataID.Creator unitless string Name of the creator of the data NO
obs_creator_did DataID.CreatorDID unitless string IVOA dataset identifier given by the creator
NO
CURATION INFORMATION (section B.4)
obs_release_date Curation.releaseDate unitless string Observation release date (ISO 8601) NO
obs_publisher_did Curation.publisherDID
unitless string Dataset ID given by the publisher. YES
publisher_id Curation.publisherID unitless string IVOA-ID for the Publisher NO
bib_reference Curation.reference unitless string Service bibliographic reference NO
data_rights Curation.rights unitless enum Public/Secure/Proprietary/ NO
ACCESS INFORMATION (section B.5)
access_url Access.reference unitless URL used to access dataset YES
access_format Access.format unitless string Content format of the dataset YES
access_estsize Access.size Kbytes int Estimated Size of dataset: in Kilo Bytes
YES
SPATIAL CHARACTERISATION (section B6.1)
- 38 -

ObsTAP
s_ra Char.SpatialAxis.Coverage.Location.Coord.Position2D.Value2.c1
deg double Central Spatial Position in ICRS YES
s_dec Char.SpatialAxis.Coverage.Location.Coord.Position2D.Value2.c2
deg double YES
s_fov Char.SpatialAxis.Coverage.bounds.extent.diameter
deg double Estimated size of the covered region as the diameter of a containing circle
YES
s_region Char.SpatialAxis.Coverage.Support.Area
AstroCoordArea
Region covered in STC or ADQL YES
s_resolution Char.SpatialAxis.Resolution.refval.CResolution
arcsec float Spatial resolution of data as FWHM YES
s_ucd Char.SpatialAxis.ucd unitless string (pos or u,v data) NO
s_resolution_min Char.spatial.Resolution.Bounds. Limits.interval.loLim
arcsec double Resolution min value on spectral axis (FHWM of PSF)
NO
s_resolution_max Char.spatial.Resolution.Bounds. Limits.interval.hiLim
arcsec double Resolution max value on spectral axis
NO
s_calib_status Char.SpatialAxis.calibStatus
unitless enum NOT CALIBRATED, FINE, COARSE NO
s_stat_error Char.SpatialAxis.Accuracy.statError.refval.value
arcsec double Astrometric precision along the spatial axis
NO
TIME CHARACTERISATION (section B6.3)
t_min Char.timeAxis.Coverage.bounds.limits.interval.startTime
day double Start time in MJD YES
t_max Char.timeAxis.Coverage.bounds.limits.interval.stopTime
day double Stop time in MJD YES
t_exptime Char.timeAxis.Coverage.support.extent
s float Total exposure time YES
t_resolution Char.timeAxis.Resolution.Refval
s float Temporal resolution FWHM YES
t_calib_status Char.timeAxis.calibStatus
unitless enum Type of coord calibration NO
t_stat_error Char.timeAxis.Accuracy.statError.refval.value
s double Time coord statistical error NO
SPECTRAL CHARACTERISATION (section B6.2)
em_ucd Char.SpectralAxis.ucd unitless string Nature of the spectral axis NO
em_min Char.SpectralAxis.Coverage.Bounds.Limits.Interval.LoLim
m double start in spectral coordinates YES
em_max Char.SpectralAxis.Coverage.Bounds.Limits.Interval.HiLim
m double stop in spectral coordinates YES
em_res_power Char.SpectralAxis.Res unitless double Value of the resolving power along YES
- 39 -
ObsTAP
olution.ResolPower .Refval
the SpectralAxis. (R)
em_res_power_min
Char.SpectralAxis.Resolution.ResolPower.LoLim
unitless double Resolving power min value on spectral axis
NO
em_res_power_max
Char.SpectralAxis.Resolution.ResolPower.HiLim
unitless double Resolving power max value on spectral axis
NO
em_resolution Char.SpectralAxis.Resolution.Refval.Value
m double Value of Resolution along the SpectralAxis
NO
em_stat_error Char.SpectralAxis.Accuracy.StatError.Refval.Value
m double Spectral coord statistical error NO
OBSERVABLE AXIS (sectionB6.4)
o_ucd Char.ObservableAxis.ucd
unitless string Nature of the observable axis YES
o_units Char.ObservableAxis.units
unitless enum Units used for the observable values NO
o_calib_status Char.ObservableAxis.calibStatus
unitless enum Level of calibration for the observable coord
NO
o_stat_error Char.ObservableAxis.accuracy.statError.refval.value
units specified by o_units
double Statistical error on the Observable axis
NO
POLARISATION AXIS (section B6.6)
pol_states Char.PolarisationAxis.stateList
unitless string List of polarization states measured in this data set
NO
PROVENANCE (section B7)
facility Provenance.obsConfig.facility.name
unitless string [from the VODataServiceStandard] NO
instrument Provenance.obsConfig.instrument.name
unitless string The name of the instrument used for the observation
NO
proposal_id Provenance.proposalID
string string Identifier of proposal to which observation belongs
NO
Table 1: Data model summary
B.1. Observation InformationThis class is a place holder that gathers all metadata relative to an observed and distributed dataset. It points to existing classes of Spectrum DM and types from VODataservice (Plante & al., 2010).
B.1.1. Data Product Type (dataproduct_type) The model defines a data product type attribute for the Observation Class. It is the type of observation the user queries for or selects for retrieval. Only high level generic types are defined at this level to allow global data discovery queries to be posed to multiple data archives. This is coded as a string that conveys a general idea of the content and organization of a dataset. Possible values for this string are described in section 3.3.1.
- 40 -

ObsTAP
The short name for this attribute is dataproduct_type in the implemented Ivoa.ObsCore table, as shown in Table 1.
B.1.2. Data Product Subtype (dataproduct_subtype)In order to be more precise the data product type may be refined with a second field, the data product subtype. Unlike the more generic dataproduct_type, this field is intended to precisely specify the scientific nature of the data product, possibly in terms relevant only to a specific archive or data collection. While less useful for global data discovery this allows the data products within a specific archive to precisely identified and referenced in queries of that specific archive. The data provider should define a vocabulary sufficient to classify all science data products in their archive to be exposed with ObsTAP. In the future we may be able to define broader standards to classify data at this level, although it will likely always be the case that data differs at the level of specific instrumental survey data collections. The data product subtype allows data within a specific archive or data collection to be precisely classified and referenced in subsequent discovery queries. Subtype names should be simple identifiers or dot-delimited tokens (a, a.b, a.b.c, etc.).
B.1.3. Calibration level (calib_level) It is a convention we suggest to use to classify the different possible calibration status of an observed dataset. These 4 categories allow distinguishing 4 levels of calibration and would be sufficient for 80% of the data collections. This will be up to the data provider to consider how to map his own internal classification to the suggested scale here.
Following examples can help to find the most appropriate value for the calibLevel attribute (Obs.calibLevel).
Level 0: Raw instrumental data, possibly in proprietary internal provider format, that needs specific tools to be handled.
Level 1: Instrumental data in a standard format (FITS, VOTable, SDFITS, ASDM, etc. The data may or may not be calibrated. Standards tools can handle it.
Level 2: Science ready data, with instrument signature removed, and calibration status defined on all physical axes.
Level 3: Enhanced data products like mosaics, improved co-added image cubes, resampled or drizzled images, etc., spectra with calibrated velocity axis at a particular line rest frequency. In such case, the improved calibration procedure is described by the data provider in some way; progenitors of such a data product can be identified into the reduction pipeline.
This classification is simple enough to cover all regimes. Data providers will adjust the mapping of their various internal levels of calibration to this general frame.
B.2. TargetThis is the astronomical object of interest for which the observation was performed. Only the name is used in the Core Components model but the Target object is fully designed in the Spectrum data model. Serendipitous archives or surveys may not contain this information for all observations, so this can be ‘NULL’ if necessary or have a value like ‘DARK’ for instance to specify a dark field and not a pointed observation.
- 41 -
ObsTAP
B.2.1. Target Name (target_name)The target_name specified here is often un-reliable when one is searching for specific classes of objects, at least for most archives since it is quite hard to standardize automatically the target name for each observation. So the users could be warn that specifying target_name for their search will not necessarily return the expected results. It is quite useful for moving target like planets.
B.2.2. Class of the Target source/object (target_class)This field indicates the type of object that was pointed for this observation. It is a string with possible values defined in a special vocabulary set to be defined: list of object classes (or types) used by the SIMBAD database, NED or defined in another IVOA vocabulary.
B.3. Dataset DescriptionAfter acquisition and reduction an observation is uniquely identified by its creator and gets a creator dataset identifier. This information is defined in the Spectrum data model in the DataID class. We re-use this class and the Utype DataID.CreatorDID in order to distinguish two dataset curated by two different services (archives) but originating from the same creator. When broadcasting a query to multiple servers, the response may contain multiple copies of the same dataset, with a unique DataID.CreatorDID obs_creator_did but possibly different obs_publisher_did (given by the data provider). Therefore a unique identifier is needed here. In the ObsCore model, the short name associated to this ID should be obs_id (to be checked).
The second identifier used in this model is the one given by the data provider, and defined in the Curation Class.
B.3.1. Creator name (obs_creator_name) The name of the institution or entity which created the dataset, in a simple string.
B.3.2. Observation Identifier (obs_id)The obs_id column contains a collection-specific identifier for an observation. In the case where multiple data products are available for an observation (e.g. with different calibration levels), the obs_id value will be the same for each product of the observation. This is equivalent to the dataset name for many archives where dataset name could have many files associated with them.
B.3.3. Dataset Text Description (obs_title) This data model field re-uses a field from the Spectrum Data model: DataID.Title. It should contain a brief description (displayable in less than one line of text) specifying in scientific terms the content of the dataset. The contents of this field are free format and are up to the data provider. For example a radio survey field consisting of HI and CO cubes and an associated 2D continuum image might use obs_title to describe the individual data products as "HI cube", "CO cube", "Stokes I continuum image at 1420 MHz", and so forth.
This is commonly used in analysis software to e.g describe a dataset in a query response table, in a plot header, in the label of a displayed image, and so forth. This helps the user to check the validity and pertinence of a selected data set for his/her personal goal.
- 42 -
ObsTAP
B.3.4. Collection name (obs_collection)The name of the collection (DataID.Collection) identifies the data collection to which the data product belongs. A data collection can be any collection of datasets which are alike in some fashion. Typical data collections might be all the data from a particular telescope, instrument, or survey. The value is either the registered shortname for the data collection, the full registered IVOA identifier for the collection, or a data provider defined shortname for the collection. Examples: HST/WFPC2, VLT/FORS2, CHANDRA/ACIS-S, etc.
We understand that this is not a very precisely defined field. What is important for the data provider is to use the collection name which is meaningful to astronomers.
B.3.5. Creation date (obs_creation_date) The date when the dataset was created. This is a time stamp, stored in ISO 8601 format, using this specific format :(“YYYY-MM-DDThh:mm:ss”).
B.3.6. Creator name (obs_creator_name) The name of the institution or entity which created the dataset.
B.3.7. Dataset Creator Identifier (obs_creator_did)IVOA dataset identifier given by its creator. See definition in the SpectrumDM specification (McDowell, Tody, & al, 2007)
B.4. Curation metadataThe Curation class inherits from the Spectrum data model and VOResource concepts too. The various attributes for ObsCore are:
B.4.1. Publisher Dataset ID (obs_publisher_did)This is the identifier the publisher provides for this observation. It may differ from the original identifier given by the creator of the dataset. (new reduction, new version, etc..). The corresponding Utype mapped from the Spectrum DM is Curation.PublisherDID and relates to the same definition
This field contains the IVOA dataset identifier (Plante & al., 2007) for the published data product. This value must be unique within the namespace controlled by the dataset publisher (data center). The value will also be globally unique since each publisher has a unique registered publisher ID. The same dataset may however have more than one publisher dataset identifier if it is published in more than one location (the creator DID, if defined for the given dataset, would be the same regardless of where the data is published).
B.4.2. Publisher Identifier (publisher_id)The IVOA ID for the data provider as defined in the Spectrum DM.
B.4.3. Bibliographic Reference (bib_reference)URL or bibcode for documentation. This is a forward link to publications which reference the dataset. This is an exact re-use of the SSA definition. See (Tody & Dolensky, 2008) in section 4.2.5.6 about Curation Metadata.
- 43 -

ObsTAP
B.4.4. Data Rights (data_rights)This parameter allows mentioning the availability of a dataset. Possible values are: public, secure, or proprietary as stated in the VODataService recommendation (Plante & al., 2010).
B.4.5. Release Date (obs_release_date)This is a new attribute added to the original class inherited from the Curation class in SpectrumDM.
It specifies the date of public release for an observation or a data product. This time stamp is a convenient way to distinguish public and private observations and also tell users when a specific data product will become available. The value is in ISO 8601 format reusing this pattern: (“YYYY-MM-DDThh:mm:ss”) and could be NULL. An observation with a NULL value in the releaseDate attribute is private by definition.
B.5. Data Access The data format as well as the URL to access the dataset is provided by the Access Class inherited from the SSA Utype list. (Tody & Dolensky, 2008). The estimated size of the data file is also given by the Size attribute and corresponds to the approximate number of kilobytes expected.
B.5.1. Access Reference (access_url)This item (Access.Reference) contains a URL that can be used to download the data product (as a file of some sort).
Users should be aware that these URL values could be volatile and subject to be different from one access time to another. The access reference URL may refer to a static object or may cause data to be generated on the fly, so long as access is synchronous.
B.5.2. Access Format (access_format)This data model item is defined in section 4.7.
Here is an example of such a list.
We are aware that many different domains and applications need to define data formats , and then define a controlled vocabulary based on implementation feedback given by data providers at different sites.
B.5.3. Estimated Size (access_estsize)The Access.Size field contains the approximate size (in kilobytes) of the file available via the corresponding url. This is used only to gain some idea of the size of a data product before downloading it, hence only an approximate value is required. It is only a useful indication that can help to tune download functionalities in an application according to high volumes of data and transfer bit rate.
B.6. Description of physical axes: Characterisation classesAs mentioned in the use-cases, selection criteria for an observation depend on the physical axes contained in the dataset especially the position, band, time, and the type of observed quantity that we call “observable” in the data model. The observable axis can cover various types of flux but also velocity, etc. Such a description was tackled in the IVOA
- 44 -

ObsTAP
Characterisation data model (Louys & al., 2008) from which we re-use mainly the first level and second levels of details except for the spatial coverage where the support region (level 3) is used too.
B.6.1. Spatial axis
B.6.1.1. The observation reference position: (s_ra and s_dec)Two coordinates in position are used to identify a reference position (typically the center) of an observation in the sky, attached to a coordinate system definition.
Coordinate system
The coordinate system defined in the Characterisation DM is based on the STC:Coordsys class. The model in principle supports all kind of coordinate systems defined in the STC reference list (Rots, 2007). However, the ObsTAP implementation of the model mandates that queries expressed in ICRS should be supported in an ObsTAP service. This allows a general query to be sent to multiple archives or data centers, but requires some interpretation /conversion of coordinates at the server side. Still this is efficient for the large data discovery strategy we need to provide. Data in a specific coordinate system will be available via client applications that would do the conversions or adapt the coordinate system to some specific servers.
Coordinates
The model uses the Location Class from the Characterisation DM, with the Utype values:
Char.SpatialAxis.Coverage.Location.Coord.Position2D.Value2.C1
Char.SpatialAxis.Coverage.Location.Coord.Position2D.Value2.C2
whose short names in the ObsCore table are s_ra and s_dec. We assume that ObsTAP implements these coordinates in the ICRS system.
Using other coordinate systems as defined in STC CITATION STC \l 1036 (Rots, 2007) and re-used in the Characterisation DM, can be considered in client applications in charge of the coordinate translations.
B.6.1.2. The covered regionThe Coverage class along the spatial axis provides two possible concepts:
Bounds which in turn can use two representations:
a) A bounding box that can estimate very coarsely the coverage of an observation. It is modeled as a couple of intervals on each coordinates with Utypes:Char.SpatialAxis.Coverage.Bounds.limits.Interval.LoLimit2Vec.C1Char.SpatialAxis.Coverage.Bounds.limits.Interval.HiLimit2Vec.C1Char.SpatialAxis.Coverage.Bounds.limits.Interval.LoLimit2Vec.C2Char.SpatialAxis.Coverage.Bounds.limits.Interval.HiLimit2Vec.C2
b) The extent of the field of view (s_fov)
- 45 -

ObsTAP
The model offers to estimate the size of the diameter of the greater circle encompassing the field of view.
This is not covered by the Characterisation DM v1.1 but in the new release of Characteriation v2.0 as Char.SpatialAxis.Coverage.bounds.extent.diameter, a new definition added in Characterisation DM v2.0 ( to appear).
B Support: (s_region)
A precise region description of spatial footprint of the dataset using region types like Circle, Polygon, etc., provided in STC. The Utypes:
Char.SpatialAxis.Coverage.Support.AreaChar.SpatialAxis.Coverage.Support.AreaType
define this region, and STC-S can be used to serialise the values.
B.6.1.3. Spatial Resolution (s_resol )The minimal size that can be distinguished along the spatial axis, s_resol is specified in arcseconds and has the following Utype: Char.SpatialAxis.Resolution.RefVal .
B.6.1.4. Astrometric Calibration Status: (s_calib_status) A string to encode the calibration status along the spatial axis (astrometry).
Possible values could be {uncalibrated, raw, calibrated} and correspond to the Utype Char.SpatialAxis.calibStatus
For some observations, only the pointing position is provided (s_calib_status =”uncalibrated”). Some other may have a raw linear relationship between the pixel coordinates and the world coordinates (s_calib_status =”raw”)..
B.6.1.5. Astrometric precision (s_stat_error)This parameter gives an estimate of the astrometric statistical error after the astrometric calibration phase. The corresponding Utype is: Char.SpatialAxis.Accuracy.StatError.Refval.
B.6.1.6. Spatial sampling (s_pixel_scale)This corresponds to the sampling precision of the data along the spatial axis. It is stored as a real number corresponding to the spatial sampling period, i.e., the distance in world coordinates system units between two pixel centers. It may contain two values if the pixels are rectangular.
B.6.2. Spectral axisThis axis is generally used to represent different kinds of physical measurements: wavelength, energy, frequency or some interpretation of this with respect to a reference position like velocity.
The data model distinguishes the various flavors of this axis using the UCD attached to it, Char.spectralAxis.ucd named as em_ucd in Obs/Tap optional fields. Possible values for this UCD are defined in the Spectrum DM (McDowell & al., 2007) in section 4.1.
Depending on the UCD used to specify the axis, the Obscore model allows to describe the spectral coordinates in a relevant unit, corresponding to the spectral quantity, and specified in the model in Char.spectralAxis.unit
- 46 -

ObsTAP
Here is a short list of preferred value for the Observation data model Core Components extracted from the recommended values proposed in the Spectrum DM.
Spectral coordinate Char.spectralAxis.ucd Char.spectralAxis.unit
frequency em.freq Hz
wavelength em.wl m or angstrom
energy em.energy keV, J, erg
Note that for the ObsTAP implementation, the Spectral axis coordinates are constrained as a wavelength quantity expressed in meters as mentioned in section REF _Ref285651639 \r \h 4.17
B.6.2.1. Spectral calibration status (em_calib_status)This attribute of the spectral axis indicates the status of the data in terms of spectral calibration. Possible values are defined in the CharDM and belong to {calibrated, uncalibrated, relative, normalized}.
B.6.2.2. Spectral BoundsThese are the limits of the spectral interval covered by the observation, in short em_min and em_max.
These limiting values are compatible with definitions of the physical quantity defined in the ucd and unit fields.
In the ObsTAP implementation such values are expressed as wavelength but using meters as units as it is easily convertible.
B.6.2.3. Spectral ResolutionAs in the Characterisation data model we distinguish a reference value of the point spread function along the spectral axis from the resolution power along this axis, more appropriate when the resolution varies along the spectral axis. Only one of the following is needed in the data model:
a) A reference value for Spectral Resolution (em_resol)
A mean estimate of the resolution (FWHM of the LSF). This can be used for narrow range spectra whereas in the majority of cases, the resolution power is preferable due to the LSF variation along the spectral axis.
Char.spectralAxis.Resolution.refval.value.
b) A reference value for Resolving Power (em_res_power)
This is an average estimation for the spectral resolution power.stored as a double value, with no unit. Char.spectralAxis.Resolution.resolPower refval
c) Resolving Power limits (em_res_power_min, em_res_power_max)
- 47 -

ObsTAP
These parameters simply give the limits of variation of the resolution power in the observation as minimal and maximal values and use the following Utypes:
Char.spectralAxis.Resolution.resolPower .LoLim
Char.spectralAxis.Resolution.resolPower.HiLim
B.6.2.4. Accuracy along the spectral axis (em_stat_error)This is also provided in the Characterisation data model, using the item mapped to the Utype: Char.SpectralAxis.Accuracy.StatError.refval.value and, stored in the same units as all the other spectral quantities.
B.6.3. Time axis
B.6.3.1. Time coverage (t_min, t_max, t_exptime)Three time stamps are used: t_start, t_stop, and t_exptime the exposure time.A format like MJD is useful for easy calculations and preferred for the Observation Core components model. Other information is given in subsection REF _Ref285666427 \r \h 4.14 and REF _Ref285666434 \r \h 4.15 .
B.6.3.2. Time resolution (t_resolution)Estimated or average value of the temporal resolution with Utype
Char.TimeAxis.Resolution.refval.value
B.6.3.3. Time Calibration Status: (t_calib_status) This parameter gives the status of time axis calibration. This is especially useful for time series.
B.6.3.4. Time Calibration Error: (t_stat_error) A parameter used if we can estimate a statistical error on the time measurements (for time series again).
B.6.4. Redshift Axis:In order to support queries looking for radial velocity measurements, we envision including the Redshift Axis description as presented in the Spectrum Data model.
The full description of the appropriate data model fields will be prepared and added in the next version of the ObsCore specification.
B.6.5. Observable Axis:
B.6.5.1. Nature of the observed quantity (o_ucd) Most observations measure some flux quantity depending on position, spectral coordinate, or time. Here we consider a more general axis: the “observable axis” that can be either flux or any other quantity, the nature of which is specified by the UCD attached to this axis.
- 48 -

ObsTAP
The possible UCD values are part of the UCD1+ vocabulary (Preite Martinez & al., 2007).One can find simple flux classes like: phot.flux, phot.flux.density, phot.count, phot.mag, or more complex combinations such as: phot.flux.density;phys.polarization.stokes.I
Various possibilities have been gathered at the following URL:http://www.ivoa.net/internal/IVOA/ObsTap/ListForObservable25Oct2010.pdf
which provides a (non-exhaustive) list of possible triplets (observable name, UCD, units) for various observables data providers may want to describe in their archive. The units used to encode values of the Observable quantity are specified in Char.ObservableAxis unit. See examples in the table and can be exposed in ObsTAP with the optional field o_unit .
B.6.5.2. Calibration status on observable (Flux or other) (o_calib_status)This describes the calibration applied on the Flux observed ( or other observable quantity) .
It is a string to be selected in {absolute, relative, normalized, any} as defined in the SSA specification CITATION Tod08 \l 1036 (Tody & Dolensky, 2008) in section 4.1.2.10.
This list can be extended or updated for instance using an extension mechanism similar to the definition of new UCDs in the IVOA process
B.6.6. Polarisation measurements (o_ucd :mandatory and pol_states: optional)This covers the case when the observed flux was recorded for various states of a polarizer.Then the dataset can be: a set of images, a set of spectra, a set of spectral cubes with various polarisation flux at each data point, etc.. What differs is the nature of the observable and the list of possible polarization states recorded.
In this case, o_ucd should at least contain the substring ‘phys.polarisation’ like in "phot.flux.density;phys.polarisation" . The polarisation measure can be specified with UCD strings like in phot.flux.density;phys.polarisation.StockesI, etc. as shown in the list of observable UCD cited above.
In order to distinguish various polarization states recorded in a dataset, we define a polarizationAxis. Char.PolarisationAxis.stateList contains the list of the various polarization modes present in the dataset.
It is an optional field in the Obs/TAP implementation: pol_states .It contains a list of polarization labels inspired from the FITS specification. See Table 7 in FITS WCS Paper 1 (Greisen & Calabretta, 2002) . Labels are combined using symbols from the {I Q U V RR LL RL LR XX Y Y XY Y X POLI POLA} set and separated by a / character.
Then a query can be easily written like :SELECT * WHERE pol_states LIKE '%Y%'
which brings back all polarization moments of type :Y XY YX YY
On the contrary, SELECT * WHERE pol_states LIKE '%/Y/%'
selects only datasets containing Y polarization state.
See A. Richards IVOA Note for the context of polarization data (Richards & Bonnarel,2010). The full description of polarization metada is covered in the upcoming Characterisation data model v2.0 (Bonnarel, Chilingarian, & Louys, (in prep.))
- 49 -

ObsTAP
B.7. ProvenanceProvenance contains a class to represent the entire Observing configuration used to acquire an observation. Instrumental parameters are gathered here.
B.7.1. Facility (facility)This class codes information about the observatory or facility used to collect the data. In this model we define two attributes: name and type.
Provenance.obsConfig.facility.name re-uses the Facility concept defined in the VODataService specification (Plante & al., 2010). The definition of a list of possible name values could be a task for the IVOA Semantic working group, starting from the ADS list published at http://vo.ads.harvard.edu/dv/facilities.txt that could be enriched when necessary.
B.7.2. Instrument name (instrument) The name of the instrument used for the acquisition of the observation. It is given in the model as Provenance.ObsConfig.instrument.name and encoded as a string. The possible name values could be checked in coordination with Semantic WG too, as stated above.
B.7.3. Proposal (proposal_id)Each proposal has an identifier attribute that can be used to collect all observations and data products related to the same proposal. The corresponding Utype will simply be Proposal.identifier[NB: Here is presented only a minimal set of information on the instrumental configuration. See future documents on Provenance data model.]
Appendix C: TAP_SCHEMA tables and usage
C.1. Implementation ExamplesExamples of the ObsTAP use-cases and ObsTAP Schema can be found at the following URL:
http:// www.cadc.hia.nrc.gc.ca/cvo/
This page will be kept current as the ObsTAP standard evolves.
C.2. List of data model fields in TAP_SCHEMATAP Schema (TAP_SCHEMA.columns) metadata for all mandatory and optional data model fields are given in the following tables. We suggest using only lower case for all column names in the tables used to implement ObsTAP, in order to simplify queries against multiple database systems.
Utypes strings are easier to read in ‘Camel case’ that is why we recommend to use these strings as written in the tables below, for all interactions with users and developers. These
- 50 -

ObsTAP
strings are produced and read in VOTable for instance and may be consumed by some applications.
For Utypes originating from the Spectrum Data model, we keep the original writing.
For Utypes created from the UML ObsCore model, we apply this rule:
Attributes of a class start with a lower case letter (e.g. calibStatus) For classes referencing one other class, we use the name of the reference or role,
and not the one of the pointed class.
- 51 -
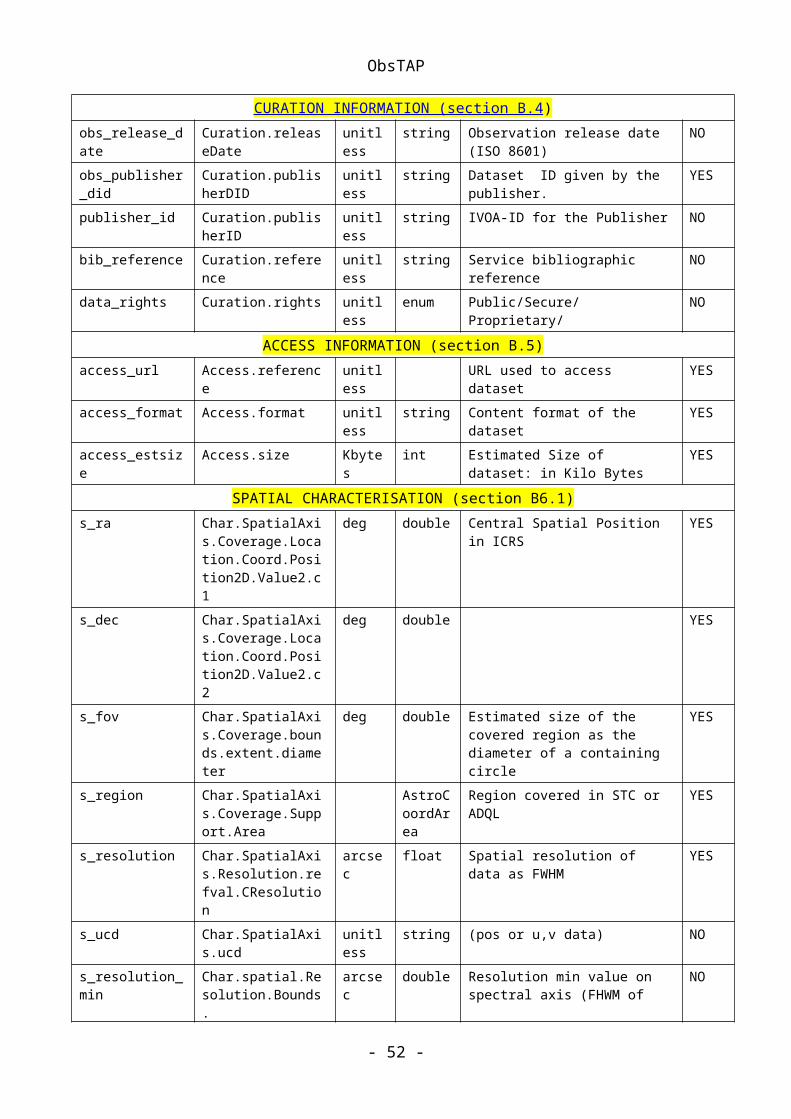
ObsTAP
Table 6 TAP_SCHEMA.columns values for the mandatory fields of an ObsTAP table. All Utypes have the data model namespace prefix “obscore:” omitted in the table.
Column Name Datatype Size Units ObsCoreDM Utype UCD Principal
Index Std
dataproduct_type adql:VARCHAR TBD NULL Obs.dataProductType meta.id;class 1 TBD 1
calib_level adql:INTEGER NULL NULL Obs.calibLevel meta.id;class 1 TBD 1
obs_collection adql:VARCHAR TBD NULL DataID.Collection meta.id 1 TBD 1
obs_id adql:VARCHAR TBD NULL DataID.Creatordid meta.id 1 TBD 1
obs_publisher_did adql:VARCHAR TBD NULL Curation.PublisherDID meta.ref.url;meta.curation 1 TBD 1
access_url adql:CLOB NULL NULL Access.Reference meta.ref.url 1 0 1
access_format adql:VARCHAR NULL NULL Access.Format meta.id;class 1 TBD 1
access_estsize adql:BIGINT NULL kB Access.Size phys.size;meta.file 1 0 1
target_name adql:VARCHAR TBD NULL Target.Name meta.id;src 1 0 1
s_ra adql:DOUBLE NULL deg Char.SpatialAxis.Coverage.Location.Coord.Position2d.Value2.c1
pos.eq.ra 1 TBD 1
s_dec adql:DOUBLE NULL deg Char.SpatialAxis.Coverage.Location.Coord.Position2d.Value2.c2
pos.eq.dec 1 TBD 1
s_fov adql:DOUBLE NULL deg Char.SpatialAxis.Coverage.Bounds.Extent.diameter
phys.angSize;instr.fov 1 TBD 1
s_region adql:REGION NULL deg Char.SpatialAxis.Coverage.Support.Area
phys.area;obs 1 TBD 1
- 52 -

ObsTAP
s_resolution adql:DOUBLE NULL deg Char.SpatialAxis.Resolution.refval.cresolution
pos.angResolution 1 TBD 1
t_min adql:DOUBLE NULL d Char.TimeAxis.Coverage.Bounds.Limits.Interval.StartTime
time.start;obs.exposure 1 TBD 1
t_max adql:DOUBLE NULL d Char.TimeAxis.Coverage.Bounds.Limits.Interval.StopTime
time.stop;obs.exposure 1 TBD 1
t_exptime adql:DOUBLE NULL s Char.TimeAxis.Coverage.Support.Extent
time.duration;obs.exposure 1 TBD 1
t_resolution adql:DOUBLE NULL s Char.TimeAxis.Resolution.Refval time.resolution 1 TBD 1
em_min adql:DOUBLE NULL m Char.SpectralAxis.Coverage.Bounds.Limits.Interval.LoLlim
em.wl;stat.min 1 TBD 1
em_max adql:DOUBLE NULL m Char.SpectralAxis.Coverage.Bounds. Limits.Interval.HiLlim
em.wl;stat.max 1 TBD 1
em_res_power adql:DOUBLE NULL NULL Char.SpectralAxis.Resolution.resolpower.refval
spec.resolution 1 TBD 1
o_ucd adql:VARCHAR TBD NULL Char.ObservableAxis.ucd meta.ucd 1 TBD 1
- 53 -
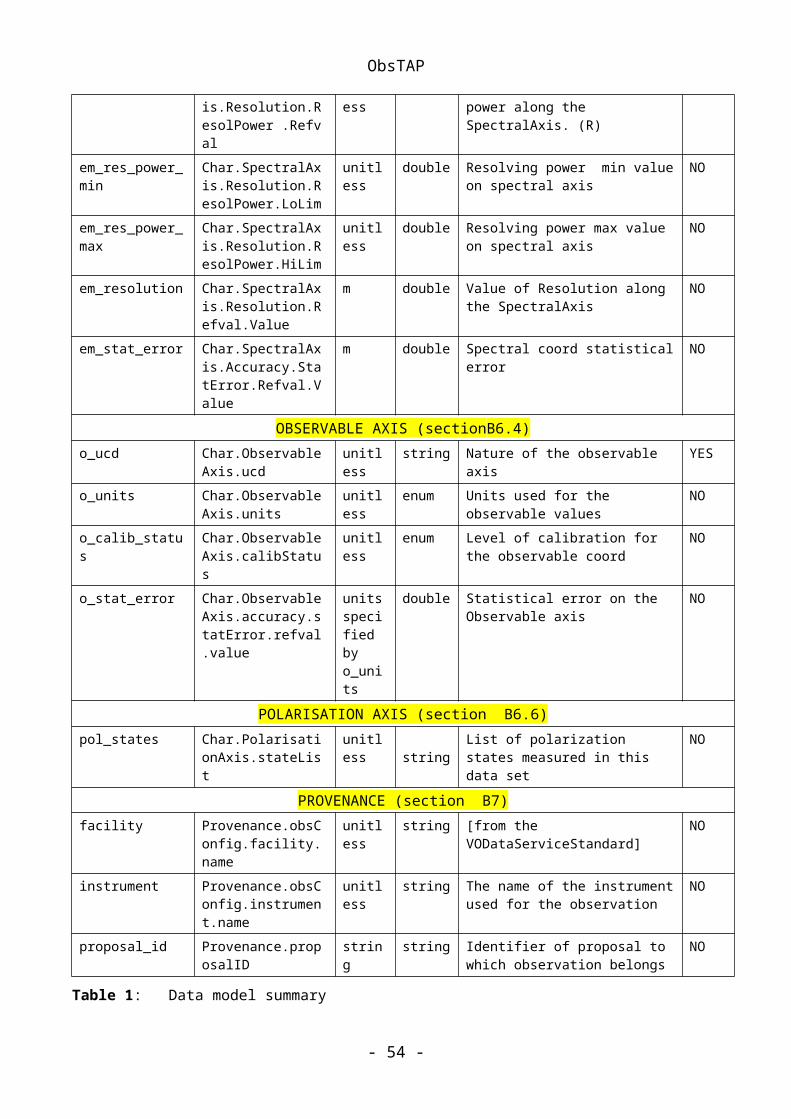
ObsTAP
Table 7 TAP.schema.columns values for the optional fields for an ObsTAP table. All Utypes have the data model namespace prefix “obscore:” omitted in the table.
Column Name Datatype Size Units ObsCoreDM Utype UCD Principal Index Std
dataproduct_subtype adql:VARCHAR TBD NULL Obs.dataProductSubtype meta.id;class 1 TBD TBD
target_class adql:VARCHAR TBD NULL Target.class src.class 1 TBD 1
obs_creation_date adql:TIMESTAMP NULL NULL DataID.Date time;meta.dataset 1 TBD 1
obs_creator_name adql:VARCHAR TBD NULL DataID.Creator meta.id;creator 1 TBD 1
obs_title adql:VARCHAR 200 NULL DataID.Title meta.title;obs 1 TBD TBD
publisher_id adql:VARCHAR TBD NULL Curation.PublisherID meta.ref.url;meta.curation 1 TBD 1
bib_reference adql:VARCHAR TBD NULL Curation.Reference meta.bib.bibcode 1 TBD 1
data_rights adql:VARCHAR NULL d Curation.Rights meta.code 1 0 1
obs_release_date adql:TIMESTAMP NULL NULL Curation.releaseDate time.release 1 0 1
s_ucd adql:VARCHAR NULL NULL Char.SpatialAxis.ucd meta.ucd 1 0 1
s_resolution_min adql:DOUBLE NULL NULL Char.SpatialAxis.Resolution.Bounds. Limits.Interval.LoLim
pos.angResolution;stat_min 1 1
s_resolution_max adql:DOUBLE NULL NULL Char.SpatialAxis.Resolution.Bounds. Limits.Interval.HiLim
pos.angResolution;stat_max 1 1
s_calib_status adql:VARCHAR NULL NULL Char.SpatialAxis.calibStatus meta.code.qual 1 1
s_stat_error adql:DOUBLE NULL NULL Char.SpatialAxis.Accuracy.statError.refval.value
stat.error;pos.eq 1 1
t_calib_status adql:VARCHAR NULL NULL Char.TimeAxis.calibStatus meta.code.qual 1 1
t_stat_error adql:DOUBLE NULL s Char.TimeAxis.Accuracy.StatError.Refval.value
stat.error;time 1 1
em_ucd adql:VARCHAR NULL NULL Char.SpectralAxis.ucd meta.ucd 1 1?
em_unit adql:VARCHAR NULL NULL Char.SpectralAxis.unit meta.unit 1 1?
- 54 -

ObsTAP
em_res_power_min adql:DOUBLE NULL NULL Char.SpectralAxis.Resolution.resolPower.LoLim
spect.resolution;stat.min 1 1
em_res_power_max adql:DOUBLE NULL NULL Char.SpectralAxis.Resolution.resolPower.HiLim
spect.resolution;stat.max 1 1
em_resolution adql:DOUBLE NULL m Char.SpectralAxis.Resolution.refval.value
spect.resolution;stat.mean 1 1
em_stat_error adql:DOUBLE NULL m Char.SpectralAxis.Accuracy.StatError.Refval.value
stat.error;em 1 1
o_unit adql:VARCHAR NULL Char.ObservableAxis.unit meta.unit 1 1?
o_calib_status adql:VARCHAR NULL Char.ObservableAxis.calibStatus meta.code.qual 1 1?
facility adql:VARCHAR NULL Provenance.ObsConfig.Facility.name
meta.code 1 ? 1
instrument adql:VARCHAR NULL Provenance.ObsConfig.Instrument.name
meta.id;instr 1 1
proposal_id adql:VARCHAR NULL NULL Provenance.proposalID meta.id; obs.proposal 1 TBD 1
- 55 -