IUMI’s 2020 analysis of the global marine insurance market
42
IUMI’s 2020 analysis of the global marine insurance market
Transcript of IUMI’s 2020 analysis of the global marine insurance market

IUMI’s 2020 analysis of the global marine insurance market

IUMI Stats 2020 1
In this document we present data on the global marine insurance market set in the context of world economic performance, trade and the shipping industry. We also offer commentary and opinion based on the data we have collected.
The International Union of Marine Insurance (IUMI) represents 45 national and marine market insurance and reinsurance asso ci ations. Its Fact & Figures Committee compiles and analyses data submitted by national insurance associations and cooperates with other data providers. Our thanks go to those IUMI member associations for their continued support, and to the other data providers, who are identified at the end of this report, for supporting IUMI with extensive and up to date information on the relevant trends that impact the marine industry. Special thanks are offered to the Nordic Association of Marine Insurers (Cefor) for annually compiling global marine insurance data on behalf of IUMI and supporting IUMI with up-to-date hull trend analyses from the Nordic Marine Insurance Statistics database (NoMIS).
The majority of the graphs in this report originate from the presenta-tions given at the IUMI conference 2020 by Facts & Figures Committee Chairperson Philip Graham and Vice Chairperson Astrid Seltmann. These contain further graphs and market trends for reference.
Although this is a statistics report we must not forget that shipping is a people business. During the current uncertain environment we have relied on thousands of seafarers to maintain the flow of goods and commodities that allows us to continue our daily lives. Some have been at sea for many months and we thank them for their hard work, dedication and commitment.
Philip Graham IUMI Facts & Figures Committee Chairperson
Lars Lange IUMI Secretary General
Introduction
IUMI Stats 2020 2
Highlights
The coronavirus pandemic has injected uncertainty into almost all sectors of the global economy which makes it challenging to predict future trends for marine underwriting. The reduction in economic activity has affected global trade, commodity prices and vessel util isa-tion which has, in turn, impacted marine insurance.
Global marine insurance premiums in 2019 amounted to USD 28.7 billion and are relatively stable compared with 2018. The Asia Pacific region continues to grow its market share. Confidence in a modest market recovery now seems less certain due to the impact of COVID-19 but early signs are encouraging nonetheless. Pages 16–18.
World seaborne trade has declined sharply as a result of COVID-19 – around 1 billion tonnes has been lost, according to Clarksons Research. Global fleet growth is slowing but a reduction in new deliveries and scrappings are increasing the age profile of the world fleet. China con- tinues to grow its share of shipbuilding and shipowning. Pages 4 –15.
IUMI Stats 2020 3
Marine cargo premiums for 2019 were slightly reduced at USD 15.6 billion. The COVID-led drop in trade will impact exposures and may erode the premium base further. Loss ratios were slightly improved on recent years but the sector is increasingly exposed to nat-cat and man-made events as well as greater accumulation of risk on ships and in port. However, a more judicious underwriting approach witnessed recently is encouraging a market recovery which started in the second half of 2019 and is improving steadily throughout 2020 in all regions. Pages 24– 27.
Premiums for ocean hull underwriting were stable at USD 6.9 billion. The gap between global premiums and global tonnage continues to widen, albeit more slowly than in previous years. Loss ratios have improved slightly. A continued benign claims environment prevails, with the exception of fires which have been an increasing concern, especially on container and RoRo vessels. Apart from fires, the claims frequency dropped further during the first half of 2020, probably due to reduced vessel activity as a result of COVID-19. A reduction in underwriting capacity seems likely to herald some modest market development but from an exceptionally low base. Pages 19–23.
Offshore energy saw a modest global premium reduction (1.4%) to USD 3.35 billion in 2019 reflected the unstable oil price but the impact of a further COVID-led price drop remains to be seen. Losses continue to be modest with no real hurricane impact seen by September 2020. A fragile balance between a low premium base and a low claims environment prevails where one major loss could eclipse the entire earned income. Pages 28–30.
This year, IUMI has published initial findings from its Major Claims Database. Following an extensive data collection and analysis process, global cargo claims information can be found on pages 31–35.
IUMI Stats 2020 4
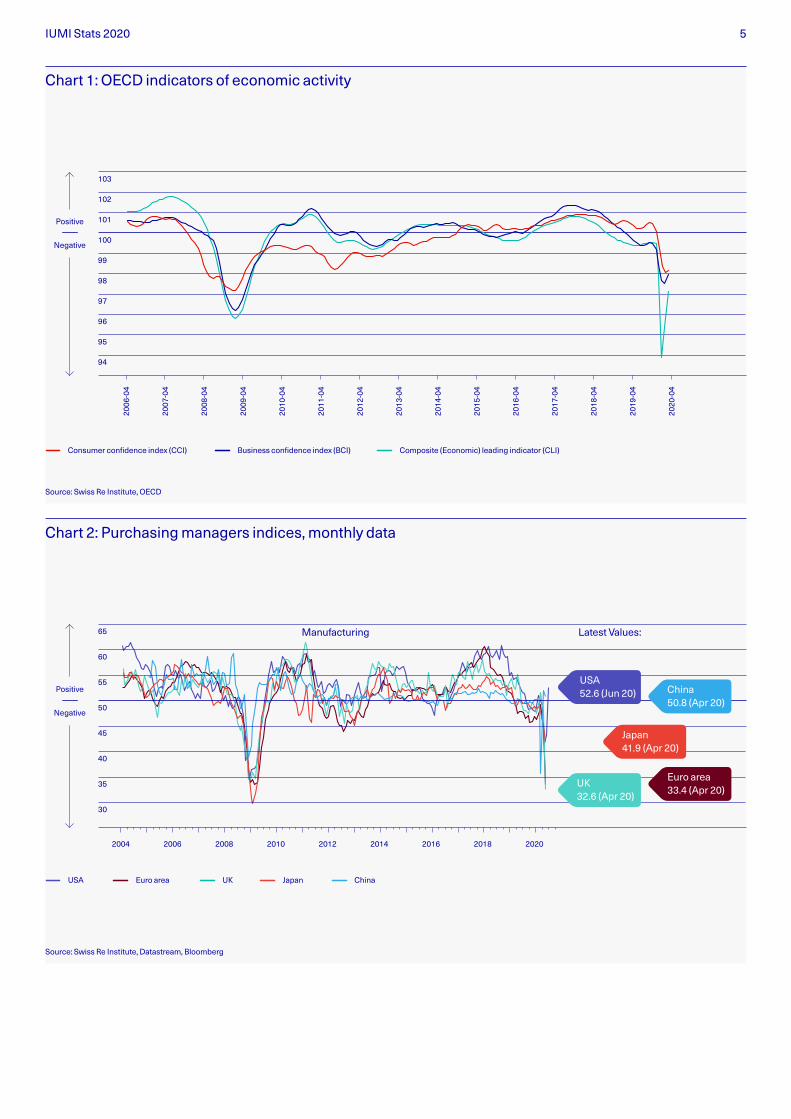
Global economic performance is uncertain but confidence is returning Consumer and business confidence took an un- precedented dip at the outbreak of coronavirus. The drop was more pronounced than experienced during the financial crisis of 2008 due, in the main, to a change in consumer behaviour. Travel and purchasing trends were most impacted by the pandemic and, unlike the financial crisis, it is cons- umer behaviour – and not financial institutions – that is likely to drive a return to more normal levels.
However, confidence had been waning in recent years as businesses adapted to geo-political tensions and general economic uncertainty.
Unsurprisingly, the purchasing managers index (chart 2) fell sharply as a result of COVID-19 but a modest uptick is anticipated from the major economies of China and the US. It is yet to be seen if other nations will follow suit.
In context
“Consumer and business confidence took an unprecedented dip at the outbreak of coronavirus.”
IUMI Stats 2020 5
2006
-04
2007
-04
2008
-04
2009
-04
2010
-04
2011
-04
2012
-04
2013
-04
2014
-04
2015
-04
2016
-04
2017
-04
2018
-04
2019
-04
2020
-04
Source: Swiss Re Institute, OECD
103
Positive
Negative
94
95
96
97
98
99
100
101
102
Chart 1: OECD indicators of economic activity
Composite (Economic) leading indicator (CLI)Consumer confidence index (CCI) Business confidence index (BCI)
Source: Swiss Re Institute, Datastream, Bloomberg
65
Positive
Negative
30
35
40
45
50
55
60
Chart 2: Purchasing managers indices, monthly data
USA Euro area Japan ChinaUK
2004 2006 2008 2010 2012 2014 2016 2018 2020
Manufacturing Latest Values:
UK 32.6 (Apr 20)
Japan 41.9 (Apr 20)
Euro area 33.4 (Apr 20)
China 50.8 (Apr 20)
USA 52.6 (Jun 20)
IUMI Stats 2020 6
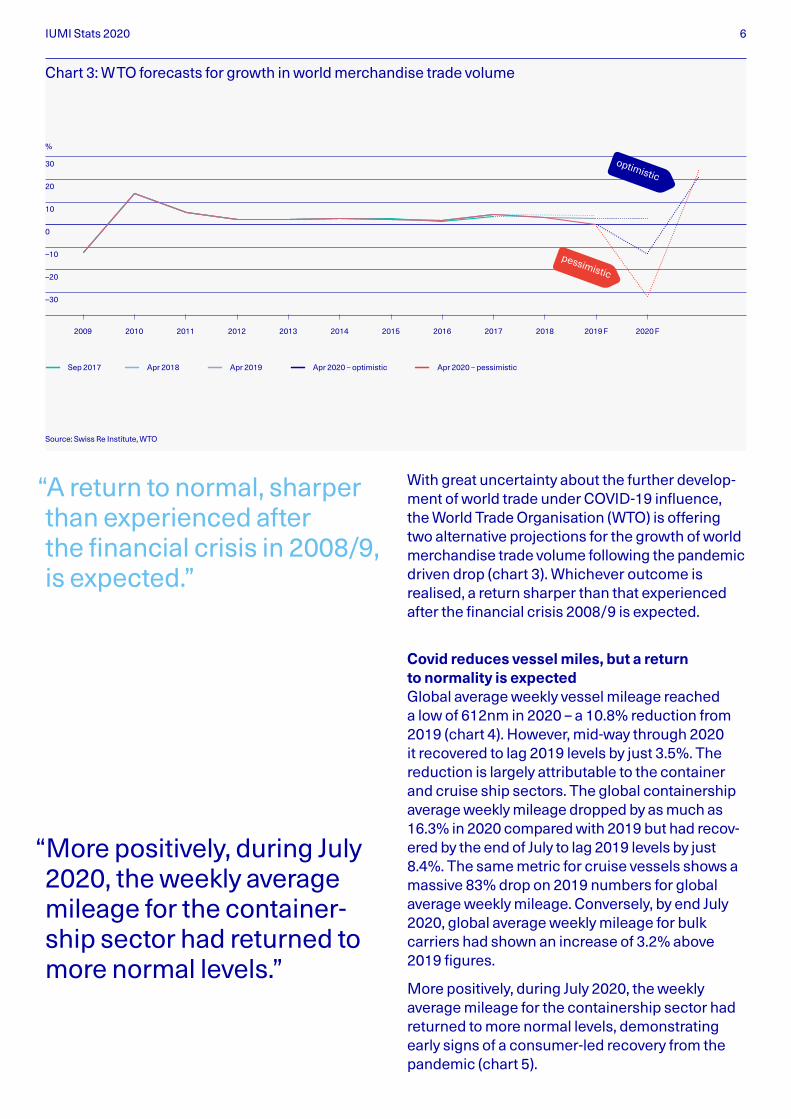
With great uncertainty about the further develop-ment of world trade under COVID-19 influence, the World Trade Organisation (WTO) is offering two alternative projections for the growth of world merchandise trade volume following the pandemic driven drop (chart 3). Whichever outcome is realised, a return sharper than that experienced after the financial crisis 2008/9 is expected.
Covid reduces vessel miles, but a return to normality is expected Global average weekly vessel mileage reached a low of 612nm in 2020 – a 10.8% reduction from 2019 (chart 4). However, mid-way through 2020 it recovered to lag 2019 levels by just 3.5%. The reduction is largely attributable to the container and cruise ship sectors. The global containership average weekly mileage dropped by as much as 16.3% in 2020 compared with 2019 but had recov-ered by the end of July to lag 2019 levels by just 8.4%. The same metric for cruise vessels shows a massive 83% drop on 2019 numbers for global average weekly mileage. Conversely, by end July 2020, global average weekly mileage for bulk carriers had shown an increase of 3.2% above 2019 figures.
More positively, during July 2020, the weekly average mileage for the containership sector had returned to more normal levels, demonstrating early signs of a consumer-led recovery from the pandemic (chart 5).
Source: Swiss Re Institute, WTO
30
–30
–20
–10
0
10
20
Chart 3: WTO forecasts for growth in world merchandise trade volume
Sep 2017 Apr 2018 Apr 2019 Apr 2020 – optimistic Apr 2020 – pessimistic
2009 2010 2011 2012 2013 20152014 2016 2017 2018 2019 F 2020 F
%
optimistic
pessimistic
“A return to normal, sharper than experienced after the financial crisis in 2008/9, is expected.”
“More positively, during July 2020, the weekly average mileage for the container-ship sector had returned to more normal levels.”

IUMI Stats 2020 7
Source: Concirrus
720
620
640
660
680
700
Chart 4: Average weekly mileage – global, all vessels
2016–2017 2017–2018 2018–2019 2019–2020
48 50 52 2 4 86 12 1410 16 18 20 22 24 26 28 30 Week
Average weekly mileage (nm)
Source: Concirrus
2,100
1,600
1,700
1,900
1,800
2,000
Chart 5: Containership average weekly mileage – global
2016–2017 2017–2018 2018–2019 2019–2020
48 50 52 2 4 86 12 1410 16 18 20 22 24 26 28 30 Week
Average weekly mileage (nm)
IUMI Stats 2020 8
Tanker Containership/MPPBulkcarrier
Global Fleet < 2,000 GT Global Fleet ≥ 2,000 GT
Gas Others Total
23.0
26.0
Years
Years
20.0
17.0
11.0
14.0
8.0
30.0
28.0
26.0
24.0
22.0
20.0
18.0
16.0
14.0
12.0
Chart 6: Average age of the world fleet
Source: Clarksons Research
Average Age by Ship Type
Average Age by Ship Size
2000
2000
2001
2001
2002
2002
2003
2003
2004
2004
2005
2005
2006
2006
2007
2007
2008
2008
2009
2009
2010
2010
2011
2011
2012
2012
2013
2013
2014
2014
2015
2015
2016
2016
2017
2017
2018
2018
2019
2019
2020
2020
1st Aug 2020 =
14.3 years
1st Aug 2020 =
27.5 years
Note (1): Includes all vessels in these categories above 100 GT.Note (2): Average age is calculated using number of vessels. Calculations are based on year and month of build.
IUMI Stats 2020 9
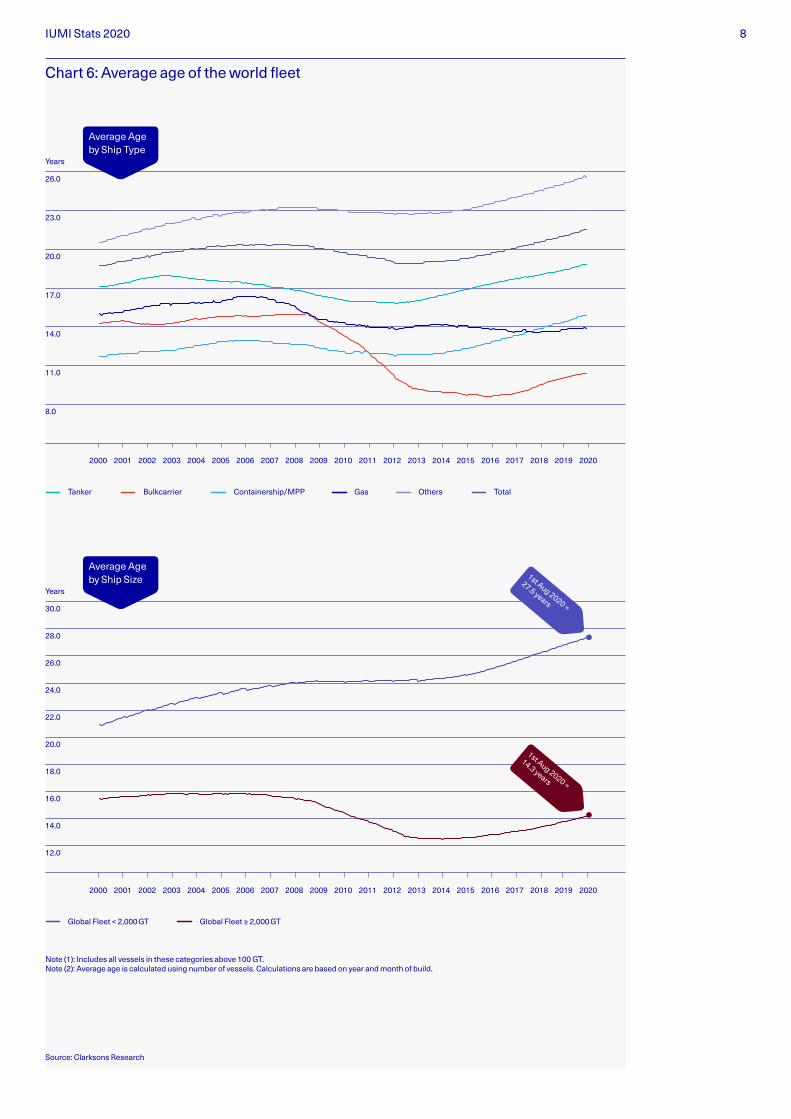
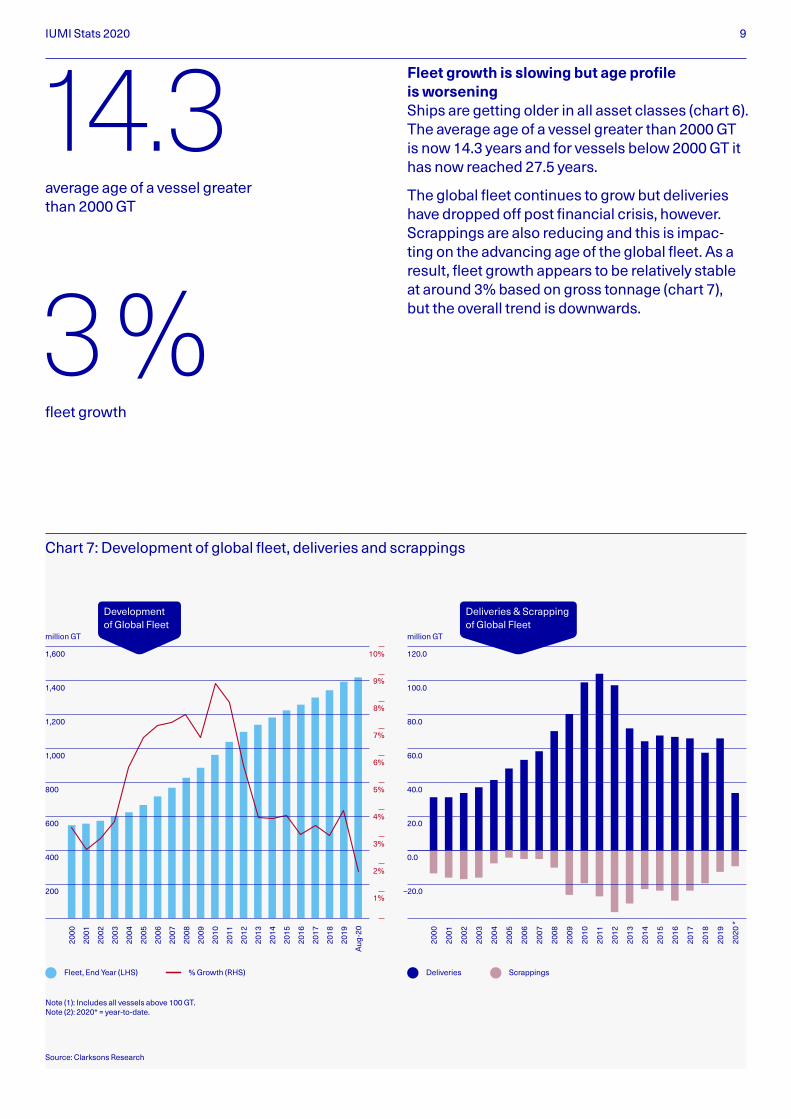
Fleet growth is slowing but age profile is worsening Ships are getting older in all asset classes (chart 6). The average age of a vessel greater than 2000 GT is now 14.3 years and for vessels below 2000 GT it has now reached 27.5 years.
The global fleet continues to grow but deliveries have dropped off post financial crisis, however. Scrappings are also reducing and this is impac- ting on the advancing age of the global fleet. As a result, fleet growth appears to be relatively stable at around 3% based on gross tonnage (chart 7), but the overall trend is downwards.
% Growth (RHS)
1,400
1,600
million GT million GT
1,200
1,000
600
800
200
400
120.0
100.0
80.0
60.0
40.0
20.0
0.0
–20.0
Chart 7: Development of global fleet, deliveries and scrappings
Source: Clarksons Research
Development of Global Fleet
Deliveries & Scrapping of Global Fleet
2000
2000
2001
2001
2002
2002
2003
2003
2004
2004
2005
2005
2006
2006
2007
2007
2008
2008
2009
2009
2010
2010
2011
2011
2012
2012
2013
2013
2014
2014
2015
2015
2016
2016
2017
2017
2018
2018
2019
2019
Aug
-20
2020
*
Note (1): Includes all vessels above 100 GT. Note (2): 2020* = year-to-date.
10%
9%
8%
7%
6%
5%
4%
3%
2%
1%
Fleet, End Year (LHS) Deliveries Scrappings
average age of a vessel greater than 2000 GT
14.3
fleet growth
3 %
IUMI Stats 2020 10
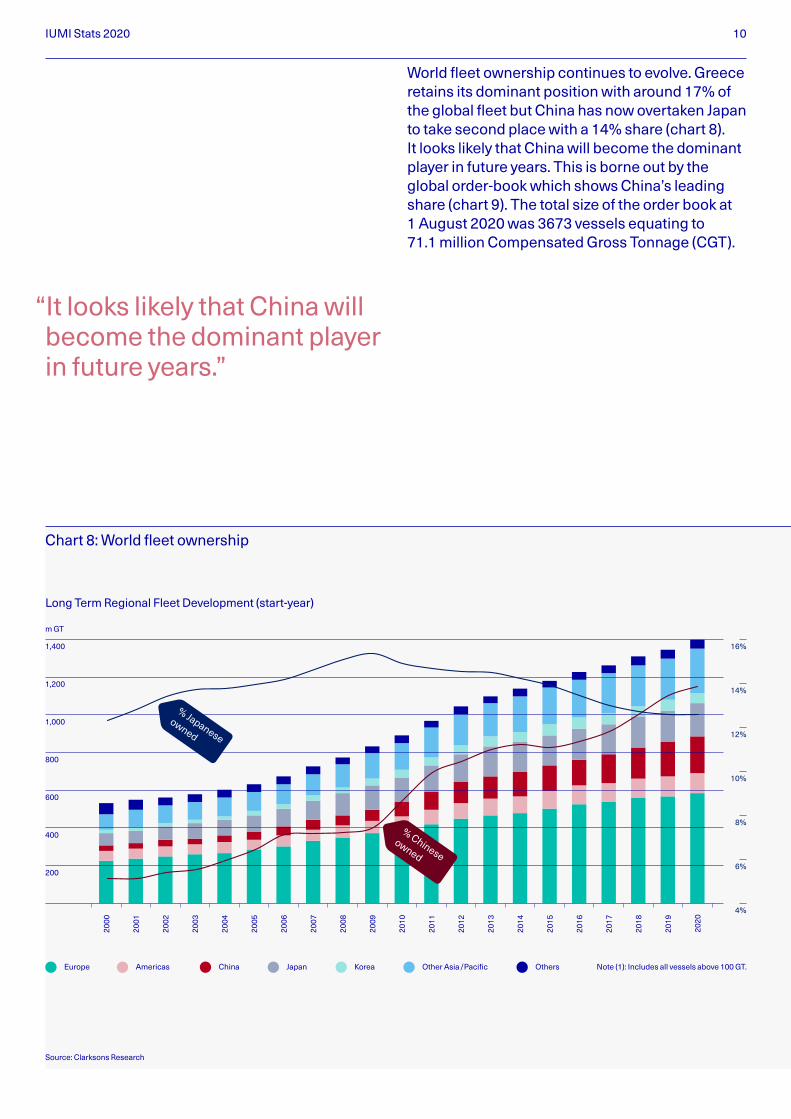
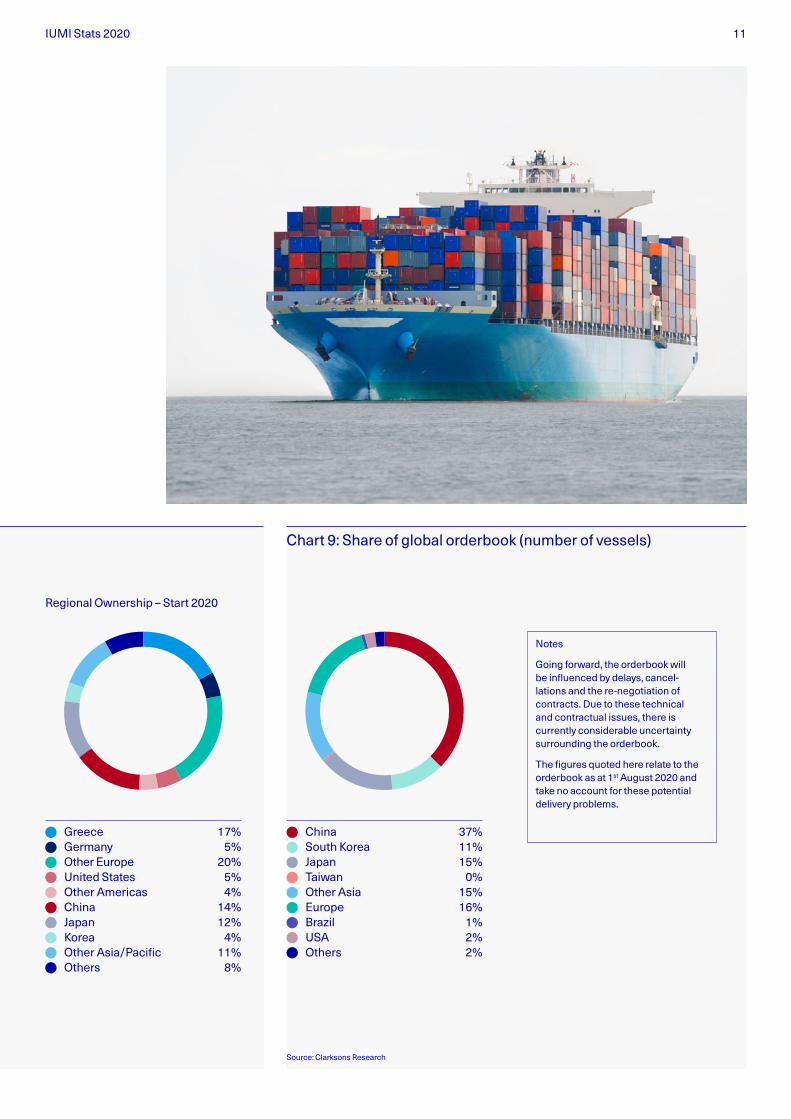
World fleet ownership continues to evolve. Greece retains its dominant position with around 17% of the global fleet but China has now overtaken Japan to take second place with a 14% share (chart 8). It looks likely that China will become the dominant player in future years. This is borne out by the global order-book which shows China’s leading share (chart 9). The total size of the order book at 1 August 2020 was 3673 vessels equating to 71.1 million Compensated Gross Tonnage (CGT).
Chart 8: World fleet ownership
Source: Clarksons Research
1,000
1,200
1,400
400
600
800
200
m GT
16%
14%
12%
10%
8%
6%
4%
Europe Americas China Japan Korea Other Asia/Pacific Others Note (1): Includes all vessels above 100 GT.
% Japanese
owned
% Chinese
owned
2000
2001
2002
2003
2004
2005
2006
2007
2008
2009
2010
2011
2012
2013
2014
2015
2016
2017
2018
2019
2020
“It looks likely that China will become the dominant player in future years.”
Long Term Regional Fleet Development (start-year)
IUMI Stats 2020 11
Greece 17% Germany 5% Other Europe 20% United States 5% Other Americas 4% China 14% Japan 12% Korea 4% Other Asia/Pacific 11% Others 8%
China 37% South Korea 11% Japan 15% Taiwan 0% Other Asia 15% Europe 16% Brazil 1% USA 2% Others 2%
Source: Clarksons Research
Chart 9: Share of global orderbook (number of vessels)
Notes
Going forward, the orderbook will be influenced by delays, cancel-lations and the re-negot iation of contracts. Due to these technical and contractual issues, there is currently considerable uncertainty surrounding the orderbook.
The figures quoted here relate to the orderbook as at 1st August 2020 and take no account for these po tential delivery problems.
Regional Ownership – Start 2020

IUMI Stats 2020 12
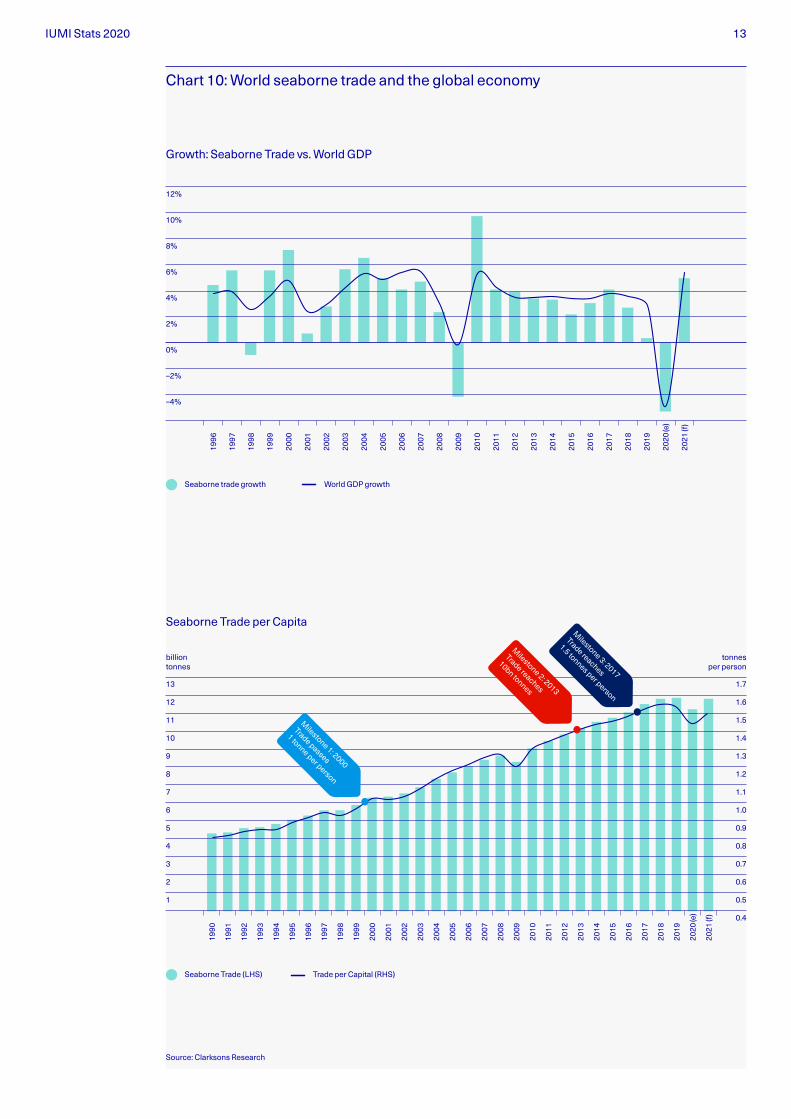
Sharp dip in seaborne trade World seaborne trade experienced its sharpest decline for 30 years as a direct result of COVID-19 as well as regional trade tensions and other commodity-related complexities. Overall, around 1 bn tonnes of trade has been lost (according to Clarksons Research) bringing the seaborne trade per capitia number below 1.5 tonnes per person (chart 10).
tonnes of trade lost due to COVID-19
1bn
IUMI Stats 2020 13
Chart 10: World seaborne trade and the global economy
Source: Clarksons Research
13 1.7
12 1.6
11 1.5
10 1.4
9 1.3
8 1.2
7 1.1
6 1.0
5 0.9
4 0.8
3 0.7
2 0.6
1 0.5
0.4
2000
1999
1998
1997
1990
1993
1991
1994
1992
1996
1995
2001
2002
2003
2004
2005
2006
2007
2008
2009
2010
2011
2012
2013
2014
2015
2016
2017
2018
2019
2020
(e)
2021
(f)
billion tonnes
tonnes per person
Seaborne Trade (LHS) Trade per Capital (RHS)
12%
10%
8%
6%
4%
2%
–2%
0%
–4%
1996
1997
1998
1999
2000
2001
2002
2003
2004
2005
2006
2007
2008
2009
2010
2011
2012
2013
2014
2015
2016
2017
2019
2018
2020
(e)
2021
(f)
World GDP growthSeaborne trade growth
Growth: Seaborne Trade vs. World GDP
Seaborne Trade per CapitaM
ilestone 3: 2017
Trade reaches
1.5 tonnes per person
Milestone 2: 2013
Trade reaches
10bn tonnes
Milestone 1: 2000
Trade passes
1 tonne per person
IUMI Stats 2020 14
Source: Clarksons Research
30,000
5,000
10,000
20,000
15,000
25,000
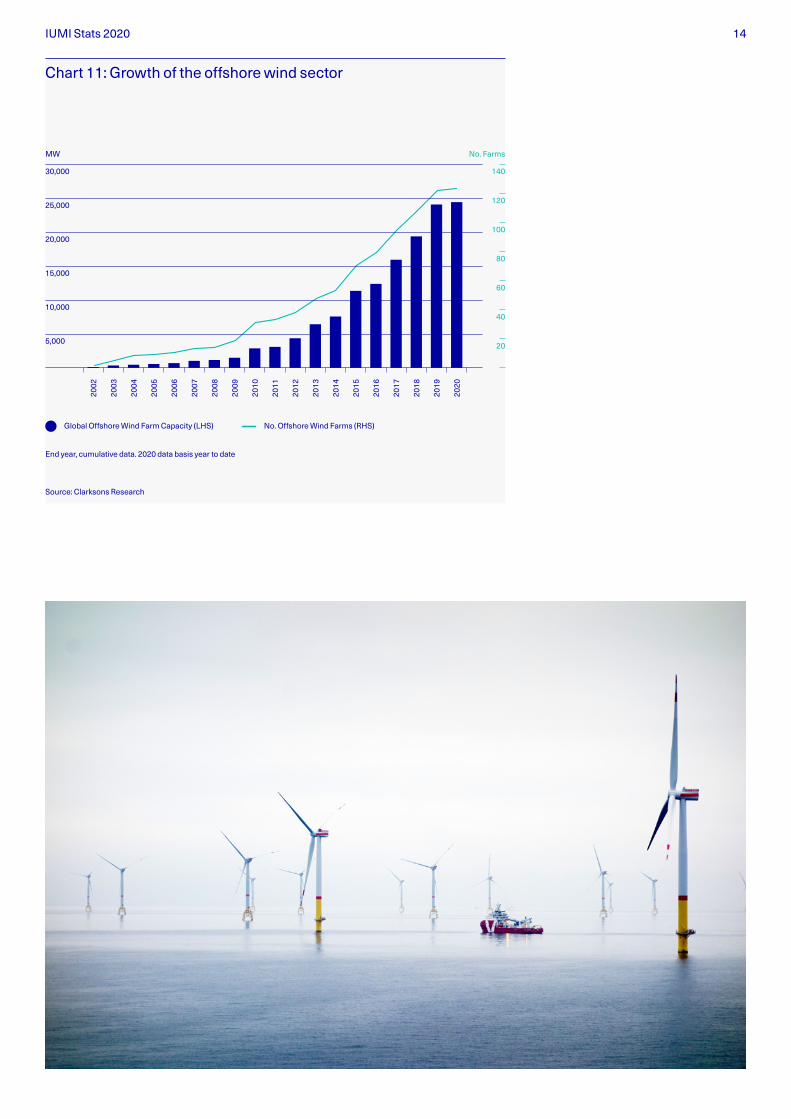
Chart 11: Growth of the offshore wind sector
MW No. Farms
140
120
100
80
60
40
20
2002
2003
2004
2005
2006
2007
2008
2009
2010
2011
2012
2013
2014
2015
2016
2017
2018
2019
2020
Global Offshore Wind Farm Capacity (LHS) No. Offshore Wind Farms (RHS)
End year, cumulative data. 2020 data basis year to date

IUMI Stats 2020 15
A renewable future As a direct consequence of society’s move to a more renewable future, the offshore wind sector continues to grow. Global capacity is approaching 25000 megawatts (MW) supplied by almost 120 offshore installations (chart 11). The global warming phenomenon is characterised by a continuing increase in sea temperatures where the upper few metres of the ocean has experi-enced an increase of around 0.13˚C per decade over the past 100 years (chart 12). This is causing extremes of weather including more severe hurri-canes and an intensification of El Niño events bringing droughts and floods.
Source: Concirrus
1
0
0.5
Chart 12: Ocean warming
1880 1890 1900 1910 1920 19401930 1950 1960 1970 1980 1990 2000 2010
Anomality (°C)
megawatts (MW) supplied by almost 120 offshore installations
25,000
IUMI Stats 2020 16
Marine insurance
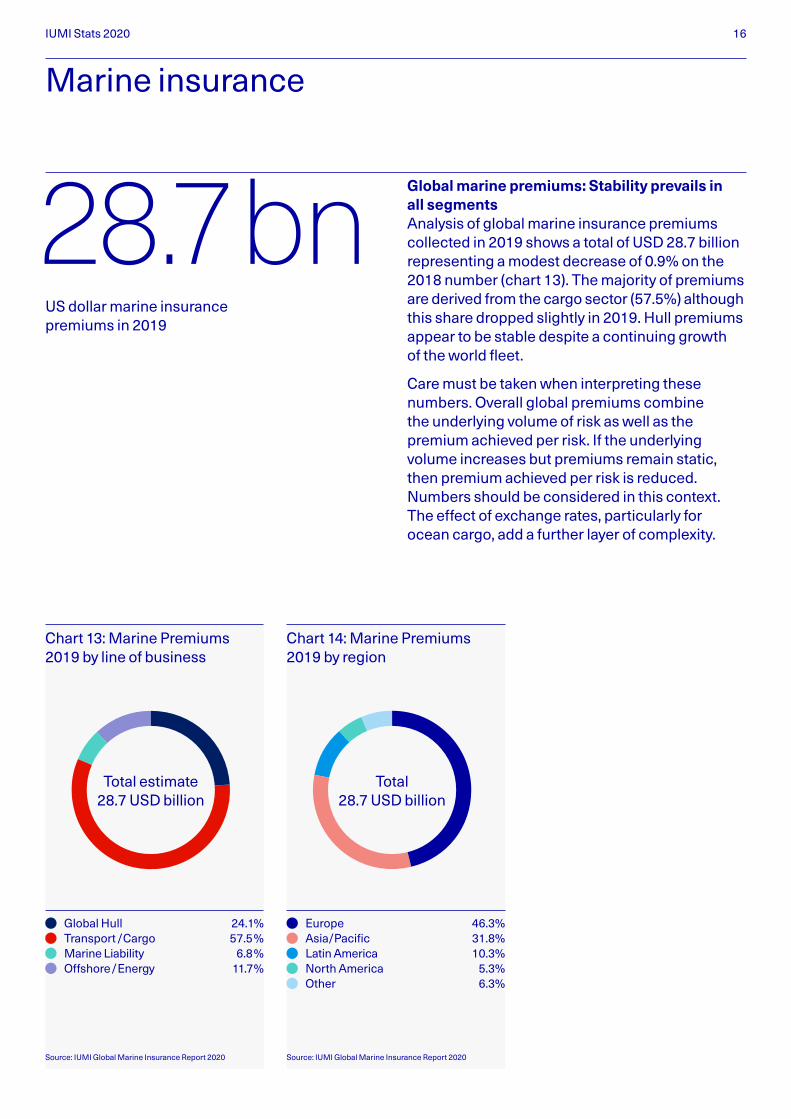
Global marine premiums: Stability prevails in all segments Analysis of global marine insurance premiums collected in 2019 shows a total of USD 28.7 billion representing a modest decrease of 0.9% on the 2018 number (chart 13). The majority of premiums are derived from the cargo sector (57.5%) although this share dropped slightly in 2019. Hull premiums appear to be stable despite a continuing growth of the world fleet.
Care must be taken when interpreting these numbers. Overall global premiums combine the underlying volume of risk as well as the premium achieved per risk. If the underlying volume increases but premiums remain static, then premium achieved per risk is reduced. Numbers should be considered in this context. The effect of exchange rates, particularly for ocean cargo, add a further layer of complexity.
Source: IUMI Global Marine Insurance Report 2020 Source: IUMI Global Marine Insurance Report 2020
Chart 13: Marine Premiums 2019 by line of business
Chart 14: Marine Premiums 2019 by region
Global Hull 24.1% Transport / Cargo 57.5% Marine Liability 6.8% Offshore / Energy 11.7%
Europe 46.3% Asia/Pacific 31.8% Latin America 10.3% North America 5.3% Other 6.3%
Total estimate 28.7 USD billion
Total 28.7 USD billion
US dollar marine insurance premiums in 2019
28.7 bn
IUMI Stats 2020 17
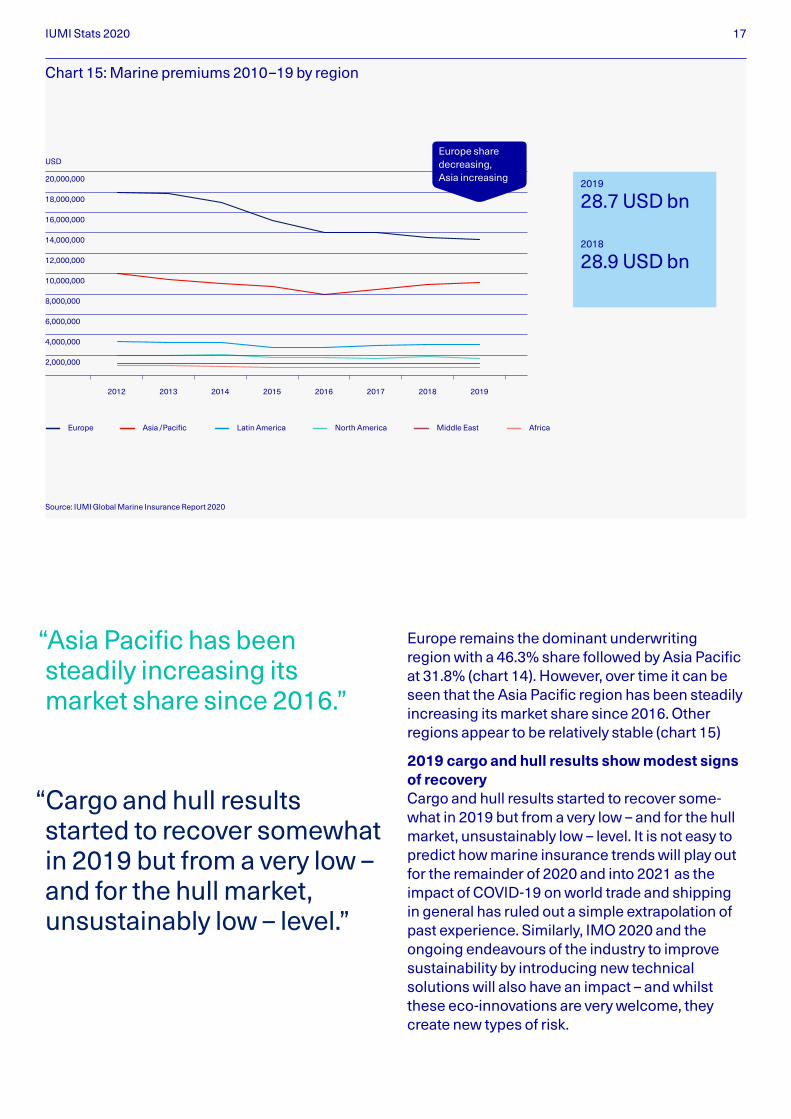
Europe remains the dominant underwriting region with a 46.3% share followed by Asia Pacific at 31.8% (chart 14). However, over time it can be seen that the Asia Pacific region has been steadily increasing its market share since 2016. Other regions appear to be relatively stable (chart 15)
2019 cargo and hull results show modest signs of recovery Cargo and hull results started to recover some- what in 2019 but from a very low – and for the hull market, unsustainably low – level. It is not easy to predict how marine insurance trends will play out for the remainder of 2020 and into 2021 as the impact of COVID-19 on world trade and shipping in general has ruled out a simple extrapolation of past experience. Similarly, IMO 2020 and the ongoing endeavours of the industry to improve sustainability by introducing new technical solutions will also have an impact – and whilst these eco-innovations are very welcome, they create new types of risk.
Source: IUMI Global Marine Insurance Report 2020
20,000,000
18,000,000
16,000,000
14,000,000
10,000,000
2,000,000
4,000,000
6,000,000
8,000,000
12,000,000
Chart 15: Marine premiums 2010–19 by region
Europe Asia /Pacific Latin America North America Middle East Africa
2012 2013 2014 2015 2016 2017 2018 2019
Europe share decreasing, Asia increasing 2019
28.7 USD bn
2018
28.9 USD bn
USD
“Asia Pacific has been steadily increasing its market share since 2016.”
“Cargo and hull results started to recover somewhat in 2019 but from a very low – and for the hull market, unsustainably low – level.”
IUMI Stats 2020 18
COVID-19 impact in 2020 varies by market segment Different market sectors have reacted differently to COVID-19. Cruise and offshore have been significantly impacted and, to a lesser extent, has the containership sector. Other markets such as crude oil tankers have fared much better, particu-larly from the demand for floating storage. This is clearly reflected by the strong variation in how vessel values in certain segments reacted during 2020 renewals, as the mid-year hull trend report issued by the Nordic Association of Marine Insurers (Cefor) shows.
The general reduction in vessel utilisation has been positive for the claims environment (see same report) but there is a potential for an increase in claims due to lapsed maintenance routines, the delay of spare parts or surveys, and an unusual accumulation of high-value vessels in areas exposed to natural catastrophes. Independent of COVID-19, the high incidence of major vessel fires and the recent spate of vessel issues in the North and South American inland waterways continue to be a cause for concern.
At the start of 2020 there was confidence that a modest market development was beginning to get underway – albeit from a very low base. However, with the arrival of COVID-19 and the related changes coming in with full force from Q2 2020, the degree of uncertainty surrounding projections of marine insurance results into the future has, once again increased.
IUMI Stats 2020 19
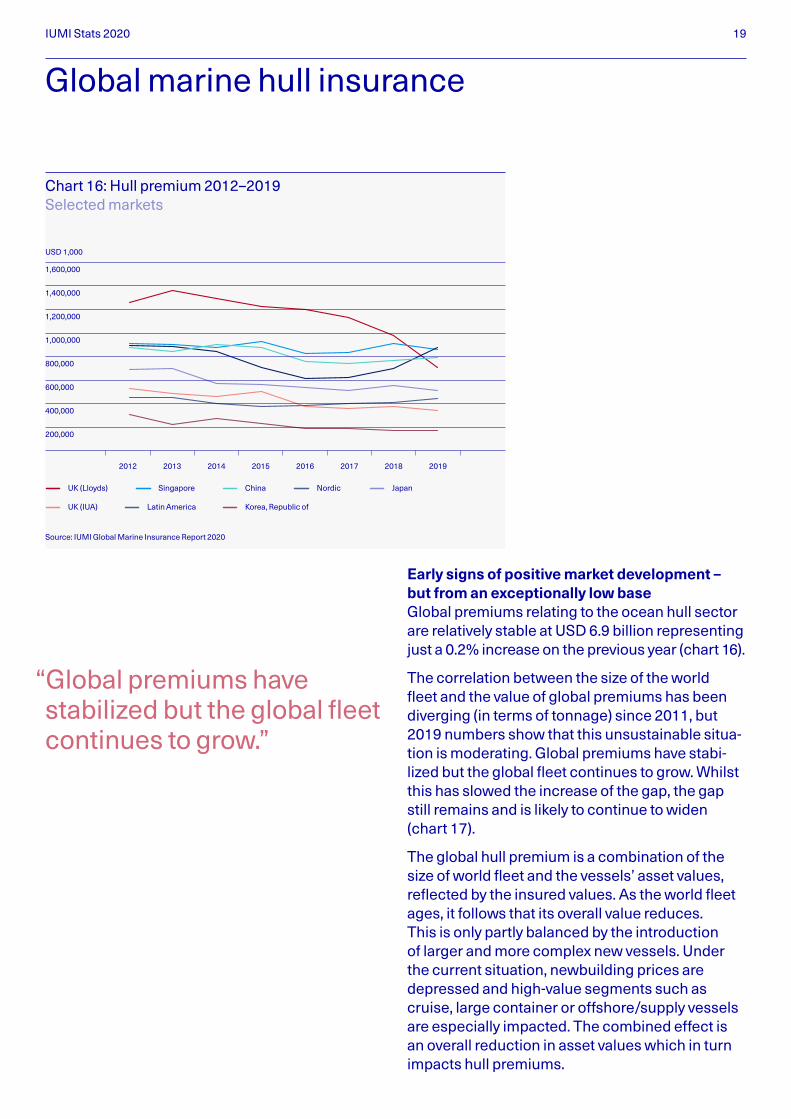
Early signs of positive market development – but from an exceptionally low base Global premiums relating to the ocean hull sector are relatively stable at USD 6.9 billion representing just a 0.2% increase on the previous year (chart 16).
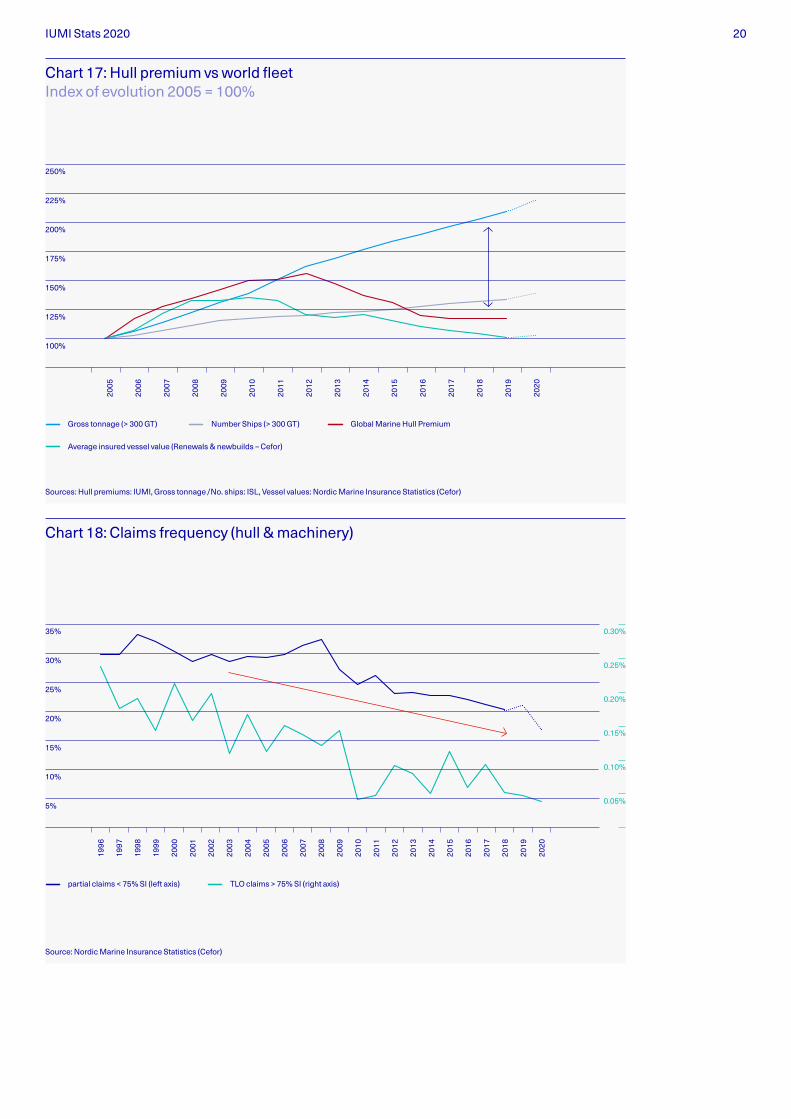
The correlation between the size of the world fleet and the value of global premiums has been diverging (in terms of tonnage) since 2011, but 2019 numbers show that this unsustainable situa-tion is moderating. Global premiums have stabi-lized but the global fleet continues to grow. Whilst this has slowed the increase of the gap, the gap still remains and is likely to continue to widen (chart 17).
The global hull premium is a combination of the size of world fleet and the vessels’ asset values, reflected by the insured values. As the world fleet ages, it follows that its overall value reduces. This is only partly balanced by the introduction of larger and more complex new vessels. Under the current situation, newbuilding prices are depressed and high-value segments such as cruise, large container or offshore/supply vessels are especially impacted. The combined effect is an overall reduction in asset values which in turn impacts hull premiums.
Global marine hull insurance
Source: IUMI Global Marine Insurance Report 2020
1,600,000
1,400,000
1,200,000
1,000,000
600,000
200,000
400,000
800,000
Chart 16: Hull premium 2012–2019 Selected markets
UK (Lloyds) Singapore China Nordic Japan
UK (IUA) Latin America Korea, Republic of
2012 2013 2014 2015 2016 2017 2018 2019
USD 1,000
“Global premiums have stabilized but the global fleet continues to grow.”
IUMI Stats 2020 20
Sources: Hull premiums: IUMI, Gross tonnage /No. ships: ISL, Vessel values: Nordic Marine Insurance Statistics (Cefor)
250%
225%
200%
175%
150%
125%
100%
Chart 17: Hull premium vs world fleet Index of evolution 2005 = 100%
Gross tonnage (> 300 GT) Number Ships (> 300 GT)
Average insured vessel value (Renewals & newbuilds – Cefor)
Global Marine Hull Premium
2005
2006
2007
2008
2009
2010
2011
2012
2013
2014
2015
2016
2017
2018
2019
2020
Source: Nordic Marine Insurance Statistics (Cefor)
35%
30%
25%
20%
10%
5%
15%
Chart 18: Claims frequency (hull & machinery)
partial claims < 75% SI (left axis) TLO claims > 75% SI (right axis)
2000
1999
1998
1997
1996
2001
2002
2003
2004
2005
2006
2007
2008
2009
2010
2011
2012
2013
2014
2015
2016
2017
2018
2020
2019
0.30%
0.25%
0.20%
0.15%
0.10%
0.05%
IUMI Stats 2020 21
The long-term downward trend in total losses continues and has now reached an all-time low (chart 18, Source: The Cefor NoMIS hull trend report as of 30 June 2020). However, as with the cargo sector, large vessel fires remain an issue and there remains a worryingly high number of major on-board fires, particularly on container-ships and – earlier in 2020 – on a car carrier and a VLCC. A major loss incurring unprecedented cost (resulting from increased vessel sizes, accumulations and new trading patterns such as arctic routes) remains a significant risk and one that could impact catastrophically on the hull sector.
COVID-19 has reduced vessel utlilisation and this has impacted positively on claims in the first half year of 2020. However, the coronavirus situation has made it difficult for owners to commission on-board inspections, secure spare parts and perform routine maintenance. Once the situation normalizes, there is a possibility of a sharp increase in attritional claims.
Issues with IMO2020 compliance might also become problematic. Whilst damage caused by fuel switching has largely been eliminated, there is concern over a potentially increased amount of engine damage as a result of accepting off-spec low-sulphur bunkers.
“A major loss incurring unprecedented cost could impact catastrophically on the hull sector.”
IUMI Stats 2020 22
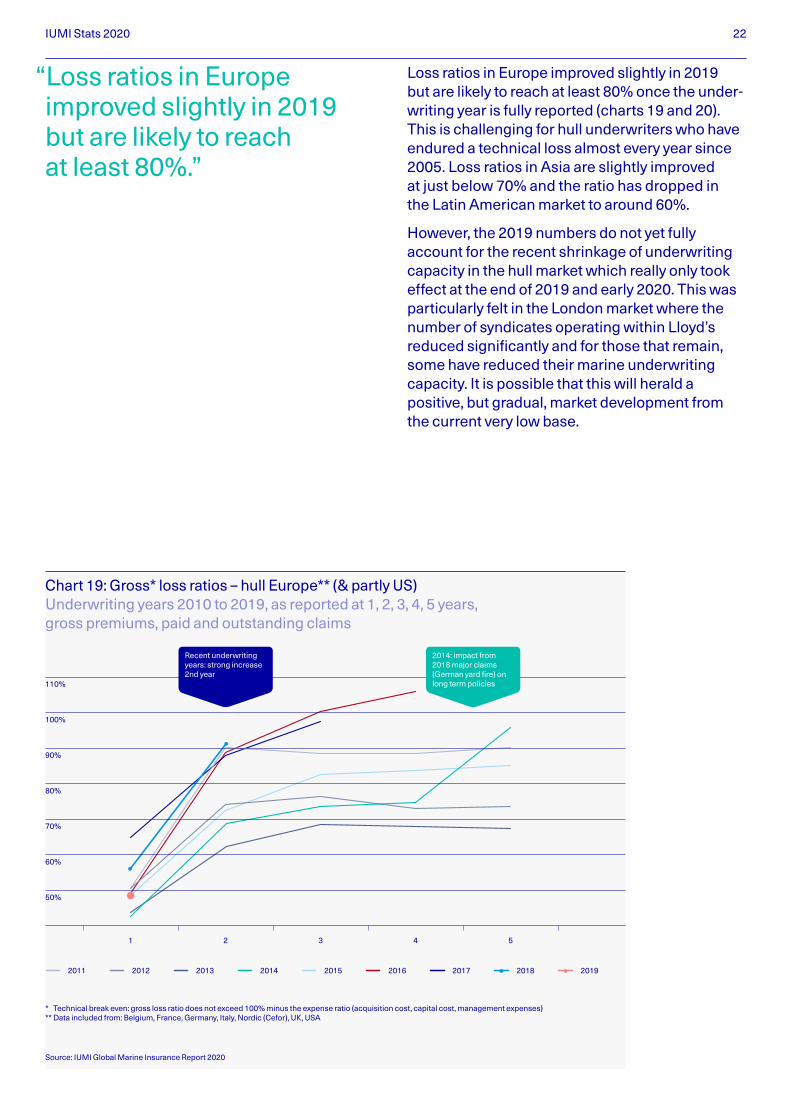
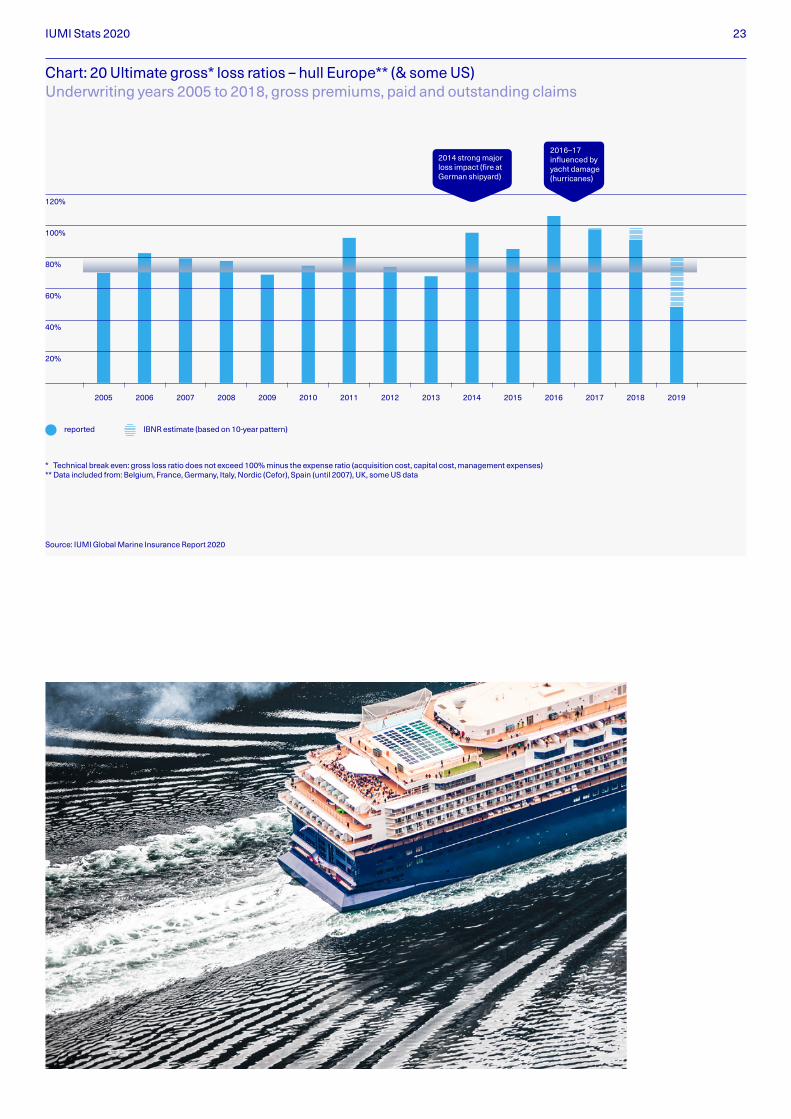
Loss ratios in Europe improved slightly in 2019 but are likely to reach at least 80% once the under-writing year is fully reported (charts 19 and 20). This is challenging for hull underwriters who have endured a technical loss almost every year since 2005. Loss ratios in Asia are slightly improved at just below 70% and the ratio has dropped in the Latin American market to around 60%.
However, the 2019 numbers do not yet fully account for the recent shrinkage of underwriting capacity in the hull market which really only took effect at the end of 2019 and early 2020. This was particularly felt in the London market where the number of syndicates operating within Lloyd’s reduced significantly and for those that remain, some have reduced their marine underwriting capacity. It is possible that this will herald a positive, but gradual, market development from the current very low base.
Source: IUMI Global Marine Insurance Report 2020
110%
100%
90%
80%
70%
50%
60%
Chart 19: Gross* loss ratios – hull Europe** (& partly US) Underwriting years 2010 to 2019, as reported at 1, 2, 3, 4, 5 years, gross premiums, paid and outstanding claims
2011 2012 2013 2014 2015 2016 2017
1 2 3 4 5
2018 2019
* Technical break even: gross loss ratio does not exceed 100% minus the expense ratio (acquisition cost, capital cost, management expenses)** Data included from: Belgium, France, Germany, Italy, Nordic (Cefor), UK, USA
Recent underwriting years: strong increase 2nd year
2014: impact from 2018 major claims (German yard fire) on long term policies
“Loss ratios in Europe improved slightly in 2019 but are likely to reach at least 80%.”
IUMI Stats 2020 23
120%
100%
80%
60%
20%
40%
Chart: 20 Ultimate gross* loss ratios – hull Europe** (& some US) Underwriting years 2005 to 2018, gross premiums, paid and outstanding claims
Source: IUMI Global Marine Insurance Report 2020
* Technical break even: gross loss ratio does not exceed 100% minus the expense ratio (acquisition cost, capital cost, management expenses)** Data included from: Belgium, France, Germany, Italy, Nordic (Cefor), Spain (until 2007), UK, some US data
reported IBNR estimate (based on 10-year pattern)
2005 2006 2007 2008 2009 2010 2011 2012 2013 2014 2015 2016 2017 2018 2019
2014 strong major loss impact (fire at German shipyard)
2016–17 influenced by yacht damage (hurricanes)
IUMI Stats 2020 24
Global marine cargo insurance
Source: IUMI Global Marine Insurance Report 2020
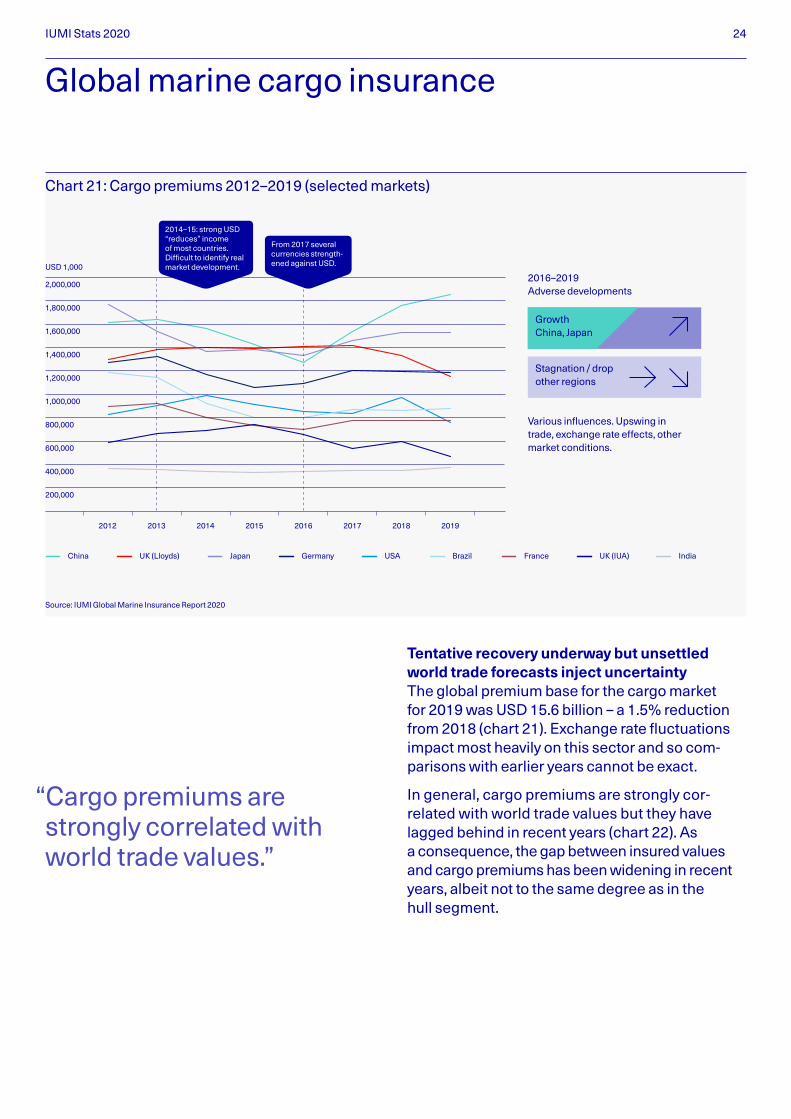
Chart 21: Cargo premiums 2012–2019 (selected markets)
2012 2013 2014 2015 2016 2017 2018 2019
2,000,000
1,800,000
1,600,000
1,400,000
1,000,000
200,000
400,000
600,000
800,000
1,200,000
2016–2019 Adverse developments
Various influences. Upswing in trade, exchange rate effects, other market conditions.
USD 1,000
UK (Lloyds) USAChina GermanyJapan UK (IUA)Brazil France India
Stagnation / drop other regions
Growth China, Japan
2014–15: strong USD “reduces” income of most countries. Difficult to identify real market development.
From 2017 several currencies strength-ened against USD.
Tentative recovery underway but unsettled world trade forecasts inject uncertainty The global premium base for the cargo market for 2019 was USD 15.6 billion – a 1.5% reduction from 2018 (chart 21). Exchange rate fluctuations impact most heavily on this sector and so com - parisons with earlier years cannot be exact.
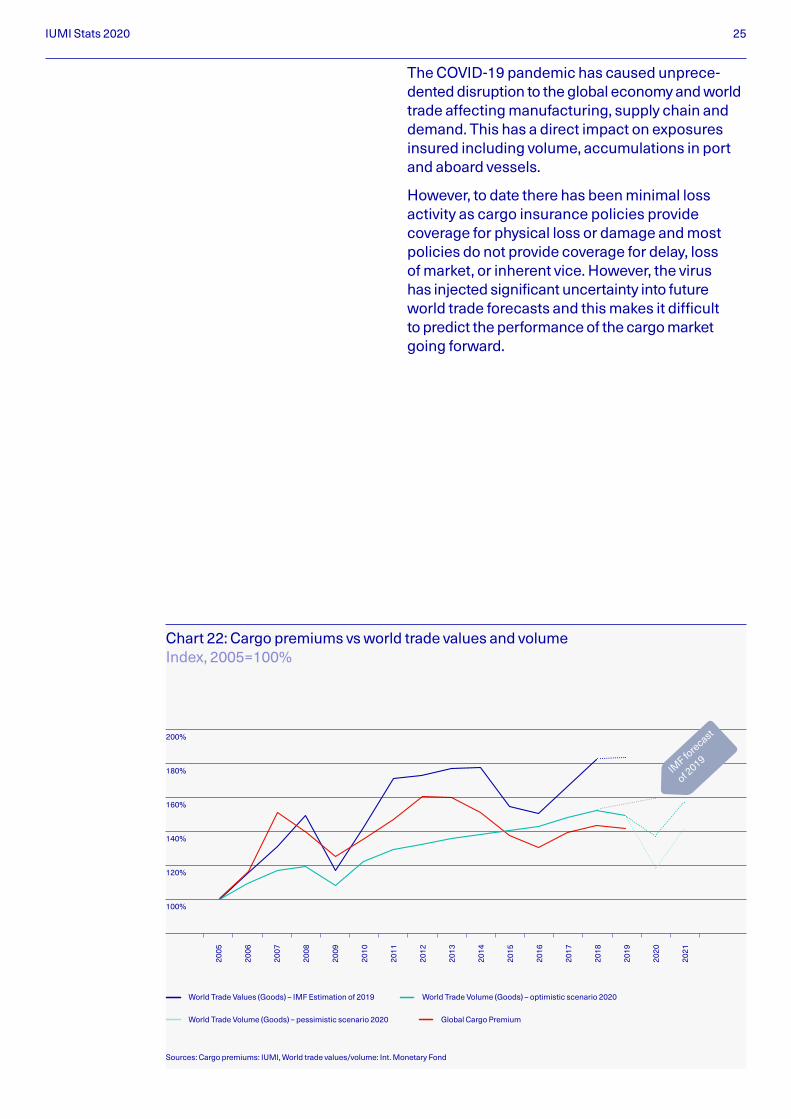
In general, cargo premiums are strongly cor - related with world trade values but they have lagged behind in recent years (chart 22). As a consequence, the gap between insured values and cargo premiums has been widening in recent years, albeit not to the same degree as in the hull segment.
“Cargo premiums are strongly correlated with world trade values.”
IUMI Stats 2020 25
The COVID-19 pandemic has caused unprece-dented disruption to the global economy and world trade affecting manufacturing, supply chain and demand. This has a direct impact on exposures insured including volume, accumulations in port and aboard vessels.
However, to date there has been minimal loss activity as cargo insurance policies provide coverage for physical loss or damage and most policies do not provide coverage for delay, loss of market, or inherent vice. However, the virus has injected significant uncertainty into future world trade forecasts and this makes it difficult to predict the performance of the cargo market going forward.
2005
2006
2007
2008
2009
2010
2011
2012
2013
2014
2015
2016
2017
2018
2019
2021
2020
Chart 22: Cargo premiums vs world trade values and volume Index, 2005=100%
200%
180%
160%
140%
120%
100%
World Trade Values (Goods) – IMF Estimation of 2019 World Trade Volume (Goods) – optimistic scenario 2020
World Trade Volume (Goods) – pessimistic scenario 2020 Global Cargo Premium
Sources: Cargo premiums: IUMI, World trade values/volume: Int. Monetary Fond
IMF fo
recast
of 2019
IUMI Stats 2020 26
100%
90%
80%
70%
60%
50%
30%
10%
20%
40%
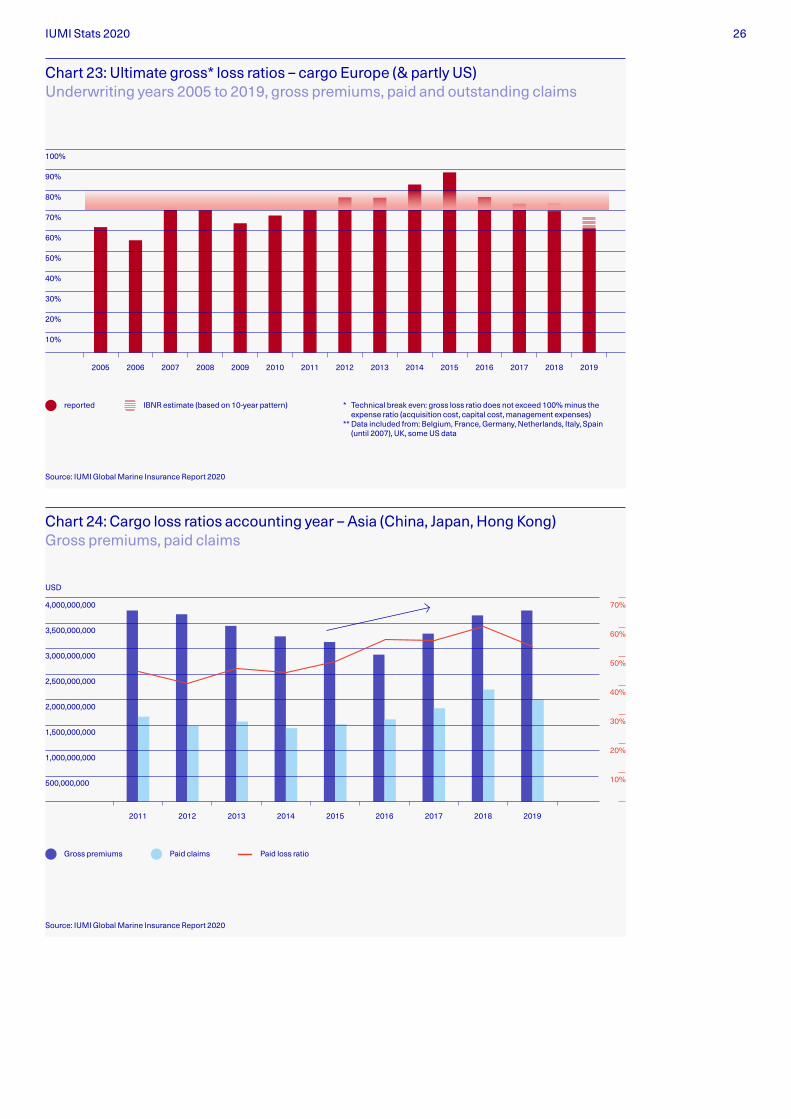
Chart 23: Ultimate gross* loss ratios – cargo Europe (& partly US) Underwriting years 2005 to 2019, gross premiums, paid and outstanding claims
Source: IUMI Global Marine Insurance Report 2020
reported
2005 2006 2007 2008 2009 2010 2011 2012 2013 2014 2015 2016 2017 2018 2019
* Technical break even: gross loss ratio does not exceed 100% minus the expense ratio (acquisition cost, capital cost, management expenses)
** Data included from: Belgium, France, Germany, Netherlands, Italy, Spain (until 2007), UK, some US data
IBNR estimate (based on 10-year pattern)
2011 2012 2013 2014 2015 2016 2017 2018 2019
Source: IUMI Global Marine Insurance Report 2020
4,000,000,000
USD
3,500,000,000
3,000,000,000
2,500,000,000
1,500,000,000
2,000,000,000
500,000,000
1,000,000,000
Chart 24: Cargo loss ratios accounting year – Asia (China, Japan, Hong Kong) Gross premiums, paid claims
Paid loss ratio
70%
60%
50%
40%
30%
20%
10%
Gross premiums Paid claims
IUMI Stats 2020 27
Loss ratios in Europe for the years 2014–2016 were particularly high, but all recent years up to 2019 were under the influence of an increasing exposure to nat-cat or man-made events combined with accumulations on ships and in ports which were not necessarily reflected in premiums. 2019 started at around 60% which demonstrates a modest improvement compared with previous years and is expected to end slightly below 70% if the year follows a standard development pattern (chart 23). Loss ratios in Asia were stable until 2014 but then increased dramatically to around 60% in 2018; there appears to be a slight improve-ment in 2019 with a loss ratio of around 50%. In Latin America, the ratio is stable in the 50–55% range (chart 24).
In 2020, there have been a number of large cargo losses. These include the tragic explosion in the Port of Beirut, a significant loss to a number of distribution facilities impacted by the Nashville tornadoes, and the total loss of 4,200 vehicles aboard the Golden Ray. Accumulation of cargo in stock and in transit has been exacerbated by COVID-19 due to port congestion and delivery delays. This is also increasing the likelihood of damage to vulnerable cargoes such a refrigerated goods.
Recent changes in the cargo insurance market include a return to exposure underwriting. This has resulted in underwriters improving technical rate adequacy and better matching of coverage offerings with exposures. Insurers are more judicious in deploying their capacity as they seek to better balance their portfolios.
Taken together, these developments indicate the beginnings of a market recovery.
“Loss ratios in Europe started at around 60% which demonstrates a modest improvement.”
“Taken together, these developments indicate the beginnings of a market recovery. ”

IUMI Stats 2020 28
Global offshore energy insurance
A fragile balance between low premium base and moderate claims activity. The offshore energy market saw a modest 1.4% reduction in total premiums to USD 3.35 billion in 2019 and although a lower number, the percentage reduction is more encouraging than the 3% reduction in 2018 and 5% in 2017 (chart 25). The impact of coronavirus will not really be known until 2021 but global premiums are expected to reduce further.
2005 2006 2007 2008 2009 2010 2011 2012 2013 2014 2015 2016 2017 2018 2019 2020
Chart 25: Global offshore energy premiums vs oil price and asset rates Energy mobiles, day rates, oil price (as of August 2020)
400%
350%
300%
250%
200%
150%
100%
Sources: Offshore premiums: IUMI, Day rates/No. rigs: Clarksons Research, Oil price: World Bank commodity price data
Average Day Rates Global Offshore Energy Premium Oil price, Brent Crude No. Contracted Rigs
Drop in oil price was followed by drop in premium.
2019 Some increase in activity.
2020 Oil price down due to oversupply. OPEC cuts. Uncer-tainty remains.
Index, 2005 = 100%
US dollar offshore energy premiums in 2019
3.35 bn

IUMI Stats 2020 29
Within the OECD, 7.8% of oil is used for aviation and that industry has collapsed as a result of corona-virus. Similarly, as a result of lockdown measures the general demand for travel has diminished. As a consequence, offshore oil production has reduced and in the first half of 2020, the world’s major oil companies downgraded their asset base values by US$ 87 billion – around 10% of their combined market cap. Reduced activity in the offshore market and reduced asset values will, inevitably, lead to a reduced premium base.
There is generally an 18-month time lag between a rise in the oil price and activity levels catching up. Oil prices had begun to recover from 2016, although with some variation, which led to a react-ivation of offshore facilities and a corresponding stabilizing of the global premium base. However, COVID-19 has reduced the demand for oil forcing prices downward again leading to more uncertainty in this sector. The cycle of laying-up and then react-ivating offshore assets brings more unpredictability and risk to this market.
“Losses remain low with modest or no major impact as of September 2020 from the hurricane seasons.”

IUMI Stats 2020 30
More positively, losses remain low with modest or no major impact as of September 2020 from the hurricane seasons post Hurricane Ike in 2008 (chart 26). The effects of Hurricane Laura earlier this year are yet to be seen although impact on the offshore sector seems to be moderate due to prevention measures and a high degree of self-insurance in recent years. Generally, the more recent underwriting years will deteriorate as a result of the backlog in claims assessment and reporting.
The fragile fortunes of this sector appear to be balanced between a low premium income base and a run of modest claims in recent years. The unpredictable oil price, influenced both by COVID-19 and trade tensions renders future trends uncertain. The global premium base is now at a level where one major loss could eclipse the entire annual income earned by the sector. This is both precarious and uncomfortable.
In the longer-term, the general move towards a more sustainable future and a reduced reliance on hydrocarbons is likely to impact significantly on the sector. Offshore renewables look set to become a sizeable strand of the overall offshore energy portfolio in the future and will include wind farms, floating solar structures, and wave and tidal projects
Chart 26: Offshore energy gross loss ratios Underwriting years 1996–2018 / incl. liability / data from UK, Nordic, some US as of December 2018
350%
300%
250%
200%
150%
100%
50%
1996 1997 1998 1999 2000 2001 2002 2003 2004 2005 2006 2007 2008 2009 2010 2011 2012 2013 2014 2015 2016 2017 2018 2019 2020
paid 1st year
paid 7th year
paid 2nd year
paid 8th year
paid 3rd year
paid 9th year
paid 4th year
paid 10th year
paid 5th year
outstanding
paid 6th year
Source: IUMI Global Marine Insurance Report 2020
2004 Ivan
2008 Ike
2009–2016 no major hurricane activity
2005 Katrina & Rita
2020 Laura
2017-2019 hurricane impact modest
2020 Hurricane Laura: Near half of the rigs and platforms in the path of Laura were evacuated (ca. 15% of US oil production). About to reactivate.
Youngest underwriting years have yet to develop and may deteriorate over time

IUMI Stats 2020 31
Over a three-year period, IUMI has recruited 22 national insurance associations (all IUMI members) who have agreed to submit data on major hull and cargo claims dating back to 2013. To date, IUMI has received 6,800 records of major losses (those over US$ 250,000) totalling US$ 10.2 billion.
Cargo underwriting tends to be more evenly spread geographically than hull and so IUMI’s cargo data set is now considered reliable enough to be published. Although data has been collec - ted on a range of metrics, five data fields are considered to be sufficiently robust enough to be analysed, these are: year of accident, under-writing year, loss amount, type of loss, and mode of transport.
Major claims database
334 384492295294313318
Source: IUMI Major Claims Database
1,500
Incurred losses, M$
# of claim records
Average losses, M$
1,000
500
Chart 27: Incurred cargo losses and average losses 2013–2019
2013
751
2.2
1.6
3.1
2.2
1.2
1.9
1.5
512
970
649
343
587
959
2014 2015 2016 2017 2018 2019
4.0
3.0
2.0
1.0
Explosion
in Tianjin
records of major losses
6,800
IUMI Stats 2020 32
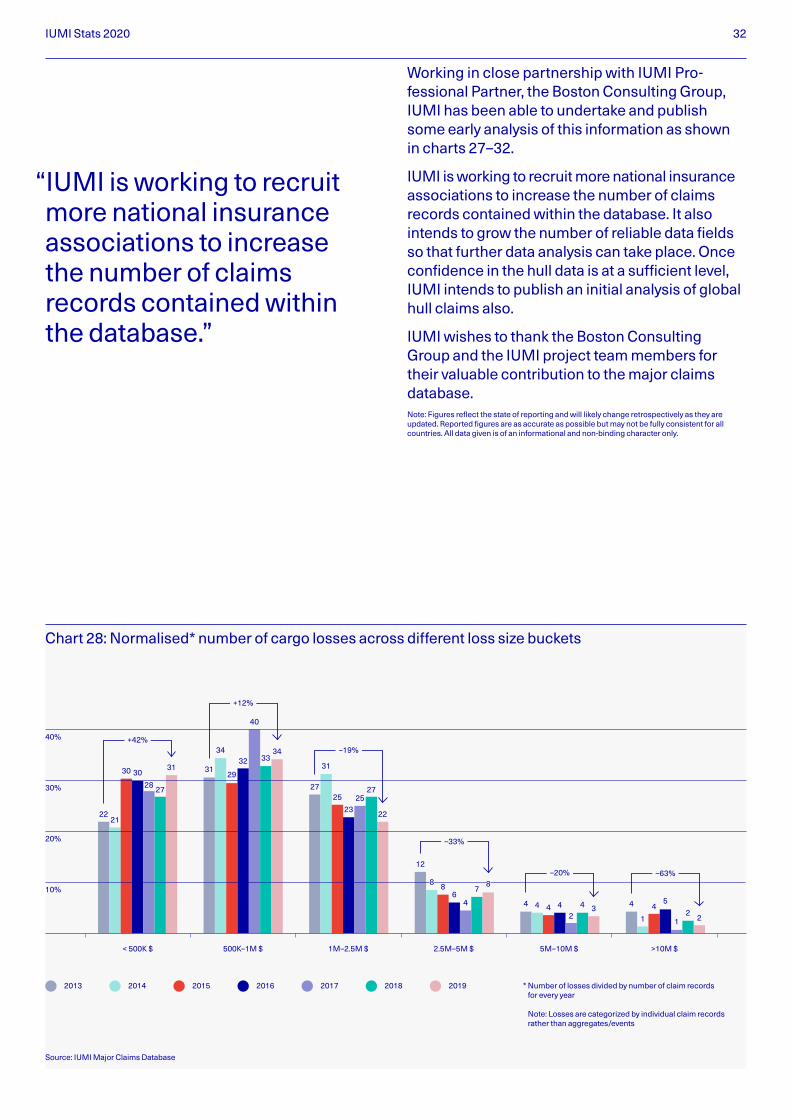
Working in close partnership with IUMI Pro - fessional Partner, the Boston Consulting Group, IUMI has been able to undertake and publish some early analysis of this information as shown in charts 27–32.
IUMI is working to recruit more national insurance associations to increase the number of claims records contained within the database. It also intends to grow the number of reliable data fields so that further data analysis can take place. Once confidence in the hull data is at a sufficient level, IUMI intends to publish an initial analysis of global hull claims also.
IUMI wishes to thank the Boston Consulting Group and the IUMI project team members for their valuable contribution to the major claims database. Note: Figures reflect the state of reporting and will likely change retrospectively as they are updated. Reported figures are as accurate as possible but may not be fully consistent for all countries. All data given is of an informational and non-binding character only.
< 500K $
22
31
27
12
4 4
21
34
31
4
1
30 29
25
8
4 4
3032
23
64 5
28
40
25
4
21
27
33
27
7
42
31
34
22
32
500K–1M $ 1M–2.5M $ 2.5M–5M $ 5M–10M $ >10M $
Source: IUMI Major Claims Database
40%
30%
20%
10%
Chart 28: Normalised* number of cargo losses across different loss size buckets
2013 20192014 2015 2016 2017 2018
8 8
+42%–19%
–33%
–20% –63%
+12%
* Number of losses divided by number of claim records for every year
Note: Losses are categorized by individual claim records rather than aggregates/events
“IUMI is working to recruit more national insurance associations to increase the number of claims records contained within the database.”

IUMI Stats 2020 33
Chart 27 shows the number of incurred losses greater than US$ 250,000 in each accident year from 2013-2019 and also the average loss amount per year. Outliers, such the Tianjin explosion will significantly impact the results in terms of total loss amounts but not necessarily the number of claims.
Chart 28 gives a further breakdown to show number of losses based on loss amounts and, in general, it shows that fewer losses are incurred in the high loss amount brackets. However, it can be seen that losses below US$ 500,000 have increased by 42% from 2013.
Chart 29 clearly demonstrates that there are many more cargo losses of smaller amounts and fewer claims for larger amounts.
4%
12%
20%
14%
12%
37%
Number of claims
2,430 4,771,474,935
Incurred losses, $
Source: IUMI Major Claims Database
100%
80%
60%
40%
20%
Chart 29: Number of cargo claims and incurred losses by size categories 2013–2019 accident years
>10M 5M–10M 2.5M–5M 1M–2.5M 500K–1M < 500K
Note: Losses are categorized by individual claim records rather than aggregates/events
27%
33%
26%
8%
4% 3%

IUMI Stats 2020 34
30%
6%
6%
22%
31%
19%
2%
6%
32%
38%
46%
8% 16%
21%
48%
13%
16%
6%
15%
15%
11%
28%
43%
60%
12%
9%
14%
49%
9%
6% 5% 6%
25%
2013 2014 2015 2016 2017 2018 2019
Source: IUMI Major Claims Database
1,000
800
600
400
200
Chart 30: Top 5 major cargo losses by type of loss 2013–2019
NatCat events or Natural perils Denting/breakage/latent defect
Theft/robbery/burglary Wetting/mould/humidity/water damage Other/unknown
Fire/Explosion Note: Due to manual mapping work about 86% of all observations can be used for analysis (compared to 72% otherwise)Note: Other/unknown also includes minor types of losses (e.g., piracy)
M$
2% 4%
2% 1%
2%
3% 5% 2%
4%
627
444
909
587
306
886
568
Chart 30 shows the top types of loss in each accident year where it can be seen that nat-cat and fire/explosion appear to be the main causes. Whilst the other/unknown category includes less common causes such as piracy, it is gratify- ing the see the pure unknown causes falling year-on-year as reporting becomes more accurate and robust.
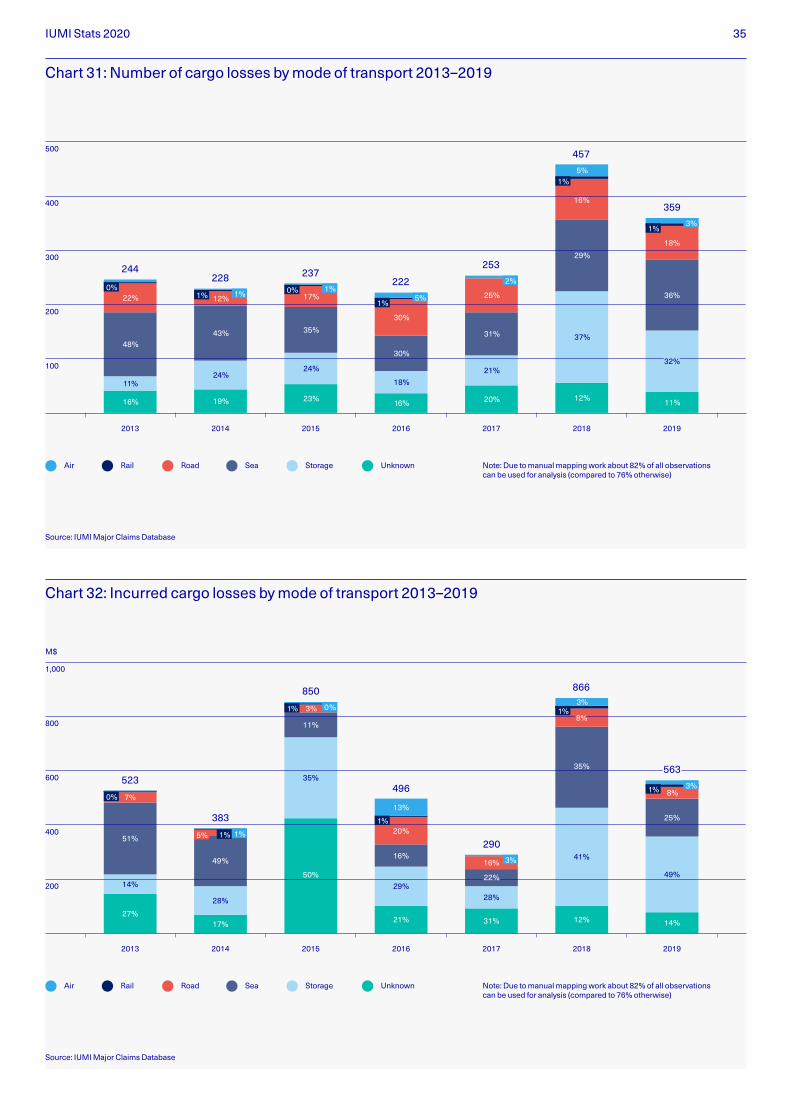
The final two charts (31 and 32) provide further information on number and value of losses by mode of transport where seaborne transport and storage appear to be the main culprits. Interestingly, causes due to storage appear to be on the rise.
IUMI Stats 2020 35
27%
14%
51%
7%
20%
21%
31%
25%
11%
36%
18%
12%
37%
29%
16%
5%
16%
18%
30%
30%
23%
24%
35%
17%
19%
24%
43%
12%
16%
11%
48%
22%
2013 2014 2015 2016 2017 2018 2019
Source: IUMI Major Claims Database
500
400
300
200
100
Chart 31: Number of cargo losses by mode of transport 2013–2019
Air Road Sea Storage UnknownRail Note: Due to manual mapping work about 82% of all observations can be used for analysis (compared to 76% otherwise)
244228 237
222
253
457
359
0% 0%
1%
1%
1% 1% 1%
5%
2%
1% 3%
32%32%
523
383
850
496
290
866
31%
28%
16%
14%
49%
25%25%
8%
12%
41%
35%35%
3%
21%
29%
16%
20%
13%
50%
35%
11%
3%
17%
28%
49%
2013 2014 2015 2016 2017 2018 2019
Source: IUMI Major Claims Database
1,000
800
600
400
200
Chart 32: Incurred cargo losses by mode of transport 2013–2019
Air Road Sea Storage UnknownRail Note: Due to manual mapping work about 82% of all observations can be used for analysis (compared to 76% otherwise)
0%
0%
3%
1%
1%
1%
1%
1%
3%
5%
M$
1%
8%8%
22%22%
563563
IUMI Stats 2020 36
Additional information This report and other public IUMI statistics are available for download from iumi.com/statistics/public-statistics. Additional information such as marine premiums by country, loss ratio trian-gulations for cargo, hull and offshore energy, and hull and cargo inflation indices are available for IUMI members from the member statistics section of IUMI’s website iumi.com/statistics/iumi-member-statistics
Data sources Information sources are clearly stated at the foot of each chart. IUMI thanks its partners who have kindly supplied charts or data for this document.
IUMI data IUMI’s total world-wide premium includes data from all relevant marine insurance markets including Asia, Latin America and Africa. Care should be taken when making comparisons with earlier published figures as data coverage varies in different years and a number of figures will each year be updated retrospectively. Similarly, “global” loss ratios for hull, energy and cargo do not encompass all regions, and underwriting year results do develop over a couple of years due to a time lag in claims reporting and payments. Loss ratios for major Asian and Latin American markets are on accounting year basis and reflect paid claims only (graphs not included here, see IUMI’s Global Marine Insurance Report 2020).
When interpreting statistics, caution should always be applied regarding what the data actually relates to.
All figures released by IUMI are global market sums or averages. While these reflect the average performance of the marine insurance market, individual companies’ or countries’ results may differ substantially. As with all averages, individual underwriting units may over or underperform compared with the average. IUMI does not make any statements about what actual applied premium rates were or should be. The aim of IUMI is solely to provide data as available and raise awareness for the importance of a critical evaluation of the risks covered.
Notes
IUMI Stats 2020 37
Disclaimer This publication provides general information only and should not be relied upon for business, investment or any other purpose. Whilst every effort has been made to ensure that the informa-tion provided is accurate, this information is provided without any representation or warranty of any kind about its accuracy and IUMI, its officers or representatives cannot be held responsible for any mistakes or omissions. Information, views and opinions expressed are those of IUMI and are not attributed to any individual committee member or officer of IUMI.
Copyright Copyright © 2020 International Union of Marine Insurance / All rights reserved.
About IUMI The International Union of Marine Insur-ance (IUMI) represents 45 national and marine market insurance and reinsur-ance associations. Operating at the forefront of marine risk, it gives a unified voice to the global marine insurance market through effective representation and lobbying activities. As a forum for the exchange of ideas and best practice, IUMI works to raise standards across the industry and provides opportunities for education and the collection and publication of industry statistics. IUMI is headquartered in Hamburg and traces its roots back to 1874.
International Union of Marine Insurance Grosse Elbstrasse 36 D-22767 Hamburg, Germany Telephone +49 40 2000 747-0 Email [email protected]
iumi.com
IUMI thanks its key data and content providers

IUMI Stats 2020 38
Facts & Figures Committee
Stephan Klein GenRe
Lars Lange IUMI Secretary General
Andrea Mazza Swiss Re International
Emiel Paaij DUPI Underwriting Agencies
Erika Schoch Swiss Re Americas
Sanjiv Singh General Insurance Council, India
Marika Svalskulla Sirius International Insurance
Atsushi Tabata Sompo Japan Nipponkoa
Li Zhang Taiping Reinsurance
Philip Graham, Chairperson Chaucer Syndicate 1084
Jun Lin, Vice Chairperson Gard
Astrid Seltmann, Vice Chairperson Cefor (The Nordic Association of Marine Insurers)
David Matcham, Secretary International Underwriting Association
Javier Alonso Mapfre Re
Robert Copp Axis Reinsurance
Mathieu Daubin AXA XL
Paul Hackett Canopius

At the forefront of marine risk
International Union of Marine Insurance Grosse Elbstrasse 36 D-22767 Hamburg, Germany Telephone +49 40 2000 747-0 Email [email protected]
iumi.com