IUMI 2008 - Global Marine Insurance Report 2008 Marine Insurance Report 2008 Astrid Seltmann Facts &...
25
Global Marine Insurance Report 2008 Astrid Seltmann Facts & Figures Committee Analyst/Actuary, CEFOR, Norway
-
Upload
truongxuyen -
Category
Documents
-
view
215 -
download
0
Transcript of IUMI 2008 - Global Marine Insurance Report 2008 Marine Insurance Report 2008 Astrid Seltmann Facts &...
Global Marine Insurance Report 2008
Astrid Seltmann
Facts & Figures Committee
Analyst/Actuary, CEFOR, Norway

Report on marine insurance premiums 2006 and 2007
• By end of August 2008, 49 of 54 members (ex 45 of 53, new IUMI member Brasil) reported their country’s marine premium figures for accounting years 2006 and 2007.
• The reporting countries represent approximately 97% of the total marine premium written by all IUMI members.
• Total premium for 2007 is therefore estimated to reach approx. USD 22.8 billion*, and increase of 9.8% from 2006 (excl. premium from mutual P&I Clubs).
• Taking into account the exchange rate impact, the increase is estimated to be only 5%.

World Merchant Fleet and Global Marine Hull & Liability Premium
Index of evolution, vessels > 100 GT, 1995 = 100%
Sources: Indicators for World Fleet from ISL Bremen, Vessel value index: CEFOR
40%
60%
80%
100%
120%
140%
160%
180%19
9519
9619
9719
9819
9920
0020
0120
0220
0320
0420
0520
0620
07
No. Ships
Gross tonnage
Global Marine Hull &Liab. Premium
Average insuredvessel value(CEFOR)
50%
100%
150%
200%
250%
300%
1995
1996
1997
1998
1999
2000
2001
2002
2003
2004
2005
2006
2007
Total World TradeVolume
Global CargoPremium
Total World TradeValues
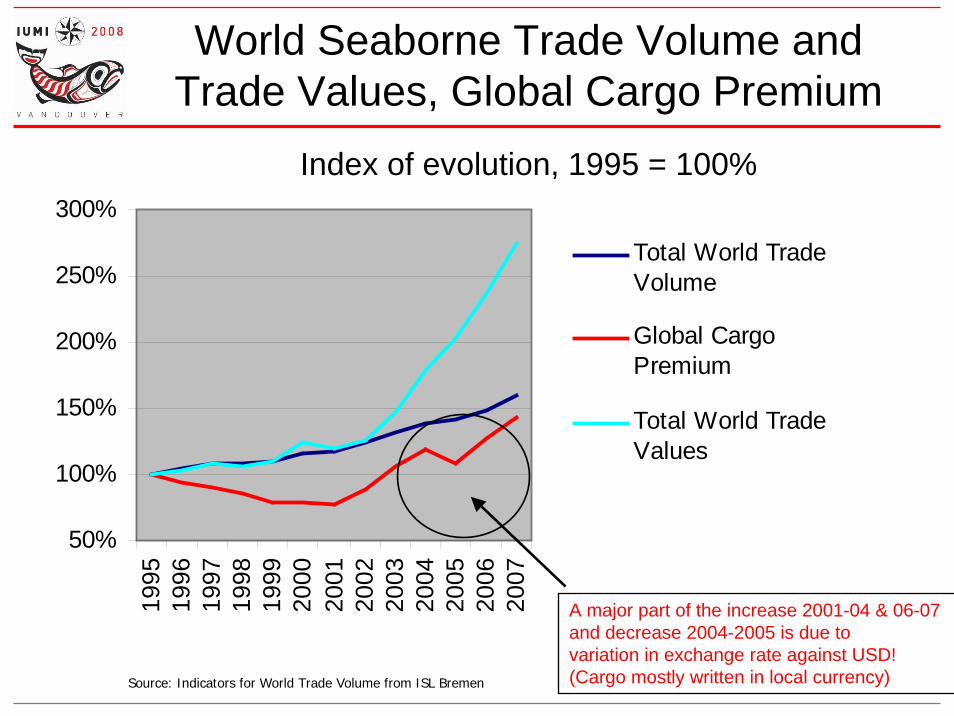
World Seaborne Trade Volume andTrade Values, Global Cargo Premium
Index of evolution, 1995 = 100%
Source: Indicators for World Trade Volume from ISL Bremen
A major part of the increase 2001-04 & 06-07 and decrease 2004-2005 is due to variation in exchange rate against USD!(Cargo mostly written in local currency)
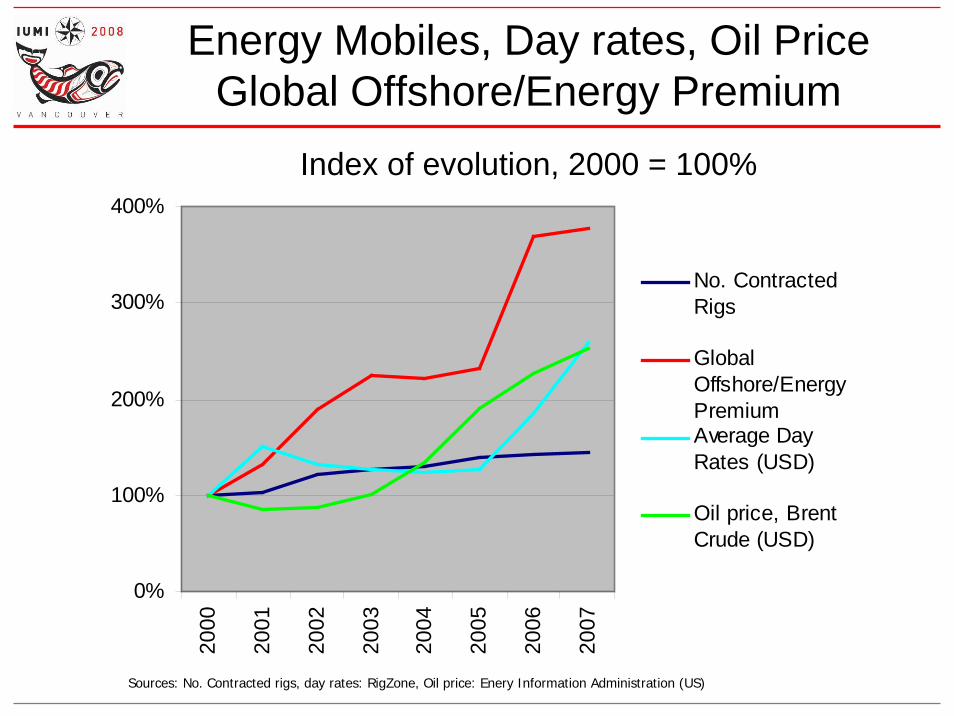
Energy Mobiles, Day rates, Oil PriceGlobal Offshore/Energy Premium
Index of evolution, 2000 = 100%
Sources: No. Contracted rigs, day rates: RigZone, Oil price: Enery Information Administration (US)
0%
100%
200%
300%
400%20
00
2001
2002
2003
2004
2005
2006
2007
No. ContractedRigs
GlobalOffshore/EnergyPremiumAverage DayRates (USD)
Oil price, BrentCrude (USD)

60%
80%
100%
120%
140%
160%19
99
2000
2001
2002
2003
2004
2005
2006
2007
EURGBPJPYNOK
Index of evolution of Exchange rates between US$ and selected currencies
(as of December each year)
USD weaker strongerweaker
Source: Norges Bank Exchange Rates Statistics
0 5000 10000 15000 20000 25000
USD (millions)
Total
Offshore / Energy
Marine Liability
Transport / Cargo
Global Hull20072006200520042003
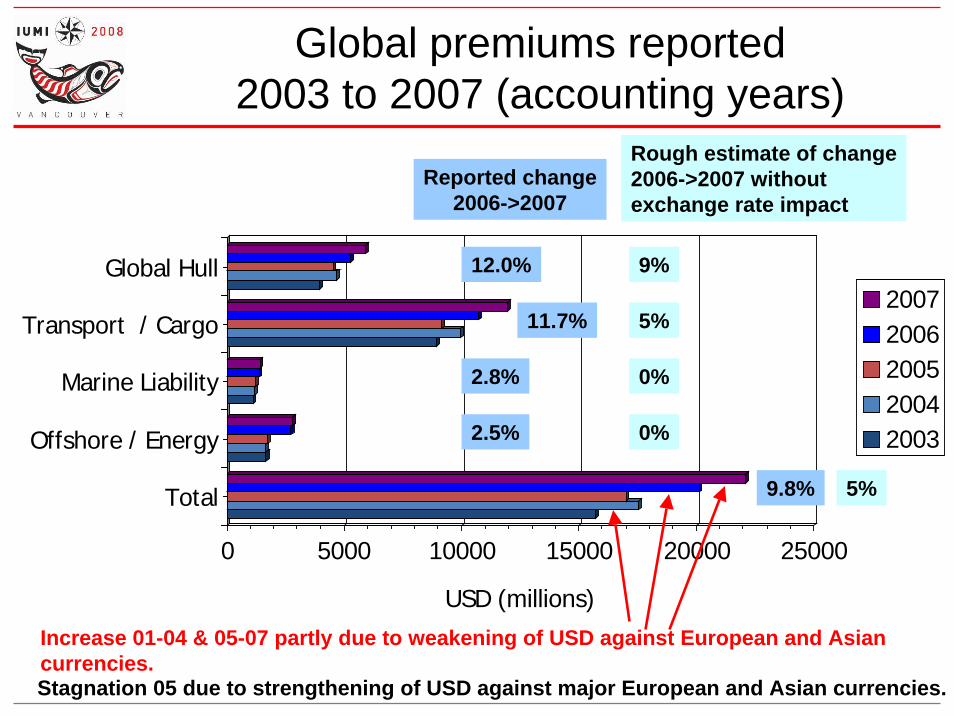
Stagnation 05 due to strengthening of USD against major European and Asian currencies.
Increase 01-04 & 05-07 partly due to weakening of USD against European and Asian currencies.
Global premiums reported 2003 to 2007 (accounting years)
Reported change2006->2007
12.0%
11.7%
2.8%
2.5%
9.8%
Rough estimate of change2006->2007 withoutexchange rate impact
9%
5%
0%
0%
5%
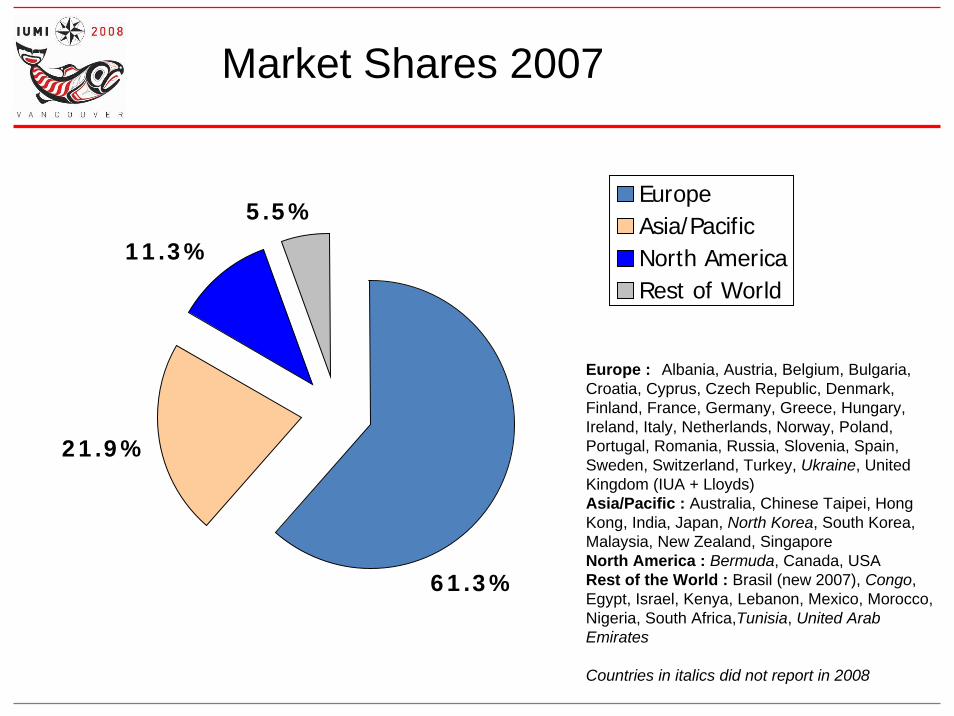
Market Shares 2007
Europe : Albania, Austria, Belgium, Bulgaria, Croatia, Cyprus, Czech Republic, Denmark, Finland, France, Germany, Greece, Hungary, Ireland, Italy, Netherlands, Norway, Poland, Portugal, Romania, Russia, Slovenia, Spain, Sweden, Switzerland, Turkey, Ukraine, United Kingdom (IUA + Lloyds)Asia/Pacific : Australia, Chinese Taipei, Hong Kong, India, Japan, North Korea, South Korea, Malaysia, New Zealand, SingaporeNorth America : Bermuda, Canada, USARest of the World : Brasil (new 2007), Congo, Egypt, Israel, Kenya, Lebanon, Mexico, Morocco, Nigeria, South Africa,Tunisia, United Arab Emirates
Countries in italics did not report in 2008
21.9%
11.3%
5.5%
61.3%
EuropeAsia/PacificNorth AmericaRest of World

02000400060008000
10000120001400016000
2000 2001 2002 2003 2004 2005 2006 2007
Accounting Year
Europe
Asia/Pacific
NorthAmerica
Rest of theWorld
Europe, Asia: Exchange rate effects due to weakening/strengthening of USD
Report on marine insurance premiums by economic areas
(USD Millions)
Rest of World: Brasil figures included from 2006

Global Marine Premium 2000 - 2007
(USD Million), as reported
Total
Cargo
Hull
EnergyLiability
0
5,000
10,000
15,000
20,000
25,000
2000 2001 2002 2003 2004 2005 2006 2007
Accounting Year
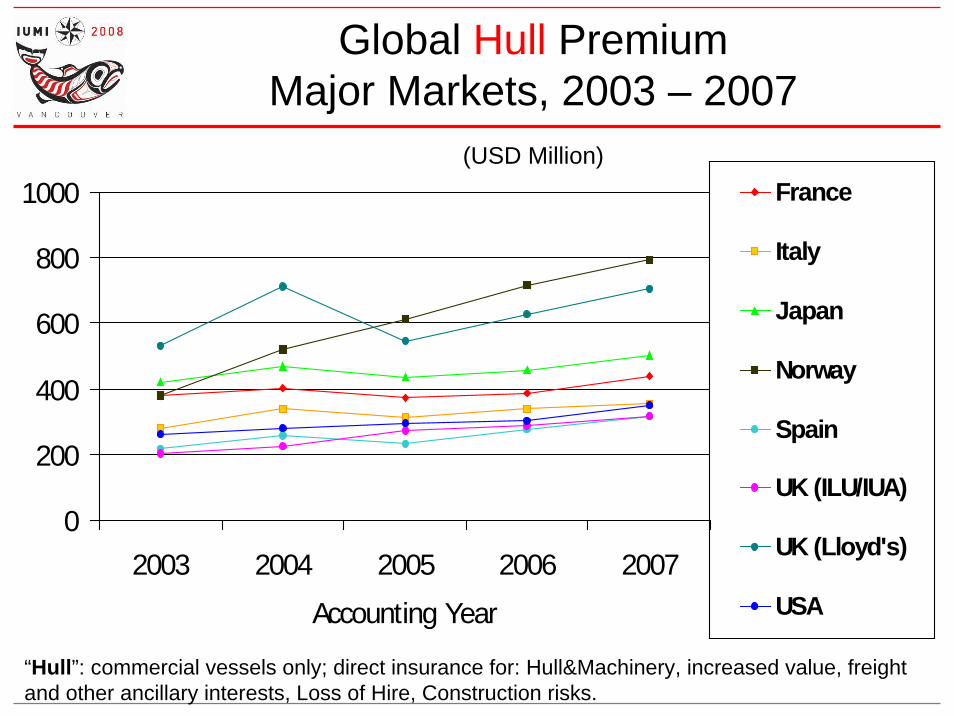
Global Hull PremiumMajor Markets, 2003 – 2007
(USD Million)
“Hull”: commercial vessels only; direct insurance for: Hull&Machinery, increased value, freight and other ancillary interests, Loss of Hire, Construction risks.
0
200
400
600
800
1000
2003 2004 2005 2006 2007
Accounting Year
France
Italy
Japan
Norway
Spain
UK (ILU/IUA)
UK (Lloyd's)
USA

Global Cargo PremiumMajor Markets, 2003 – 2007
(USD Million)
Europe/Asia: exchange rate effects.
0
1000
2000
2003 2004 2005 2006 2007
Accounting Year
Belgium
China
France
Germany
Italy
Japan
Netherlands
Spain
Sweden
UK (ILU/IUA)
UK (Lloyd's)
USA

MARINE MUTUAL MARKET SECTORGross Calls (Premium) – Operational location
Per accounting year – USD Million
Source: Standard & Poors Marine Mutual Report 2008
0
500
1000
1500
2000
2003 2004 2005 2006 2007
Accounting Year
Japan
Norway
Sweden
UK
US
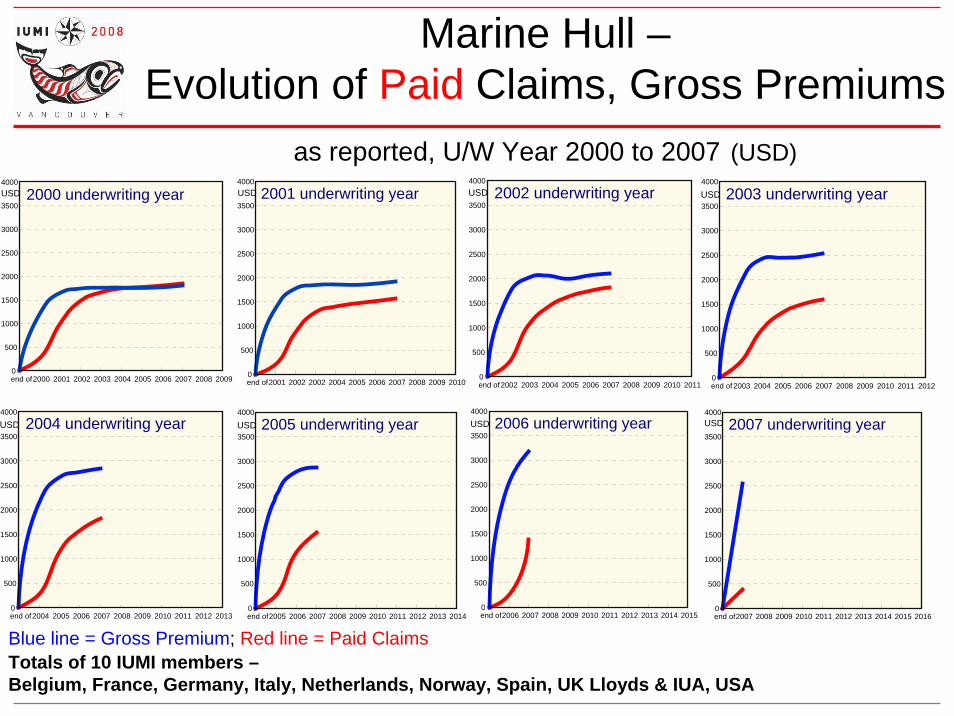
Marine Hull –Evolution of Paid Claims, Gross Premiums
as reported, U/W Year 2000 to 2007 (USD)
Totals of 10 IUMI members –Belgium, France, Germany, Italy, Netherlands, Norway, Spain, UK Lloyds & IUA, USA
Blue line = Gross Premium; Red line = Paid Claims
2000 underwriting year
end of2000 2001 2002 2003 2004 2005 2006 2007 2008 20090
500
1000
1500
2000
2500
3000
3500
4000USD 2000 underwriting year
end of2002 2003 2004 2005 2006 2007 2008 2009 2010 20110
500
1000
1500
2000
2500
3000
3500
4000USD 2002 underwriting year
end of2001 2002 2002 2004 2005 2006 2007 2008 2009 20100
500
1000
1500
2000
2500
3000
3500
4000USD 2001 underwriting year
end of 2003 2004 2005 2006 2007 2008 2009 2010 2011 20120
500
1000
1500
2000
2500
3000
3500
4000
USD 2003 underwriting year
end of2004 2005 2006 2007 2008 2009 2010 2011 2012 20130
500
1000
1500
2000
2500
3000
3500
4000
USD 2004 underwriting year
end of2005 2006 2007 2008 2009 2010 2011 2012 2013 20140
500
1000
1500
2000
2500
3000
3500
4000
USD 2005 underwriting year
end of2006 2007 2008 2009 2010 2011 2012 2013 2014 20150
500
1000
1500
2000
2500
3000
3500
4000
USD 2006 underwriting year
end of2007 2008 2009 2010 2011 2012 2013 2014 2015 20160
500
1000
1500
2000
2500
3000
3500
4000USD 2007 underwriting year

Marine Hull –Evolution of Paid Claims, Gross Premiums
with estimation towards ultimate, U/W Year 2000 to 2007 (USD)
Blue line = Gross Premium; Red line = Paid Claims
2000 underwriting year
Totals of 10 IUMI members –Belgium, France, Germany, Italy, Netherlands, Norway, Spain, UK Lloyds & IUA, USA
end of2000 2001 2002 2003 2004 2005 2006 2007 2008 ult0
500
1000
1500
2000
2500
3000
3500
4000
4500
5000USD 2000 underwriting year
end of2002 2003 2004 2005 2006 2007 2008 2009 2010 ult0
500
1000
1500
2000
2500
3000
3500
4000
4500
5000USD 2002 underwriting year
end of2001 2002 2002 2004 2005 2006 2007 2008 2009 ult0
500
1000
1500
2000
2500
3000
3500
4000
4500
5000USD 2001 underwriting year
end of2003 2004 2005 2006 2007 2008 2009 2010 2011 ult0
500
1000
1500
2000
2500
3000
3500
4000
4500
5000USD 2003 underwriting year
end of2004 2005 2006 2007 2008 2009 2010 2011 2012 ult0
500
1000
1500
2000
2500
3000
3500
4000
4500
5000USD 2004 underwriting year
end of2005 2006 2007 2008 2009 2010 2011 2012 2013 ult0
500
1000
1500
2000
2500
3000
3500
4000
4500
5000USD 2005 underwriting year
end of2006 2007 2008 2009 2010 2011 2012 2013 2014 ult0
500
1000
1500
2000
2500
3000
3500
4000
4500
5000USD 2006 underwriting year
end of2007 2008 2009 2010 2011 2012 2013 2014 2015 ult0
500
1000
1500
2000
2500
3000
3500
4000
4500
5000USD 2007underwriting year

0%
20%
40%
60%
80%
100%
120%
140%
12 24 36 48 60 72 84 96 108
120
132
144
Ultimate
199619971998199920002001200220032004200520062007
Ultimates based on 10 IUMI members: Belgium, France, Germany, Italy, Netherlands, Norway, Spain, UK Lloyds & IUA, USA
Marine Hull Gross Loss Ratio paid claims, Actual and estimated towards ultimate
U/W Year 1996 to 2007
1999
1998
2000
2002 2007/2001
20062004
2005/2003
Technical break even is achieved when the gross loss ratio does not exceed 100% minus the expense ratio (between 20% and 30%, acquisitioncosts, capital costs and management expenses)

Transport/Cargo –Evolution of Paid Claims, Gross Premiums
as reported, U/W Year 2000 to 2007 (USD)
Totals of 9 IUMI members – Belgium, France, Germany, Italy, Netherlands, Spain, UK Lloyds & IUA, USA
Blue line = Gross Premium; Red line = Paid Claims
end of2003 2004 2005 2006 2007 2008 2009 2010 2011 20120
500
1000
1500
2000
2500
3000
3500
4000
4500
5000USD 2003 underwriting year
end of2000 2001 2002 2003 2004 2005 2006 2007 2008 20090
500
1000
1500
2000
2500
3000
3500
4000
4500
5000USD 2000 underwriting year 2001 underwriting year
end of2001 2002 2003 2004 2005 2006 2007 2008 2009 20100
500
1000
1500
2000
2500
3000
3500
4000
4500
5000USD 2001 underwriting year
end of2002 2003 2004 2005 2006 2007 2008 2009 2010 20110
500
1000
1500
2000
2500
3000
3500
4000
4500
5000USD 2002 underwriting year
end of2004 2005 2006 2007 2008 2009 2010 2011 2012 20130
500
1000
1500
2000
2500
3000
3500
4000
4500
5000USD 2004 underwriting year
end of2005 2006 2007 2008 2009 2010 2011 2012 2013 20140
500
1000
1500
2000
2500
3000
3500
4000
4500
5000USD 2005 underwriting year
end of2006 2007 2008 2009 2010 2011 2012 2013 2014 20150
500
1000
1500
2000
2500
3000
3500
4000
4500
5000USD 2006 underwriting year
end of2007 2008 2009 2010 2011 2012 2013 2014 2015 20160
500
1000
1500
2000
2500
3000
3500
4000
4500
5000USD 2007 underwriting year

Transport/Cargo –Evolution of Paid Claims, Gross Premiums
with estimation towards ultimate, U/W Year 2000 to 2007 (USD)
Totals of 9 IUMI members – Belgium, France, Germany, Italy, Netherlands, Spain, UK Lloyds & IUA, USABlue line = Gross Premium; Red line = Paid Claims
end of2003 2004 2005 2006 2007 2008 2009 2010 2011 ult0
500
1000
1500
2000
2500
3000
3500
4000
4500
5000
5500
6000USD 2003 underwriting year
end of2000 2001 2002 2003 2004 2005 2006 2007 2008 ult0
500
1000
1500
2000
2500
3000
3500
4000
4500
5000
5500
6000USD 2000 underwriting year 2001 underwriting year
end of2001 2002 2003 2004 2005 2006 2007 2008 2009 ult0
500
1000
1500
2000
2500
3000
3500
4000
4500
5000USD 2001 underwriting year
end of2005 2006 2007 2008 2009 2010 2011 2012 2013 ult0
500
1000
1500
2000
2500
3000
3500
4000
4500
5000
5500
6000USD 2005 underwriting year
end of2002 2003 2004 2005 2006 2007 2008 2009 2010 ult0
500
1000
1500
2000
2500
3000
3500
4000
4500
5000
5500
6000USD 2002 underwriting year
end of2004 2005 2006 2007 2008 2009 2010 2011 2012 ult0
500
1000
1500
2000
2500
3000
3500
4000
4500
5000
5500
6000USD 2004 underwriting year
end of2006 2007 2008 2009 2010 2011 2012 2013 2014 ult0
500
1000
1500
2000
2500
3000
3500
4000
4500
5000
5500
6000USD 2006 underwriting year
end of2007 2008 2009 2010 2011 2012 2013 2014 2015 ult0
500
1000
1500
2000
2500
3000
3500
4000
4500
5000
5500
6000USD 2007 underwriting year

0%
10%
20%
30%
40%
50%
60%
70%
80%
90%
100%
12 24 36 48 60 72 84 96 108
120
132
144
Ultimate
199619971998199920002001200220032004200520062007
Ultimates based on 9 IUMI members – Belgium, France, Germany, Italy, Netherlands, Spain, UK Lloyds, UK IUA, USA
Transp./Cargo, Gross Loss ratio paid claims,Actual and estimated towards ultimate
U/W Year 1996 to 2007
1999
1998/2000
1997
20012007 / 2005
20022004
2006 / 2003
Technical break even is achieved when the gross loss ratio does not exceed 100% minus the expense ratio (between 20% and 30%, acquisitioncosts, capital costsand management expenses)

0%
20%
40%
60%
80%
100%
120%
140%
1996 1997 1998 1999 2000 2001 2002 2003 2004 2005 2006
Marine HullCargo/Transport
Marine Hull and Cargo/TransportGross Ultimate Loss Ratio – as of 2007
U/W Year 1996 to 2006Impact of major claims in 2007 attaching to 2006 + further increase in partial claims costs in 2007
Estimation shown in Copenhagen 2007

0%
20%
40%
60%
80%
100%
120%
140%
1996 1997 1998 1999 2000 2001 2002 2003 2004 2005 2006 2007
Marine HullCargo/Transport
Marine Hull and Cargo/TransportGross Ultimate Loss Ratio – as of 2008
U/W Year 1996 to 2007
Hull 06: Claims incurred 2007attaching to 2006
Cargo 05: includingUS impact (Katrina)
and 2007:When will it end ?

40%
50%
60%
70%
80%
90%
12 24 36 48 60
2003
2004
2005
2006
2007
Hull Gross Loss Ratio (Paid+Outst. Claims / Gross Premiums)
by UW year, as reported at 12, 14, 36, 48 and 60 months
Months
2006 UW year: Claims occured in 2007, but attaching to 2006
2007: starts high at 55%
40%
50%
60%
70%
80%
12 24 36 48 60
2003
2004
2005
2006
2007
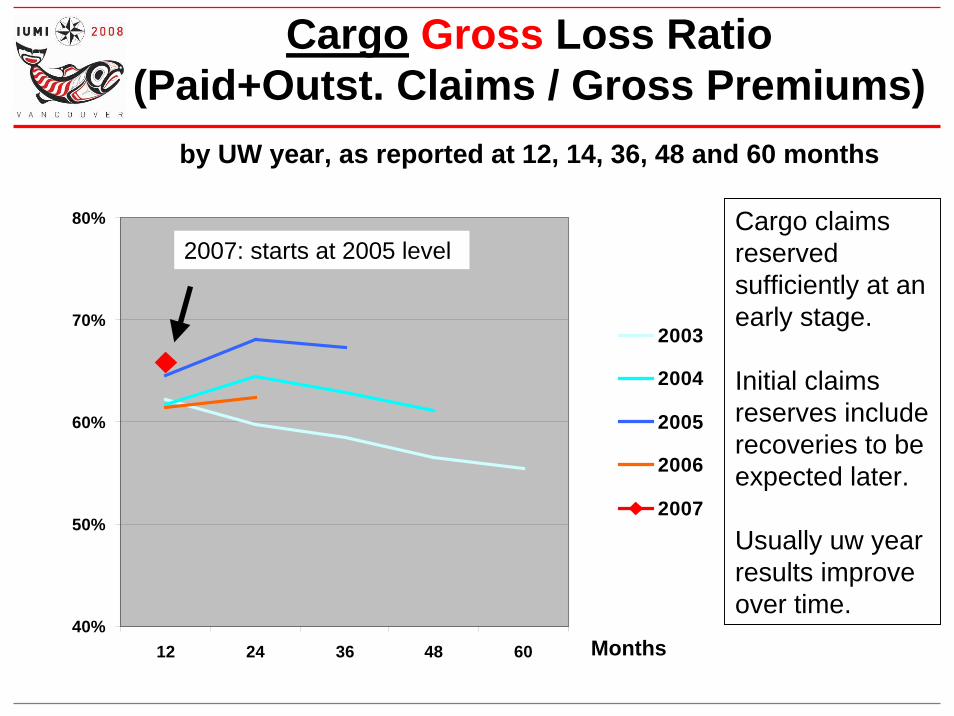
Cargo Gross Loss Ratio (Paid+Outst. Claims / Gross Premiums)
by UW year, as reported at 12, 14, 36, 48 and 60 months
Months
2007: starts at 2005 levelCargo claimsreserved sufficiently at an early stage.
Initial claimsreserves includerecoveries to beexpected later.
Usually uw year results improve over time.

Summing up Hull• Marine Hull
– 2004, 2005: • Few major claims, but increase in average repair cost
– 2006:• Increase in number and severity of major claims• Trend towards higher attritional claims cost continues• Strong impact on result by claims occured in 2007, but
attaching to 2006– 2007:
• Starts at high loss ratio level, expected to produce a technical loss again.
• Premium increases do not sufficiently balance cost inflation.

Summing up Transport/Cargo
• Transport/Cargo– Exposures in values increase significantly,
but not reflected in premium development– Stability in results since 2002– 2005: slightly worse than average result,
probably due to Katrina– 2007: signs of worsening of cargo results