itw 072203
30
ITW Conference Call Second Quarter 2003
-
Upload
finance16 -
Category
Economy & Finance
-
view
292 -
download
2
Transcript of itw 072203

ITW Conference Call
Second Quarter2003

ITWAgenda
1. Introduction……………………..John Brooklier
2. Financial Overview……………..Jon Kinney
3. Manufacturing Segments……… John Brooklier
4. Forecast…………………………Jon Kinney
5. Q & A…………………………...Kinney/Brooklier

ITWForward-Looking Statements
Statements regarding the company’s earnings estimates contain forward-looking statements within the meaning of the private securities Litigation Reform act of 1995, including, without limitation, statements regarding the company’s 2003 forecasts. These statements are subject to certain risks, uncertainties, and other factors, which could cause actual results to differ materially from those anticipated, including, without limitation, the following risks:1)a downturn in the construction, automotive, general industrial, food service and retail, or real estate markets; 2)deterioration in global and domestic businesses and economic conditions, particularly in North America, the European community and Australia; 3) the unfavorable impact of foreign currency fluctuations; 4) an interruption in , or reduction in, introducing new products into the Company’s product lines; and 5)an unfavorable environment for making acquisitions or dispositions, domestic and international, including adverse accounting or regulatory requirements and market value of candidates.

Conference Call Playback
Replay number: 402-220-2269
Replay available thru midnight of August 5
No pass code necessary

ITWQuarterly Highlights
2002 2003Q2 Q2 Amount %
Operating Revenues 2,434.6 2,564.0 129.4 5.3%Operating Income 429.0 454.1 25.1 5.9%
% of Revenues 17.6% 17.7% 0.1%
Income From Continuing OperationsIncome Amount 265.2 284.0 18.8 7.1%Income Per Share-Diluted 0.86 0.92 0.06 7.0%
Average Invested Capital 6,500.5 6,698.2 197.7 3.0%Return on Invested Capital 17.0% 17.6% 0.6%
Free Cash 229.0 217.7 (11.3) -4.9%
F(U) Last Year

ITWQuarterly Operating Analysis
Revenue Income MarginsBase Manufacturing Business
Operating Leverage -4.4% -10.8% -1.2%Non Volume Related 2.5% 0.4%
Total -4.4% -8.3% -0.8%
Acquisitions / Divestitures 2.1% 1.1% -0.1%
Translation 6.2% 5.6% -0.1%
Restructuring 1.1% 0.2%
Leasing & Investment 1.0% 6.4% 0.9%
Other Revenue 0.4% 0.0%Total 5.3% 5.9% 0.1%

2002 2003Q2 Q2 Amount %
Operating Revenues 40.5 65.8 25.3 62.5%
Operating Income 24.5 52.1 27.6 112.7%
Operating Margins 60.5% 79.2% 18.7%
F(U) Last Year
ITWLeasing & Investment

2002 2003Q2 Q2 Amount %
Operating Income 429.0 454.1 25.1 5.9%
Interest Expense (18.4) (19.1) (0.7) Other Income (Expense) 2.1 2.0 (0.1)
Income From Continuing Operations-P/T 412.6 436.9 24.3 5.9%
Income Taxes 147.4 152.9 5.5 % to Pre Tax Income 35.7% 35.0% 0.7%
Income From Continuing Operations-A/T 265.2 284.0 18.8 7.1%
F(U) Last Year
ITWNon Operating & Taxes

6/30/02 12/31/02 6/30/03Trade Receivables 1,584.8 1,500.0 1,709.7
Days Sales Outstanding 58.6 55.6 60.0 Inventories 957.5 962.7 1,011.7
Months on Hand 1.8 1.8 1.8 Other Current Assets 225.3 354.3 367.0 Accounts Payable & Accruals (1,319.4) (1,445.6) (1,414.5)
Operating Working Capital 1,448.2 1,371.4 1,673.9 % to Revenue(Prior 4 Qtrs.) 14% 17%
Net plant & Equipment 1,633.5 1,631.2 1,703.5 Investments, net of L&I Debt 617.5 622.3 655.4 Goodwill 2,315.5 2,394.5 2,484.3 Other net 605.3 383.9 345.1
Invested Capital 6,620.0 6,403.3 6,862.2
ITWInvested Capital

6/30/02 12/31/02 6/30/03Total Capital
Short Term Debt 171.3 121.6 116.8 Long Term Debt 1,485.1 1,460.4 1,446.0
Total Debt 1,656.4 1,582.0 1,562.8 Stockholders Equity 6,260.3 6,649.0 7,295.3
Total Capital 7,916.7 8,231.0 8,858.1 Less:
Leasing & Investment Debt (811.4) (770.1) (761.8) Cash (485.3) (1,057.7) (1,234.1)
Net Debt & Equity 6,620.0 6,403.2 6,862.2
Debt to Total Capital 21% 19% 18%Debt to Total Capital (x L&I) 13% 11% 11%
ITWDebt & Equity

2002 2003Q2 Q2
Net Income 267.5 276.1 Adjust for Non-Cash Items 28.7 49.8 Changes in Operating Assets & Liab. (14.9) (49.6)
Net Cash From Operating Activities 281.3 276.3
Additions to Plant & Equipment (68.6) (66.0) Proceeds from investments 16.3 7.4
Free Cash 229.0 217.7
Acquisitions (56.6) (59.5) Investments (60.4) (11.7) Dividends (67.4) (70.5) Debt 116.2 (6.5) Other 43.6 39.0
Net Cash Increase(Decrease) 204.4 108.5
ITWCash Flow
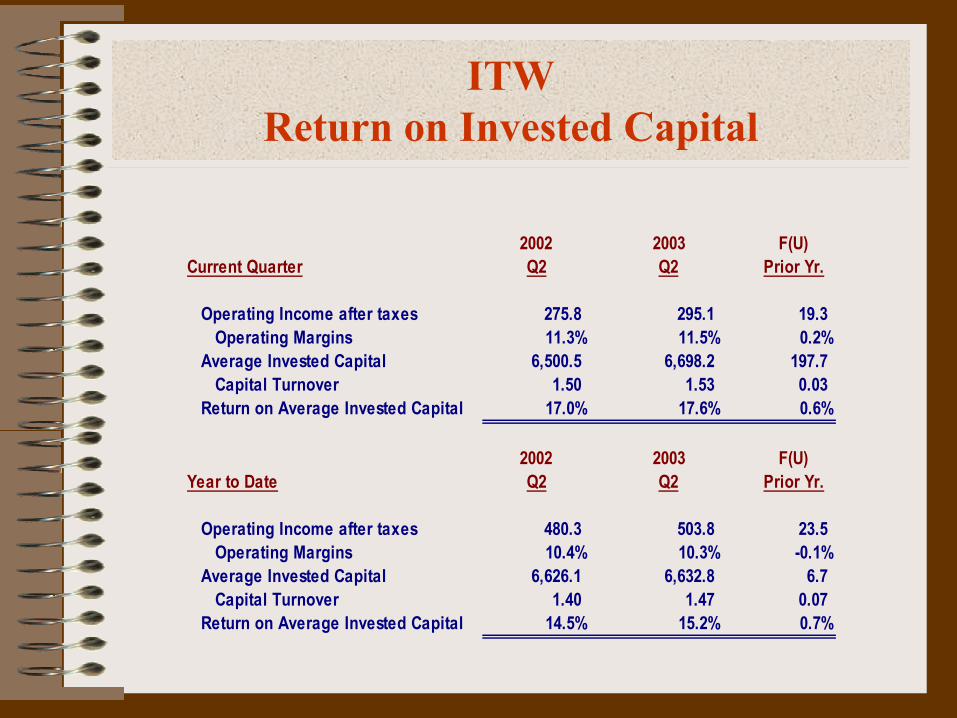
2002 2003 F(U)Current Quarter Q2 Q2 Prior Yr.
Operating Income after taxes 275.8 295.1 19.3 Operating Margins 11.3% 11.5% 0.2%
Average Invested Capital 6,500.5 6,698.2 197.7 Capital Turnover 1.50 1.53 0.03
Return on Average Invested Capital 17.0% 17.6% 0.6%
2002 2003 F(U)Year to Date Q2 Q2 Prior Yr.
Operating Income after taxes 480.3 503.8 23.5 Operating Margins 10.4% 10.3% -0.1%
Average Invested Capital 6,626.1 6,632.8 6.7 Capital Turnover 1.40 1.47 0.07
Return on Average Invested Capital 14.5% 15.2% 0.7%
ITWReturn on Invested Capital

Q1 Q2 Q3 Q4 Q1 Q2
Annual Revenues Acquired 31 59 33 72 49 35
Purchase PriceCash Paid 35 57 14 82 44 30 Stock Issued - - - - - -
Total 35 57 14 82 44 30
Number of AcquisitionsNorth America
Engineered Products 2 1 1 1 1 - Specialty Systems - 2 1 2 - 2
InternationalEngineered Products 1 2 1 - 1 Specialty Systems 2 2 2 1 7 3
Total 5 7 5 4 8 6
2002 2003
ITWAcquisitions

Key Economic Data
• June ’03 ISM: 49.8.% is slightly better than 46.2% in March…but still under 50 “growth/no growth”
• US Industrial Production (ex. Tech.): -1.7% in June ‘03 compared to -0.6% in March’03
• Euro-Zone Industrial Production Index:46.4% in June ’03 versus 48.4% in March ‘03

2002 2003Q2 Q2 Amount %
Operating Revenues 805.8 781.7 (24.1) -3.0%
Operating Income 155.3 133.3 (22.0) -14.2%
Operating Margins 19.3% 17.1% -2.2%
F(U) Last Year
ITWEngineered Products – N. America

Operating Operating OperatingRevenue Income Margins
Base BusinessOperating Leverage -6.5% -14.1% -1.6%Non Volume Related 2.2% 0.5%
Total -6.5% -11.9% -1.1%
Acquisitions / Divestitures 3.3% 0.0% -0.6%
Translation 0.2% -0.3% -0.1%
Restructuring -2.0% -0.4%
Total -3.0% -14.2% -2.2%
% F(U) Prior Year
Engineered Products-N. AmericaQuarterly Analysis

Engineered Products-North AmericaKey Points
• ITW construction base revenues: -6% for Q2-Commercial construction: -8% to -10%-New housing: -3%-Renovation/rehab: +10%
• Commercial construction bouncing along the bottom…but not expected to materially improve in ‘03
• New housing starts expected to decline 3% to 4% in ‘03
• Renovation/rehab grew 10% in Q2; sales look stable for FY‘03

Engineered Products-North AmericaKey Points
• Auto base revenues: -7% for Q2
• Big 3 build rates: -11% for Q2– GM: -11%– Ford: -13%– Chrysler: -8%
• ITW estimate for Q3 builds: -10%; Wards: -7%
• ITW FY ’03 estimate: -8%; Wards: -6%
• June Big 3 inventories: 70 days…better than 81 days on hand in March and 97 days in January

ITWEngineered Products – International
2002 2003Q2 Q2 Amount %
Operating Revenues 391.6 470.5 78.9 20.1%
Operating Income 58.6 68.1 9.5 16.2%
Operating Margins 15.0% 14.5% -0.5%
F(U) Last Year

Engineered Products-InternationalQuarterly Analysis
Operating Operating OperatingRevenue Income Margins
Base BusinessOperating Leverage 1.5% 3.9% 0.4%Non Volume Related -11.0% -1.6%
Total 1.5% -7.1% -1.2%
Acquisitions / Divestitures 0.9% 0.8% 0.0%
Translation 17.7% 21.8% 0.6%
Restructuring 0.7% 0.1%
Total 20.1% 16.2% -0.5%
% F(U) Prior Year

Engineered Products-InternationalKey Points
• Construction base revenues: +1% in Q2 – Europe: +2% growth (strength in UK, France and Italy)– Australia: -1% (slowing new housing and commercial
activity)– Wilsonart Intl.: +6% (activity in China)
• Automotive base revenues: +3% in Q2– Builds: –1% in Q2 – GM: +10%; Citroen-Peugeot: +7%; Ford: +1%
BMW: -4%; Daimler/Chrysler : -3%– Forecasting FY ’03 builds to be: –2%/-3%

ITWSpecialty Systems-N. America
2002 2003Q2 Q2 Amount %
Operating Revenues 871.9 832.4 (39.5) -4.5%
Operating Income 137.1 142.7 5.6 4.1%
Operating Margins 15.7% 17.1% 1.4%
F(U) Last Year

Specialty Systems-N. AmericaQuarterly Analysis
Operating Operating OperatingRevenue Income Margins
Base BusinessBase Operating Leverage -5.8% -15.7% -1.6%Base Non Volume 11.8% 1.9%
Total -5.8% -3.9% 0.3%
Acquisitions / Divestitures 0.9% 1.1% 0.0%
Translation 0.4% 0.1% -0.1%
Restructuring 6.8% 1.2%
Total -4.5% 4.1% 1.4%
% F(U) Prior Year

Specialty Systems-N. America Key Points
• Food Equipment base revenues: -9% in Q2; restaurants and supermarkets still weak
• Food Equipment op. income +22% and margins improve +400 basis points in Q2 due to 80/20 programs
• Industrial packaging: Signode -7% base revenues….consumables continue to outperform “cap ex” machinery
• Welding base revenues: -2% in Q2
• Finishing base revenues: -7% in Q2

ITWSpecialty Systems-International
2002 2003Q2 Q2 Amount %
Operating Revenues 425.4 498.7 73.3 17.2%
Operating Income 53.4 57.8 4.4 8.2%
Operating Margins 12.6% 11.6% -1.0%
F(U) Last Year

Specialty Systems-InternationalQuarterly Analysis
Operating Operating OperatingRevenue Income Margins
Base BusinessBase Operating Leverage -3.5% -10.6% -0.9%Base Non Volume -4.7% -0.6%
Total -3.5% -15.3% -1.5%
Acquisitions / Divestitures 3.1% 5.3% 0.3%
Translation 17.6% 21.9% 0.7%
Restructuring -3.7% -0.5%
Total 17.2% 8.2% -1.0%
% F(U) Prior Year

Specialty Systems-International Key Points
. Total packaging: -2% base revenues in Q2
• Signode led the way for industrial packaging: -Europe: -3%-Asia/Pacific: +12%
-growth due to consumables rather than machinery
• Food Equipment: base revenues -1%…but op. income/margins up significantly (margins improve 120 basis points)
• Finishing: base revenues +1% in Q2

Mid %F(U)Low High Point 2002
3rd QuarterBase Revenues -5% -1% -3%Income Per Share-Diluted $0.77 $0.87 $0.82 4%
Full YearBase Revenues -4% -2% -3%Income Per Share-Diluted $3.12 $3.32 $3.22 7%
ITW2003 Forecast

ITW 2003 ForecastKey Assumptions
• Exchange rates hold at June 30, 2003 levels.
• Acquired revenues in the $200 to $600 million range.
• Restructuring cost of $55 to $60 million.
• No further goodwill or intangible impairment cost for the balance of the year.
• No significant mark-to-market adjustments in Leasing and Investments
• Tax rate of 35%

ITW Conference Call
Q & A
Second Quarter2003