ITUC Global Poll 2013 Building Workers Power (English)
29
ITUC Global Poll 2013 Building Workers’ Power
-
Upload
international-trade-union-confederation -
Category
Documents
-
view
228 -
download
1
description
Â
Transcript of ITUC Global Poll 2013 Building Workers Power (English)
ITUC Global Poll 2013Building Workers’ Power

3
Executive summary ................................................................................................ 4
Building workers’ power
Access to union representation ................................................................... 7
Unions better for workplace ........................................................................ 9
Economic and social outlook
Personal financial situation ........................................................................ 11
Personal or family experience of unemployment ........................................ 12
Gender: Job security laws ......................................................................... 14
Personal financial situation: not enough for essentials ............................... 15
Family income and cost of living ............................................................... 16
Economic situation of country ................................................................... 17
A crisis of political leadership
Government and unemployment ................................................................ 18
Government prioritises business interests ................................................. 20
Direction of country ................................................................................... 21
The rise of corporate greed
International labour rules .......................................................................... 22
The five point plan – An organising agenda
1. Job creation policy agenda .................................................................... 23
2. Reasonable wages through fair pay for goods and services ................... 24
3. Labour rights ......................................................................................... 25
4. Social protection floor ........................................................................... 27
5. Tax policies ........................................................................................... 28
Survey methodology ............................................................................................ 29
Contents
4
The ITUC World Congress in 2014, under the theme of Building Workers’ Power, marks a strategic moment to reclaim our democracies, our communities, the dignity of work and our rights as workers.
We are witness to alarming decent work deficits in an ailing global economy, where women and young people and those with less access to social protection are disproportionately affected.
The dominant model of corporate greed has driven a global economy based on exploitative wages, insecure and unsafe work. It must end and we will counter the threat to equality, social justice and our environment posed by the power and influence of these corporations on democratically elected governments.
The ITUC is determined to take up this challenge by building the power of workers and organising men, women and young people.
The state of the world for working families is bleak. Unemployment is again rising above 200 million and youth unemployment is a problem in nearly every nation.
The ITUC Global Poll 2013 covers the adult populations of Belgium, Brazil, Canada, China, France, Germany, India, Japan, Russia, South Africa, Spain, the United Kingdom and the United States. The findings represent the opinions of more than 3.7 billion people, or according to UN estimates about half of the world population.
Building workers’ powerThe challenge is enormous. The global workforce is 2.9 billion, and the formal workforce is 1.7 billion people.
The unionised workforce is 200 million. The ITUC family is the largest democratic force on earth, yet 7 percent of the global workforce is organised.
This requires us to focus on the central ambition of ‘’Building Workers’ Power” to ensure we have the democratic power to realise rights and shape a world that delivers sustainable jobs, secure incomes and social protection for both men and women.
We recognise that we must organise to grow. If we are to build the power of workers necessary to secure democracy, decent work, equality and social justice, we must break through the 7 percent barrier.
To do this we must organise.
We must organise workers in the formal sector, and indeed the informal sector with a view to creating decent formal work with freedom of association, social protection, a minimum wage and collective bargaining as starting points.
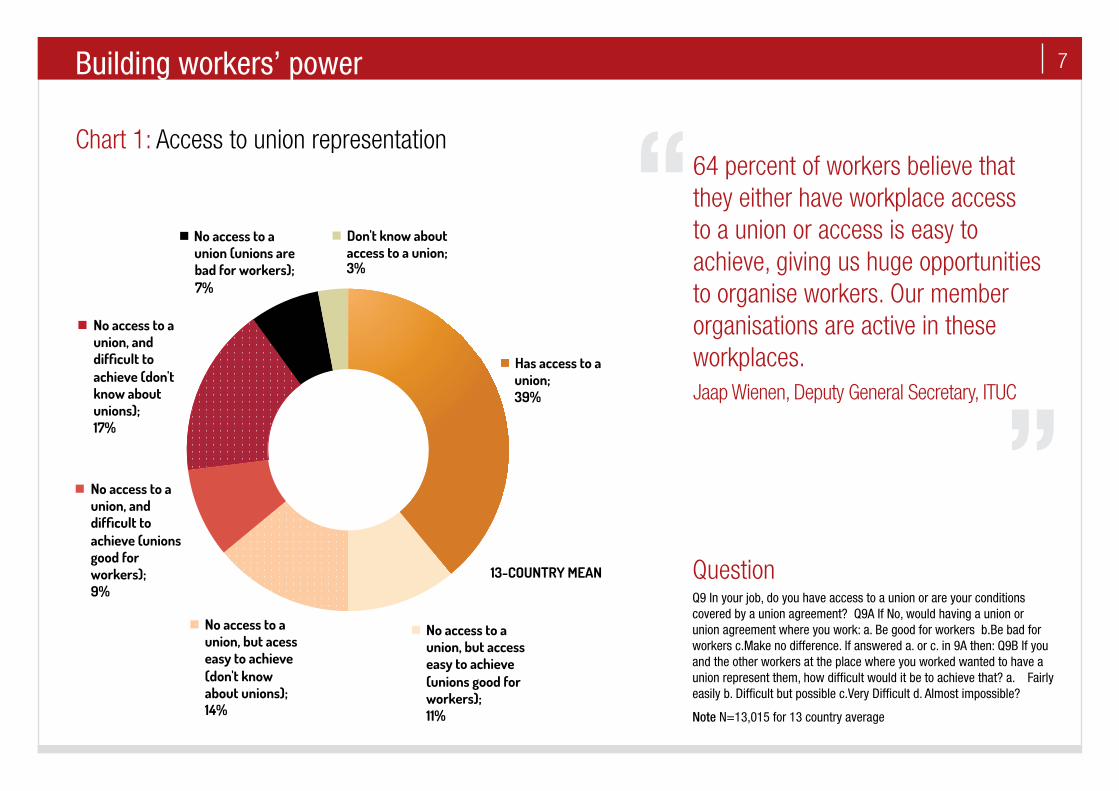
The ITUC Global Poll 2013 shows that 64 percent of workers believe that they either have workplace access to a union or access is easy to achieve. [Chart 1]
39 percent of respondents say that they have either access to a union or have their working conditions covered by a union agreement. Another 25 percent say it would be ‘easy to achieve’ such union coverage. [Chart 1]
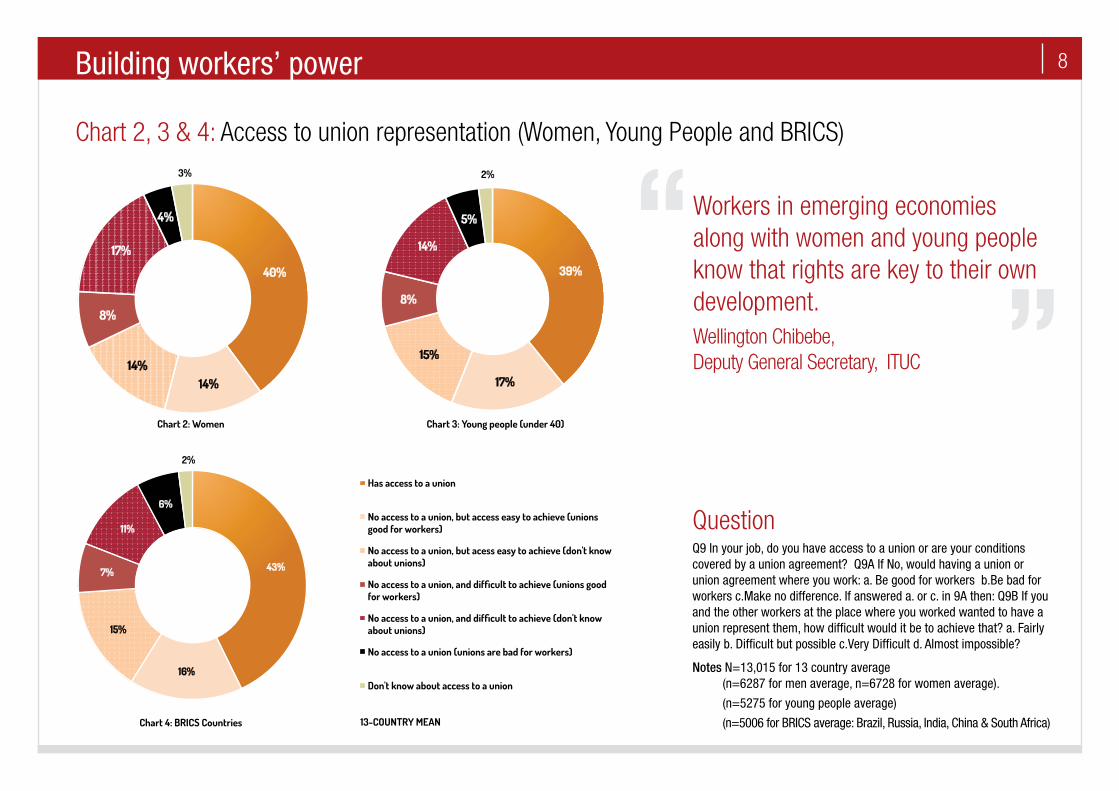
68 percent of women believe they have workplace access or it is easy to achieve. [Chart 2]
71 percent of young people under the age of 40 believe they have workplace access or it is easy to achieve. [Chart 3]
74 percent of people in BRICS countries (Brazil, Russia, India, China and South Africa) believe they have workplace access or it is easy to achieve. [Chart 4]
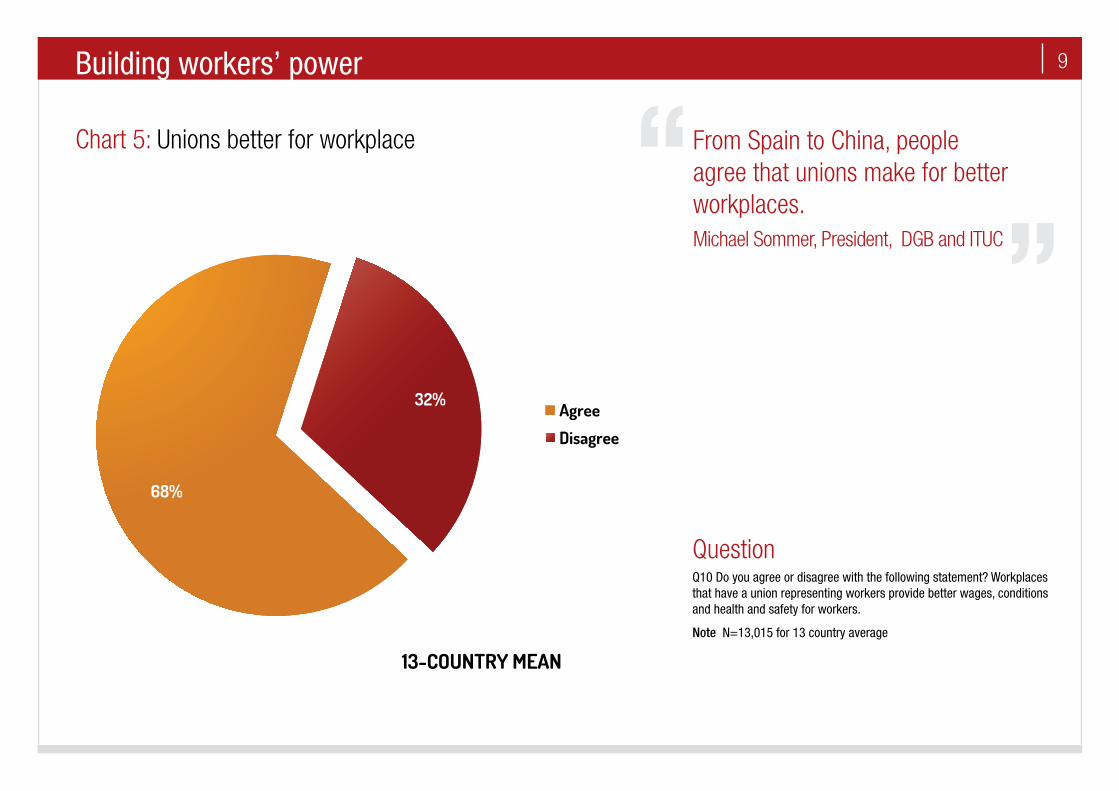
More than two out of three respondents (68 percent) agree that workplaces with a union provide better wages, conditions and health and safety for workers. [Chart 5]
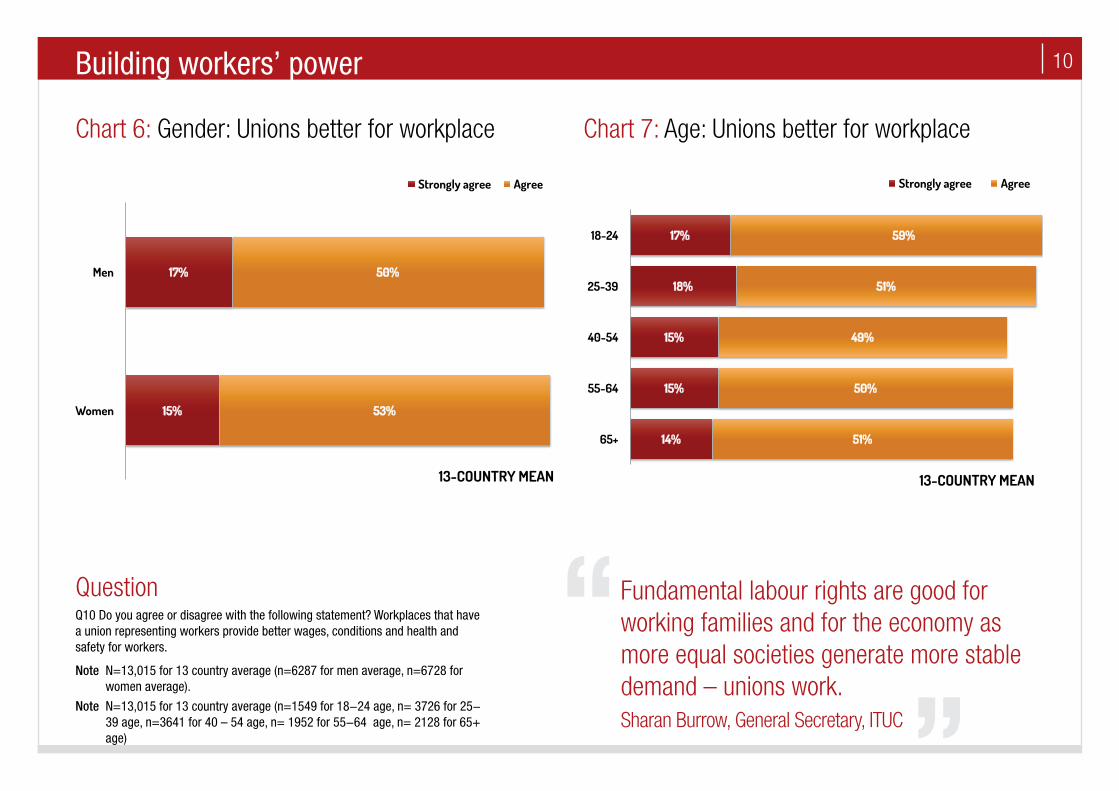
These findings are similar for men and women [Chart 6]. Young people between the ages of 18 and 24 show higher levels of support for unions providing better wages, conditions and health and safety than other age groups. [Chart 7]
Agreement that unions create better work places, combined with the overwhelming support for union values and polices from labour rights to a social protection floor as indicated in the ITUC Global Poll, demonstrates we have the prevailing conditions for a successful organising agenda.
Economic and social outlookThe state of the world for working people and their families is bleak.
Five years since the ‘great recession’ started, the failed policy of austerity has left a legacy of extreme levels of unemployment, rising inequality, the marginalisation of young people and the desperation of a growing informal sector where rules simply don’t apply.
The global economy is no more secure today than it was seven years ago, and we now have a bitter crisis of unemployment and inequality for which leaders have no serious plan.
Global projected growth is 3.1 percent and has been downgraded by the IMF seven times since 2011.
Unemployment in the formal sector is intractable at around 200 million, and youth unemployment is depriving the dignity of work to enormous numbers of our young people.
Executive summary
The ITUC is building the power of workers and organising men, women and young people. We are the opposition to a global attack on workers and their families.
5
Inequality is growing in almost all nations, and wages are amongst the lowest on record as a share of wealth.
Health, public education, transport and public services in general are increasingly denied to those who cannot pay. Tax evasion by large multinational corporations is rampant.
The very best prognosis is that we are living through a period of prolonged stagnation.
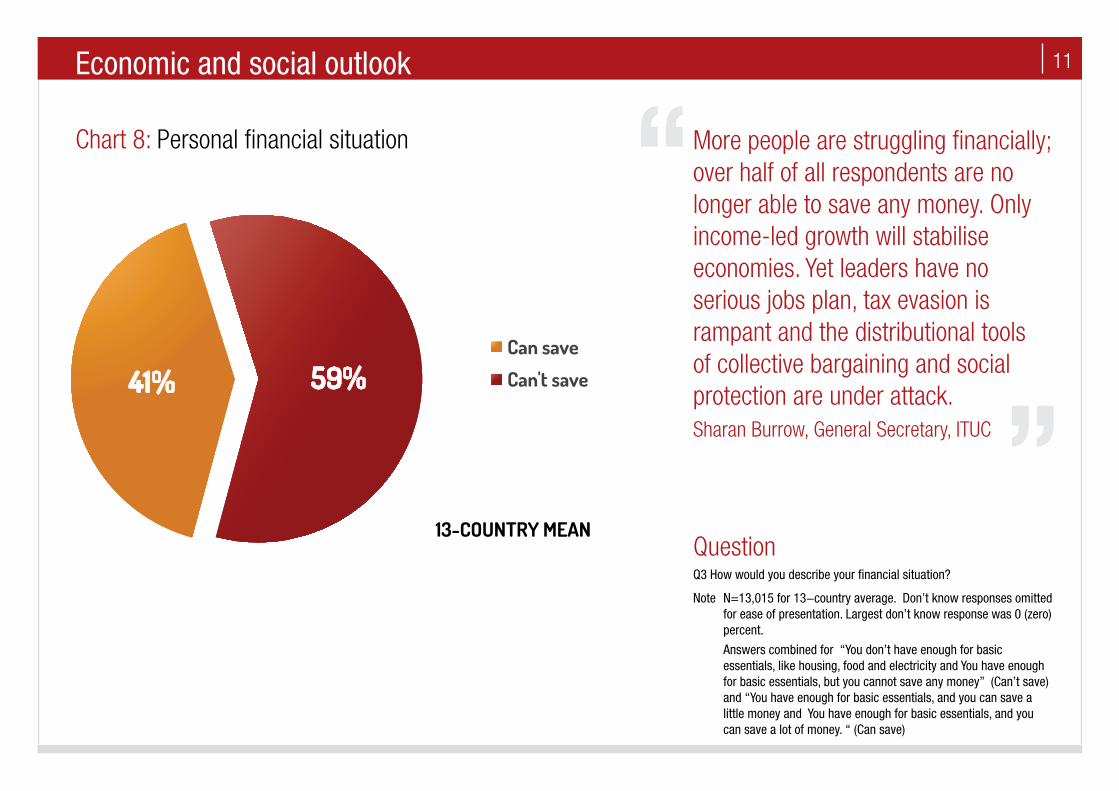
59 percent of people are no longer able to save any money. [Chart 8]
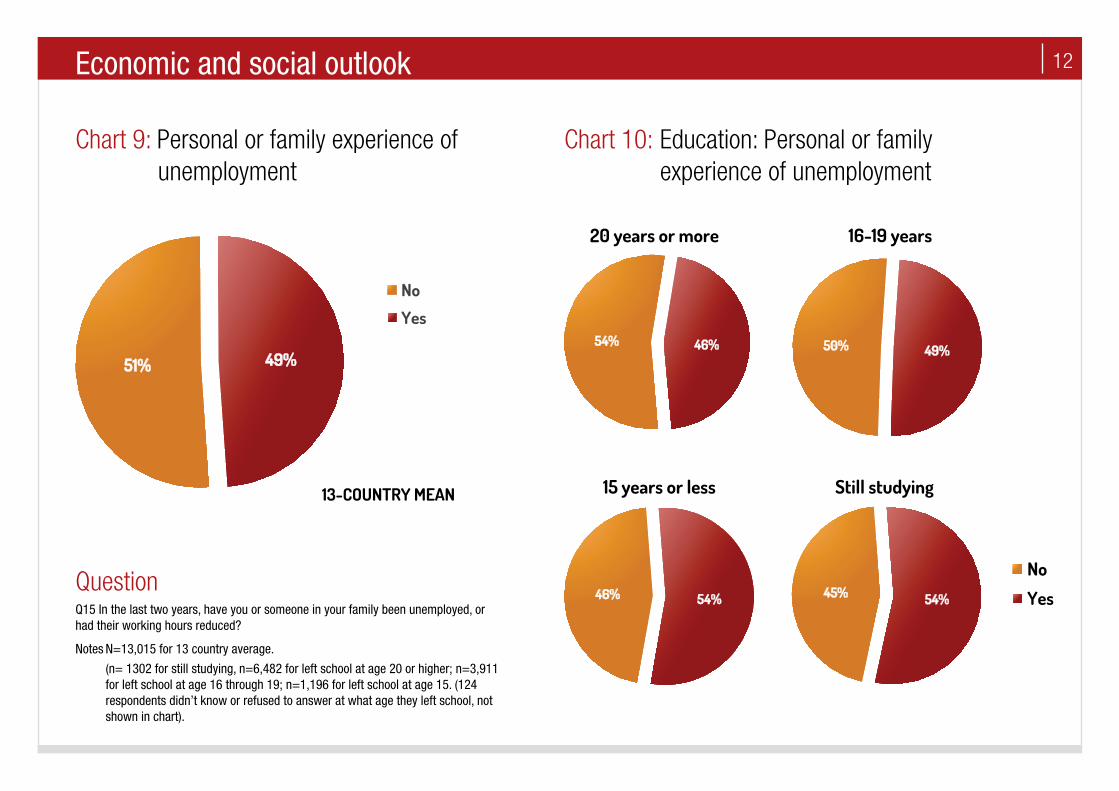
One in two working families are directly impacted by the loss of jobs or reduction of working hours. [Chart 9]
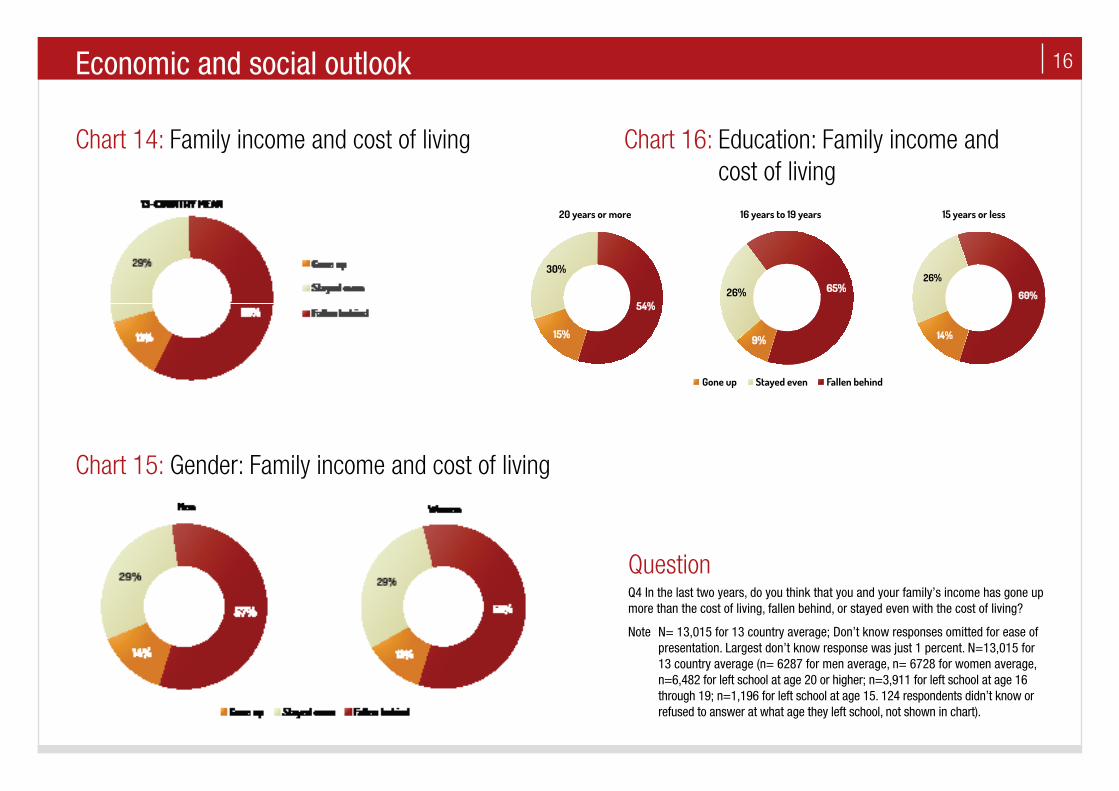
87 percent of people in the ITUC Global Poll 2013 say their wages are falling behind the cost of living or are stagnant. [Chart 14]
Women and those with less access to education have been most affected by the economic crisis.
The number of years spent in education also relates to experience of unemployment or reduction in working hours; those still studying or with less years of education are more affected by job insecurity. [Chart 10]
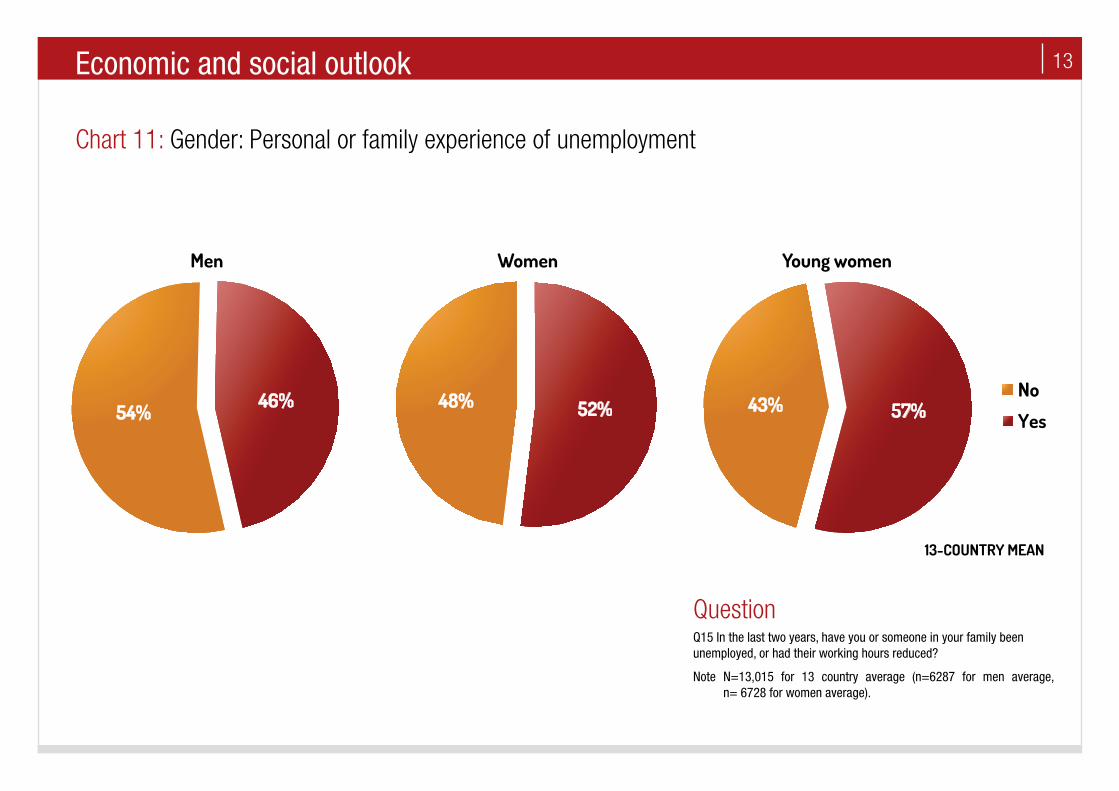
52 percent of women compared with 46 percent of men are directly impacted by the loss of jobs or reduction of working hours. 57 percent of young women have been affected. [Chart 11]
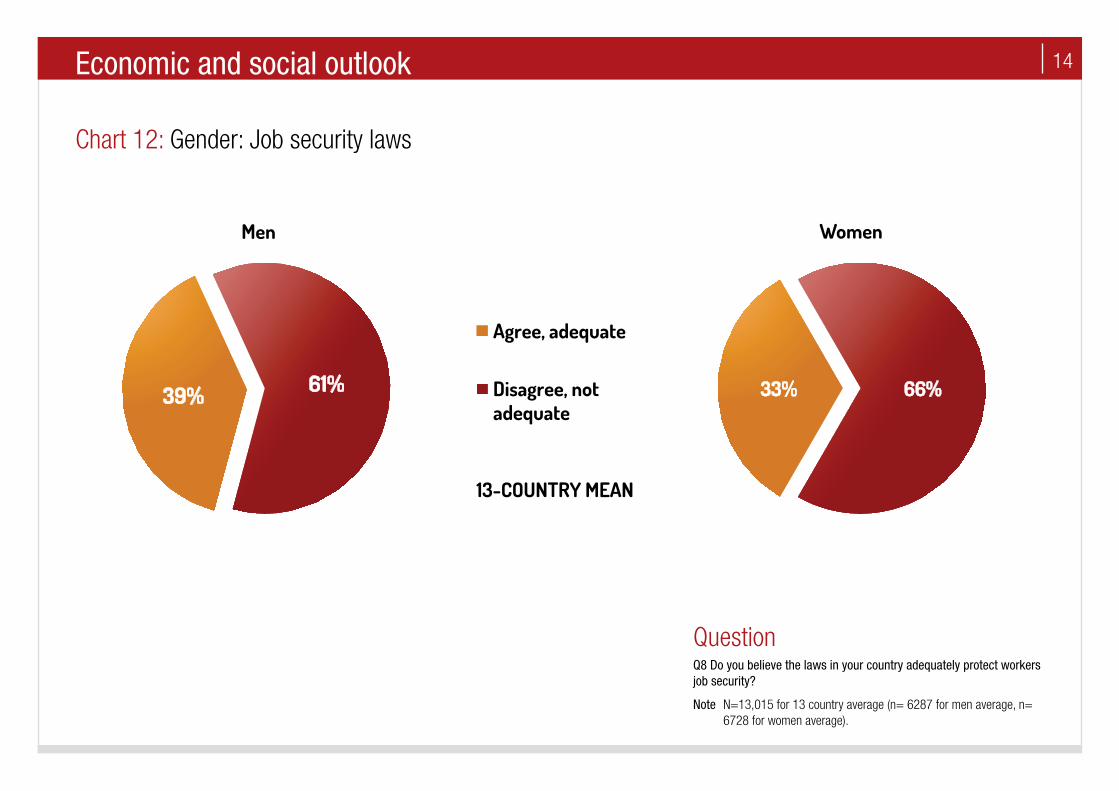
66 percent of women do not think that job security laws protect them compared with 61 percent of men. [Chart 12]
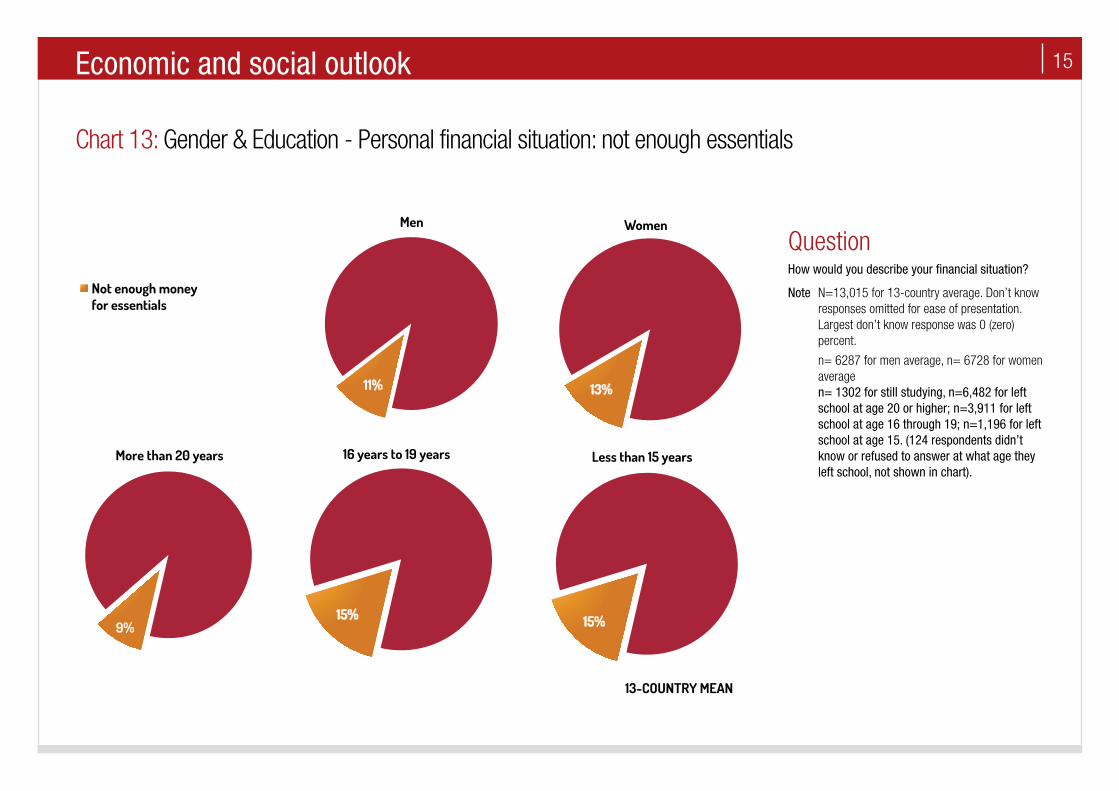
13 percent of women do not have enough money for basic essentials. [Chart 13]
15 percent of people who left school at 15 -19 years of age don’t have enough money for basic essentials compared with 9 percent for people who left after 20 or more years of age. [Chart 13]
Only 12 percent of women have seen their income rise with the cost of living compared with 14 percent of men. [Chart 15]
People with less years of education have seen their income fall behind the cost of living compared with people with more years spent in education. [Chart 16]
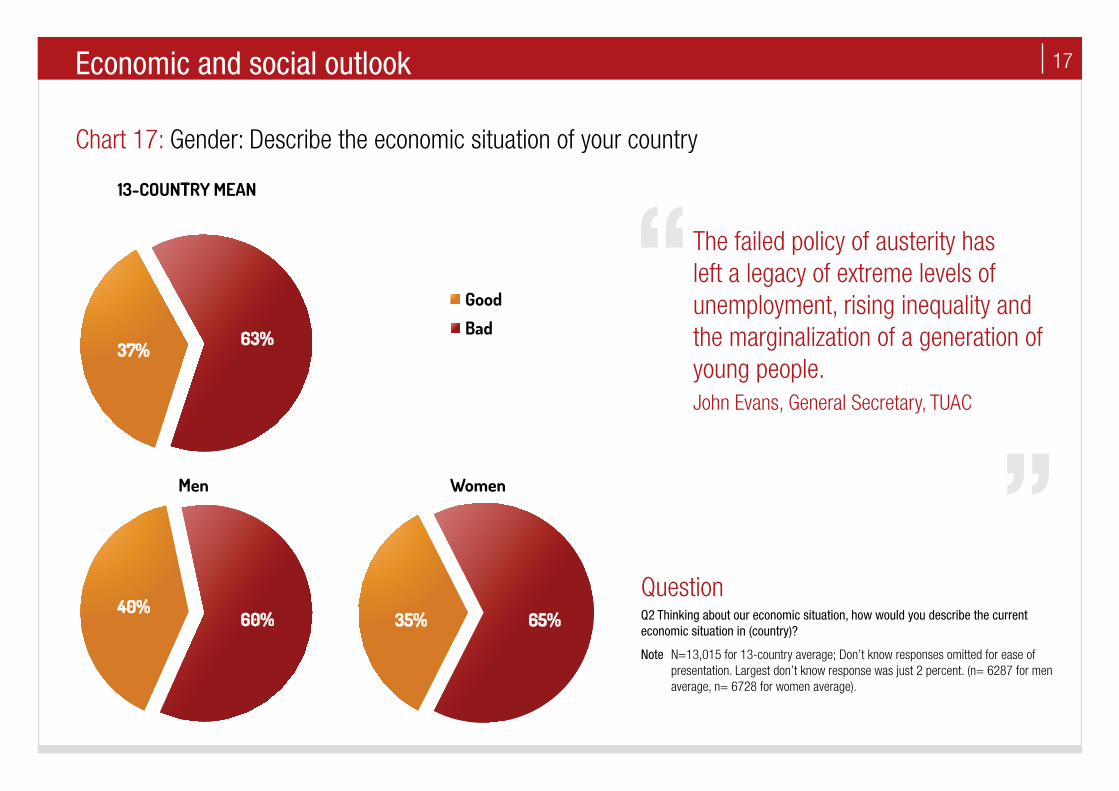
65 percent of women have negative views of the economic situation of their country, compared with 60 percent of men. [Chart 17]
A crisis of political leadershipWe face a global crisis in leadership, as governments lack the political will to act urgently and in cooperation with each other.
Pressure from international organisations has driven countries across Europe into recession, and a slow-down in BRICS nations. In combination, they have gone to war on the rights of workers and put the interests of banks, financial institutions and large corporates ahead of their people.
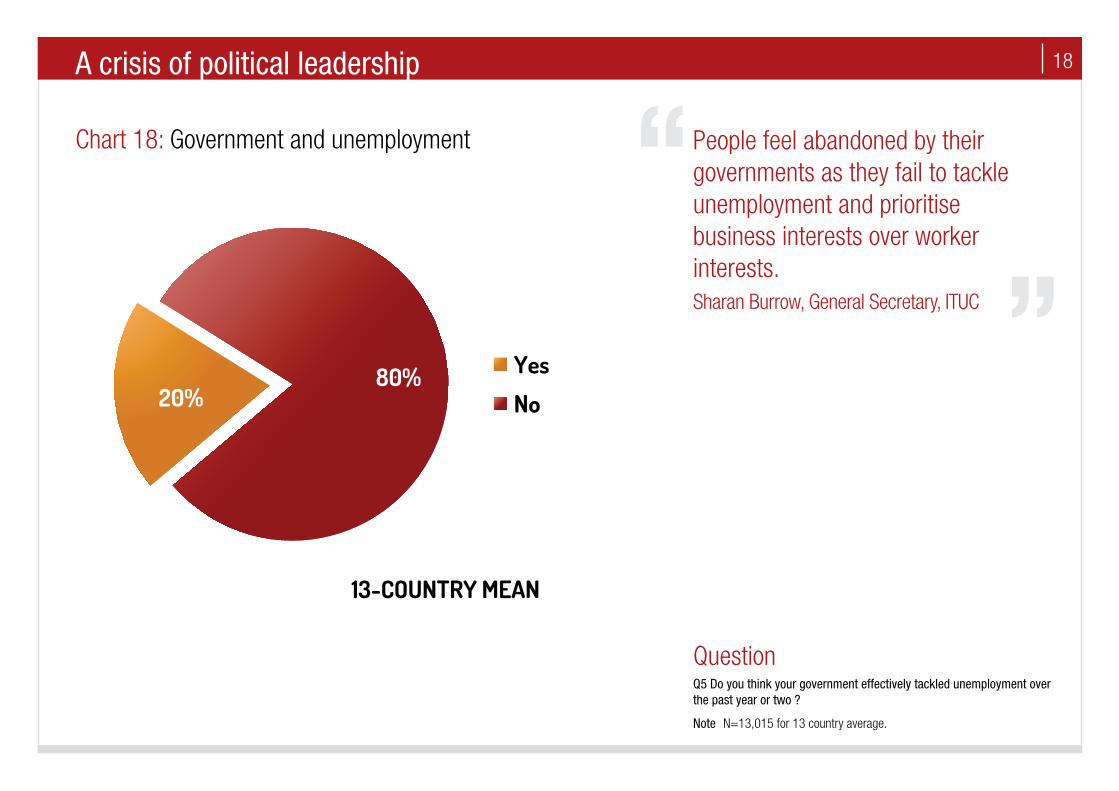
People feel abandoned by their governments. 80 percent of people say their government has failed to tackle unemployment effectively. [Chart 18]
There is a profound mistrust of governments and institutions. Only 13 percent of people think that governments are acting in their interests and 28 percent are disenchanted or worse disengaged with the belief that governments are acting in the interests of neither people nor business. [Chart 19]
Governments and their international institutions have failed to ensure secure and inclusive democracies for people and a sustainable planet for the 21st century.
They have failed to build stable economies, at tremendous cost to working people, their families and communities. They have failed to tackle climate threats.
They have failed to strengthen democracy and deliver on global peace.
People are increasingly losing trust in their governments as they prioritise business interests over the needs, concerns and livelihoods of working people. Women are more disenchanted then men and only 12 percent of women think governments are focused on the interests of working people. [Chart 20]
When considering the direction of a country, an indicator often used to monitor support for a national government, more women hold negative views than men. 54 percent of women think their country is going in the wrong direction. [Chart 21]
The rise of corporate greedBusiness and its political supporters have used the great recession to tip the balance of power firmly towards the large corporations at the expensive of ordinary people and to eradicate decades of progress made by trade unions and other progressive forces, damaging democracy.
Large corporations act in the interests of the few.
The ITUC Global Poll 2013 shows half the world’s population are willing to pay higher prices for reasonable wages for workers. [Chart 24] Even people without real disposable income and facing real inequality still indicate they are willing to pay extra for goods and services provided with decent wages, and direct
Governments and their international institutions have failed to build stable economies at tremendous cost to working people, their families and communities. They have failed to tackle climate threats.
Executive summary (continued)
6
experience of unemployment or reduced working hours has virtually no impact on people’s willingness to pay extra.
Virtually all respondents to the ITUC Global Poll were in support of companies being bound by international labour rules to protect workers and pay a reasonable wage.
95 percent of people agree that “all companies, business and employers should pay workers a reasonable wage regardless of where they work”. [Chart 22]
Likewise 91 percent of people agree that “international companies should be subject to international rules for the working conditions of the employees making their products and services, no matter which country the workers are in”. [Chart 22]
80 percent of people support “international rules that meant workers were better paid by mult-national companies, even if it meant paying a little more for goods and services”. [Chart 22]
The five point plan: an organising agenda for jobs, decent wages and social protectionThe ITUC Global Poll 2013 tells us that people demand what unions offer. Globally citizens support a five point plan towards reducing uncertainty and inequality, a plan offering hope for billions of workers.
A plan for jobs, fair wages, strong labour laws, a social protection floor and more equality with big business paying their fair share of taxes.
These are the issues we must organise in our workplaces and in our communities as we seek to build the power of workers to effect change.
We need to harness the anger and uncertainty that people feel, provide hope with a vision for an alternative future and empower people with a global labour movement for change, a movement with a set of demands that can’t be ignored.
The ITUC is determined to build the power of workers. The uncertainty that people face creates anger and denies hope.
We have a vision for a positive future for working people and their families, with a strong global labour movement that can shape an alternate economic and social future: a movement which can organise and mobilise the full potential of its vast membership united against the vested interests of unregulated capital.
The ITUC is proud of our inclusive global movement of working people, and we stand with them and their families as we build the power of workers to strengthen democracy, demand rights and bargain for a socially just world.
Sharan Burrow, General Secretary International Trade Union Confederation
The five point plan: an organising agenda for jobs, decent wages and social protectionThe ITUC Global Poll 2013 shows global citizens support a five point plan towards reducing uncertainty and inequality, a plan offering hope for billions of workers.
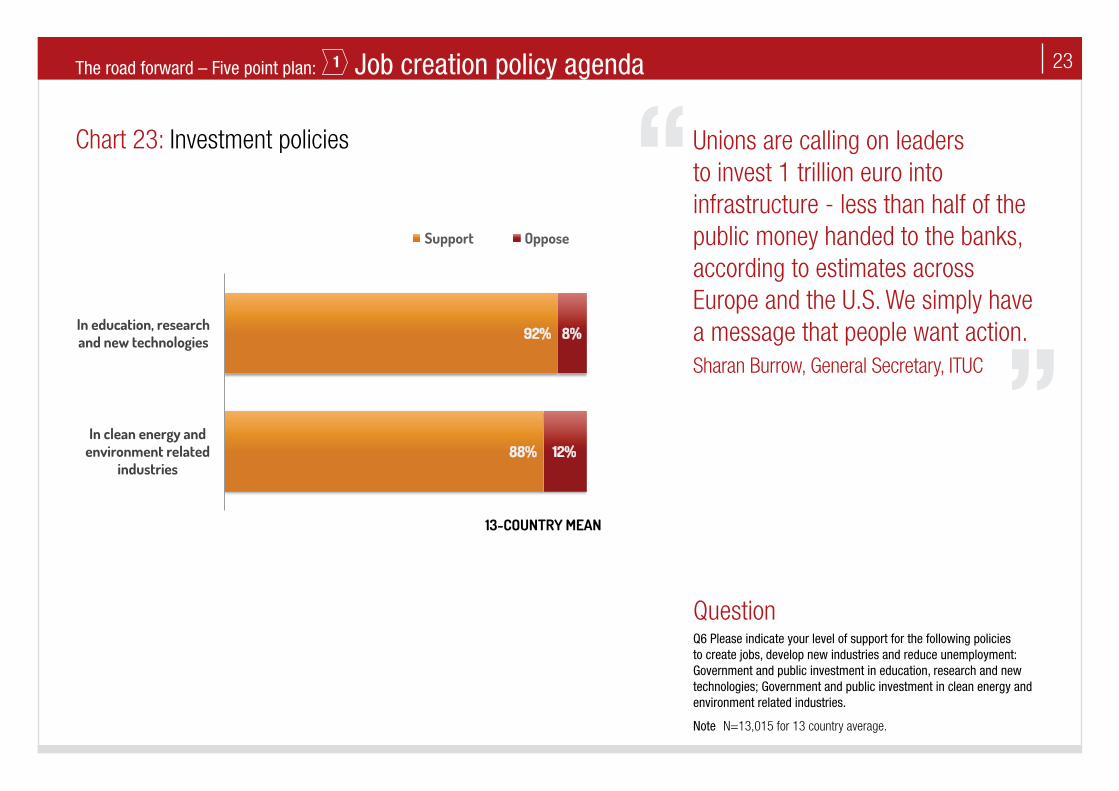
1 Jobs: Investment in infrastructure, new green technologies and industries [Chart 23]
There is overwhelming support for ‘public investment in education, research and new technologies’ (92 percent support) and ‘public investment in clean energy and environment-related industries’ (88 percent support).
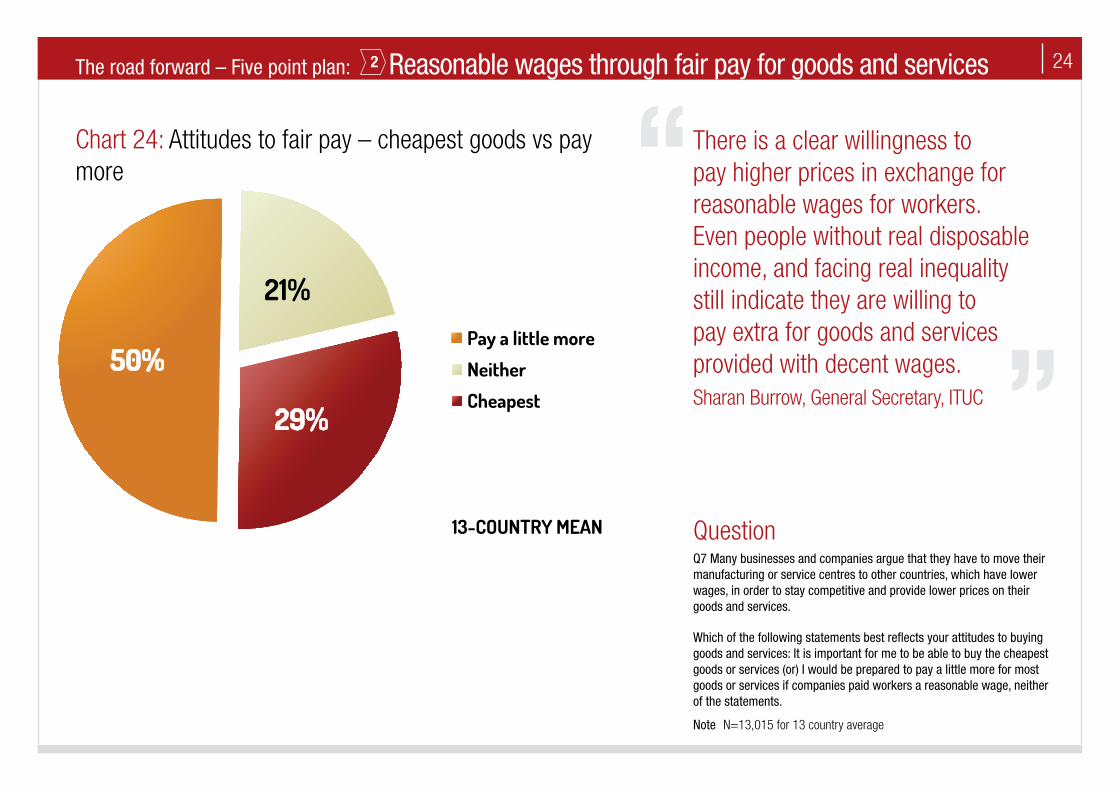
2 Fair wages: ensure reasonable wages through fair prices [Chart 24]
When confronted with the choice between paying the lowest possible price for goods and services and paying ‘a little more for most goods or services if companies paid workers a reasonable wage’, half the world’s population prefer paying a little more to paying the lowest possible price.
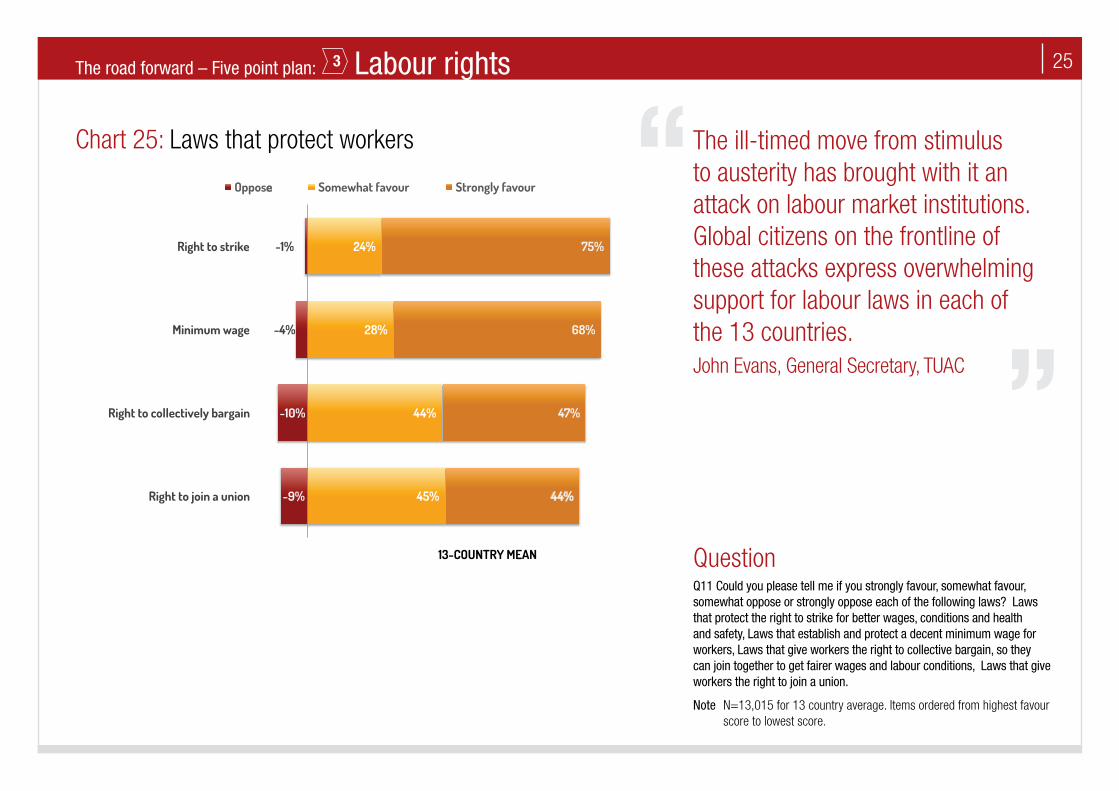
3 Labour rights: adopted and strengthened national and international labour rules [Chart 25]Global citizens continue to express very strong, emotionally anchored support for a wide range of national labour laws and international standards including:
• ‘Therighttostrikeforbetterwages,conditionsandhealthandsafety.’(99percentinfavour,ofwhich75percent‘stronglyfavour’)
• ‘Establishandprotectadecentminimumwage.’(96percentinfavour,ofwhich68percentstrongly)
• ‘Giveworkerstherighttocollectivelybargain.’(91percentinfavour,ofwhich47percentstrongly)
• ‘Giveworkerstherighttojoinaunion’(89percentinfavour,ofwhich44percentstrongly)
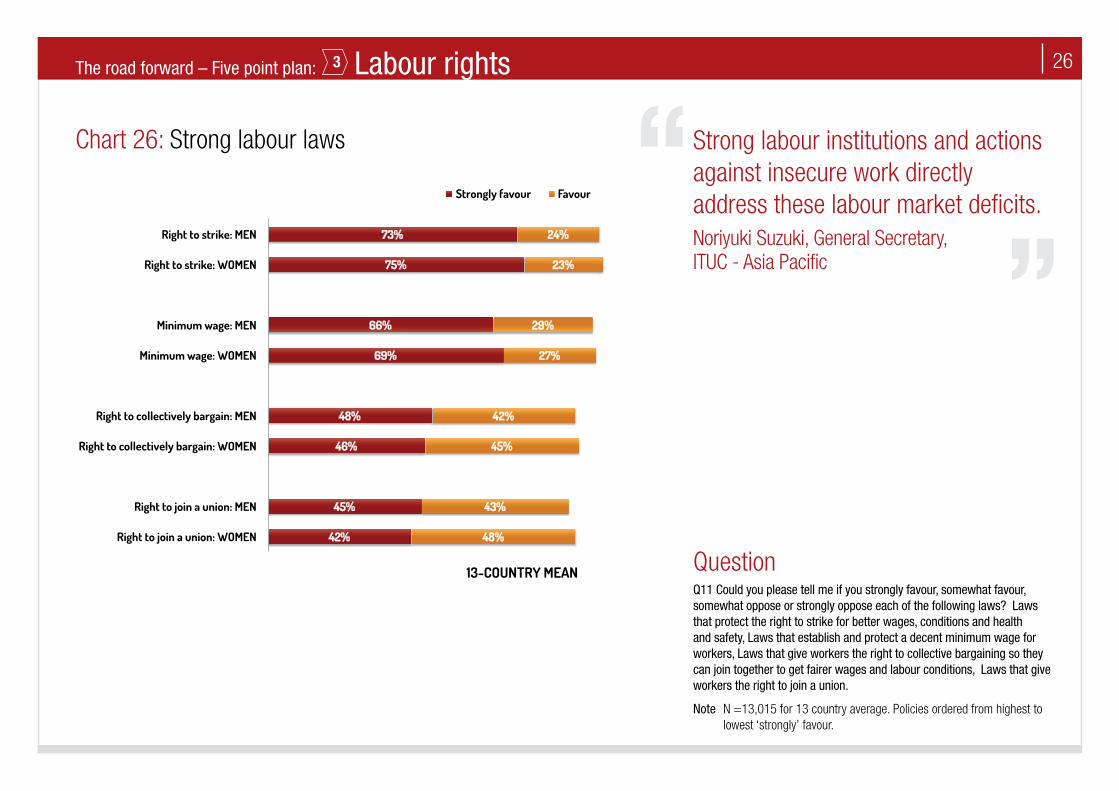
Women show stronger levels of intense support for the right to strike and a decent minimum wage than men. [Chart 26]
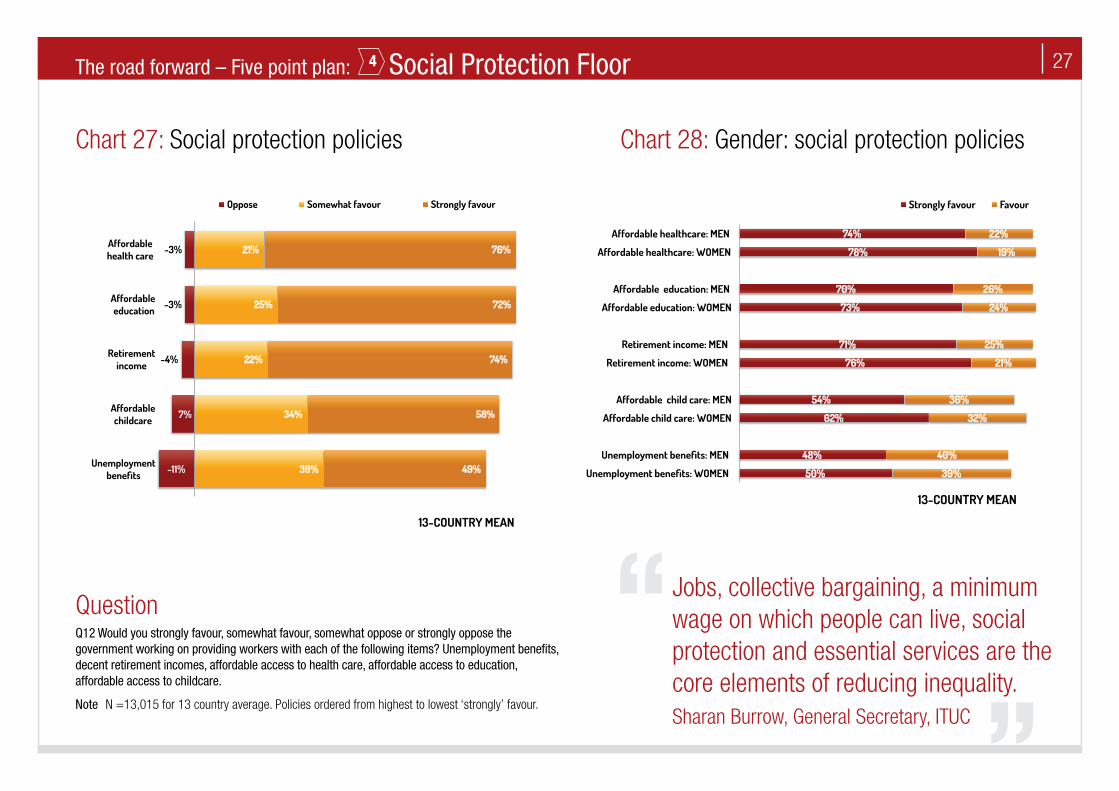
4 A social protection floor: governments step forward to protect the interests of workers and their families [Chart 27] Governments need to step forward and protect the interests of workers and their families to reduce inequality. There is overwhelming global public support for a social protection floor with active income measures. • ‘Affordableaccesstohealthcare.’(97percentinfavour) • ‘Affordableaccesstoeducation.’(97percentinfavour) • ‘Decentretirementincomes.’(96percentinfavour) • ‘Affordableaccesstochildcare.’(92percentinfavour) • ‘Unemploymentbenefits.’(88percentinfavour)Women show stronger levels of support for all elements of a social protection floor than men. In particular 62 percent strongly support affordable access to childcare. Sadly only 54 percent of men indicate strong support for childcare which is critical for women’s participation in the workforce. [Chart 28]
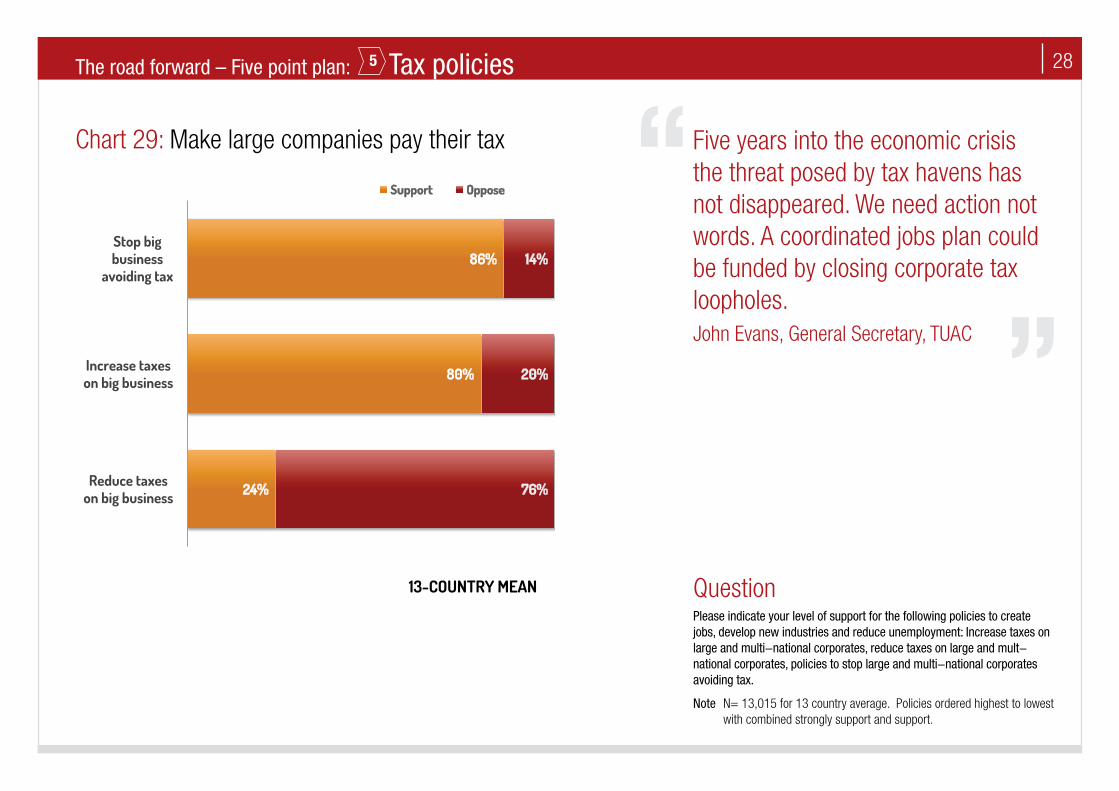
5 Tax policies: Make large and multinational companies pay their taxes [Chart 29]
Global citizens want tax evasion to end. An overwhelming majority of global citizens (86 percent) support policies to stop large and multi-national corporations avoiding tax. 80 percent are open to raising taxes for large companies. People insist on more equality.
Executive summary (continued)
7
Chart 1: Access to union representation
Building workers’ power
Has access to a union; 39%
No access to a union, but access easy to achieve (unions good for workers);11%
No access to a union, and difficult to achieve (unions good for workers);9%
No access to a union, and difficult to achieve (don't know about unions);17%
No access to a union (unions are bad for workers); 7%
Don't know about access to a union; 3%
easy to achieve (don't know about unions); 14%
No access to a union, but acess
13-COUNTRY MEAN QuestionQ9 In your job, do you have access to a union or are your conditions covered by a union agreement? Q9A If No, would having a union or union agreement where you work: a. Be good for workers b.Be bad for workers c.Make no difference. If answered a. or c. in 9A then: Q9B If you and the other workers at the place where you worked wanted to have a union represent them, how difficult would it be to achieve that? a. Fairly easily b. Difficult but possible c.Very Difficult d. Almost impossible?
Note N=13,015 for 13 country average
64 percent of workers believe that they either have workplace access to a union or access is easy to achieve, giving us huge opportunities to organise workers. Our member organisations are active in these workplaces.Jaap Wienen, Deputy General Secretary, ITUC
8
Chart 2, 3 & 4: Access to union representation (Women, Young People and BRICS)
Building workers’ power
43%
16%
15%
7%
11%
6%
2%
Chart 4: BRICS Countries
Has access to a union
No access to a union, but access easy to achieve (unions good for workers)
No access to a union, but acess easy to achieve (don't know about unions)
No access to a union, and difficult to achieve (unions good for workers)
No access to a union, and difficult to achieve (don't know about unions)
No access to a union (unions are bad for workers)
Don't know about access to a union
39%
17%
15%
8%
14%
5%
2%
Chart 3: Young people (under 40)
40%
14% 14%
8%
17%
4%
3%
Chart 2: Women
13-COUNTRY MEAN
QuestionQ9 In your job, do you have access to a union or are your conditions covered by a union agreement? Q9A If No, would having a union or union agreement where you work: a. Be good for workers b.Be bad for workers c.Make no difference. If answered a. or c. in 9A then: Q9B If you and the other workers at the place where you worked wanted to have a union represent them, how difficult would it be to achieve that? a. Fairly easily b. Difficult but possible c.Very Difficult d. Almost impossible?
Notes N=13,015 for 13 country average (n=6287 for men average, n=6728 for women average).
(n=5275 for young people average)
(n=5006 for BRICS average: Brazil, Russia, India, China & South Africa)
Workers in emerging economies along with women and young people know that rights are key to their own development.Wellington Chibebe, Deputy General Secretary, ITUC
9
Chart 5: Unions better for workplace
68%
13-COUNTRY MEAN
Agree
Disagree
32%
From Spain to China, people agree that unions make for better workplaces.Michael Sommer, President, DGB and ITUC
QuestionQ10 Do you agree or disagree with the following statement? Workplaces that have a union representing workers provide better wages, conditions and health and safety for workers.
Note N=13,015 for 13 country average
Building workers’ power
10
QuestionQ10 Do you agree or disagree with the following statement? Workplaces that have a union representing workers provide better wages, conditions and health and safety for workers.
Note N=13,015 for 13 country average (n=6287 for men average, n=6728 for women average).
Note N=13,015 for 13 country average (n=1549 for 18-24 age, n= 3726 for 25-39 age, n=3641 for 40 – 54 age, n= 1952 for 55-64 age, n= 2128 for 65+ age)
Chart 6: Gender: Unions better for workplace Chart 7: Age: Unions better for workplace
14%
15%
15%
18%
17%
51%
50%
49%
51%
59%
65+
55-64
40-54
25-39
18-24
13-COUNTRY MEAN
Strongly agree Agree
17%
15%
50%
53%
Men
Women
13-COUNTRY MEAN
Strongly agree Agree
14%
15%
15%
18%
17%
51%
50%
49%
51%
59%
65+
55-64
40-54
25-39
18-24
13-COUNTRY MEAN
Strongly agree Agree
17%
15%
50%
53%
Men
Women
13-COUNTRY MEAN
Strongly agree Agree
Fundamental labour rights are good for working families and for the economy as more equal societies generate more stable demand – unions work. Sharan Burrow, General Secretary, ITUC
Building workers’ power
11
More people are struggling financially; over half of all respondents are no longer able to save any money. Only income-led growth will stabilise economies. Yet leaders have no serious jobs plan, tax evasion is rampant and the distributional tools of collective bargaining and social protection are under attack. Sharan Burrow, General Secretary, ITUC
Chart 8: Personal financial situation
41% 59%
13-COUNTRY MEAN
Can save
Can't save
T
QuestionQ3 How would you describe your financial situation?
Note N=13,015 for 13-country average. Don’t know responses omitted for ease of presentation. Largest don’t know response was 0 (zero) percent.
Answers combined for “You don’t have enough for basic essentials, like housing, food and electricity and You have enough for basic essentials, but you cannot save any money” (Can’t save) and “You have enough for basic essentials, and you can save a little money and You have enough for basic essentials, and you can save a lot of money. “ (Can save)
Economic and social outlook
12
QuestionQ15 In the last two years, have you or someone in your family been unemployed, or had their working hours reduced?
Notes N=13,015 for 13 country average.
(n= 1302 for still studying, n=6,482 for left school at age 20 or higher; n=3,911 for left school at age 16 through 19; n=1,196 for left school at age 15. (124 respondents didn’t know or refused to answer at what age they left school, not shown in chart).
Chart 9: Personal or family experience of unemployment
Chart 10: Education: Personal or family experience of unemployment
51% 49%
13-COUNTRY MEAN
No
Yes
45% 54%
Still studying
54% 46%
20 years or more
50% 49%
16-19 years
46% 54%
No
Yes
15 years or less
Economic and social outlook
13
Chart 11: Gender: Personal or family experience of unemployment
54% 46%
Men
48% 52%
Women
43% 57%
Young women
No
Yes
13-COUNTRY MEAN
QuestionQ15 In the last two years, have you or someone in your family been unemployed, or had their working hours reduced?
Note N=13,015 for 13 country average (n=6287 for men average, n= 6728 for women average).
Economic and social outlook
14
QuestionQ8 Do you believe the laws in your country adequately protect workers job security?
Note N=13,015 for 13 country average (n= 6287 for men average, n= 6728 for women average).
Chart 12: Gender: Job security laws
39% 61%
Men
Agree, adequate
Disagree, not adequate
33% 66%
Women
13-COUNTRY MEAN
Economic and social outlook
15
QuestionHow would you describe your financial situation?
Note N=13,015 for 13-country average. Don’t know responses omitted for ease of presentation. Largest don’t know response was 0 (zero) percent.
n= 6287 for men average, n= 6728 for women average n= 1302 for still studying, n=6,482 for left school at age 20 or higher; n=3,911 for left school at age 16 through 19; n=1,196 for left school at age 15. (124 respondents didn’t know or refused to answer at what age they left school, not shown in chart).
Chart 13: Gender & Education - Personal financial situation: not enough essentials
11%
Men
Not enough moneyfor essentials
13%
Women
9%
More than 20 years
15%
16 years to 19 years
15%
Less than 15 years
13-COUNTRY MEAN
Economic and social outlook
16
QuestionQ4 In the last two years, do you think that you and your family’s income has gone up more than the cost of living, fallen behind, or stayed even with the cost of living?
Note N= 13,015 for 13 country average; Don’t know responses omitted for ease of presentation. Largest don’t know response was just 1 percent. N=13,015 for 13 country average (n= 6287 for men average, n= 6728 for women average, n=6,482 for left school at age 20 or higher; n=3,911 for left school at age 16 through 19; n=1,196 for left school at age 15. 124 respondents didn’t know or refused to answer at what age they left school, not shown in chart).
Chart 14: Family income and cost of living Chart 16: Education: Family income and cost of living
13%
29%
58%
13-COUNTRY MEAN
Gone up
Stayed even
Fallen behind
12%
29%
58%
Women
14%
29%
57%
Men
9%
26% 65%
16 years to 19 years
15%
30%
54%
20 years or more
14%
26%
60%
15 years or less
Gone up Stayed even Fallen behind
Gone up Stayed even Fallen behind
Economic and social outlook
Chart 15: Gender: Family income and cost of living
17
QuestionQ2 Thinking about our economic situation, how would you describe the current economic situation in (country)?
Note N=13,015 for 13-country average; Don’t know responses omitted for ease of presentation. Largest don’t know response was just 2 percent. (n= 6287 for men average, n= 6728 for women average).
Chart 17: Gender: Describe the economic situation of your country
The failed policy of austerity has left a legacy of extreme levels of unemployment, rising inequality and the marginalization of a generation of young people. John Evans, General Secretary, TUAC
40% 60%
Men
35% 65%
Women
37% 63%
13-COUNTRY MEAN
Good
Bad
Economic and social outlook
18
QuestionQ5 Do you think your government effectively tackled unemployment over the past year or two ?
Note N=13,015 for 13 country average.
Chart 18: Government and unemployment People feel abandoned by their governments as they fail to tackle unemployment and prioritise business interests over worker interests. Sharan Burrow, General Secretary, ITUC
20% 80%
13-COUNTRY MEAN
Yes
No
A crisis of political leadership
19
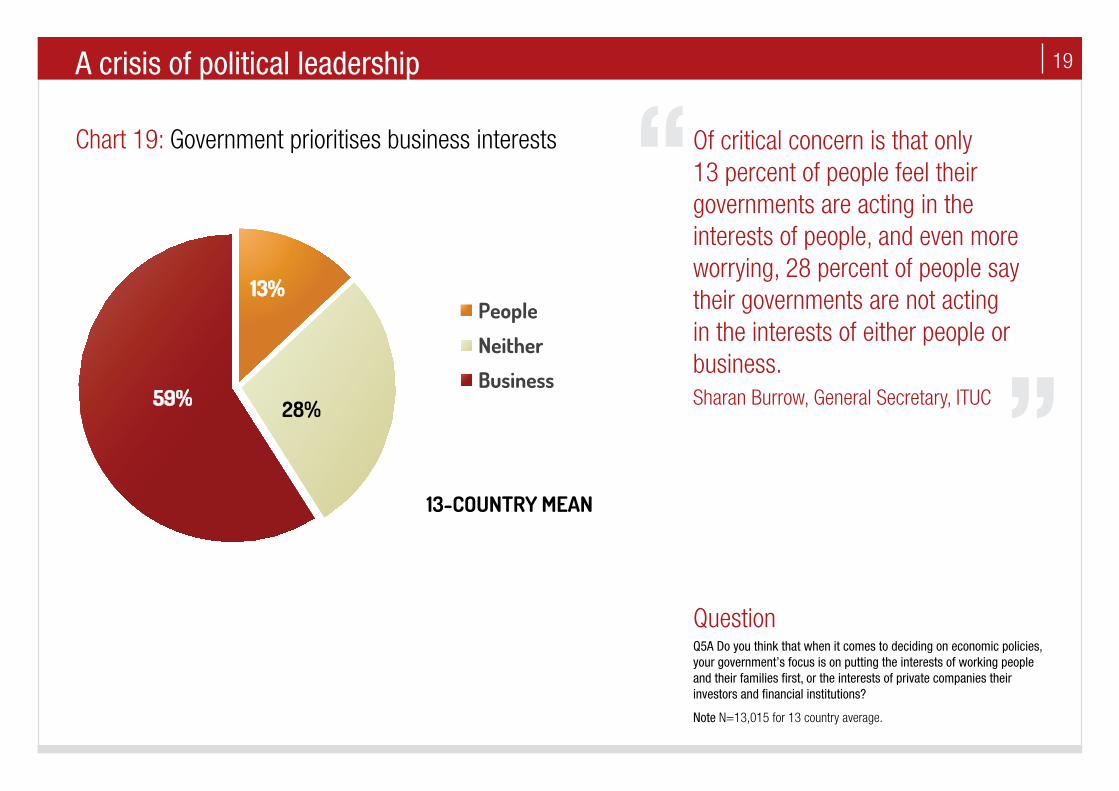
QuestionQ5A Do you think that when it comes to deciding on economic policies, your government’s focus is on putting the interests of working people and their families first, or the interests of private companies their investors and financial institutions?
Note N=13,015 for 13 country average.
Chart 19: Government prioritises business interests Of critical concern is that only 13 percent of people feel their governments are acting in the interests of people, and even more worrying, 28 percent of people say their governments are not acting in the interests of either people or business. Sharan Burrow, General Secretary, ITUC
13%
28% 59%
13-COUNTRY MEAN
People
Neither
Business
A crisis of political leadership
20
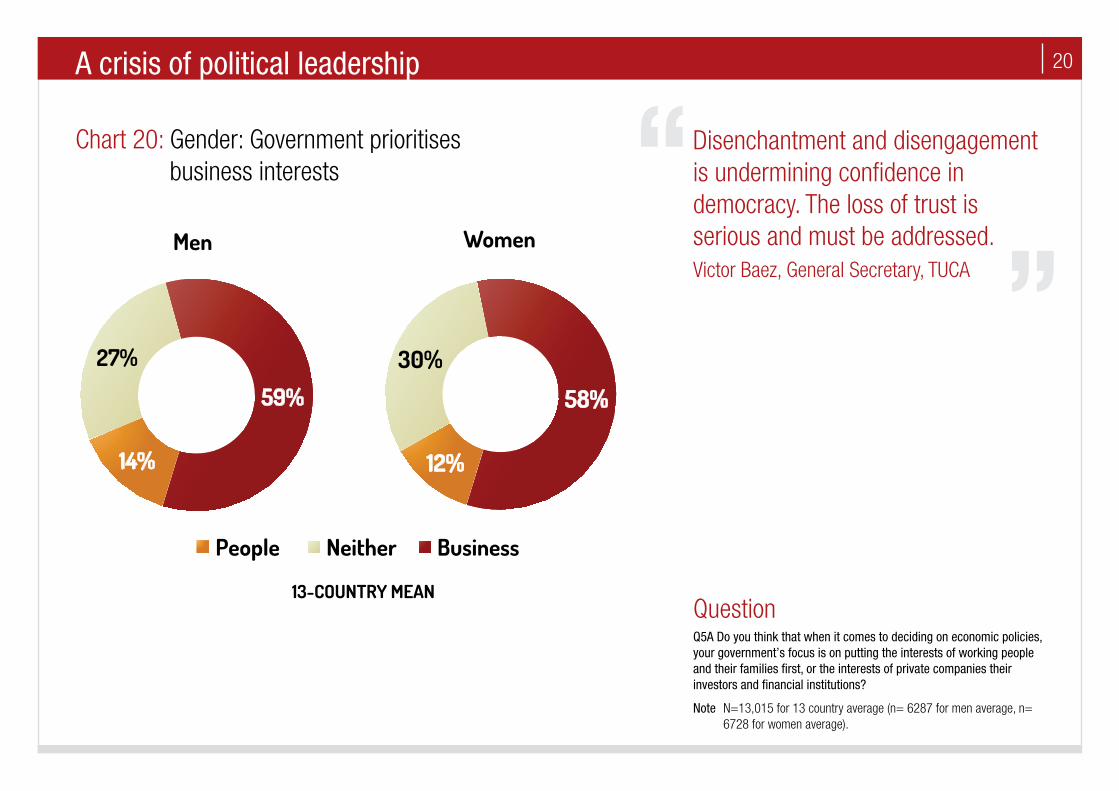
QuestionQ5A Do you think that when it comes to deciding on economic policies, your government’s focus is on putting the interests of working people and their families first, or the interests of private companies their investors and financial institutions?
Note N=13,015 for 13 country average (n= 6287 for men average, n= 6728 for women average).
Chart 20: Gender: Government prioritises business interests
Disenchantment and disengagement is undermining confidence in democracy. The loss of trust is serious and must be addressed. Victor Baez, General Secretary, TUCA
12%
30%
58%
Women
People Neither Business
14%
27%
59%
Men
13-COUNTRY MEAN
A crisis of political leadership
21
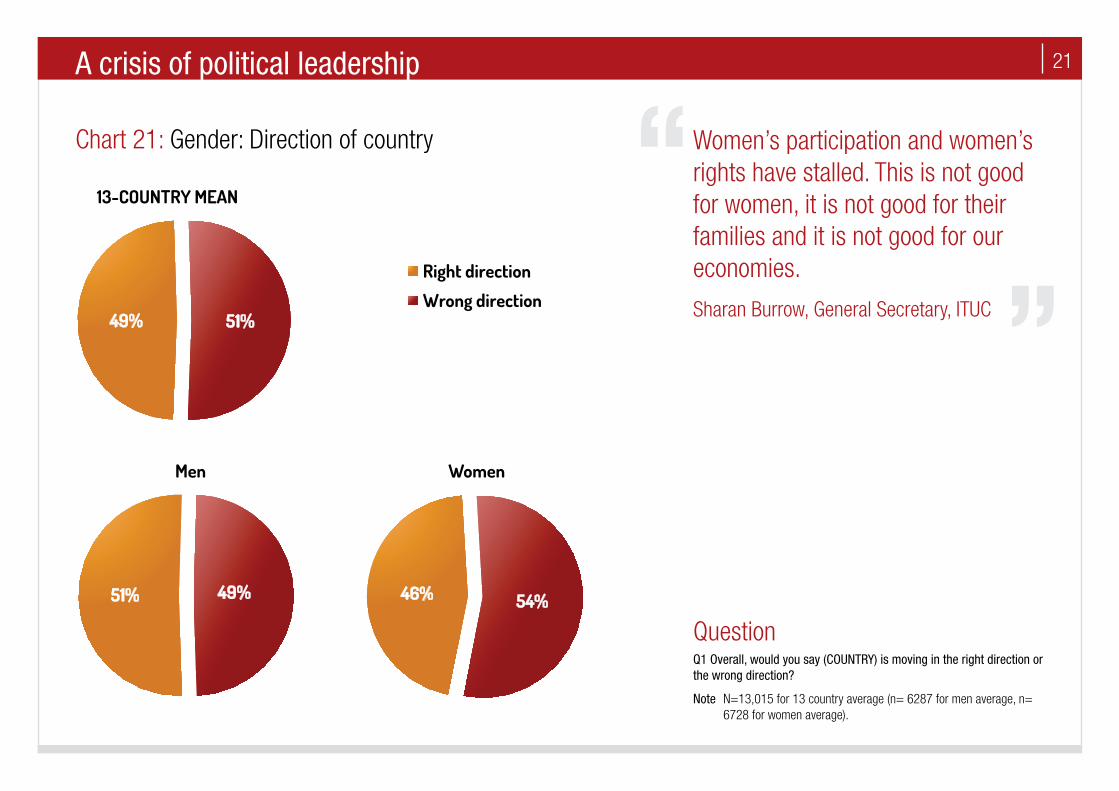
QuestionQ1 Overall, would you say (COUNTRY) is moving in the right direction or the wrong direction?
Note N=13,015 for 13 country average (n= 6287 for men average, n= 6728 for women average).
Chart 21: Gender: Direction of country Women’s participation and women’s rights have stalled. This is not good for women, it is not good for their families and it is not good for our economies.
Sharan Burrow, General Secretary, ITUC
51% 49%
Men
46% 54%
Women
49% 51%
13-COUNTRY MEAN
Right direction
Wrong direction
A crisis of political leadership
22
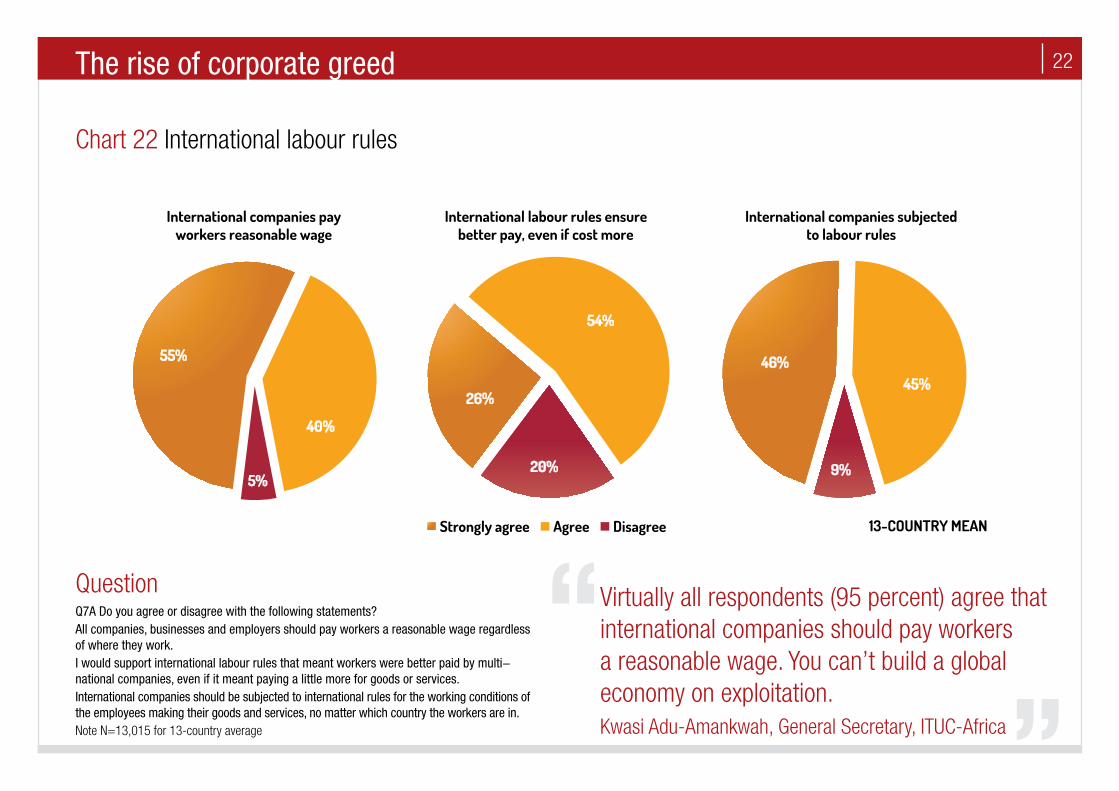
Chart 22 International labour rules
The rise of corporate greed
55%
40%
5%
International companies pay workers reasonable wage
Strongly agree Agree Disagree
26%
54%
20%
International labour rules ensure better pay, even if cost more
46% 45%
9%
International companies subjected to labour rules
13-COUNTRY MEAN
Virtually all respondents (95 percent) agree that international companies should pay workers a reasonable wage. You can’t build a global economy on exploitation. Kwasi Adu-Amankwah, General Secretary, ITUC-Africa
QuestionQ7A Do you agree or disagree with the following statements?All companies, businesses and employers should pay workers a reasonable wage regardless of where they work.I would support international labour rules that meant workers were better paid by multi-national companies, even if it meant paying a little more for goods or services.International companies should be subjected to international rules for the working conditions of the employees making their goods and services, no matter which country the workers are in.Note N=13,015 for 13-country average
23
Chart 23: Investment policies
The road forward – Five point plan: Job creation policy agenda
92%
88%
8%
12%
In education, research and new technologies
In clean energy and environment related
industries
13-COUNTRY MEAN
Support Oppose
Unions are calling on leaders to invest 1 trillion euro into infrastructure - less than half of the public money handed to the banks, according to estimates across Europe and the U.S. We simply have a message that people want action. Sharan Burrow, General Secretary, ITUC
QuestionQ6 Please indicate your level of support for the following policies to create jobs, develop new industries and reduce unemployment: Government and public investment in education, research and new technologies; Government and public investment in clean energy and environment related industries.
Note N=13,015 for 13 country average.
1
24
Chart 24: Attitudes to fair pay – cheapest goods vs pay more
The road forward – Five point plan: Reasonable wages through fair pay for goods and services
There is a clear willingness to pay higher prices in exchange for reasonable wages for workers. Even people without real disposable income, and facing real inequality still indicate they are willing to pay extra for goods and services provided with decent wages. Sharan Burrow, General Secretary, ITUC
QuestionQ7 Many businesses and companies argue that they have to move their manufacturing or service centres to other countries, which have lower wages, in order to stay competitive and provide lower prices on their goods and services.
Which of the following statements best reflects your attitudes to buying goods and services: It is important for me to be able to buy the cheapest goods or services (or) I would be prepared to pay a little more for most goods or services if companies paid workers a reasonable wage, neither of the statements.
Note N=13,015 for 13 country average
2
50%
21%
29%
13-COUNTRY MEAN
Pay a little more
Neither
Cheapest
25
Chart 25: Laws that protect workers
-1%
-4%
-10%
-9%
24%
28%
44%
45%
75%
68%
47%
44%
Right to strike
Minimum wage
Right to collectively bargain
Right to join a union
13-COUNTRY MEAN
Oppose Somewhat favour Strongly favour
The ill-timed move from stimulus to austerity has brought with it an attack on labour market institutions. Global citizens on the frontline of these attacks express overwhelming support for labour laws in each of the 13 countries. John Evans, General Secretary, TUAC
QuestionQ11 Could you please tell me if you strongly favour, somewhat favour, somewhat oppose or strongly oppose each of the following laws? Laws that protect the right to strike for better wages, conditions and health and safety, Laws that establish and protect a decent minimum wage for workers, Laws that give workers the right to collective bargain, so they can join together to get fairer wages and labour conditions, Laws that give workers the right to join a union.
Note N=13,015 for 13 country average. Items ordered from highest favour score to lowest score.
The road forward – Five point plan: Labour rights3
26
Chart 26: Strong labour laws
73%
75%
66%
69%
48%
46%
45%
42%
24%
23%
29%
27%
42%
45%
43%
48%
Right to strike: MEN
Right to strike: WOMEN
Minimum wage: MEN
Minimum wage: WOMEN
Right to collectively bargain: MEN
Right to collectively bargain: WOMEN
Right to join a union: MEN
Right to join a union: WOMEN
13-COUNTRY MEAN
Strongly favour Favour
Strong labour institutions and actions against insecure work directly address these labour market deficits. Noriyuki Suzuki, General Secretary, ITUC - Asia Pacific
QuestionQ11 Could you please tell me if you strongly favour, somewhat favour, somewhat oppose or strongly oppose each of the following laws? Laws that protect the right to strike for better wages, conditions and health and safety, Laws that establish and protect a decent minimum wage for workers, Laws that give workers the right to collective bargaining so they can join together to get fairer wages and labour conditions, Laws that give workers the right to join a union.
Note N =13,015 for 13 country average. Policies ordered from highest to lowest ‘strongly’ favour.
The road forward – Five point plan: Labour rights3
27
Chart 27: Social protection policies
Jobs, collective bargaining, a minimum wage on which people can live, social protection and essential services are the core elements of reducing inequality. Sharan Burrow, General Secretary, ITUC
QuestionQ12 Would you strongly favour, somewhat favour, somewhat oppose or strongly oppose the government working on providing workers with each of the following items? Unemployment benefits, decent retirement incomes, affordable access to health care, affordable access to education, affordable access to childcare.
Note N =13,015 for 13 country average. Policies ordered from highest to lowest ‘strongly’ favour.
The road forward – Five point plan: Social Protection Floor4
-3%
-3%
-4%
-7%
-11%
21%
25%
22%
34%
39%
76%
72%
74%
58%
49%
Affordable health care
Affordable education
Retirement income
Affordable childcare
Unemployment benefits
13-COUNTRY MEAN
Oppose Somewhat favour Strongly favour
74%
78%
70%
73%
71%
76%
54%
62%
48%
50%
22%
19%
26%
24%
25%
21%
36%
32%
40%
39%
Affordable healthcare: MEN
Affordable healthcare: WOMEN
Affordable education: MEN
Affordable education: WOMEN
Retirement income: MEN
Retirement income: WOMEN
Affordable child care: MEN
Affordable child care: WOMEN
Unemployment benefits: MEN
Unemployment benefits: WOMEN
13-COUNTRY MEAN
Strongly favour Favour
Chart 28: Gender: social protection policies
28
Chart 29: Make large companies pay their tax
86%
80%
24%
14%
20%
76%
Stop big business
avoiding tax
Increase taxes on big business
Reduce taxes on big business
13-COUNTRY MEAN
Support Oppose t
Five years into the economic crisis the threat posed by tax havens has not disappeared. We need action not words. A coordinated jobs plan could be funded by closing corporate tax loopholes. John Evans, General Secretary, TUAC
QuestionPlease indicate your level of support for the following policies to create jobs, develop new industries and reduce unemployment: Increase taxes on large and multi-national corporates, reduce taxes on large and mult-national corporates, policies to stop large and multi-national corporates avoiding tax.
Note N= 13,015 for 13 country average. Policies ordered highest to lowest with combined strongly support and support.
The road forward – Five point plan: Tax policies5
29
This project covers the adult (18 years and over) populations of Belgium, Brazil, Canada, China, France, Germany, India, Japan, Russia, South Africa, Spain, the UK and the USA.
Essential Research constructed the survey in consultation with TNS Opinion and the ITUC.
TNS Opinion conducted the survey fieldwork through local partners Lightspeed Research. TNS Opinion was responsible for translations, the fieldwork in the 13 countries and data processing.
The survey was in the field from the 18 April and 1 May 2013.
The sample in each country has been selected by quotas to reflect national proportions in terms of age, gender and region.
In each country 1000 interviews were targeted for a total of 13,015 conducted interviews.
All interviews were conducted online.
SPSS software and Microsoft Excel were used to analyse and present the data.
This project was conducted in compliance with AS: ISO20252 guidelines.
For more information contact: Gemma Swart on +32 479 06 41 63 or [email protected] or go to www.ituc-csi.org
EMC and Essential Research, was responsible for question design and project management.
Anker Solutions was responsible for analysis and report writing.
TNS Opinion, coordinated the fieldwork with reputable local partners in each of the countries involved.
EMC is a member of the Association of Market and Social Research Organisations.
Survey Methodology