ITU Workshop on Performance, QoS and QoE Dakar, … · IuB IuPS Gi IMS RNC SGSN GGSN UE eNB HLR 5....
23
ITU Workshop on Performance, QoS and QoE Dakar, Senegal, 19-March 2018 Erwin Dirckx 1
Transcript of ITU Workshop on Performance, QoS and QoE Dakar, … · IuB IuPS Gi IMS RNC SGSN GGSN UE eNB HLR 5....

ITU Workshop on Performance,
QoS and QoE
Dakar, Senegal, 19-March 2018
Erwin Dirckx
1
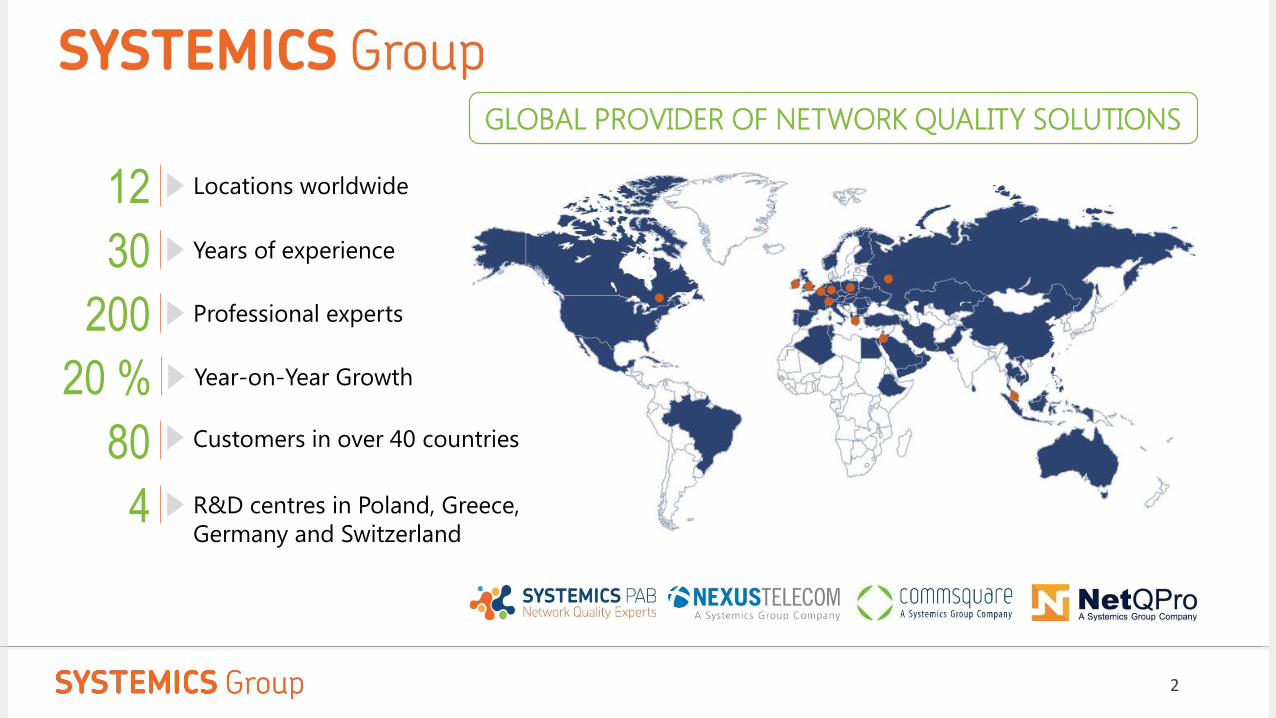
20 % Year-on-Year Growth
12 Locations worldwide
30 Years of experience
200 Professional experts
4 R&D centres in Poland, Greece,
Germany and Switzerland
GLOBAL PROVIDER OF NETWORK QUALITY SOLUTIONS
80 Customers in over 40 countries
2
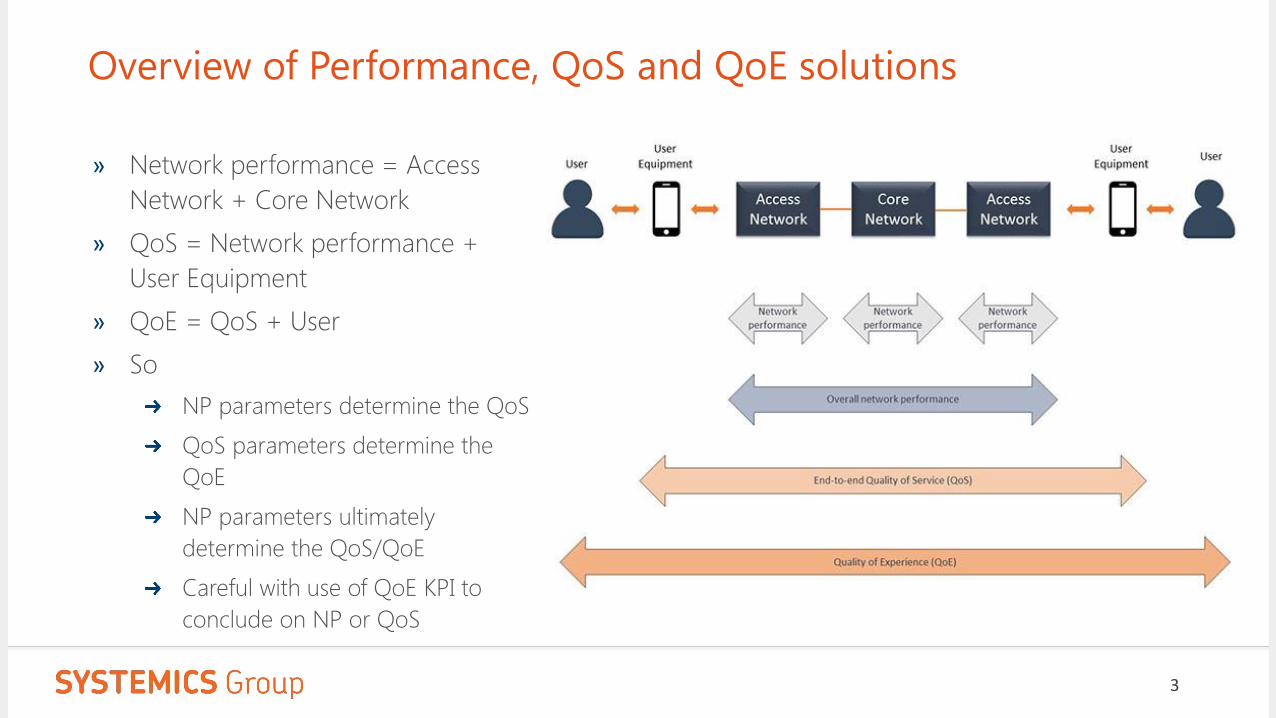
Overview of Performance, QoS and QoE solutions
» Network performance = Access
Network + Core Network
» QoS = Network performance +
User Equipment
» QoE = QoS + User
» So
NP parameters determine the QoS
QoS parameters determine the
QoE
NP parameters ultimately
determine the QoS/QoE
Careful with use of QoE KPI to
conclude on NP or QoS
3
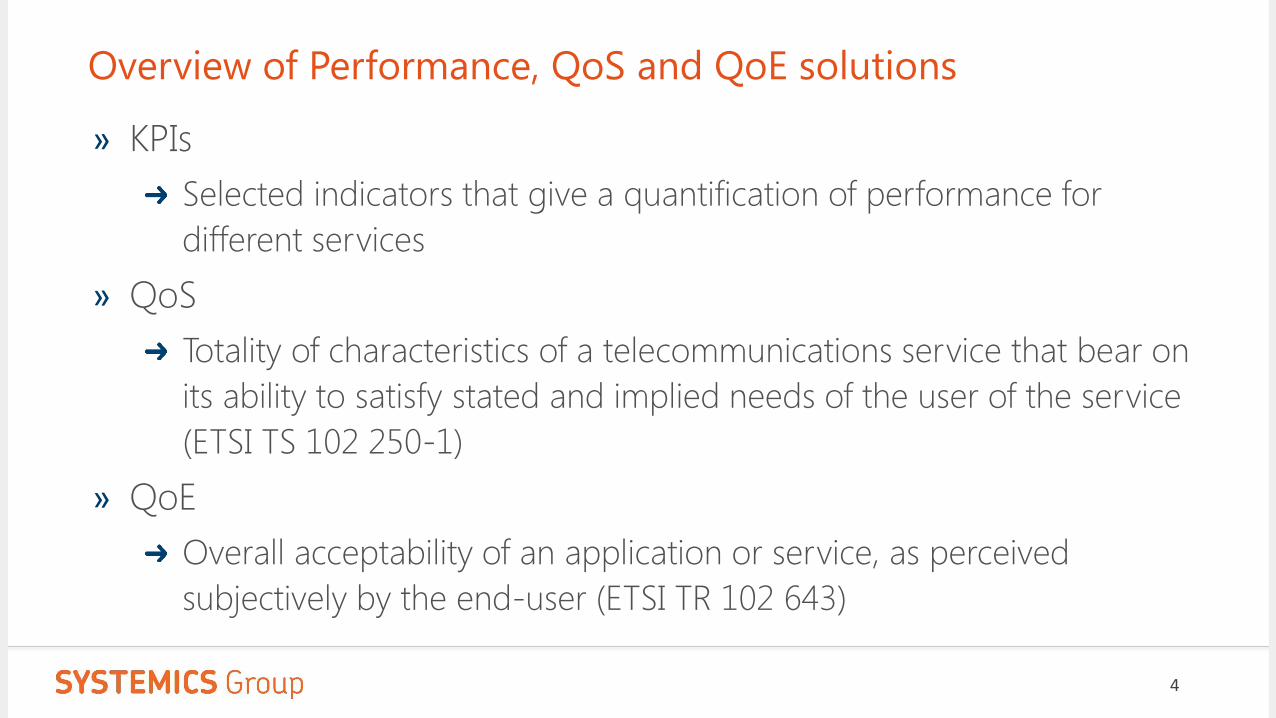
Overview of Performance, QoS and QoE solutions
» KPIs
Selected indicators that give a quantification of performance for
different services
» QoS
Totality of characteristics of a telecommunications service that bear on
its ability to satisfy stated and implied needs of the user of the service
(ETSI TS 102 250-1)
» QoE
Overall acceptability of an application or service, as perceived
subjectively by the end-user (ETSI TR 102 643)
4
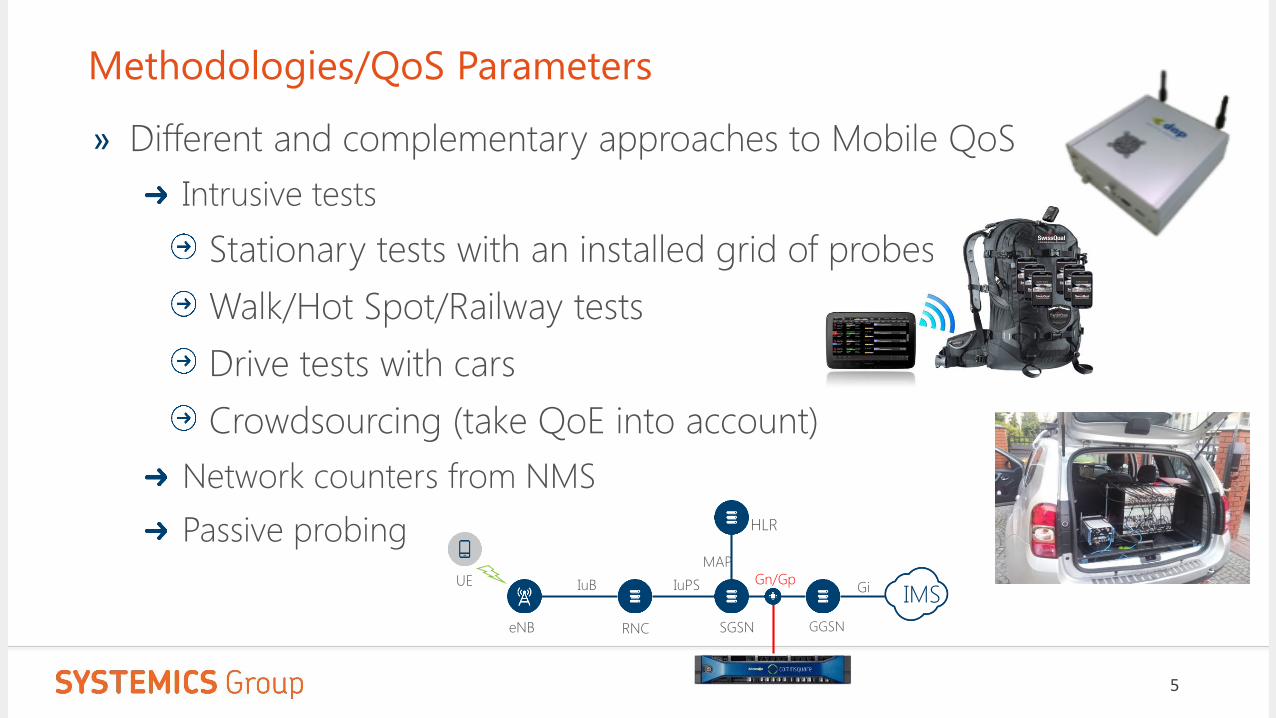
Methodologies/QoS Parameters
» Different and complementary approaches to Mobile QoS
Intrusive tests
Stationary tests with an installed grid of probes
Walk/Hot Spot/Railway tests
Drive tests with cars
Crowdsourcing (take QoE into account)
Network counters from NMS
Passive probing
Gn/Gp
MAP
IuPSIMS
IuB Gi
SGSN GGSNRNC
UE
eNB
HLR
5
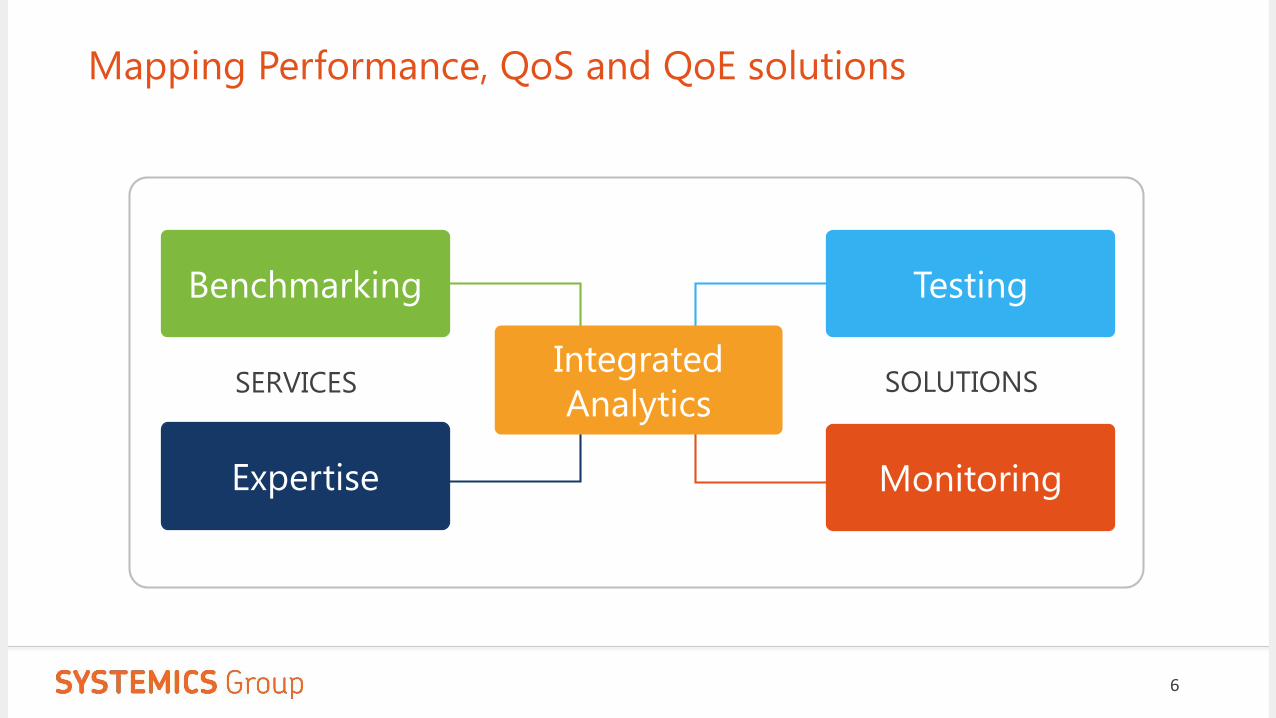
Benchmarking
Expertise Monitoring
Testing
SERVICES SOLUTIONSIntegrated
Analytics
Mapping Performance, QoS and QoE solutions
6
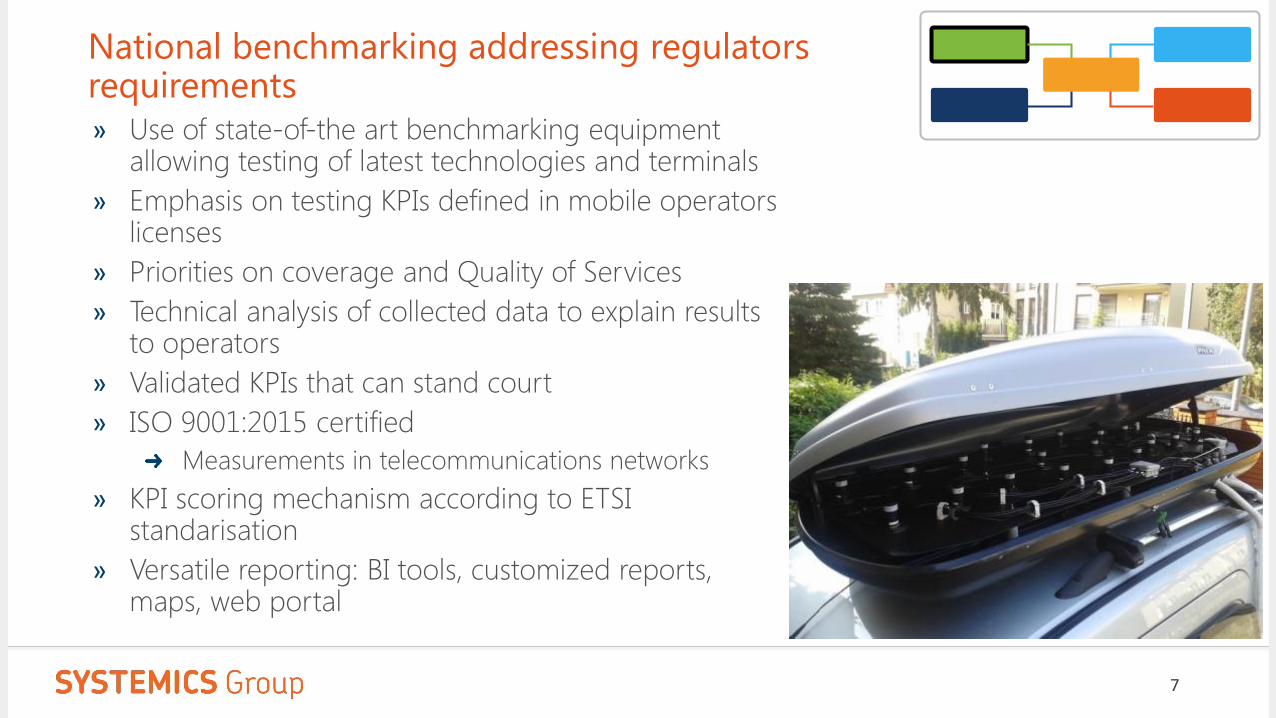
National benchmarking addressing regulatorsrequirements» Use of state-of-the art benchmarking equipment
allowing testing of latest technologies and terminals
» Emphasis on testing KPIs defined in mobile operators licenses
» Priorities on coverage and Quality of Services
» Technical analysis of collected data to explain results to operators
» Validated KPIs that can stand court
» ISO 9001:2015 certified
Measurements in telecommunications networks
» KPI scoring mechanism according to ETSI standarisation
» Versatile reporting: BI tools, customized reports, maps, web portal
7
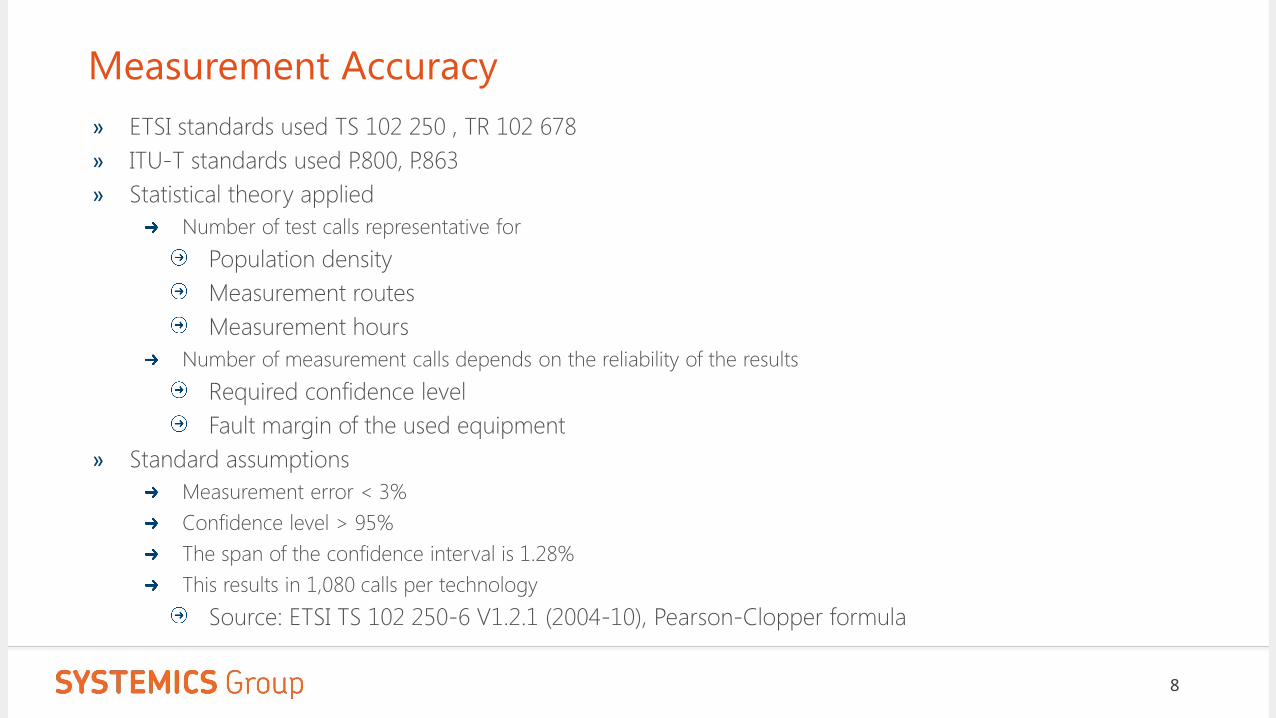
Measurement Accuracy
» ETSI standards used TS 102 250 , TR 102 678
» ITU-T standards used P.800, P.863
» Statistical theory applied
Number of test calls representative for
Population density
Measurement routes
Measurement hours
Number of measurement calls depends on the reliability of the results
Required confidence level
Fault margin of the used equipment
» Standard assumptions
Measurement error < 3%
Confidence level > 95%
The span of the confidence interval is 1.28%
This results in 1,080 calls per technology
Source: ETSI TS 102 250-6 V1.2.1 (2004-10), Pearson-Clopper formula
8
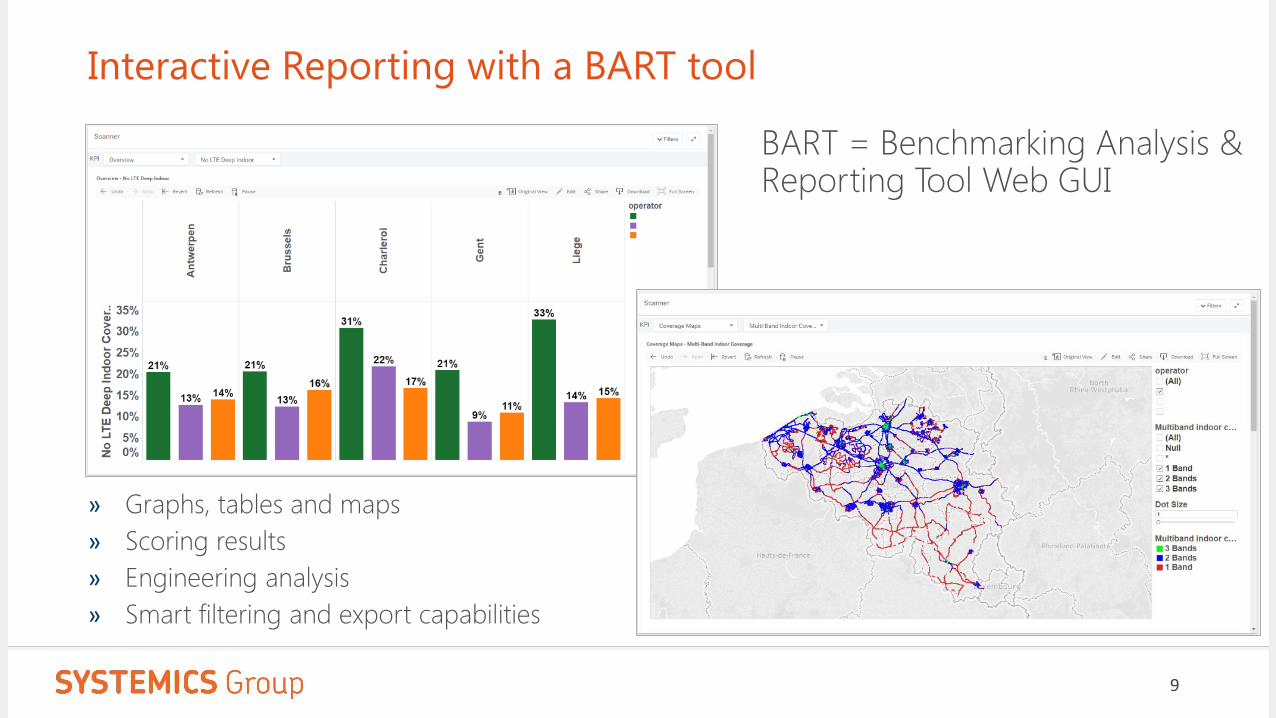
Interactive Reporting with a BART tool
BART = Benchmarking Analysis & Reporting Tool Web GUI
» Graphs, tables and maps
» Scoring results
» Engineering analysis
» Smart filtering and export capabilities
9
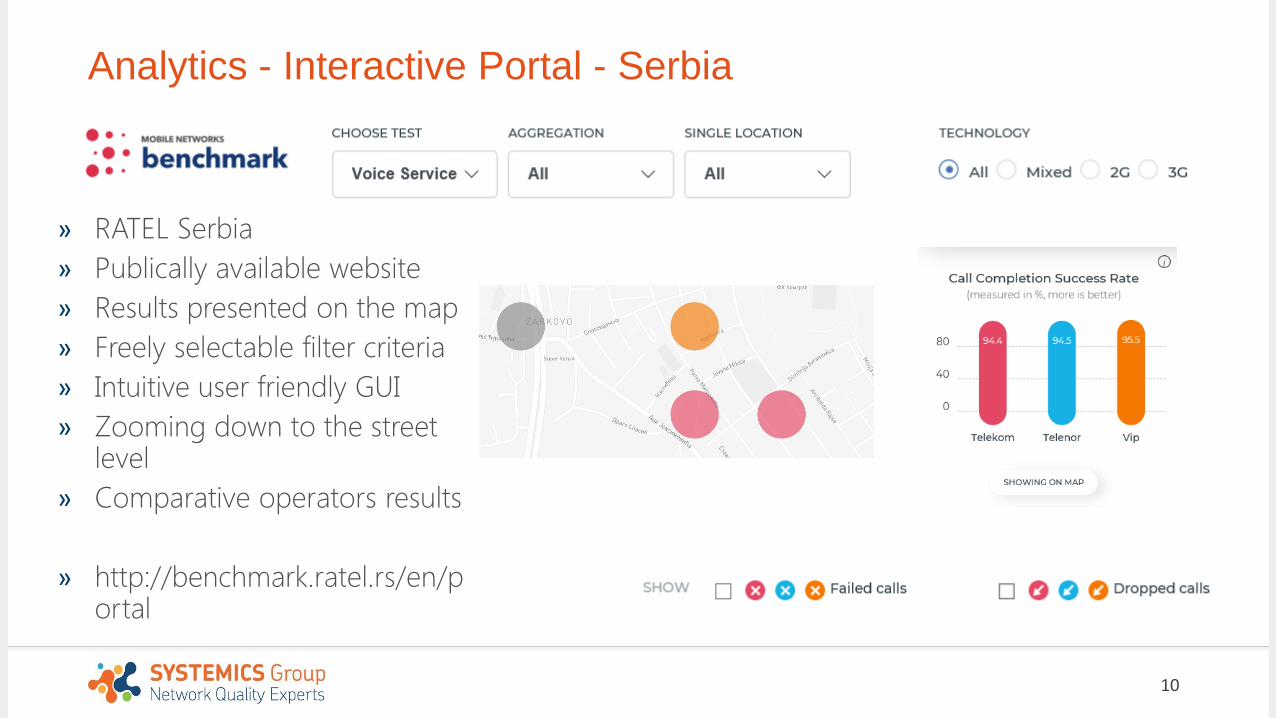
Analytics - Interactive Portal - Serbia
» RATEL Serbia
» Publically available website
» Results presented on the map
» Freely selectable filter criteria
» Intuitive user friendly GUI
» Zooming down to the street level
» Comparative operators results
» http://benchmark.ratel.rs/en/portal
10
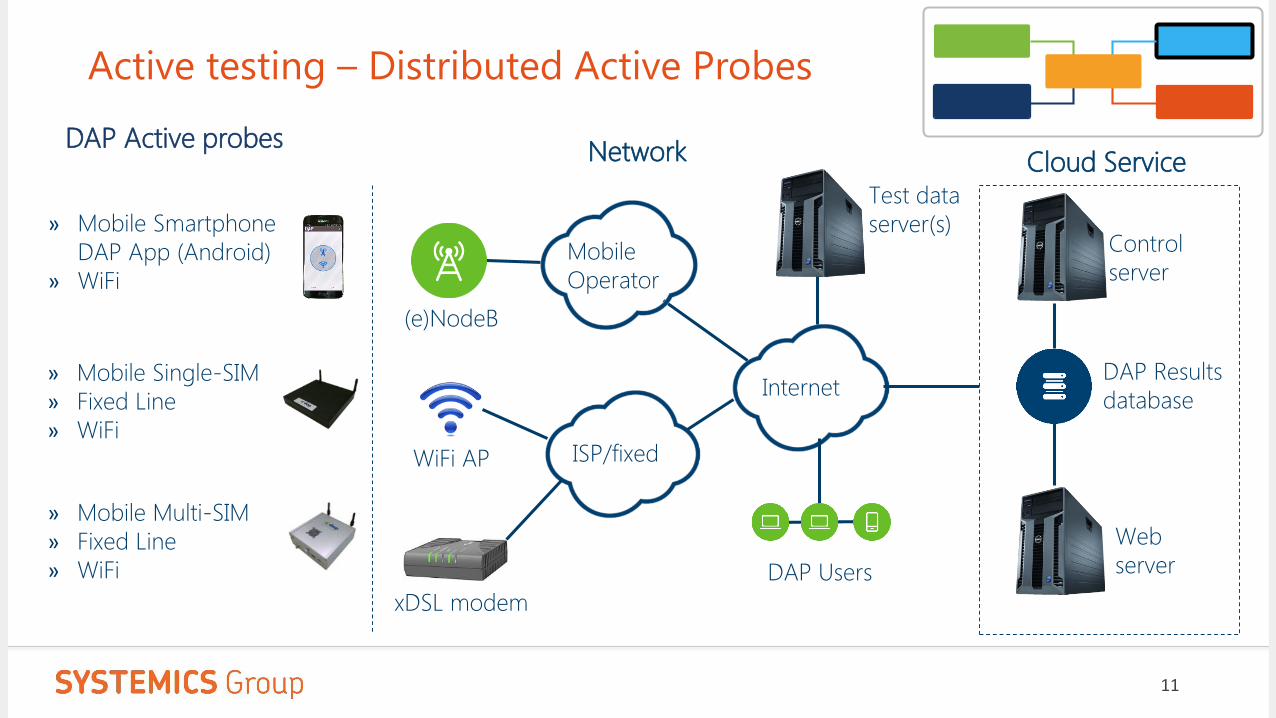
Active testing – Distributed Active Probes
Control
server
Web
server
DAP Results
database
Test data
server(s)
DAP Users
(e)NodeB
Mobile
Operator
Internet
Cloud Service
ISP/fixedWiFi AP
xDSL modem
» Mobile Single-SIM
» Fixed Line
» WiFi
» Mobile Multi-SIM
» Fixed Line
» WiFi
Probes Network
» Mobile Smartphone
DAP App (Android)
» WiFi
DAP Active probes
11
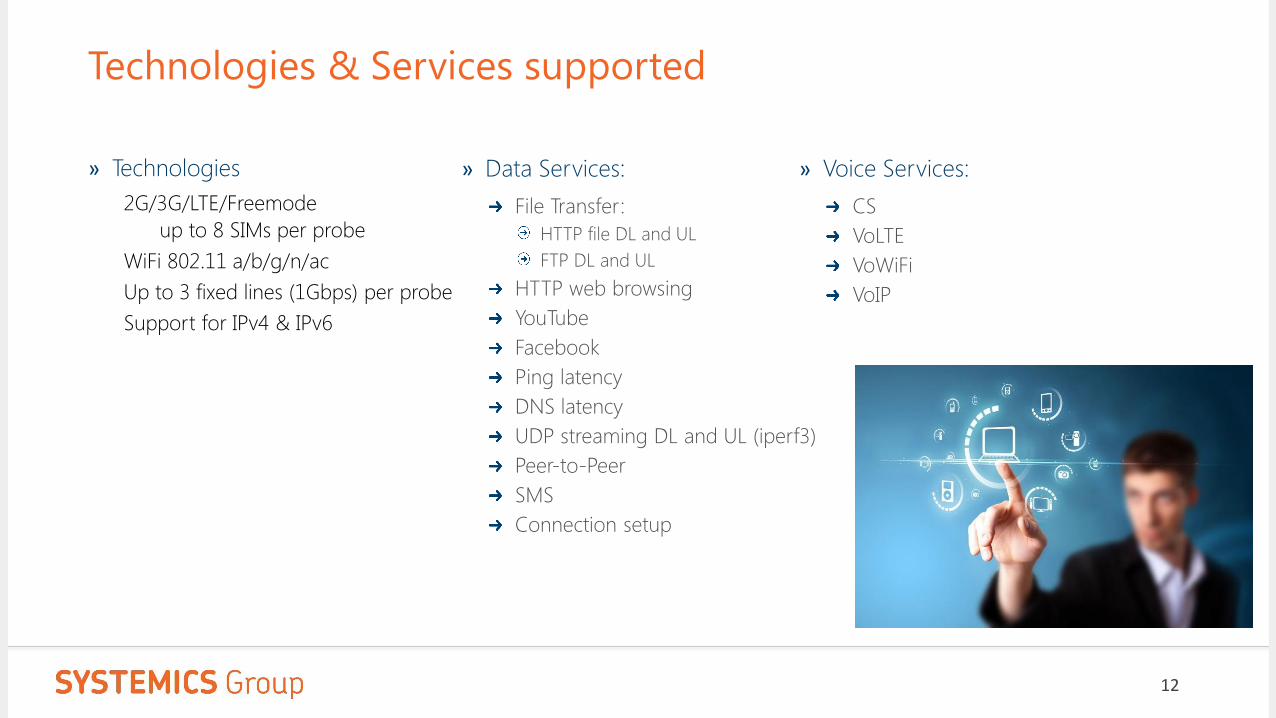
» Technologies
2G/3G/LTE/Freemode
up to 8 SIMs per probe
WiFi 802.11 a/b/g/n/ac
Up to 3 fixed lines (1Gbps) per probe
Support for IPv4 & IPv6
Technologies & Services supported
» Data Services:
File Transfer:
HTTP file DL and UL
FTP DL and UL
HTTP web browsing
YouTube
Ping latency
DNS latency
UDP streaming DL and UL (iperf3)
Peer-to-Peer
SMS
Connection setup
» Voice Services:
CS
VoLTE
VoWiFi
VoIP
12
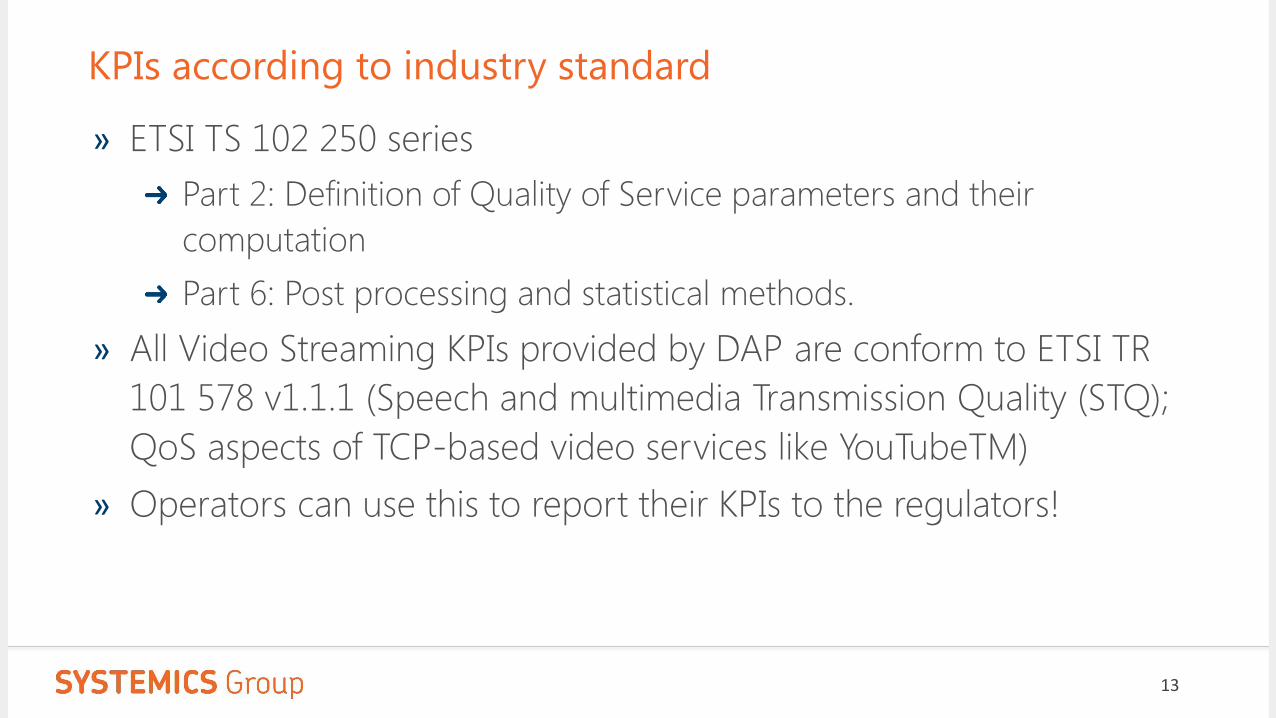
KPIs according to industry standard
» ETSI TS 102 250 series
Part 2: Definition of Quality of Service parameters and their
computation
Part 6: Post processing and statistical methods.
» All Video Streaming KPIs provided by DAP are conform to ETSI TR
101 578 v1.1.1 (Speech and multimedia Transmission Quality (STQ);
QoS aspects of TCP-based video services like YouTubeTM)
» Operators can use this to report their KPIs to the regulators!
13
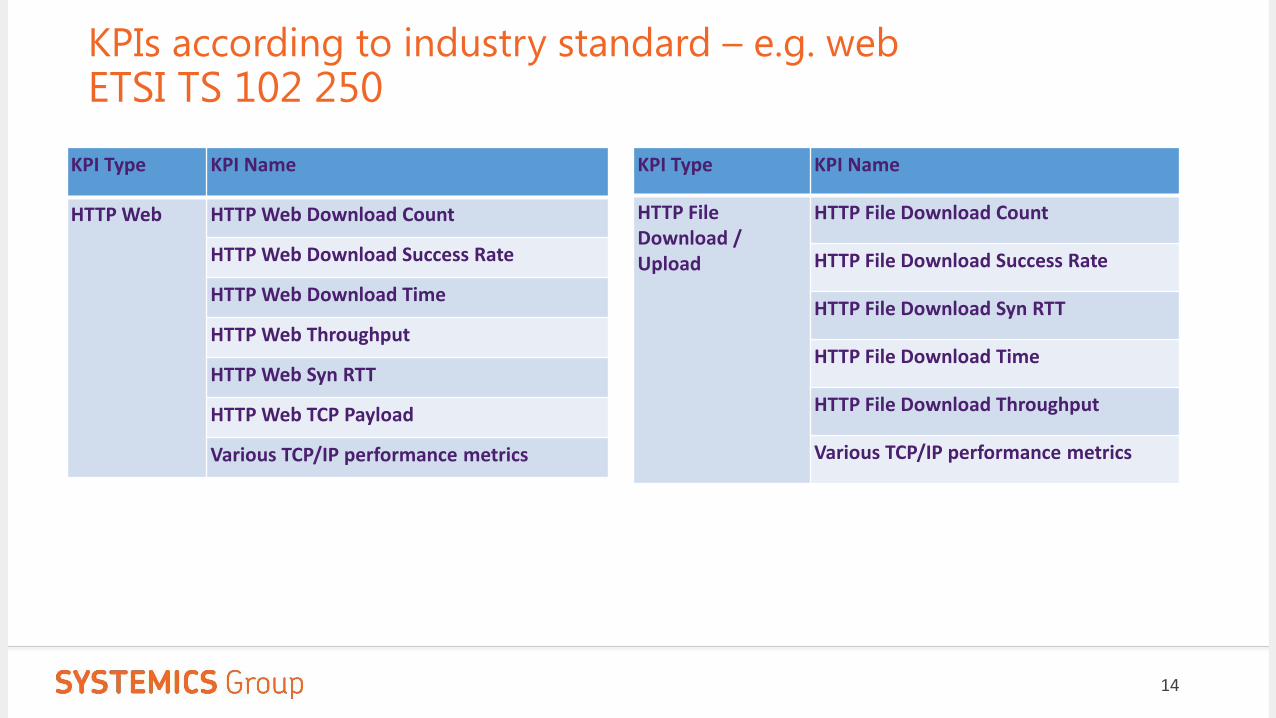
KPIs according to industry standard – e.g. webETSI TS 102 250
KPI Type KPI Name
HTTP Web HTTP Web Download Count
HTTP Web Download Success Rate
HTTP Web Download Time
HTTP Web Throughput
HTTP Web Syn RTT
HTTP Web TCP Payload
Various TCP/IP performance metrics
KPI Type KPI Name
HTTP File Download / Upload
HTTP File Download Count
HTTP File Download Success Rate
HTTP File Download Syn RTT
HTTP File Download Time
HTTP File Download Throughput
Various TCP/IP performance metrics
14
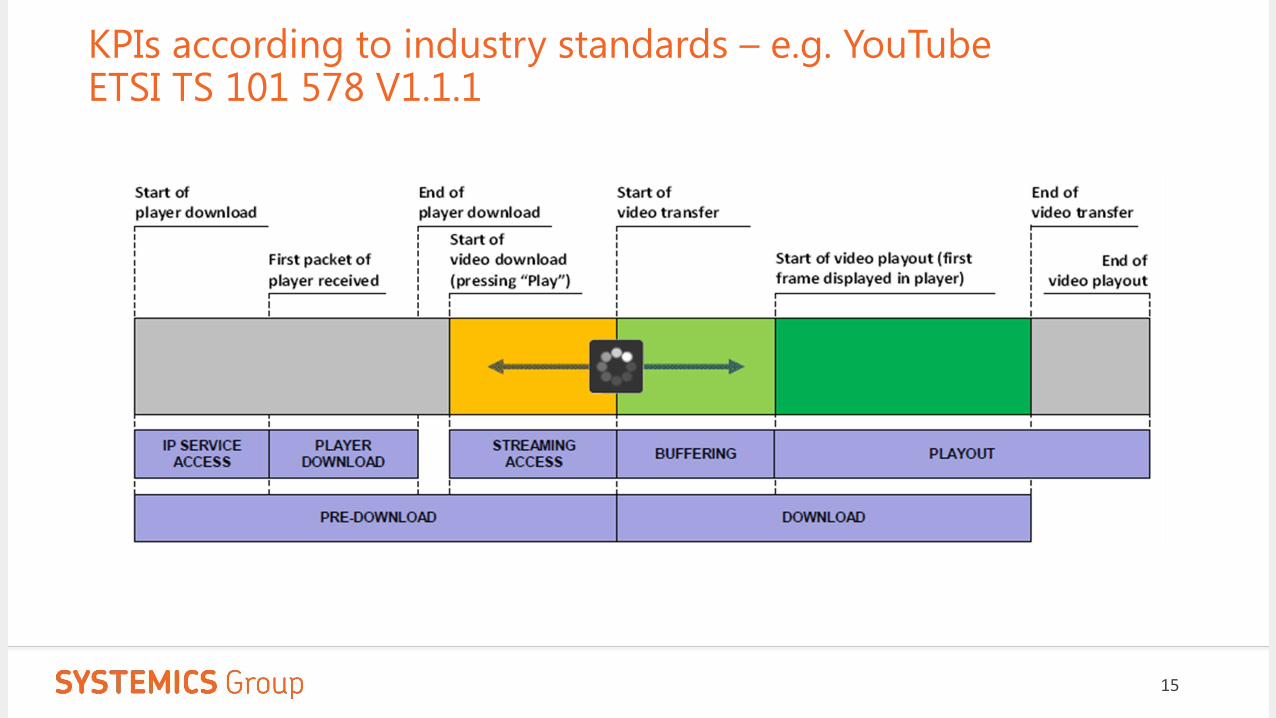
KPIs according to industry standards – e.g. YouTubeETSI TS 101 578 V1.1.1
15
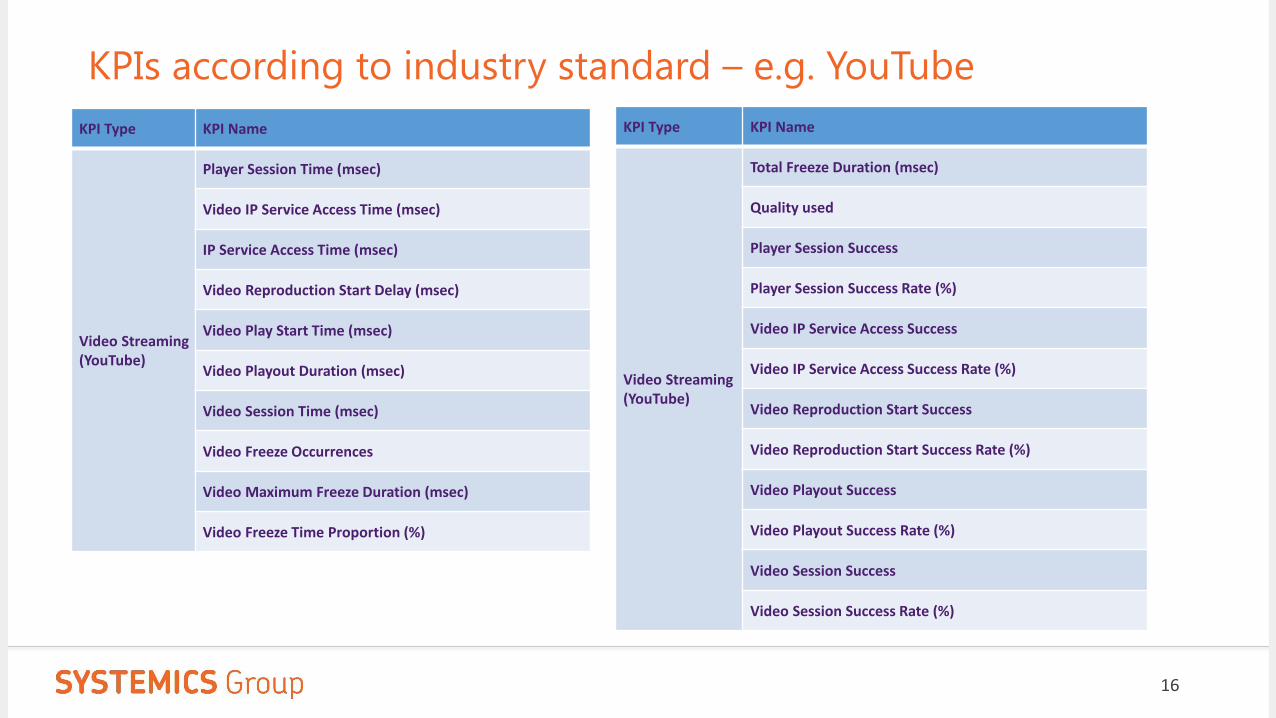
KPIs according to industry standard – e.g. YouTube
KPI Type KPI Name
Video Streaming (YouTube)
Player Session Time (msec)
Video IP Service Access Time (msec)
IP Service Access Time (msec)
Video Reproduction Start Delay (msec)
Video Play Start Time (msec)
Video Playout Duration (msec)
Video Session Time (msec)
Video Freeze Occurrences
Video Maximum Freeze Duration (msec)
Video Freeze Time Proportion (%)
KPI Type KPI Name
Video Streaming (YouTube)
Total Freeze Duration (msec)
Quality used
Player Session Success
Player Session Success Rate (%)
Video IP Service Access Success
Video IP Service Access Success Rate (%)
Video Reproduction Start Success
Video Reproduction Start Success Rate (%)
Video Playout Success
Video Playout Success Rate (%)
Video Session Success
Video Session Success Rate (%)
16
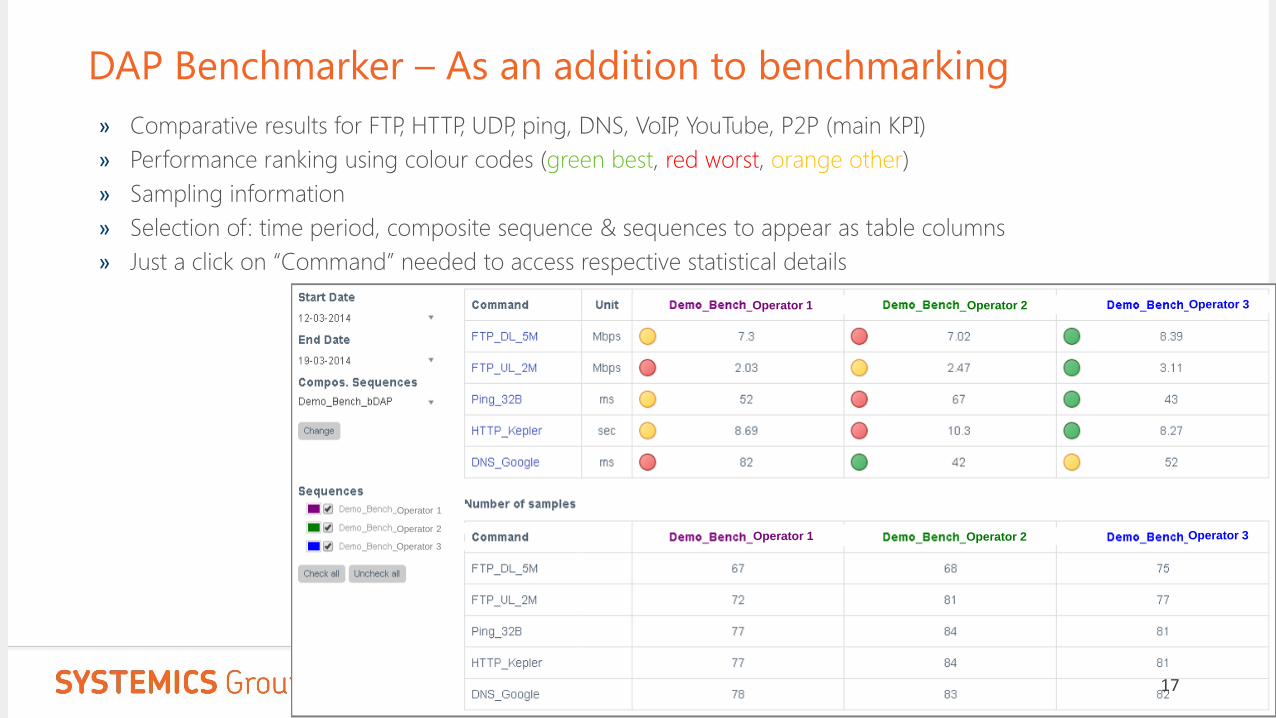
DAP Benchmarker – As an addition to benchmarking
» Comparative results for FTP, HTTP, UDP, ping, DNS, VoIP, YouTube, P2P (main KPI)
» Performance ranking using colour codes (green best, red worst, orange other)
» Sampling information
» Selection of: time period, composite sequence & sequences to appear as table columns
» Just a click on “Command” needed to access respective statistical details
Operator 1 Operator 2 Operator 3
Operator 1 Operator 2 Operator 3
Operator 1
Operator 2
Operator 3
17
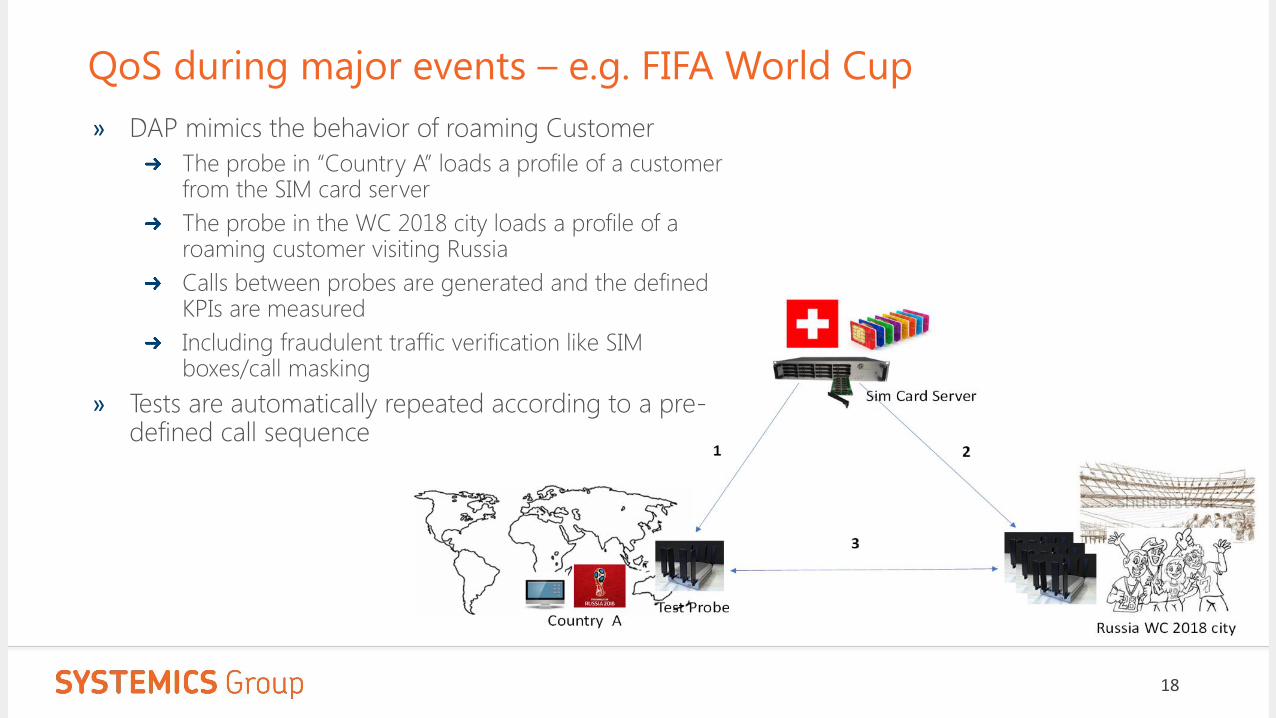
QoS during major events – e.g. FIFA World Cup
» DAP mimics the behavior of roaming Customer
The probe in “Country A” loads a profile of a customer from the SIM card server
The probe in the WC 2018 city loads a profile of a roaming customer visiting Russia
Calls between probes are generated and the defined KPIs are measured
Including fraudulent traffic verification like SIM boxes/call masking
» Tests are automatically repeated according to a pre-defined call sequence
18
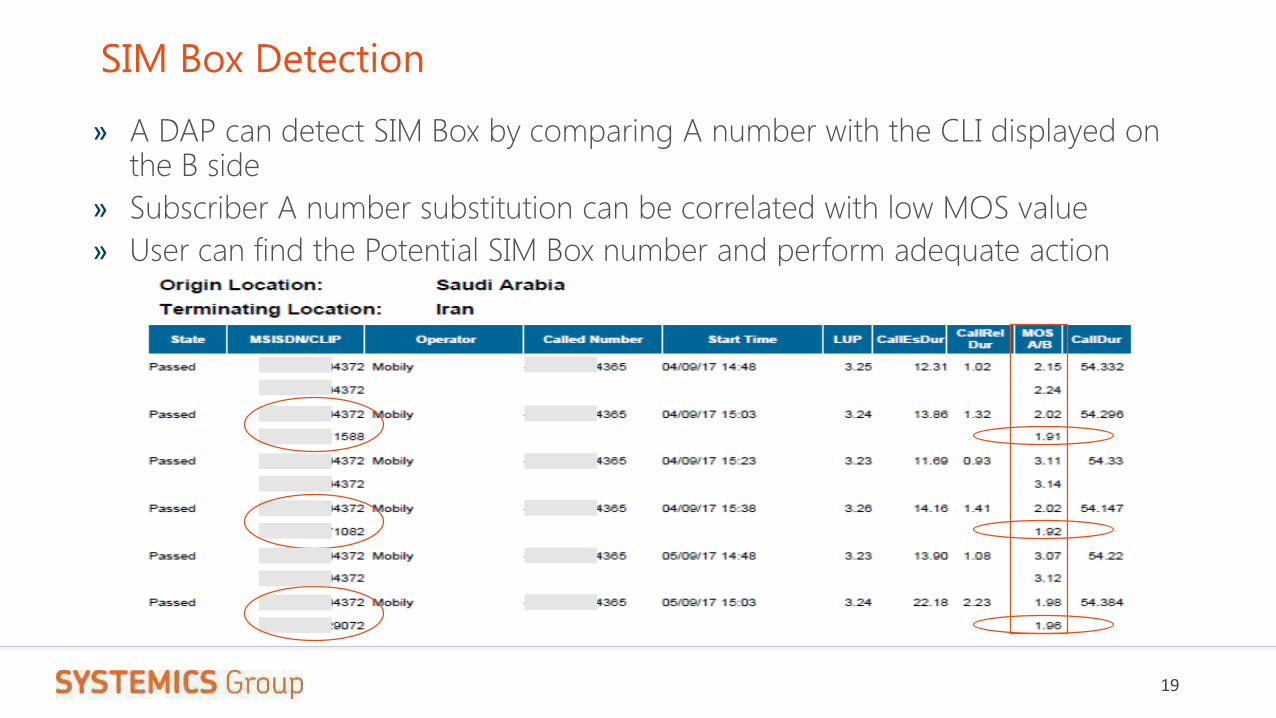
SIM Box Detection
19
» A DAP can detect SIM Box by comparing A number with the CLI displayed on the B side
» Subscriber A number substitution can be correlated with low MOS value
» User can find the Potential SIM Box number and perform adequate action
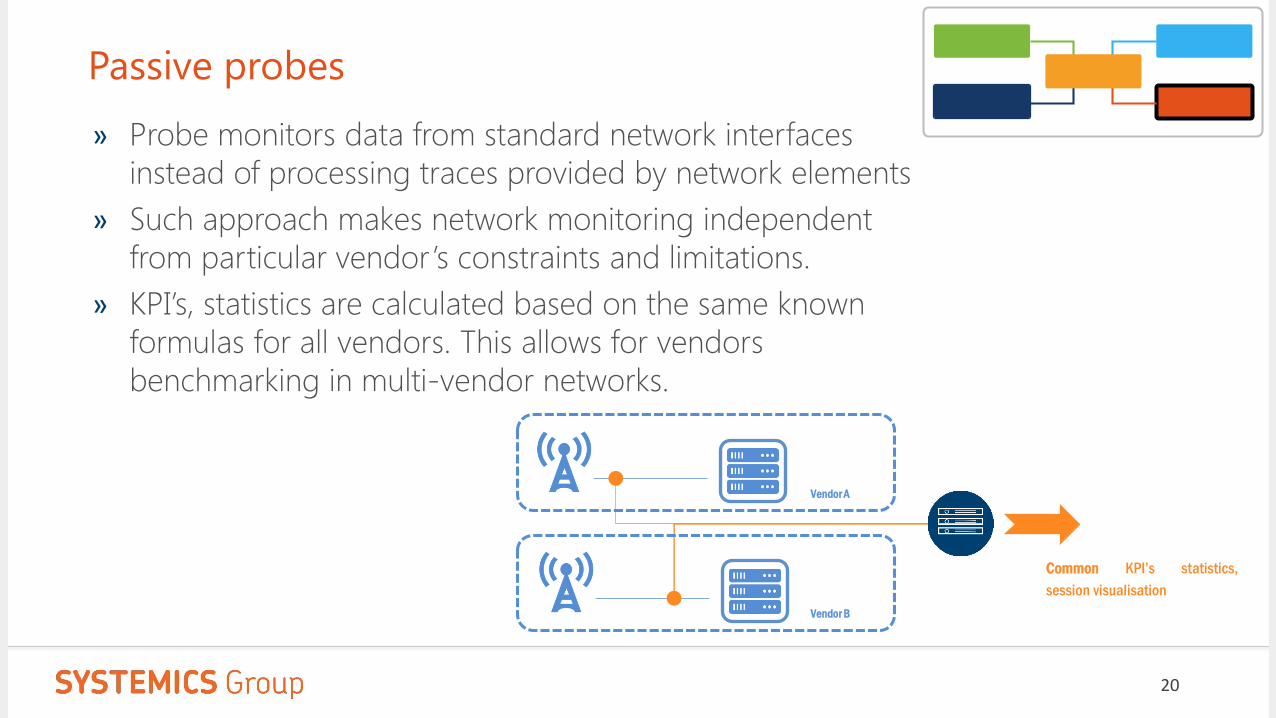
Passive probes
Vendor A
Vendor B
Common KPI’s statistics,
session visualisation
» Probe monitors data from standard network interfaces
instead of processing traces provided by network elements
» Such approach makes network monitoring independent
from particular vendor’s constraints and limitations.
» KPI’s, statistics are calculated based on the same known
formulas for all vendors. This allows for vendors
benchmarking in multi-vendor networks.
20
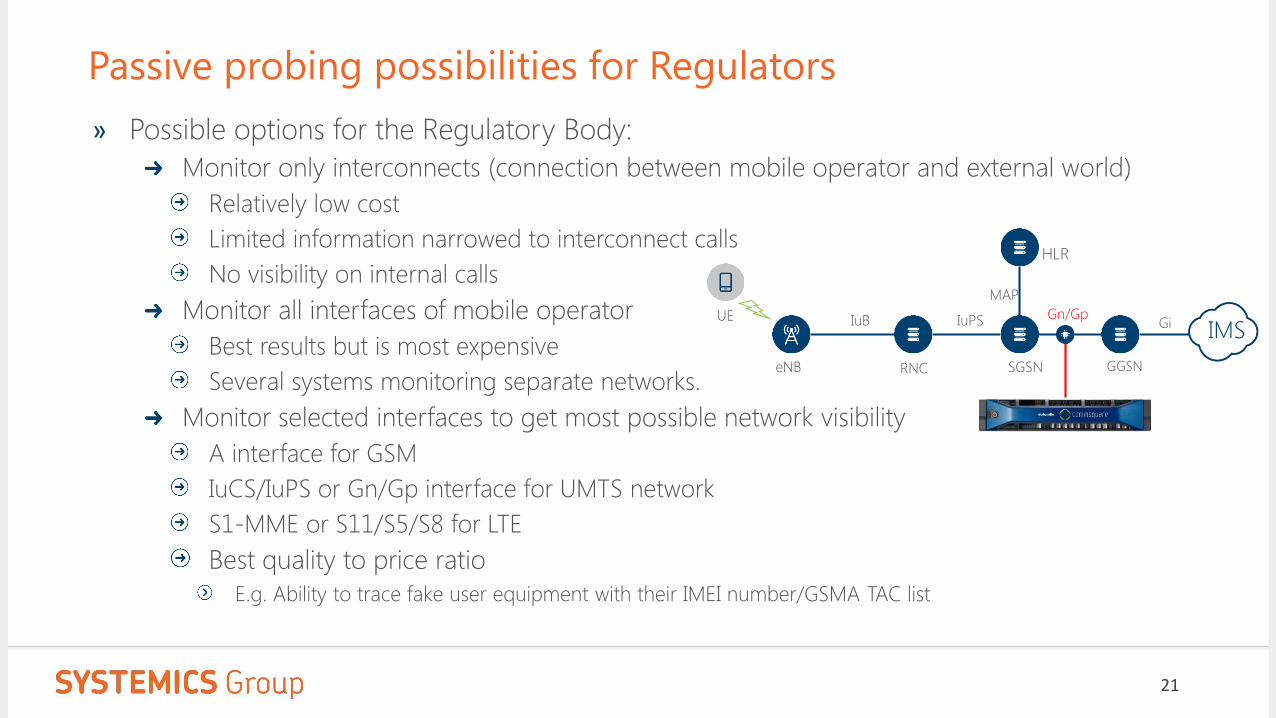
Passive probing possibilities for Regulators
» Possible options for the Regulatory Body:
Monitor only interconnects (connection between mobile operator and external world)
Relatively low cost
Limited information narrowed to interconnect calls
No visibility on internal calls
Monitor all interfaces of mobile operator
Best results but is most expensive
Several systems monitoring separate networks.
Monitor selected interfaces to get most possible network visibility
A interface for GSM
IuCS/IuPS or Gn/Gp interface for UMTS network
S1-MME or S11/S5/S8 for LTE
Best quality to price ratio
E.g. Ability to trace fake user equipment with their IMEI number/GSMA TAC list
21
Gn/Gp
MAP
IuPSIMS
IuB Gi
SGSN GGSNRNC
UE
eNB
HLR
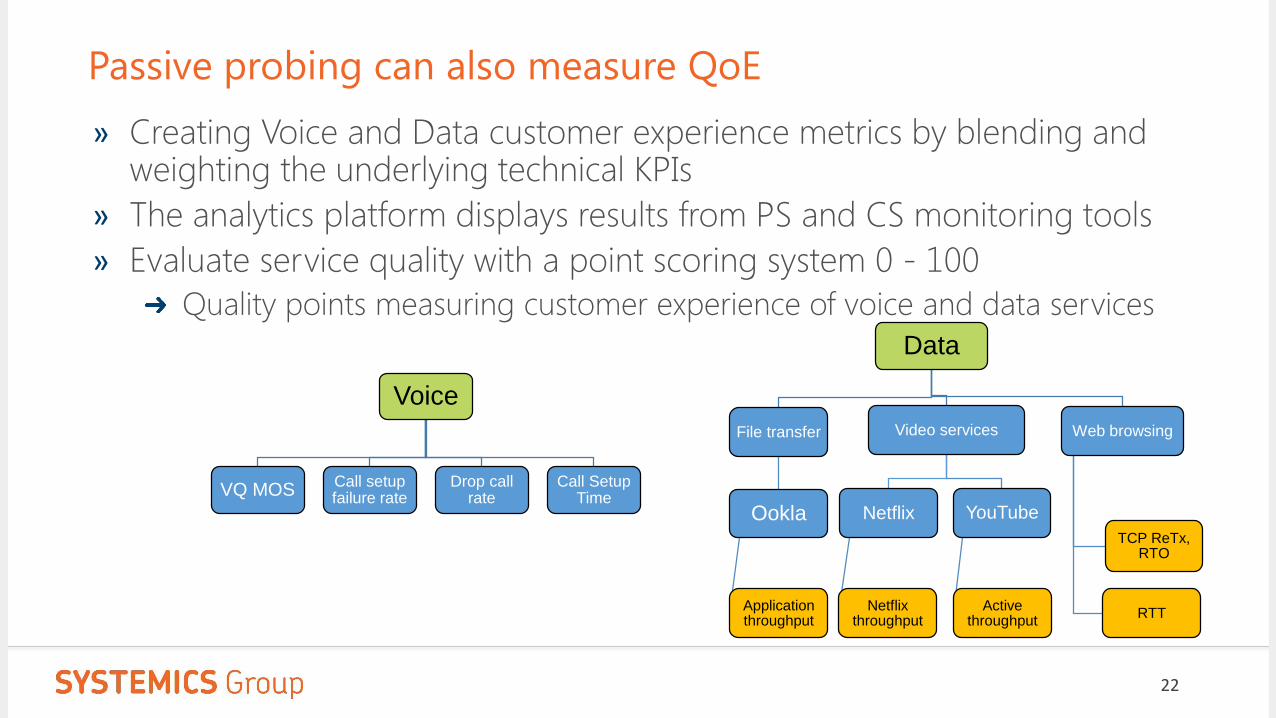
Passive probing can also measure QoE
Voice
VQ MOSCall setup failure rate
Drop call rate
Call Setup Time
Data
File transfer
Ookla
Application throughput
Video services
Netflix
Netflix throughput
YouTube
Active throughput
Web browsing
TCP ReTx, RTO
RTT
» Creating Voice and Data customer experience metrics by blending and weighting the underlying technical KPIs
» The analytics platform displays results from PS and CS monitoring tools
» Evaluate service quality with a point scoring system 0 - 100
Quality points measuring customer experience of voice and data services
22
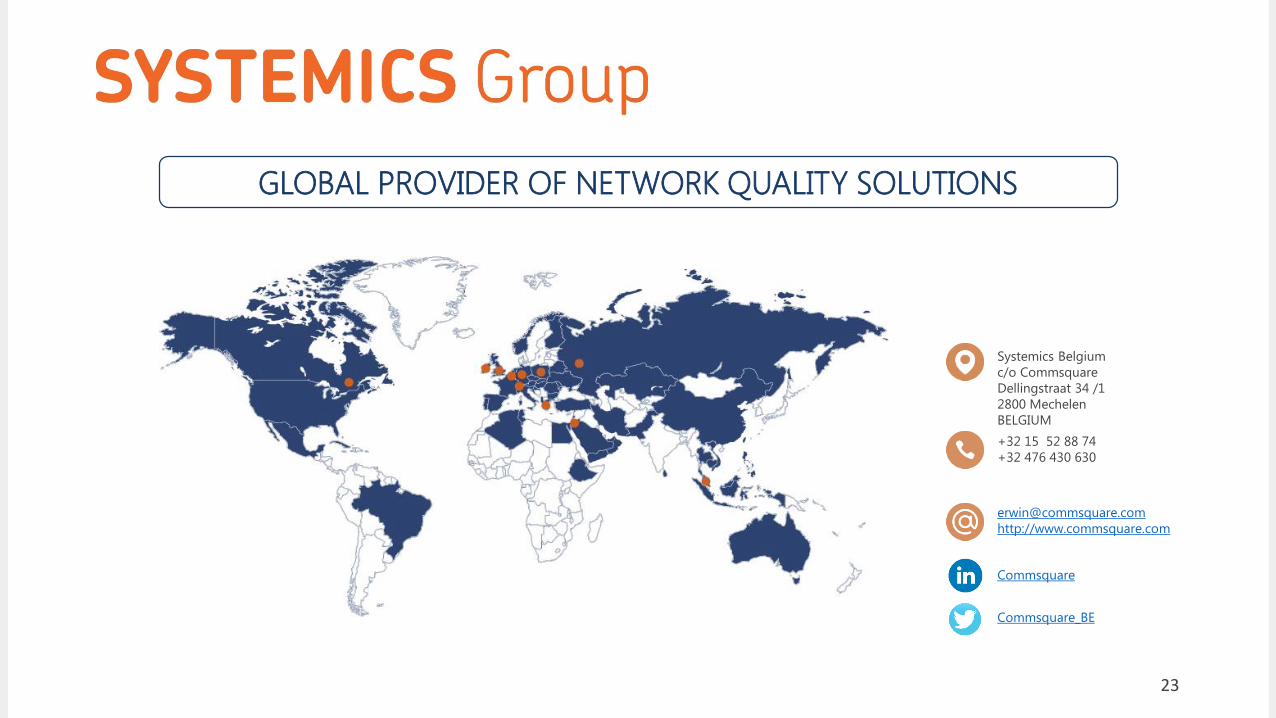
GLOBAL PROVIDER OF NETWORK QUALITY SOLUTIONS
Systemics Belgium
c/o Commsquare
Dellingstraat 34 /1
2800 Mechelen
BELGIUM
+32 15 52 88 74
+32 476 430 630
http://www.commsquare.com
Commsquare
Commsquare_BE
23