
Itu - Airline Strategies and Business Models Alex...
73
Airline Strategies and Business Models Alex Philip & Bruce Tecklenburg Fundamentals of Airline Management Module 4: 13 October 2015 Istanbul Technical University Air Transportation Management M.Sc. Program
Transcript of Itu - Airline Strategies and Business Models Alex...

Airline Strategies and Business ModelsAlex Philip & Bruce Tecklenburg
Fundamentals of Airline Management
Module 4: 13 October 2015
Istanbul Technical University
Air Transportation Management
M.Sc. Program

2
Objectives
Connect market segments and passenger expectations
Connect potential airline business models with
passenger expectations
Connect deregulation and potential airline business
models
Connect partnering strategies and alliances with both
deregulation and airline business models
Connect cargo strategy impact on airline success

Regulatory
Environment
Technology
Airline and
Industry
Strategies
Passenger
Expectations
The passenger is at the center

4
Passenger market is segmented
Business
30% Travel
40-50%
Revenue
Personal
70% Travel
50-60% Revenue
Short-Haul
65% Travel
Long-Haul
35% Travel
Long-haul
business
Long-haul
personal
Short-haul
business
Short-haul
personal

5
Business
30% Travel
40-50% Revenue
Personal
70% Travel
50-60% Revenue
Short-Haul
65% Travel
Long-Haul
35% Travel
Long-haul
business
Long-haul
personal
Short-haul
business
Short-haul
personal
Table exercise/discussion questions
1. What are three key passenger expectations for your market segment?
2. How are these passenger expectations changing?

6
Market forecast drivers and considerations
Infrastructure Economicgrowth
Marketliberalization
Emergingmarkets
Fuelprice
Airlinestrategies &
businessmodels
Airplanecapabilities Environment
Highspeed
rail
CurrentMarketOutlook
2015-2034

Regulatory
Environment
Technology
Airline and
Industry
Strategies
Passenger
Expectations
The passenger is at the center

Copyright © 2015 Boeing. All rights reserved.
History
International air transportation is
mostly negotiated between two
countries (bilateral)
Under the framework first
introduced in the 1944 Chicago
Convention
Increasing liberal agreements over
last twenty years
Open Skies deals are the most
liberal
Chicago Convention framework is
still being used
Ownership remains to be nationally
based

9
A typical bilateral (except Open Skies)
Negotiated between two sovereign nations
Specified type of traffic allowed (traffic freedoms)
May specify: airlines, airports, capacity, frequency & fares
Typically includes a “nationality” clause
Reciprocity
Any changes have to be approved by both governments
Typical Example:
• Total 18 frequencies per day
allocated to specific route groups
• No gauge restrictions
• Fare: no restrictions
• Must be Chinese controlled airlines

10
Open Skies Agreement
What’s different:
Agreement can be bilateral, multi-
lateral, or by joint political entity
(e.g., EU)
Typically no traffic restrictions
other than domestic (Cabotage)
No limitations on airline
designations, points served,
service levels (frequencies &
seats), nor fares
Changes in services do not have to
be approved by both governments
What remains:
“Nationality” clause
Reciprocity

11
Current model Open-Skies agreement
Reference: http://www.state.gov/e/eb/rls/othr/ata/114866.htm

12
Traffic rights

13
4 Nothing in this article shall be deemed to confer on the airline or airlines of one Party the
rights to take on board, in the territory of the other Party, passengers, baggage, cargo, or mail
carried for compensation and destined for another point in the territory of that other Party.
- No Cabotage (Eighth & Ninth Freedoms)
(i) for airlines of the United States, from points behind the United States via
the United States and intermediate points to any point or points in
[country] and beyond; [and for all-cargo service, between [country] and
any point or points - Seventh Freedom
Traffic rights
(a) the right to fly across its territory without landing - First Freedom
(b) the right to make stops in its territory for non-traffic purposes - Second Freedom
(i) for airlines of the United States, from points behind the United States via
the United States and intermediate points to any point or points in
[country] and beyond; [and for all-cargo service, between [country] and
any point or points - Sixth Freedom
(i) for airlines of the United States, from points behind the United States via
the United States and intermediate points to any point or points in
[country] and beyond; [and for all-cargo service, between [country] and
any point or points - Fifth Freedom
(i) for airlines of the United States, from points behind the United States via
the United States and intermediate points to any point or points in
[country] and beyond; [and for all-cargo service, between [country] and
any point or points - Third & Fourth Freedoms

14
Freedoms of the Air

15
Perth
Cairns
Melbourne
Sydney
Brisbane
Christchurch
Auckland
Wellington
Adelaide
Gold Coast
Trans-Tasman
Nonstop Services
April 2006
Palmerston
Dunedin
Hamilton
Queenstown
Analysis of Growth in Major Markets vs. Non Major Markets
1994 - 2004
Australian Bureau of Transport and Regional Economics
0
500,000
1,000,000
1,500,000
2,000,000
2,500,000
3,000,000
3,500,000
4,000,000
4,500,000
1994 1995 1996 1997 1998 1999 2000 2001 2002 2003 2004
To
tal P
assen
gers
- M
ajo
r M
ark
ets
-
100,000
200,000
300,000
400,000
500,000
600,000
To
tal P
assen
gers
- N
on
Majo
r M
ark
ets
Major Markets Non Major Markets
CAGR for Non
Major Markets -
14.45%
CAGR for Major
Markets 7.10%
Source: Australian Bureau of Transport and Regional Economics, International City Pair Data
Major Markets includes all routings between main New Zealand markets (Auckland, Christchurch, Wellington) and Australian markets
(Sydney, Melbourne, Brisbane)
Open Skies can stimulate growth
even in mature markets
Australia – New Zealand Trans-Tasman Open Skies Agreement 2000
16
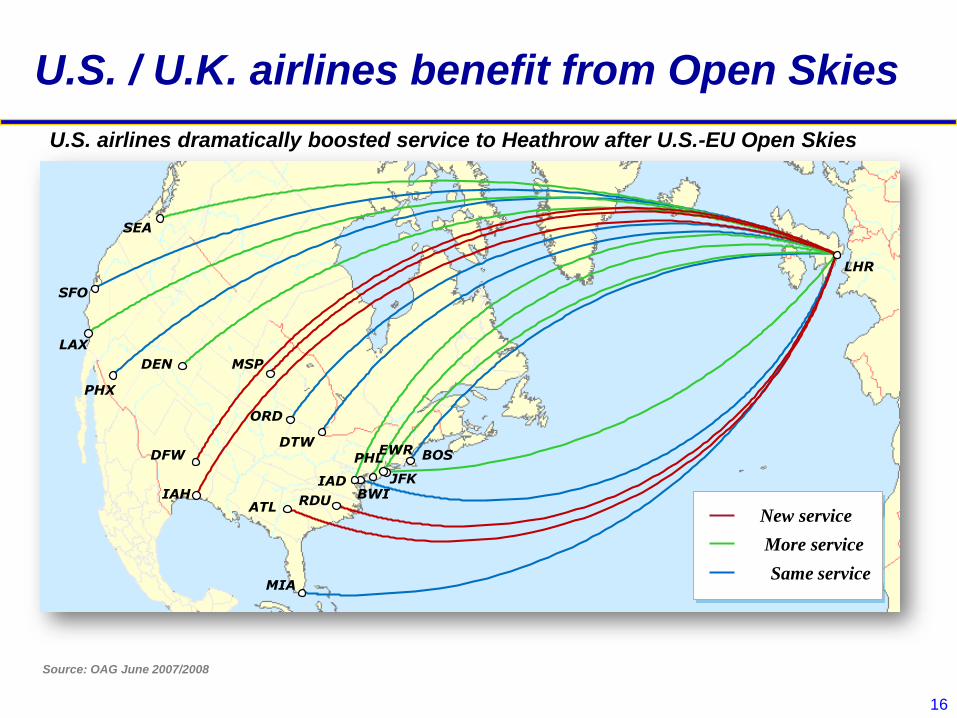
U.S. / U.K. airlines benefit from Open Skies
Source: OAG June 2007/2008
LHR
ATL
DEN
DFWDTW
IAH
LAX
MSP
ORD
PHX
RDU
SEA
SFO
BOS
BWI
EWR
IAD JFK
PHL
MIA
New service
More service
Same service
U.S. airlines dramatically boosted service to Heathrow after U.S.-EU Open Skies

17
US-EU Open Skies transformed market landscapeTrans-Atlantic traffic share of ATI JVs now 75%
Traffic share measured by ASK

18
Ownership

19
But Ownership Restrictions Remain
a. Substantial ownership and effective control of that airline are vested in the other Party,
nationals of that Party, or both

20
Airlines are pursuing more cross-
border ownership arrangements
Chicago Convention introduced sovereignty concept but left to
each nation to define criteria for national carriers
Uncommon to see restrictions allowing above 49% foreign ownership
Recent cross-border investments have focused on
consolidation of network airlines and LCCs
Air France/KLM, IAG, Latam for example
JetStar, Air Asia, Lion Air, Tiger, Indigo Partners
Various legal structures have been used to meet national
ownership and control requirements

21
Many factors drive strategic plans
Airline Business Models
Business Personal
Short-Haul
Long-Haul
Regulatory
Environmen
t
Technology
Airline and
Industry
Strategies
Passenger
Expectations

22
Low cost carriers have changed the industry
Business
30% Travel
40-50%
Revenue
Personal
70% Travel
50-60% Revenue
Short-Haul
65% Travel
Long-Haul
35% Travel
LCCs

23
Southwest was designed to serve
short-haul markets
Capitalized on underserved
short-haul markets
Business shuttle focus
Low fare traffic stimulation
Southwest Airlines in 1971 – “Texas Triangle”
DAL
SAT HOU
24
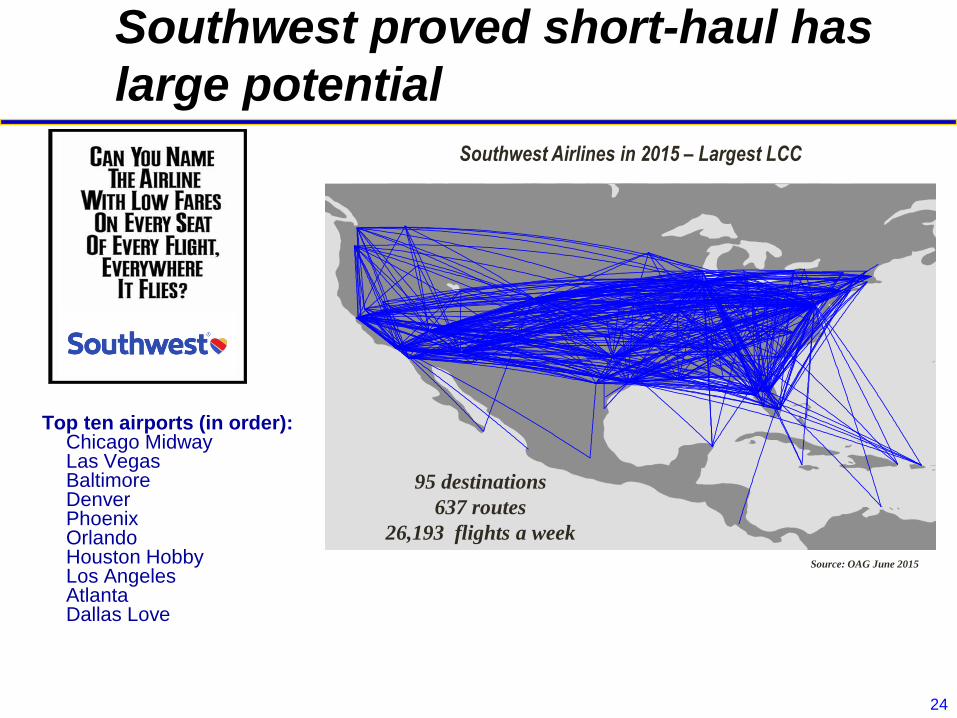
Southwest proved short-haul has
large potential
Top ten airports (in order):Chicago MidwayLas VegasBaltimoreDenverPhoenixOrlandoHouston HobbyLos AngelesAtlantaDallas Love
Source: OAG June 2015
Southwest Airlines in 2015 – Largest LCC
95 destinations
637 routes
26,193 flights a week

2525
Traditional LCC business model characteristics
Traditional LCC business model highly successful, but evolving
• Network/Schedule
• Simplified network (P2P)
• Secondary airports; multiple bases
• Relatively short-haul
• Fare/Product Mix
• One-cabin class
• No seat assignments
• Basic service (reduced frills)
• Ancillary revenues
• No frequent flier program
• Operations
• Common fleet
• High utilization
• Avoidance of global distribution system
• Low labor / avoid unions
• Stand-alone airline (no subsidiaries)

26
19.4
13.711.9
10.3 9.8
02468
101214161820
Avg. of USmajor
networkcarriers
Southwest JetBlue Allegiant Spirit
LCC unit cost advantage is critical
Unit costs in US cents/ASM, 2013
Source: US DOT Form 41
Stage length adjusted to system average
LCCs must achieve at least 20-40% lower cost
than network carriers

27
Low costs and fares stimulate growth
Local traffic and average yields in three Minneapolis
markets before and after LCC entry
Source: Sabre ADI, 2009-20110
150,000
300,000
450,000
600,000
750,000
Denver (DEN) Chicago (MDW) St. Louis (STL)
Before SWA After SWA
22¢
27¢
48¢
30¢
42¢A
nn
ua
l O
&D
Pa
ssen
ger
s
75¢
60¢
45¢
30¢
15¢
16¢

28
LCC websites are powerful tools
Majority of reservations are
via the websites
Cost benefits:
– No commissions
– No GDS fees
Revenue benefits:
– Up-selling opportunities
– Fees for letting other
companies use the website
Relationship benefits:
– Millions of visitors
– Direct, on-going customer
contact

29
LCC business model origin1990: U.S. LCCs growing/emerging in E.U.
Source: Aug 1990 OAG
LCCs in 1990

30
LCC business model has gone worldwide
Oceania
Flights/week: 2,640
km/flight: 1,640
Today LCC’s operating in most regions
SE Asia
Flights/week: 19,740
km/flight: 1,160
NE Asia & China
Flights/week: 11,900
km/flight: 1,040
S Asia
Flights/week: 7,150
km/flight: 1,060
Middle East
Flights/week: 3,250
km/flight: 1,600
Europe & CIS
Flights/week: 39,500
km/flight: 1,190
Latin America
Flights/week: 13,400
km/flight: 980
Source: 2014 Diio/Innovata
Africa
Flights/week: 960
km/flight: 1,080
North America
Flights/week: 39,450
km/flight: 1,400

31| 31
54%
50%
36%
33%
29%
28%
26%
16%
12%
9%
9%
1%
SE Asia
S Asia
Europe
Lat America
N America
World
Oceania
NE Asia
Middle East
Africa
China
Former CIS
Source: Diio/Innovata 2015, jets only
Only Selected Regions Have Low LCC
Penetration2014 LCC market share - measured in annual seats
(by airline domicile)
32
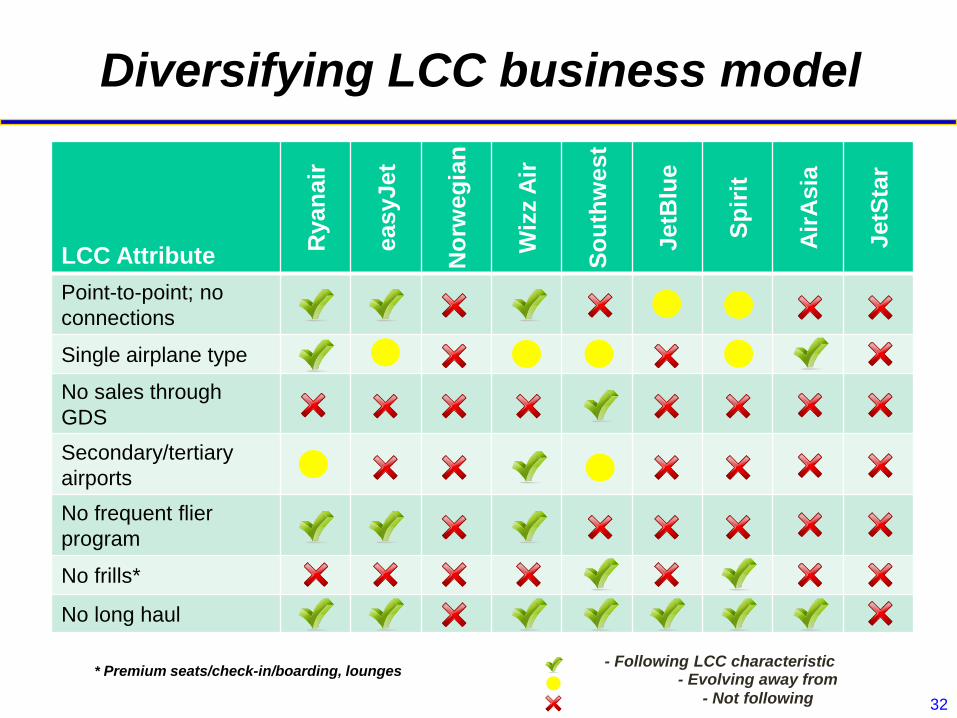
Diversifying LCC business model
LCC Attribute
Ryan
air
easyJet
No
rweg
ian
Wiz
z A
ir
So
uth
west
JetB
lue
Sp
irit
Air
Asia
JetS
tar
Point-to-point; no
connections
Single airplane type
No sales through
GDS
Secondary/tertiary
airports
No frequent flier
program
No frills*
No long haul
* Premium seats/check-in/boarding, lounges- Following LCC characteristic
- Evolving away from
- Not following
33
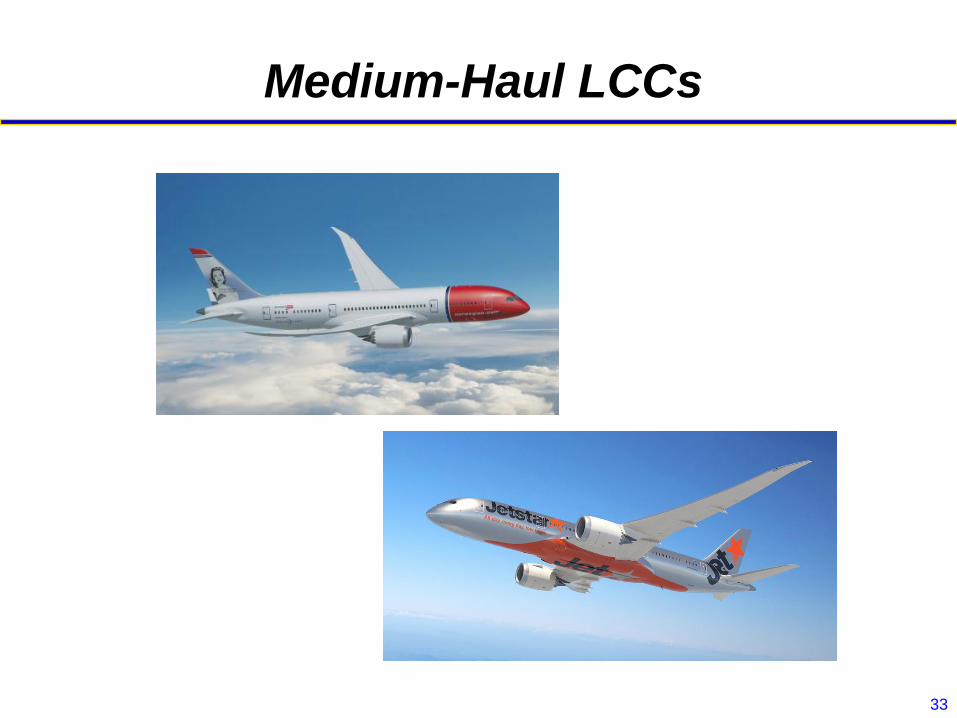
Medium-Haul LCCs

Asia pacific is center of Medium-haul LCCs
OAK-ARN
(8583km)
LAX-CPH
(9024km)
OSL-BKK
(8668km) ARN-BKK
(8291km)
MCO-VCP
(6799km)
RUH-
MNL
(7772km)
JED-KUL
(7060km)
DXB-MNL
(6902km) NRT-OOL
(7237km)
MEL-HNL
(8871km)
SIN-AKL
(8406km)
Source: 2014 Diio/Innovata – for wide-body service from Norwegian, AirAsia X (incl. Thai, Indonesia), Jetstar, Cebu Pacific, Scoot, Azul, Pal Express

35
Global Network business model
Business
30% Travel
40-50%
Revenue
Personal
70% Travel
50-60% Revenue
Short-Haul
65% Travel
Long-Haul
35% Travel
Focus on multiple passenger segments

36
Global network carriers are large
Rank Airline RPK(billions)
1 American Airlines & US Airways 350.7
2 United Airlines 330.9
3 Delta Air Lines 326.6
4 Emirates 230.9
5 Air France-KLM 229.3
6 Lufthansa Group 214.6
7 IAG 202.6
8 Southwest Airlines :LCC 173.9
9 China Southern Airlines 166.6
10 Air China 154.7
Top airlines by RPKs - 2014
Source: ICAO, IATA, airline annual reports, Boeing analysis
RPKs Share
Global
Network
Top 9:34%
37
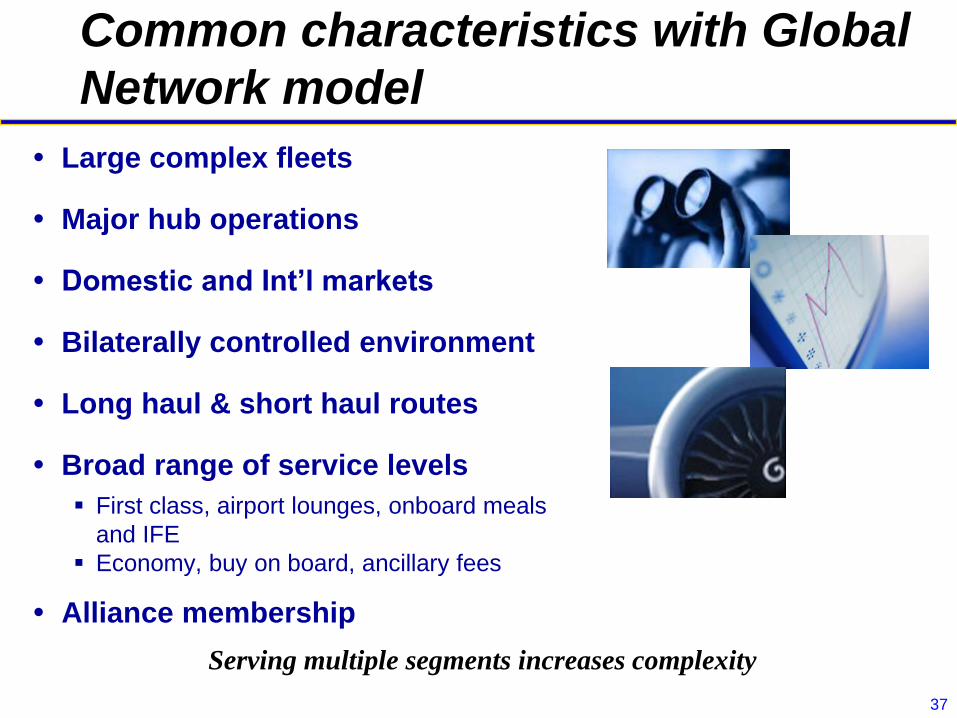
Common characteristics with Global
Network model
Large complex fleets
Major hub operations
Domestic and Int’l markets
Bilaterally controlled environment
Long haul & short haul routes
Broad range of service levels
First class, airport lounges, onboard meals
and IFE
Economy, buy on board, ancillary fees
Alliance membership
Serving multiple segments increases complexity

38
Hubs increase reach of Network airlines
The connecting hub and spoke network has become
the dominant airline business model
City A
City B Hub
City D
City C
City E
City F
3 airplanes : 15 city pairs

39
Hubs must create value
ATH
LHR
DUBMAN
EDI
MIA
LAX
SFO
YVR
ORDYYZ BOS
JFK
IAD
PHL
Example London (LHR) to Athens (ATH)
Other 10
45
10
10
9
8
76
6
65
4
3
3
2
LOCAL PAX 45
CONNECTING PAX 89
134 TOTAL PAX
Collect traffic at one point to create volume for non-stop service

40
Networks are best for serving small markets
0%
2%
4%
6%
8%
10%
12%
14%
16%
<6 <12 <25 <50 <100 <200 <400 <800 <1600 1600+
O&D Passengers per Day
Sh
are
of
Wo
rld
RP
Ks
Connecting Markets Nonstop Markets
Source: Boeing Hub Development Analysis
98% of all of the World’s markets have less than 10 PDEW

41
Gulf 3 success: one stop to everywhere
20
04
20
14
EmiratesQatarEtihad
• 6th Freedom business model
but with differentiation
• Prime location
• Supportive governments
• Efficient operation
• Strong brands
• Enabled by 8000NM aircraft
42
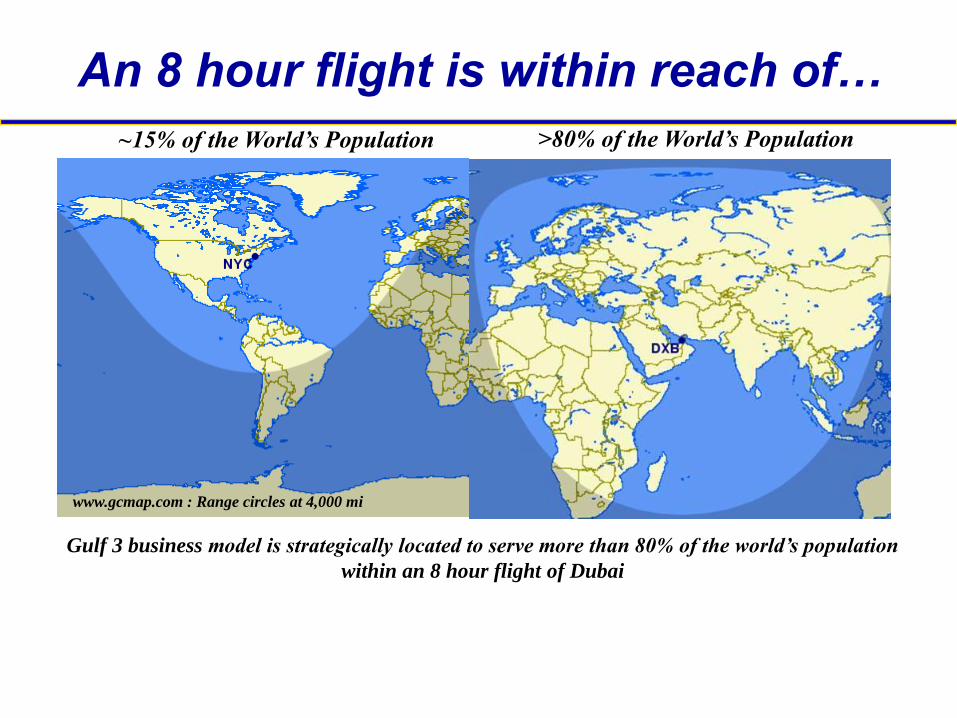
An 8 hour flight is within reach of…
~15% of the World’s Population >80% of the World’s Population
Gulf 3 business model is strategically located to serve more than 80% of the world’s population
within an 8 hour flight of Dubai
www.gcmap.com : Range circles at 4,000 mi

43
Airport congestion can impede network
airline growth
Work to maximize convenience and minimize hassles

44
Business travel is vital to most network airlines
Burning questions
Will business travel keep growing?
How can airlines prevent business
travelers “buying down” to
economy?
Long-haul business travelers value
comfort, convenience, and reliability,
but how much?
Short-haul business travelers
value convenience and reliability,
but are increasingly price sensitive.
What will they value in the future?
Business traveler expectations can change

45
Differentiation for different market
segments
Airport
Boarding pass on
mobile devices
Automated boarding
Lounges
On board
First
Business
Premium Economy
Economy
Value analysis: revenue benefits vs associated costs

46
Non-global Network Carriers face
challenges
Business
30% Travel
40-50%
Revenue
Personal
70% Travel
50-60% Revenue
Short-Haul
65% Travel
Long-Haul
35% Travel
Global Network
Non-global Network
47
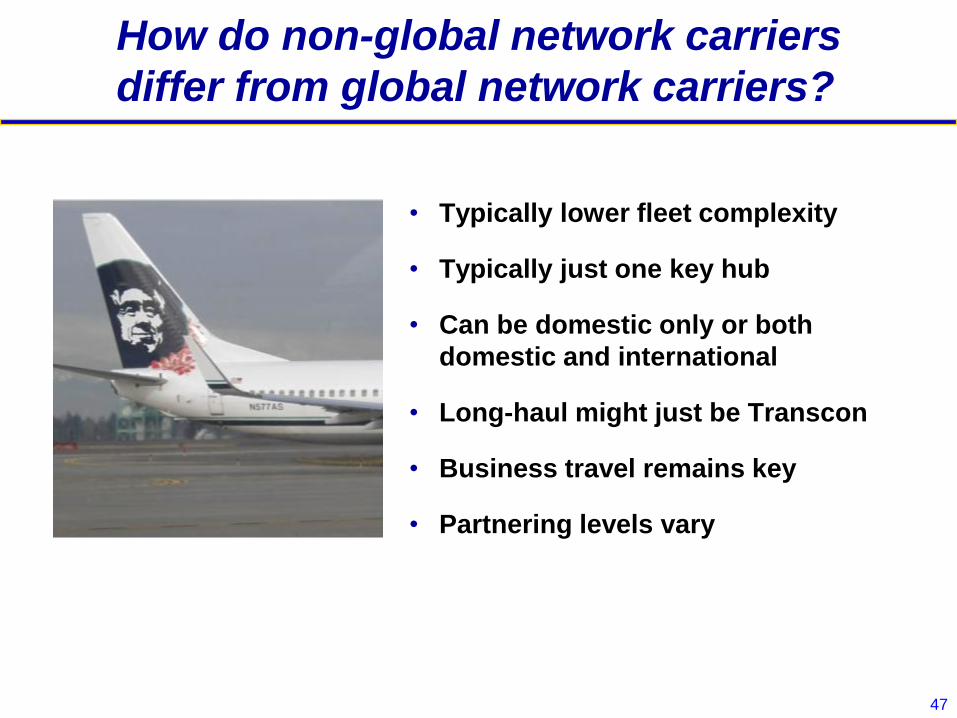
How do non-global network carriers
differ from global network carriers?
• Typically lower fleet complexity
• Typically just one key hub
• Can be domestic only or both
domestic and international
• Long-haul might just be Transcon
• Business travel remains key
• Partnering levels vary

48
Charter Carriers evolving due to LCC
competition
Business
30% Travel
40-50%
Revenue
Personal
70% Travel
50-60% Revenue
Short-Haul
65% Travel
Long-Haul
35% Travel
Global Network
Charter

49
Charter carrier characteristics
• Targets leisure travelers
• Often inclusive tour
packages
• Seasonal markets
• High load factors and
utilization rates
• In direct competition with
LCCs

50
LCC
Business Personal
Short-Haul
Long-Haul
Non-global Network Charter
Global Network
Class exercise
Global Network Carrier Non-global Network Carrier LCC
1 2 3
For the segments shown below:
• What are the challenges in capturing these passengers?
• What strategies/tactics might be used?
Business
Short-Haul
Business
Long-Haul
Business
Short-Haul

51
LOW
HIGH
Limited cooperation on specific routes
Expanded cooperation to develop joint
network
Anti-trustjoint venture
Airline cooperation takes different forms

52
Code sharing routes have increased at a
7.8% CAGR over the last decade
OAG August
Over half of worldwide ASKs are code sharing
-
20
40
60
80
100
120
140
160
180
2002 2003 2004 2005 2006 2007 2008 2009 2010 2011 2012 2013 2014
Billio
ns
Worldwide weekly ASK
Code Sharing
Non code sharing
Code sharing
40.9%
Code sharing
57.1%

Example: Qantas had 134 airport pairs in 2014 flying their own metal
― Own metal ― Partner metal OAG Aug,2014Network (2014)
<Airport-pairs>
Own Partner Total
134

Qantas’s airport pairs 4X with code sharing
― Own metal ― Partner metal OAG Aug,2014Network (2014)
Own Partner Total
134 346 480
<Airport-pairs>

Turkish Network
― Own metal ― Partner metal Innovata Sep 2015Network (Sep 2015)
<Airport-pairs>
Own Partner Total
335 614

Turkish with codeshare
― Own metal ― Partner metal Innovata Sep 2015Network (Sep 2015)
<Airport-pairs>
Own Partner Total
335 279 614

57
Alliances have become a powerful tactic
Expand network / enhance revenue / reduce costs

58
0
5
10
15
20
25
30
1997 1998 1999 2000 2001 2002 2003 2004 2005 2006 2007 2008 2009 2010 2011 2012 2013 2014
One World Sky Team Star
0%
10%
20%
30%
40%
50%
60%
1997 1998 1999 2000 2001 2002 2003 2004 2005 2006 2007 2008 2009 2010 2011 2012 2013 2014Source: OAG, BCA Analysis
Alliances are maturing
Number of Airlines
% of Global Scheduled ASM

59
Star Alliance oneworld SkyTeam Major Unaligned
U.S./Canada
Europe
Asia Pacific
Other
Airline alliances members as of December 2014

60
Deeper partnering and ownership strategies
Subsidiaries
Acquisitions
Mergers

61
Airlines are creating subsidiaries for
many purposes
Broadening customer base
Offering multiple brands
Serving customers in different
regions
Often required by foreign
ownership limits that prevent
full consolidation
Diversifying airline business
activities
Examples
50/50

62
Airlines invest in other airlines for multiple
reasons
40% 21.2%24%
4%
49%
33.3%
29%49%
To gain access to
restricted markets
To gain needed
network feed
To overcome
alliance weakness
To gain valuable
airport slots
Note: Darwin Airline was renamed to
49% 2.98%3.5%
10%
5% 29.9%

63
Airline mergers
Mergers can provide multiple
benefits
Rationalization of costs (including
capacity discipline)
Expand market access and global
reach
Ability to compete with competitor
mergers
Recent major carrier mergers have
been important to remain
competitive
Cross-border mergers can be
highly creative in working with
foreign ownership restrictions
Major mergers

64
Air Freight Express Mail
Air Cargo

65
Two major business models
1. Panalpina
2. Expeditors
3. DB Schenker
4. Kuehne+Nagel
5. Hellmann
Freight forwarders act as intermediaries between airlines and shippers
Express Carrier/Integrators
General Cargo Carrier
66
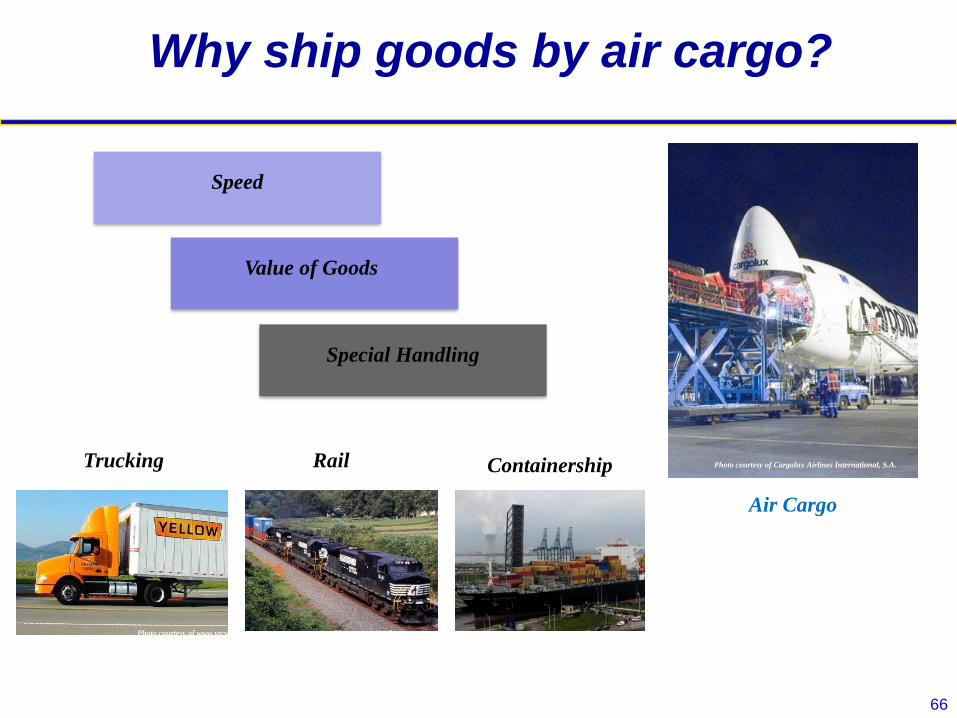
Why ship goods by air cargo?
Photo courtesy of www.yrcw.com Photo courtesy of www.nscorp.com
Photo courtesy of Cargolux Airlines International, S.A.Trucking Rail Containership
Air Cargo
Speed
Value of Goods
Special Handling
67
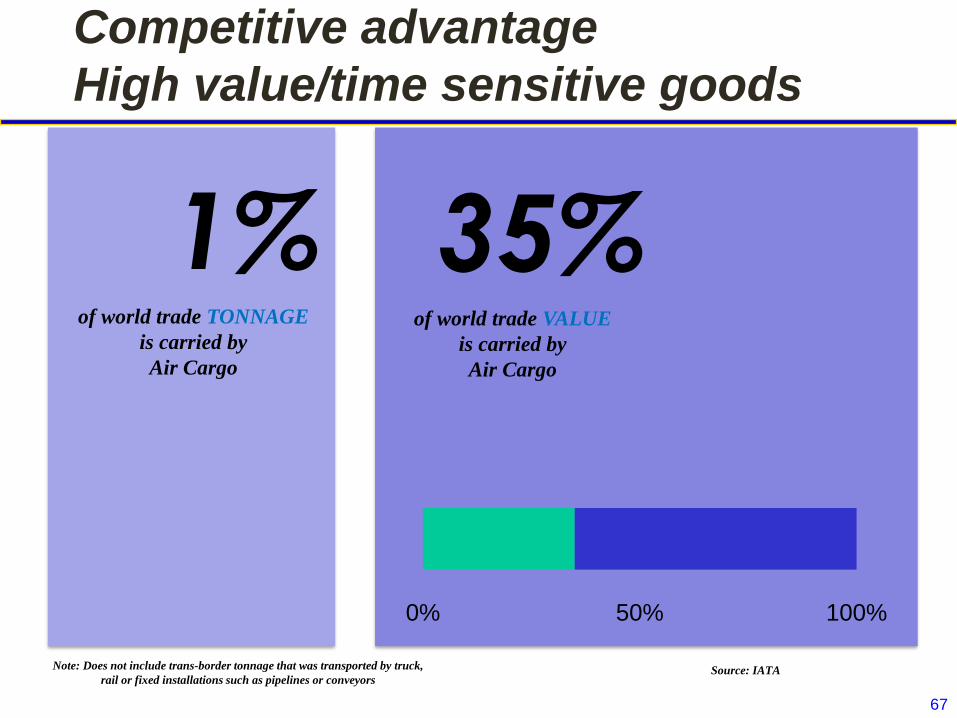
Competitive advantage
High value/time sensitive goods
1%of world trade TONNAGE
is carried by
Air Cargo
35%of world trade VALUE
is carried by
Air Cargo
0% 50% 100%
Note: Does not include trans-border tonnage that was transported by truck,
rail or fixed installations such as pipelines or conveyorsSource: IATA
68
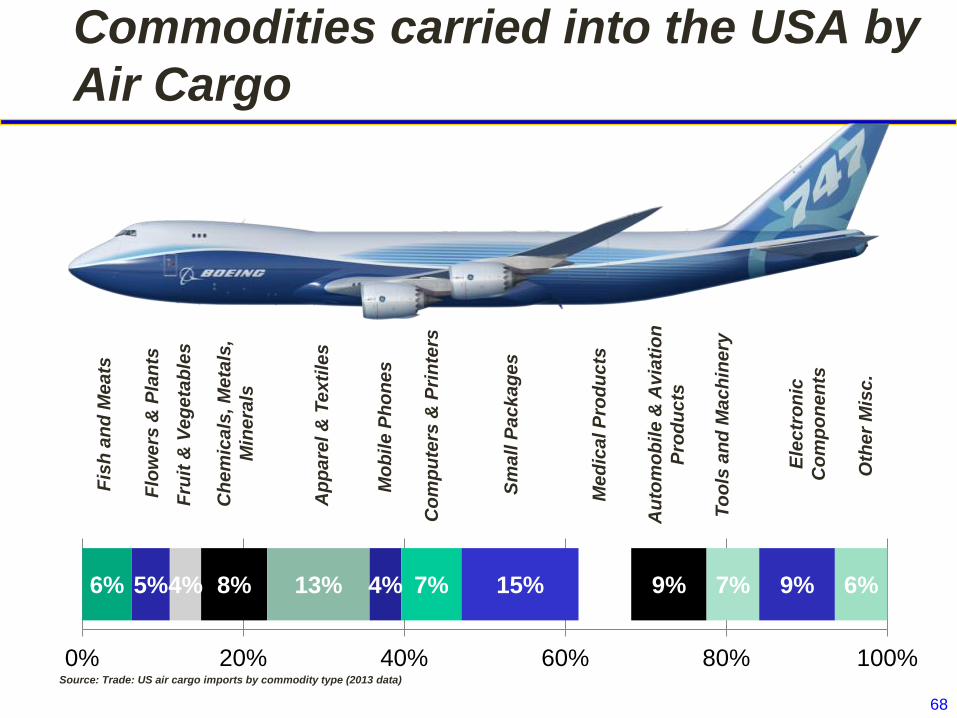
6% 5%4% 8% 13% 4% 7% 15% 7% 9% 7% 9% 6%
0% 20% 40% 60% 80% 100%
Fis
h a
nd
Me
ats
Flo
we
rs &
Pla
nts
Fru
it &
Ve
ge
tab
les
Ch
em
ica
ls, M
eta
ls,
Min
era
ls
Ap
pa
rel &
Te
xti
les
Mo
bil
e P
ho
ne
s
Co
mp
ute
rs &
Pri
nte
rs
Sm
all
Pa
ck
ag
es
Me
dic
al P
rod
uc
ts
Au
tom
ob
ile
& A
via
tio
n
Pro
du
cts
To
ols
an
d M
ac
hin
ery
Ele
ctr
on
ic
Co
mp
on
en
ts
Oth
er
Mis
c.
Source: Trade: US air cargo imports by commodity type (2013 data)
Commodities carried into the USA by
Air Cargo

69
Total air cargo industry revenue by business model
Express carriers
38%
Combination carriers
41%
All cargo11%
Passenger belly only
10%
World air cargo revenue
$92.6 billion
Express
carriers$35.1B
Combination
carriers
$38.3B
Passenger
belly only$9.5B
All cargo$9.7B
Sources: Air Transport Intelligence, U.S. DOT F41, Boeing estimates, and airline reports. (2012
Data)
Freighters, directly or indirectly, contribute to 90% of total air cargo industry revenue

70
80% AsiaN America Cargo Carried on Maindeck
Daily Flights
Pax
flights
Converting
lower hold
capacity to
equivalent
freighter flights
logistic/
destination
range
LF
regulations
Source: Innovata, DOT T-100, 2013, Boeing Analysis
60-7050-60
10
150
Equivalent
freighter
flights
Total
freighter
flights
Freighter
flights

71
Freighter service advantages over passenger belly
Cargo focus and control
Timing and routing
Capacity (volume, weight, hazmat & dimensional)
Handling location and ramp proximity
Reliability and predictability
Freighters will remain the leading cargo capacity provider

72
Key Takeaways
A good strategy is critical for success
Customers (passengers) need to be at the center of
your plan
Relentless focus on many external factors
The regulatory environment is a key external factor
No one airline business model is “right”
No specific partnering level is “right”
Good strategy is also key for air cargo success

73
MonteCristoAir Case Study Connection
What is MonteCristoAir’s current strategy?
Given the key factors MonteCristoAir is facing, does their
strategy need updating?
What are the key regulatory issues facing them?
What is their current business model?
How should they adapt their business model to fit their
environment?
What partnering level is right for MonteCristoAir?
Should air cargo be part of their operations?