
its programs, facilities, and employment without regard …€¦ · its programs, facilities, and...
79
Transcript of its programs, facilities, and employment without regard …€¦ · its programs, facilities, and...

The University of Minnesota is committed to the policy that all persons shall have equal access toits programs, facilities, and employment without regard to race, color, creed, religion, national origin, sex,age, marital status, disability, public assistance status, veteran status, or sexual orientation.
Information on other titles in this series may be obtained from Waite Library, University ofMinnesota, Department of Applied Economics, 1994 Buford Avenue, 232 ClaOff, St. Paul, MN 55108-6040, U.S.A. The Waite Library e-mail address is: [email protected]. This paper is availableelectronically from AgEcon Search at http://agecon.lib.umn.edu.
The entire report is available at: http://apec.umn.edu/faculty/kolson/currentres.html

i
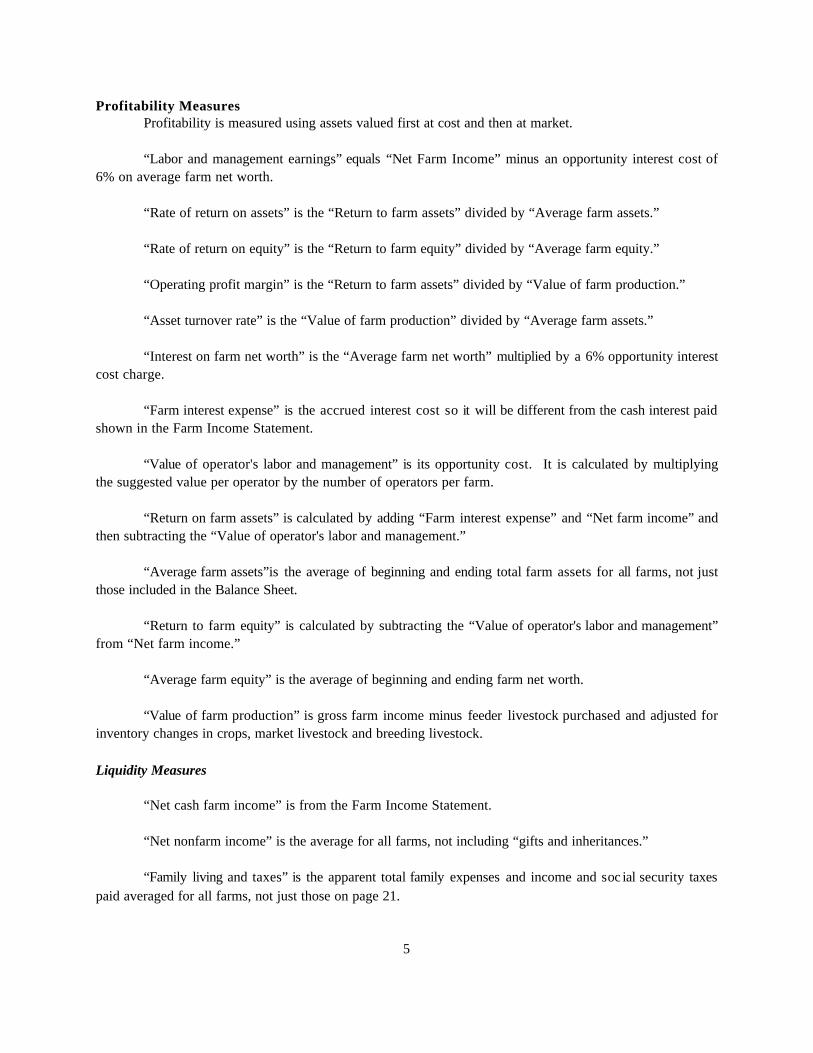
Figure 1. Average Accrual Net Farm Income
-50,000
-25,0000
25,00050,000
75,000100,000125,000
82 83 84 85 86 87 88 89 90 91 92 93 94 95 96 97 98 99 00 01
Year
Dol
lars
per
Far
m
Nominal $ Constant $ Labor & Mgt $ NFI (new depr)
EXECUTIVE SUMMARY
2001 ANNUAL REPORT OF THE SOUTHWESTERN MINNESOTAFARM BUSINESS MANAGEMENT ASSOCIATION
by Kent D. Olson, Erlin J. Weness, Robert D. Anderson, James L. Christensen,Perry A. Fales, and Dale W. Nordquist
Average net farm income was $36,614 in 2001 for the 207 farms included in this annual report of theSouthwestern Minnesota Farm Business Management Association. This is a sharp drop (55%) from the averagenet farm income of $81,750 in 2000 (Figure 1).
As in previous years, the actual profit levels experienced by individual farms vary greatly from the overallaverage profit. When the net farm incomes for the 207 farms in the report are ranked from lowest to highest,the resulting graph shows how much the incomes do vary (Figure 2). Twenty-four percent of the farmsexperienced negative net farm income in 2001; 8% had incomes over $100,000. Most of the net farm incomesranged from below 0 to about $150,000. The median or middle income was $29,040. The high 20% of the farmshad an average net farm income of $130,230 which is a 35% decrease from 2000. The low 20% of the farms hadan average loss of $32,064 in 2000 which is much worse than 2000.
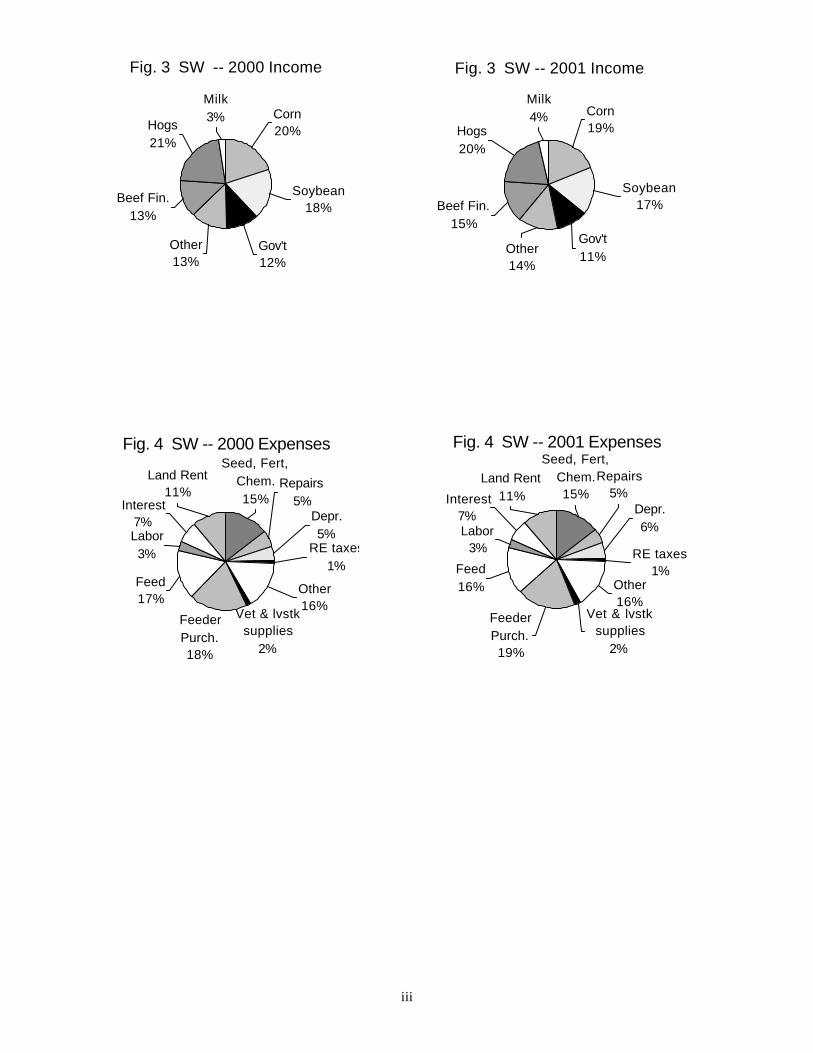
Average gross cash farm income in 2001 was $433,698. This was a 3% increase from 2000. Foursources of sales again dominated: hogs, corn, soybeans, and beef finishing (Figure 3). These sources were quitestable between 2000 and 2001 except beef finishing which increased by 14%.
Government payments of all types decreased slightly to $48,208 per average farm in 2001. Governmentpayments for the average farm were $50,567 in 2000, $44,674 in 1999, $30,021 in 1998, and $12,257 in 1997. Asa percentage of total income, government payments were 11% in 2001, compared to 12% in 2000, 11% in 1999,8% in 1998, and 3% in 1997.
Cash expenses increased 3% to an average of $358,506 in 2001. As a percentage of both cash expensesand depreciation in 2001, feeder purchases; feed, seed, fertilizer, and crop chemicals; and land rent continue todominate (Figure 4).

ii
Figure 2. Distribution of Net Farm Income(SWMFBMA 2001)
-$100,000
$0
$100,000
$200,000
$300,000
$400,000
$500,000
$600,000
1 51 101 151 201
Farm rank
Net
Far
m In
com
e pe
r far
m
NFI by farmAverage NFIMedian NFI
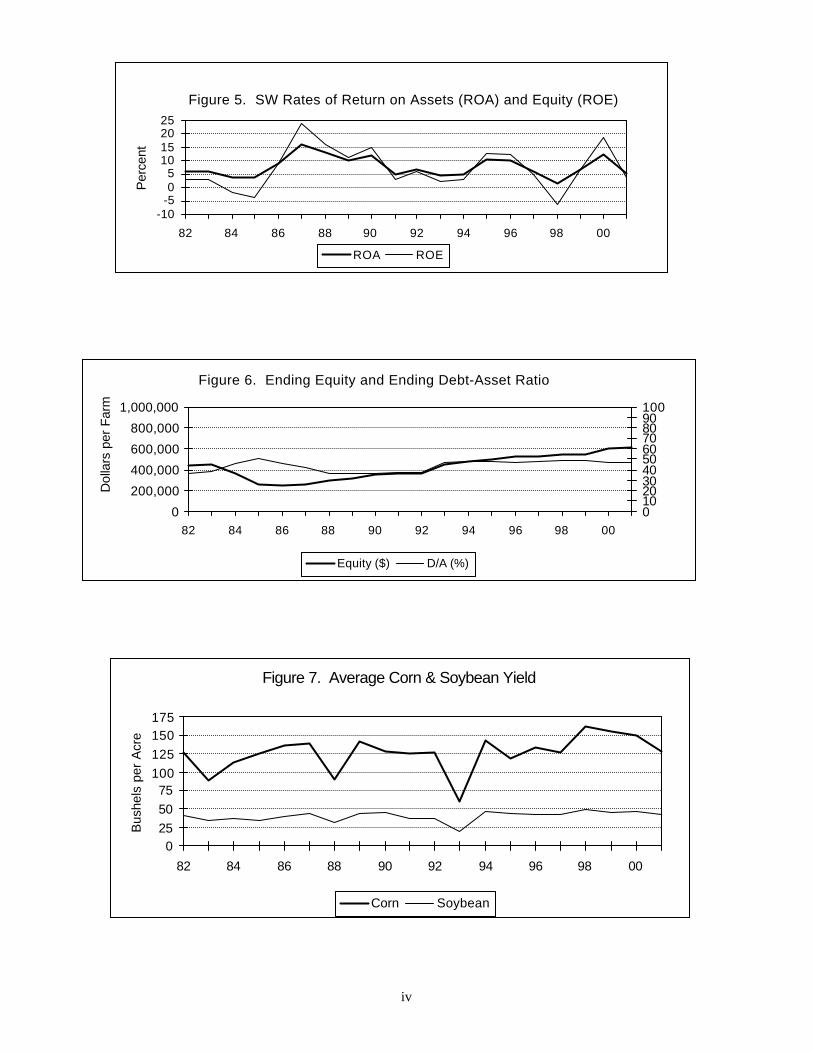
Both the average rate of return on assets (ROA) and the rate of return to equity (ROE) decreasedsubstantially in 2001 compared to 2000 (Figure 5). In 2001 ROA averaged 6% and ROE was 4% using assetsvalued on a cost basis.
Using a market value basis, average total equity (of the 178 sole proprietors) was $618,197 at the end of2001. This was an increase of $20,730 during the year for these 178 farms (p. 17). Average equity has continuedto improve since 1986. The average debt-asset ratio did not change, it remained at 47% at the end of 2001(Figure 6).
The average corn yield was 128 bushels per acre; soybeans were at 42 bushels per acre (Figure 7). Bothyields were lower than the previous 3 years.
Results by Type of Farm
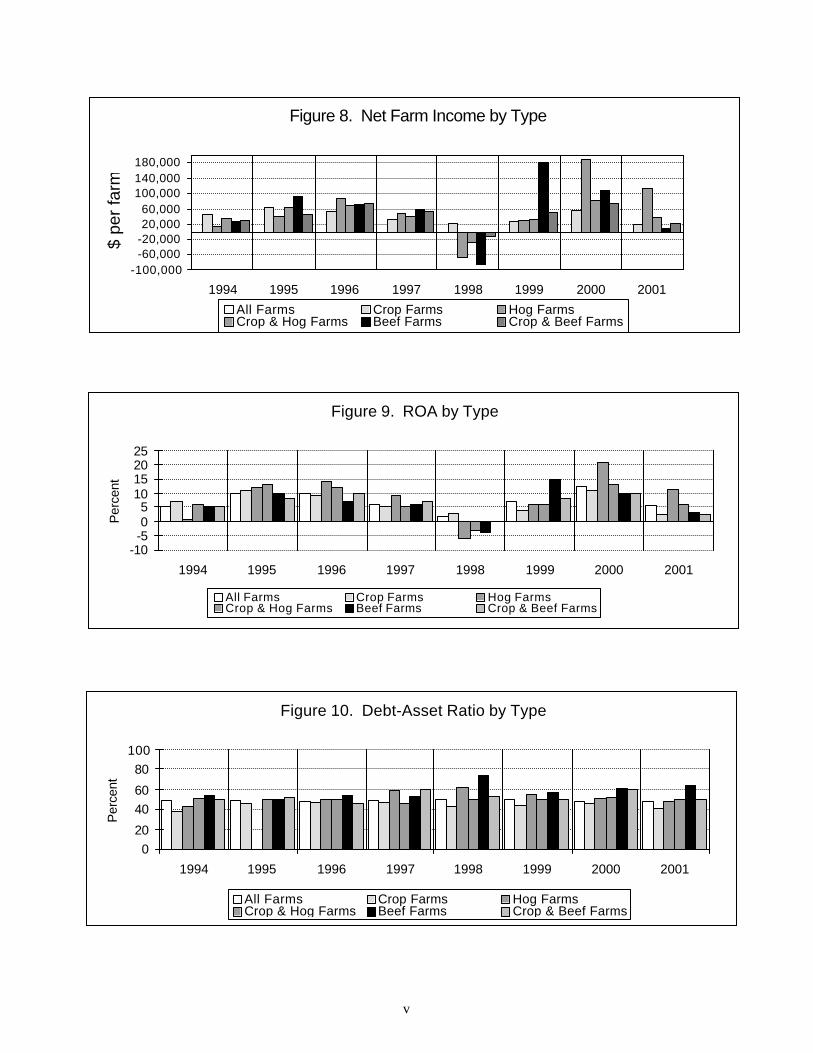
The 207 farms in the report were classified as a certain type of farm (e.g., hog) on the basis of having70 percent or more of their gross sales from that category. Using this 70 percent rule in 2001, there were 107crop farms, 11 hog farms, 22 crop and hog farms, 9 beef farms, and 12 crop and beef farms. (There were 40farms which did not have a single source (or pair of sources) of income over 70%.)
Compared to 2000, all types of farms (except beef farms) had lower net farm incomes in 2001 (Figure8). A similar story can be seen in the rate of return to assets (ROA) (Figure 9). (Assets are valued on a cost-basis for ROA).
Using assets valued on a market basis, the average crop farm has a debt-to-asset ratio of 41% at the endof 2001 (Figure 10). Farms with 70% of their income from beef only had an average debt-to-asset ratio higherthan 50%.
The report provides additional information on profitability, liquidity, and solvency as well as other whole-farm information and detailed information on crop and livestock enterprises. Also reported are whole-farmfinancial condition and performance by county, sales size class, and type of farm.
iii
Fig. 3 SW -- 2000 Income
Soybean18%
Gov't12%
Other13%
Beef Fin.13%
Hogs21%
Milk3% Corn
20%
Fig. 3 SW -- 2001 Income
Gov't11%Other
14%
Corn19%
Milk4%
Hogs20%
Beef Fin.15%
Soybean17%
Fig. 4 SW -- 2000 Expenses
Depr.5%
RE taxes1%
Repairs5%
Seed, Fert, Chem.15%
Vet & lvstk supplies
2%
Land Rent11%
Interest7%
Feed17%
Labor3%
Feeder Purch.18%
Other16%
Fig. 4 SW -- 2001 Expenses
Vet & lvstk supplies
2%
Feeder Purch.19%
Labor3%
Interest7%
Feed16% Other
16%
RE taxes1%
Depr.6%
Repairs5%
Seed, Fert, Chem.15%
Land Rent11%
iv
-10-505
10152025
82 84 86 88 90 92 94 96 98 00
Per
cent
ROA ROE
Figure 5. SW Rates of Return on Assets (ROA) and Equity (ROE)
0
200,000
400,000
600,000
800,000
1,000,000
82 84 86 88 90 92 94 96 98 00
Dol
lars
per
Far
m
0102030405060708090100
Equity ($) D/A (%)
Figure 6. Ending Equity and Ending Debt-Asset Ratio
Figure 7. Average Corn & Soybean Yield
0255075
100125150175
82 84 86 88 90 92 94 96 98 00
Bus
hels
per
Acr
e
Corn Soybean
v
Figure 8. Net Farm Income by Type
-100,000-60,000-20,00020,00060,000
100,000140,000180,000
1994 1995 1996 1997 1998 1999 2000 2001
$ pe
r fa
rm
All Farms Crop Farms Hog FarmsCrop & Hog Farms Beef Farms Crop & Beef Farms
Figure 9. ROA by Type
-10-505
10152025
1994 1995 1996 1997 1998 1999 2000 2001
Per
cent
All Farms Crop Farms Hog FarmsCrop & Hog Farms Beef Farms Crop & Beef Farms
Figure 10. Debt-Asset Ratio by Type
020
4060
80100
1994 1995 1996 1997 1998 1999 2000 2001
Per
cent
All Farms Crop Farms Hog FarmsCrop & Hog Farms Beef Farms Crop & Beef Farms

vi

1Olson is Professor, University of Minnesota-Twin Cities; Weness, Anderson, and Christensen areExtension Educators--Farm Management and Fieldmen for the Association; Fales is a retired ExtensionEducator, Nordquist is Extension Economist--Farm Management, University of Minnesota, Twin Cities. RannLoppnow, Assistant Extension Economist--Farm Management, was the programmer for RankEm Central (theanalysis package used to prepare this report).
1
2001 ANNUAL REPORT OF THE SOUTHWESTERN MINNESOTAFARM BUSINESS MANAGEMENT ASSOCIATION
byKent D. Olson, Erlin J. Weness, Robert D. Anderson, James L. Christensen,
Perry A. Fales, and Dale W. Nordquist1
This report summarizes the individual farm records of the members of the Southwestern MinnesotaFarm Business Management Association for 2001.
Whole-farm information and enterprise costs and returns are reported. The year-end analysis of theindividual farms was performed by the fieldmen using FINPACK 2001 from the Center for Farm FinancialManagement within the Department of Applied Economics. The individual analyses were summarized at theDepartment of Applied Economics using RankEm Central. In addition to the average of all farms, theaverages for the high and low income groups are also presented. The tables are divided into four majorgroups: whole-farm information, crop enterprises, livestock enterprises, and summary information. Thesummary information includes information on the prices used in the analysis, and whole-farm information overtime and by county, gross income class, type of farm, and operator.
Of the 228 farms in the Southwestern Association, the data for 207 farms are included in this report.The rest were omitted because the records were incomplete at the time that this report was prepared. In twoseparate studies the farmers who belong to a management association were found to be larger than theaverage farm reported by the agricultural census and were more likely to have livestock.
Reflecting the statewide trend of decreasing number of farms with livestock, the Association also hasfewer farms with livestock. In order to provide information with fewer farms, the livestock enterprise reportsinclude farms from both the Southwestern and Southeastern Associations.
In addition to this report, members receive an annual farm business analysis; on-farm instructionalvisits; end-of-year income tax planning and preparation; periodic meetings, tours, and seminars; a monthlynewsletter; and other managerial and educational assistance. Each farmer pays an annual fee which coversa large part of the cost, with the balance defrayed by the Minnesota Extension Service and research programsof the University of Minnesota.
Erlin Weness has been a fieldman for the Association and an extension educator at the Universityof Minnesota since 1968. For 35 years, members of the Association, farmers in Minnesota, and theUniversity have benefitted from Erlin’s wisdom, dedication, and perseverance. He has given uncountablepresentations; written many factsheets, articles, newsletters, and papers; and helped an innumerable numberof farmers. In 2000, he won the Distinguished Extension Faculty Award. He has always strived to helpfarmers survive and prosper. For all this the Southwestern Association says a huge thank you as he retiresin June 2002, and a wish for all the best in the future.

2
SOUTHWESTERN MINNESOTA FARM BUSINESS MANAGEMENT ASSOCIATION
DISTRIBUTION OF MEMBERSHIP -- 2001
Number of Number ofFarm Records
County Units Submitted
Cottonwood 46 37Jackson 25 23Martin 12 12Murray 31 31Nobles 40 41Pipestone 12 12Redwood 38 37Watonwan 11 8Others2 11 11TOTAL 228 212
Mike Landuyt, PresidentKip Rassmussen, Vice PresidentJanet Froslan, Secretary-Treasurer
The directors of the Southwestern Minnesota Farm Business Management Association in 2001were: Ronald Dahl, Eric Fultz, Michael Landuyt, Mark Loewen, Mark Malecek, Kip Rassmussen, DanRiley, Harlan Spronk, and Matt Surprenant.
2In 2001 the Association had records submitted from members in Brown, Faribault, Lyon, Nicollet,Rock, and Yellow Medicine counties, in addition to the counties listed individually.

3
SOUTHWESTERN MINNESOTA FARM BUSINESS MANAGEMENT ASSOCIATIONTABLE OF CONTENTS
Page Explanatory Notes for the Whole-farm Reports . . . . . . . . . . . . . . . . . . . . . . . . . . . . . . . . . . . . . . 4-9
Farm Income Statement . . . . . . . . . . . . . . . . . . . . . . . . . . . . . . . . . . . . . . . . . . . . . . . . . 10-11 Inventory Changes . . . . . . . . . . . . . . . . . . . . . . . . . . . . . . . . . . . . . . . . . . . . . . . . . . . . . . . 12 Depreciation and Other Capital Adjustments . . . . . . . . . . . . . . . . . . . . . . . . . . . . . . . . . . . . . . 13 Profitability Measures . . . . . . . . . . . . . . . . . . . . . . . . . . . . . . . . . . . . . . . . . . . . . . . . . . . . . 14 Liquidity Measures . . . . . . . . . . . . . . . . . . . . . . . . . . . . . . . . . . . . . . . . . . . . . . . . . . . . . . . 15 Balance Sheet at COST Values . . . . . . . . . . . . . . . . . . . . . . . . . . . . . . . . . . . . . . . . . . . . . . . 16 Balance Sheet at MARKET Values . . . . . . . . . . . . . . . . . . . . . . . . . . . . . . . . . . . . . . . . . . . . . 17 Statement of Cash Flows . . . . . . . . . . . . . . . . . . . . . . . . . . . . . . . . . . . . . . . . . . . . . . . . . . . 18 Financial Standards Measures . . . . . . . . . . . . . . . . . . . . . . . . . . . . . . . . . . . . . . . . . . . . . . . 19 Crop Production and Marketing Summary . . . . . . . . . . . . . . . . . . . . . . . . . . . . . . . . . . . . . . . 20 Household and Personal Expenses . . . . . . . . . . . . . . . . . . . . . . . . . . . . . . . . . . . . . . . . . . . . . 21 Operator and Labor Information . . . . . . . . . . . . . . . . . . . . . . . . . . . . . . . . . . . . . . . . . . . . . . 22 Nonfarm Summary . . . . . . . . . . . . . . . . . . . . . . . . . . . . . . . . . . . . . . . . . . . . . . . . . . . . . . . 23
Explanatory Notes for Crops Tables . . . . . . . . . . . . . . . . . . . . . . . . . . . . . . . . . . . . . . . . . . . . . . . 25 Corn on Owned Land . . . . . . . . . . . . . . . . . . . . . . . . . . . . . . . . . . . . . . . . . . . . . . . . . . . . . 26 Corn on Cash Rented Land . . . . . . . . . . . . . . . . . . . . . . . . . . . . . . . . . . . . . . . . . . . . . . . . . . 27 Corn on Share Rented Land . . . . . . . . . . . . . . . . . . . . . . . . . . . . . . . . . . . . . . . . . . . . . . . . . 28 Soybeans on Owned Land . . . . . . . . . . . . . . . . . . . . . . . . . . . . . . . . . . . . . . . . . . . . . . . . . . 29 Soybeans on Cash Rented Land . . . . . . . . . . . . . . . . . . . . . . . . . . . . . . . . . . . . . . . . . . . . . . 30 Soybeans on Share Rented Land . . . . . . . . . . . . . . . . . . . . . . . . . . . . . . . . . . . . . . . . . . . . . . 31 Oats on Owned Land . . . . . . . . . . . . . . . . . . . . . . . . . . . . . . . . . . . . . . . . . . . . . . . . . . . . . . 32 Oats on Cash Rented Land . . . . . . . . . . . . . . . . . . . . . . . . . . . . . . . . . . . . . . . . . . . . . . . . . . 33 Corn Silage on Owned Land . . . . . . . . . . . . . . . . . . . . . . . . . . . . . . . . . . . . . . . . . . . . . . . . . 34 Corn Silage on Cash Rented Land . . . . . . . . . . . . . . . . . . . . . . . . . . . . . . . . . . . . . . . . . . . . . 35 Hay, Alfalfa on Owned Land . . . . . . . . . . . . . . . . . . . . . . . . . . . . . . . . . . . . . . . . . . . . . . . . . 36 Hay, Alfalfa on Cash Rented Land . . . . . . . . . . . . . . . . . . . . . . . . . . . . . . . . . . . . . . . . . . . . . 37 Pasture on Owned Land . . . . . . . . . . . . . . . . . . . . . . . . . . . . . . . . . . . . . . . . . . . . . . . . . . . . 38 Pasture on Cash Rented Land . . . . . . . . . . . . . . . . . . . . . . . . . . . . . . . . . . . . . . . . . . . . . . . . 39 Peas on Owned Land . . . . . . . . . . . . . . . . . . . . . . . . . . . . . . . . . . . . . . . . . . . . . . . . . . . . . . 40 Peas on Cash Rented Land . . . . . . . . . . . . . . . . . . . . . . . . . . . . . . . . . . . . . . . . . . . . . . . . . . 41 Sweet Corn on Owned Land . . . . . . . . . . . . . . . . . . . . . . . . . . . . . . . . . . . . . . . . . . . . . . . . . 42 Sweet Corn on Cash Rented Land . . . . . . . . . . . . . . . . . . . . . . . . . . . . . . . . . . . . . . . . . . . . . 43 CRP on Owned Land . . . . . . . . . . . . . . . . . . . . . . . . . . . . . . . . . . . . . . . . . . . . . . . . . . . . . . 44 CRP on Cash Rented Land . . . . . . . . . . . . . . . . . . . . . . . . . . . . . . . . . . . . . . . . . . . . . . . . . . 45 Rented Out on Owned Land . . . . . . . . . . . . . . . . . . . . . . . . . . . . . . . . . . . . . . . . . . . . . . . . . 46
Explanatory Notes for Livestock Tables . . . . . . . . . . . . . . . . . . . . . . . . . . . . . . . . . . . . . . . . . . . . . 47 Hogs, Farrow-to-Finish--Average Per Litter . . . . . . . . . . . . . . . . . . . . . . . . . . . . . . . . . . . . . . 48 Hogs, Farrow-to-Finish--Average Per Cwt. Produced . . . . . . . . . . . . . . . . . . . . . . . . . . . . . . . 49 Hogs, Finish Feeder Pigs--Average Per Head . . . . . . . . . . . . . . . . . . . . . . . . . . . . . . . . . . . . . 50 Hogs, Finish Feeder Pigs--Average Per Cwt. Produced . . . . . . . . . . . . . . . . . . . . . . . . . . . . . . 51 Hogs, Weaning to Finish--Average Per Head . . . . . . . . . . . . . . . . . . . . . . . . . . . . . . . . . . . . . . 52 Hogs, Weaning to Finish--Average Per Cwt. Produced . . . . . . . . . . . . . . . . . . . . . . . . . . . . . . 53 Hogs, Contractee--Average Per Pig Space . . . . . . . . . . . . . . . . . . . . . . . . . . . . . . . . . . . . . . . 54 Beef Cow-Calf--Average Per Cow . . . . . . . . . . . . . . . . . . . . . . . . . . . . . . . . . . . . . . . . . . . . 55 Beef, Finish Beef Calves--Average Per Head . . . . . . . . . . . . . . . . . . . . . . . . . . . . . . . . . . . . . 56 Beef, Finish Beef Calves--Average Per Cwt. Produced . . . . . . . . . . . . . . . . . . . . . . . . . . . . . . 57 Dairy--Average Per Cow . . . . . . . . . . . . . . . . . . . . . . . . . . . . . . . . . . . . . . . . . . . . . . . . . . . 58 Dairy Replacement Heifers--Average Per Head Sold/Trans . . . . . . . . . . . . . . . . . . . . . . . . . . . 59 Dairy and Replacement Heifers--Average Per Cow . . . . . . . . . . . . . . . . . . . . . . . . . . . . . . . . . 60 Dairy Steers--Average Per Head . . . . . . . . . . . . . . . . . . . . . . . . . . . . . . . . . . . . . . . . . . . . . . 61 Dairy Steers--Average Per Cwt. Produced . . . . . . . . . . . . . . . . . . . . . . . . . . . . . . . . . . . . . . 62 Prices Used in the Analysis . . . . . . . . . . . . . . . . . . . . . . . . . . . . . . . . . . . . . . . . . . . . . . . . . . 63
Explanatory Notes for the Summary Tables . . . . . . . . . . . . . . . . . . . . . . . . . . . . . . . . . . . . . . . . . 65 Financial Summary of the Whole-Farm Analysis by Years . . . . . . . . . . . . . . . . . . . . . . . . . 66-67 Financial Summary -- by County . . . . . . . . . . . . . . . . . . . . . . . . . . . . . . . . . . . . . . . . . . . . . . 68 Financial Summary -- by Gross Farm Income . . . . . . . . . . . . . . . . . . . . . . . . . . . . . . . . . . . . 69 Financial Summary -- Farm Type . . . . . . . . . . . . . . . . . . . . . . . . . . . . . . . . . . . . . . . . . . . . . 70 Financial Summary -- by Age of Operator . . . . . . . . . . . . . . . . . . . . . . . . . . . . . . . . . . . . . . . 71

4
EXPLANATORY NOTES FOR THE WHOLE-FARM REPORTS
The whole-farm reports (except for the balance sheets) include the same number of farms, whichwere all of the farms whose records were judged to be of sufficient quality. The Balance Sheets include onlysole proprietors; partnerships and corporations are excluded because some debt is held outside of the businesscausing potential misinterpretations of the average financial condition.
Rounding of individual items may have caused minor discrepancies between those items and theprinted totals which are calculated before rounding.
Farm Income Statement
The Farm Income Statement is a summary of income, expenses, and resultant profit or loss fromfarming operations during the calendar year. The first section lists cash farm income from all sources. Thesecond section lists cash expenses. “Interest” includes only interest actually paid. No opportunity chargeson farm equity capital or unpaid labor are included. The difference between “Gross Cash Farm Income” and“Total Cash Expense” is the “Net Cash Farm Income.” This is net farm income on a cash basis.
The third and fourth sections deal with noncash changes in the farm business. The “InventoryChanges” and “Depreciation and Other Capital Adjustments” sections are used to convert the cash incomestatement (Net Cash Farm Income) derived from the first two sections into an accrual income statement.The resulting “Net Farm Income” represents the return to the operator's and family's unpaid labor,management, and equity capital (net worth). In other words, it represents the return to all of the resourceswhich are owned by the farm family and, hence, not purchased or paid a wage. However, it does not includeany asset appreciation, debt forgiveness or asset repossessions.
Inventory Changes
This is the detailed statement of inventory changes which is summarized in the Farm IncomeStatement. It includes beginning and ending inventories and the calculated changes.
Depreciation and Other Capital Adjustments
This is the detailed statement of depreciation and other capital adjustments which is summarized inthe Farm Income Statement. It includes beginning and ending inventories (valued at cost), sales, purchases,and depreciation.
The accounting method for calculating depreciation was changed this year (2000). Previously, taxdepreciation was used. The new method is designed to estimate actual economic depreciation more closely.The new method depreciates machinery and equipment at 12% of beginning cost basis plus boot purchasesless basis of sales items. For buildings and other improvements, the percentage was 8%; for breeding stock,the percentage varied between 20 to 25%.
5
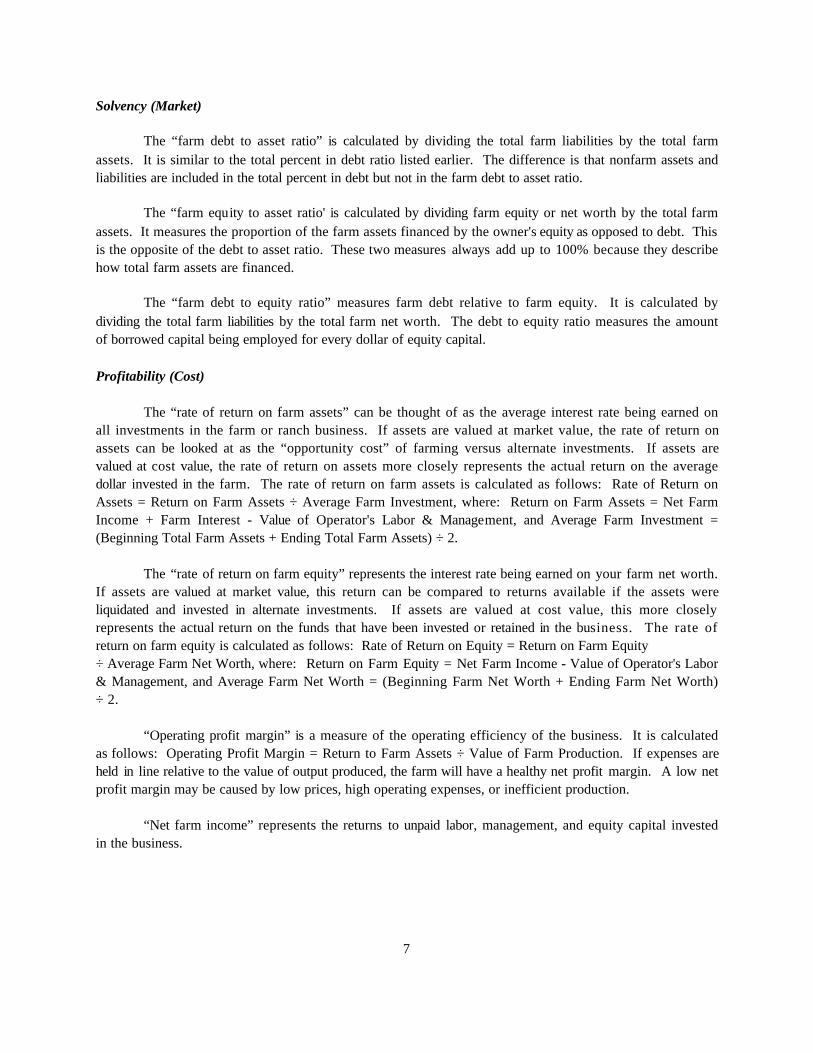
Profitability MeasuresProfitability is measured using assets valued first at cost and then at market.
“Labor and management earnings” equals “Net Farm Income” minus an opportunity interest cost of6% on average farm net worth.
“Rate of return on assets” is the “Return to farm assets” divided by “Average farm assets.”
“Rate of return on equity” is the “Return to farm equity” divided by “Average farm equity.”
“Operating profit margin” is the “Return to farm assets” divided by “Value of farm production.”
“Asset turnover rate” is the “Value of farm production” divided by “Average farm assets.”
“Interest on farm net worth” is the “Average farm net worth” multiplied by a 6% opportunity interestcost charge.
“Farm interest expense” is the accrued interest cost so it will be different from the cash interest paidshown in the Farm Income Statement.
“Value of operator's labor and management” is its opportunity cost. It is calculated by multiplyingthe suggested value per operator by the number of operators per farm.
“Return on farm assets” is calculated by adding “Farm interest expense” and “Net farm income” andthen subtracting the “Value of operator's labor and management.”
“Average farm assets”is the average of beginning and ending total farm assets for all farms, not justthose included in the Balance Sheet.
“Return to farm equity” is calculated by subtracting the “Value of operator's labor and management”from “Net farm income.”
“Average farm equity” is the average of beginning and ending farm net worth.
“Value of farm production” is gross farm income minus feeder livestock purchased and adjusted forinventory changes in crops, market livestock and breeding livestock.
Liquidity Measures
“Net cash farm income” is from the Farm Income Statement.
“Net nonfarm income” is the average for all farms, not including “gifts and inheritances.”
“Family living and taxes” is the apparent total family expenses and income and soc ial security taxespaid averaged for all farms, not just those on page 21.

6
“Real estate principal payments” are taken from the farmer's data.
“Cash available for intermediate debt service” on the cash basis is “Total net income” minus “Familyliving and taxes” and “Real estate principal payments.” “Available for intermediate debt service” on theaccrual basis is “Net accrual operating income” plus ‘Net nonfarm income” and minus “Family living andtaxes” and “Real estate principal payments.”
“Average intermediate debt” is the average of beginning and ending intermediate farm liabilities.
“Years to turn over intermediate debt” is “Average intermediate debt” divided by “Cash availablefor intermediate debt service.” If either the cash-based or accrual-based “Cash available for intermediatedebt” is a negative number, debt repayment is not possible because of negative cash flow and “Years to turnover intermediate debt” cannot be calculated.
“Expense as a percent of income” (cash basis) is “Total cash expense” divided by “Gross cash farmincome.” “Expense as a percent of income” (accrual basis) is “Total accrual farm expense” divided by“Total accrual farm income.”
“Interest as a percent of income”(cash basis) is “Interest” divided by “Gross cash farm income.”“Interest as a percent of income” (accrual basis) is “Interest” minus beginning accrued interest plus endingaccrued interest divided by “Total accrual farm income.”
Balance Sheets at Cost and Market Values
These tables include only sole proprietors; partnerships and corporations are excluded because someassets and debts are held outside of the farm business causing potential misinterpretations of the averagefinancial condition.
Statement of Cash Flows
This table reports the sources from which cash was available or obtained and where that cash wasused or remains at the end of the year.
Financial Standards Measures
This table contains the Farm Financial Standards Council’s 16 financial measures for evaluating afarm's financial position and performance are reported.
Liquidity
The “current ratio” is calculated by dividing the total current farm assets by the total current farmliabilities.
“Working capital” is calculated by subtracting current farm liabilities from current farm assets.
7
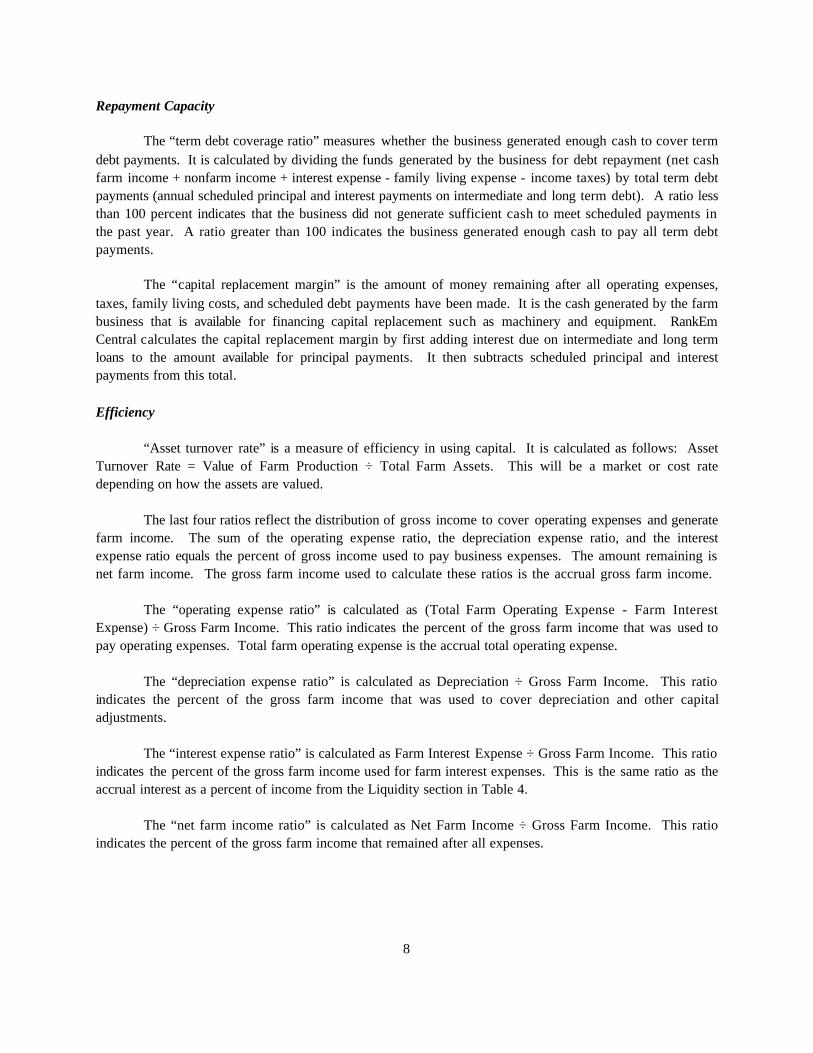
Solvency (Market)
The “farm debt to asset ratio” is calculated by dividing the total farm liabilities by the total farmassets. It is similar to the total percent in debt ratio listed earlier. The difference is that nonfarm assets andliabilities are included in the total percent in debt but not in the farm debt to asset ratio.
The “farm equity to asset ratio' is calculated by dividing farm equity or net worth by the total farmassets. It measures the proportion of the farm assets financed by the owner's equity as opposed to debt. Thisis the opposite of the debt to asset ratio. These two measures always add up to 100% because they describehow total farm assets are financed.
The “farm debt to equity ratio” measures farm debt relative to farm equity. It is calculated bydividing the total farm liabilities by the total farm net worth. The debt to equity ratio measures the amountof borrowed capital being employed for every dollar of equity capital.
Profitability (Cost)
The “rate of return on farm assets” can be thought of as the average interest rate being earned onall investments in the farm or ranch business. If assets are valued at market value, the rate of return onassets can be looked at as the “opportunity cost” of farming versus alternate investments. If assets arevalued at cost value, the rate of return on assets more closely represents the actual return on the averagedollar invested in the farm. The rate of return on farm assets is calculated as follows: Rate of Return onAssets = Return on Farm Assets ÷ Average Farm Investment, where: Return on Farm Assets = Net FarmIncome + Farm Interest - Value of Operator's Labor & Management, and Average Farm Investment =(Beginning Total Farm Assets + Ending Total Farm Assets) ÷ 2.
The “rate of return on farm equity” represents the interest rate being earned on your farm net worth.If assets are valued at market value, this return can be compared to returns available if the assets wereliquidated and invested in alternate investments. If assets are valued at cost value, this more closelyrepresents the actual return on the funds that have been invested or retained in the business. The rate ofreturn on farm equity is calculated as follows: Rate of Return on Equity = Return on Farm Equity ÷ Average Farm Net Worth, where: Return on Farm Equity = Net Farm Income - Value of Operator's Labor& Management, and Average Farm Net Worth = (Beginning Farm Net Worth + Ending Farm Net Worth)÷ 2.
“Operating profit margin” is a measure of the operating efficiency of the business. It is calculatedas follows: Operating Profit Margin = Return to Farm Assets ÷ Value of Farm Production. If expenses areheld in line relative to the value of output produced, the farm will have a healthy net profit margin. A low netprofit margin may be caused by low prices, high operating expenses, or inefficient production.
“Net farm income” represents the returns to unpaid labor, management, and equity capital investedin the business.
8
Repayment Capacity
The “term debt coverage ratio” measures whether the business generated enough cash to cover termdebt payments. It is calculated by dividing the funds generated by the business for debt repayment (net cashfarm income + nonfarm income + interest expense - family living expense - income taxes) by total term debtpayments (annual scheduled principal and interest payments on intermediate and long term debt). A ratio lessthan 100 percent indicates that the business did not generate sufficient cash to meet scheduled payments inthe past year. A ratio greater than 100 indicates the business generated enough cash to pay all term debtpayments.
The “capital replacement margin” is the amount of money remaining after all operating expenses,taxes, family living costs, and scheduled debt payments have been made. It is the cash generated by the farmbusiness that is available for financing capital replacement such as machinery and equipment. RankEmCentral calculates the capital replacement margin by first adding interest due on intermediate and long termloans to the amount available for principal payments. It then subtracts scheduled principal and interestpayments from this total.
Efficiency
“Asset turnover rate” is a measure of efficiency in using capital. It is calculated as follows: AssetTurnover Rate = Value of Farm Production ÷ Total Farm Assets. This will be a market or cost ratedepending on how the assets are valued.
The last four ratios reflect the distribution of gross income to cover operating expenses and generatefarm income. The sum of the operating expense ratio, the depreciation expense ratio, and the interestexpense ratio equals the percent of gross income used to pay business expenses. The amount remaining isnet farm income. The gross farm income used to calculate these ratios is the accrual gross farm income.
The “operating expense ratio” is calculated as (Total Farm Operating Expense - Farm InterestExpense) ÷ Gross Farm Income. This ratio indicates the percent of the gross farm income that was used topay operating expenses. Total farm operating expense is the accrual total operating expense.
The “depreciation expense ratio” is calculated as Depreciation ÷ Gross Farm Income. This ratioindicates the percent of the gross farm income that was used to cover depreciation and other capitaladjustments.
The “interest expense ratio” is calculated as Farm Interest Expense ÷ Gross Farm Income. This ratioindicates the percent of the gross farm income used for farm interest expenses. This is the same ratio as theaccrual interest as a percent of income from the Liquidity section in Table 4.
The “net farm income ratio” is calculated as Net Farm Income ÷ Gross Farm Income. This ratioindicates the percent of the gross farm income that remained after all expenses.
9
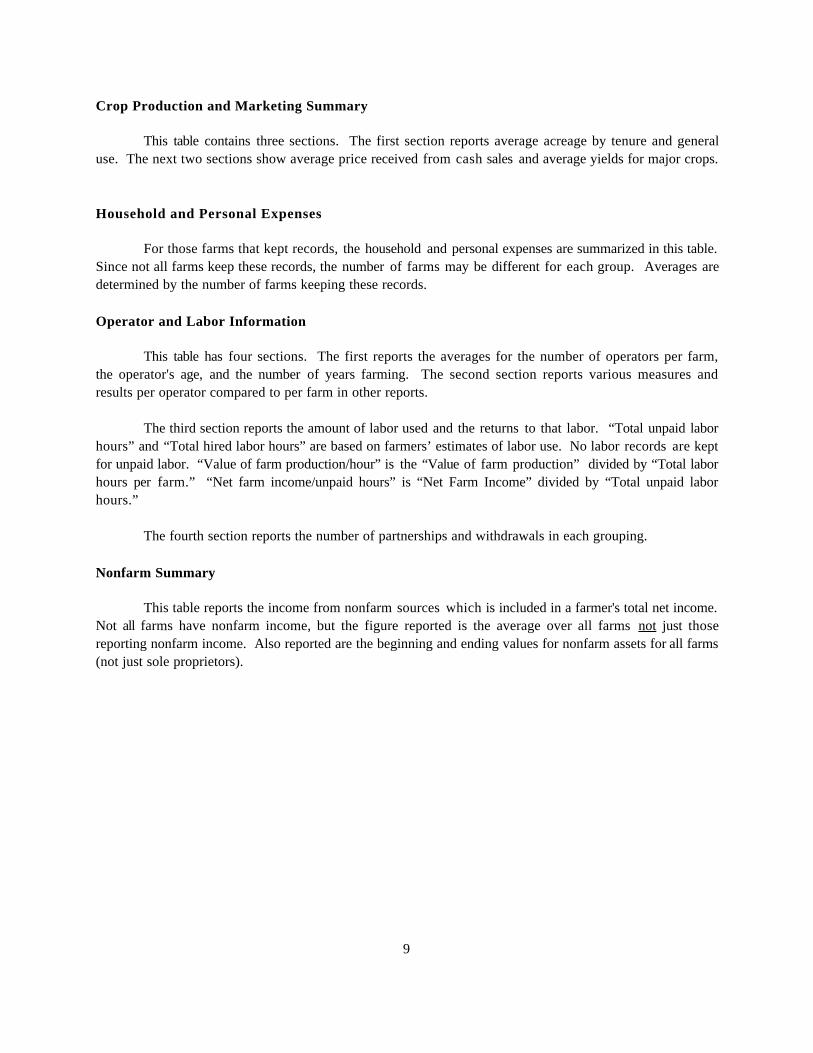
Crop Production and Marketing Summary
This table contains three sections. The first section reports average acreage by tenure and generaluse. The next two sections show average price received from cash sales and average yields for major crops.
Household and Personal Expenses
For those farms that kept records, the household and personal expenses are summarized in this table.Since not all farms keep these records, the number of farms may be different for each group. Averages aredetermined by the number of farms keeping these records.
Operator and Labor Information
This table has four sections. The first reports the averages for the number of operators per farm,the operator's age, and the number of years farming. The second section reports various measures andresults per operator compared to per farm in other reports.
The third section reports the amount of labor used and the returns to that labor. “Total unpaid laborhours” and “Total hired labor hours” are based on farmers’ estimates of labor use. No labor records are keptfor unpaid labor. “Value of farm production/hour” is the “Value of farm production” divided by “Total laborhours per farm.” “Net farm income/unpaid hours” is “Net Farm Income” divided by “Total unpaid laborhours.”
The fourth section reports the number of partnerships and withdrawals in each grouping.
Nonfarm Summary
This table reports the income from nonfarm sources which is included in a farmer's total net income.Not all farms have nonfarm income, but the figure reported is the average over all farms not just thosereporting nonfarm income. Also reported are the beginning and ending values for nonfarm assets for all farms(not just sole proprietors).

Farm Income StatementSouthwest Minnesota Farm Business Management Association
(Farms Sorted By Net Farm Income)
Avg. OfAll Farms Low 20% High 20%
Number of farms 207 41 42
Cash Farm IncomeBeans, Navy 282 - 1,147Corn 81,125 95,439 77,323Corn Silage 1,067 4,585 24Hay, Alfalfa 1,334 142 3,693Hay, Grass 114 15 499Hay, Mixed 44 - 188Oats 401 - 1,308Peas 505 224 300Soybeans 75,475 95,774 73,960Sugar Beets 274 - 1,349Sweet Corn 1,100 795 427Wheat, Spring 357 159 150Miscellaneous crop income 84 6 205Beef Bulls 73 367 -Beef Cow-Calf, Beef Calves 1,458 4,420 1,593Beef Replacement Heifers 136 - 669Beef, Custom Fed 225 - -Beef, Background Beef 188 - -Beef, Finish Beef Calves 64,164 83,896 6,975Chickens, Egg Product., Eggs 1,901 9,597 -Dairy, Milk 16,890 - 83,244Dairy, Dairy Calves 432 297 1,838Dairy Heifers (for sale) 2,763 - 4,692Dairy Steers 1,796 4,194 1,657Hogs, Farrow-Fin, Raised Hogs 16,662 23,330 42,273Hogs, Feeder Pigs, Feeder Pigs 176 - -Hogs, Finish Feeder Pigs 10,800 26 36,278Sheep, Market Lambs, Mkt Lambs 1,274 - 1,526Turkeys 2,687 - 13,244Hogs, Contractee 284 - -Hogs, Weaning Pigs, Weaning Pigs 417 - -Hogs, Weaning to Feeder 506 - 2,496Hogs, Weaning to Finish 58,120 - 128,246Cull breeding livestock 2,708 2,919 5,442Misc. livestock income 896 250 715Transistion payments 17,949 20,940 20,698CRP payments 628 1,164 620Other government payments 29,631 29,522 39,580Custom work income 15,797 9,156 20,622Patronage dividends, cash 2,470 1,813 5,494Insurance income 4,701 6,112 7,366Cash from hedging accts 1,052 2,472 962Contract livestock income 2,963 154 5,343Other farm income 11,787 11,437 19,069
Gross Cash Farm Income 433,698 409,204 611,214
2001 Annual Report Page 10 Copyright (c) 2001, University of Minnesota
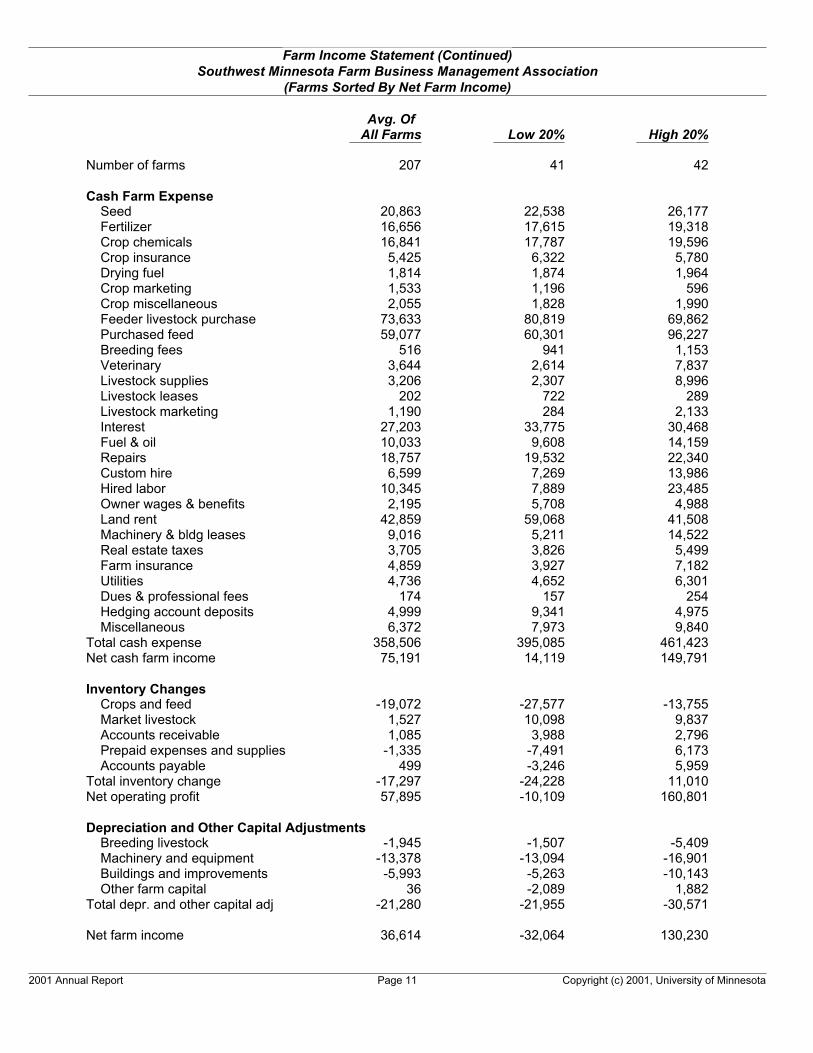
Farm Income Statement (Continued)Southwest Minnesota Farm Business Management Association
(Farms Sorted By Net Farm Income)
Avg. OfAll Farms Low 20% High 20%
Number of farms 207 41 42
Cash Farm ExpenseSeed 20,863 22,538 26,177Fertilizer 16,656 17,615 19,318Crop chemicals 16,841 17,787 19,596Crop insurance 5,425 6,322 5,780Drying fuel 1,814 1,874 1,964Crop marketing 1,533 1,196 596Crop miscellaneous 2,055 1,828 1,990Feeder livestock purchase 73,633 80,819 69,862Purchased feed 59,077 60,301 96,227Breeding fees 516 941 1,153Veterinary 3,644 2,614 7,837Livestock supplies 3,206 2,307 8,996Livestock leases 202 722 289Livestock marketing 1,190 284 2,133Interest 27,203 33,775 30,468Fuel & oil 10,033 9,608 14,159Repairs 18,757 19,532 22,340Custom hire 6,599 7,269 13,986Hired labor 10,345 7,889 23,485Owner wages & benefits 2,195 5,708 4,988Land rent 42,859 59,068 41,508Machinery & bldg leases 9,016 5,211 14,522Real estate taxes 3,705 3,826 5,499Farm insurance 4,859 3,927 7,182Utilities 4,736 4,652 6,301Dues & professional fees 174 157 254Hedging account deposits 4,999 9,341 4,975Miscellaneous 6,372 7,973 9,840
Total cash expense 358,506 395,085 461,423Net cash farm income 75,191 14,119 149,791
Inventory ChangesCrops and feed -19,072 -27,577 -13,755Market livestock 1,527 10,098 9,837Accounts receivable 1,085 3,988 2,796Prepaid expenses and supplies -1,335 -7,491 6,173Accounts payable 499 -3,246 5,959
Total inventory change -17,297 -24,228 11,010Net operating profit 57,895 -10,109 160,801
Depreciation and Other Capital AdjustmentsBreeding livestock -1,945 -1,507 -5,409Machinery and equipment -13,378 -13,094 -16,901Buildings and improvements -5,993 -5,263 -10,143Other farm capital 36 -2,089 1,882
Total depr. and other capital adj -21,280 -21,955 -30,571
Net farm income 36,614 -32,064 130,230
2001 Annual Report Page 11 Copyright (c) 2001, University of Minnesota

Inventory ChangesSouthwest Minnesota Farm Business Management Association
(Farms Sorted By Net Farm Income)
Avg. OfAll Farms Low 20% High 20%
Number of farms 207 41 42
Net cash farm income 75,191 14,119 149,791
Crops and FeedEnding inventory 128,858 107,424 177,685Beginning inventory 147,930 135,001 191,441Inventory change -19,072 -27,577 -13,755
Market LivestockEnding inventory 71,716 66,332 95,847Beginning inventory 70,189 56,234 86,009Inventory change 1,527 10,098 9,837
Accts Receivable & Other Current AssetsEnding inventory 11,888 17,135 14,711Beginning inventory 10,803 13,147 11,915Inventory change 1,085 3,988 2,796
Prepaid Expenses and SuppliesEnding inventory 27,809 16,867 49,050Beginning inventory 29,144 24,358 42,876Inventory change -1,335 -7,491 6,173
Accounts Payable & Accrued ExpensesBeginning inventory 15,618 18,864 22,150Ending inventory 15,119 22,110 16,191Inventory change 499 -3,246 5,959
Total inventory change -17,297 -24,228 11,010
Net operating profit 57,895 -10,109 160,801
2001 Annual Report Page 12 Copyright (c) 2001, University of Minnesota

Depreciation and Other Capital AdjustmentsSouthwest Minnesota Farm Business Management Association
(Farms Sorted By Net Farm Income)
Avg. OfAll Farms Low 20% High 20%
Number of farms 207 41 42
Net operating profit 57,895 -10,109 160,801
Breeding LivestockEnding inventory 5,364 1,798 16,302Capital sales 231 - 24Beginning inventory 3,235 2,174 5,504Capital purchases 4,305 1,132 16,231Depreciation, capital adjust. -1,945 -1,507 -5,409
Machinery and EquipmentEnding inventory 98,234 95,814 127,114Capital sales 871 781 1,765Beginning inventory 83,182 87,457 103,427Capital purchases 29,301 22,233 42,353Depreciation, capital adjust. -13,378 -13,094 -16,901
Buildings and ImprovementsEnding inventory 84,572 74,156 162,282Capital sales 41 - -Beginning inventory 74,595 67,947 130,479Capital purchases 16,011 11,472 41,946Depreciation, capital adjust. -5,993 -5,263 -10,143
Other Capital AssetsEnding inventory 55,869 66,039 73,213Capital sales 394 470 175Beginning inventory 52,385 68,007 70,141Capital purchases 3,843 591 1,366Depreciation, capital adjust. 36 -2,089 1,882
Total depreciation, capital adj. -21,280 -21,955 -30,571
Net farm income 36,614 -32,064 130,230
2001 Annual Report Page 13 Copyright (c) 2001, University of Minnesota

Profitability MeasuresSouthwest Minnesota Farm Business Management Association
(Farms Sorted By Net Farm Income)
Avg. OfAll Farms Low 20% High 20%
Number of farms 207 41 42
Profitability (assets valued at cost)Net farm income 36,614 -32,064 130,230Labor and management earnings 16,094 -46,063 93,024Rate of return on assets 5.5 % -2.6 % 12.5 %Rate of return on equity 3.8 % -25.3 % 16.5 %Operating profit margin 14.1 % -7.1 % 29.9 %Asset turnover rate 38.9 % 36.9 % 41.7 %
Interest on farm net worth 20,521 13,999 37,206Farm interest expense 27,551 34,903 30,327Value of operator lbr and mgmt. 24,212 20,709 29,436Return on farm assets 39,953 -17,870 131,121Average farm assets 727,057 685,636 1,051,736Return on farm equity 12,403 -52,773 100,794Average farm equity 329,070 208,796 611,943Value of farm production 282,583 253,086 438,594
Avg. OfAll Farms Low 20% High 20%
Number of farms 207 41 42
Profitability (assets valued at market)Net farm income 49,613 -8,034 127,568Labor and management earnings 18,588 -32,032 75,988Rate of return on assets 4.9 % 0.6 % 8.4 %Rate of return on equity 4.9 % -7.3 % 11.4 %Operating profit margin 18.7 % 2.4 % 29.3 %Asset turnover rate 26.4 % 25.1 % 28.6 %
Interest on farm net worth 31,025 23,998 51,581Farm interest expense 27,551 34,903 30,327Value of operator lbr and mgmt. 24,212 20,709 29,436Return on farm assets 52,952 6,160 128,460Average farm assets 1,071,426 1,008,212 1,533,770Return on farm equity 25,401 -28,744 98,133Average farm equity 515,422 394,689 859,678Value of farm production 282,583 253,086 438,594
2001 Annual Report Page 14 Copyright (c) 2001, University of Minnesota
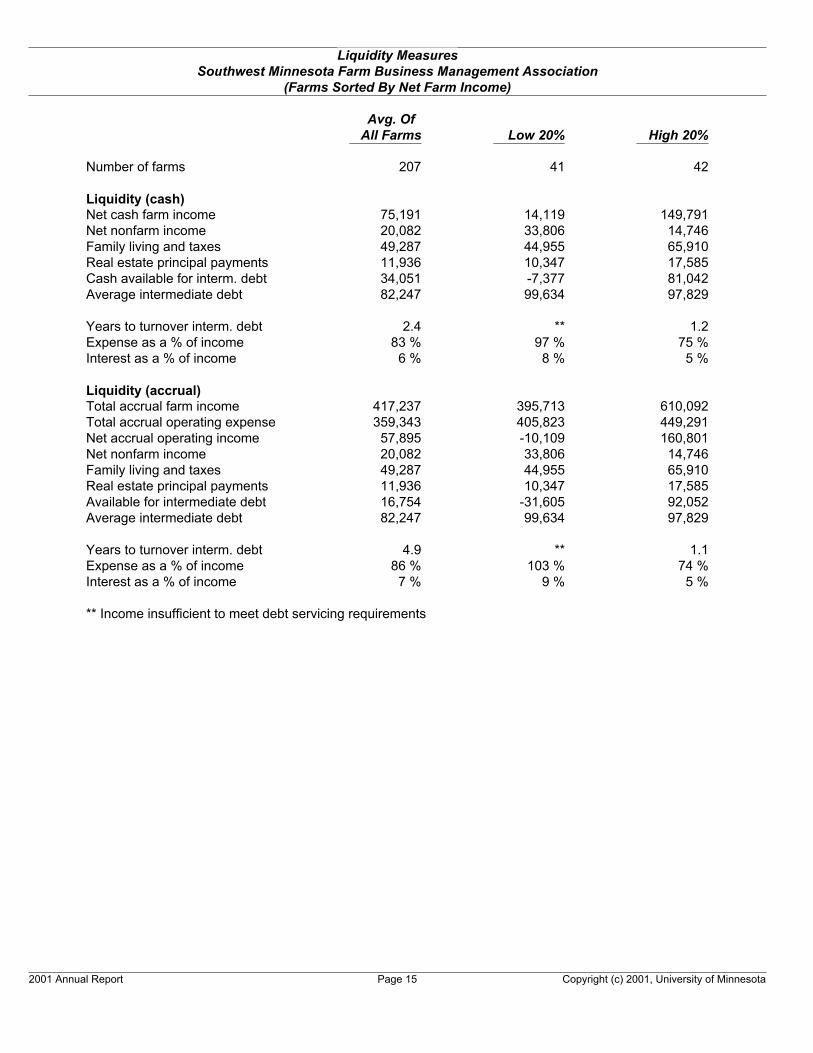
Liquidity MeasuresSouthwest Minnesota Farm Business Management Association
(Farms Sorted By Net Farm Income)
Avg. OfAll Farms Low 20% High 20%
Number of farms 207 41 42
Liquidity (cash)Net cash farm income 75,191 14,119 149,791Net nonfarm income 20,082 33,806 14,746Family living and taxes 49,287 44,955 65,910Real estate principal payments 11,936 10,347 17,585Cash available for interm. debt 34,051 -7,377 81,042Average intermediate debt 82,247 99,634 97,829
Years to turnover interm. debt 2.4 ** 1.2Expense as a % of income 83 % 97 % 75 %Interest as a % of income 6 % 8 % 5 %
Liquidity (accrual)Total accrual farm income 417,237 395,713 610,092Total accrual operating expense 359,343 405,823 449,291Net accrual operating income 57,895 -10,109 160,801Net nonfarm income 20,082 33,806 14,746Family living and taxes 49,287 44,955 65,910Real estate principal payments 11,936 10,347 17,585Available for intermediate debt 16,754 -31,605 92,052Average intermediate debt 82,247 99,634 97,829
Years to turnover interm. debt 4.9 ** 1.1Expense as a % of income 86 % 103 % 74 %Interest as a % of income 7 % 9 % 5 %
** Income insufficient to meet debt servicing requirements
2001 Annual Report Page 15 Copyright (c) 2001, University of Minnesota

Balance Sheet at Cost ValuesSouthwest Minnesota Farm Business Management Association
(Farms Sorted By Net Farm Income)
Avg. OfAll Farms Low 20% High 20%
Number of farms 178 33 32
Beginning Ending Beginning Ending Beginning EndingAssetsCurrent Farm Assets
Cash and checking balance 14,537 17,011 5,355 9,870 21,797 30,008Prepaid expenses & supplies 26,800 25,573 20,225 14,282 36,742 41,541Growing crops 0 0 0 0 0 0Accounts receivable 6,506 7,648 6,026 6,438 6,484 10,619Hedging accounts 1,722 1,279 2,947 2,879 1,498 709Crops held for sale or feed 125,997 107,042 100,199 69,647 146,164 136,487Crops under government loan 7,798 7,566 6,846 8,180 5,203 4,111Market livestock held for sale 55,705 52,922 44,977 42,174 64,741 71,352Other current assets 1,216 1,840 5,923 9,108 219 177
Total current farm assets 240,282 220,882 192,498 162,577 282,846 295,005
Intermediate Farm AssetsBreeding livestock 2,885 5,456 1,187 1,139 5,213 19,480Machinery and equipment 74,094 87,377 71,669 83,024 81,309 99,652Other intermediate assets 3,925 3,736 6,603 5,370 2,482 2,452
Total intermediate farm assets 80,903 96,568 79,460 89,534 89,004 121,584
Long Term Farm AssetsFarm land 226,783 235,409 262,349 269,301 306,922 321,633Buildings and improvements 60,586 71,514 57,352 64,969 96,146 133,349Other long-term assets 43,035 45,489 64,604 62,639 65,035 67,973
Total long-term farm assets 330,404 352,412 384,305 396,908 468,103 522,955Total Farm Assets 651,589 669,862 656,262 649,019 839,953 939,544
Total Nonfarm Assets 119,749 126,982 112,855 120,234 194,445 204,785Total Assets 771,338 796,844 769,117 769,253 1,034,399 1,144,328
LiabilitiesCurrent Farm Liabilities
Accrued interest 7,335 7,633 11,043 12,062 5,166 4,632Accounts payable 6,197 5,789 5,529 7,151 13,749 8,595Current notes 105,872 113,531 115,273 134,002 73,900 84,012Government crop loans 7,443 7,294 6,395 7,600 4,805 4,010Principal due on term debt 23,528 23,379 19,678 21,956 31,365 30,558
Total current farm liabilities 150,376 157,627 157,918 182,771 128,985 131,807
Total intermediate farm liabs 48,116 51,535 64,371 62,314 42,813 63,237Total long term farm liabilities 152,376 159,058 212,694 218,282 185,949 201,391Total farm liabilities 350,868 368,220 434,983 463,367 357,747 396,435
Total nonfarm liabilities 17,056 16,649 17,498 19,400 24,783 22,037Total liabilities 367,924 384,869 452,481 482,767 382,530 418,472
Net worth (farm and nonfarm) 403,414 411,975 316,636 286,486 651,868 725,856Net worth change 8,562 -30,150 73,988
Ratio AnalysisCurrent farm liabilities / assets 63 % 71 % 82 % 112 % 46 % 45 %Curr. & interm farm liab. / assets 62 % 66 % 82 % 97 % 46 % 47 %Long term farm liab. / assets 46 % 45 % 55 % 55 % 40 % 39 %Total debt to asset ratio 48 % 48 % 59 % 63 % 37 % 37 %
2001 Annual Report Page 16 Copyright (c) 2001, University of Minnesota
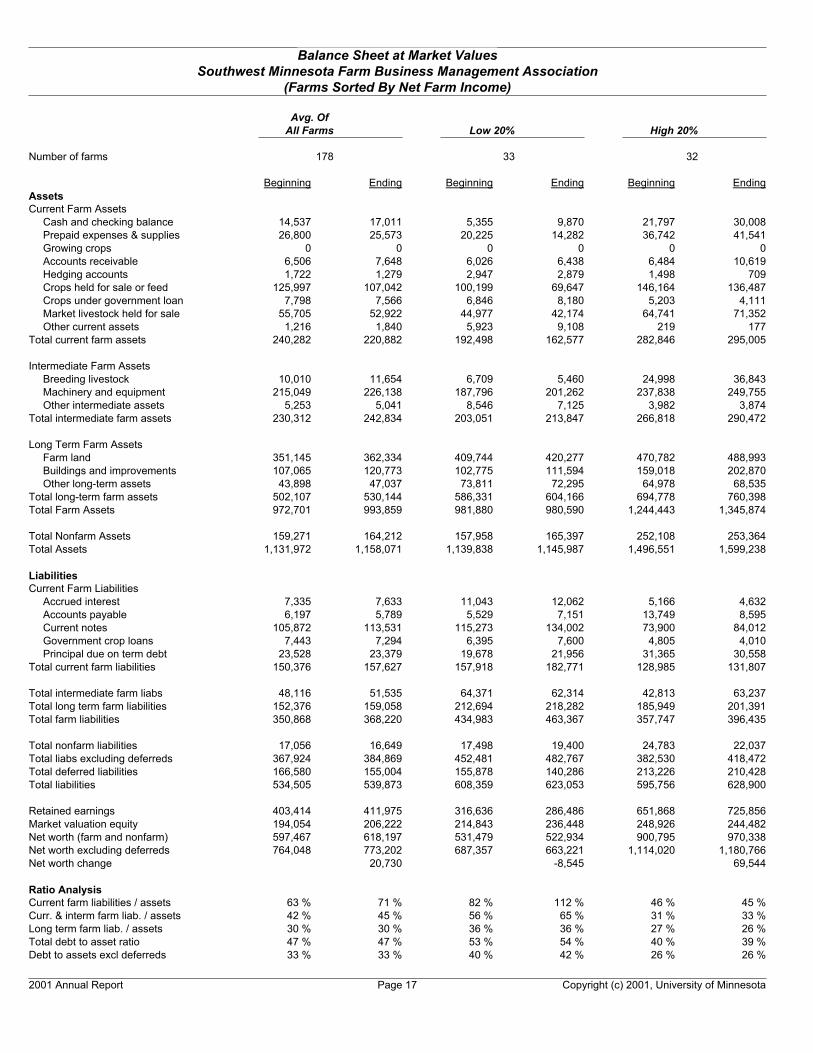
Balance Sheet at Market ValuesSouthwest Minnesota Farm Business Management Association
(Farms Sorted By Net Farm Income)
Avg. OfAll Farms Low 20% High 20%
Number of farms 178 33 32
Beginning Ending Beginning Ending Beginning EndingAssetsCurrent Farm Assets
Cash and checking balance 14,537 17,011 5,355 9,870 21,797 30,008Prepaid expenses & supplies 26,800 25,573 20,225 14,282 36,742 41,541Growing crops 0 0 0 0 0 0Accounts receivable 6,506 7,648 6,026 6,438 6,484 10,619Hedging accounts 1,722 1,279 2,947 2,879 1,498 709Crops held for sale or feed 125,997 107,042 100,199 69,647 146,164 136,487Crops under government loan 7,798 7,566 6,846 8,180 5,203 4,111Market livestock held for sale 55,705 52,922 44,977 42,174 64,741 71,352Other current assets 1,216 1,840 5,923 9,108 219 177
Total current farm assets 240,282 220,882 192,498 162,577 282,846 295,005
Intermediate Farm AssetsBreeding livestock 10,010 11,654 6,709 5,460 24,998 36,843Machinery and equipment 215,049 226,138 187,796 201,262 237,838 249,755Other intermediate assets 5,253 5,041 8,546 7,125 3,982 3,874
Total intermediate farm assets 230,312 242,834 203,051 213,847 266,818 290,472
Long Term Farm AssetsFarm land 351,145 362,334 409,744 420,277 470,782 488,993Buildings and improvements 107,065 120,773 102,775 111,594 159,018 202,870Other long-term assets 43,898 47,037 73,811 72,295 64,978 68,535
Total long-term farm assets 502,107 530,144 586,331 604,166 694,778 760,398Total Farm Assets 972,701 993,859 981,880 980,590 1,244,443 1,345,874
Total Nonfarm Assets 159,271 164,212 157,958 165,397 252,108 253,364Total Assets 1,131,972 1,158,071 1,139,838 1,145,987 1,496,551 1,599,238
LiabilitiesCurrent Farm Liabilities
Accrued interest 7,335 7,633 11,043 12,062 5,166 4,632Accounts payable 6,197 5,789 5,529 7,151 13,749 8,595Current notes 105,872 113,531 115,273 134,002 73,900 84,012Government crop loans 7,443 7,294 6,395 7,600 4,805 4,010Principal due on term debt 23,528 23,379 19,678 21,956 31,365 30,558
Total current farm liabilities 150,376 157,627 157,918 182,771 128,985 131,807
Total intermediate farm liabs 48,116 51,535 64,371 62,314 42,813 63,237Total long term farm liabilities 152,376 159,058 212,694 218,282 185,949 201,391Total farm liabilities 350,868 368,220 434,983 463,367 357,747 396,435
Total nonfarm liabilities 17,056 16,649 17,498 19,400 24,783 22,037Total liabs excluding deferreds 367,924 384,869 452,481 482,767 382,530 418,472Total deferred liabilities 166,580 155,004 155,878 140,286 213,226 210,428Total liabilities 534,505 539,873 608,359 623,053 595,756 628,900
Retained earnings 403,414 411,975 316,636 286,486 651,868 725,856Market valuation equity 194,054 206,222 214,843 236,448 248,926 244,482Net worth (farm and nonfarm) 597,467 618,197 531,479 522,934 900,795 970,338Net worth excluding deferreds 764,048 773,202 687,357 663,221 1,114,020 1,180,766Net worth change 20,730 -8,545 69,544
Ratio AnalysisCurrent farm liabilities / assets 63 % 71 % 82 % 112 % 46 % 45 %Curr. & interm farm liab. / assets 42 % 45 % 56 % 65 % 31 % 33 %Long term farm liab. / assets 30 % 30 % 36 % 36 % 27 % 26 %Total debt to asset ratio 47 % 47 % 53 % 54 % 40 % 39 %Debt to assets excl deferreds 33 % 33 % 40 % 42 % 26 % 26 %
2001 Annual Report Page 17 Copyright (c) 2001, University of Minnesota
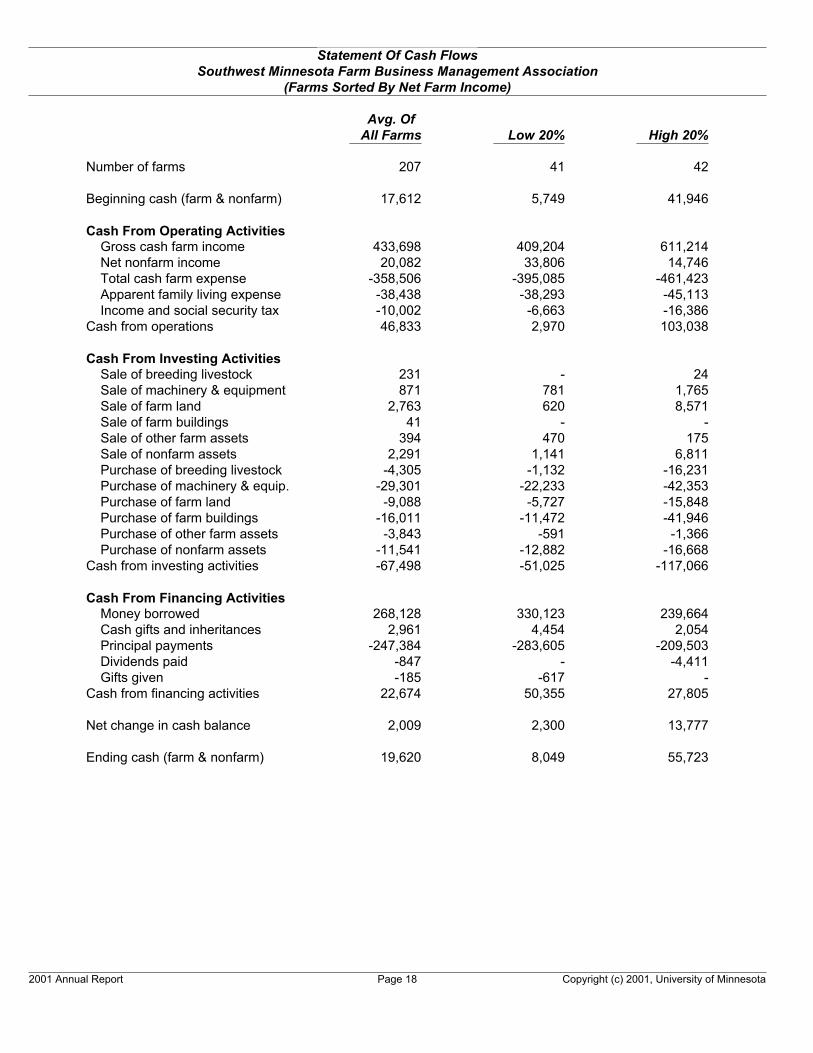
Statement Of Cash FlowsSouthwest Minnesota Farm Business Management Association
(Farms Sorted By Net Farm Income)
Avg. OfAll Farms Low 20% High 20%
Number of farms 207 41 42
Beginning cash (farm & nonfarm) 17,612 5,749 41,946
Cash From Operating ActivitiesGross cash farm income 433,698 409,204 611,214Net nonfarm income 20,082 33,806 14,746Total cash farm expense -358,506 -395,085 -461,423Apparent family living expense -38,438 -38,293 -45,113Income and social security tax -10,002 -6,663 -16,386
Cash from operations 46,833 2,970 103,038
Cash From Investing ActivitiesSale of breeding livestock 231 - 24Sale of machinery & equipment 871 781 1,765Sale of farm land 2,763 620 8,571Sale of farm buildings 41 - -Sale of other farm assets 394 470 175Sale of nonfarm assets 2,291 1,141 6,811Purchase of breeding livestock -4,305 -1,132 -16,231Purchase of machinery & equip. -29,301 -22,233 -42,353Purchase of farm land -9,088 -5,727 -15,848Purchase of farm buildings -16,011 -11,472 -41,946Purchase of other farm assets -3,843 -591 -1,366Purchase of nonfarm assets -11,541 -12,882 -16,668
Cash from investing activities -67,498 -51,025 -117,066
Cash From Financing ActivitiesMoney borrowed 268,128 330,123 239,664Cash gifts and inheritances 2,961 4,454 2,054Principal payments -247,384 -283,605 -209,503Dividends paid -847 - -4,411Gifts given -185 -617 -
Cash from financing activities 22,674 50,355 27,805
Net change in cash balance 2,009 2,300 13,777
Ending cash (farm & nonfarm) 19,620 8,049 55,723
2001 Annual Report Page 18 Copyright (c) 2001, University of Minnesota

Financial Standards MeasuresSouthwest Minnesota Farm Business Management Association
(Farms Sorted By Net Farm Income)
Avg. OfAll Farms Low 20% High 20%
Number of farms 207 41 42
LiquidityCurrent ratio 1.47 0.99 2.39Working capital 83,500 -3,202 228,387
Solvency (market)Farm debt to asset ratio 52 % 62 % 43 %Farm equity to asset ratio 48 % 38 % 57 %Farm debt to equity ratio 107 % 165 % 77 %
Profitability (cost)Rate of return on farm assets 5.5 % -2.6 % 12.5 %Rate of return on farm equity 3.8 % -25.3 % 16.5 %Operating profit margin 14.1 % -7.1 % 29.9 %Net farm income 36,614 -32,064 130,230
Repayment CapacityTerm debt coverage ratio 103 % -9 % 229 %Capital replacement margin 1,363 -45,222 71,935
EfficiencyAsset turnover rate (cost) 38.9 % 36.9 % 41.7 %Operating expense ratio 79.5 % 93.7 % 68.7 %Depreciation expense ratio 5.1 % 5.5 % 5.0 %Interest expense ratio 6.6 % 8.8 % 5.0 %Net farm income ratio 8.8 % -8.1 % 21.3 %
2001 Annual Report Page 19 Copyright (c) 2001, University of Minnesota

Crop Production and Marketing SummarySouthwest Minnesota Farm Business Management Association
(Farms Sorted By Net Farm Income)
Avg. OfAll Farms Low 20% High 20%
Number of farms 207 41 42
Acreage SummaryTotal acres owned 252 241 360Total crop acres 759 820 907Crop acres owned 214 206 302Crop acres cash rented 468 573 469Crop acres share rented 77 42 135Total pasture acres 7 0 10
Average Price Received (Cash Sales Only)Soybeans per bushel 4.32 4.32 4.34Corn per bushel 1.72 1.74 1.72Oats per bushel 1.51 - 1.53Hay, Alfalfa per ton 79.17 - -Sweet Corn per ton 45.95 - -Wheat, Spring per bushel 2.95 - -Peas per lb 0.085 - -Hay, Grass per ton 63.09 - -
Average Yield Per AcreSoybeans (bushel) 41.86 40.55 43.54Corn (bushel) 128.07 124.69 133.67Hay, Alfalfa (ton) 4.07 4.51 4.04Corn Silage (ton) 16.83 15.94 18.05Oats (bushel) 83.59 - 84.04Sweet Corn (ton) 6.30 - -Peas (lb) 3,433.79 - -Wheat, Spring (bushel) 56.15 - -Hay, Grass (ton) 1.87 - -Oatlage (ton) 7.60 - -Barley (bushel) 68.82 - -
2001 Annual Report Page 20 Copyright (c) 2001, University of Minnesota
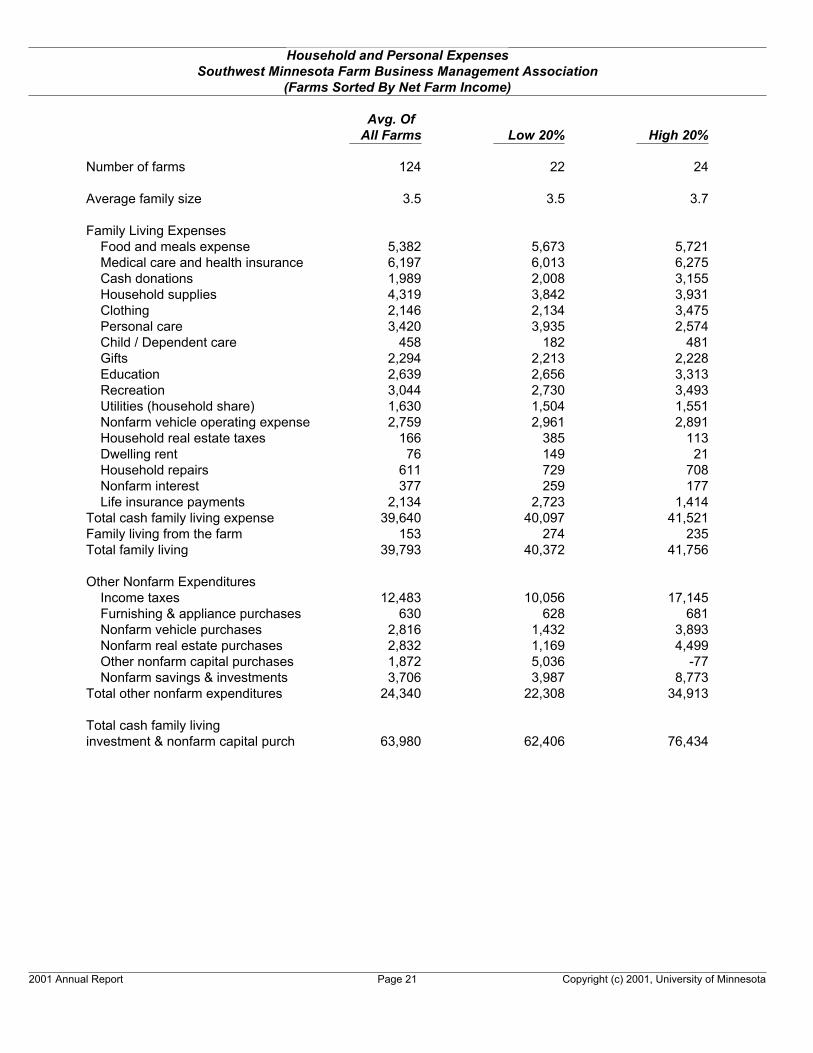
Household and Personal ExpensesSouthwest Minnesota Farm Business Management Association
(Farms Sorted By Net Farm Income)
Avg. OfAll Farms Low 20% High 20%
Number of farms 124 22 24
Average family size 3.5 3.5 3.7
Family Living ExpensesFood and meals expense 5,382 5,673 5,721Medical care and health insurance 6,197 6,013 6,275Cash donations 1,989 2,008 3,155Household supplies 4,319 3,842 3,931Clothing 2,146 2,134 3,475Personal care 3,420 3,935 2,574Child / Dependent care 458 182 481Gifts 2,294 2,213 2,228Education 2,639 2,656 3,313Recreation 3,044 2,730 3,493Utilities (household share) 1,630 1,504 1,551Nonfarm vehicle operating expense 2,759 2,961 2,891Household real estate taxes 166 385 113Dwelling rent 76 149 21Household repairs 611 729 708Nonfarm interest 377 259 177Life insurance payments 2,134 2,723 1,414
Total cash family living expense 39,640 40,097 41,521Family living from the farm 153 274 235Total family living 39,793 40,372 41,756
Other Nonfarm ExpendituresIncome taxes 12,483 10,056 17,145Furnishing & appliance purchases 630 628 681Nonfarm vehicle purchases 2,816 1,432 3,893Nonfarm real estate purchases 2,832 1,169 4,499Other nonfarm capital purchases 1,872 5,036 -77Nonfarm savings & investments 3,706 3,987 8,773
Total other nonfarm expenditures 24,340 22,308 34,913
Total cash family livinginvestment & nonfarm capital purch 63,980 62,406 76,434
2001 Annual Report Page 21 Copyright (c) 2001, University of Minnesota
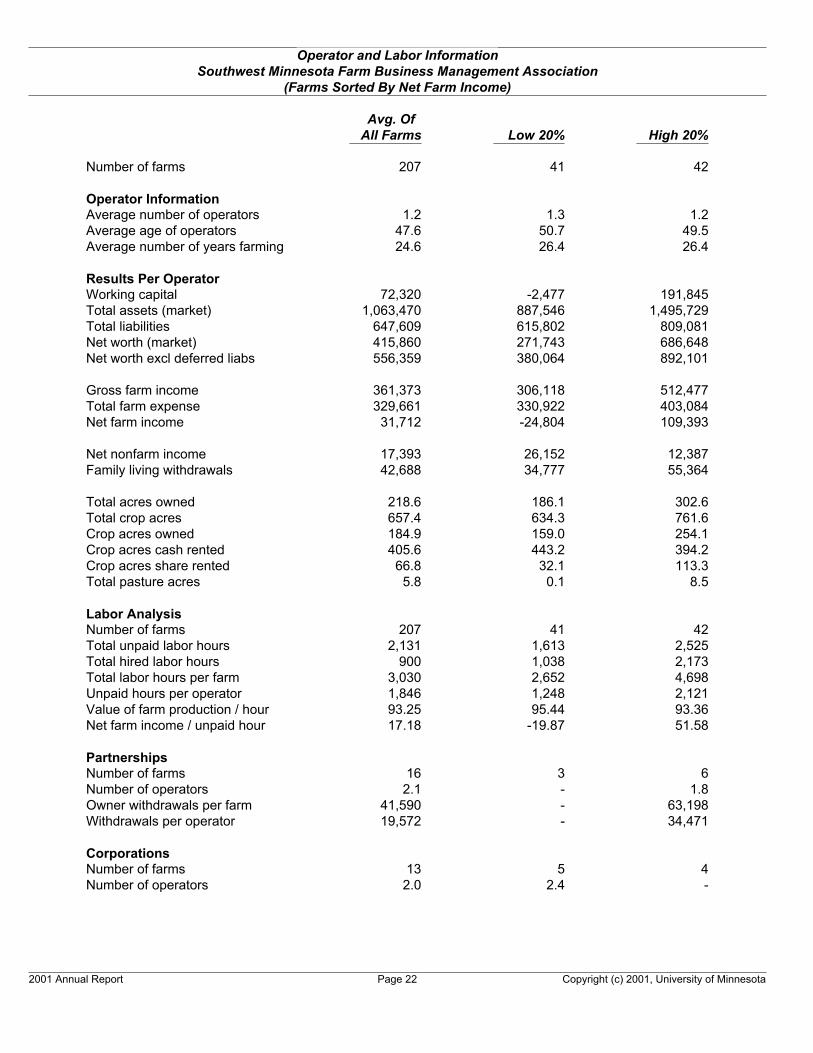
Operator and Labor InformationSouthwest Minnesota Farm Business Management Association
(Farms Sorted By Net Farm Income)
Avg. OfAll Farms Low 20% High 20%
Number of farms 207 41 42
Operator InformationAverage number of operators 1.2 1.3 1.2Average age of operators 47.6 50.7 49.5Average number of years farming 24.6 26.4 26.4
Results Per OperatorWorking capital 72,320 -2,477 191,845Total assets (market) 1,063,470 887,546 1,495,729Total liabilities 647,609 615,802 809,081Net worth (market) 415,860 271,743 686,648Net worth excl deferred liabs 556,359 380,064 892,101
Gross farm income 361,373 306,118 512,477Total farm expense 329,661 330,922 403,084Net farm income 31,712 -24,804 109,393
Net nonfarm income 17,393 26,152 12,387Family living withdrawals 42,688 34,777 55,364
Total acres owned 218.6 186.1 302.6Total crop acres 657.4 634.3 761.6Crop acres owned 184.9 159.0 254.1Crop acres cash rented 405.6 443.2 394.2Crop acres share rented 66.8 32.1 113.3Total pasture acres 5.8 0.1 8.5
Labor AnalysisNumber of farms 207 41 42Total unpaid labor hours 2,131 1,613 2,525Total hired labor hours 900 1,038 2,173Total labor hours per farm 3,030 2,652 4,698Unpaid hours per operator 1,846 1,248 2,121Value of farm production / hour 93.25 95.44 93.36Net farm income / unpaid hour 17.18 -19.87 51.58
PartnershipsNumber of farms 16 3 6Number of operators 2.1 - 1.8Owner withdrawals per farm 41,590 - 63,198Withdrawals per operator 19,572 - 34,471
CorporationsNumber of farms 13 5 4Number of operators 2.0 2.4 -
2001 Annual Report Page 22 Copyright (c) 2001, University of Minnesota

Nonfarm SummarySouthwest Minnesota Farm Business Management Association
(Farms Sorted By Net Farm Income)
Avg. OfAll Farms Low 20% High 20%
Number of farms 207 41 42
Nonfarm IncomeNonfarm wages & salary 12,323 21,150 7,168Nonfarm business income 2,217 9,027 802Nonfarm rental income 710 396 812Nonfarm interest income 1,126 459 1,879Nonfarm cash dividends 195 137 14Tax refunds 988 1,074 1,063Gifts and inheritances 2,961 4,454 2,054Other nonfarm income 2,523 1,562 3,007
Total nonfarm income 23,043 38,260 16,800
Nonfarm Assets (market)Checking & savings 299 116 218Stocks & bonds 18,924 8,104 40,646Other current assets 1,789 3,685 2,464Furniture & appliances 9,689 10,424 8,926Nonfarm vehicles 10,164 9,993 10,379Cash value of life ins. 11,791 9,311 12,447Retirement accounts 27,642 27,016 47,677Other intermediate assets 7,866 16,164 16,065Nonfarm real estate 44,856 40,986 54,468Other long term assets 10,676 8,538 5,584
Total nonfarm assets 143,698 134,337 198,873
Nonfarm LiabilitiesAccrued interest 82 127 52Accounts payable 5,576 3,720 9,573Current notes 6,857 5,993 10,528Princ due on term debt 844 937 903
Total current liabilities 6,857 5,993 10,528Intermediate liabilities 3,132 5,491 812Long term liabilities 5,239 4,203 9,873Total nonfarm liabilities 15,228 15,688 21,214
Nonfarm net worth 128,469 118,649 177,660Nonfarm debt to asset ratio 11 % 12 % 11 %
2001 Annual Report Page 23 Copyright (c) 2001, University of Minnesota

24

25
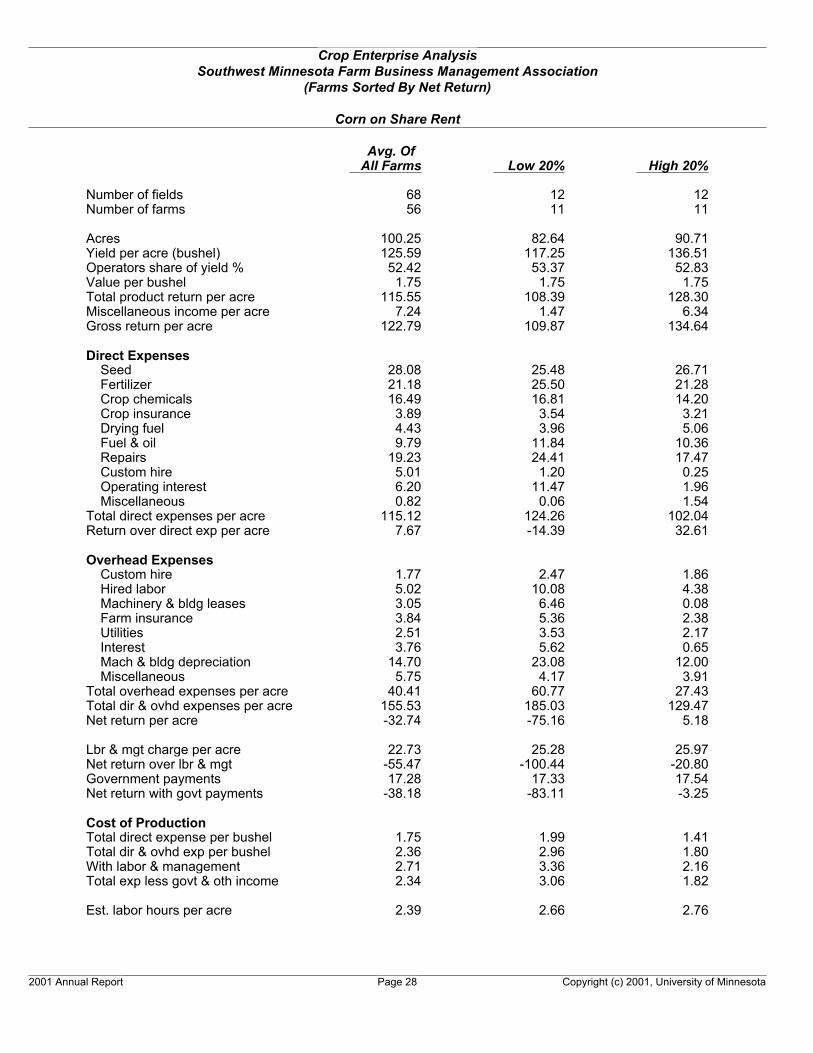
EXPLANATORY NOTES FOR CROPS TABLES
The “Crop Enterprise Analysis” tables show the average physical production, gross return, directcosts, overhead costs, and net returns per acre. All costs are actual costs; no opportunity costs areincluded. The “Net Return per Acre” is the “Gross Return per Acre” minus the direct and overheadcosts. The last section of each crop table contains economic efficiency measures and the net return peracre including government payments and a charge for unpaid labor and management.
There are potentially three tables for each group depending on the farmer's tenure on the land: owned land, cash rented land, and share rented land. It is possible for an individual farm to have data inall three tables if all three land tenure categories are represented in that farm business. Farms areclassified into low 20% or high 20% on the basis of net return per acre. The classification is doneseparately for each table.
To estimate the return to crops in the government programs, the net return including government
payments is estimated and included in the appropriate tables. This is done for each farm by allocating thetransition payments from the whole farm to these crops.
The “net return over labor and management” is calculated by allocating the farmer's charge forunpaid labor and management and subtracting it from the “net return government payments.”
Rounding of individual items for the report may have caused minor discrepancies with thecalculated totals. If fewer than 5 farms have a crop, land tenure category, that information is notreported. If there are fewer than 25 farms, the high and low groups are not reported.

Crop Enterprise AnalysisSouthwest Minnesota Farm Business Management Association
(Farms Sorted By Net Return)
Corn on Owned Land
Avg. OfAll Farms Low 20% High 20%
Number of fields 165 30 36Number of farms 129 25 26
Acres 109.67 87.46 130.59Yield per acre (bushel) 132.91 116.81 146.49Operators share of yield % 100.00 100.00 100.00Value per bushel 1.75 1.75 1.75Total product return per acre 232.60 204.42 256.36Miscellaneous income per acre 8.52 4.75 8.63Gross return per acre 241.12 209.17 264.99
Direct ExpensesSeed 38.47 38.89 38.54Fertilizer 40.08 39.53 33.64Crop chemicals 25.44 24.59 23.54Crop insurance 6.93 6.92 5.17Drying fuel 7.62 6.08 6.02Fuel & oil 11.16 12.88 10.24Repairs 21.43 34.01 15.88Custom hire 2.11 2.84 3.53Marketing 0.27 1.11 0.17Operating interest 7.71 13.11 3.98Miscellaneous 2.10 1.77 1.11
Total direct expenses per acre 163.32 181.73 141.82Return over direct exp per acre 77.80 27.45 123.17
Overhead ExpensesCustom hire 2.83 3.24 1.40Hired labor 5.82 8.64 3.24Machinery & bldg leases 1.73 2.37 0.82RE & pers. property taxes 13.47 14.55 12.24Farm insurance 4.86 5.40 3.95Utilities 3.49 5.80 2.73Interest 41.43 77.16 19.99Mach & bldg depreciation 22.66 29.54 21.93Miscellaneous 5.16 6.25 4.56
Total overhead expenses per acre 101.45 152.95 70.87Total dir & ovhd expenses per acre 264.77 334.68 212.68Net return per acre -23.65 -125.51 52.31
Lbr & mgt charge per acre 30.28 27.74 29.97Net return over lbr & mgt -53.93 -153.24 22.33Government payments 36.52 36.02 38.58Net return with govt payments -17.41 -117.22 60.92
Cost of ProductionTotal direct expense per bushel 1.23 1.56 0.97Total dir & ovhd exp per bushel 1.99 2.87 1.45With labor & management 2.22 3.10 1.66Total exp less govt & oth income 1.88 2.75 1.33
Est. labor hours per acre 2.76 3.18 2.28
2001 Annual Report Page 26 Copyright (c) 2001, University of Minnesota
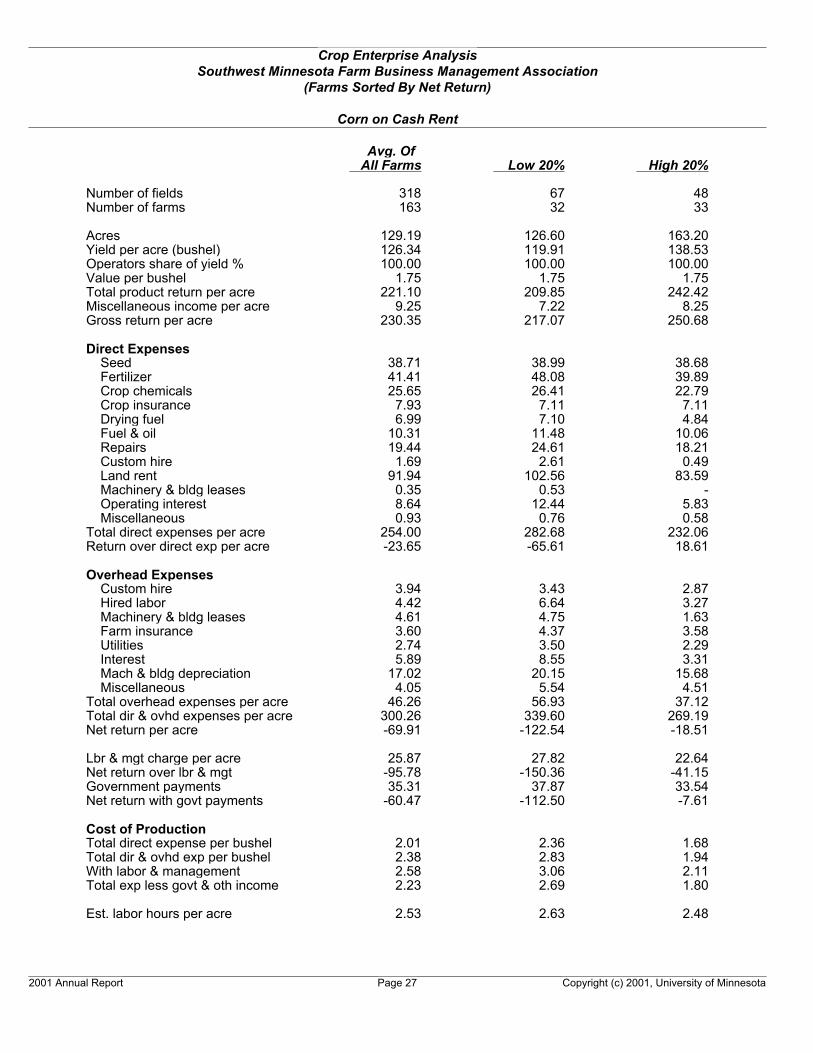
Crop Enterprise AnalysisSouthwest Minnesota Farm Business Management Association
(Farms Sorted By Net Return)
Corn on Cash Rent
Avg. OfAll Farms Low 20% High 20%
Number of fields 318 67 48Number of farms 163 32 33
Acres 129.19 126.60 163.20Yield per acre (bushel) 126.34 119.91 138.53Operators share of yield % 100.00 100.00 100.00Value per bushel 1.75 1.75 1.75Total product return per acre 221.10 209.85 242.42Miscellaneous income per acre 9.25 7.22 8.25Gross return per acre 230.35 217.07 250.68
Direct ExpensesSeed 38.71 38.99 38.68Fertilizer 41.41 48.08 39.89Crop chemicals 25.65 26.41 22.79Crop insurance 7.93 7.11 7.11Drying fuel 6.99 7.10 4.84Fuel & oil 10.31 11.48 10.06Repairs 19.44 24.61 18.21Custom hire 1.69 2.61 0.49Land rent 91.94 102.56 83.59Machinery & bldg leases 0.35 0.53 -Operating interest 8.64 12.44 5.83Miscellaneous 0.93 0.76 0.58
Total direct expenses per acre 254.00 282.68 232.06Return over direct exp per acre -23.65 -65.61 18.61
Overhead ExpensesCustom hire 3.94 3.43 2.87Hired labor 4.42 6.64 3.27Machinery & bldg leases 4.61 4.75 1.63Farm insurance 3.60 4.37 3.58Utilities 2.74 3.50 2.29Interest 5.89 8.55 3.31Mach & bldg depreciation 17.02 20.15 15.68Miscellaneous 4.05 5.54 4.51
Total overhead expenses per acre 46.26 56.93 37.12Total dir & ovhd expenses per acre 300.26 339.60 269.19Net return per acre -69.91 -122.54 -18.51
Lbr & mgt charge per acre 25.87 27.82 22.64Net return over lbr & mgt -95.78 -150.36 -41.15Government payments 35.31 37.87 33.54Net return with govt payments -60.47 -112.50 -7.61
Cost of ProductionTotal direct expense per bushel 2.01 2.36 1.68Total dir & ovhd exp per bushel 2.38 2.83 1.94With labor & management 2.58 3.06 2.11Total exp less govt & oth income 2.23 2.69 1.80
Est. labor hours per acre 2.53 2.63 2.48
2001 Annual Report Page 27 Copyright (c) 2001, University of Minnesota
Crop Enterprise AnalysisSouthwest Minnesota Farm Business Management Association
(Farms Sorted By Net Return)
Corn on Share Rent
Avg. OfAll Farms Low 20% High 20%
Number of fields 68 12 12Number of farms 56 11 11
Acres 100.25 82.64 90.71Yield per acre (bushel) 125.59 117.25 136.51Operators share of yield % 52.42 53.37 52.83Value per bushel 1.75 1.75 1.75Total product return per acre 115.55 108.39 128.30Miscellaneous income per acre 7.24 1.47 6.34Gross return per acre 122.79 109.87 134.64
Direct ExpensesSeed 28.08 25.48 26.71Fertilizer 21.18 25.50 21.28Crop chemicals 16.49 16.81 14.20Crop insurance 3.89 3.54 3.21Drying fuel 4.43 3.96 5.06Fuel & oil 9.79 11.84 10.36Repairs 19.23 24.41 17.47Custom hire 5.01 1.20 0.25Operating interest 6.20 11.47 1.96Miscellaneous 0.82 0.06 1.54
Total direct expenses per acre 115.12 124.26 102.04Return over direct exp per acre 7.67 -14.39 32.61
Overhead ExpensesCustom hire 1.77 2.47 1.86Hired labor 5.02 10.08 4.38Machinery & bldg leases 3.05 6.46 0.08Farm insurance 3.84 5.36 2.38Utilities 2.51 3.53 2.17Interest 3.76 5.62 0.65Mach & bldg depreciation 14.70 23.08 12.00Miscellaneous 5.75 4.17 3.91
Total overhead expenses per acre 40.41 60.77 27.43Total dir & ovhd expenses per acre 155.53 185.03 129.47Net return per acre -32.74 -75.16 5.18
Lbr & mgt charge per acre 22.73 25.28 25.97Net return over lbr & mgt -55.47 -100.44 -20.80Government payments 17.28 17.33 17.54Net return with govt payments -38.18 -83.11 -3.25
Cost of ProductionTotal direct expense per bushel 1.75 1.99 1.41Total dir & ovhd exp per bushel 2.36 2.96 1.80With labor & management 2.71 3.36 2.16Total exp less govt & oth income 2.34 3.06 1.82
Est. labor hours per acre 2.39 2.66 2.76
2001 Annual Report Page 28 Copyright (c) 2001, University of Minnesota

Crop Enterprise AnalysisSouthwest Minnesota Farm Business Management Association
(Farms Sorted By Net Return)
Soybeans on Owned Land
Avg. OfAll Farms Low 20% High 20%
Number of fields 178 33 36Number of farms 140 28 28
Acres 115.91 103.44 119.23Yield per acre (bushel) 42.96 39.95 47.17Operators share of yield % 100.00 100.00 100.00Value per bushel 5.15 5.15 5.15Total product return per acre 221.27 205.74 242.92Miscellaneous income per acre 1.48 2.12 0.61Gross return per acre 222.75 207.85 243.53
Direct ExpensesSeed 19.16 22.61 18.02Fertilizer 9.12 10.91 8.65Crop chemicals 20.51 23.94 18.53Crop insurance 7.53 9.61 4.22Fuel & oil 8.67 9.38 7.74Repairs 17.41 23.53 13.25Custom hire 2.51 5.73 1.63Machinery & bldg leases 0.19 0.83 0.15Operating interest 6.28 10.81 2.49Miscellaneous 0.87 0.80 0.68
Total direct expenses per acre 92.25 118.15 75.38Return over direct exp per acre 130.50 89.70 168.15
Overhead ExpensesCustom hire 2.39 1.98 1.04Hired labor 4.35 6.03 2.76Machinery & bldg leases 1.55 2.77 0.77RE & pers. property taxes 13.23 15.32 12.71Farm insurance 3.77 3.23 3.24Utilities 2.64 3.52 1.93Interest 42.94 82.71 18.55Mach & bldg depreciation 17.55 23.51 18.96Miscellaneous 4.02 5.20 3.35
Total overhead expenses per acre 92.44 144.26 63.31Total dir & ovhd expenses per acre 184.69 262.41 138.68Net return per acre 38.06 -54.56 104.85
Lbr & mgt charge per acre 23.49 22.86 24.42Net return over lbr & mgt 14.57 -77.42 80.43Government payments 35.63 36.55 37.65Net return with govt payments 50.20 -40.87 118.08
Cost of ProductionTotal direct expense per bushel 2.15 2.96 1.60Total dir & ovhd exp per bushel 4.30 6.57 2.94With labor & management 4.85 7.14 3.46Total exp less govt & oth income 3.98 6.17 2.65
Est. labor hours per acre 2.14 1.97 1.92
2001 Annual Report Page 29 Copyright (c) 2001, University of Minnesota

Crop Enterprise AnalysisSouthwest Minnesota Farm Business Management Association
(Farms Sorted By Net Return)
Soybeans on Cash Rent
Avg. OfAll Farms Low 20% High 20%
Number of fields 316 65 54Number of farms 161 32 33
Acres 133.16 113.42 134.11Yield per acre (bushel) 41.44 37.55 45.39Operators share of yield % 100.00 100.00 100.00Value per bushel 5.15 5.15 5.15Total product return per acre 213.42 193.40 233.76Miscellaneous income per acre 2.68 2.47 0.18Gross return per acre 216.11 195.87 233.94
Direct ExpensesSeed 19.13 21.84 16.17Fertilizer 8.74 8.97 8.46Crop chemicals 19.99 22.24 18.52Crop insurance 8.77 11.32 5.90Fuel & oil 8.29 9.13 8.09Repairs 15.50 20.26 13.35Custom hire 1.31 3.33 0.95Land rent 92.42 98.87 80.54Operating interest 6.92 11.01 4.95Miscellaneous 0.94 1.42 0.60
Total direct expenses per acre 182.03 208.40 157.52Return over direct exp per acre 34.08 -12.53 76.42
Overhead ExpensesCustom hire 2.93 1.76 1.65Hired labor 3.73 4.17 2.42Machinery & bldg leases 3.57 4.98 1.14Farm insurance 2.92 3.72 3.03Utilities 2.16 3.31 2.09Interest 4.58 4.74 2.52Mach & bldg depreciation 13.24 15.66 11.67Miscellaneous 3.20 4.42 2.99
Total overhead expenses per acre 36.34 42.77 27.51Total dir & ovhd expenses per acre 218.37 251.17 185.04Net return per acre -2.26 -55.30 48.90
Lbr & mgt charge per acre 20.42 21.06 20.72Net return over lbr & mgt -22.68 -76.36 28.18Government payments 35.07 35.33 33.78Net return with govt payments 12.39 -41.03 61.96
Cost of ProductionTotal direct expense per bushel 4.39 5.55 3.47Total dir & ovhd exp per bushel 5.27 6.69 4.08With labor & management 5.76 7.25 4.53Total exp less govt & oth income 4.85 6.24 3.78
Est. labor hours per acre 2.04 2.12 2.33
2001 Annual Report Page 30 Copyright (c) 2001, University of Minnesota
Crop Enterprise AnalysisSouthwest Minnesota Farm Business Management Association
(Farms Sorted By Net Return)
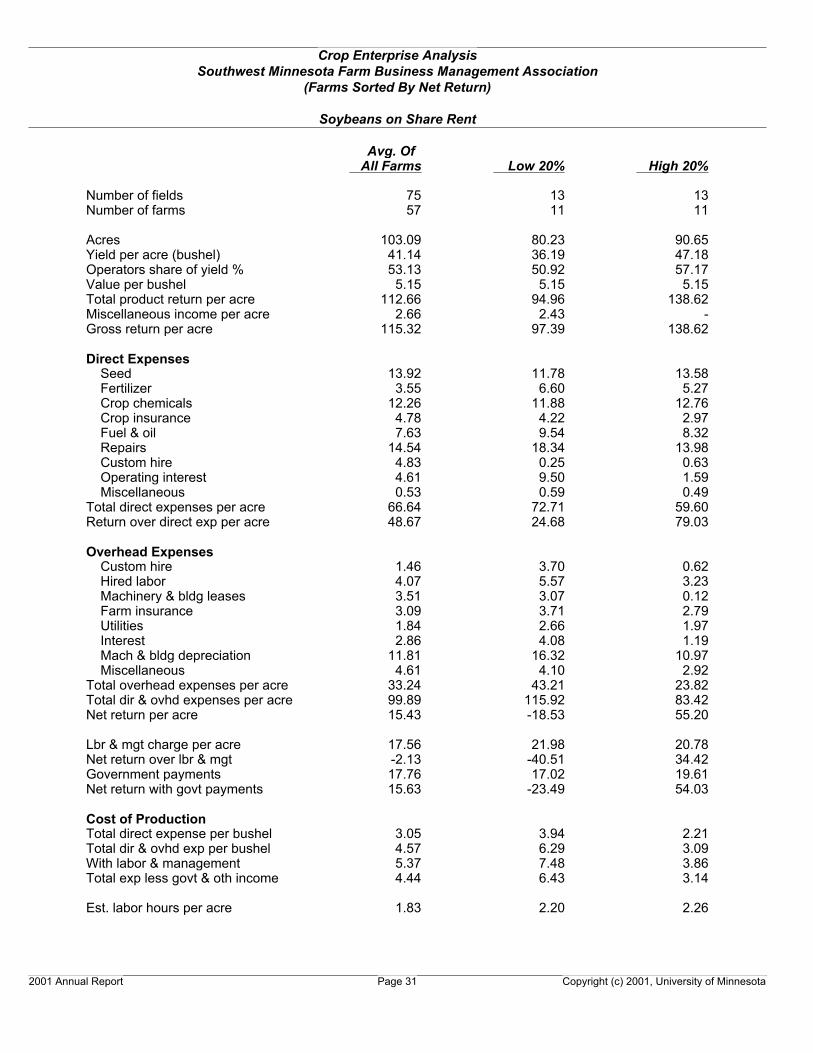
Soybeans on Share Rent
Avg. OfAll Farms Low 20% High 20%
Number of fields 75 13 13Number of farms 57 11 11
Acres 103.09 80.23 90.65Yield per acre (bushel) 41.14 36.19 47.18Operators share of yield % 53.13 50.92 57.17Value per bushel 5.15 5.15 5.15Total product return per acre 112.66 94.96 138.62Miscellaneous income per acre 2.66 2.43 -Gross return per acre 115.32 97.39 138.62
Direct ExpensesSeed 13.92 11.78 13.58Fertilizer 3.55 6.60 5.27Crop chemicals 12.26 11.88 12.76Crop insurance 4.78 4.22 2.97Fuel & oil 7.63 9.54 8.32Repairs 14.54 18.34 13.98Custom hire 4.83 0.25 0.63Operating interest 4.61 9.50 1.59Miscellaneous 0.53 0.59 0.49
Total direct expenses per acre 66.64 72.71 59.60Return over direct exp per acre 48.67 24.68 79.03
Overhead ExpensesCustom hire 1.46 3.70 0.62Hired labor 4.07 5.57 3.23Machinery & bldg leases 3.51 3.07 0.12Farm insurance 3.09 3.71 2.79Utilities 1.84 2.66 1.97Interest 2.86 4.08 1.19Mach & bldg depreciation 11.81 16.32 10.97Miscellaneous 4.61 4.10 2.92
Total overhead expenses per acre 33.24 43.21 23.82Total dir & ovhd expenses per acre 99.89 115.92 83.42Net return per acre 15.43 -18.53 55.20
Lbr & mgt charge per acre 17.56 21.98 20.78Net return over lbr & mgt -2.13 -40.51 34.42Government payments 17.76 17.02 19.61Net return with govt payments 15.63 -23.49 54.03
Cost of ProductionTotal direct expense per bushel 3.05 3.94 2.21Total dir & ovhd exp per bushel 4.57 6.29 3.09With labor & management 5.37 7.48 3.86Total exp less govt & oth income 4.44 6.43 3.14
Est. labor hours per acre 1.83 2.20 2.26
2001 Annual Report Page 31 Copyright (c) 2001, University of Minnesota
Crop Enterprise AnalysisSouthwest Minnesota Farm Business Management Association
(Farms Sorted By Net Return)
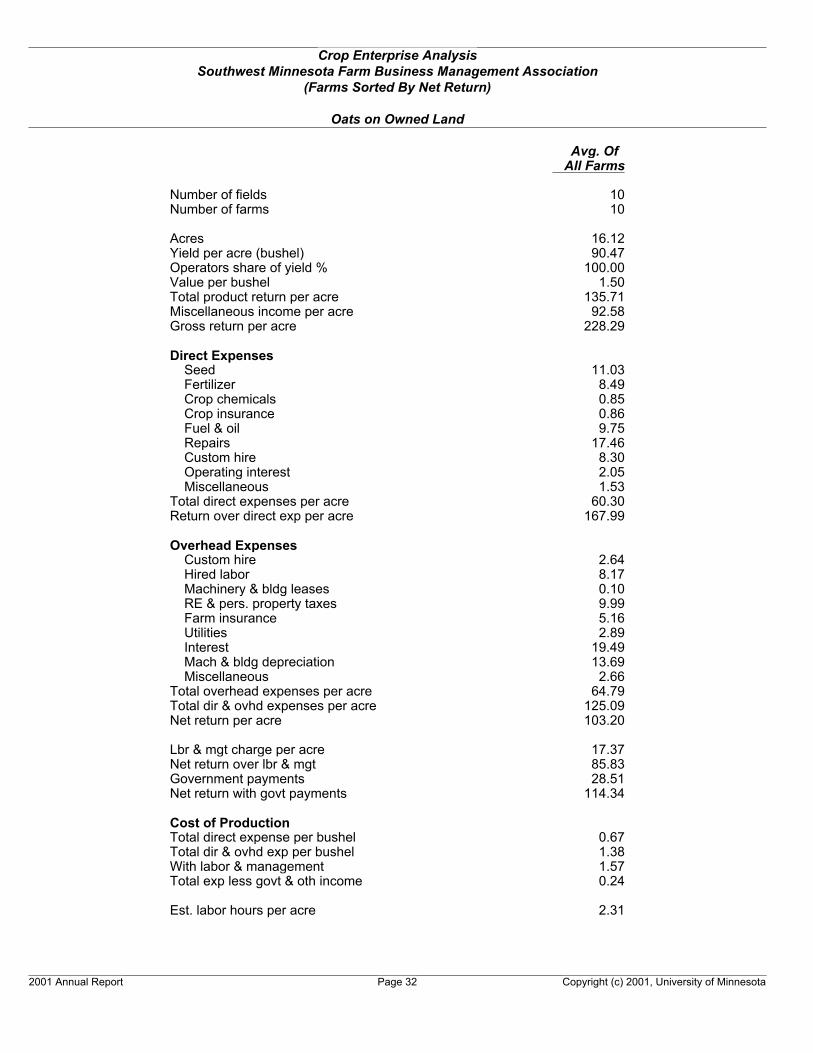
Oats on Owned Land
Avg. OfAll Farms
Number of fields 10Number of farms 10
Acres 16.12Yield per acre (bushel) 90.47Operators share of yield % 100.00Value per bushel 1.50Total product return per acre 135.71Miscellaneous income per acre 92.58Gross return per acre 228.29
Direct ExpensesSeed 11.03Fertilizer 8.49Crop chemicals 0.85Crop insurance 0.86Fuel & oil 9.75Repairs 17.46Custom hire 8.30Operating interest 2.05Miscellaneous 1.53
Total direct expenses per acre 60.30Return over direct exp per acre 167.99
Overhead ExpensesCustom hire 2.64Hired labor 8.17Machinery & bldg leases 0.10RE & pers. property taxes 9.99Farm insurance 5.16Utilities 2.89Interest 19.49Mach & bldg depreciation 13.69Miscellaneous 2.66
Total overhead expenses per acre 64.79Total dir & ovhd expenses per acre 125.09Net return per acre 103.20
Lbr & mgt charge per acre 17.37Net return over lbr & mgt 85.83Government payments 28.51Net return with govt payments 114.34
Cost of ProductionTotal direct expense per bushel 0.67Total dir & ovhd exp per bushel 1.38With labor & management 1.57Total exp less govt & oth income 0.24
Est. labor hours per acre 2.31
2001 Annual Report Page 32 Copyright (c) 2001, University of Minnesota

Crop Enterprise AnalysisSouthwest Minnesota Farm Business Management Association
(Farms Sorted By Net Return)
Oats on Cash Rent
Avg. OfAll Farms
Number of fields 10Number of farms 10
Acres 35.05Yield per acre (bushel) 79.30Operators share of yield % 100.00Value per bushel 1.50Total product return per acre 118.96Miscellaneous income per acre 60.35Gross return per acre 179.30
Direct ExpensesSeed 12.08Fertilizer 7.71Crop chemicals 3.09Crop insurance 0.90Fuel & oil 7.77Repairs 16.52Custom hire 15.21Land rent 88.83Operating interest 3.96Miscellaneous 3.99
Total direct expenses per acre 160.06Return over direct exp per acre 19.24
Overhead ExpensesCustom hire 1.05Hired labor 1.31Machinery & bldg leases 7.92Farm insurance 3.09Utilities 1.25Interest 3.77Mach & bldg depreciation 8.65Miscellaneous 2.16
Total overhead expenses per acre 29.20Total dir & ovhd expenses per acre 189.26Net return per acre -9.96
Lbr & mgt charge per acre 13.31Net return over lbr & mgt -23.27Government payments 28.42Net return with govt payments 5.15
Cost of ProductionTotal direct expense per bushel 2.02Total dir & ovhd exp per bushel 2.39With labor & management 2.55Total exp less govt & oth income 1.44
Est. labor hours per acre 1.14
2001 Annual Report Page 33 Copyright (c) 2001, University of Minnesota
Crop Enterprise AnalysisSouthwest Minnesota Farm Business Management Association
(Farms Sorted By Net Return)
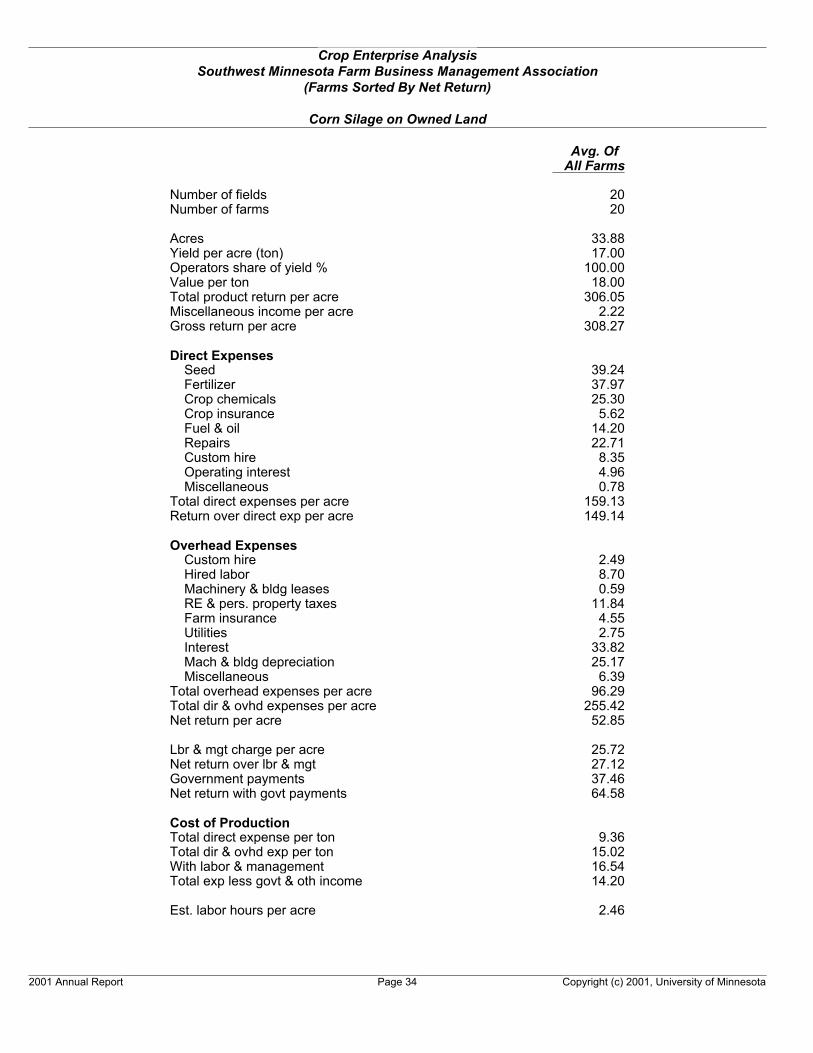
Corn Silage on Owned Land
Avg. OfAll Farms
Number of fields 20Number of farms 20
Acres 33.88Yield per acre (ton) 17.00Operators share of yield % 100.00Value per ton 18.00Total product return per acre 306.05Miscellaneous income per acre 2.22Gross return per acre 308.27
Direct ExpensesSeed 39.24Fertilizer 37.97Crop chemicals 25.30Crop insurance 5.62Fuel & oil 14.20Repairs 22.71Custom hire 8.35Operating interest 4.96Miscellaneous 0.78
Total direct expenses per acre 159.13Return over direct exp per acre 149.14
Overhead ExpensesCustom hire 2.49Hired labor 8.70Machinery & bldg leases 0.59RE & pers. property taxes 11.84Farm insurance 4.55Utilities 2.75Interest 33.82Mach & bldg depreciation 25.17Miscellaneous 6.39
Total overhead expenses per acre 96.29Total dir & ovhd expenses per acre 255.42Net return per acre 52.85
Lbr & mgt charge per acre 25.72Net return over lbr & mgt 27.12Government payments 37.46Net return with govt payments 64.58
Cost of ProductionTotal direct expense per ton 9.36Total dir & ovhd exp per ton 15.02With labor & management 16.54Total exp less govt & oth income 14.20
Est. labor hours per acre 2.46
2001 Annual Report Page 34 Copyright (c) 2001, University of Minnesota
Crop Enterprise AnalysisSouthwest Minnesota Farm Business Management Association
(Farms Sorted By Net Return)
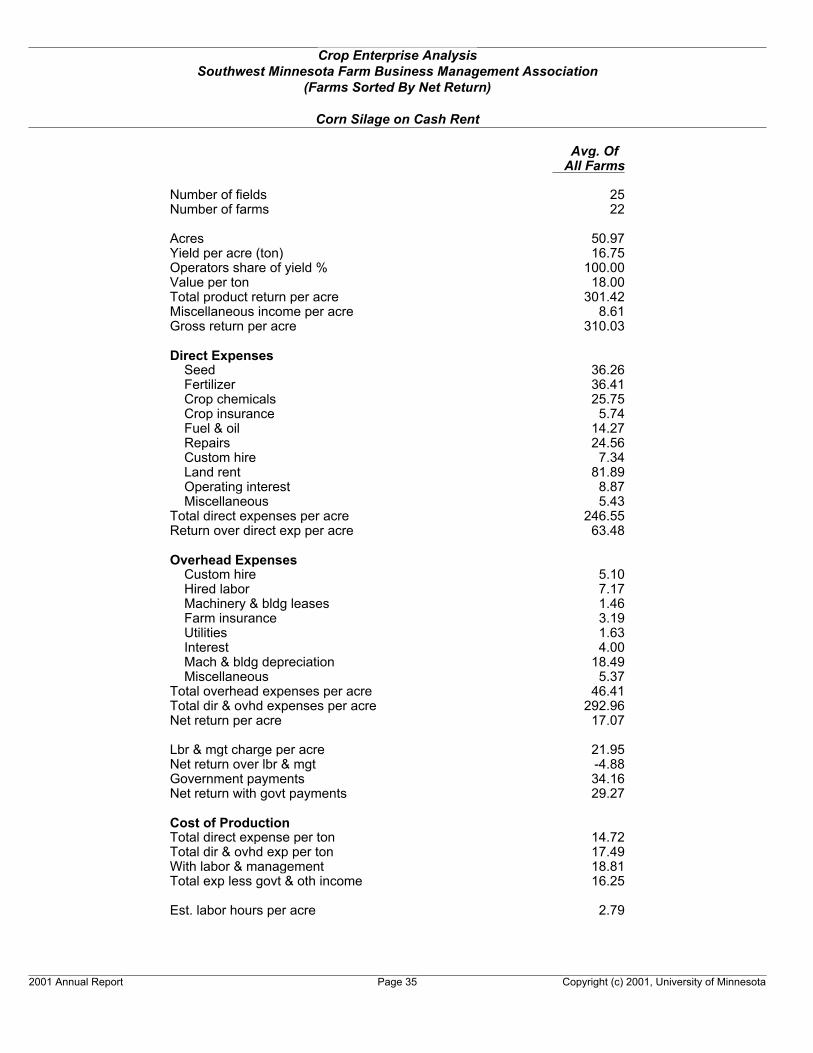
Corn Silage on Cash Rent
Avg. OfAll Farms
Number of fields 25Number of farms 22
Acres 50.97Yield per acre (ton) 16.75Operators share of yield % 100.00Value per ton 18.00Total product return per acre 301.42Miscellaneous income per acre 8.61Gross return per acre 310.03
Direct ExpensesSeed 36.26Fertilizer 36.41Crop chemicals 25.75Crop insurance 5.74Fuel & oil 14.27Repairs 24.56Custom hire 7.34Land rent 81.89Operating interest 8.87Miscellaneous 5.43
Total direct expenses per acre 246.55Return over direct exp per acre 63.48
Overhead ExpensesCustom hire 5.10Hired labor 7.17Machinery & bldg leases 1.46Farm insurance 3.19Utilities 1.63Interest 4.00Mach & bldg depreciation 18.49Miscellaneous 5.37
Total overhead expenses per acre 46.41Total dir & ovhd expenses per acre 292.96Net return per acre 17.07
Lbr & mgt charge per acre 21.95Net return over lbr & mgt -4.88Government payments 34.16Net return with govt payments 29.27
Cost of ProductionTotal direct expense per ton 14.72Total dir & ovhd exp per ton 17.49With labor & management 18.81Total exp less govt & oth income 16.25
Est. labor hours per acre 2.79
2001 Annual Report Page 35 Copyright (c) 2001, University of Minnesota

Crop Enterprise AnalysisSouthwest Minnesota Farm Business Management Association
(Farms Sorted By Net Return)
Hay, Alfalfa on Owned Land
Avg. OfAll Farms
Number of fields 20Number of farms 19
Acres 34.90Yield per acre (ton) 3.78Operators share of yield % 100.00Value per ton 85.00Total product return per acre 321.01Miscellaneous income per acre -Gross return per acre 321.01
Direct ExpensesSeed 4.92Fertilizer 13.84Crop chemicals 2.87Crop insurance 1.56Fuel & oil 13.69Repairs 21.13Custom hire 17.44Operating interest 4.28Miscellaneous 1.17
Total direct expenses per acre 80.90Return over direct exp per acre 240.11
Overhead ExpensesCustom hire 2.58Hired labor 14.68Machinery & bldg leases 0.54RE & pers. property taxes 11.76Farm insurance 5.40Utilities 2.49Interest 23.23Mach & bldg depreciation 22.89Miscellaneous 3.41
Total overhead expenses per acre 86.97Total dir & ovhd expenses per acre 167.88Net return per acre 153.13
Lbr & mgt charge per acre 19.02Net return over lbr & mgt 134.11Government payments 29.56Net return with govt payments 163.67
Cost of ProductionTotal direct expense per ton 21.42Total dir & ovhd exp per ton 44.45With labor & management 49.49Total exp less govt & oth income 41.66
Est. labor hours per acre 2.50
2001 Annual Report Page 36 Copyright (c) 2001, University of Minnesota
Crop Enterprise AnalysisSouthwest Minnesota Farm Business Management Association
(Farms Sorted By Net Return)
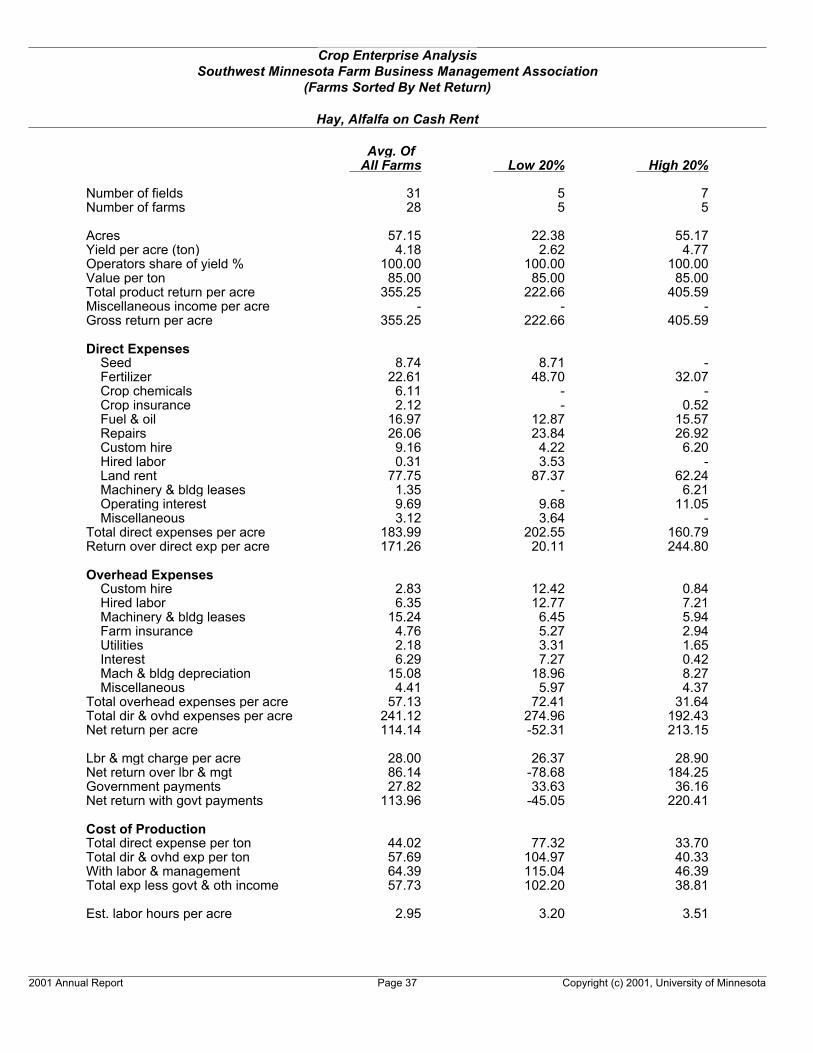
Hay, Alfalfa on Cash Rent
Avg. OfAll Farms Low 20% High 20%
Number of fields 31 5 7Number of farms 28 5 5
Acres 57.15 22.38 55.17Yield per acre (ton) 4.18 2.62 4.77Operators share of yield % 100.00 100.00 100.00Value per ton 85.00 85.00 85.00Total product return per acre 355.25 222.66 405.59Miscellaneous income per acre - - -Gross return per acre 355.25 222.66 405.59
Direct ExpensesSeed 8.74 8.71 -Fertilizer 22.61 48.70 32.07Crop chemicals 6.11 - -Crop insurance 2.12 - 0.52Fuel & oil 16.97 12.87 15.57Repairs 26.06 23.84 26.92Custom hire 9.16 4.22 6.20Hired labor 0.31 3.53 -Land rent 77.75 87.37 62.24Machinery & bldg leases 1.35 - 6.21Operating interest 9.69 9.68 11.05Miscellaneous 3.12 3.64 -
Total direct expenses per acre 183.99 202.55 160.79Return over direct exp per acre 171.26 20.11 244.80
Overhead ExpensesCustom hire 2.83 12.42 0.84Hired labor 6.35 12.77 7.21Machinery & bldg leases 15.24 6.45 5.94Farm insurance 4.76 5.27 2.94Utilities 2.18 3.31 1.65Interest 6.29 7.27 0.42Mach & bldg depreciation 15.08 18.96 8.27Miscellaneous 4.41 5.97 4.37
Total overhead expenses per acre 57.13 72.41 31.64Total dir & ovhd expenses per acre 241.12 274.96 192.43Net return per acre 114.14 -52.31 213.15
Lbr & mgt charge per acre 28.00 26.37 28.90Net return over lbr & mgt 86.14 -78.68 184.25Government payments 27.82 33.63 36.16Net return with govt payments 113.96 -45.05 220.41
Cost of ProductionTotal direct expense per ton 44.02 77.32 33.70Total dir & ovhd exp per ton 57.69 104.97 40.33With labor & management 64.39 115.04 46.39Total exp less govt & oth income 57.73 102.20 38.81
Est. labor hours per acre 2.95 3.20 3.51
2001 Annual Report Page 37 Copyright (c) 2001, University of Minnesota

Crop Enterprise AnalysisSouthwest Minnesota Farm Business Management Association
(Farms Sorted By Net Return)
Pasture on Owned Land
Avg. OfAll Farms
Number of fields 9Number of farms 9
Acres 28.97Yield per acre (unit) 1.98Operators share of yield % 100.00Value per unit 12.30Total product return per acre 24.37Miscellaneous income per acre -Gross return per acre 24.37
Direct ExpensesFertilizer 0.66Crop chemicals 2.19Fuel & oil 1.19Repairs 2.28Operating interest 0.54
Total direct expenses per acre 6.86Return over direct exp per acre 17.52
Overhead ExpensesCustom hire 0.46Hired labor 0.94RE & pers. property taxes 9.45Farm insurance 0.73Utilities 0.28Interest 30.98Mach & bldg depreciation 1.59Miscellaneous 0.59
Total overhead expenses per acre 45.03Total dir & ovhd expenses per acre 51.89Net return per acre -27.52
Lbr & mgt charge per acre 2.21Net return over lbr & mgt -29.72Government payments 0.51Net return with govt payments -29.22
Cost of ProductionTotal direct expense per unit 3.46Total dir & ovhd exp per unit 26.18With labor & management 27.30Total exp less govt & oth income 27.04
Est. labor hours per acre 0.37
2001 Annual Report Page 38 Copyright (c) 2001, University of Minnesota

Crop Enterprise AnalysisSouthwest Minnesota Farm Business Management Association
(Farms Sorted By Net Return)
Pasture on Cash Rent
Avg. OfAll Farms
Number of fields 9Number of farms 9
Acres 105.33Yield per acre (unit) 1.87Operators share of yield % 100.00Value per unit 9.54Total product return per acre 17.87Miscellaneous income per acre -Gross return per acre 17.87
Direct ExpensesCrop chemicals 0.60Fuel & oil 1.10Repairs 1.76Land rent 11.55Operating interest 0.75Miscellaneous 0.12
Total direct expenses per acre 15.87Return over direct exp per acre 2.00
Overhead ExpensesCustom hire 0.25Hired labor 0.51Utilities 0.18Interest 0.41Mach & bldg depreciation 1.13Miscellaneous 0.89
Total overhead expenses per acre 3.37Total dir & ovhd expenses per acre 19.24Net return per acre -1.37
Lbr & mgt charge per acre 1.80Net return over lbr & mgt -3.17Government payments -Net return with govt payments -3.17
Cost of ProductionTotal direct expense per unit 8.47Total dir & ovhd exp per unit 10.27With labor & management 11.23Total exp less govt & oth income 11.23
Est. labor hours per acre 0.26
2001 Annual Report Page 39 Copyright (c) 2001, University of Minnesota

Crop Enterprise AnalysisSouthwest Minnesota Farm Business Management Association
(Farms Sorted By Net Return)
Peas on Owned Land
Avg. OfAll Farms
Number of fields 5Number of farms 5
Acres 32.60Yield per acre (lb) 2,221.14Operators share of yield % 100.00Value per lb 0.08Total product return per acre 171.66Miscellaneous income per acre 53.72Gross return per acre 225.38
Direct ExpensesFertilizer 9.48Crop chemicals 5.67Crop insurance 7.40Fuel & oil 6.48Repairs 9.79Operating interest 4.12
Total direct expenses per acre 42.93Return over direct exp per acre 182.44
Overhead ExpensesCustom hire 0.47Hired labor 2.19RE & pers. property taxes 16.35Farm insurance 2.83Utilities 2.36Interest 49.14Mach & bldg depreciation 15.88Miscellaneous 1.58
Total overhead expenses per acre 90.80Total dir & ovhd expenses per acre 133.73Net return per acre 91.64
Lbr & mgt charge per acre 12.37Net return over lbr & mgt 79.27Government payments -Net return with govt payments 79.27
Cost of ProductionTotal direct expense per lb 0.02Total dir & ovhd exp per lb 0.06With labor & management 0.07Total exp less govt & oth income 0.04
Est. labor hours per acre 1.15
2001 Annual Report Page 40 Copyright (c) 2001, University of Minnesota

Crop Enterprise AnalysisSouthwest Minnesota Farm Business Management Association
(Farms Sorted By Net Return)
Peas on Cash Rent
Avg. OfAll Farms
Number of fields 7Number of farms 7
Acres 31.71Yield per acre (lb) 4,324.17Operators share of yield % 100.00Value per lb 0.07Total product return per acre 303.01Miscellaneous income per acre -Gross return per acre 303.01
Direct ExpensesSeed 1.29Fertilizer 22.00Crop chemicals 8.80Crop insurance 6.11Fuel & oil 6.11Repairs 11.04Custom hire 2.07Land rent 93.25Operating interest 4.88
Total direct expenses per acre 155.56Return over direct exp per acre 147.45
Overhead ExpensesCustom hire 0.75Hired labor 1.42Machinery & bldg leases 0.30Farm insurance 2.46Utilities 1.68Interest 2.47Mach & bldg depreciation 8.49Miscellaneous 3.01
Total overhead expenses per acre 20.58Total dir & ovhd expenses per acre 176.14Net return per acre 126.87
Lbr & mgt charge per acre 12.35Net return over lbr & mgt 114.52Government payments -Net return with govt payments 114.52
Cost of ProductionTotal direct expense per lb 0.04Total dir & ovhd exp per lb 0.04With labor & management 0.04Total exp less govt & oth income 0.04
Est. labor hours per acre 1.24
2001 Annual Report Page 41 Copyright (c) 2001, University of Minnesota

Crop Enterprise AnalysisSouthwest Minnesota Farm Business Management Association
(Farms Sorted By Net Return)
Sweet Corn on Owned Land
Avg. OfAll Farms
Number of fields 5Number of farms 5
Acres 39.48Yield per acre (ton) 6.33Operators share of yield % 100.00Value per ton 45.75Total product return per acre 289.62Miscellaneous income per acre -Gross return per acre 289.62
Direct ExpensesSeed 1.35Fertilizer 33.97Crop chemicals 37.32Crop insurance 4.70Fuel & oil 8.22Repairs 14.55Operating interest 2.65
Total direct expenses per acre 102.77Return over direct exp per acre 186.86
Overhead ExpensesHired labor 0.53Machinery & bldg leases 0.55RE & pers. property taxes 13.19Farm insurance 4.06Utilities 2.40Dues & professional fees 0.67Interest 37.10Mach & bldg depreciation 18.26Miscellaneous 3.55
Total overhead expenses per acre 80.31Total dir & ovhd expenses per acre 183.08Net return per acre 106.55
Lbr & mgt charge per acre 19.20Net return over lbr & mgt 87.34Government payments -Net return with govt payments 87.34
Cost of ProductionTotal direct expense per ton 16.23Total dir & ovhd exp per ton 28.92With labor & management 31.96Total exp less govt & oth income 31.96
Est. labor hours per acre 1.95
2001 Annual Report Page 42 Copyright (c) 2001, University of Minnesota
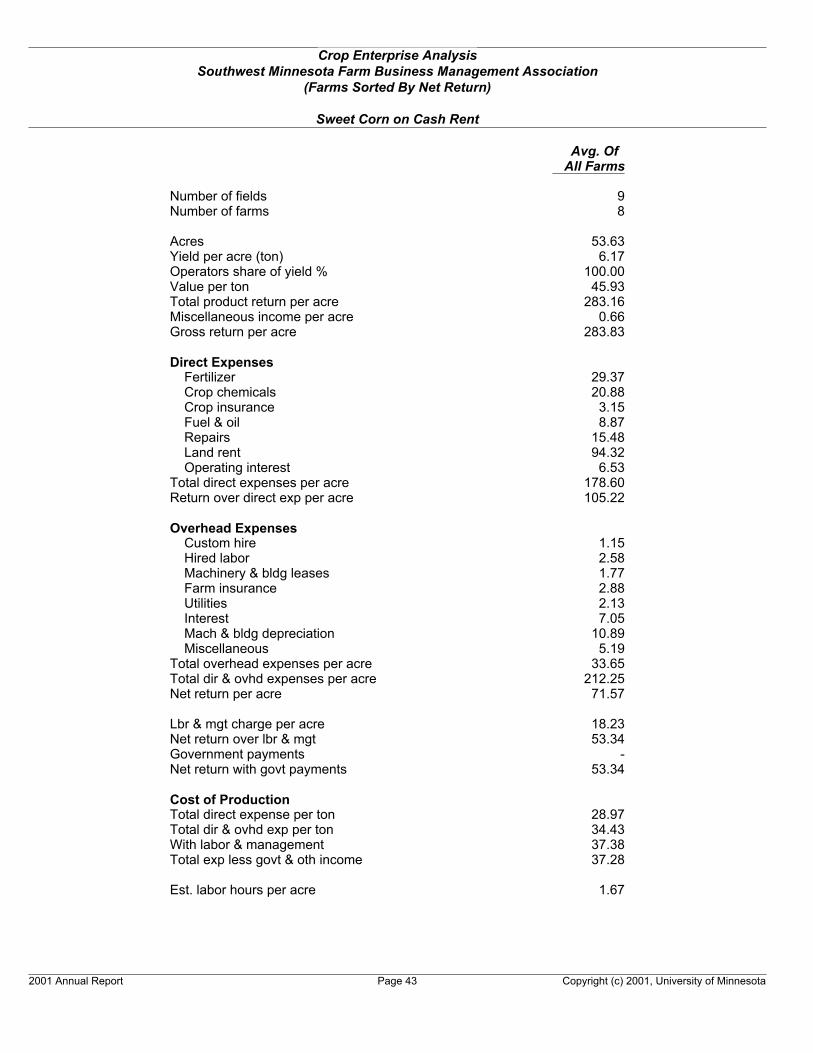
Crop Enterprise AnalysisSouthwest Minnesota Farm Business Management Association
(Farms Sorted By Net Return)
Sweet Corn on Cash Rent
Avg. OfAll Farms
Number of fields 9Number of farms 8
Acres 53.63Yield per acre (ton) 6.17Operators share of yield % 100.00Value per ton 45.93Total product return per acre 283.16Miscellaneous income per acre 0.66Gross return per acre 283.83
Direct ExpensesFertilizer 29.37Crop chemicals 20.88Crop insurance 3.15Fuel & oil 8.87Repairs 15.48Land rent 94.32Operating interest 6.53
Total direct expenses per acre 178.60Return over direct exp per acre 105.22
Overhead ExpensesCustom hire 1.15Hired labor 2.58Machinery & bldg leases 1.77Farm insurance 2.88Utilities 2.13Interest 7.05Mach & bldg depreciation 10.89Miscellaneous 5.19
Total overhead expenses per acre 33.65Total dir & ovhd expenses per acre 212.25Net return per acre 71.57
Lbr & mgt charge per acre 18.23Net return over lbr & mgt 53.34Government payments -Net return with govt payments 53.34
Cost of ProductionTotal direct expense per ton 28.97Total dir & ovhd exp per ton 34.43With labor & management 37.38Total exp less govt & oth income 37.28
Est. labor hours per acre 1.67
2001 Annual Report Page 43 Copyright (c) 2001, University of Minnesota

Crop Enterprise AnalysisSouthwest Minnesota Farm Business Management Association
(Farms Sorted By Net Return)
CRP on Owned Land
Avg. OfAll Farms Low 20% High 20%
Number of fields 26 6 5Number of farms 25 5 5
Acres 34.06 16.85 42.94Yield per acre (unit) 89.92 70.95 104.58Operators share of yield % 100.00 100.00 100.00Value per unit 1.00 1.00 1.00Total product return per acre 89.92 70.95 104.58Miscellaneous income per acre 0.15 - -Gross return per acre 90.07 70.95 104.58
Direct ExpensesSeed 8.81 - -Fuel & oil 0.89 1.85 0.37Repairs 2.22 3.08 2.75Operating interest 0.37 1.12 0.34Miscellaneous 0.50 - -
Total direct expenses per acre 12.79 6.05 3.45Return over direct exp per acre 77.28 64.90 101.13
Overhead ExpensesHired labor 0.53 0.04 1.71RE & pers. property taxes 11.74 10.24 14.99Farm insurance 0.46 0.87 0.57Interest 17.63 53.86 7.80Mach & bldg depreciation 2.83 2.86 1.89Miscellaneous 1.61 1.41 1.90
Total overhead expenses per acre 34.81 69.28 28.86Total dir & ovhd expenses per acre 47.60 75.32 32.32Net return per acre 42.47 -4.37 72.27
Lbr & mgt charge per acre 3.56 3.81 2.82Net return over lbr & mgt 38.91 -8.18 69.45Government payments - - -Net return with govt payments 38.91 -8.18 69.45
Cost of ProductionTotal direct expense per unit 0.14 0.09 0.03Total dir & ovhd exp per unit 0.53 1.06 0.31With labor & management 0.57 1.12 0.34Total exp less govt & oth income 0.57 1.12 0.34
Est. labor hours per acre 0.29 0.32 0.36
2001 Annual Report Page 44 Copyright (c) 2001, University of Minnesota

Crop Enterprise AnalysisSouthwest Minnesota Farm Business Management Association
(Farms Sorted By Net Return)
CRP on Cash Rent
Avg. OfAll Farms
Number of fields 6Number of farms 5
Acres 10.47Yield per acre (unit) 102.89Operators share of yield % 100.00Value per unit 1.00Total product return per acre 102.89Miscellaneous income per acre -Gross return per acre 102.89
Direct ExpensesFuel & oil 0.92Repairs 2.17Land rent 67.83Operating interest 0.58Miscellaneous 0.00
Total direct expenses per acre 71.50Return over direct exp per acre 31.39
Overhead ExpensesHired labor 1.65Machinery & bldg leases 1.04Farm insurance 0.58Utilities 0.34Interest 0.74Mach & bldg depreciation 2.17Miscellaneous 0.43
Total overhead expenses per acre 6.95Total dir & ovhd expenses per acre 78.45Net return per acre 24.44
Lbr & mgt charge per acre 3.15Net return over lbr & mgt 21.29Government payments -Net return with govt payments 21.29
Cost of ProductionTotal direct expense per unit 0.69Total dir & ovhd exp per unit 0.76With labor & management 0.79Total exp less govt & oth income 0.79
Est. labor hours per acre 0.40
2001 Annual Report Page 45 Copyright (c) 2001, University of Minnesota

Crop Enterprise AnalysisSouthwest Minnesota Farm Business Management Association
(Farms Sorted By Net Return)
Rented Out on Owned Land
Avg. OfAll Farms
Number of fields 15Number of farms 15
Acres 201.74Yield per acre (unit) 97.02Operators share of yield % 100.00Value per unit 1.00Total product return per acre 97.02Miscellaneous income per acre -Gross return per acre 97.02
Direct ExpensesFuel & oil 0.51Repairs 2.33Operating interest 2.27
Total direct expenses per acre 5.10Return over direct exp per acre 91.92
Overhead ExpensesCustom hire 0.14Hired labor 0.08Machinery & bldg leases 0.13RE & pers. property taxes 12.77Farm insurance 2.18Utilities 0.28Interest 28.83Mach & bldg depreciation 4.43Miscellaneous 0.37
Total overhead expenses per acre 49.22Total dir & ovhd expenses per acre 54.32Net return per acre 42.70
Lbr & mgt charge per acre 2.95Net return over lbr & mgt 39.75Government payments 0.06Net return with govt payments 39.80
Cost of ProductionTotal direct expense per unit 0.05Total dir & ovhd exp per unit 0.56With labor & management 0.59Total exp less govt & oth income 0.59
Est. labor hours per acre 0.18
2001 Annual Report Page 46 Copyright (c) 2001, University of Minnesota
47
EXPLANATORY NOTES FOR LIVESTOCK TABLES
The “Livestock Enterprise Analysis” tables show the average physical production, gross returns,direct costs, overhead costs, and net returns per budget unit. All costs are actual costs; no opportunitycosts are included. The “Net Return” to the enterprise is the “Gross Return” minus the direct andoverhead costs. The last section of each livestock table contains both economic and technical efficiencymeasures.
Reflecting the statewide trend of decreasing number of farms with livestock, the Association alsohas fewer farms with livestock. In order to provide information with fewer farms, the livestock enterprisereports include farms from both the Southwestern and Southeastern Associations.
The “Dairy” table contains the information for only the milking herd (which includes dry cows). “Dairy Replacement Heifers” are those heifers kept for replacement into the milking herd. “DairySteers” includes only steers for feeding. The “Dairy and Replacement Heifers” table is for the wholeherd and includes those farms in the “Dairy” and “Dairy Replacement Heifers” tables; it does not include“Dairy Steers.”
The “Beef, Finish Beef Calves” tables include the FINPACK codes for beef steer and heifer calffinishing; there was no yearling feeding.
“Lbs. feed per lb. of gain” is the lbs. of total feed divided by “Total production.” For grains, thesepounds per bushel are used: corn, 56; oats, 32; barley, 48; grain sorghum, 56; wheat, 60; and millet, 48. For these forages, the pounds are calculated by these factors: alfalfa haylage, 0.5; corn silage, 0.33;oatlage, 0.5; and sorghum silage, 0.33; and small grain silage, 0.33.
The calving and weaning percentages are calculated as the number of calves which are calvedand weaned, respectively, divided by the number of cows which are supposed to bear young.
Rounding of individual items for the report may have caused minor discrepancies with thecalculated totals. If fewer than 5 farms have a certain livestock enterprise, that information is notreported. If there are fewer than 25 farms, the high and low groups are not reported.
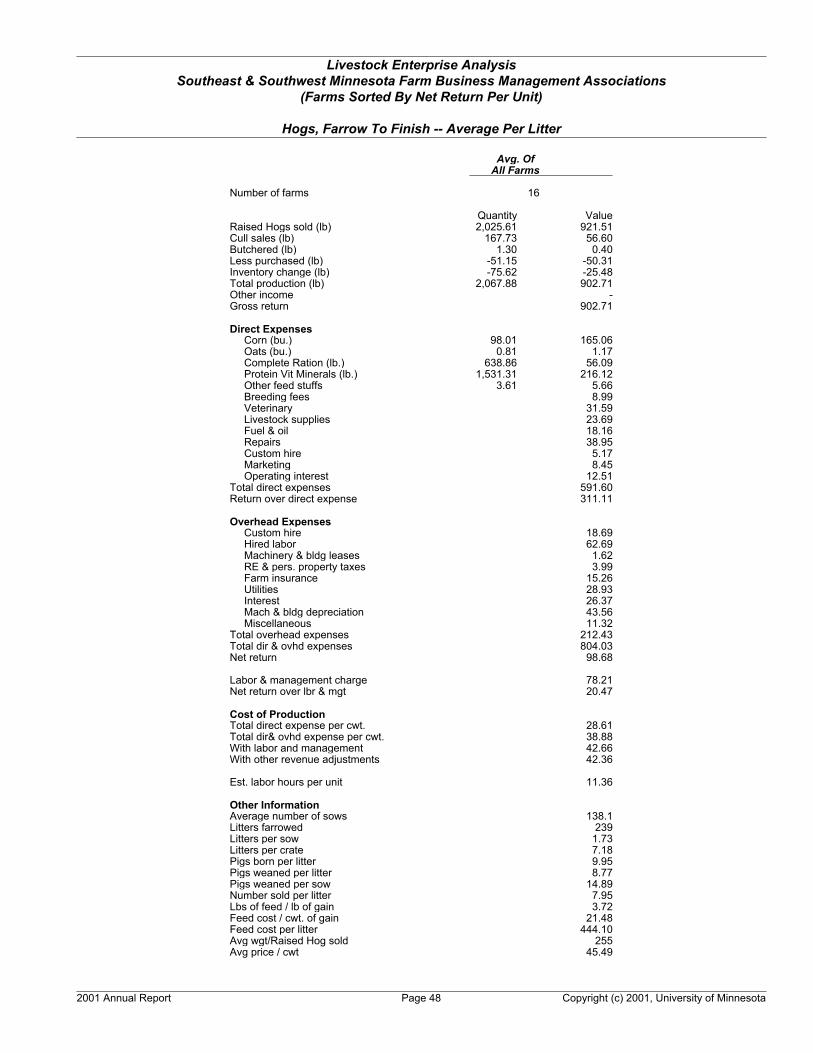
Livestock Enterprise AnalysisSoutheast & Southwest Minnesota Farm Business Management Associations
(Farms Sorted By Net Return Per Unit)
Hogs, Farrow To Finish -- Average Per Litter
Avg. OfAll Farms
Number of farms 16
Quantity ValueRaised Hogs sold (lb) 2,025.61 921.51Cull sales (lb) 167.73 56.60Butchered (lb) 1.30 0.40Less purchased (lb) -51.15 -50.31Inventory change (lb) -75.62 -25.48Total production (lb) 2,067.88 902.71Other income -Gross return 902.71
Direct ExpensesCorn (bu.) 98.01 165.06Oats (bu.) 0.81 1.17Complete Ration (lb.) 638.86 56.09Protein Vit Minerals (lb.) 1,531.31 216.12Other feed stuffs 3.61 5.66Breeding fees 8.99Veterinary 31.59Livestock supplies 23.69Fuel & oil 18.16Repairs 38.95Custom hire 5.17Marketing 8.45Operating interest 12.51
Total direct expenses 591.60Return over direct expense 311.11
Overhead ExpensesCustom hire 18.69Hired labor 62.69Machinery & bldg leases 1.62RE & pers. property taxes 3.99Farm insurance 15.26Utilities 28.93Interest 26.37Mach & bldg depreciation 43.56Miscellaneous 11.32
Total overhead expenses 212.43Total dir & ovhd expenses 804.03Net return 98.68
Labor & management charge 78.21Net return over lbr & mgt 20.47
Cost of ProductionTotal direct expense per cwt. 28.61Total dir& ovhd expense per cwt. 38.88With labor and management 42.66With other revenue adjustments 42.36
Est. labor hours per unit 11.36
Other InformationAverage number of sows 138.1Litters farrowed 239Litters per sow 1.73Litters per crate 7.18Pigs born per litter 9.95Pigs weaned per litter 8.77Pigs weaned per sow 14.89Number sold per litter 7.95Lbs of feed / lb of gain 3.72Feed cost / cwt. of gain 21.48Feed cost per litter 444.10Avg wgt/Raised Hog sold 255Avg price / cwt 45.49
2001 Annual Report Page 48 Copyright (c) 2001, University of Minnesota

Livestock Enterprise AnalysisSoutheast & Southwest Minnesota Farm Business Management Associations
(Farms Sorted By Net Return Per Unit)
Hogs, Farrow To Finish -- Average Per Cwt. Produced
Avg. OfAll Farms
Number of farms 16
Quantity ValueRaised Hogs sold (lb) 97.96 44.56Cull sales (lb) 8.11 2.74Butchered (lb) 0.06 0.02Less purchased (lb) -2.47 -2.43Inventory change (lb) -3.66 -1.23Total production (lb) 100.00 43.65Other income -Gross return 43.65
Direct ExpensesCorn (bu.) 4.74 7.98Oats (bu.) 0.04 0.06Complete Ration (lb.) 30.89 2.71Protein Vit Minerals (lb.) 74.05 10.45Other feed stuffs 0.17 0.27Breeding fees 0.43Veterinary 1.53Livestock supplies 1.15Fuel & oil 0.88Repairs 1.88Custom hire 0.25Marketing 0.41Operating interest 0.61
Total direct expenses 28.61Return over direct expense 15.04
Overhead ExpensesCustom hire 0.90Hired labor 3.03Machinery & bldg leases 0.08RE & pers. property taxes 0.19Farm insurance 0.74Utilities 1.40Interest 1.28Mach & bldg depreciation 2.11Miscellaneous 0.55
Total overhead expenses 10.27Total dir & ovhd expenses 38.88Net return 4.77
Labor & management charge 3.78Net return over lbr & mgt 0.99
Cost of ProductionTotal direct expense per cwt. 28.61Total dir& ovhd expense per cwt. 38.88With labor and management 42.66With other revenue adjustments 42.36
Est. labor hours per unit 0.55
Other InformationAverage number of sows 138.1Litters farrowed 239Litters per sow 1.73Litters per crate 7.18Pigs born per litter 9.95Pigs weaned per litter 8.77Pigs weaned per sow 14.89Number sold per litter 7.95Lbs of feed / lb of gain 3.72Feed cost / cwt. of gain 21.48Feed cost per litter 444.10Avg wgt/Raised Hog sold 255Avg price / cwt 45.49
2001 Annual Report Page 49 Copyright (c) 2001, University of Minnesota

Livestock Enterprise AnalysisSoutheast & Southwest Minnesota Farm Business Management Associations
(Farms Sorted By Net Return Per Unit)
Hogs, Finish Feeder Pigs -- Average Per Head
Avg. OfAll Farms
Number of farms 9
Quantity ValueFinish Hogs sold (lb) 247.52 108.63Transferred out (lb) 0.14 0.05Butchered (lb) 0.27 0.13Less purchased (lb) -46.84 -48.08Less transferred in (lb) -4.58 -4.53Inventory change (lb) 8.22 5.29Total production (lb) 204.73 61.50Other income -Gross return 61.50
Direct ExpensesCorn (bu.) 9.52 15.78Complete Ration (lb.) 5.59 0.42Protein Vit Minerals (lb.) 126.28 20.63Other feed stuffs 0.08 0.57Veterinary 0.31Livestock supplies 0.30Fuel & oil 0.48Repairs 1.54Custom hire 0.92Machinery & bldg leases 0.76Livestock leases 1.09Marketing 0.69Operating interest 1.48
Total direct expenses 44.95Return over direct expense 16.55
Overhead ExpensesHired labor 0.21Machinery & bldg leases 0.99RE & pers. property taxes 0.41Farm insurance 0.71Utilities 1.49Dues & professional fees 0.05Interest 2.02Mach & bldg depreciation 2.37Miscellaneous 1.29
Total overhead expenses 9.55Total dir & ovhd expenses 54.50Net return 7.00
Labor & management charge 6.60Net return over lbr & mgt 0.40
Cost of ProductionTotal direct expense per cwt. 37.20Total dir& ovhd expense per cwt. 41.06With labor and management 43.72With other revenue adjustments 43.72
Est. labor hours per unit 0.54
Other InformationNo. purchased or trans in 1,297Number sold or trans out 1,165Percentage death loss 3.3Avg. daily gain (lbs) 1.36Lbs of conc / lb of gain 3.21Lbs of feed / lb of gain 3.24Feed cost per cwt of gain 18.26Feed cost per head 37.39Average purchase weight 49Average sales weight 262Avg purch price / head 50.20Avg sales price / cwt 43.89
2001 Annual Report Page 50 Copyright (c) 2001, University of Minnesota

Livestock Enterprise AnalysisSoutheast & Southwest Minnesota Farm Business Management Associations
(Farms Sorted By Net Return Per Unit)
Hogs, Finish Feeder Pigs -- Average Per Cwt. Produced
Avg. OfAll Farms
Number of farms 9
Quantity ValueFinish Hogs sold (lb) 120.90 53.06Transferred out (lb) 0.07 0.03Butchered (lb) 0.13 0.06Less purchased (lb) -22.88 -23.48Less transferred in (lb) -2.24 -2.21Inventory change (lb) 4.02 2.59Total production (lb) 100.00 30.04Other income -Gross return 30.04
Direct ExpensesCorn (bu.) 4.65 7.71Complete Ration (lb.) 2.73 0.20Protein Vit Minerals (lb.) 61.68 10.07Other feed stuffs 0.04 0.28Veterinary 0.15Livestock supplies 0.14Fuel & oil 0.23Repairs 0.75Custom hire 0.45Machinery & bldg leases 0.37Livestock leases 0.53Marketing 0.34Operating interest 0.72
Total direct expenses 21.96Return over direct expense 8.08
Overhead ExpensesHired labor 0.10Machinery & bldg leases 0.48RE & pers. property taxes 0.20Farm insurance 0.35Utilities 0.73Dues & professional fees 0.02Interest 0.99Mach & bldg depreciation 1.16Miscellaneous 0.63
Total overhead expenses 4.67Total dir & ovhd expenses 26.62Net return 3.42
Labor & management charge 3.22Net return over lbr & mgt 0.19
Cost of ProductionTotal direct expense per cwt. 37.20Total dir& ovhd expense per cwt. 41.06With labor and management 43.72With other revenue adjustments 43.72
Est. labor hours per unit 0.26
Other InformationNo. purchased or trans in 1,297Number sold or trans out 1,165Percentage death loss 3.3Avg. daily gain (lbs) 1.36Lbs of conc / lb of gain 3.21Lbs of feed / lb of gain 3.24Feed cost per cwt of gain 18.26Feed cost per head 37.39Average purchase weight 49Average sales weight 262Avg purch price / head 50.20Avg sales price / cwt 43.89
2001 Annual Report Page 51 Copyright (c) 2001, University of Minnesota

Livestock Enterprise AnalysisSoutheast & Southwest Minnesota Farm Business Management Associations
(Farms Sorted By Net Return Per Unit)
Hogs, Weaning to Finish -- Average Per Head
Avg. OfAll Farms
Number of farms 14
Quantity ValueWean-Fin Pig sold (lb) 258.94 118.08Cull sales (lb) 1.77 0.48Butchered (lb) 0.04 0.02Less purchased (lb) -15.12 -39.91Less transferred in (lb) -0.09 -0.30Inventory change (lb) 2.96 0.86Total production (lb) 248.50 79.22Other income 1.11Gross return 80.33
Direct ExpensesCorn (bu.) 8.97 15.98Complete Ration (lb.) 72.85 11.54Protein Vit Minerals (lb.) 65.80 8.34Other feed stuffs 0.04 5.88Veterinary 2.08Livestock supplies 0.50Fuel & oil 1.51Repairs 1.79Custom hire 1.28Marketing 0.70Operating interest 1.04
Total direct expenses 50.64Return over direct expense 29.70
Overhead ExpensesHired labor 3.54Machinery & bldg leases 7.19RE & pers. property taxes 0.19Farm insurance 1.03Utilities 1.33Interest 2.38Mach & bldg depreciation 2.55Miscellaneous 0.67
Total overhead expenses 18.88Total dir & ovhd expenses 69.52Net return 10.81
Labor & management charge 2.85Net return over lbr & mgt 7.97
Cost of ProductionTotal direct expense per cwt. 34.56Total dir& ovhd expense per cwt. 41.85With labor and management 42.95With other revenue adjustments 42.52
Est. labor hours per unit 0.40
Other InformationNo. purchased or trans in 7,978Number sold or trans out 6,830Percentage death loss 6.9Avg. daily gain (lbs) 1.36Lbs of conc / lb of gain 2.57Lbs of feed / lb of gain 2.85Feed cost per cwt of gain 16.79Feed cost per head 41.73Average purchase weight 13Average sales weight 261Avg purch price / head 34.69Avg sales price / cwt 45.60
2001 Annual Report Page 52 Copyright (c) 2001, University of Minnesota
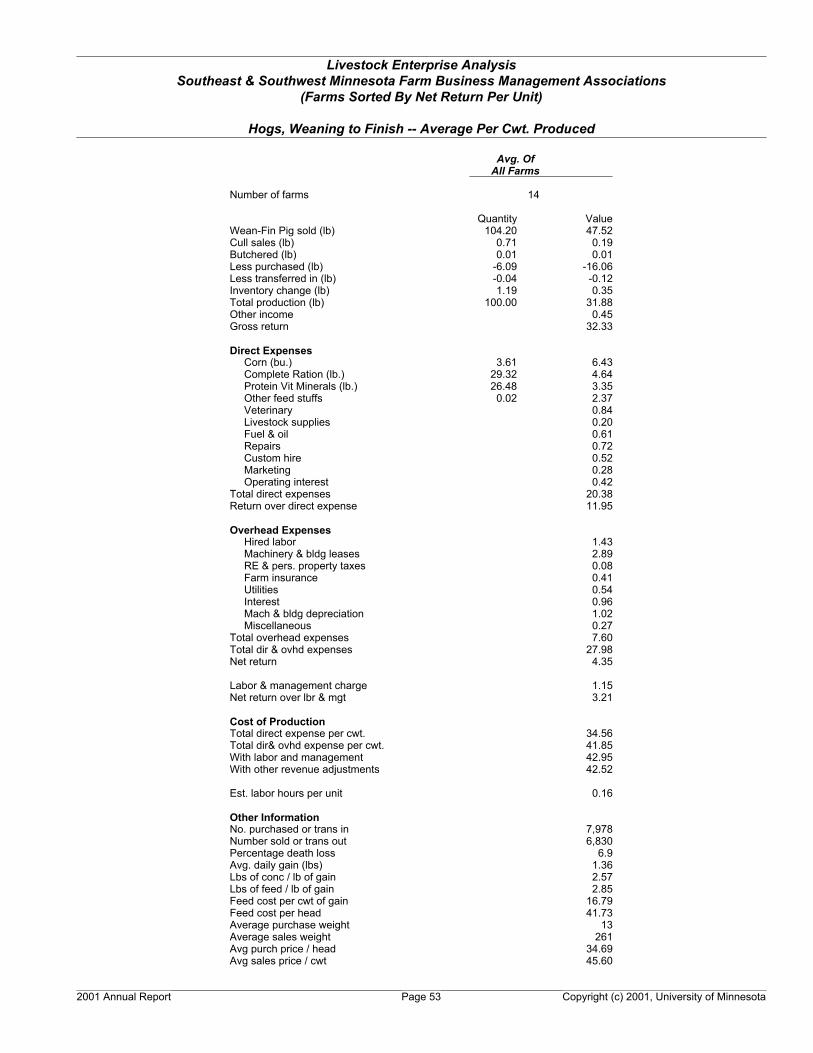
Livestock Enterprise AnalysisSoutheast & Southwest Minnesota Farm Business Management Associations
(Farms Sorted By Net Return Per Unit)
Hogs, Weaning to Finish -- Average Per Cwt. Produced
Avg. OfAll Farms
Number of farms 14
Quantity ValueWean-Fin Pig sold (lb) 104.20 47.52Cull sales (lb) 0.71 0.19Butchered (lb) 0.01 0.01Less purchased (lb) -6.09 -16.06Less transferred in (lb) -0.04 -0.12Inventory change (lb) 1.19 0.35Total production (lb) 100.00 31.88Other income 0.45Gross return 32.33
Direct ExpensesCorn (bu.) 3.61 6.43Complete Ration (lb.) 29.32 4.64Protein Vit Minerals (lb.) 26.48 3.35Other feed stuffs 0.02 2.37Veterinary 0.84Livestock supplies 0.20Fuel & oil 0.61Repairs 0.72Custom hire 0.52Marketing 0.28Operating interest 0.42
Total direct expenses 20.38Return over direct expense 11.95
Overhead ExpensesHired labor 1.43Machinery & bldg leases 2.89RE & pers. property taxes 0.08Farm insurance 0.41Utilities 0.54Interest 0.96Mach & bldg depreciation 1.02Miscellaneous 0.27
Total overhead expenses 7.60Total dir & ovhd expenses 27.98Net return 4.35
Labor & management charge 1.15Net return over lbr & mgt 3.21
Cost of ProductionTotal direct expense per cwt. 34.56Total dir& ovhd expense per cwt. 41.85With labor and management 42.95With other revenue adjustments 42.52
Est. labor hours per unit 0.16
Other InformationNo. purchased or trans in 7,978Number sold or trans out 6,830Percentage death loss 6.9Avg. daily gain (lbs) 1.36Lbs of conc / lb of gain 2.57Lbs of feed / lb of gain 2.85Feed cost per cwt of gain 16.79Feed cost per head 41.73Average purchase weight 13Average sales weight 261Avg purch price / head 34.69Avg sales price / cwt 45.60
2001 Annual Report Page 53 Copyright (c) 2001, University of Minnesota
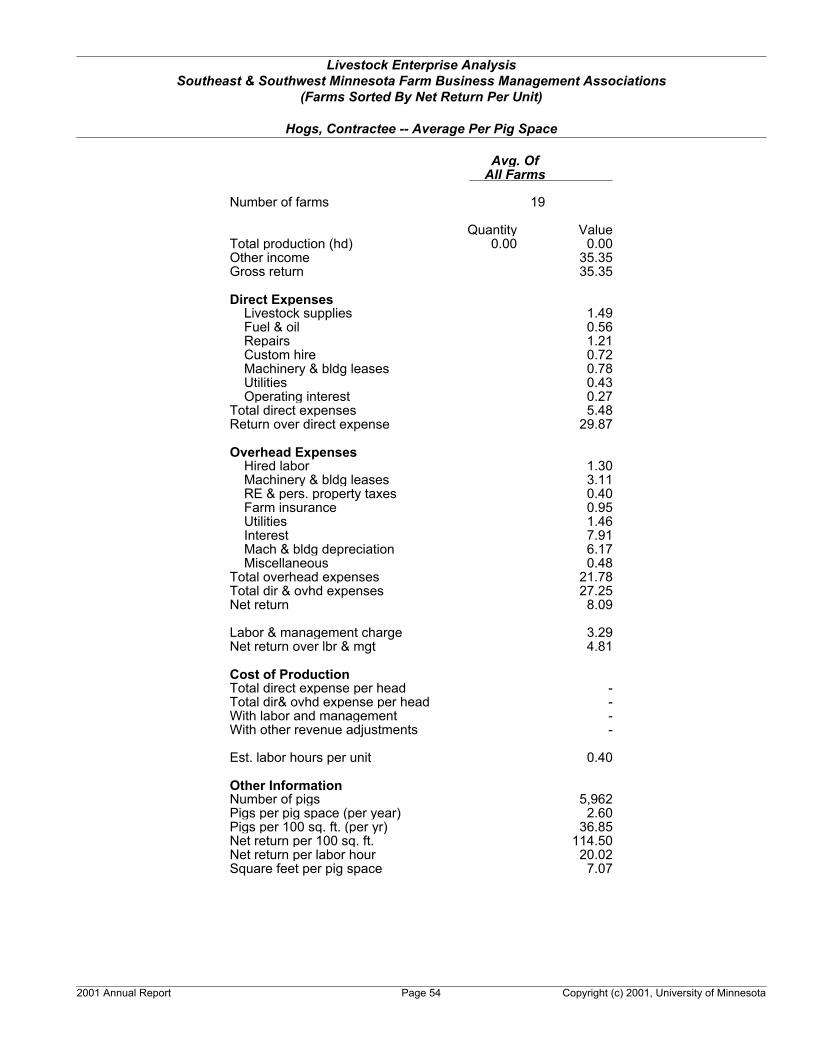
Livestock Enterprise AnalysisSoutheast & Southwest Minnesota Farm Business Management Associations
(Farms Sorted By Net Return Per Unit)
Hogs, Contractee -- Average Per Pig Space
Avg. OfAll Farms
Number of farms 19
Quantity ValueTotal production (hd) 0.00 0.00Other income 35.35Gross return 35.35
Direct ExpensesLivestock supplies 1.49Fuel & oil 0.56Repairs 1.21Custom hire 0.72Machinery & bldg leases 0.78Utilities 0.43Operating interest 0.27
Total direct expenses 5.48Return over direct expense 29.87
Overhead ExpensesHired labor 1.30Machinery & bldg leases 3.11RE & pers. property taxes 0.40Farm insurance 0.95Utilities 1.46Interest 7.91Mach & bldg depreciation 6.17Miscellaneous 0.48
Total overhead expenses 21.78Total dir & ovhd expenses 27.25Net return 8.09
Labor & management charge 3.29Net return over lbr & mgt 4.81
Cost of ProductionTotal direct expense per head -Total dir& ovhd expense per head -With labor and management -With other revenue adjustments -
Est. labor hours per unit 0.40
Other InformationNumber of pigs 5,962Pigs per pig space (per year) 2.60Pigs per 100 sq. ft. (per yr) 36.85Net return per 100 sq. ft. 114.50Net return per labor hour 20.02Square feet per pig space 7.07
2001 Annual Report Page 54 Copyright (c) 2001, University of Minnesota

Livestock Enterprise AnalysisSoutheast & Southwest Minnesota Farm Business Management Associations
(Farms Sorted By Net Return Per Unit)
Beef Cow-Calf -- Average Per Cow
Avg. OfAll Farms
Number of farms 16
Quantity ValueBeef Calves sold (lb) 114.46 108.55Transferred out (lb) 344.55 328.29Cull sales (lb) 148.55 84.56Butchered (lb) 6.31 2.71Less purchased (lb) -16.92 -53.37Less transferred in (lb) -86.07 -76.96Inventory change (lb) 123.07 31.33Total production (lb) 633.95 425.12Other income -Gross return 425.12
Direct ExpensesCorn (bu.) 2.49 4.18Corn Silage (lb.) 6,147.40 53.92Hay, Alfalfa (lb.) 2,390.03 91.05Hay, Grass & Other (lb.) 2,215.91 40.77Haylage, Alfalfa (lb.) 42.42 0.74Pasture (aum) 2.32 40.48Stover (lb.) 333.83 8.12Complete Ration (lb.) 17.94 11.04Protein Vit Minerals (lb.) 69.33 14.12Other feed stuffs 6.38 0.30Breeding fees 9.97Veterinary 19.32Livestock supplies 5.52Fuel & oil 9.66Repairs 21.62Custom hire 4.19Bedding 0.57Operating interest 11.65
Total direct expenses 347.20Return over direct expense 77.92
Overhead ExpensesCustom hire 1.77Hired labor 4.36Machinery & bldg leases 2.35RE & pers. property taxes 0.92Farm insurance 8.91Utilities 11.12Interest 6.39Mach & bldg depreciation 12.50Miscellaneous 9.25
Total overhead expenses 57.56Total dir & ovhd expenses 404.76Net return 20.36
Labor & management charge 65.83Net return over lbr & mgt -45.46
Cost of ProductionTotal direct expense per cwt. 54.77Total dir& ovhd expense per cwt. 63.85With labor and management 74.23With other revenue adjustments 63.90
Est. labor hours per unit 7.30
Other InformationNumber of cows 58.9Pregnancy percentage 98.0Pregnancy loss percentage 3.0Culling percentage 15.3Calving percentage 95.1Weaning percentage 87.9Calves sold per cow 0.88Calf death loss percent 7.5Average weaning weight 524Lbs weaned/exposed female 460Feed cost per cow 264.71Avg wgt/Beef Calf sold 580Avg price / cwt 94.84
2001 Annual Report Page 55 Copyright (c) 2001, University of Minnesota
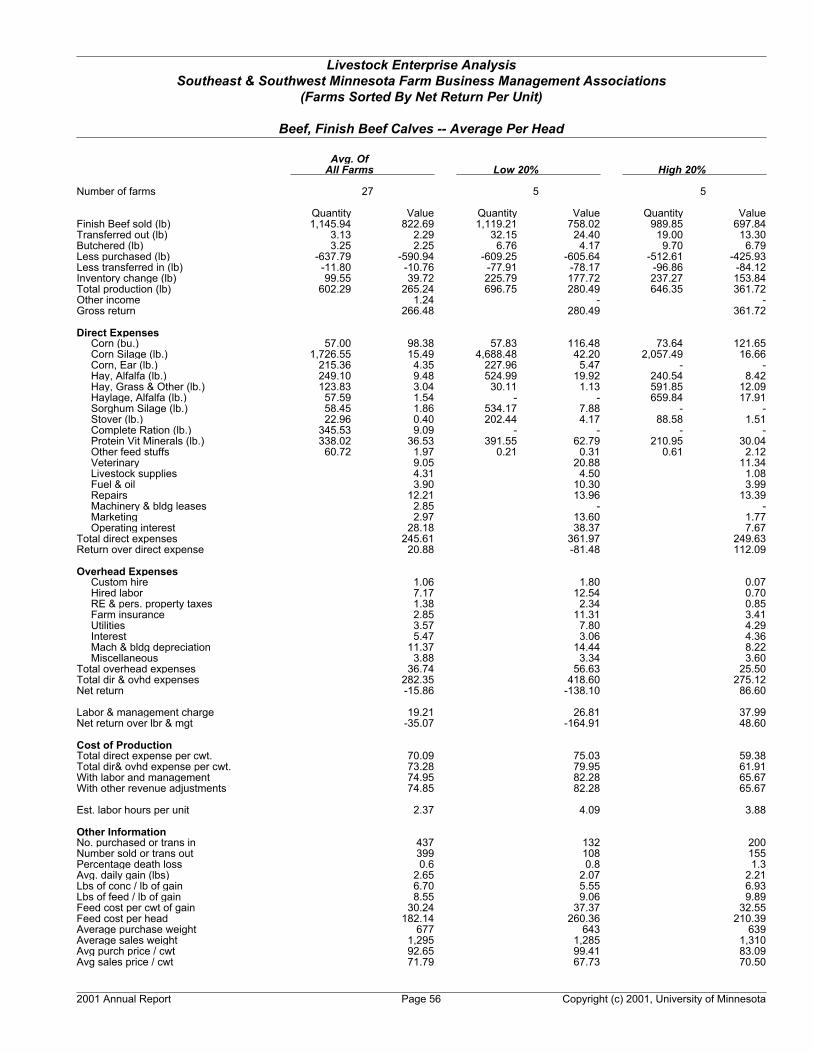
Livestock Enterprise AnalysisSoutheast & Southwest Minnesota Farm Business Management Associations
(Farms Sorted By Net Return Per Unit)
Beef, Finish Beef Calves -- Average Per Head
Avg. OfAll Farms Low 20% High 20%
Number of farms 27 5 5
Quantity Value Quantity Value Quantity ValueFinish Beef sold (lb) 1,145.94 822.69 1,119.21 758.02 989.85 697.84Transferred out (lb) 3.13 2.29 32.15 24.40 19.00 13.30Butchered (lb) 3.25 2.25 6.76 4.17 9.70 6.79Less purchased (lb) -637.79 -590.94 -609.25 -605.64 -512.61 -425.93Less transferred in (lb) -11.80 -10.76 -77.91 -78.17 -96.86 -84.12Inventory change (lb) 99.55 39.72 225.79 177.72 237.27 153.84Total production (lb) 602.29 265.24 696.75 280.49 646.35 361.72Other income 1.24 - -Gross return 266.48 280.49 361.72
Direct ExpensesCorn (bu.) 57.00 98.38 57.83 116.48 73.64 121.65Corn Silage (lb.) 1,726.55 15.49 4,688.48 42.20 2,057.49 16.66Corn, Ear (lb.) 215.36 4.35 227.96 5.47 - -Hay, Alfalfa (lb.) 249.10 9.48 524.99 19.92 240.54 8.42Hay, Grass & Other (lb.) 123.83 3.04 30.11 1.13 591.85 12.09Haylage, Alfalfa (lb.) 57.59 1.54 - - 659.84 17.91Sorghum Silage (lb.) 58.45 1.86 534.17 7.88 - -Stover (lb.) 22.96 0.40 202.44 4.17 88.58 1.51Complete Ration (lb.) 345.53 9.09 - - - -Protein Vit Minerals (lb.) 338.02 36.53 391.55 62.79 210.95 30.04Other feed stuffs 60.72 1.97 0.21 0.31 0.61 2.12Veterinary 9.05 20.88 11.34Livestock supplies 4.31 4.50 1.08Fuel & oil 3.90 10.30 3.99Repairs 12.21 13.96 13.39Machinery & bldg leases 2.85 - -Marketing 2.97 13.60 1.77Operating interest 28.18 38.37 7.67
Total direct expenses 245.61 361.97 249.63Return over direct expense 20.88 -81.48 112.09
Overhead ExpensesCustom hire 1.06 1.80 0.07Hired labor 7.17 12.54 0.70RE & pers. property taxes 1.38 2.34 0.85Farm insurance 2.85 11.31 3.41Utilities 3.57 7.80 4.29Interest 5.47 3.06 4.36Mach & bldg depreciation 11.37 14.44 8.22Miscellaneous 3.88 3.34 3.60
Total overhead expenses 36.74 56.63 25.50Total dir & ovhd expenses 282.35 418.60 275.12Net return -15.86 -138.10 86.60
Labor & management charge 19.21 26.81 37.99Net return over lbr & mgt -35.07 -164.91 48.60
Cost of ProductionTotal direct expense per cwt. 70.09 75.03 59.38Total dir& ovhd expense per cwt. 73.28 79.95 61.91With labor and management 74.95 82.28 65.67With other revenue adjustments 74.85 82.28 65.67
Est. labor hours per unit 2.37 4.09 3.88
Other InformationNo. purchased or trans in 437 132 200Number sold or trans out 399 108 155Percentage death loss 0.6 0.8 1.3Avg. daily gain (lbs) 2.65 2.07 2.21Lbs of conc / lb of gain 6.70 5.55 6.93Lbs of feed / lb of gain 8.55 9.06 9.89Feed cost per cwt of gain 30.24 37.37 32.55Feed cost per head 182.14 260.36 210.39Average purchase weight 677 643 639Average sales weight 1,295 1,285 1,310Avg purch price / cwt 92.65 99.41 83.09Avg sales price / cwt 71.79 67.73 70.50
2001 Annual Report Page 56 Copyright (c) 2001, University of Minnesota

Livestock Enterprise AnalysisSoutheast & Southwest Minnesota Farm Business Management Associations
(Farms Sorted By Net Return Per Unit)
Beef, Finish Beef Calves -- Average Per Cwt. Produced
Avg. OfAll Farms Low 20% High 20%
Number of farms 27 5 5
Quantity Value Quantity Value Quantity ValueFinish Beef sold (lb) 190.26 136.59 160.63 108.79 153.15 107.97Transferred out (lb) 0.52 0.38 4.61 3.50 2.94 2.06Butchered (lb) 0.54 0.37 0.97 0.60 1.50 1.05Less purchased (lb) -105.89 -98.12 -87.44 -86.92 -79.31 -65.90Less transferred in (lb) -1.96 -1.79 -11.18 -11.22 -14.99 -13.01Inventory change (lb) 16.53 6.59 32.41 25.51 36.71 23.80Total production (lb) 100.00 44.04 100.00 40.26 100.00 55.96Other income 0.21 - -Gross return 44.25 40.26 55.96
Direct ExpensesCorn (bu.) 9.46 16.34 8.30 16.72 11.39 18.82Corn Silage (lb.) 286.66 2.57 672.91 6.06 318.33 2.58Corn, Ear (lb.) 35.76 0.72 32.72 0.79 - -Hay, Alfalfa (lb.) 41.36 1.57 75.35 2.86 37.22 1.30Hay, Grass & Other (lb.) 20.56 0.50 4.32 0.16 91.57 1.87Haylage, Alfalfa (lb.) 9.56 0.26 - - 102.09 2.77Sorghum Silage (lb.) 9.70 0.31 76.67 1.13 - -Stover (lb.) 3.81 0.07 29.06 0.60 13.70 0.23Complete Ration (lb.) 57.37 1.51 - - - -Protein Vit Minerals (lb.) 56.12 6.07 56.20 9.01 32.64 4.65Other feed stuffs 10.08 0.33 0.03 0.05 0.09 0.33Veterinary 1.50 3.00 1.75Livestock supplies 0.72 0.65 0.17Fuel & oil 0.65 1.48 0.62Repairs 2.03 2.00 2.07Machinery & bldg leases 0.47 - -Marketing 0.49 1.95 0.27Operating interest 4.68 5.51 1.19
Total direct expenses 40.78 51.95 38.62Return over direct expense 3.47 -11.69 17.34
Overhead ExpensesCustom hire 0.18 0.26 0.01Hired labor 1.19 1.80 0.11RE & pers. property taxes 0.23 0.34 0.13Farm insurance 0.47 1.62 0.53Utilities 0.59 1.12 0.66Interest 0.91 0.44 0.67Mach & bldg depreciation 1.89 2.07 1.27Miscellaneous 0.64 0.48 0.56
Total overhead expenses 6.10 8.13 3.94Total dir & ovhd expenses 46.88 60.08 42.57Net return -2.63 -19.82 13.40
Labor & management charge 3.19 3.85 5.88Net return over lbr & mgt -5.82 -23.67 7.52
Cost of ProductionTotal direct expense per cwt. 70.09 75.03 59.38Total dir& ovhd expense per cwt. 73.28 79.95 61.91With labor and management 74.95 82.28 65.67With other revenue adjustments 74.85 82.28 65.67
Est. labor hours per unit 0.39 0.59 0.60
Other InformationNo. purchased or trans in 437 132 200Number sold or trans out 399 108 155Percentage death loss 0.6 0.8 1.3Avg. daily gain (lbs) 2.65 2.07 2.21Lbs of conc / lb of gain 6.70 5.55 6.93Lbs of feed / lb of gain 8.55 9.06 9.89Feed cost per cwt of gain 30.24 37.37 32.55Feed cost per head 182.14 260.36 210.39Average purchase weight 677 643 639Average sales weight 1,295 1,285 1,310Avg purch price / cwt 92.65 99.41 83.09Avg sales price / cwt 71.79 67.73 70.50
2001 Annual Report Page 57 Copyright (c) 2001, University of Minnesota

Livestock Enterprise AnalysisSoutheast & Southwest Minnesota Farm Business Management Associations
(Farms Sorted By Net Return Per Unit)
Dairy -- Average Per Cow
Avg. OfAll Farms Low 20% High 20%
Number of farms 30 6 6
Quantity Value Quantity Value Quantity ValueMilk sold (lb) 21,644.82 3,200.63 22,015.46 3,107.25 22,020.54 3,389.62Milk used in home (lb) 10.38 1.21 2.75 0.34 21.02 2.10Milk fed to animals (lb) 28.09 2.98 59.23 6.89 - -Dairy Calves sold (hd) 0.23 30.48 0.46 52.20 - -Transferred out (hd) 0.71 78.13 0.37 55.19 0.86 85.92Cull sales (hd) 0.28 126.81 0.22 84.34 0.24 133.73Butchered (hd) 0.00 0.43 0.00 0.33 - -Less purchased (hd) -0.16 -224.13 -0.51 -724.95 0.00 -3.89Less transferred in (hd) -0.27 -362.61 -0.10 -121.32 -0.36 -466.49Inventory change (hd) 0.08 122.51 0.35 388.92 0.05 196.78Total production 2,976.44 2,849.18 3,337.79Other income 22.92 31.91 20.36Gross return 2,999.37 2,881.10 3,358.15
Direct ExpensesCorn (bu.) 92.66 155.78 85.50 155.28 103.37 165.40Corn Silage (lb.) 12,670.73 95.13 16,047.17 118.98 11,187.67 72.72Hay, Alfalfa (lb.) 3,039.08 128.15 2,933.02 119.29 2,914.48 114.90Haylage, Alfalfa (lb.) 6,209.28 125.87 5,320.75 105.72 11,831.10 234.66Complete Ration (lb.) 409.49 33.80 - - - -Protein Vit Minerals (lb.) 3,803.35 486.71 5,152.23 601.12 3,704.02 498.62Other feed stuffs 1,090.75 20.74 558.62 10.95 1.23 1.82Breeding fees 36.07 39.53 33.25Veterinary 116.92 130.08 108.46BST 26.47 22.82 -Livestock supplies 200.13 213.14 235.56Fuel & oil 25.27 38.72 16.92Repairs 109.50 133.60 127.19Custom hire 54.64 88.25 24.45Hired labor 61.41 16.98 -Marketing 33.88 10.00 23.08Operating interest 10.58 19.24 1.98
Total direct expenses 1,721.03 1,823.70 1,659.01Return over direct expense 1,278.34 1,057.40 1,699.13
Overhead ExpensesCustom hire 11.79 16.97 1.42Hired labor 243.90 347.78 145.98Machinery & bldg leases 20.37 35.52 15.71Farm insurance 21.74 24.02 19.62Utilities 52.94 55.68 45.72Interest 92.92 242.04 9.02Mach & bldg depreciation 96.78 80.23 87.58Miscellaneous 49.42 22.34 28.35
Total overhead expenses 589.88 824.59 353.42Total dir & ovhd expenses 2,310.91 2,648.29 2,012.43Net return 688.46 232.81 1,345.72
Labor & management charge 201.35 209.13 288.79Net return over lbr & mgt 487.12 23.69 1,056.93
Cost of ProductionTotal direct expense per cwt. 7.94 8.26 7.53Total dir& ovhd expense per cwt. 10.66 12.00 9.13With labor and management 11.59 12.94 10.44With other revenue adjustments 12.53 14.00 10.59
Est. labor hours per unit 48.11 55.47 42.95
Other InformationAvg. number of Cows 131.4 176.7 124.3Milk produced per Cow 21,683 22,077 22,042Percent butterfat in milk 3.8 3.7 3.8Culling percentage 27.9 21.8 24.3Turnover rate 36.5 32.3 30.7Percent of barn capacity 104.5 96.5 96.6Lbs. milk/lb grain & conc. 2.2 2.2 2.7Feed cost per cwt of milk 4.82 5.03 4.94Feed cost per Cow 1,046.17 1,111.34 1,088.12Avg. milk price per cwt. 14.79 14.11 15.39
2001 Annual Report Page 58 Copyright (c) 2001, University of Minnesota
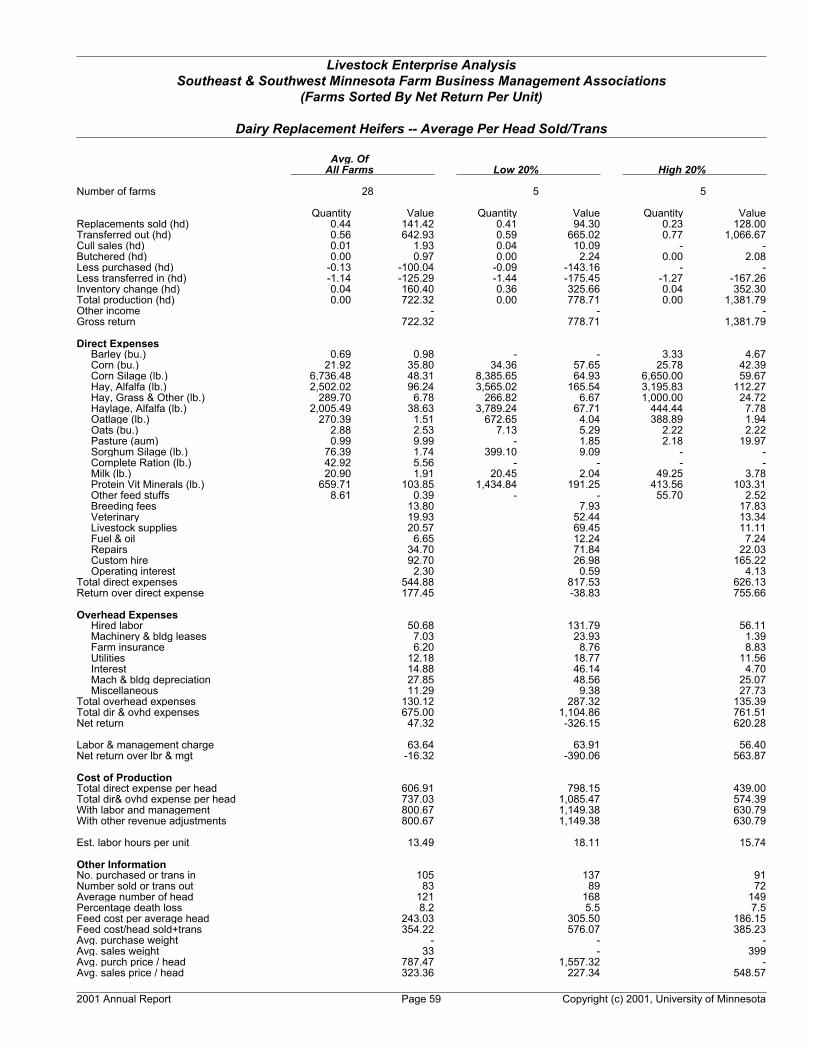
Livestock Enterprise AnalysisSoutheast & Southwest Minnesota Farm Business Management Associations
(Farms Sorted By Net Return Per Unit)
Dairy Replacement Heifers -- Average Per Head Sold/Trans
Avg. OfAll Farms Low 20% High 20%
Number of farms 28 5 5
Quantity Value Quantity Value Quantity ValueReplacements sold (hd) 0.44 141.42 0.41 94.30 0.23 128.00Transferred out (hd) 0.56 642.93 0.59 665.02 0.77 1,066.67Cull sales (hd) 0.01 1.93 0.04 10.09 - -Butchered (hd) 0.00 0.97 0.00 2.24 0.00 2.08Less purchased (hd) -0.13 -100.04 -0.09 -143.16 - -Less transferred in (hd) -1.14 -125.29 -1.44 -175.45 -1.27 -167.26Inventory change (hd) 0.04 160.40 0.36 325.66 0.04 352.30Total production (hd) 0.00 722.32 0.00 778.71 0.00 1,381.79Other income - - -Gross return 722.32 778.71 1,381.79
Direct ExpensesBarley (bu.) 0.69 0.98 - - 3.33 4.67Corn (bu.) 21.92 35.80 34.36 57.65 25.78 42.39Corn Silage (lb.) 6,736.48 48.31 8,385.65 64.93 6,650.00 59.67Hay, Alfalfa (lb.) 2,502.02 96.24 3,565.02 165.54 3,195.83 112.27Hay, Grass & Other (lb.) 289.70 6.78 266.82 6.67 1,000.00 24.72Haylage, Alfalfa (lb.) 2,005.49 38.63 3,789.24 67.71 444.44 7.78Oatlage (lb.) 270.39 1.51 672.65 4.04 388.89 1.94Oats (bu.) 2.88 2.53 7.13 5.29 2.22 2.22Pasture (aum) 0.99 9.99 - 1.85 2.18 19.97Sorghum Silage (lb.) 76.39 1.74 399.10 9.09 - -Complete Ration (lb.) 42.92 5.56 - - - -Milk (lb.) 20.90 1.91 20.45 2.04 49.25 3.78Protein Vit Minerals (lb.) 659.71 103.85 1,434.84 191.25 413.56 103.31Other feed stuffs 8.61 0.39 - - 55.70 2.52Breeding fees 13.80 7.93 17.83Veterinary 19.93 52.44 13.34Livestock supplies 20.57 69.45 11.11Fuel & oil 6.65 12.24 7.24Repairs 34.70 71.84 22.03Custom hire 92.70 26.98 165.22Operating interest 2.30 0.59 4.13
Total direct expenses 544.88 817.53 626.13Return over direct expense 177.45 -38.83 755.66
Overhead ExpensesHired labor 50.68 131.79 56.11Machinery & bldg leases 7.03 23.93 1.39Farm insurance 6.20 8.76 8.83Utilities 12.18 18.77 11.56Interest 14.88 46.14 4.70Mach & bldg depreciation 27.85 48.56 25.07Miscellaneous 11.29 9.38 27.73
Total overhead expenses 130.12 287.32 135.39Total dir & ovhd expenses 675.00 1,104.86 761.51Net return 47.32 -326.15 620.28
Labor & management charge 63.64 63.91 56.40Net return over lbr & mgt -16.32 -390.06 563.87
Cost of ProductionTotal direct expense per head 606.91 798.15 439.00Total dir& ovhd expense per head 737.03 1,085.47 574.39With labor and management 800.67 1,149.38 630.79With other revenue adjustments 800.67 1,149.38 630.79
Est. labor hours per unit 13.49 18.11 15.74
Other InformationNo. purchased or trans in 105 137 91Number sold or trans out 83 89 72Average number of head 121 168 149Percentage death loss 8.2 5.5 7.5Feed cost per average head 243.03 305.50 186.15Feed cost/head sold+trans 354.22 576.07 385.23Avg. purchase weight - - -Avg. sales weight 33 - 399Avg. purch price / head 787.47 1,557.32 -Avg. sales price / head 323.36 227.34 548.57
2001 Annual Report Page 59 Copyright (c) 2001, University of Minnesota
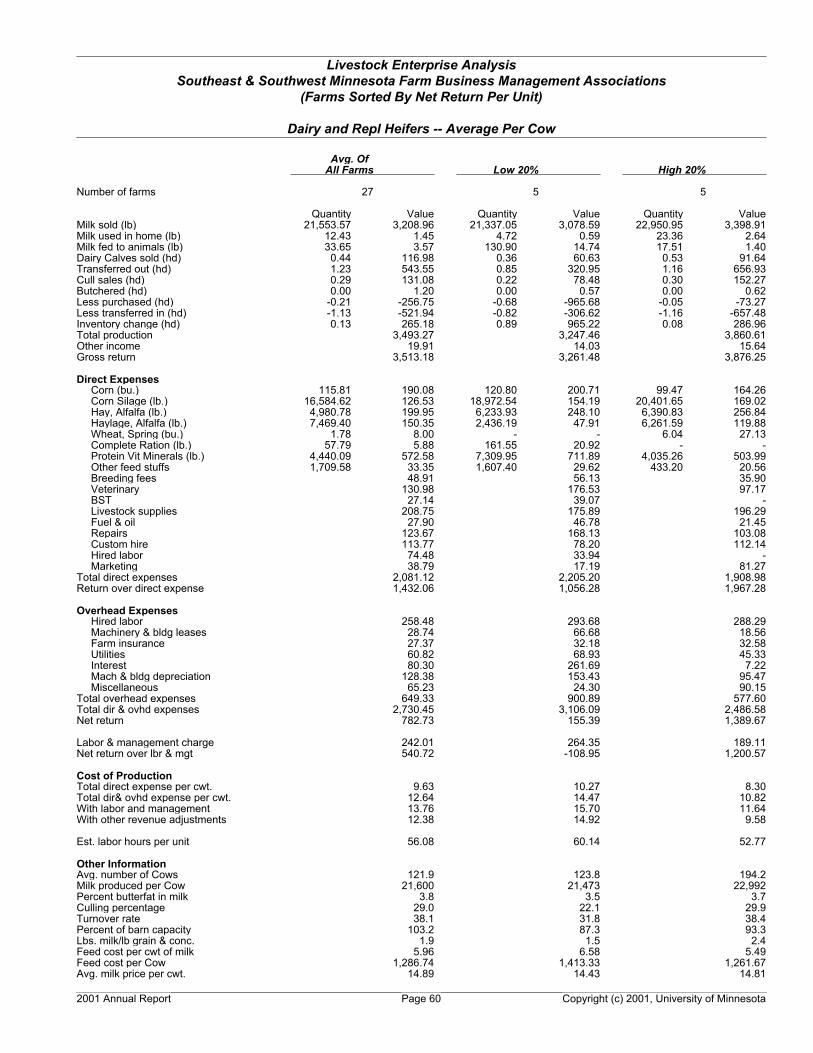
Livestock Enterprise AnalysisSoutheast & Southwest Minnesota Farm Business Management Associations
(Farms Sorted By Net Return Per Unit)
Dairy and Repl Heifers -- Average Per Cow
Avg. OfAll Farms Low 20% High 20%
Number of farms 27 5 5
Quantity Value Quantity Value Quantity ValueMilk sold (lb) 21,553.57 3,208.96 21,337.05 3,078.59 22,950.95 3,398.91Milk used in home (lb) 12.43 1.45 4.72 0.59 23.36 2.64Milk fed to animals (lb) 33.65 3.57 130.90 14.74 17.51 1.40Dairy Calves sold (hd) 0.44 116.98 0.36 60.63 0.53 91.64Transferred out (hd) 1.23 543.55 0.85 320.95 1.16 656.93Cull sales (hd) 0.29 131.08 0.22 78.48 0.30 152.27Butchered (hd) 0.00 1.20 0.00 0.57 0.00 0.62Less purchased (hd) -0.21 -256.75 -0.68 -965.68 -0.05 -73.27Less transferred in (hd) -1.13 -521.94 -0.82 -306.62 -1.16 -657.48Inventory change (hd) 0.13 265.18 0.89 965.22 0.08 286.96Total production 3,493.27 3,247.46 3,860.61Other income 19.91 14.03 15.64Gross return 3,513.18 3,261.48 3,876.25
Direct ExpensesCorn (bu.) 115.81 190.08 120.80 200.71 99.47 164.26Corn Silage (lb.) 16,584.62 126.53 18,972.54 154.19 20,401.65 169.02Hay, Alfalfa (lb.) 4,980.78 199.95 6,233.93 248.10 6,390.83 256.84Haylage, Alfalfa (lb.) 7,469.40 150.35 2,436.19 47.91 6,261.59 119.88Wheat, Spring (bu.) 1.78 8.00 - - 6.04 27.13Complete Ration (lb.) 57.79 5.88 161.55 20.92 - -Protein Vit Minerals (lb.) 4,440.09 572.58 7,309.95 711.89 4,035.26 503.99Other feed stuffs 1,709.58 33.35 1,607.40 29.62 433.20 20.56Breeding fees 48.91 56.13 35.90Veterinary 130.98 176.53 97.17BST 27.14 39.07 -Livestock supplies 208.75 175.89 196.29Fuel & oil 27.90 46.78 21.45Repairs 123.67 168.13 103.08Custom hire 113.77 78.20 112.14Hired labor 74.48 33.94 -Marketing 38.79 17.19 81.27
Total direct expenses 2,081.12 2,205.20 1,908.98Return over direct expense 1,432.06 1,056.28 1,967.28
Overhead ExpensesHired labor 258.48 293.68 288.29Machinery & bldg leases 28.74 66.68 18.56Farm insurance 27.37 32.18 32.58Utilities 60.82 68.93 45.33Interest 80.30 261.69 7.22Mach & bldg depreciation 128.38 153.43 95.47Miscellaneous 65.23 24.30 90.15
Total overhead expenses 649.33 900.89 577.60Total dir & ovhd expenses 2,730.45 3,106.09 2,486.58Net return 782.73 155.39 1,389.67
Labor & management charge 242.01 264.35 189.11Net return over lbr & mgt 540.72 -108.95 1,200.57
Cost of ProductionTotal direct expense per cwt. 9.63 10.27 8.30Total dir& ovhd expense per cwt. 12.64 14.47 10.82With labor and management 13.76 15.70 11.64With other revenue adjustments 12.38 14.92 9.58
Est. labor hours per unit 56.08 60.14 52.77
Other InformationAvg. number of Cows 121.9 123.8 194.2Milk produced per Cow 21,600 21,473 22,992Percent butterfat in milk 3.8 3.5 3.7Culling percentage 29.0 22.1 29.9Turnover rate 38.1 31.8 38.4Percent of barn capacity 103.2 87.3 93.3Lbs. milk/lb grain & conc. 1.9 1.5 2.4Feed cost per cwt of milk 5.96 6.58 5.49Feed cost per Cow 1,286.74 1,413.33 1,261.67Avg. milk price per cwt. 14.89 14.43 14.81
2001 Annual Report Page 60 Copyright (c) 2001, University of Minnesota

Livestock Enterprise AnalysisSoutheast & Southwest Minnesota Farm Business Management Associations
(Farms Sorted By Net Return Per Unit)
Dairy Steers -- Average Per Head
Avg. OfAll Farms
Number of farms 8
Quantity ValueDairy Steers sold (lb) 1,099.82 721.72Transferred out (lb) 27.11 19.95Butchered (lb) 13.96 8.05Less purchased (lb) -208.25 -230.79Less transferred in (lb) -153.83 -110.11Inventory change (lb) 255.61 116.90Total production (lb) 1,034.40 525.73Other income -Gross return 525.73
Direct ExpensesCorn (bu.) 107.71 179.86Corn Silage (lb.) 635.16 4.13Hay, Grass & Other (lb.) 352.21 8.40Haylage, Alfalfa (lb.) 910.26 17.95Protein Vit Minerals (lb.) 645.96 118.27Other feed stuffs 16.18 0.57Veterinary 19.86Livestock supplies 12.54Fuel & oil 9.05Repairs 19.28Custom hire 1.17Marketing 10.15Operating interest 5.62
Total direct expenses 406.84Return over direct expense 118.89
Overhead ExpensesCustom hire 0.91Hired labor 4.78Machinery & bldg leases 3.08RE & pers. property taxes 1.64Farm insurance 8.46Utilities 14.69Interest 1.11Mach & bldg depreciation 10.65Miscellaneous 5.50
Total overhead expenses 50.82Total dir & ovhd expenses 457.66Net return 68.07
Labor & management charge 54.73Net return over lbr & mgt 13.34
Cost of ProductionTotal direct expense per cwt. 55.26Total dir& ovhd expense per cwt. 59.77With labor and management 64.63With other revenue adjustments 64.63
Est. labor hours per unit 5.27
Other InformationNo. purchased or trans in 72Number sold or trans out 54Percentage death loss 2.3Avg. daily gain (lbs) 2.28Lbs of conc / lb of gain 6.37Lbs of feed / lb of gain 7.37Feed cost per cwt of gain 31.82Feed cost per head 329.17Average purchase weight 252Average sales weight 1,301Avg purch price / head 278.96Avg sales price / cwt 65.62
2001 Annual Report Page 61 Copyright (c) 2001, University of Minnesota

Livestock Enterprise AnalysisSoutheast & Southwest Minnesota Farm Business Management Associations
(Farms Sorted By Net Return Per Unit)
Dairy Steers -- Average Per Cwt. Produced
Avg. OfAll Farms
Number of farms 8
Quantity ValueDairy Steers sold (lb) 106.32 69.77Transferred out (lb) 2.62 1.93Butchered (lb) 1.35 0.78Less purchased (lb) -20.13 -22.31Less transferred in (lb) -14.87 -10.64Inventory change (lb) 24.71 11.30Total production (lb) 100.00 50.82Other income -Gross return 50.82
Direct ExpensesCorn (bu.) 10.41 17.39Corn Silage (lb.) 61.40 0.40Hay, Grass & Other (lb.) 34.05 0.81Haylage, Alfalfa (lb.) 88.00 1.74Protein Vit Minerals (lb.) 62.45 11.43Other feed stuffs 1.56 0.05Veterinary 1.92Livestock supplies 1.21Fuel & oil 0.88Repairs 1.86Custom hire 0.11Marketing 0.98Operating interest 0.54
Total direct expenses 39.33Return over direct expense 11.49
Overhead ExpensesCustom hire 0.09Hired labor 0.46Machinery & bldg leases 0.30RE & pers. property taxes 0.16Farm insurance 0.82Utilities 1.42Interest 0.11Mach & bldg depreciation 1.03Miscellaneous 0.53
Total overhead expenses 4.91Total dir & ovhd expenses 44.24Net return 6.58
Labor & management charge 5.29Net return over lbr & mgt 1.29
Cost of ProductionTotal direct expense per cwt. 55.26Total dir& ovhd expense per cwt. 59.77With labor and management 64.63With other revenue adjustments 64.63
Est. labor hours per unit 0.51
Other InformationNo. purchased or trans in 72Number sold or trans out 54Percentage death loss 2.3Avg. daily gain (lbs) 2.28Lbs of conc / lb of gain 6.37Lbs of feed / lb of gain 7.37Feed cost per cwt of gain 31.82Feed cost per head 329.17Average purchase weight 252Average sales weight 1,301Avg purch price / head 278.96Avg sales price / cwt 65.62
2001 Annual Report Page 62 Copyright (c) 2001, University of Minnesota
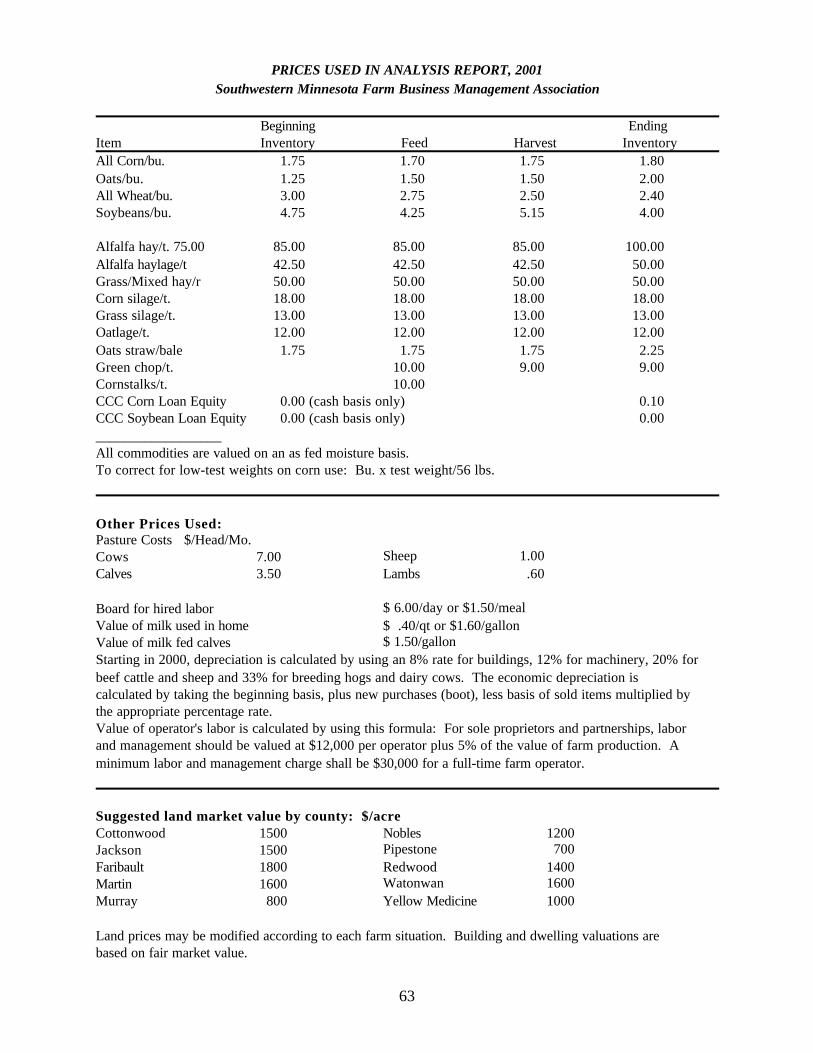
63
PRICES USED IN ANALYSIS REPORT, 2001Southwestern Minnesota Farm Business Management Association
Beginning EndingItem Inventory Feed Harvest InventoryAll Corn/bu. 1.75 1.70 1.75 1.80Oats/bu. 1.25 1.50 1.50 2.00All Wheat/bu. 3.00 2.75 2.50 2.40Soybeans/bu. 4.75 4.25 5.15 4.00
Alfalfa hay/t. 75.00 85.00 85.00 85.00 100.00Alfalfa haylage/t 42.50 42.50 42.50 50.00Grass/Mixed hay/r 50.00 50.00 50.00 50.00Corn silage/t. 18.00 18.00 18.00 18.00Grass silage/t. 13.00 13.00 13.00 13.00Oatlage/t. 12.00 12.00 12.00 12.00Oats straw/bale 1.75 1.75 1.75 2.25Green chop/t. 10.00 9.00 9.00Cornstalks/t. 10.00CCC Corn Loan Equity 0.00 (cash basis only) 0.10CCC Soybean Loan Equity 0.00 (cash basis only) 0.00__________________All commodities are valued on an as fed moisture basis.To correct for low-test weights on corn use: Bu. x test weight/56 lbs.
Other Prices Used:Pasture Costs $/Head/Mo.Cows 7.00 Sheep 1.00Calves 3.50 Lambs .60
Board for hired labor $ 6.00/day or $1.50/mealValue of milk used in home $ .40/qt or $1.60/gallonValue of milk fed calves $ 1.50/gallonStarting in 2000, depreciation is calculated by using an 8% rate for buildings, 12% for machinery, 20% forbeef cattle and sheep and 33% for breeding hogs and dairy cows. The economic depreciation iscalculated by taking the beginning basis, plus new purchases (boot), less basis of sold items multiplied bythe appropriate percentage rate.Value of operator's labor is calculated by using this formula: For sole proprietors and partnerships, laborand management should be valued at $12,000 per operator plus 5% of the value of farm production. Aminimum labor and management charge shall be $30,000 for a full-time farm operator.
Suggested land market value by county: $/acreCottonwood 1500 Nobles 1200Jackson 1500 Pipestone 700Faribault 1800 Redwood 1400Martin 1600 Watonwan 1600Murray 800 Yellow Medicine 1000
Land prices may be modified according to each farm situation. Building and dwelling valuations arebased on fair market value.

64
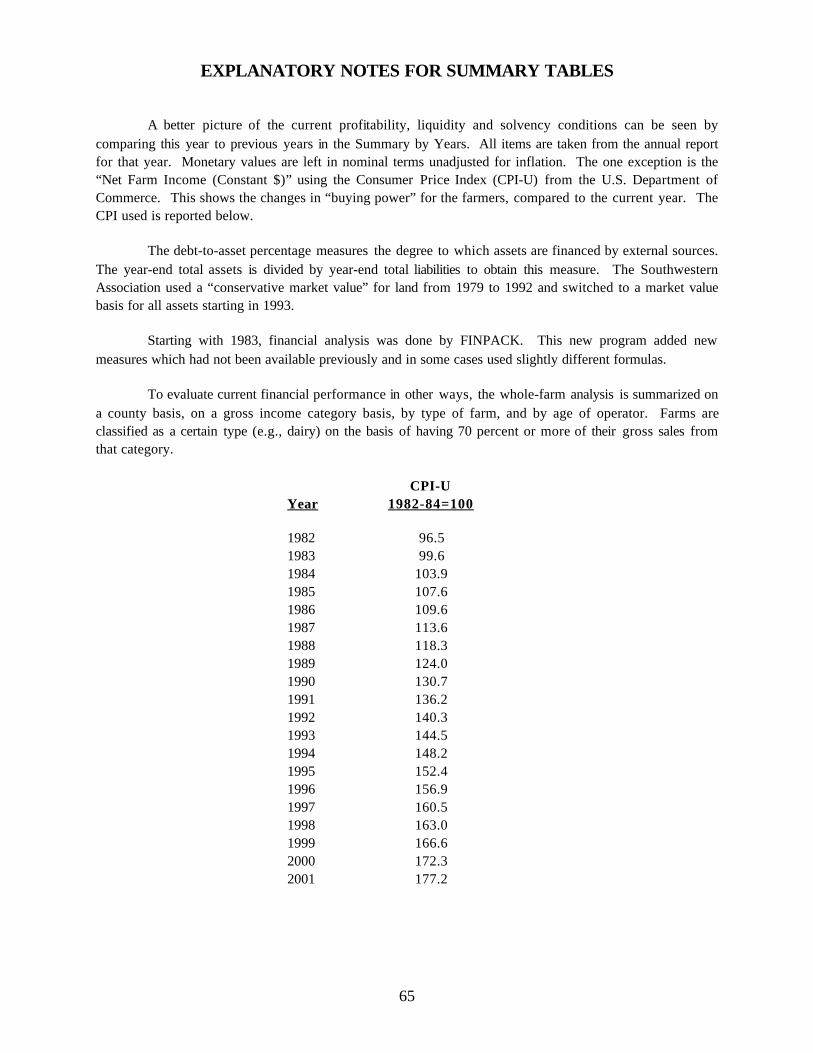
65
EXPLANATORY NOTES FOR SUMMARY TABLES
A better picture of the current profitability, liquidity and solvency conditions can be seen bycomparing this year to previous years in the Summary by Years. All items are taken from the annual reportfor that year. Monetary values are left in nominal terms unadjusted for inflation. The one exception is the“Net Farm Income (Constant $)” using the Consumer Price Index (CPI-U) from the U.S. Department ofCommerce. This shows the changes in “buying power” for the farmers, compared to the current year. TheCPI used is reported below.
The debt-to-asset percentage measures the degree to which assets are financed by external sources.The year-end total assets is divided by year-end total liabilities to obtain this measure. The SouthwesternAssociation used a “conservative market value” for land from 1979 to 1992 and switched to a market valuebasis for all assets starting in 1993.
Starting with 1983, financial analysis was done by FINPACK. This new program added newmeasures which had not been available previously and in some cases used slightly different formulas.
To evaluate current financial performance in other ways, the whole-farm analysis is summarized ona county basis, on a gross income category basis, by type of farm, and by age of operator. Farms areclassified as a certain type (e.g., dairy) on the basis of having 70 percent or more of their gross sales fromthat category.
CPI-UYear 1982-84=100
1982 96.51983 99.61984 103.91985 107.61986 109.61987 113.61988 118.31989 124.01990 130.71991 136.21992 140.31993 144.51994 148.21995 152.41996 156.91997 160.51998 163.01999 166.62000 172.32001 177.2

TABLE 14SUMMARY OF THE WHOLE FARM ANALYSIS BY YEARS
Southwestern Minnesota Farm Business Management Association(Overall averages for all farms reporting)
Row Items 1982 1983 1984 1985 1986 1987 1988 1989 1990---------------------------------------------------------------------- ---- ---- ---- ---- ---- ---- ---- ---- ----
1 Number of Farms 180 182 168 180 182 178 202 203 200
Farm Income Statement2 Gross Cash Farm Income 247,413 251,287 259,338 237,875 246,048 254,004 262,229 265,019 291,8393 Total Cash Farm Expense 205,451 191,634 217,464 185,864 189,097 196,046 206,433 204,939 222,2014 Inventory Change * -1,304 1,234 -15,056 1,798 31,353 20,577 11,788 22,2425 Depr. & Cap. Adj. * -30,286 -33,093 -31,469 -26,656 -25,906 -21,370 -21,709 -26,8766 Net Farm Income 25,838 27,844 9,872 5,487 32,093 63,404 55,004 50,159 65,004
7 Net Farm Income (Constant $) 47,446 49,538 16,837 9,036 51,888 98,901 82,390 71,679 88,131
Profitability and Liquidity Analysis8 Labor and Management Earnings 13,491 -35,799 -8,161 -5,860 21,241 51,592 39,866 33,078 47,215
Rate of return on:9 Average Assets (%) 6 6 4 4 9 16 13 10 12
10 Average Equity (%) 3 3 -2 -4 9 24 16 11 1511 Operating Profit Margin (%) 28 19 11 10 18 26 22 19 2312 Asset Turnover Rate (%) 22 31 35 40 52 63 58 49 5313 Value of Farm Production 147,570 201,051 206,568 185,740 211,530 246,235 246,893 233,867 264,28214 Farm Interest Paid 30,317 27,769 29,498 26,700 21,446 15,993 14,546 15,489 17,12615 Cash Expense as a % of Income 83 76 84 78 77 77 79 77 76
Interest Paid as a % of:16 Gross Cash Income 12 11 11 11 9 6 6 6 617 Total Cash Expenses 15 14 14 14 11 8 7 8 818 Yrs. to T/O Non R.E. Debt * 3.3 7.1 1.7 1.5 1.9 1.4 2.2 1.9
Comparative Financial Statement (Market Basis)19 No. of Sole Proprietors 143 162 147 160 161 164 182 179 18020 Total Ending Assets 686,198 728,302 669,773 508,552 462,043 439,918 468,616 506,988 557,91221 Total Ending Liabilities 252,574 281,999 304,940 255,031 211,411 180,785 172,714 186,956 202,62622 Ending Net Worth 433,624 446,303 364,833 253,521 250,632 259,133 295,902 320,032 355,28623 Ending Farm C+I Debt to Asset % 45 51 55 51 43 37 35 35 3624 Ending Total Debt to Asset % 37 39 46 50 46 41 37 37 36
Acreage Information25 Total Acres Owned 244 * 250 249 231 222 222 237 23726 Total Crop Acres Farmed 480 * 519 552 540 520 525 568 56127 Crop Acres Owned 206 * 206 212 191 180 186 199 19128 Crop Acres Cash Rented * * 208 237 236 231 238 269 27529 Crop Acres Share Rented * * 104 103 113 108 101 100 95
Crop Yields30 Corn per acre 126 88 113 124 136 138 89 141 12831 Soybean per acre 40 35 38 35 39 44 32 43 45
Crop Prices Received (cash sales)32 Corn per Bushel 2.23 * 2.88 2.35 2.03 1.53 2.08 2.20 2.3033 Soybeans per Bushel 5.63 * 7.12 5.38 5.01 4.89 6.80 6.57 5.69
Household Information34 No. Farms Reporting HseHld Info 96 96 89 96 101 102 120 129 12635 Average Family Size 4.0 * 3.7 3.9 3.6 3.7 3.8 3.9 3.936 Total Family Use of Cash 29,981 35,660 29,540 28,701 28,027 30,729 37,556 44,214 46,587
37 Average Net Nonfarm Income 9,385 * 11,262 8,445 8,580 7,787 6,890 11,973 12,135
* Not available.** Starting with 1993, profitability is analyzed using assets valued on the cost basis and the financial statement uses fair market value. From 1979
through 1992, profitability and solvency are analyzed using land valued with a conservative market value and all other assets valued on a cost basis.
66

Table 14, continued
1991 1992 1993 1994 1995 1996 1997 1998 1999 2000 2001 Row ---- ---- ---- ---- ---- ---- ---- ---- ---- ---- ---- ----
207 201 202 202 216 203 208 210 216 212 207 1
Change288,031 301,907 296,705 306,175 346,838 382,502 359,710 369,573 388,731 422,897 433,698 2 10801.0221,385 236,768 242,616 256,246 277,214 299,610 303,241 305,344 324,802 348,711 358,506 3 9795.0-10,822 -429 4,474 9,254 16,939 12,231 19,769 -21,057 15,633 25,296 -17,297 4 -42593.0-26,122 -27,051 -26,997 -27,268 -29,288 -32,424 -35,640 -34,557 -35,800 -17,731 -21,280 5 -3549.029,702 37,659 31,567 31,915 57,276 62,699 40,598 8,616 43,762 81,750 36,614 6 -45136.0
38,643 47,564 38,711 38,160 66,597 70,811 44,822 9,367 46,546 84,075 36,614 7 -47460.9
** ** ** ** ** ** ** ** **11,281 19,467 16,681 16,949 41,326 45,206 23,364 -8,757 26,896 62,532 16,094 8
5 7 5 5 10 10 6 2 7 12 6 93 6 2 3 13 12 5 -6 7 19 4 10
12 14 12 12 22 21 14 4 16 27 14 1143 46 40 41 46 48 44 39 43 45 39 12
225,829 244,243 191,194 207,729 247,690 277,026 262,396 250,717 274,411 313,232 282,583 1317,061 17,943 15,667 17,837 22,084 22,337 22,282 25,358 27,488 27,002 27,203 14
77 78 82 84 80 78 84 83 84 82 83 15
6 6 5 6 6 6 6 7 7 6 6 168 8 6 7 8 7 7 8 8 8 8 17
3.3 2.6 1.8 2.6 1.3 1.2 3.3 2.5 2.5 2.1 2.4 18
** ** ** ** ** ** ** ** **187 180 178 179 184 173 180 183 185 181 178 19 Change
579,629 596,525 844,030 901,807 944,208 982,750 1,016,308 1,066,565 1,061,579 1,150,838 1,158,071 20 7233.0216,189 227,131 396,899 431,390 452,253 462,505 490,140 522,994 517,040 545,689 539,918 21 -5771.0363,440 369,394 447,132 470,418 491,955 520,245 526,168 543,571 544,539 605,149 618,197 22 13048.0
41 44 38 39 38 37 44 45 43 42 45 2337 38 47 48 48 47 48 49 49 47 47 24
241 251 252 267 256 249 233 250 241 250 252 25570 586 600 612 625 658 648 697 709 730 759 26200 203 204 204 211 204 200 219 204 214 214 27274 286 299 323 340 384 381 402 430 445 468 2896 96 97 86 74 70 67 76 75 70 77 29
125 126 61 143 119 133 126 161 156 150 128 3038 38 20 46 43 42 42 49 45 46 42 31
2.26 2.20 2.11 2.24 2.30 3.04 2.39 1.97 1.66 1.68 1.72 325.41 5.39 5.84 5.94 5.56 6.84 7.13 5.72 4.59 4.57 4.32 33
145 136 131 134 151 131 123 122 125 120 124 344.0 4.1 3.9 3.8 3.7 3.7 3.7 3.6 3.6 3.5 3.5 35
48,911 45,638 45,897 42,179 43,315 47,584 58,051 48,197 50,326 62,349 63,980 36
10,803 12,329 12,354 13,515 16,014 16,954 18,982 17,475 20,275 24,692 23,043 37
67
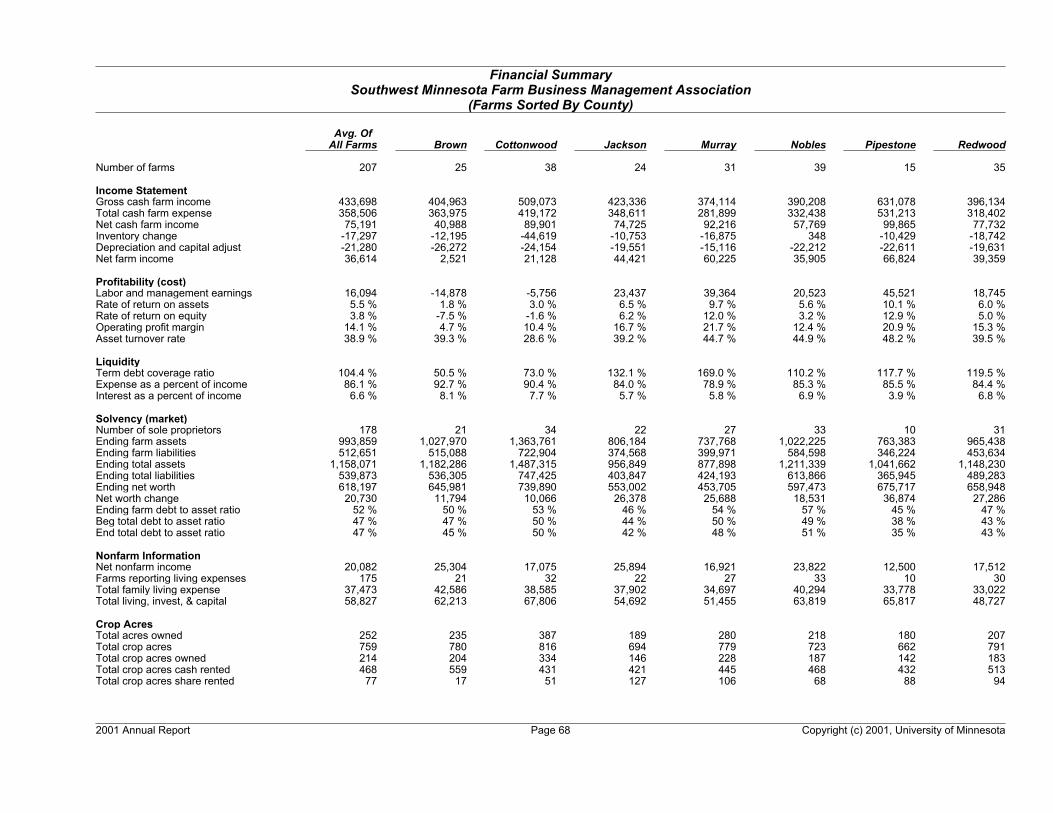
Financial SummarySouthwest Minnesota Farm Business Management Association
(Farms Sorted By County)
Avg. OfAll Farms Brown Cottonwood Jackson Murray Nobles Pipestone Redwood
Number of farms 207 25 38 24 31 39 15 35
Income StatementGross cash farm income 433,698 404,963 509,073 423,336 374,114 390,208 631,078 396,134Total cash farm expense 358,506 363,975 419,172 348,611 281,899 332,438 531,213 318,402Net cash farm income 75,191 40,988 89,901 74,725 92,216 57,769 99,865 77,732Inventory change -17,297 -12,195 -44,619 -10,753 -16,875 348 -10,429 -18,742Depreciation and capital adjust -21,280 -26,272 -24,154 -19,551 -15,116 -22,212 -22,611 -19,631Net farm income 36,614 2,521 21,128 44,421 60,225 35,905 66,824 39,359
Profitability (cost)Labor and management earnings 16,094 -14,878 -5,756 23,437 39,364 20,523 45,521 18,745Rate of return on assets 5.5 % 1.8 % 3.0 % 6.5 % 9.7 % 5.6 % 10.1 % 6.0 %Rate of return on equity 3.8 % -7.5 % -1.6 % 6.2 % 12.0 % 3.2 % 12.9 % 5.0 %Operating profit margin 14.1 % 4.7 % 10.4 % 16.7 % 21.7 % 12.4 % 20.9 % 15.3 %Asset turnover rate 38.9 % 39.3 % 28.6 % 39.2 % 44.7 % 44.9 % 48.2 % 39.5 %
LiquidityTerm debt coverage ratio 104.4 % 50.5 % 73.0 % 132.1 % 169.0 % 110.2 % 117.7 % 119.5 %Expense as a percent of income 86.1 % 92.7 % 90.4 % 84.0 % 78.9 % 85.3 % 85.5 % 84.4 %Interest as a percent of income 6.6 % 8.1 % 7.7 % 5.7 % 5.8 % 6.9 % 3.9 % 6.8 %
Solvency (market)Number of sole proprietors 178 21 34 22 27 33 10 31Ending farm assets 993,859 1,027,970 1,363,761 806,184 737,768 1,022,225 763,383 965,438Ending farm liabilities 512,651 515,088 722,904 374,568 399,971 584,598 346,224 453,634Ending total assets 1,158,071 1,182,286 1,487,315 956,849 877,898 1,211,339 1,041,662 1,148,230Ending total liabilities 539,873 536,305 747,425 403,847 424,193 613,866 365,945 489,283Ending net worth 618,197 645,981 739,890 553,002 453,705 597,473 675,717 658,948Net worth change 20,730 11,794 10,066 26,378 25,688 18,531 36,874 27,286Ending farm debt to asset ratio 52 % 50 % 53 % 46 % 54 % 57 % 45 % 47 %Beg total debt to asset ratio 47 % 47 % 50 % 44 % 50 % 49 % 38 % 43 %End total debt to asset ratio 47 % 45 % 50 % 42 % 48 % 51 % 35 % 43 %
Nonfarm InformationNet nonfarm income 20,082 25,304 17,075 25,894 16,921 23,822 12,500 17,512Farms reporting living expenses 175 21 32 22 27 33 10 30Total family living expense 37,473 42,586 38,585 37,902 34,697 40,294 33,778 33,022Total living, invest, & capital 58,827 62,213 67,806 54,692 51,455 63,819 65,817 48,727
Crop AcresTotal acres owned 252 235 387 189 280 218 180 207Total crop acres 759 780 816 694 779 723 662 791Total crop acres owned 214 204 334 146 228 187 142 183Total crop acres cash rented 468 559 431 421 445 468 432 513Total crop acres share rented 77 17 51 127 106 68 88 94
2001 Annual Report Page 68 Copyright (c) 2001, University of Minnesota
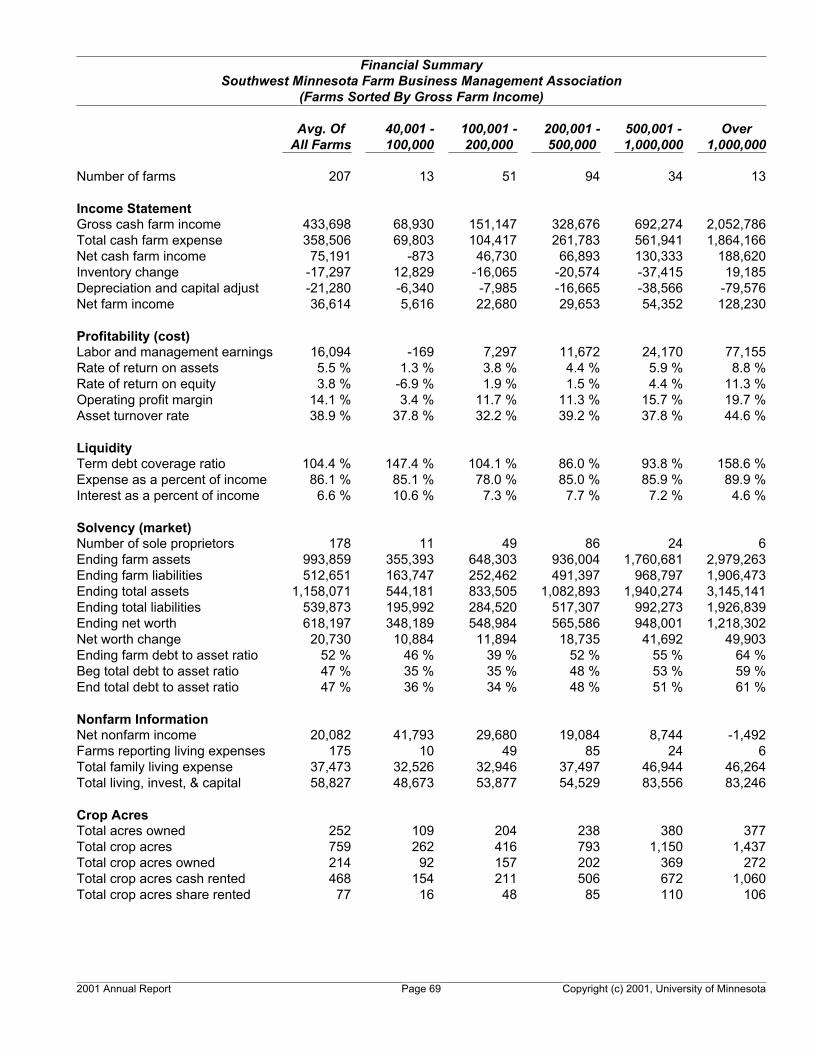
Financial SummarySouthwest Minnesota Farm Business Management Association
(Farms Sorted By Gross Farm Income)
Avg. Of 40,001 - 100,001 - 200,001 - 500,001 - OverAll Farms 100,000 200,000 500,000 1,000,000 1,000,000
Number of farms 207 13 51 94 34 13
Income StatementGross cash farm income 433,698 68,930 151,147 328,676 692,274 2,052,786Total cash farm expense 358,506 69,803 104,417 261,783 561,941 1,864,166Net cash farm income 75,191 -873 46,730 66,893 130,333 188,620Inventory change -17,297 12,829 -16,065 -20,574 -37,415 19,185Depreciation and capital adjust -21,280 -6,340 -7,985 -16,665 -38,566 -79,576Net farm income 36,614 5,616 22,680 29,653 54,352 128,230
Profitability (cost)Labor and management earnings 16,094 -169 7,297 11,672 24,170 77,155Rate of return on assets 5.5 % 1.3 % 3.8 % 4.4 % 5.9 % 8.8 %Rate of return on equity 3.8 % -6.9 % 1.9 % 1.5 % 4.4 % 11.3 %Operating profit margin 14.1 % 3.4 % 11.7 % 11.3 % 15.7 % 19.7 %Asset turnover rate 38.9 % 37.8 % 32.2 % 39.2 % 37.8 % 44.6 %
LiquidityTerm debt coverage ratio 104.4 % 147.4 % 104.1 % 86.0 % 93.8 % 158.6 %Expense as a percent of income 86.1 % 85.1 % 78.0 % 85.0 % 85.9 % 89.9 %Interest as a percent of income 6.6 % 10.6 % 7.3 % 7.7 % 7.2 % 4.6 %
Solvency (market)Number of sole proprietors 178 11 49 86 24 6Ending farm assets 993,859 355,393 648,303 936,004 1,760,681 2,979,263Ending farm liabilities 512,651 163,747 252,462 491,397 968,797 1,906,473Ending total assets 1,158,071 544,181 833,505 1,082,893 1,940,274 3,145,141Ending total liabilities 539,873 195,992 284,520 517,307 992,273 1,926,839Ending net worth 618,197 348,189 548,984 565,586 948,001 1,218,302Net worth change 20,730 10,884 11,894 18,735 41,692 49,903Ending farm debt to asset ratio 52 % 46 % 39 % 52 % 55 % 64 %Beg total debt to asset ratio 47 % 35 % 35 % 48 % 53 % 59 %End total debt to asset ratio 47 % 36 % 34 % 48 % 51 % 61 %
Nonfarm InformationNet nonfarm income 20,082 41,793 29,680 19,084 8,744 -1,492Farms reporting living expenses 175 10 49 85 24 6Total family living expense 37,473 32,526 32,946 37,497 46,944 46,264Total living, invest, & capital 58,827 48,673 53,877 54,529 83,556 83,246
Crop AcresTotal acres owned 252 109 204 238 380 377Total crop acres 759 262 416 793 1,150 1,437Total crop acres owned 214 92 157 202 369 272Total crop acres cash rented 468 154 211 506 672 1,060Total crop acres share rented 77 16 48 85 110 106
2001 Annual Report Page 69 Copyright (c) 2001, University of Minnesota
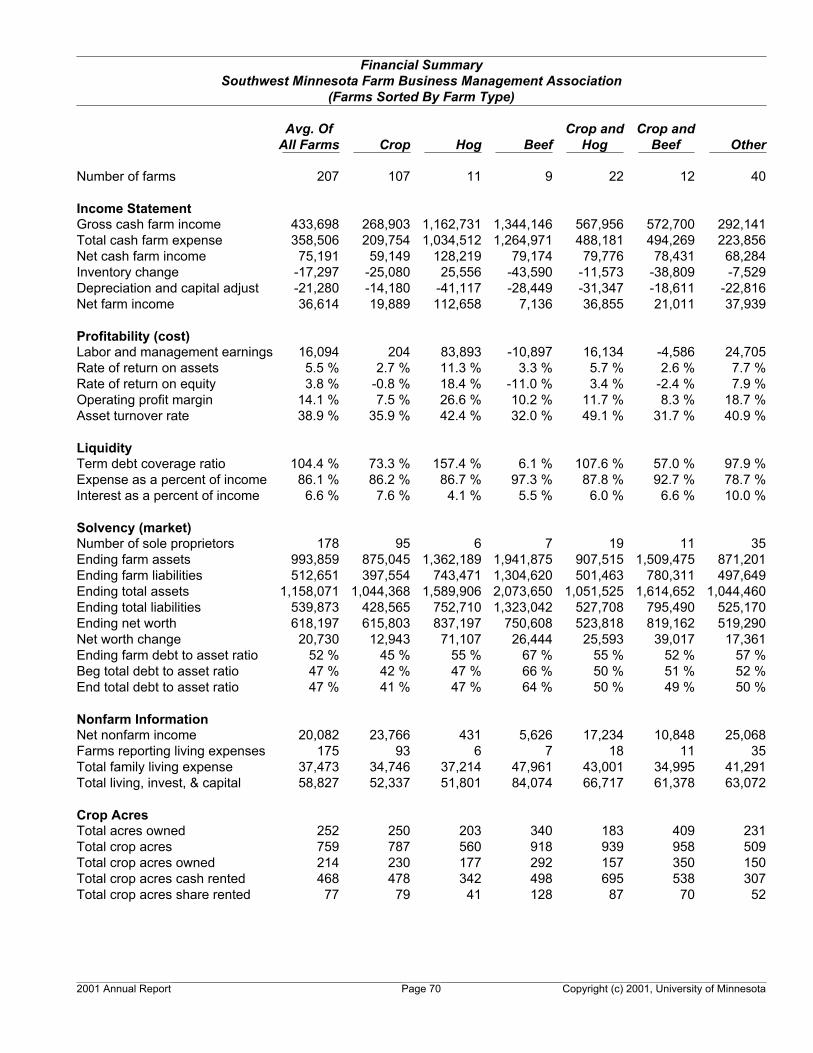
Financial SummarySouthwest Minnesota Farm Business Management Association
(Farms Sorted By Farm Type)
Avg. Of Crop and Crop andAll Farms Crop Hog Beef Hog Beef Other
Number of farms 207 107 11 9 22 12 40
Income StatementGross cash farm income 433,698 268,903 1,162,731 1,344,146 567,956 572,700 292,141Total cash farm expense 358,506 209,754 1,034,512 1,264,971 488,181 494,269 223,856Net cash farm income 75,191 59,149 128,219 79,174 79,776 78,431 68,284Inventory change -17,297 -25,080 25,556 -43,590 -11,573 -38,809 -7,529Depreciation and capital adjust -21,280 -14,180 -41,117 -28,449 -31,347 -18,611 -22,816Net farm income 36,614 19,889 112,658 7,136 36,855 21,011 37,939
Profitability (cost)Labor and management earnings 16,094 204 83,893 -10,897 16,134 -4,586 24,705Rate of return on assets 5.5 % 2.7 % 11.3 % 3.3 % 5.7 % 2.6 % 7.7 %Rate of return on equity 3.8 % -0.8 % 18.4 % -11.0 % 3.4 % -2.4 % 7.9 %Operating profit margin 14.1 % 7.5 % 26.6 % 10.2 % 11.7 % 8.3 % 18.7 %Asset turnover rate 38.9 % 35.9 % 42.4 % 32.0 % 49.1 % 31.7 % 40.9 %
LiquidityTerm debt coverage ratio 104.4 % 73.3 % 157.4 % 6.1 % 107.6 % 57.0 % 97.9 %Expense as a percent of income 86.1 % 86.2 % 86.7 % 97.3 % 87.8 % 92.7 % 78.7 %Interest as a percent of income 6.6 % 7.6 % 4.1 % 5.5 % 6.0 % 6.6 % 10.0 %
Solvency (market)Number of sole proprietors 178 95 6 7 19 11 35Ending farm assets 993,859 875,045 1,362,189 1,941,875 907,515 1,509,475 871,201Ending farm liabilities 512,651 397,554 743,471 1,304,620 501,463 780,311 497,649Ending total assets 1,158,071 1,044,368 1,589,906 2,073,650 1,051,525 1,614,652 1,044,460Ending total liabilities 539,873 428,565 752,710 1,323,042 527,708 795,490 525,170Ending net worth 618,197 615,803 837,197 750,608 523,818 819,162 519,290Net worth change 20,730 12,943 71,107 26,444 25,593 39,017 17,361Ending farm debt to asset ratio 52 % 45 % 55 % 67 % 55 % 52 % 57 %Beg total debt to asset ratio 47 % 42 % 47 % 66 % 50 % 51 % 52 %End total debt to asset ratio 47 % 41 % 47 % 64 % 50 % 49 % 50 %
Nonfarm InformationNet nonfarm income 20,082 23,766 431 5,626 17,234 10,848 25,068Farms reporting living expenses 175 93 6 7 18 11 35Total family living expense 37,473 34,746 37,214 47,961 43,001 34,995 41,291Total living, invest, & capital 58,827 52,337 51,801 84,074 66,717 61,378 63,072
Crop AcresTotal acres owned 252 250 203 340 183 409 231Total crop acres 759 787 560 918 939 958 509Total crop acres owned 214 230 177 292 157 350 150Total crop acres cash rented 468 478 342 498 695 538 307Total crop acres share rented 77 79 41 128 87 70 52
2001 Annual Report Page 70 Copyright (c) 2001, University of Minnesota

Financial SummarySouthwest Minnesota Farm Business Management Association
(Farms Sorted By Age Of Operator)
Avg. Of LessAll Farms than 31 31 - 40 41 - 50 51 - 60 Over 60
Number of farms 207 10 45 65 62 25
Income StatementGross cash farm income 433,698 189,746 386,931 540,572 437,707 327,640Total cash farm expense 358,506 158,695 321,589 444,284 353,043 295,408Net cash farm income 75,191 31,051 65,343 96,288 84,664 32,232Inventory change -17,297 -2,662 -16,969 -21,816 -19,174 -7,336Depreciation and capital adjust -21,280 -4,908 -18,015 -26,334 -20,980 -21,312Net farm income 36,614 23,480 30,358 48,139 44,510 3,584
Profitability (cost)Labor and management earnings 16,094 18,452 16,842 30,510 15,982 -23,402Rate of return on assets 5.5 % 5.9 % 5.7 % 7.2 % 5.4 % 1.4 %Rate of return on equity 3.8 % 4.2 % 3.9 % 7.5 % 4.1 % -3.4 %Operating profit margin 14.1 % 9.0 % 12.4 % 16.7 % 15.3 % 5.1 %Asset turnover rate 38.9 % 66.0 % 45.9 % 42.8 % 35.2 % 26.9 %
LiquidityTerm debt coverage ratio 104.4 % 115.2 % 97.5 % 104.7 % 135.1 % 35.5 %Expense as a percent of income 86.1 % 84.9 % 87.0 % 85.5 % 84.4 % 92.4 %Interest as a percent of income 6.6 % 5.7 % 6.0 % 6.8 % 6.4 % 8.0 %
Solvency (market)Number of sole proprietors 178 10 38 56 53 21Ending farm assets 993,859 307,313 705,805 1,026,174 1,203,579 1,226,560Ending farm liabilities 512,651 212,632 426,531 610,917 550,089 454,826Ending total assets 1,158,071 334,892 820,687 1,135,208 1,430,833 1,533,129Ending total liabilities 539,873 219,860 454,084 626,587 585,110 502,095Ending net worth 618,197 115,032 366,603 508,621 845,723 1,031,034Net worth change 20,730 10,246 16,794 34,280 17,841 4,001Ending farm debt to asset ratio 52 % 69 % 60 % 60 % 46 % 37 %Beg total debt to asset ratio 47 % 65 % 56 % 56 % 41 % 34 %End total debt to asset ratio 47 % 66 % 55 % 55 % 41 % 33 %
Nonfarm InformationNet nonfarm income 20,082 14,144 18,169 19,612 22,168 21,947Farms reporting living expenses 175 9 37 55 53 21Total family living expense 37,473 25,772 36,558 41,567 37,499 33,315Total living, invest, & capital 58,827 32,417 55,397 63,497 58,853 63,893
Crop AcresTotal acres owned 252 50 113 222 354 410Total crop acres 759 515 668 847 797 700Total crop acres owned 214 37 96 191 314 305Total crop acres cash rented 468 431 525 543 396 365Total crop acres share rented 77 47 47 112 87 30
2001 Annual Report Page 71 Copyright (c) 2001, University of Minnesota


