Planning/ predicting (Prefrontal) (). What will you do this weekend?

It’s Not Where You Start, It’s How You Finish: Predicting Law School and Bar Success
National Report of Findings for the AccessLex/LSSSE Bar Exam Success Initiative
WORKING PAPER1
(Last Updated March 24, 2021)
Aaron N. Taylor*, Jason M. Scott*, and Josh Jackson *These authors contributed equally to this work
EXECUTIVE SUMMARY The AccessLex/LSSSE Bar Exam Success Initiative is the first multi-institutional investigation into the factors that help predict law school academic and first-time bar exam performance. Mixed effects linear and logit modeling techniques are used to analyze pre-admission data; law school transcript data; and bar exam performance data for almost 5,000 Spring 2018 and 2019 graduates from 20 law schools that participated in this study. Law School Survey of Student Engagement (LSSSE) response data were also analyzed for a subset of about 2,000 graduates.
Our modeling techniques allowed us to localize the impact of the factors of interest, while also accounting for other factors. For example, our analyses of the impact of various student engagement factors on bar exam performance account for other potentially relevant factors such as law school grades.
We find that:
• LSAT score and undergraduate GPA (UGPA) are modestly associated with law school GPA (LGPA). LSAT score and first year (1L) LGPA yield the strongest association. Across our sample, a one-point increase in LSAT score is associated with a 0.04 increase in 1L LGPA. A one-tenth point increase in UGPA is associated with a 0.03 increase in LGPA (Figure 2).
• LGPA is the strongest predictor of bar exam performance, even at the early stages of matriculation. For example, a one standard deviation increase in 1L LGPA is associated with a student quadrupling his/her odds of bar passage (Figure 3).
1 As a working paper, feedback is welcomed and encouraged; please email comments and questions to [email protected] and [email protected].

• Positive growth in LGPA between the end of the first semester and graduation is
associated with greater odds of passing the bar exam, particularly among graduates who struggled early on. Graduates with below average first-semester grades who experienced no LGPA growth had a 25 percent chance of passing the bar exam, compared to 43 percent among their peers who experienced average growth of about 0.17 grade points (Figure 5).
• Graduates who spent more than 21 hours per week on responsibilities such as caring for dependents or working a non-law-related job had lower third year (3L) LGPAs and bar passage odds than their peers who spent 0 to 5 hours on these activities (Figure 12).
• Graduates who worked in law-related jobs while in law school (Figure 9); graduates who felt that their law school experience contributed “very much” to their skills development (Figure 10); and graduates who regularly participated in class (Figure 11) were modestly more likely to pass the bar exam than other graduates.
Collectively, our results suggest that academic and bar exam success are driven by what happens in law school, not just early on, but throughout the experience—and the greatest opportunities for impact exist among those who struggle the most early on.

TABLE OF CONTENTS Introduction ................................................................................................................................................... 1
1. Background ............................................................................................................................................... 2
2. Literature Review ...................................................................................................................................... 4
2.1 Student Engagement Theory ............................................................................................................... 4
2.2 Input-Environment-Outcome Model ................................................................................................... 5
2.3 Growth vs. Fixed Mindsets ................................................................................................................. 5
3. Methods .................................................................................................................................................... 6
3.1 Data ..................................................................................................................................................... 6
3.1.1 Pre-admission and Law School Transcript Data .......................................................................... 6
3.1.2 LSSSE Survey Data ..................................................................................................................... 7
3.2 Sample................................................................................................................................................. 7
3.3 Variables ............................................................................................................................................. 9
3.4 Models............................................................................................................................................... 12
4. Results ..................................................................................................................................................... 14
4.1 LSAT Score and UGPA as Predictors of Bar Passage and Academic Performance ........................ 15
4.1.1 LSAT and UGPA are Positively Associated with LGPA .......................................................... 15
4.1.2 LSAT and UGPA are Positively Associated with Bar Exam Performance ............................... 16
4.2 LGPA as a Predictor of Bar Passage ................................................................................................. 16
4.2.1 LGPA is the Strongest Predictor of Bar Performance ............................................................... 17
4.3 Student Engagement as a Predictor of Academic Performance and Bar Passage ............................. 20
4.3.1 Several Modest Effects of Student Engagement on Academic Performance ............................ 20
4.3.1 Varied Effects of Student Engagement on Bar Passage ............................................................. 22
5. Discussion & Recommendations ............................................................................................................ 28
5.1 Recommendations ............................................................................................................................. 28
Explore relevance of varied admission factors. .................................................................................. 28
Encourage growth mindset thinking. .................................................................................................. 29
Intervene early. ................................................................................................................................... 30
Maximize opportunities for student improvement. ............................................................................. 30
Provide targeted support to students with outside responsibilities. .................................................... 30
Harness the cumulative potential of student engagement. .................................................................. 31
5.1 Limitations ........................................................................................................................................ 31
6. Conclusion .............................................................................................................................................. 32
References ................................................................................................................................................... 33

1
INTRODUCTION How does a law school’s campus environment impact the academic performance of its students and the first-time bar passage performance of its graduates? Researchers have devoted extensive attention to trying to answer this complicated question, focusing on variables such as undergraduate academic performance (Thomas, 2003), ethnic background (Klein, 1990), and bar preparation methods (Johns, 2016). However, these studies often do not account for various aspects of a law school’s climate, such as the faculty’s interactions with students and the law school’s capacity to assist students with unusually heavy non-academic burdens. Surely, the environment of a law school impacts the academic performance of students and their eventual performance on the bar exam.
This study—the AccessLex/LSSSE Bar Exam Success Initiative—is the first multi-institutional investigation into the factors that help predict law school academic and first-time bar exam performance. Mixed effects linear and logit modeling techniques are used to analyze pre-admission data; law school transcript data; and bar exam performance data for almost 5,000 Spring 2018 and 2019 graduates from 20 law schools that participated in this study. Law School Survey of Student Engagement (LSSSE) response data were also analyzed for a subset of about 2,000 graduates.
Despite a small bump in 2019, first-time bar passage rates have been on the decline for more than a decade (Coe, 2017; Ward, 2018), leaving a growing number of law graduates unable to practice law. In addition, graduates from demographic groups that are already underrepresented in the profession are more likely to not pass the bar exam, a stark trend that intensifies the harmful impacts of the overall declines. This study addresses these concerning dynamics by contributing new insight to our broader understanding of factors that promote academic and bar success. The robust incorporation of student engagement factors, as captured on the LSSSE Survey, renders this study distinct from typical analyses.
In undertaking this study, AccessLex and LSSSE partnered with 20 ABA-approved law schools to conduct analyses of pre-admission and law school transcript data for 4,722 graduates and LSSSE Survey response data for a subset of 2,025 graduates. We explore the relationships between LSAT score, UGPA, law school academic performance, nineteen student engagement factors, and the ultimate outcome of concern: first-time bar exam performance. In the end, we analyze data encompassing the expanse of the law school experience, from pre-admission to the first bar exam administration post-graduation. The LSSSE response data allow us to capture the impact of student experiences inside of their law schools as well as in their outside lives.
To account for variation between the schools (e.g., differences in grading policies, student characteristics) we employ mixed effects modeling. In addition, we include a robust set of controls such as graduating cohort, race/ethnicity, gender, age, and, where applicable, bar exam jurisdiction.
This study emphasizes that indicators of academic performance and student engagement are valuable at helping to identify the roots of academic difficulty which, in turn, helps identify

2
students most at risk of not passing the bar exam. But these factors do not tell the whole story. They supplement but do not replace the professional judgement and expertise of faculty and staff who work with law students every day. Nevertheless, the findings in this report can help focus and guide efforts to develop and implement interventions designed to improve law student academic growth and bar exam preparedness.
This report is structured as follows:
• Section 1 provides background and introduces the research questions. • Section 2 summarizes the extant literature and the theoretical framework guiding the
research. • Section 3 describes the data sources, sample, variables, and statistical models. • Section 4 presents the results of our analyses. • Section 5 offers recommendations rooted in the findings and contextualized by the
limitations of the study.
We include a series of footnotes that briefly introduce and describe key statistical and methodological terms. This is done to improve the readability of the report and make it more accessible to a wide array of readers with varying levels of experience interpreting statistical analyses. Granular information regarding our statistical methods and outputs can be found in the Technical Appendix.
All the data we analyze represent outcomes that occurred prior to the onset of the COVID pandemic, which altered the manners in which legal education and the bar exam are delivered. It is not yet known the extent to which policies implemented in response to the pandemic will supplant previous norms on a long-term basis. This is an important consideration because the applicability of our findings to COVID-era outcomes is uncertain. We are confident, however, that the findings illustrate a relationship between law students and their law schools that will persist through and outlast the pandemic.
1. BACKGROUND The national first-time bar exam passage rate fell roughly 10 percentage points from 2007 to 2018 (Coe, 2017; Ward, 2018). This trend reached a nadir with the July 2018 bar exam, when the national average Multistate Bar Examination (MBE) score was 139.5—the lowest in 34 years (Albanese 2018). Even more disquieting are persistent racial and ethnic disparities in passage rates. A national assessment of bar passage conducted more than 20 years ago by the Law School Admission Council found a gap of nearly 20 percentage points between White and Hispanic test takers and 30 points between White and Black test takers (Wightman, 1998). More recent data from New York and California show virtually no narrowing of these disparities (National Conference of Bar Examiners, 2019; State Bar of California, 2019).
The declining pass rates and the demographic disparities have spawned important debates about the purpose, design, and legitimacy of bar exams. Recent developments—such as the American Bar Association’s revision of its bar passage accreditation standard (American Bar Association,

3
2019) and the onset of the COVID-19 pandemic (Angelos et al., 2020)—have raised the volume of these debates and indeed the stakes of the exams themselves.
For law graduates, failing the bar exam has negative financial and employment consequencesBambauer 2009). Law schools face consequences as well. Low pass rates can negatively impact perceptions of a school’s quality and can ultimately jeopardize its enrollment and even its accreditation. As a perceived safeguard, many law schools rely heavily on LSAT scores and UGPAs to make admission decisions (Holmquist et al., 2014; Marks & Moss, 2016). But overreliance on these metrics2 often shuts out historically underrepresented students who, on average, score lower on the LSAT and have lower UGPAs (Haddon & Post, 2006; Holmquist et al., 2014; Randall, 2006). As a result, law student demographics do not reflect the racial and ethnic diversity of the applicant pools from which those students were selected (AccessLex 2020). Overreliance on LSAT scores and UGPAs in the law school admission process is a principal driver of the persistent dearth of diversity in the legal profession (American Bar Association, 2019; Rhode, 2015; Taylor, 2019).
Diversity in the legal profession is fundamentally an access to justice issue. Lawyers from underrepresented backgrounds are more likely to represent underserved people and interests (Markovic and Plickert, 2019; Pratt, 2008). Diversifying the legal profession could also help foster higher levels of belief in the legitimacy of our legal system among traditionally marginalized groups (Pratt, 2008). The need for such civic embrace has taken on greater urgency in light of renewed calls for racial justice and the caustic political environment that has highlighted the glaring precariousness of our democracy.
Fostering diverse and equitable access to the legal profession requires law schools to gather empirical evidence on the extent to which admission factors and elements of the law school experience are predictive of, or otherwise tied to, relevant outcomes, such as academic success and bar exam passage. To that end, our research examines:
1. The extent to which LSAT score and UGPA predict law school academic and first-time bar exam performance;
2. The extent to which law school academic performance predicts first-time bar exam performance;
3. What, if any, student engagement factors are associated with law school academic performance;
2 We use “overreliance” to refer to law schools’ heavy emphasis on UGPA and LSAT score in admissions decisions. Law schools use these metrics as a signal of who will perform better in their first year of law school. However, there are problems with this approach. First year academic performance is only one aspect of legal education and admissions decisions ideally would primarily consider factors that predict overall success as an attorney, especially in light of this study’s argument that growth in LGPA is a powerful predictor of bar passage. As we put it below, students may perform sub-optimally early on in law school, but if they improve their grades by the time they graduate, they have a higher probability of bar exam success. Furthermore, the overreliance on LSAT scores exacerbates an existing racial disparity in average LSAT scores. Black students score about 11 points lower on the LSAT than their White and Asian counterparts, which leads to their exclusion from law schools based on a metric that does not predict lawyer success or even bar success well. See Taylor (2015, 2019) for an extended discussion of this dynamic.

4
4. What, if any, student engagement factors are associated with first-time bar exam performance.
2. LITERATURE REVIEW 2.1 Student Engagement Theory Our work is grounded in theories of student engagement (Astin, 1984; Kuh, 2009; Pascarella, 1980; Tinto, 1975), a holistic concept encompassing “the choices and commitments of students, of individual faculty members, and of entire institutions” (McCormick et al., 2013, p. 55). Student engagement theories assert that the learning environment, coupled with student participation in, and perceptions of, that environment, contribute to learning outcomes. Within the higher education context, student engagement includes not only the classroom experience and other academic components, but also student clubs and organizations, common spaces, such as libraries and student unions, and interactions with administration.
Although postsecondary student engagement research is largely situated in the undergraduate context (Carini et al., 2006; Krause & Coates, 2008; McCormick et al., 2013; Quaye & Harper, 2014), studies within law schools are emerging. Similar to the undergraduate studies, the law school iterations link engagement to higher grades, professional development, and overall student satisfaction (Austin et al., 2016; Detwiler, 2011; Florio & Hoffman, 2012; Law School Survey of Student Engagement, 2012; Silver et al., 2013). Additionally, there is limited but promising research tying student engagement to bar passage. Using items from the LSSSE Survey, Austin et al. (2016) find that students who participate in extra-curricular activities that foster law school engagement “perform better in law school and on the bar exam” (p. 23).
Despite the research suggesting the importance of student engagement, studies of explanatory factors of law school grades and bar exam performance typically focus on LSAT score and UGPA. Several find that both factors are predictive of law school academic performance, particularly in the first semester and first year (Marks & Moss, 2016; Shultz & Zedeck, 2011; Thomas, 2003). These findings help provide a basis for the intense emphasis of both metrics in law school admission processes (Currier, 2016; Law School Admission Council, 2014; Marks & Moss, 2016).
Prior research also examines the relationship of LSAT score and UGPA to first-time bar passage. Most of these studies find a positive correlation between LSAT score and bar passage (Austin et al., 2016; Georgakopoulos, 2013; Wightman, 1998). The evidence for UGPA is mixed. Some studies find a weak positive correlation (Wightman, 1998); others find no relationship (Austin et al., 2016; Georgakopoulos, 2013; Trujillo, 2007).
Models that account for academic performance during law school tend to have much greater explanatory power. Overwhelmingly, studies indicate that law school grades are the best predictor of first-time bar passage (Austin et al., 2016; Farley et al., 2018; Georgakopoulos, 2013; Wightman, 1998). Nonetheless, even when LSAT score, UGPA, and law school grades are considered, much of what impacts bar exam performance remains unexplained.

5
2.2 Input-Environment-Outcome Model Astin’s (1991) Input-Environment-Outcome (I-E-O) model frames our work, which aims to explain law student outcomes using student characteristics and levels of engagement as the input and the law school setting as the environment. It posits that student outcomes (e.g., learning, the acquisition of skills, the development of professional identities, socialization into disciplinary norms) are functions of two kinds of factors: inputs and environment. Inputs include student demographic characteristics, incoming academic indicators, attributes acquired prior to students’ entry into the given educational environment, and elements of the student’s life outside of the educational environment.
The I-E-O model structures our understanding of both the factors to be considered and the hypotheses to explore in our analysis. Preparing law students for academic success, the bar exam and for entry into the legal profession is a collaborative effort, involving the commitment and participation of faculty, administrators, staff, and students. The structure and function of institutional policies and practices are also relevant.
2.3 Growth vs. Fixed Mindsets
Our investigation is also informed by recent developments in educational psychology—most importantly, the distinction between growth mindsets and fixed mindsets (Dweck 2000; Dweck 2006; Molden and Dweck 2006). Many people believe that capacity to learn is “fixed” or unable to augmented (Adams-Schoen 2014). A growing body of research, however, asserts that intelligence and cognitive capacities are flexible and adaptable.
Belief in the notion of fixed intellectual capacities is common among law students (Shapcott et al. 2017). The very structure of legal education and its system of grading and sorting students is rooted in a fixed mindset premise. The first year of law school typically plays an outsized role in determining eligibility for sought-after co-curricular experiences, such as law journal membership. Prestigious and lucrative internships and the jobs that often flow therefrom are typically open only to students who attained high grades early on. Grades in later years are relevant but usually pale in importance to the first year.
But much research asserts that embracing growth mindset thinking can lead to substantial improvements in student outcomes. In the undergraduate context, several studies have found that interventions that foster growth mindset thinking3 in students improve academic performance. In a study by Aronson, Fried, and Good (2002), 79 undergraduate students were instructed to write letters to middle school students explaining that intelligence can be expanded through effort and encouraging them to not be discouraged by obstacles to their learning, the premise of growth mindset thinking. At the beginning of the study, participants were given video lessons about human intelligence and its capacity to increase as a function of learning new information. This was ostensibly to prepare the participants to write to younger students about how they can work hard and increase their intelligence—fostering a growth mindset. Participants were also asked to summarize the growth mindset lessons in speeches to further internalize the lessons on
3 “Growth mindset” in this context refers to the belief that intelligence (and academic performance) is not fixed and can therefore be improved (Sperling and Shapcott, 2012 p. 48).

6
intelligence growth. The study finds that the participating college students were more likely to believe in the malleability of intelligence, and in turn more likely to achieve higher grades the next semester.
Similarly, in two studies of seventh graders by Blackwell, Trzesniewski, and Dweck (2007), the authors find that possessing a growth mindset is predictive of an upward grade trajectory and that interventions aimed at fostering growth mindsets improve academic performance. A study by Aditomo (2015) did not find a direct association between growth mindset and academic achievement, but it did find that students with growth mindsets were better able to “bounce back” and maintain motivation after scoring poorly on a midterm exam.
At the law school level, we find only two mindset studies. Both observed the prevalence of fixed mindsets among law students. A survey of 100 first-year law students by Sperling and Shapcott (2012) finds that 25 percent have a fixed mindset, 25 percent have a growth mindset, and 50 percent fall somewhere in the middle. Another survey by Shapcott, Davis and Hanson (2017) find that among 425 students across all years, mindsets became more fixed as the students progressed through law school, a seemingly logical trend. There is an absence of research on the impact of growth mindsets on law student outcomes. The findings we present in this report help fill this gap in knowledge.
3. METHODS 3.1 Data The AccessLex/LSSSE Bar Exam Success Initiative is a collaborative effort to understand the relationships between academic and student engagement and bar exam performance. AccessLex and LSSSE partnered with 20 ABA-approved law schools to conduct analyses of pre-admission and law school transcript data for 4,722 graduates and LSSSE Survey responses for a subset of 2,025 graduates who responded to that questionnaire. We explore the relationships between LSAT score, UGPA, law school academic performance, 19 student engagement factors, and the ultimate outcome of concern: first-time bar exam performance. In the end, we analyze data encompassing the expanse of the law school experience, from pre-admission to the first bar exam administration post-graduation. The LSSSE response data allow us to capture the impact of student experiences inside of their law schools as well as in their outside lives.
3.1.1 Pre-admission and Law School Transcript Data Pre-admission and law school transcript data were provided by 20 participating law schools for the 4,722 graduates who: (1) earned a J.D. in 2018 or 2019; (2) were enrolled full-time at graduation; (3) took the bar exam for the first time during the administration immediately following graduation; and (4) took the bar exam in a jurisdiction where at least 25 percent of graduates took the bar exam during the same administration. For each graduate, these data include LSAT score; cumulative UGPA; first-semester (1S) LGPA; first year (1L) LGPA; second year (2L) LGPA; final LGPA; class rank; first-time bar result and jurisdiction; race; gender; and birth year. All participating schools secured the necessary internal approvals (e.g., IRB) prior to providing the research team with data.

7
3.1.2 LSSSE Survey Data Survey response data were provided by LSSSE for the 2,025 graduates who completed the questionnaire in their final semester of study. Responses were matched to each graduate’s pre-admission and law school transcript data. Analyses were then conducted on the combined dataset with the identities of students and schools removed.
The LSSSE Survey is the most comprehensive and long-standing effort to measure the impact of legal education on law students and uses student engagement as its conceptual premise. The concept of student engagement is multifaceted and not always directly measurable. LSSSE operationalizes the different facets of the concept using proxy measures and pointed survey items. The survey contains approximately 125 questions and takes 15-20 minutes to complete (LSSSE, 2020). Survey questions explore various facets of how students spend their time inside and outside of the classroom; how they assess their own learning and development; and how they view their law school experiences overall.
Participation is voluntary; thus, LSSSE respondents comprise a convenience sample of law students willing and able to respond to the survey. Some participating schools offer financial incentives or prizes to encourage higher survey completion among students. Since 2004, the LSSSE Survey has been administered to over 380,000 law students at 203 law schools in the U.S., Canada, and Australia. LSSSE’s breadth of subject matter and its sheer volume of collected responses render the survey uniquely valuable as a legal education assessment and research tool (LSSSE, 2020). 3.2 Sample AccessLex offered the opportunity to participate in this study to all ABA-approved law schools. In order to be eligible, schools had to agree to:
1. Administer the LSSSE Survey in two consecutive years: either academic years 2017-2018 (AY 2017) and 2018-2019 (AY 2018) or AY 2018 and 2019-2020 (AY 2019);
2. Share demographic and academic background information for bar-takers in the two LSSSE administration years with AccessLex and LSSSE researchers; and
3. Allow aggregate and (anonymized) school-level data to be used in the building of a clearinghouse of relevant information as well as in reports, presentations, etc.
In order to encourage participation among schools with lower bar pass rates, AccessLex offered a subsidy to cover the LSSSE registration fee to law schools with cumulative first-time bar passage rates below 75 percent in at least two of the previous three calendar years leading up to the study. Twenty-one (21) schools elected to participate. Of these, one school was excluded from this analysis due to its data being incomparable to the rest of the sample. After this exclusion, our sample consists of pre-admission and law school transcript data for 4,722 graduates from the remaining 20 law schools. Eighteen schools provided data for both AY 2017 and AY 2018, one for only AY 2017, and one for only AY 2018. Table A.II.1 lists each school’s number of observations, response rate, and status of participation in the two years of the study. For each school, analyses were conducted on bar exam results only for jurisdictions where at least 25 percent of graduates took the exam.

8
LSSSE Survey data were received for 2,025 graduates (42.9 percent of the full sample) from the remaining 20 schools. Of these schools, 17 administered LSSSE in both AY 2017-2018 and AY 2018-2019, two in AY 2017-2018 only, and one in AY 2018-2019 only. Responses were matched to each graduate’s pre-admission and law school transcript data. After matching, all information identifying students and law schools was deleted and replaced with assigned numbers. For students, the number was randomly generated and assigned. For schools, a School ID, spanning the numbers one to twenty-one, was assigned. Analyses were conducted using this de-identified dataset. Neither students nor schools will be identified by name in this report. Schools will be referred to by their School ID. In examining the differences between the three schools with one year of survey data and those with two and restricting the comparison to those observations with survey data, the three schools collectively do not appear to differ systematically in measures of our outcomes of interest nor racial composition. (See the Technical Appendix for a more thorough discussion.) Overall, the schools in our sample represent a diverse cross-section of the broader population of 198 ABA-approved law schools. The full sample and the subsample of LSSSE respondents appear to be reasonably representative of the national population of law students, particularly in terms of median LSAT, median UGPA, and bar passage rates (Table 1). We consider these factors to be important when speculating about the degree of generalizability of the findings. The racial and ethnic composition of our samples do differ to notable degrees from the national population of law students. White and Asian graduates are overrepresented in both samples to statistically significant extents compared to the national population. Hispanic graduates are underrepresented in both samples to statistically significant extents. Black graduates are underrepresented in both samples, but the difference within the full sample is not statistically significant (Table 1). In our analyses, we include race/ethnicity as a control variable to account for lurking, unobserved impacts. Regarding gender, there is a statistically significant difference in composition between the full sample and the national population, but this difference is not cause for concern for several reasons. First, the difference is modest, and the statistical significance is more the result of the largeness of the sample sizes than of any meaningful imbalance. Second, there do not appear to be any notable relationships between gender and the outcomes that we studied. Men and women in our samples have roughly the same law school grades and bar pass rates. Third, we include gender as a control variable in our analyses to account for confounding factors that might be related to differences in it.
Figure 1 Flow Chart of Observations

9
In considering generalizability, the timeframe during which we conducted the study is important. We must consider the extent to which characteristics of the study subjects and their outcomes represent continuations or reasonable variations from previous cohorts and timeframes. In examining trends in bar passage, median LSAT, median UGPA, and demographic enrollment at the study schools from 2011–2019, neither of our study cohorts or their outcomes appear to be exceptional. They are comparable to previous years. Therefore, the study timeframe does not limit the generalizability of the findings. We do caution against extrapolating our findings to years impacted by the COVID-19 pandemic, including the July 2020 and February 2021 bar exam administrations. The myriad of unprecedented issues and the varied law school and jurisdictional responses renders these years unlike any previous ones. As such, applying the findings from this study to years affected by the COVID-19 pandemic should be done with caution—if not avoided entirely.
Table 1 Sample Overview (Individual-Level)
Full Sample
(n = 4,722) LSSSE Respondents
(n = 2,025) National
(ABA Law Schools) Race (percent)
Asian 8.43* 8.30* 6.39 Black 7.73 6.76* 8.35 Hispanic 10.61* 8.35* 12.34 White 63.98* 69.04* 61.44 Two or More 3.35 3.16 2.97 Remaining 3.11* 3.16* 4.12 Unknown 2.80* 1.23* 4.39
Gender (percent) Female 54.38* 53.88 51.99 Male 45.62* 46.02 47.96
LSAT (median) 154 155 154 UGPA (median) 3.36 3.36 3.37 First-time bar passage rate 74.99* 76.64 76.86 Source: AccessLex Institute (2020), Admissions [Data set], available from http://analytix.accesslex.org/DataSet; AccessLex Institute (2020), Degrees [Data set], available from http://analytix.accesslex.org/DataSet; AccessLex Institute (2020), Enrollment [Data set], available from http://analytix.accesslex.org/DataSet; AccessLex Institute (2020), 2018 First-Time Exam Takers and Repeaters from ABA-Approved Law Schools (thebarexaminer.org); and 2019 First-Time Exam Takers and Repeaters from ABA-Approved Law Schools (thebarexaminer.org). Note: *difference is statistically significant (p < 0.05) from the national figure; national race/ethnicity figures are based on J.D.’s awarded in 2018 and 2019 (regardless of whether full-time or part-time—this distinction is not made in the ABA Standard 509 Required Disclosure data); national gender data is based on the 3L enrollment for both full- and part-time students (as with race/ethnicity, this distinction is not made in ABA Standard 509 data, it is also not reported with the number of degrees awarded data); national LSAT and UGPA figures represent the median of the medians for each individual ABA law school for the admitted class of 2018; national bar passage rate is the aggregated combined pass rate for the July 2018 and July 2019 bar exam administrations.
In sum, our full sample is reasonably representative of the national population of full-time law students during the study period and in previous years; thus, findings yielded from analyses of the full sample should be generalizable to the broader population of ABA law schools and

10
students. But caution should be exercised in generalizing findings to years impacted by the COVID-19 pandemic. Findings from analyses of the LSSSE subsample cannot be generalized with confidence. Although the pool of respondents closely resembles the national population in terms of LSAT, UGPA, and first-time bar passage, there are notable demographic differences that prevent us from generalizing beyond the study schools. 3.3 Variables Our models use both the academic and LSSSE response data to estimate two outcomes: (1) law school academic performance and (2) first-time bar exam performance.
Law school GPA (LGPA) is our academic performance variable. We analyze five iterations of LGPA: first-semester (1S), first-year (1L), third-year (3L),4 final, and LGPA growth—the difference between final and 1S LGPA.5 Each LGPA variable is standardized within each school, which allows us to account for variation in grading policies between schools and for changes in grading practices and trends as students progress through law school (e.g., grade inflation in later years).6
The focus of our analyses is to estimate the extent to which certain variables have a statistical relationship with LGPA. We use LSAT score and UGPA as explanatory variables in our analyses of all five iterations of LGPA. For 3L LGPA, we add 19 student engagement variables. Four of these variables are composites of multiple LSSSE Survey questions, called Engagement Indicators. The remaining 15 are specific survey questions or composites of questions that we identified as potentially having the greatest impact (Table 2).7
First-time bar result (pass/fail) is our bar exam passage variable. For each graduate cohort, we analyze results from either the July 2018 or July 2019 exam, whichever is the first administration following its graduation. Focusing on the most immediate bar exam after graduation helps minimize the influence of unobserved or confounding factors on our analyses. The more time that elapses, the less precise and, potentially, less valid our findings become. Additionally, first-time bar result is probably the most highly scrutinized law school outcome, maximizing the practical value of our study focus.
The focus of our analyses is to estimate the extent to which certain variables have a correlational or predictive relationship to bar exam result.
4 3L LGPA was not provided by schools but is estimated using the provided second-year LGPA and final LGPA, both of which are cumulative measures. This is imperfect as it cannot account for the number of credit hours, but it is a reasonable approximation of a student’s performance in his/her final two semesters. 5 As we discuss below, in models using LGPA growth as the dependent variable, we also include a control for first-semester GPA to account for the fact that a student’s 1S LGPA inherently defines how much room for growth or loss they can experience. 6 Standardizing is a process by which the values of a variable are centered around the mean. The mean is given the value zero and its standard deviation a value of one. All other values are assigned above or below zero based on their distance from the mean and relative to the standard deviation. 7 When combining questions to create thematic composite variables, we used confirmatory factor analysis to verify that our composite variables explained a common, unobserved dimension and should therefore be considered valid. We describe the variable selection process in more detail in Technical Appendix A.I.C.

11
Table 2 Student Engagement Variables
Variable Name and Response Range Variable Description
Learning to Think Like a Lawyer* 1 (very little/some)–3 (very much)
Students think critically, think analytically, and effectively process information from different contexts and frameworks (LSSSE, 2013).
Law School Environment* 1 (never/sometimes)–3 (very often)
Students’ perception of the law school in areas such as diversity, social life, and help coping with non-academic responsibilities, and how the student perceives their own “fit” in the environment. (LSSSE, 2013).
Student Advising* 1 (unsatisfied)–3 (very satisfied)
The quality and quantity of advisory services such as academic counseling and career advising offered by law schools (LSSSE, 2013).
Student–Faculty Interaction* 1 (rarely)–3 (often)
How students communicate with faculty (e.g., receiving prompt feedback or assisting on projects) and what type of advice they receive (e.g., job search advice) (LSSSE, 2013).
Amount of Law School Debt 1 ($0–$20k)–3 ($100k+)
The amount of law school debt respondents expect to have at graduation.
Broad Legal Education 1 (very little/some)–3 (very much)
The extent to which students perceived that their experience at law school contributed to acquiring a broad (as opposed to specialized) legal education.
Challenging Coursework 1 (not/a little)–3 (very challenging)
The degree to which students were challenged and put forth extra effort in their academic lives (“going the extra mile”), including on exams, homework, and writing assignments.
Class Participation 1 (never/sometimes)–3 (very often)
The frequency with which students asked questions in their courses or contributed to class discussions.
Collaboration 0 (never/sometimes)–1 (often/very often)
The frequency with which students discussed ideas or worked on assignments with other students, both in and out of the classroom.
Coming to Class Unprepared 1 (often/very often)–3 (never)
The frequency with which students came to class unprepared (e.g., did not do the reading assignment).
Diverse Knowledge Displayed 1 (never/sometimes)–3 (very often)
The frequency with which class discussions and writing assignments included perspectives (e.g., ethnic or religious background) and conceptual ideas from other courses perspectives in class discussions and writing assignments.
Emphasis on Academics 1 (very little/some)–3 (very much)
The extent to which a law school encourages students to take part in an academically holistic law school experience.
Extracurricular Legal Experience 1 (0 hr.) – 4 (21+ hr.)
The amount of time per week students spent working in the legal field, either through pro bono work or in a paid, law-related job.
Other Responsibilities 1 (0–5 hr.)–3 (21+ hr.)
The amount of time per week students spent on activities not directly related to their education.
Practical Skills 1 (very little/some)–3 (very much)
The extent to which students perceived their law school experience contributed to developing tangible skills that are important for success as an attorney, such as effective speaking, research, and writing.
Preparation for Class 1 (0–20 hr.)–3 (31+ hr.)
The amount of time per week students reported spending preparing for class, on average.
School Satisfaction 1 (unsatisfied)–3 (very satisfied)
The level of satisfaction that students reported with their education experience, and whether they would choose the same law school if they started over.
Self–Care 1 (0–10 hr.)–3 (26+ hr.)
The amount of time per week students participate in non-academic activities, such as exercising or participating in community organizations.
Supportive Relationships 1 (modestly helpful)–4 (helpful)
The degree to which students felt their relationships with faculty, administrative staff, and other students were helpful and provided a sense of belonging.

12
3.4 Models Each model employs either linear mixed effects regression or logistic mixed effects regression. Table 3 describes, by research question, our explanatory and outcome variables, the regression method employed, and the number of observations.
Table 3 Models and Variables Employed
By Research Question Model Obs. Method
(Linear or Logistic)1
Explanatory Variable(s)
Outcome Variable
Question 1: The extent to which LSAT score and UGPA predict law school academic success and first-time bar passage
Bar Result given incoming indicators
4,113 Logistic LSAT and UGPA Bar result
1S LGPA given incoming indicators
3,938 Linear LSAT and UGPA 1S LGPA
1L LGPA given incoming indicators
3,941 Linear LSAT and UGPA 1L LGPA
Final LGPA given incoming indicators
4,223 Linear LSAT and UGPA Final LGPA
LGPA growth given incoming indicators
3,938 Linear LSAT and UGPA LGPA growth
Question 2: The extent to which law school academic performance predicts bar passage.
Bar result given 1S LGPA
3,846 Logistic 1S LGPA Bar result
Bar result given 1L LGPA
3,850 Logistic 1L LGPA Bar result
Bar result given final LGPA
4,113 Logistic Final LGPA Bar result
Bar result given LGPA growth
3,846 Logistic LGPA Growth Bar result
Question 3: What student engagement factors are associated with bar passage?
Bar result given LSSSE Engagement Indicators2
1,451 Logistic LSSSE EIs Bar result
Bar result given School-Related Factors3
1,408 Logistic School-Related Engagement Factors Bar result
Bar result given Student-Centered Factors3
1,366 Logistic Student-Centered Engagement Factors Bar Result
Question 4: What student engagement factors are associated with law school academic performance?
3L LGPA given LSSSE EIs2 1,461 Linear LSSSE EIs 3L LGPA
3L LGPA given School-Related Factors3
1,459 Linear School-Related Engagement Factors 3L LGPA
3L LGPA given Student-Centered Factors3
1,413 Linear Student-Centered Engagement Factors 3L LGPA
Note: 1All models in this study use mixed effects estimation to account for nesting within the data; 2“EI” refers to “engagement indicator,” the term for the four composite variables that LSSSE itself creates and includes in its own reporting; 3 For model parsimony, we divide the remaining collection of 15 student engagement factors into 2 separate models: school-related (e.g., school support for non-academics) and student-centered (e.g., legal work performed) explanatory variables (adding all variables into one single model would lead to model overfitting, particularly in the case of the mixed effects logistic models).

13
Linear regression is generally used when the outcome variable is continuous and normally distributed, although this is not a requirement.8 One of the advantages to this method is that it produces a coefficient that is directly interpretable. The coefficient reflects the impact of a one-unit change in the explanatory variable on the outcome variable, while holding all other variables constant. For example, linear regression allows us to measure the impact of a one-point increase in LSAT score on 1S LGPA. This is a powerful means of interpreting relationships between variables.
Logistic regression is used when the outcome variable is binary (e.g., bar exam pass/fail). Unlike the outputs from linear regression, the results from logit regressions are not directly interpretable. Logistic regression modeling produces outputs called “log odds,” which provide insight on the relationship between variables that we analyze. Log odds tell us two things: 1) general information about the impact of a change in the explanatory variable (or set of variables) on the outcome variable; and 2) whether those impacts are statistically significant. But log odds do not directly communicate, for example, the impact of a one-point increase in LSAT score on the likelihood of bar passage.
In order to increase the usefulness of the logistic regression outputs, we do two things:
• First, we transform log odds into odds ratios, which help frame the strength of the relationship between the variables. Based on odds ratios, we can frame the size of relationships as small, medium, or large.
• Second, we calculate the predicted probability of bar passage based on the average amount of change of a given explanatory variable. Predicted probabilities are particularly useful because they help localize the impact of factors of interest by controlling for other potentially relevant factors.
In this study, we examine 20 schools, each having its own graduates clustered within it. To account for differences between schools and their impact on graduate outcomes, we employ a hierarchical, mixed effects model. Essentially, we perform two levels of analyses. The first level consists of performing separate regressions for each school, producing 20 sets of school-specific coefficients. The second level consists of calculating a weighted average for each coefficient (this is referred to as “partial pooling”). See the Technical Appendix for a more detailed discussion of this method and our reasons for using it.
As shown in Table 4, we utilize a robust set of controls that include, graduation year, race/ethnicity, gender, age, and jurisdiction. Graduation year is a fixed effect that is applied consistently across all models in order to control for variation between the 2018 and 2019 cohorts within each school. To avoid overfitting, the particular control variables employed vary by model based on AIC and BIC values. (The tables in Appendix A.I list all control variables used for each model and Appendix C.IV discusses AIC and BIC.)
8 For further discussion see, for example, Agresti and Finlay, 1986; and King, Keohane, and Verba, 1994.

14
Table 4 Control Variables1
Variable Name Variable Type Description and/or Available Responses Age Binary 0, under 35-years of age; 1, at or over 35-years of age2 Amount of Law School Debt Categorical The amount of law school debt the student expects to
have upon graduation. 1 ($0) – 12 (More than $200,000) First-Generation Binary Indicates whether a student comes from a household
where neither parent/guardian obtained a bachelor’s degree: 1, No; 2, Yes
First-Semester LGPA Continuous Accounts for starting LGPA, given that those with higher first-semester LGPAs have greater statistical likelihood of either diminishment or marginal improvement in LGPA (and vice versa).
Gender Categorical Either “Female” or “Male”.
Graduation Year Categorical Indicates graduation cohort: “2018” or “2019”.
Jurisdiction (California)2 Binary Differentiates those taking the bar in California, which is widely recognized as one of the most difficult exams.
Missing Semester 1 LGPA Binary Indicates whether an observation is missing a value for Semester 1 LGPA, which serves as a proxy for a student’s transfer status (either from another school or from part-time to full-time status).
Minority Proportion3 Continuous Indicates the proportion of the student body at a given school that identifies as either Black, Hispanic, other, or two or more races.
Race Categorical Either “White,” “Asian,” “Black,” “Hispanic,” “Two or More,” or “Remaining”
School Size Categorical Three-category variable that measures the size of the law student population. 1 (Under 500) – 3 (Greater than 900)
Note: 1Not all control variables are employed in all models, see the regression outputs in the appendix for the list of control variables included in each model; 2 this cutoff was selected due to noticeable differences in non-academic responsibilities between those younger and older than 35; 3 for models with bar passage as the dependent variable only.
4. RESULTS We take a multi-faceted approach to interpreting results, particularly those related to the engagement factors that we study. Chiefly, we consider the interplay between practical significance and statistical significance. Throughout, we highlight results that are large or small enough to have practical significance (i.e., for odds ratios, those greater than 1.5 or less than 0.759), regardless of whether they are statistically significant (though we do provide confidence
9 These guideposts are imperfect and to some extent arbitrary, although they are based on what is commonly referred to as “Cohen’s Rule of Thumb” (Cohen’s d = 0.2 [small], 0.5 [medium], and 0.8 [large]) and informed by Chen, Cohen, and Chen’s (2010) work in the field of epidemiology. Chen et al. calculate conversions of odds ratios to Cohen’s d values given various levels of exposure in the nontreatment group. Given the values Chen et al. provide, assuming a rate of exposure greater than 10 percent (essentially, those in lower/higher categories of each variable would have more than a 10 percent probability of passing the bar exam), odds ratios between 1.5 and 2.0 would be considered small, between 2.0 and 4.0 medium, and greater than 4.0 large. Chen et al. do not provide conversions

15
intervals and indicate significance for each). In general, we place greater emphasis on findings that are both practically and statistically significant.
4.1 LSAT Score and UGPA as Predictors of Bar Passage and Academic Performance LSAT score and UGPA bear considerable weight in the admission process. Therefore, we examine the strength of relationships between these factors and the main outcomes of interest: LGPA and first-time bar exam performance. We also track how those relationships change over the course of matriculation, from first semester to graduation.
When interpreting these results, it should be noted that there is some level of “weeding out” that occurs in the admission process and during law school (e.g., student attrition). Our sample comprises only individuals who gained admission, enrolled, and remained enrolled through graduation. Unfortunately, our analyses do not and cannot speak to relationships among applicants who never enrolled or students who did enroll, but left school (via either attrition or transfer) prior to graduation.
4.1.1 LSAT and UGPA are Positively Associated with LGPA We find positive, statistically significant relationships between LGPA and both LSAT score and UGPA (Figure 3). At its strongest, a one-point increase is LSAT score is associated with a 0.08 standard deviation increase in first year LGPA. The exact interpretation will vary by school, but a 0.08 standard deviation increase approximates to a 0.04 increase in 1L LGPA across our standardized sample of 20 schools. The coefficient is similar for UGPA: a one-tenth point increase in UGPA is associated with a 0.03 increase in 1L LGPA. (Note the coefficient is actually 0.28, but this is for a full-point change in UGPA [e.g., 2.0 to 3.0]. To improve applicability and interpretation, we report here and throughout on these changes for a one-tenth point change.)
These coefficients suggest that while LSAT and UGPA may have tangible value as explanatory variables of law school academic performance, that value is modest. But it is possible that our analyses understate the impact of these variables. As we noted earlier, we were able to analyze only the outcomes of
for ORs below 1.0, so given that a lower boundary exists for these values, we apply the inverse to the above thresholds to establish the following bounds: ORs 0.67–0.50 small, 0.50–0.25 medium, and less than 0.25 large.
Figure 2 The Effect of LSAT and UGPA
on LGPA

16
individuals who gained admission, enrolled, and graduated from the study schools. We were unable to account for the pre-admission sifting of applicants or for law school attrition or transfer. These limitations aside, the smallness of the coefficients suggest that even with the possibility of understatement, the impact of these variables on outcomes is likely limited.
4.1.2 LSAT and UGPA are Positively Associated with Bar Exam Performance As with our LGPA analyses, we find small, positive and statistically significant relationships between bar exam performance and both LSAT score and UGPA. The analyses yield odds ratios of 1.11 for LSAT score and 1.99 for UGPA.10 These ratios mean that a one-point increase in LSAT score is associated with an 11 percent increase in the odds of passing the bar exam; a one-tenth increase in UGPA (e.g., 3.4 to 3.5) is associated with a 9.9 percent increase in bar passage odds.11
Figure 3 The Change in Effect Size of LSAT and UGPA on Bar Passage
As Various Explanatory Variables Are Added Odds Ratios and 95 Percent Confidence Intervals
The odds ratios above were yielded using a model that includes LSAT, UGPA, and several control variables mentioned earlier in this report.12 The strength of the relationships (and the size of the odds ratios) diminish when any of the LGPA variables are added to the model. For
10 To allow for comparison across effects sizes and for ease of interpretability, here and throughout, for variables that required transformation—such as UGPA—for model fit, we perform the reverse transformation and then calculate the odds ratio (OR) using this coefficient, reporting that value in discussion. 11 Here we use “percent” and not “percentage points” consciously; this increase in the odds of bar passage is 9.9% over the baseline odds of bar passage. 12 Control variables in this model are gender, race, age, graduation year, and whether the test was taken in the CA jurisdiction.

17
example, when 1L LGPA was added, the odds ratios fell to 1.05 for LSAT score and 1.02 for UGPA.13 They fall further when Final LGPA is the added variable.
4.2 LGPA as a Predictor of Bar Passage 4.2.1 LGPA is the Strongest Predictor of Bar Performance The strongest predictors of bar exam performance are law school grades. We analyzed the impact of law school grades using the four LGPA variables listed earlier, spanning the entire law school experience. The odds ratios range from 3.18 for 1S LGPA to 5.31 for Final LGPA, amounting to large substantive effects. For example, 1L LGPA has an odds ratio of 4.02, meaning that a one standard deviation increase in this variable is associated with a student quadrupling his/her odds of bar passage. More practically, this translates to a student more than doubling his/her odds of bar passage with a one-tenth point increase in 1L LGPA. Each LGPA variable has an effect size that is at least twice as large as that of LSAT or UGPA (Table 5).14
Table 5
The (Relative) Effect Size of LGPA Compared to LSAT and UGPA By Model
Odds Ratios and Effect Sizes Relative to LGPA
First-Semester LGPA
First Year LGPA
Final LGPA
LGPA Growth
OR
Relative OR OR
Relative OR OR
Relative OR OR
Relative OR
LGPA 3.18 (1.00) 4.02 (1.00) 5.31 (1.00) 3.32 (1.00) LSAT 1.06 (0.33) 1.05 (0.26) 1.04 (0.20) 1.04 (0.31) UGPAa 1.31 (0.42) 1.28 (0.32) 1.17 (0.22) 1.20 (0.36) Note: a For all columns, UGPA variables were cubed for model fit—the odds ratios reported here are obtained by performing a reverse transformation (i.e., cube-root) and using these values to calculate the odds ratio; the LGPA Growth model includes 1S LGPA as a control, which is not shown here; all ORs reported here are significant at the p < 0.05 level, except UGPA in the final LGPA and LGPA growth columns.
13 We do not employ any models that include all LGPA variables due to the high collinearity among them. Table A.II.5 in the appendix shows the high correlation among the different LGPA variables. Utilizing models that include such highly correlated variables introduces the problem of multicollinearity. Models that violate the collinearity assumption can produce unreliable results. 14 Recall that all LGPA variables are standardized within their specific schools to account for differences in grading scales.
Figure 4 The Effects of LSAT Score, UGPA, and LGPA on
Bar Passage Odds Ratios and 95 Percent Confidence Intervals

18
The impact of changes in LGPA over the course of students’ law school matriculation is particularly interesting. Recall that the LGPA Growth variable captures the extent to which LGPAs grew or fell between the end of the first semester and graduation. In our analyses, LGPA Growth has an odds ratio of 3.32, meaning that a one standard deviation increase is associated with a student more than tripling their odds of passing the bar.15 This translates to approximately a 19-percentage point increase in bar passage odds with average growth in LGPA of 0.17.
Figure 5 illustrates the impact of the LGPA Growth variable in nuanced fashion. There are three sets of four bars, each representing a subset of graduates grouped together by where their 1S LGPA fell in the overall distribution at their law schools. The group on the left had below average first-semester grades; the middle group had average grades; the group on the right had above average grades.16 Each group comprising each four-bar set represents the probability of bar passage based on four LGPA Growth benchmarks: growth of -0.09 (one standard deviation below the mean; no growth; growth of 0.17 (the average for the entire sample); and growth of 0.43 (one standard deviation above the mean).
Figure 5 Predicted Probability of Bar Passage
Given LGPA Growth and First-Semester LGPA
15 A helpful workshop comment we received suggested that to improve one’s class standing, some students might be motivated to increase their number clinic credit hours, which are more leniently graded. This could potentially lead to an artificial inflation of LGPA growth and bias our results. However, we did not find any evidence that the number of clinic hours had any meaningful impact on bar passage or on LGPA growth. 16 Separating comparison groups by average grades allows us to examine the effect of LGPA growth on several types of students—in this case, below average, average, and above average performing students. This is useful because as Figure 5 demonstrates, the effect of LGPA growth is quite different for below-average and above-average students, allowing us to make more precise recommendations to improve bar passage rates.
Note: LGPA growth values are standardized within each school and are approximated here using the non-standardized mean and standard deviation for the full sample; thus, exact values will vary by school.

19
The most compelling observation from the figure is the extent to which increases in LGPA impact the bar passage chances of individuals with below average first-semester grades. Graduates with below average first-semester grades who experienced negative LGPA growth (-0.09) had only an 18 percent chance of passing the bar exam, and those with no LGPA growth had a 25 percent chance of passing the bar exam, compared to 43 percent among their peers who experienced average growth. Above average growth was associated with a 71 percent chance of passing. There were also noticeable impacts of grade improvement among graduates who had average first-semester grades. The impacts were negligible among graduates with above average first-semester grades; their chances of passing the bar were already high irrespective of subsequent academic performance.
Both of these latter trends suggest that interventions targeted at students in the bottom two quintiles of the LGPA distribution are likely to have the greatest impact on bar passage than interventions focusing on other students. We expound on this point in the Recommendations section.
Figure 6 Predicted Probability of Bar Passage Given LGPA Performance

20
4.3 Student Engagement as a Predictor of Academic Performance and Bar Passage 4.3.1 Several Modest Effects of Student Engagement on Academic Performance Our analyses of the student engagement variables were limited to graduates who completed the LSSSE Survey in their final semester of 3L study, making 3L LGPA the most germane academic outcome of interest. As shown in Figure 7, our analyses yield small positive and negative relationships between several of the student engagement factors and 3L LGPA. The effect sizes appear quite modest at first blush. For example, the largest effect size is yielded by the Class Participation variable. Participating in class “very often” is associated with a 0.28 standard deviation increase in 3L LGPA compared to the “never/sometimes” response option. In practical terms, this approximates to a difference of about 0.07 grade points.
On their own, none of these results are practically significant. However, as we note in our recommendations, student engagement theory emphasizes the importance of fostering learning environments that encourage multifaceted engagement among students. Thus, it might be that these factors should not be considered in isolation, but as complementary. As such, the cumulative impact of several of these small effects could be tangible.
The analyses yield two seemingly contradictory findings that warrant brief mention. On one hand, the Preparation for Class variable is negatively and significantly associated with 3L LGPA; the more hours graduates reported spending preparing for class the lower their 3L LGPA. But the Coming to Class Unprepared variable is positively and significantly associated with 3L LGPA. Graduates who reported “never” coming to class unprepared had higher 3L LGPAs than graduates who reported being unprepared “often” or “very often”. The seeming contradiction should not be interpreted to mean that studying does not make a difference; it surely does. The more likely explanation is that graduates who experienced academic difficulty may have simply needed more time to grasp the material or may have been more likely to use inefficient or ineffective study methods that increased their preparation time. Thus, we caution against using a variable measuring the amount of time students report preparing for class when estimating academic outcomes.

21
Figure 7 The Effects of Student Engagement Factors on 3L LGPA
Coefficients and 95 Percent Confidence Intervals
22
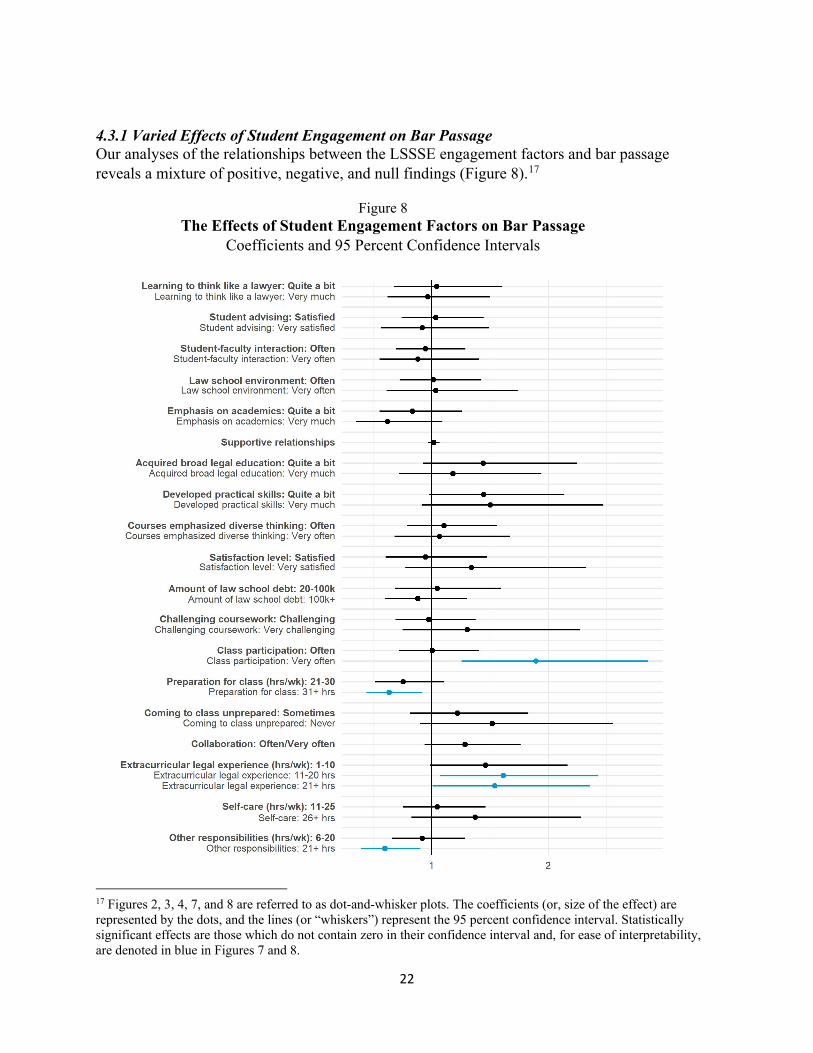
4.3.1 Varied Effects of Student Engagement on Bar Passage Our analyses of the relationships between the LSSSE engagement factors and bar passage reveals a mixture of positive, negative, and null findings (Figure 8).17
17 Figures 2, 3, 4, 7, and 8 are referred to as dot-and-whisker plots. The coefficients (or, size of the effect) are represented by the dots, and the lines (or “whiskers”) represent the 95 percent confidence interval. Statistically significant effects are those which do not contain zero in their confidence interval and, for ease of interpretability, are denoted in blue in Figures 7 and 8.
Figure 8 The Effects of Student Engagement Factors on Bar Passage
Coefficients and 95 Percent Confidence Intervals

23
Positive Indicators
Of the 19 LSSSE factors that we investigate, four have positive and meaningful relationships with bar passage.
Extracurricular Legal Experience: Graduates who reported working in the legal field, either through pro bono work or in a paid, law-related job were more likely to pass the bar exam. The favorable impacts are greatest among graduates who entered law school with below average LSAT scores (Figure 9).
Figure 9 Predicted Probability of Bar Passage
Given Weekly Hours of Extracurricular Legal Experience (by LSAT Score)
Practical Skills: Graduates who reported that their law school experience contributed “very much” to their development of relevant and tangible skills were more likely to pass the bar exam than other graduates. Once again, the favorable impacts were greatest among graduates who entered law school with below average LSAT scores (Figure 10).

24
Figure 10 Predicted Probability of Bar Passage
Given Practical Skills (by LSAT Score)
Class Participation: Graduates who reported participating in class “very often” were more likely to pass the bar exam than other graduates. Once again, the favorable impacts were greatest among graduates who entered law school with below average LSAT scores (Figure 11).
Figure 11
Predicted Probability of Bar Passage Given Class Participation
(by LSAT score)

25
Negative Indicators
Two LSSSE factors appear to be negatively associated with bar passage.
Other Responsibilities: Graduates who reported spending at least 21 hours per week caring for dependents and/or working a job outside of the legal field were less likely to pass the bar exam than other graduates (Figure 12).
Figure 12
Predicted Probability of Bar Passage Given Hours per Week of Other Responsibilities
(by LSAT score)
Counterintuitive Findings
Emphasis on Academics: A decidedly counterintuitive finding is that graduates who reported that their law school encouraged students to take part in an academically holistic law school experience were less likely to pass the bar exam than other graduates. Graduates who responded “very little/some” to the prompt were most likely to pass (Figure 13). This trend held, irrespective of LSAT grouping. We have no reasonable explanation for this finding, particularly in light of findings pertaining to the benefits of gaining relevant practical experience.

26
Figure 13 Predicted Probability of Bar Passage
Given School’s Emphasis on Academics (by LSAT score)
Coming to Class Unprepared and Preparation for Class: Similar to our analysis of student engagement and academic performance, time spent preparing for class was associated with lower chances of passing the bar exam while preparing for class overall was associated with higher chances of passing. These trends held irrespective of LSAT score grouping (Figure 14). As we theorized earlier, this might capture two phenomena pertaining to graduates who were less likely to pass the bar exam: 1) they may have needed more time to grasp the material, or 2) they may have been more likely to use inefficient or ineffective study methods that increased their preparation time.

27
Figure 14 Predicted Probability of Bar Passage
Given Preparation for Class and Coming to Class Unprepared by LSAT score
Null/Inconclusive
We do not find evidence that any of the remaining LSSSE factors, including the LSSSE engagement indicators, are meaningfully related to academic or first-time bar performance. Note that this does not mean that there is definitively no relationship between these variables, only that we fail to find a meaningful substantive impact in this study.
5. DISCUSSION & RECOMMENDATIONS This study was designed with action in mind. We sought to take an applied approach to our analyses, with the goal of yielding findings that could be used to inform policies, procedures, and practices. To that end, below is a series of action-oriented recommendations rooted in our findings.
5.1 Recommendations Explore relevance of varied admission factors. Consistent with extant research, we find that the LSAT score and UGPA are modestly predictive of law school academic performance. A one-point increase in LSAT score is associated with a 0.04 increase in 1L LGPA across our standardized sample of 20 schools. A one-tenth point increase in UGPA was associated with a 0.03 increase in LGPA (Section 4.1.1.). These relationships are considerably weaker for academic performance beyond the first year. Additionally, we find noteworthy relationships between LSAT score and UGPA and bar exam passage. A one-point increase in LSAT score is associated with an 11 percent increase in the

28
odds of passing the bar exam (see Section 4.1.2). A one-tenth point increase in UGPA is associated with a 9.9 percent increase.
These findings suggest that while the LSAT score and UGPA have some value as predictors of academic and bar exam performance, their usefulness is limited and they are not determinative of success or failure; therefore, what law schools do after students enroll is very important. Law school grades at every stage of matriculation, from the first semester through the last, are by far the strongest predictors of bar exam performance, progressively supplanting pre-admission factors.
The limits of the primary admission factors offer a need and an opportunity for law schools to explore and leverage the predictive value of other aspects of the application. For example, most law schools require applicants to submit personal statements and letters of recommendation. What do these materials tell us about who has the potential to be successful law students and effective and ethical lawyers? Is it possible that these materials have predictive value in their current form? If not, can they be designed in ways that would yield predictive value? If so, these materials could serve as useful components of the admission process, allowing law schools to get a fuller picture of applicant potential in ways that could possibly yield entering cohorts that are more diverse and more likely to experience favorable outcomes.
Encourage growth mindset thinking. Law school is a distinctive academic experience, and many students find the transition difficult, particularly early on. This difficulty often manifests as less-than-stellar academic performance in the first year, which can lower one’s confidence in their ability to do well. These impacts are intensified by the manner in which first-year grades set the tone for future academic and professional opportunities. As discussed earlier, fixed mindset thinking is common among law students and is commonly embedded in policies and practices existing within law schools. But our findings strongly suggest that encouraging growth mindset thinking could not only improve academic performance but increase bar exam pass rates as well.
One of our most robust findings is that improvement in LGPA between the end of the first semester and graduation was associated with increased odds of passing the bar exam, even after controlling for other relevant factors (e.g., entering admission credentials, bar exam jurisdiction) and after accounting for differences among schools, including grading policies (see Section 4.2.1). The impacts are particularly intense among students who experience the most academic difficulty in the first semester. Graduates with below average first-semester grades who experienced no LGPA growth had a 25 percent chance of passing the bar exam, compared to 43 percent among their peers who experienced average growth (about 0.17 grade points—Figure 5).
Schools should nurture growth mindsets among their students by creating learning environments in which policies, practices and messaging emphasize that growth in knowledge, skills and abilities is possible. Students should be encouraged to take ownership of their learning and be provided the instruction and support they need to succeed. Our findings show that doing so can yield substantial benefits.

29
Intervene early. The end of the first year is a common intervention point for law schools seeking to assist students who are experiencing academic difficulty. Less common, although certainly with precedent, are interventions that begin prior to the end of the first year. Our analyses demonstrate that first-semester grades can help predict bar exam performance and helping identify students most at risk of not passing. The predicted probabilities of bar passage that we calculated using 1S LGPA showed stark differences (Figure 6). Students with below average first-semester grades had a 56 percent chance of passing the bar exam, compared to 80 percent among students with average first-semester grades and 93 percent among those with above average grades.
Predicted probabilities are particularly useful because they control for other potentially relevant factors in seeking to localize the impact of the LGPA differences. Our analyses demonstrate the immense usefulness of first-semester grades as an early indicator of bar exam risks. Schools could leverage such data in designing robust interventions that begin six or more months prior to interventions that begin after the end of the first year. The earlier the intervention, the better.
Maximize opportunities for student improvement. Our data suggest that efforts to increase bar passage rates are most impactfully targeted at students at the lower end of the LGPA distribution (Figure 5). For example, the favorable impact of LGPA growth on bar pass odds is most dramatic among students who had below average first-year grades. Enhancing the potential for impact is the fact that these students have statistically the most room and, therefore, opportunity to grow.
Another intriguing finding is that the favorable impacts of higher levels of student engagement were more pronounced among students who entered law school with lower LSAT scores. Things like frequently participating in class (Figure 11) and gaining practical legal experience while in school (Figure 9) increased bar passage odds most noticeably among students with below average LSAT scores, compared to other students.
Our findings highlight the importance of designing curricular and co-curricular frameworks that provide comprehensive support and opportunities for engagement among all students, particularly those who have the most room to improve. These findings may also call into question academic policies that narrow the curriculum for students who experience academic difficulty, increase the number of mandatory courses, and discourage participation in co-curricular activities and relevant employment.
Provide targeted support to students with outside responsibilities. Some students enter law school with significant responsibilities outside of school. For some, these responsibilities can impact their academic performance. Graduates who spent more than 21 hours per week on responsibilities such as caring for dependents or working a non-law-related job had lower 3L LGPAs and bar passage odds than their peers who spent 0 to 5 hours on these activities (Figure 12). A likely cause of this trend is the simple fact that time and energy spent on other responsibilities can often mean less time spent studying or engaging in law school work; this is probably especially true when the other responsibilities are very important, such as caring for a dependent.

30
The existence of outside responsibilities should not prevent students from thriving. Supporting these students requires law schools to target resources in ways that address needs in relevant ways. These efforts could help promote broad based student success, given that students with significant outside responsibilities are more likely to come from underrepresented backgrounds or have non-traditional characteristics (e.g., above average age).
Harness the cumulative potential of student engagement. There are a number of student engagement factors that each have modest, though tangible, impacts on academic or bar exam performance. Some of these factors appear complementary. For example, favorable responses to the Extracurricular Legal Experience and Class Participation prompts each had modest positive impacts on bar exam passage (Figures 9 and 11, respectively). It seems that in situations where they coexist – a student who is both gaining law-related work experience and actively participating in classes – there is the possibility of a cumulative and magnifying effect. Similarly, Challenging Coursework, Class Participation, Broad Legal Education, and Student-Faculty Interaction each have modest positive effects on 3L LGPA (Figure 7), again suggesting potential for cumulatively favorable impacts.
More research is needed to understand the extent to which these factors complement each other. In the meantime, there is surely no downside to law schools fostering environments in which students are encouraged and provided the support needed to engage deeply with their studies and the law school experience overall.
5.1 Limitations There are several limitations to this study that may have impacted our findings:
• Although we benefit from a relatively large dataset, our ability to detect statistically significant effects may be somewhat constrained by sample size limitations, particularly in the case of our analyses of the impact of the LSSSE variables on bar performance. Insufficient sample sizes make it harder for statistical models to discern with confidence that statistically significant effects are present. This may in turn lead to “false negative” effects going undetected or understated by us.
• The schools in our sample enrolled a diverse cross-section of law students that in some ways reflected the broader law school population. But some of our analyses of subsets of graduates were done using non-representative data. Moreover, the self-selected nature of school participation in this study and student completion of the LSSSE Survey introduces elements of non-randomness that make drawing inferences risky. To help mitigate these risks, we employ mixed effects models that serve to acknowledge the non-randomness of the data and provide estimates that theoretically account for it.
• In analyzing LSAT scores, we were faced with range restriction limitations (Salkind 2010). We were unable to observe the entire range of LSAT scores in relation to LGPA and bar performance because no school admits the entire range of LSAT scorers. Therefore, our analyses were restricted by the range of scorers that enrolled in study schools, graduated, and took the bar exam (Klieger et al 2018). This phenomenon could have led to an understatement of the associations between LSAT score and the outcomes

31
of interest (Gardiner 2019). As such, our findings can only be applied to the population of law students that enroll in and graduate from law school.
• Our sample naturally does not include students who entered a study law but did not graduate from that law school. These students may have transferred out or left law school altogether. Data pertaining to their outcomes (e.g., law school grades) are not included, potentially impacting our findings.
6. CONCLUSION
This study is the first multi-institutional investigation of the relationships between pre-admission factors, law school academic performance, student engagement and first-time bar exam performance. Our analyses yield various findings that in some cases align with extant research and contradict it in others. There are also findings that shed new light on previously unexplored questions. The overarching finding is a simple confirmation that what law schools do, matters. Neither pre-admission factors nor early law school performance are destiny. There are many opportunities to change downward trajectories and position students for subsequent academic and bar exam success.
We hope that the findings presented in this report will supplement the insight, experience and judgment of legal educators by helping inform efforts to cultivate learning environments designed to foster academic growth and bar exam preparedness.
ACKNOWLEDGEMENTS We are extremely grateful for the advice and assistance of Tiffane Cochran, Chad Christensen, and Meera Deo. In addition, we thank Todd Nobles for his excellent research assistance.

32
REFERENCES
AccessLex Institute Center for Legal Education Excellence (2020). Legal Education Data Deck. Retrieved from https://www.accesslex.org/research-and-data-tools-and-resources/legal-education-data-deck.
Achen, C. H. (2004). “Let’s Put Garbage-Can Regressions and Garbage-Can Probits where they Belong.” Retrieved October 16, 2020, from http://www.columbia.edu/~gjw10/achen04.pdf.
Aditomo, A. (2015). Students’ response to academic setback: “Growth mindset” as a buffer
against demotivation. International Journal of Educational Psychology, 4(2), 198-222. Albanese, M.A. (2018). “The Testing Column: February 2018: The MBE Storm Surge
Continues,” 87(2) The Bar Examiner 27–32. American Bar Association (2018). Chapter 5: Admissions and student services. In ABA
standards and rules of procedure for approval of law schools 2018-2019. Retrieved from https://www.americanbar.org/content/dam/aba/publications/misc/legal_education/Standards/2018-2019ABAStandardsforApprovalofLawSchools/2018-2019-aba-standards-chapter5.pdf
American Bar Association. (2019). ABA profile of the legal profession. Retrieved from
https://www.americanbar.org/news/reporter_resources/profile-of-profession/ American Bar Association. Memorandum to ABA Accredited Law Schools. “Revisions to
Standard 316: Bar Passage.” 6 May 2019. Aronson, J., Fried, C. B., & Good, C. (2002). Reducing the effects of stereotype threat on
African American college students by shaping theories of intelligence. Journal of Experimental Social Psychology, 38(2), 113-125.
Astin, A. W. (1984). Student involvement: A development theory for higher education. Journal
of College Student Development, 40, 518-529. Retrieved from https://www.researchgate.net/publication/220017441_Student_Involvement_A_Development_Theory_for_Higher_Education
Astin, A. W. (1991). Assessment for excellence: The philosophy and practice of assessment and
evaluation in higher education. Washington, DC: American Council on Education/Oryx Press Series on Higher Education.
Astin, A. W. (1993). Assessment for Excellence: the philosophy and practice of assessment and
evaluation in higher education. New York: Oryx Press.

33
Attinasi, L. C., Jr. (1989). Getting in: Mexican Americans' perceptions of university attendance and the implications for freshman year persistence. Journal of Higher Education 60(3): 247-277.
Austin, K. A., Christopher, C. M., & Dickerson, D. (2016). Will I pass the bar exam?: Predicting
student success using LSAT scores and law school performance. Hofstra Law Review, 45(3), 753-784.
Bess, M. (2019). Grit, growth mindset, and the path to successful lawyering. doi:
10.2139/ssrn.3458632 Blackwell, L. S., Trzesniewski, K. H., & Dweck, C. S. (2007). Implicit theories of intelligence
predict achievement across an adolescent transition: A longitudinal study and an intervention. Child Development, 78(1), 246-263.
Carini, R. M., Kuh, G. D., & Klein, S. P. (2006). Student engagement and student learning:
Testing the linkages. Research in Higher Education, 47, 1-32. Chen, H., Cohen, P., & Chen, S. (2010). How big is a big odds ratio? Interpreting the magnitudes
of odds ratios in epidemiological studies, Communications in Statistics - Simulation and Computation, 39:4, 860-864, DOI: 10.1080/03610911003650383
Coe, A. (2017, April 10). Multistate bar exam results dive to 10-year low. Law360. Retrieved
from https://www.law360.com/articles/911899/multistate-bar-exam-results-dive-to-10-year-low
Cohen , J. (1988). Statistical Power Analysis for the Behavioral Sciences. Hillsdale, NJ: Erlbaum
Clydesdale, Timothy T. (2004). "A forked river runs through law school: Toward understanding
race, gender, age, and related gaps in law school performance and bar passage." Law & Social Inquiry 29.4: 711-769.
Cohen, B. H., & Lea, R. B. (2004). Essentials of statistics for the social and behavioral sciences. Hoboken, NJ: Wiley.
Cronbach, L. J. (1951). Coefficient alpha and the internal structure of tests. Psychometrika, 16(3), 297-334.
Currier, B. (2016). It’s (appropriately) complicated: Be cautious in using LSAT scores to evaluate law schools. Syllabus, 47(2), v-vii.

34
Deo, M. E. (2011). The promise of Grutter: Diverse interactions at the University of Michigan Law School. Mich. J. Race & L., 17(1), 63-118.
Detwiler, R. (2011). Assessing factors influencing student academic success in law
school. (Electronic Thesis or Dissertation). Retrieved from https://etd.ohiolink.edu/ Dey, Eric L. (1997). "Working with low survey response rates: The efficacy of weighting
adjustments." Research in higher education 38.2: 215-227. Dweck, C. S. (2000). Self-theories: Their role in motivation, personality, and development.
Psychology Press. Dweck, C. S. (2006). Mindset: The new psychology of success. Random House Publishing
Group. Farley, A. N., Swoboda, C. M., Chanvisanuruk, J., McKinley, K. M., & Boards, A. (2018). Law
student success and supports: Examining bar passage and factors that contribute to student performance. doi: 10.2139/ssrn.3237546
Finlay, Barbara, and A. Agresti. 1986. Statistical methods for the social sciences. Dellen, 1986. Florio, C. M. S. & Hoffman, S. J. (2012). Student perspectives on legal education: A
longitudinal empirical evaluation. Journal of Legal Education, 62(1), 162–187.
Friedman, H. H., Herskovitz, P. J., & Pollack, S. (1994). The biasing effects of scale-checking styles on response to a Likert scale. In Proceedings of the American statistical association annual conference: survey research methods (Vol. 792, pp. 792-795).
Gardiner, R. (2019). Understanding the Impact of Range Restriction on LSAT Correlation Studies. Retrieved October 16, 2020, from https://www.accesslex.org/xblog/understanding-impact-of-range-restriction-on-lsat-correlation-studies
George, D., & Mallery, P. (2003). SPSS for Windows step by step: A simple guide and reference.
11.0 update (4th ed.). Boston: Allyn & Bacon. Georgakopoulos, N. L. (2013). Bar passage: GPA and LSAT, not bar reviews. Indiana
University Robert H. McKinney School of Law Research Paper No. 2013-30. doi: 10.2139/ssrn.2308341
Gliem, J. & Gliem, R. (2003). Calculating, Interpreting, and Reporting Cronbach’s Alpha
Reliability Coefficient for Likert-Type Scales. 2003 Midwest Research to Practice Conference in Adult, Continuing, and Community Education.

35
Haddon, P. A. & Post, D. W. (2006). Misuse and abuse of the LSAT: Making the case for alternative evaluative efforts and a redefinition of merit. St. John’s Law Review, 80(1), 41-106.
Holmquist, K., Shultz, M., Zedeck, S., & Oppenheimer, D. (2014). Measuring merit: The Shultz-
Zedeck research on law school admissions. Journal of Legal Education, 63(4), 565-584. Hu, S., Kuh, G. D. & Li, S. (2008), The effects of engagement in inquiry-oriented activities on
student learning and personal development. Innovative Higher Education, 33(2), 71–8. Jellum, L. & Reeves, E. P. (2004). Cool data on a hot issue: Empirical evidence that a law school
bar support program enhances bar performance. Nevada Law Journal, 5(3), 646-683. Jin, K. Y., & Chen, H. F. (2020). MIMIC approach to assessing differential item functioning
with control of extreme response style. Behavior Research Methods, 52(1), 23-35.
Scott Johns, Empirical Reflections: A Statistical Evaluation of Bar Exam Program Interventions, 54 U. Louisville L. Rev. 35 (2016), https://heinonline.org/HOL/P?h=hein.journals/branlaj54&i=41.
King, G., Keohane, R., & Verba, S. (1994). Designing Social Inquiry: Scientific Inference in
Qualitative Research. PRINCETON, NEW JERSEY: Princeton University Press. doi:10.2307/j.ctt7sfxj
Klein, Stephen P. (1990). "Disparities in Bar Exam Passing Rates Among Racial/Ethnic Groups:
Their Size, Source, and Implications." T. Marshall L. Rev. 16: 517.
Klieger, D., Bridgeman, B., Tannenbaum, R., Cline, F., & Olivera-Aguilar, M. (2018). The Validity of GRE® General Test Scores for Predicting ... Retrieved October 19, 2020, from https://files.eric.ed.gov/fulltext/EJ1202794.pdf
Krause, K. L. & Coates, H. (2008). Students’ engagement in first‐year university. Assessment & Evaluation in Higher Education, 33(5), 493-505.
Kuh, G. (2008). High impact educational practices: What they are, who has access to them, and
why they matter. Washington, DC: Association of American Colleges and Universities. Kuh, G. D. (2008). Excerpt from high-impact educational practices: What they are, who has access to them, and why they matter. Association of American Colleges and Universities, 19-34.
Kuh, G. D. (2009). What student affairs professionals need to know about student
engagement. Journal of College Student Development 50(6), 683-706.

36
Kuh, G. D. (2009). The National Survey of Student Engagement: Conceptual and empirical foundations. New Directions for Institutional Research 2009(141), 5–20.
Kruger, J., & Dunning, D. (1999). Unskilled and unaware of it: How difficulties in recognizing one's own incompetence lead to inflated self-assessments. Retrieved October 19, 2020, from https://doi.apa.org/doiLanding?doi=10.1037%2F0022-3514.77.6.1121
Law School Admission Council. (2014). Cautionary policies concerning LSAT scores and related services. Retrieved from https://www.lsac.org/sites/default/files/media/lsat-score-cautionary-policies_0.pdf
Law School Admission Council. (n.d. -a). Archive: 2000-2015 ABA end-of-year summaries—
applicants, admitted applicants & applications. Retrieved from https://www.lsac.org/archive-2000-2015-aba-end-year-summaries-applicants-admitted-applicants-applications
Law School Admission Council. (n.d. -b). Admission trends: ABA applicants, admitted
applicants & applications. Retrieved from https://www.lsac.org/archive-2000-2015-aba-end-year-summaries-applicants-admitted-applicants-applications
Law School Survey of Student Engagement (2020) Administering LSSSE. Retrieved from:
https://lssse.indiana.edu/administering/
Law School Survey of Student Engagement. (2012). Lessons from law students on legal
education – annual results 2012. Bloomington, IN: Indiana University Center for Postsecondary Research.
Law School Survey of Student Engagement (2020) LSSSE Survey. Retrieved from:
https://lssse.indiana.edu/about-lssse-surveys/
Likert, R. (1931). A technique for the measurement of attitudes. Archives of Psychology,
22(140), 1-55.
Markovic, M., & Plickert, G. (2019). The paradox of minority attorney satisfaction. International
Review of Law and Economics, 60, 105859. Marks, A. B. & Moss, S. A. (2016). What predicts law student success: A longitudinal study
correlating law student applicant data and law school outcomes. Journal of Empirical Legal Studies, 13(2), 205-265.
McCormick, A. C., Kinzie, J., & Gonyea, R. M. (2013). Student engagement: Bridging research

37
and practice to improve the quality of undergraduate education. In M. B. Paulsen (Ed.), Higher education: Handbook of theory and research (pp. 47–92). New York, NY: Springer.
National Conference of Bar Examiners (2019, August 20). Impact of adoption of the Uniform
Bar Examination in New York. Retrieved from https://www.nybarexam.org/UBEReport/NY%20UBE%20Adoption%20Part%202%20Study.pdf
Pascarella, E. T. (1980). Student-faculty informal contact and college outcomes. Review of
Educational Research, 50(4), 545-595. Pratt, C. D. (2008). Way to Represent: The Role of Black Lawyers in Contemporary American
Democracy. Fordham L. Rev., 77, 1409. Quaye, S. J., & Harper, S. R. (Eds.). (2014). Student engagement in higher education:
Theoretical perspectives and practical approaches for diverse populations. Routledge. Quintanilla, V. D. & Erman, S. (2020). Productive mindset interventions mitigate psychological
friction and improve well-being for bar exam takers. Raising the Bar, 3(1), 7-9. Randall, V. R. (2006). The misuses of the LSAT: Discrimination against blacks and other
minorities in law school admissions. St. John's Law Review, 80(1), 107-152. Rocconi, L., Taylor, A., Haeger, H., Zilvinskis, J., & Christensen, C. (2019). Beyond the
numbers: An examination of diverse interactions in law school. Journal of Diversity in Higher Education, 12(1), 27-37.
Rhode, D. L. (2015, May 27). Law is the least diverse profession in the nation. And lawyers
aren’t doing enough to change that. The Washington Post. Retrieved from https://www.washingtonpost.com/posteverything/wp/2015/05/27/law-is-the-least-diverse-profession-in-the-nation-and-lawyers-arent-doing-enough-to-change-that/?hpid=z11
Salkind, N. J. (2010). Encyclopedia of research design (Vols. 1-0). Thousand Oaks, CA: SAGE
Publications, Inc. doi: 10.4135/9781412961288 Sander, R. H. (2019). Are Law Schools Engines of Inequality. JL & Educ., 48, 243.
Shultz, M. M. & Zedeck, S. (2011). Predicting lawyer effectiveness: Broadening the basis for
law school admission decisions. Law & Social Inquiry, 36(3), 620-661. Shultz, M. M. & Zedeck, S. (2012). Admission to law school: New measures. Educational
Psychologist, 47(1), 51–65.

38
Shapcott, S., Davis, S. & Hanson, L. (2017). The jury is in: Law schools foster students’ fixed
mindsets. Law & Psychology Review, 42, 1-34. Silver, C., Rocconi, L., Haeger, H., & Watkins, L. (2013). Gaining from the system: Lessons
from the Law School Survey of Student Engagement about student development in law school. University of St. Thomas Law Journal, 10(1), 286-316.
Sperling, C. & Shapcott, S. (2012). Fixing students’ fixed mindsets: Paving the way for
meaningful assessment. Legal Writing, 18, 39-84. Spitzer, B. & Aronson, J. (2015). Minding and mending the gap: Social psychological
interventions to reduce educational disparities. Journal of Educational Psychology, 85(1), 1-18.
State Bar of California. (2019, December 20). General statistics report July 2019 California Bar
Examination. Retrieved from http://www.calbar.ca.gov/Portals/0/documents/July2019-CBX-Statistics.pdf
Taylor, A.N. (2019). The Marginalization of Black Aspiring Lawyers, 13 FIU L. Rev. 489. Taylor, A.N. (2015). Diversity as a Law School Survival Strategy. Saint Louis U. Legal Studies
Research Paper No. 2015-1. Taylor, A. N. (2014). Diversity as a law school survival strategy. St. Louis University Law
Journal, 59(2), 321-384. Taylor, A. N. & Christensen, C. (2017, February). Law school scholarship policies: Engines of
inequity (LSSSE Annual Results 2016). Bloomington, IN: Indiana University Center for Postsecondary Research.
The Bar Examiner. 2018 First-Time Exam Takers and Repeaters from ABA-Approved Law
Schools (Dataset). Available at https://thebarexaminer.org/statistics/2018-statistics/2018-first-time-exam-takers-and-repeaters-from-aba-approved-law-schools/.
The Bar Examiner. 2019 First-Time Exam Takers and Repeaters from ABA-Approved Law
Schools (Dataset). Available at https://thebarexaminer.org/2019-statistics/2019-first-time-exam-takers-and-repeaters-from-aba-approved-law-schools/.
Thomas, D. (2003). Predicting law school academic performance from LSAT scores and
undergraduate grade point averages: A comprehensive study. Arizona State Law Journal, 35(3), 1007-1028.

39
Tinto, V. (1975). Dropouts from higher education: A theoretical synthesis of recent research. Review of Educational Research, 45(1), 89-125.
Trujillo, L. A. (2007). The relationship between law school and the bar exam: A look at
assessment and student success. University of Colorado Law Review, 78(1), 69-114. Ward, S. F. “Lowest bar pass rate for California in 67 years; other states see drop, too.” (2018,
November 19), ABA Journal. Retrieved on April 11, 2019, http://www.abajournal.com/news/article/lowest_bar_pass_rate_for_california_in_67_years_other_states_see_drop_too
Wasserstein, R.L. & Lazar, N.A.. (2016) The ASA statement on p-Values: Context, process, and
purpose, The American Statistician, 70:2, 129-133, DOI: 10.1080/00031305.2016.1154108
Wasserstein, R.L., Schirm, A.L. & Lazar, N.A.. (2019) Moving to a World Beyond “p < 0.05”, The American Statistician, 73:sup1, 1-19, DOI: 10.1080/00031305.2019.1583913
Wightman, L. F. (1997). The threat to diversity in legal education: An empirical analysis of the consequences of abandoning race as a factor in law school admission decisions. New York University Law Review, 72(1), 1-53.
Wightman, L. F. & Ramsey, H. (1998). LSAC national longitudinal bar passage study. Law
School Admission Council.