
“It’s all about Creating Value”
63
© VimpelCom Ltd 2013 “It’s all about Creating Value” Renaissance Capital Investor Conference Moscow, June 2013 Dmitriy Afinogenov Chief Financial Officer Business Unit Russia Gerbrand Nijman Group Director & Head of Investor Relations
Transcript of “It’s all about Creating Value”

1
© V
impelC
om
Ltd
2013 “It’s all about Creating Value”
Renaissance Capital Investor Conference
Moscow, June 2013
Dmitriy Afinogenov
Chief Financial Officer Business Unit Russia
Gerbrand Nijman
Group Director & Head of Investor Relations

2
© V
impelC
om
Ltd
2013
* 1Q13 for number of mobile subscribers and 1Q13 LTM for Revenue and EBITDA
** Based on mobile subscribers
*** Population figures are provided by ©Informa Telecoms & Media – © Informa UK Ltd 2013 as per YE 2012
No 7 Mobile
Operator in the
world**
International Telecoms Operator with Attractive Emerging Markets Exposure
215 million*
753 million***
17
USD 23.0 billion*
USD 9.8 billion*
10
Mobile
subscribers
Population covered
Countries
Total Operating
Revenue
EBITDA
Number of Brands

3
© V
impelC
om
Ltd
2013
Create superior customer experience
Optimize distribution
Develop superior pricing capabilities
Value Agenda
Stakeholder Value
Profitable Growth
Increase Net Cash
Customer Excellence
Operational Excellence
Capital Efficiency
VimpelCom Culture World-Class Organization
Effective Business Steering
Win in mobile data
Grow beyond the core (MFS, OTTs)
Drive cost efficiency
Optimize geographic portfolio
Increase network sharing
Optimize capital structure
4
5
6
7
8
9
1
2
3
Set performance culture
10
Clearly Defined Strategic Focus for 2013 – 2015
It’s all about creating value through execution

4
© V
impelC
om
Ltd
2013
Achieving Business Excellence
Passionate
Shared Services
Roaming Procurement
In-house Bank
Governance &
Compliance
People Management
Financial, Tax and Funding
Structure
Performance Management
Portfolio Management
Global Scope
Passion and commitment to achieve exceptional results
Admired for customer experience and operational
excellence
Empower employees to perform at the highest level
and lead with a focus on execution
Professional Leadership The VimpelCom Way
Empowered Employees and Business Units
The Operating Model

5
© V
impelC
om
Ltd
2013
Continued Profitable Growth in 1Q13 Despite Impact of Regulatory and Governmental Measures
Comparisons with 1Q12 * Net Income attributable to VimpelCom shareholders
Revenues (USD billion)
5.6 (+1% organic)
EBITDA (USD billion)
2.3 (+3% organic)
EBITDA margin (%)
42.0 (+0.9 p.p.)
Net income* (USD million)
408 (+28%)
Total mobile subscriber Base (million)
215 (+4%)
Net cash from operating activities (USD billion)
1.3 (-21%)
• 4% YoY organic revenue growth excl. MTR cuts in Italy
• 5% YoY organic EBITDA growth excl. MTR cuts in Italy
• EBITDA margin expansion due to operational excellence initiatives
• Positive operational developments continued in Russia
• Continued market outperformance in Italy
• Solid cash flow generation, impacted by temporary working capital movements
• Net Income attributable to VimpelCom shareholders increased substantially
Highlights:
6
© V
impelC
om
Ltd
2013
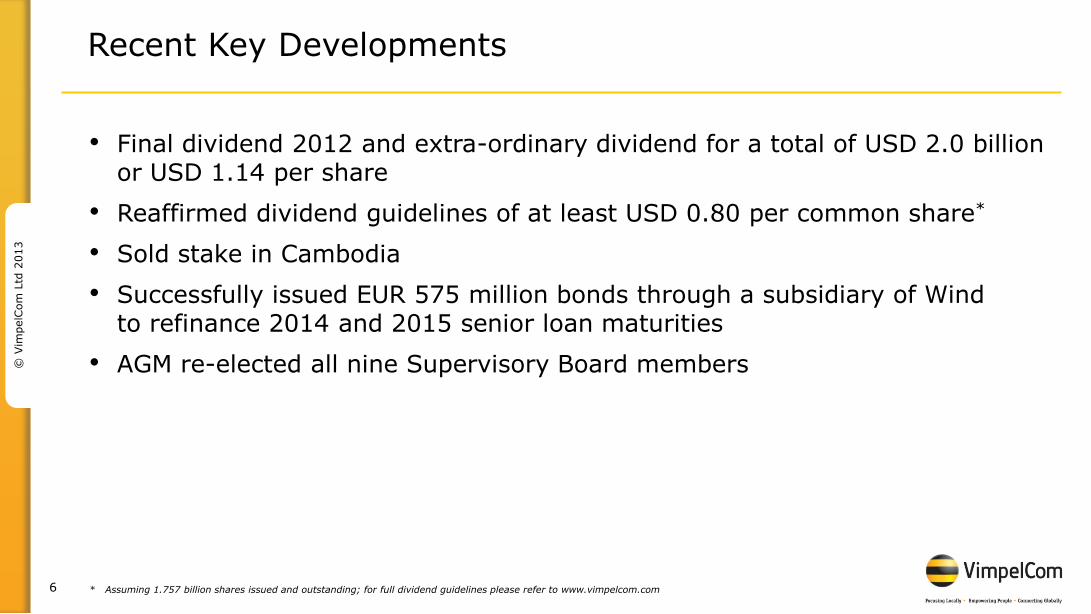
Recent Key Developments
• Final dividend 2012 and extra-ordinary dividend for a total of USD 2.0 billion or USD 1.14 per share
• Reaffirmed dividend guidelines of at least USD 0.80 per common share*
• Sold stake in Cambodia
• Successfully issued EUR 575 million bonds through a subsidiary of Wind to refinance 2014 and 2015 senior loan maturities
• AGM re-elected all nine Supervisory Board members
* Assuming 1.757 billion shares issued and outstanding; for full dividend guidelines please refer to www.vimpelcom.com
7
© V
impelC
om
Ltd
2013
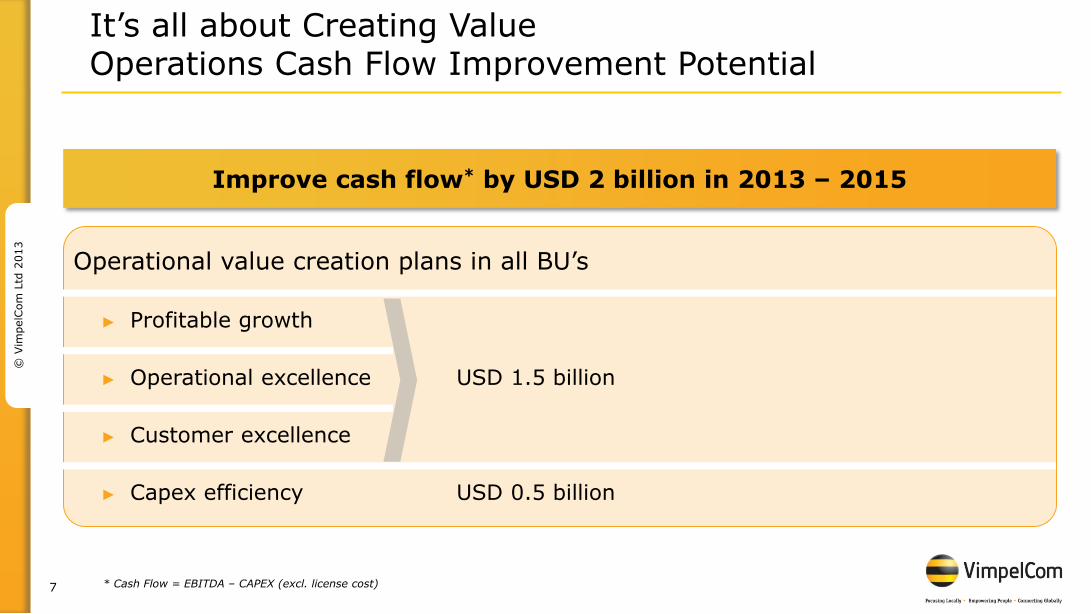
* Cash Flow = EBITDA – CAPEX (excl. license cost)
Operational value creation plans in all BU’s
► Profitable growth
► Operational excellence USD 1.5 billion
► Customer excellence
► Capex efficiency USD 0.5 billion
Improve cash flow* by USD 2 billion in 2013 – 2015
It’s all about Creating Value Operations Cash Flow Improvement Potential

8
© V
impelC
om
Ltd
2013
Average cost of new debt 100 – 150 b.p. lower
► In-house bank USD 200 – 250 million per year
► Debt optimization USD 100 – 175 million per year
► Gross debt reduction USD 250 – 350 million per year
► Withholding tax saving USD 50 – 75 million per year
Improve cash flow by USD 0.6 – 0.9 billion per year over 2013 - 2015
It’s all about Creating Value Finance Cash Flow Improvement Potential

9
© V
impelC
om
Ltd
2013
* In 2015
The above objectives assume: constant currency, no major regulatory changes, current asset portfolio mix and a stable macro economic environment
Mid single digit CAGR
Mid single digit CAGR
~ 15%*
< 2*
Group Objectives: 2013-2015
Revenue
EBITDA
CAPEX /revenue
Net debt / EBITDA
It’s all about Creating Value by Achieving Ambitious Objectives

10
© V
impelC
om
Ltd
2013
* For a full dividend guideline please refer to www.vimpelcom.com ** Operating free cash flow = net cash from operating activities minus capital expenditures
Cash Returns to Shareholders Objectives
Dividends (USD million)
Dividend guideline*
• Intention to pay a dividend that develops substantially in line with the development of operational performance
• Barring unforeseen circumstances, the Company aims to pay out a significant part of its annual operating free cash flow** to its shareholders in the form of dividends
• Precise amount and timing of dividends for a particular year will be approved by the Supervisory Board, subject to certain constraints and guidelines
• Assuming not more than 1,757 million common shares issued and outstanding
Aim to pay at least
USD 0.80 per common
share
615
2011 2012 2013
2,003
Extraordinary dividend Ordinary dividend
Per share 1,302 1,227
1,388
#shares outstanding 1.628 bn 1.628 bn 1.757 bn
0.35
2011 2012 2013
0.79
0.79 0.80

11
© V
impelC
om
Ltd
2013
On track to deliver on the Value Agenda 2013-2015
• Continued profitable growth
• Solid operational performance in businesses
• EBITDA margin expanded to 42.0%
• Top-line growth under regulatory and price pressure
• Continued focus on operational excellence and cost control to grow cash flows
1Q13 Group Objectives
2013-2015 Assumptions
Revenues +1% Mid single digit CAGR
Revenues (excl. MTR cut in Italy) +4%
EBITDA +3% Mid single digit CAGR
EBITDA (excl. MTR cut in Italy) +5%
• Constant currency basis 2012
• No major regulatory changes
• Stable macro economic environment
12
© V
impelC
om
Ltd
2013
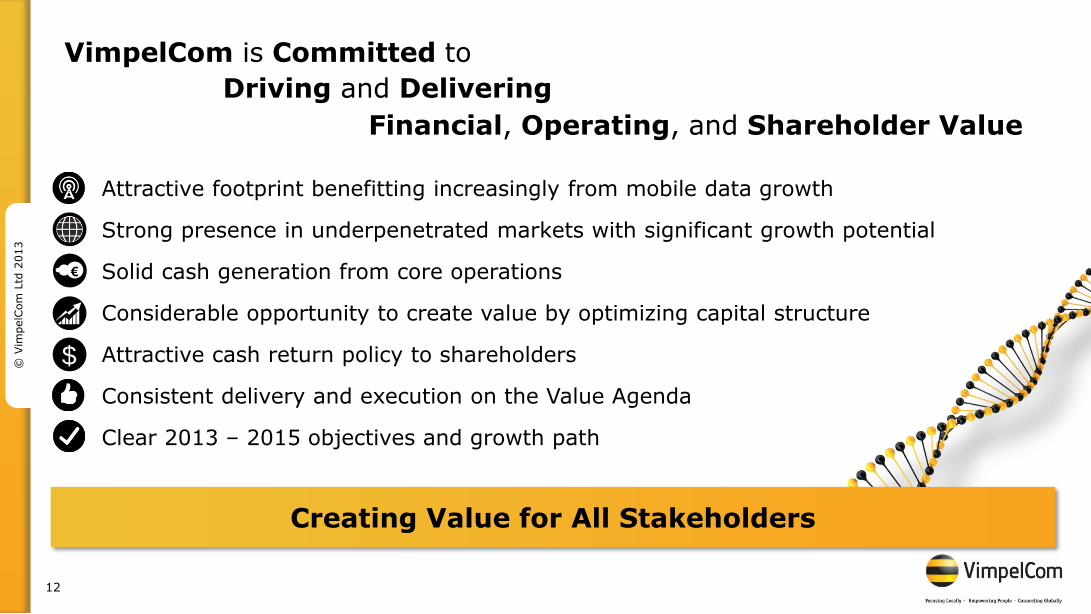
Attractive footprint benefitting increasingly from mobile data growth
Strong presence in underpenetrated markets with significant growth potential
Solid cash generation from core operations
Considerable opportunity to create value by optimizing capital structure
Attractive cash return policy to shareholders
Consistent delivery and execution on the Value Agenda
Clear 2013 – 2015 objectives and growth path
€
$
Creating Value for All Stakeholders
Financial, Operating, and Shareholder Value
VimpelCom is Committed to
Driving and Delivering

13
© V
impelC
om
Ltd
2013 Creating Value in Russia

14
© V
impelC
om
Ltd
2013
It’s all about Creating Value
• Focus on profitable growth
► Grow in mobile data
► Increase efficiencies by strong execution of the operational excellence program and efficient network roll out
• Improve customer excellence
VimpelCom‘s value creation philosophy is based on Performance Management and Empowered BU Management
What it IS about

15
© V
impelC
om
Ltd
2013
Mobile Data to Grow in Russia with 30% CAGR
Telecom market expected to grow 3.5% CAGR 2012 - 2015, mainly driven by Mobile Data
Russian Telecoms Market Dynamics*
(Revenues in RUB billion)
* Source: Company estimates
Fixed Data
Mobile voice + messaging +1%
+7%
Mobile Data +30%
Fixed Voice -3 %
2015 2014 2013 2012
261
205
334
757
245
161
345
758
229
123
358
749
213
93
370
730
+3.5% Telecom Market
CAGR, % 2012-2015
1,557 1,509
1,459 1,406
16
© V
impelC
om
Ltd
2013
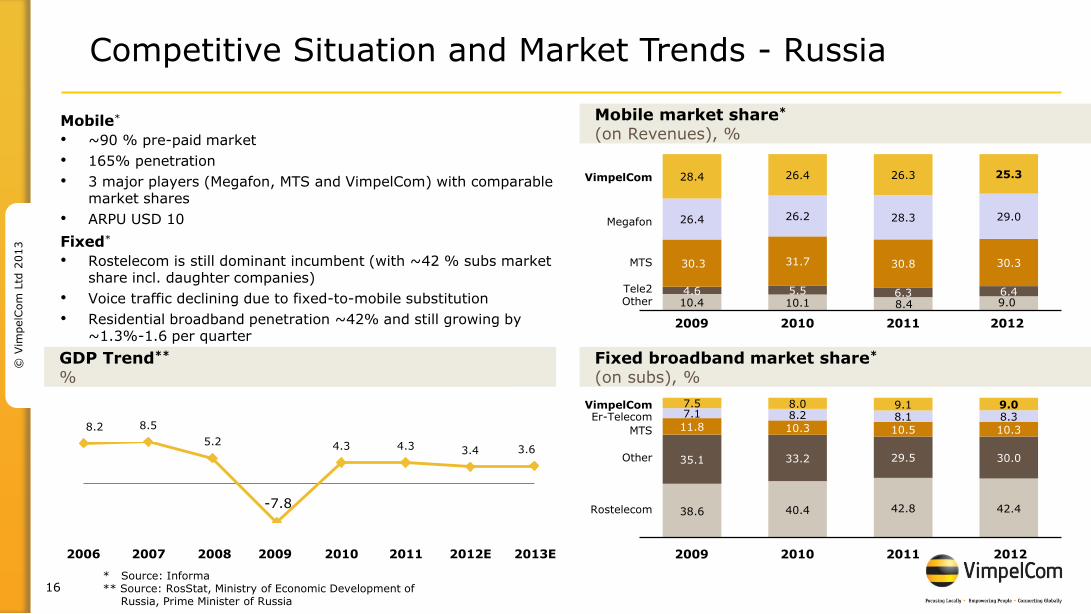
Competitive Situation and Market Trends - Russia
Mobile*
• ~90 % pre-paid market
• 165% penetration
• 3 major players (Megafon, MTS and VimpelCom) with comparable market shares
• ARPU USD 10
Fixed*
• Rostelecom is still dominant incumbent (with ~42 % subs market share incl. daughter companies)
• Voice traffic declining due to fixed-to-mobile substitution
• Residential broadband penetration ~42% and still growing by ~1.3%-1.6 per quarter
Mobile market share*
(on Revenues), %
Fixed broadband market share*
(on subs), %
* Source: Informa ** Source: RosStat, Ministry of Economic Development of
Russia, Prime Minister of Russia
10.4 10.1 8.4 9.0 4.6 5.5 6.3 6.4
30.3 31.7 30.8 30.3
26.4 26.2 28.3 29.0
28.4 26.4 26.3 25.3
MTS
Tele2 Other
2012 2011
VimpelCom
Megafon
2010 2009
38.6 40.4 42.8 42.4
35.1 33.2 29.5 30.0
11.8 10.3 10.5 10.3
7.1 8.2 8.1 8.3
7.5 8.0 9.1 9.0 VimpelCom
MTS
Er-Telecom
Rostelecom
Other
8.2 8.5
5.2 4.3 4.3 3.4 3.6
-7.8
2006
GDP Trend**
%
2007 2008 2009 2010 2011 2012E 2013E 2012 2011 2010 2009

17
© V
impelC
om
Ltd
2013
Russia Performance 1Q13: Continued Positive Operational Development
Revenues (RUB billion)
55.6 57.9 61.8 61.6 58.1
11.4 12.3 12.6 12.1 12.0
1Q12 2Q12 3Q12 4Q12 1Q13
+5% YoY
29.3
41.3% 43.1% 43.2% 41.3% 41.8%
1Q12 2Q12 3Q12 4Q12 1Q13
27.7 30.3 32.2 30.4
+6% YoY
CAPEX CAPEX / Revenue
50.7 51.3
18% 18%
FY12 1Q13 LTM
CAPEX* (RUB billion)
Highlights:
• Revenue increased 5% YoY, with 5% growth in both mobile revenues and fixed-line revenues
• Mobile data revenue grew 31% YoY in Russia and 61% YoY in Moscow, with 44% YoY improvement in small screen data revenue
• EBITDA increased 6% YoY leading to EBITDA margin growth of 0.5 p.p. YoY to 41.8%
• Continued to execute on the Operational Excellence program
• All distributors on a full revenue share model
• Quarterly churn decreased by two percentage points to 15%; still a focus area for further improvement
70.3
EBITDA EBITDA Margin Mobile Fixed-line
67.0 74.5
EBITDA and EBITDA Margin (RUB billion)
73.6 70.1
* CAPEX excluding licenses

18
© V
impelC
om
Ltd
2013
314 336
321
254
279 282 290 277
1Q12 2Q12 3Q12 4Q12 1Q13
+2% YoY ARPU +9% YoY MOU
Mobile subscribers (million)
55.6 55.7 56.2 56.1 55.7
1Q12 2Q12 3Q12 4Q12 1Q13
ARPU and MOU (RUB) (min)
ARPU MOU
flat YoY
2.2 2.3 2.3 2.4 2.4
2.6 2.5 2.5 2.7 2.7
1Q12 2Q12 3Q12 4Q12 1Q13
426 427 421 445 440
235 221 225 248 234
1Q12 2Q12 3Q12 4Q12 1Q13
Fixed broadband ARPU Mobile broadband ARPU
Operating Highlights Russia
Broadband subscribers (million)
Broadband ARPU (RUB)
+3% YoY Fixed Flat YoY Mobile
+7% YoY Fixed +5% YoY Mobile
Fixed broadband subs Mobile broadband subs
352 343

19
© V
impelC
om
Ltd
2013
Drive Cost Efficiency
Operational Excellence Initiatives continue in 2013 after strong execution in 2012
10 Strategic Initiatives Pursued to Achieve Group Objectives
Create Superior Customer Experience
Improve network quality and launched a comprehensive Customer Experience Program
Value Agenda
Stakeholder Value
Profitable Growth
Increase Net Cash
Customer Excellence
Operational Excellence
Capital Efficiency
VimpelCom Culture World-Class Organization
Effective Business Steering
4
5
6
7
8
9
1
2
3
Set performance culture 10
Optimize Distribution
Roll out self owned monobrand network, smart pricing and JV Euroset
Develop Superior Pricing Capabilities
Streamline tariff portfolio and focus on on-net and data bundles
Win in Mobile Data
Focus on small & medium screens
Grow Beyond the Core (MFS, OTTs) Partnership with Alfa Bank – RURU, active in Remote Payments, Proximity Payments and Micro Loans. Google play launched in December and Facebook partnership
Optimize geographic portfolio
Optimize capital structure
Increase Network Sharing
CAPEX optimization in 2013 as a result of network sharing and efficiency projects

20
© V
impelC
om
Ltd
2013
Example of “big ticket” levers
• Domestic acquisitions
• Outsourcing of Network maintenance
• Shared service center
• Reorganization
• Real estate sale-leaseback
Structural transformation 2011-2012
• Head count reduction (norming/delayering)
• Non-FTE Opex program
• Retail turnaround
• Customer experience program
• Payment commission
Direction and control 2012
• Continue implementation of- and secure run-rate impact from existing initiatives
• Lean in Network field force
• Lean in HQ (end to end process optimization)
• Further outsourcing
Frontline transformation (Lean) 2013-
OE 1.0 – top-down project-based change OE 2.0 – Bottom-up frontline transformation
• Front-line manager driven
• Many small levers
• Changing daily
• Continuous improvement
• Top management driven
• Few big levers
• Project-based change
• One-off step improvements
Approach: 3 waves of operational improvement journey
21
© V
impelC
om
Ltd
2013
Increased investments to significantly improve network quality
Objectives of network quality improvement program
• Targeted investments in network quality
► Increased investments (CAPEX/revenue of 22%) supported by CAPEX efficiency initiatives target to improve network quality across Russia
► Priority investments in 9 strategic regions (60% of revenue and EBITDA) and high priority clusters (94% of revenue and EBITDA)
► Special focus on quality in Moscow

22
© V
impelC
om
Ltd
2013
Momentum in 2013 3G roll out will ensure significant increase in NW quality throughout Russia
NodeBs
# 1000s
NodeBs on IP
Percent
18.7 19.4 25.3
HSPA+ support
Percent
48 55 82
27 48
79
2013 EOY
2013 Q1
2012 EOY
>2x growth
83 88 100
44
88
2013 EOY
100
2013 Q1
2012 EOY
Russia Moscow
•Russia: ~700 NodeBs launched in 1Q13 (2 times more than 1Q12)
•Moscow: Installed NodeBs increased by +21% in 1Q13 vs. 2012 EOY
•During 1Q13, average end-user data speed in Moscow region increased by >25%
Comment
Actual
Plan
•By EOY full parity in 3G data service will be reached in Moscow
23
© V
impelC
om
Ltd
2013
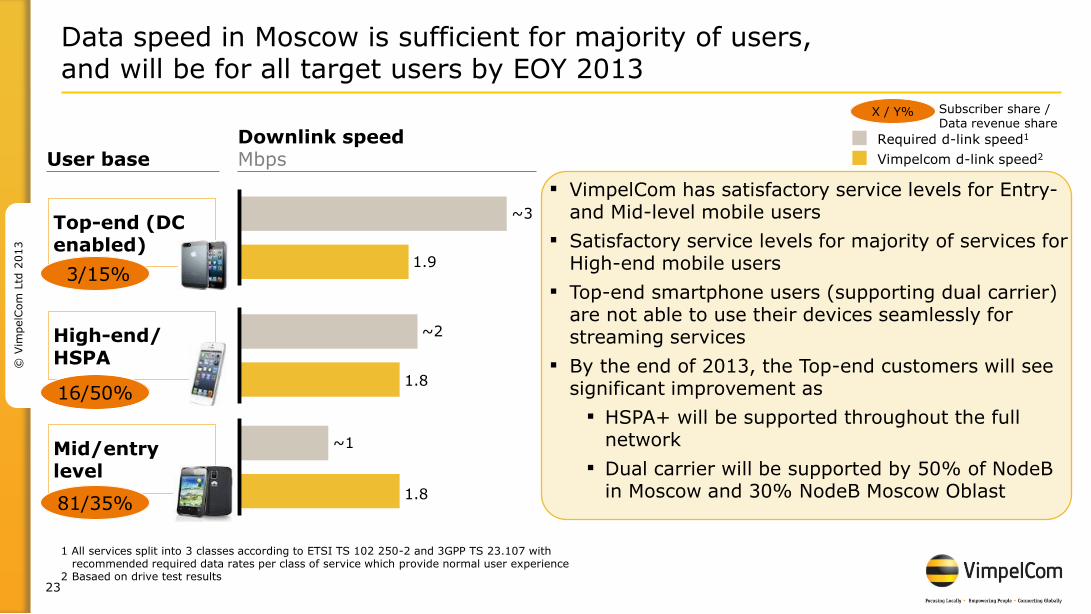
▪ VimpelCom has satisfactory service levels for Entry- and Mid-level mobile users
▪ Satisfactory service levels for majority of services for High-end mobile users
▪ Top-end smartphone users (supporting dual carrier) are not able to use their devices seamlessly for streaming services
▪ By the end of 2013, the Top-end customers will see significant improvement as
▪ HSPA+ will be supported throughout the full network
▪ Dual carrier will be supported by 50% of NodeB in Moscow and 30% NodeB Moscow Oblast
Data speed in Moscow is sufficient for majority of users, and will be for all target users by EOY 2013
1 All services split into 3 classes according to ETSI TS 102 250-2 and 3GPP TS 23.107 with recommended required data rates per class of service which provide normal user experience
2 Basaed on drive test results
1.9
~3
1.8
~2
1.8
~1
Downlink speed Mbps
Required d-link speed1
Vimpelcom d-link speed2 User base
Mid/entry level
81/35%
Top-end (DC enabled)
3/15%
High-end/ HSPA
16/50%
X / Y% Subscriber share / Data revenue share
24
© V
impelC
om
Ltd
2013
Achieving sustainable profitable growth
• Sustainable turnaround in Russia
• Catching up in network quality in 2013
• Optimize distribution to support data strategy and customer experience
• Strong growth of data revenues, targeting small and medium screens
• Focus on profitability
Creating Value in Russia
25
© V
impelC
om
Ltd
2013
Further information
Investor Relations
Claude Debussylaan 88 1082 MD Amsterdam
The Netherlands
T: +31 20 79 77 234 E: [email protected]
Install VimpelCom iPad App
Visit our new website www.vimpelcom.com

26
© V
impelC
om
Ltd
2013 Appendices
27
© V
impelC
om
Ltd
2013
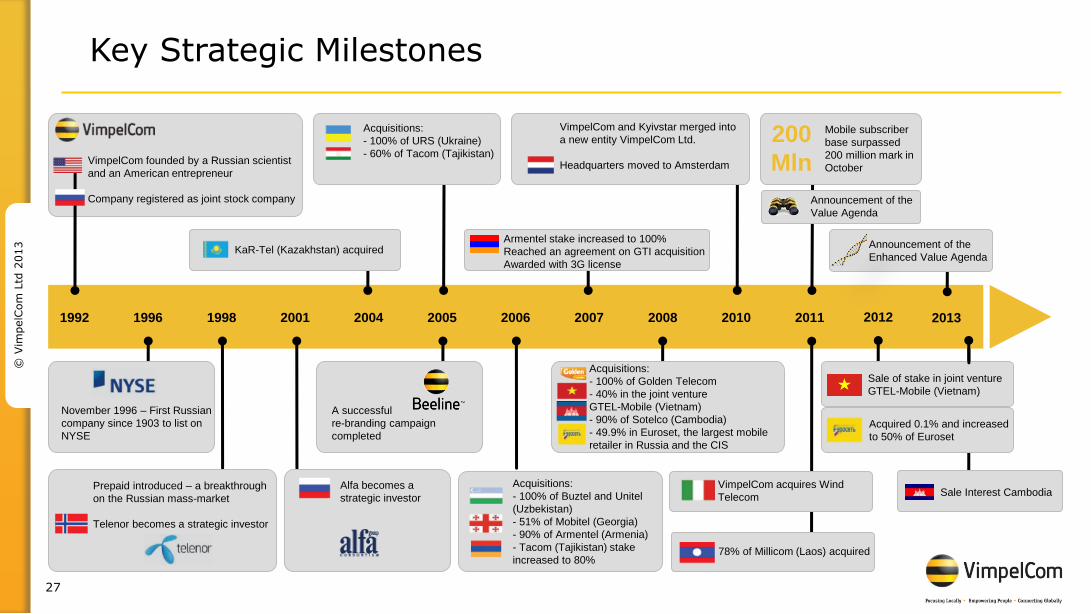
1992
VimpelCom founded by a Russian scientist
and an American entrepreneur
Company registered as joint stock company
2010
VimpelCom and Kyivstar merged into
a new entity VimpelCom Ltd.
Headquarters moved to Amsterdam
2004
KaR-Tel (Kazakhstan) acquired
1996
November 1996 – First Russian
company since 1903 to list on
NYSE
1998
Prepaid introduced – a breakthrough
on the Russian mass-market
Telenor becomes a strategic investor
2001
Alfa becomes a
strategic investor
2006
Acquisitions:
- 100% of Buztel and Unitel
(Uzbekistan)
- 51% of Mobitel (Georgia)
- 90% of Armentel (Armenia)
- Tacom (Tajikistan) stake
increased to 80%
2008
Acquisitions:
- 100% of Golden Telecom
- 40% in the joint venture
GTEL-Mobile (Vietnam)
- 90% of Sotelco (Cambodia)
- 49.9% in Euroset, the largest mobile
retailer in Russia and the CIS
2005
Acquisitions:
- 100% of URS (Ukraine)
- 60% of Tacom (Tajikistan)
A successful
re-branding campaign
completed
2007
Armentel stake increased to 100%
Reached an agreement on GTI acquisition
Awarded with 3G license
2012
Sale of stake in joint venture
GTEL-Mobile (Vietnam)
2011
VimpelCom acquires Wind
Telecom
78% of Millicom (Laos) acquired
Announcement of the
Value Agenda
Mobile subscriber
base surpassed
200 million mark in
October
200
Mln
Key Strategic Milestones
2013
Announcement of the
Enhanced Value Agenda
Acquired 0.1% and increased
to 50% of Euroset
Sale Interest Cambodia
28
© V
impelC
om
Ltd
2013
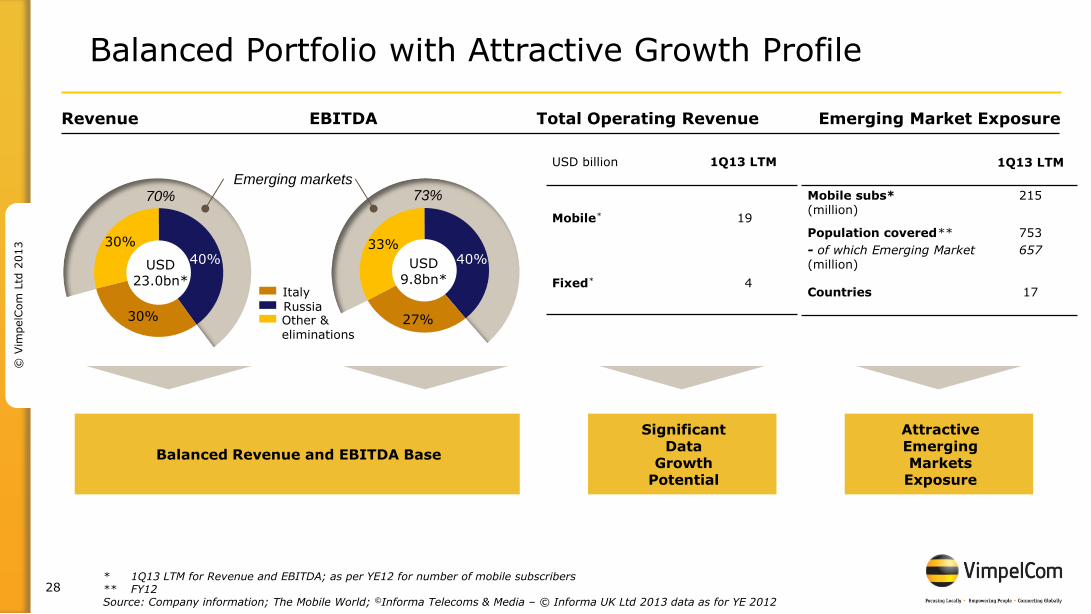
40%
1Q13 LTM
Mobile subs* (million)
215
Population covered**
- of which Emerging Market (million)
753
657
Countries 17
USD 23.0bn*
30%
40%
30%
Balanced Revenue and EBITDA Base
USD billion 1Q13 LTM
Mobile* 19
Fixed* 4
Balanced Portfolio with Attractive Growth Profile
Revenue Emerging Market Exposure Total Operating Revenue
Attractive Emerging Markets
Exposure
Significant Data
Growth Potential
USD 9.8bn*
27%
33%
Russia Italy
Other & eliminations
EBITDA
70% 73% Emerging markets
* 1Q13 LTM for Revenue and EBITDA; as per YE12 for number of mobile subscribers ** FY12 Source: Company information; The Mobile World; ©Informa Telecoms & Media – © Informa UK Ltd 2013 data as for YE 2012

29
© V
impelC
om
Ltd
2013
Strong Management Team with Empowered BU Management
Business Unit Management
Igor Lytovchenko
Ukraine
Anton Kudryashov
Russia
Ahmed Abou Doma Asia & Africa
Dmitry Kromsky
CIS
Maximo Ibarra
Italy
Group Executive Board
Jo Lunder
CEO Henk van Dalen
CFO Jan Edvard Thygesen
Deputy CEO and COO
Taras Parkhomenko
Kazakhstan

30
© V
impelC
om
Ltd
2013 VimpelCom Financials

31
© V
impelC
om
Ltd
2013
BUSINESS UNITS
Revenue EBITDA
Organic FX and others
Reported Organic FX and others
Reported
Russia 5% -1% 4% 6% -1% 5%
Italy -9% 1% -8% -5% 0% -5%
Africa & Asia -1% -6% -7% 2% -5% -3%
Ukraine 3% 0% 3% -1% 0% -1%
CIS 20% -1% 19% 38% -1% 37%
Total 1% -1% 0% 3% -1% 2%
Financial Performance 1Q13: Delivering Profitable Growth
• Overall revenue growth on an organic basis was 1% YoY (excl. MTR cuts in Italy it would have been 4% YoY)
• Reported revenues were flat YoY, mainly due to depreciation of local currencies against the USD
• EBITDA increased 3% YoY organically; reported EBITDA increased by 2% YoY supported by operational excellence initiatives (excl. MTR cuts in Italy it would have been 5% YoY)
• EBIT up 9% YoY reflecting the better operational performance and the positive impact of a declining amortization of intangible assets
• Profit before tax decreased 8% YoY due to lower foreign exchange gain in 1Q13 (USD 28 million) versus 1Q12 (USD 63 million) and higher financial income and expenses
• Net income attributable to VimpelCom shareholders increased 28% YoY as a result of higher EBIT, higher financial expenses and the favorable impact attributable to non-controlling interest
GROUP
(USD million) 1Q13 1Q12 YoY
Revenues 5,591 5,619 0%
EBITDA 2,348 2,311 2%
D&A/Other (1,241) (1,296) -4%
EBIT 1,107 1,015 9%
Financial income / expenses (501) (443) 13%
FX and Other (63) 21 n.m.
Profit before tax 543 593 -8%
Tax (213) (239) -11%
Non-controlling interest 78 (36) n.m.
Net income* 408 318 28%
* Net Income attributable to VimpelCom shareholders

32
© V
impelC
om
Ltd
2013
31%
45%
21%
3%
Well Balanced Debt Composition and Maturity Profile
During 1Q13
• Issuance of USD 2 billion Eurobonds to refinance 2013/2014 maturities of OJSC “VimpelCom” and general corporate purposes
• EKN supported Credit facility with HSBC for up to USD 0.5 billion (undrawn)
Available headroom under committed revolving credit facilities per March 2013:
• EUR 300 million (USD 385 million) for Wind
• RUB 15 billion (USD 483 million) for Russia
• EUR 205 million (USD 262 million) and USD 225 million for VIP HQ
2Q13
• Prepayment on the WIND Senior bank loan 2014 and 2015 maturities for EUR 575 million through issuance of Senior Secured Notes by Wind Acquisition Finance
Group Debt Maturity Schedule per 31 March 2013 (adjusted for recent transactions after 1Q13)
Debt Composition by Currency**
Other information
27%
49%
22%
3%
USD
EUR
RUB
Other
* 2Q13 - 4Q13 ** After effect of cross currency swaps
1Q13 4Q12
0.2
2013 2014 2015 2016 2017 2018 2019 2020 2021 2022 2023 >2023
Proceeds Eurobonds used for repayment
Wind
OTH
VimpelCom/OJSC
1.6
2.4
9.0
5.9
1.5 1.0 0.8
1.0
Issuance of SSN by Wind in April 2013
0.6 0.2
Proceeds Eurobonds used for repayment
2.2
0.4
1.2
2.7
*
33
© V
impelC
om
Ltd
2013
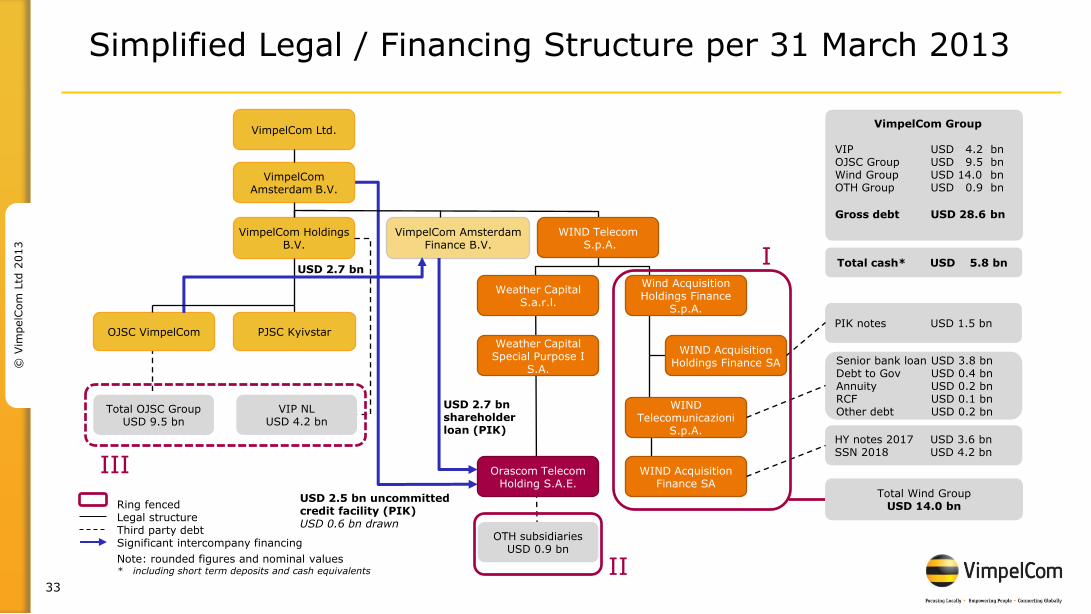
USD 2.7 bn shareholder loan (PIK)
Simplified Legal / Financing Structure per 31 March 2013
VimpelCom Ltd.
VimpelCom Amsterdam B.V.
VimpelCom Holdings B.V.
VimpelCom Amsterdam Finance B.V.
OJSC VimpelCom
USD 2.7 bn
WIND Telecom
S.p.A.
Wind Acquisition Holdings Finance
S.p.A.
WIND Acquisition
Finance SA
WIND
Telecomunicazioni S.p.A.
WIND Acquisition
Holdings Finance SA
Orascom Telecom
Holding S.A.E.
Ring fenced Legal structure Third party debt Significant intercompany financing
Note: rounded figures and nominal values * including short term deposits and cash equivalents
VIP NL USD 4.2 bn
PJSC Kyivstar
Total OJSC Group USD 9.5 bn
OTH subsidiaries USD 0.9 bn
Weather Capital Special Purpose I
S.A.
Weather Capital
S.a.r.l.
Total Wind Group USD 14.0 bn
PIK notes USD 1.5 bn
HY notes 2017 USD 3.6 bn SSN 2018 USD 4.2 bn
Senior bank loan USD 3.8 bn Debt to Gov USD 0.4 bn Annuity USD 0.2 bn RCF USD 0.1 bn Other debt USD 0.2 bn
VimpelCom Group VIP USD 4.2 bn OJSC Group USD 9.5 bn Wind Group USD 14.0 bn OTH Group USD 0.9 bn
Gross debt USD 28.6 bn
I
II
Total cash* USD 5.8 bn
USD 2.5 bn uncommitted credit facility (PIK) USD 0.6 bn drawn
III
34
© V
impelC
om
Ltd
2013
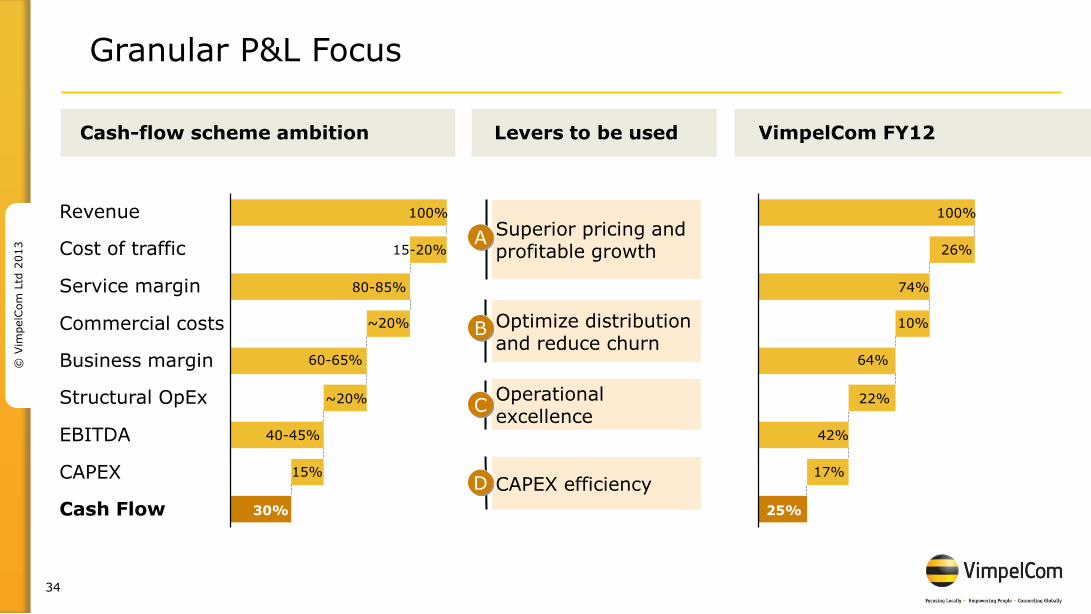
100%
Service margin
Cost of traffic
Revenue
Cash Flow
CAPEX
EBITDA
Structural OpEx
Business margin
~20%
80-85%
15-20%
30%
15%
40-45%
~20%
60-65%
Commercial costs
Cash-flow scheme ambition
Granular P&L Focus
Superior pricing and profitable growth
A
Levers to be used
Optimize distribution and reduce churn
B
Operational excellence
C
CAPEX efficiency D
VimpelCom FY12
100%
10%
74%
26%
25%
17%
42%
22%
64%

35
© V
impelC
om
Ltd
2013
Financial Standing
• Maintain BB rating short term
► Secure operating performance
► Secure cash flow upstreaming
► Gross debt to be around 3 times EBITDA maximum
• Grow to BB+ / BBB-
► Increase cash flow generation
► Deleveraging Gross Debt
• Flexible access to capital markets
• Lower cost of funding
• Moving towards < 2 times Net Debt to EBITDA Investment Grade
36
© V
impelC
om
Ltd
2013
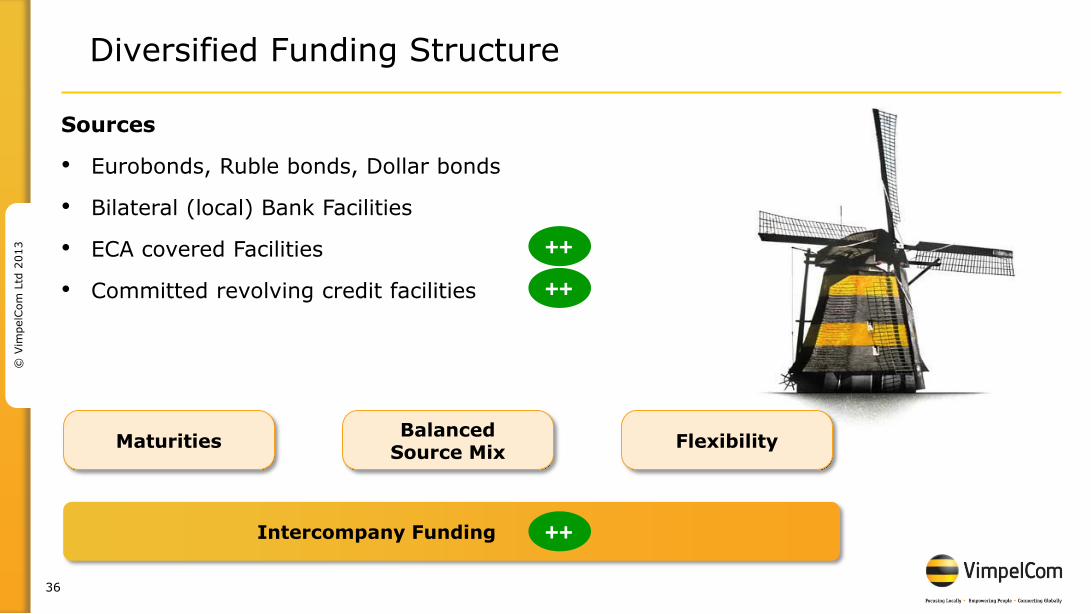
Diversified Funding Structure
Sources
• Eurobonds, Ruble bonds, Dollar bonds
• Bilateral (local) Bank Facilities
• ECA covered Facilities
• Committed revolving credit facilities
Maturities Balanced
Source Mix Flexibility
Intercompany Funding
++
++
++
37
© V
impelC
om
Ltd
2013
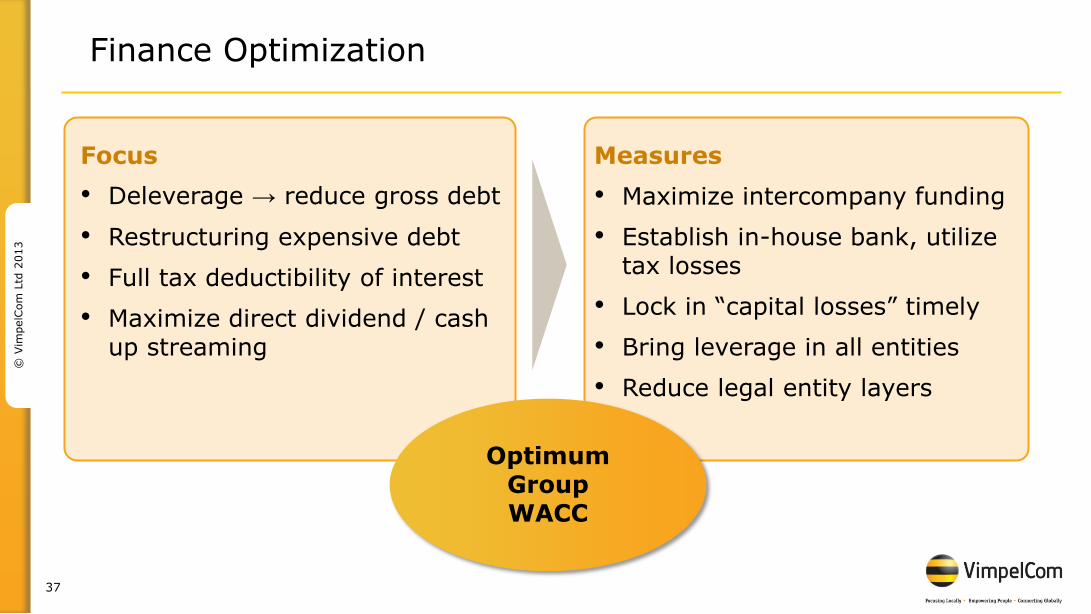
Finance Optimization
Focus
• Deleverage → reduce gross debt
• Restructuring expensive debt
• Full tax deductibility of interest
• Maximize direct dividend / cash up streaming
Optimum Group WACC
Measures
• Maximize intercompany funding
• Establish in-house bank, utilize tax losses
• Lock in “capital losses” timely
• Bring leverage in all entities
• Reduce legal entity layers

38
© V
impelC
om
Ltd
2013
Group Optimum Tax and Funding Model by 2015
VIP Ltd (NL)
Other operating entities
VIP AMS (NL)
In-house bank (LUX)
IC loan funding
External parties
Cash generating entities
Dividends
Equity Group
Debt
VIP HOL (NL)
Dividends
Dividends to
minorities
Equity
Dividends
Dividends to VIP
shareholders
Minimal
legal entity
layers
Local debt
selectively
39
© V
impelC
om
Ltd
2013
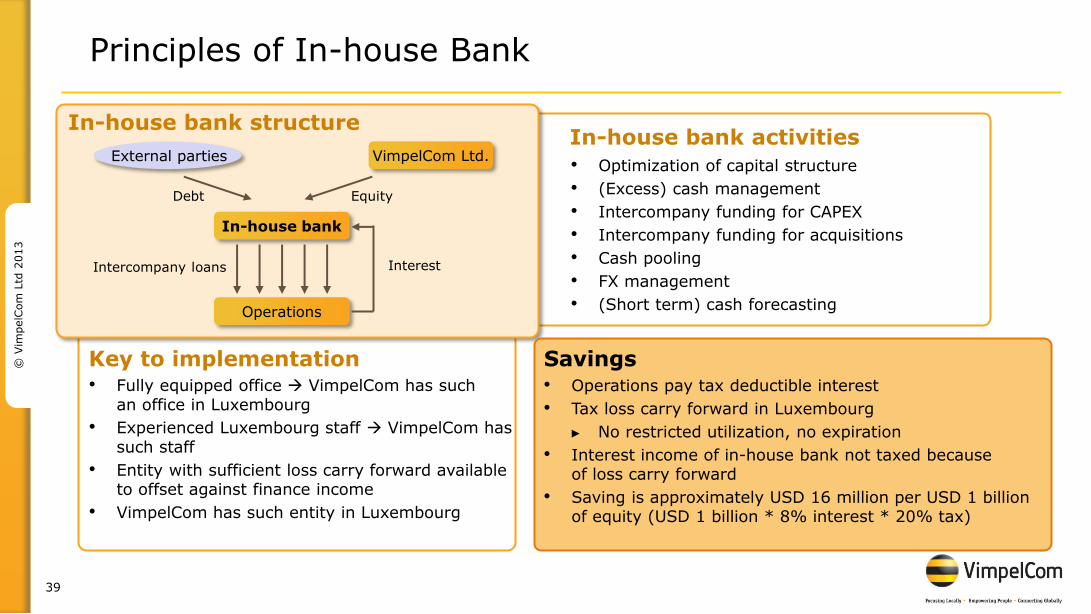
Principles of In-house Bank
Interest
Debt Equity
Savings
In-house bank structure
In-house bank
VimpelCom Ltd. External parties
Operations
Intercompany loans
• Fully equipped office VimpelCom has such an office in Luxembourg
• Experienced Luxembourg staff VimpelCom has such staff
• Entity with sufficient loss carry forward available to offset against finance income
• VimpelCom has such entity in Luxembourg
In-house bank activities
• Optimization of capital structure
• (Excess) cash management
• Intercompany funding for CAPEX
• Intercompany funding for acquisitions
• Cash pooling
• FX management
• (Short term) cash forecasting
Key to implementation • Operations pay tax deductible interest
• Tax loss carry forward in Luxembourg
► No restricted utilization, no expiration
• Interest income of in-house bank not taxed because of loss carry forward
• Saving is approximately USD 16 million per USD 1 billion of equity (USD 1 billion * 8% interest * 20% tax)
40
© V
impelC
om
Ltd
2013 Business Units Performance
1Q13
41
© V
impelC
om
Ltd
2013
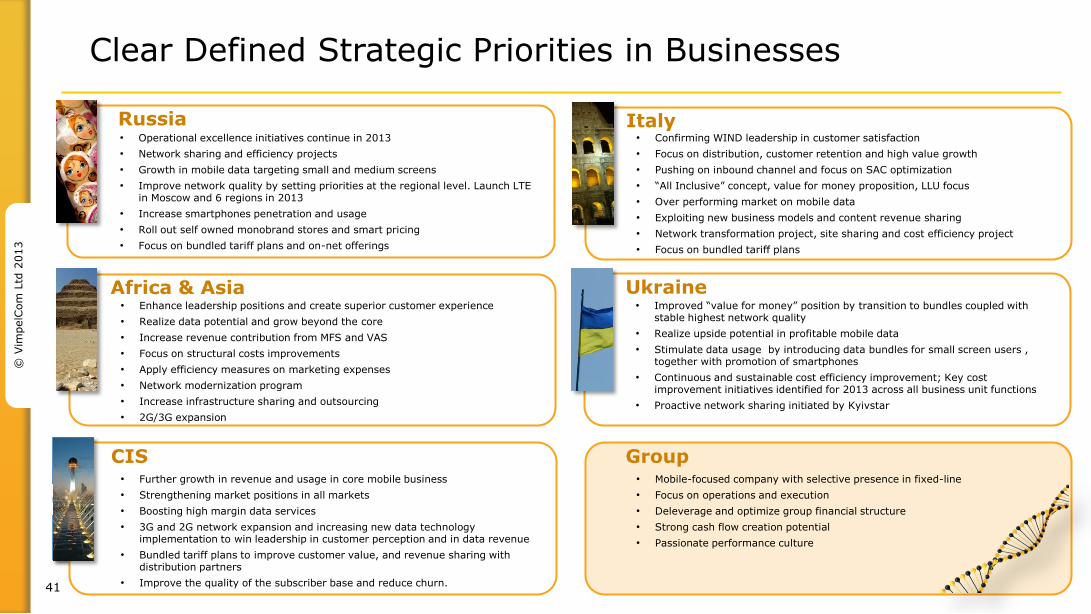
Clear Defined Strategic Priorities in Businesses
• Operational excellence initiatives continue in 2013
• Network sharing and efficiency projects
• Growth in mobile data targeting small and medium screens
• Improve network quality by setting priorities at the regional level. Launch LTE in Moscow and 6 regions in 2013
• Increase smartphones penetration and usage
• Roll out self owned monobrand stores and smart pricing
• Focus on bundled tariff plans and on-net offerings
Russia
Ukraine • Improved “value for money” position by transition to bundles coupled with
stable highest network quality
• Realize upside potential in profitable mobile data
• Stimulate data usage by introducing data bundles for small screen users , together with promotion of smartphones
• Continuous and sustainable cost efficiency improvement; Key cost improvement initiatives identified for 2013 across all business unit functions
• Proactive network sharing initiated by Kyivstar
CIS • Further growth in revenue and usage in core mobile business
• Strengthening market positions in all markets
• Boosting high margin data services
• 3G and 2G network expansion and increasing new data technology implementation to win leadership in customer perception and in data revenue
• Bundled tariff plans to improve customer value, and revenue sharing with distribution partners
• Improve the quality of the subscriber base and reduce churn.
Africa & Asia • Enhance leadership positions and create superior customer experience
• Realize data potential and grow beyond the core
• Increase revenue contribution from MFS and VAS
• Focus on structural costs improvements
• Apply efficiency measures on marketing expenses
• Network modernization program
• Increase infrastructure sharing and outsourcing
• 2G/3G expansion
Italy • Confirming WIND leadership in customer satisfaction
• Focus on distribution, customer retention and high value growth
• Pushing on inbound channel and focus on SAC optimization
• “All Inclusive” concept, value for money proposition, LLU focus
• Over performing market on mobile data
• Exploiting new business models and content revenue sharing
• Network transformation project, site sharing and cost efficiency project
• Focus on bundled tariff plans
• Mobile-focused company with selective presence in fixed-line
• Focus on operations and execution
• Deleverage and optimize group financial structure
• Strong cash flow creation potential
• Passionate performance culture
Group

42
© V
impelC
om
Ltd
2013
Ukraine
Revenues + 3% UAH 3.2 bn EBITDA margin 49.0% EBITDA - 1% UAH 1.6 bn
Mobile Sub + 11% 28 mln
Mobile ARPU - 6% UAH 35
Algeria
Revenues - 1% DZD 34 bn EBITDA margin 59.2% EBITDA - 2% DZD 20 bn
Mobile Sub + 1% 18 mln
Mobile ARPU - 4% DZD 630
Business Dashboard 1Q13
Russia
Kazakhstan
Pakistan
Revenues + 5% RUB 70.1 bn EBITDA margin 41.8% EBITDA + 6% RUB 29.3 bn
Mobile Sub 0% 56 mln
Mobile ARPU + 2% RUB 321
Revenues + 1% KZT 28.7 bn EBITDA margin 46.7% EBITDA + 5% KZT 13.4 bn
Mobile Sub + 2% 9 mln
Mobile ARPU - 3% KZT 1,012
Bangladesh
Italy
Revenues + 5% PKR 27 bn EBITDA margin 42.3% EBITDA +5% PKR 12 bn
Mobile Sub + 1% 36 mln
Mobile ARPU + 2% PKR 244
Revenues - 13% BDT 9 bn EBITDA margin 41.3% EBITDA + 5% BDT 4 bn
Mobile Sub + 5% 26 mln
Mobile ARPU - 18% BDT 119
Revenues - 9% +1%* EUR 1.2 bn EBITDA margin 37.5% EBITDA - 5% +2%* EUR 0.5 bn
Mobile Sub + 4% 22 mln
Mobile ARPU -16% EUR 12
* Excluding MTR impact

43
© V
impelC
om
Ltd
2013
487 524 537 514
461
36.2% 37.9% 40.4% 37.5% 37.5%
1Q12 2Q12 3Q12 4Q12 1Q13
851 875 891 922 838
132 140 68 78 50
363 368 370 369 341
1Q12 2Q12 3Q12 4Q12 1Q13
Italy Performance 1Q13: Continued Market Outperformance
Total Revenues (EUR million)
-9% YoY Excluding MTR +1% YoY
EBITDA and EBITDA Margin (EUR million)
-5% YoY Excluding MTR +2% YoY
CAPEX* (EUR billion)
Highlights:
• Revenues increased 1% YoY, excluding MTR impact
• EBITDA up 2% YoY, excluding MTR impact, supported by cost efficiency
• Strong data revenue growth: mobile Internet up 29%, messaging up 5%, fixed broadband up 9%
• Mobile subscribers exceeded 22 million; 100% of all net additions in the market
• OPEX and CAPEX savings initiatives being implemented to protect cash flows
Mobile revenues (excluding Incoming)
Mobile Incoming revenues
Fixed-line
0.9 0.9
17% 17%
FY12 1Q13 LTM**
CAPEX CAPEX / Revenue
1,383
EBITDA EBITDA Margin
1,346 1,329 1,369 1,229
* CAPEX excluding licenses ** CAPEX exludes EUR 136 million of non-cash increase in Intangible Assets related to the contract with Terna in
relation to the Right of Way of WIND’s backbone

44
© V
impelC
om
Ltd
2013
-16% YoY ARPU +5% YoY MOU
Operating Highlights Italy
+4% YoY
Fixed broadband subs Mobile broadband subs
Broadband subscribers* (thousands)
Broadband ARPU (EUR)
+7% YoY +1% YoY Fixed +39% YoY Mobile
* Mobile broadband includes consumer customers that have performed at least one mobile Internet event in the previous month on 2.5G/3G/3.5G network technology
21.1 21.2 21.5
21.6
22.0
1Q12 2Q12 3Q12 4Q12 1Q13
14.7 15.0 14.0 13.7 12.4
205 209 202 212 216
1Q12 2Q12 3Q12 4Q12 1Q13
4,525 4,444 4,734 5,541
6,277
2,211 2,236 2,216 2,210
2,228
1Q12 2Q12 3Q12 4Q12 1Q13
18.9 18.5 18.7 19.1 20.2
1Q12 2Q12 3Q12 4Q12 1Q13
Mobile subscribers (million)
ARPU and MOU (EUR) (min)
ARPU MOU
Fixed broadband ARPU
45
© V
impelC
om
Ltd
2013
424 466
424 426 412
45.7% 48.9% 46.9% 45.5% 47.7%
1Q12 2Q12 3Q12 4Q12 1Q13
927 953 904 937 864
1Q12 2Q12 3Q12 4Q12 1Q13
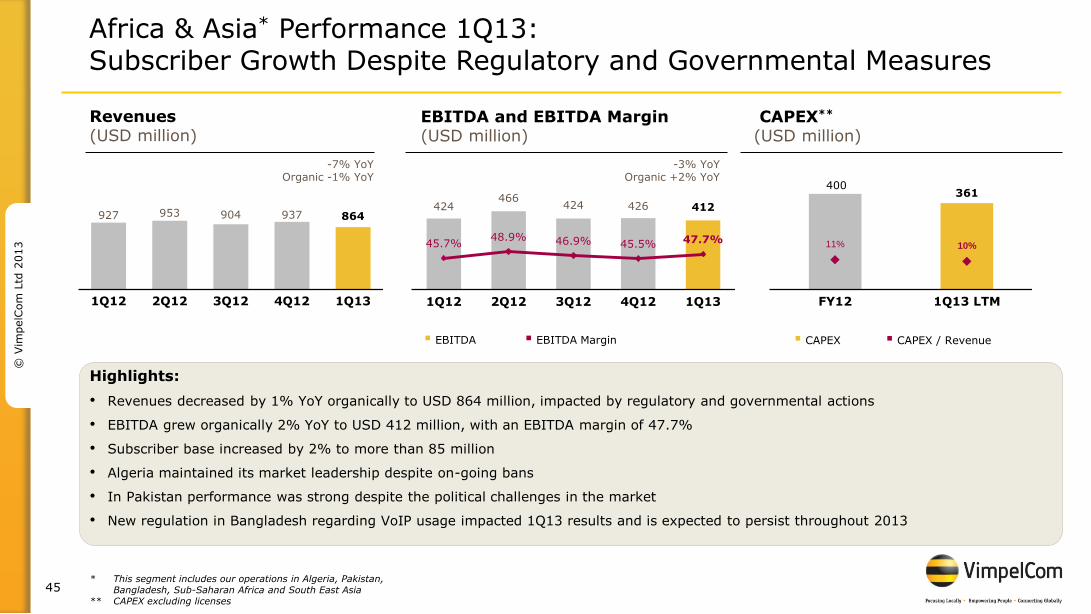
Africa & Asia* Performance 1Q13: Subscriber Growth Despite Regulatory and Governmental Measures
Revenues (USD million)
-7% YoY Organic -1% YoY
EBITDA and EBITDA Margin (USD million)
EBITDA EBITDA Margin
-3% YoY Organic +2% YoY
CAPEX** (USD million)
Highlights:
• Revenues decreased by 1% YoY organically to USD 864 million, impacted by regulatory and governmental actions
• EBITDA grew organically 2% YoY to USD 412 million, with an EBITDA margin of 47.7%
• Subscriber base increased by 2% to more than 85 million
• Algeria maintained its market leadership despite on-going bans
• In Pakistan performance was strong despite the political challenges in the market
• New regulation in Bangladesh regarding VoIP usage impacted 1Q13 results and is expected to persist throughout 2013
400 361
11% 10%
FY12 1Q13 LTM
* This segment includes our operations in Algeria, Pakistan, Bangladesh, Sub-Saharan Africa and South East Asia ** CAPEX excluding licenses
CAPEX CAPEX / Revenue
46
© V
impelC
om
Ltd
2013
20.6 21.6 21.2 21.8 20.2
60.0% 60.3% 58.3% 59.0% 59.2%
1Q12 2Q12 3Q12 4Q12 1Q13
34.3 35.8 36.2 37.0 34.1
1Q12 2Q12 3Q12 4Q12 1Q13
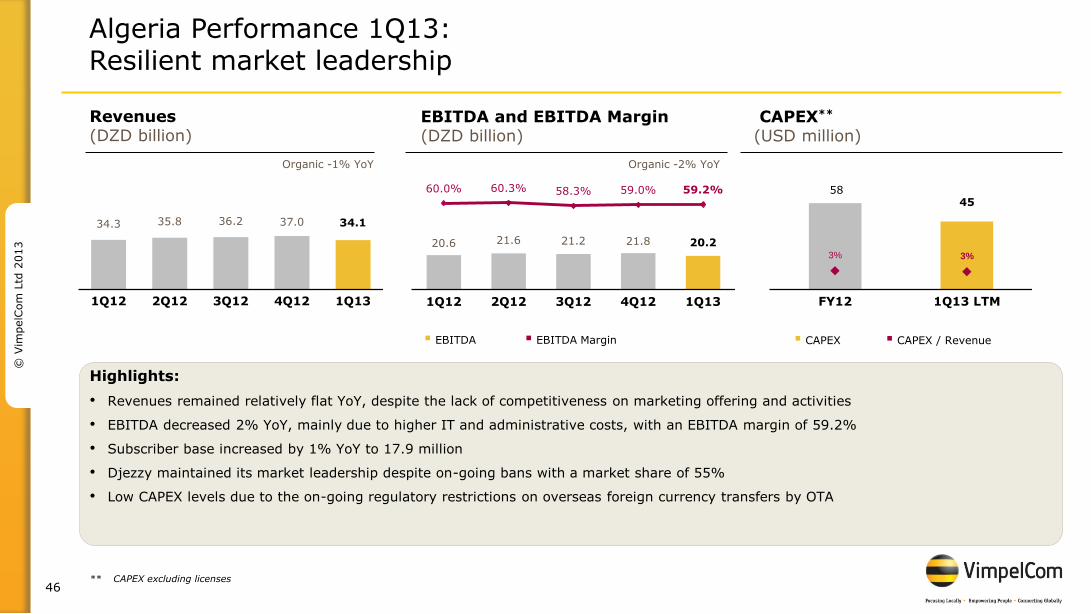
Algeria Performance 1Q13: Resilient market leadership
Revenues (DZD billion)
Organic -1% YoY
EBITDA and EBITDA Margin (DZD billion)
EBITDA EBITDA Margin
Organic -2% YoY
CAPEX** (USD million)
Highlights:
• Revenues remained relatively flat YoY, despite the lack of competitiveness on marketing offering and activities
• EBITDA decreased 2% YoY, mainly due to higher IT and administrative costs, with an EBITDA margin of 59.2%
• Subscriber base increased by 1% YoY to 17.9 million
• Djezzy maintained its market leadership despite on-going bans with a market share of 55%
• Low CAPEX levels due to the on-going regulatory restrictions on overseas foreign currency transfers by OTA
58 45
3% 3%
FY12 1Q13 LTM
** CAPEX excluding licenses
CAPEX CAPEX / Revenue
47
© V
impelC
om
Ltd
2013
25.9 27.2 25.5 27.2 27.2
1Q12 2Q12 3Q12 4Q12 1Q13
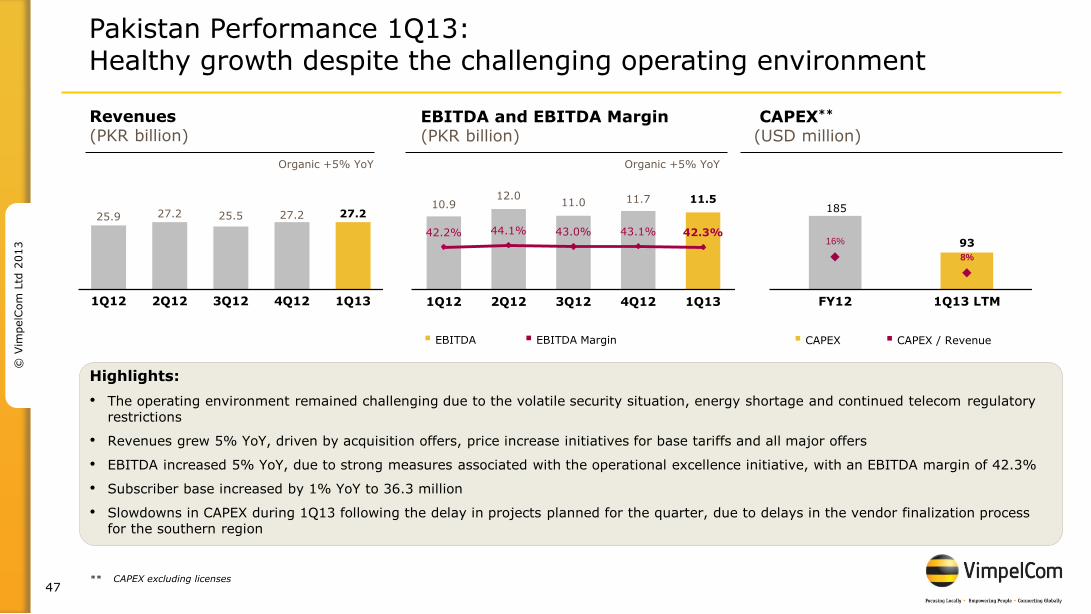
Pakistan Performance 1Q13: Healthy growth despite the challenging operating environment
Revenues (PKR billion)
Organic +5% YoY
EBITDA and EBITDA Margin (PKR billion)
EBITDA EBITDA Margin
Organic +5% YoY
CAPEX** (USD million)
Highlights:
• The operating environment remained challenging due to the volatile security situation, energy shortage and continued telecom regulatory restrictions
• Revenues grew 5% YoY, driven by acquisition offers, price increase initiatives for base tariffs and all major offers
• EBITDA increased 5% YoY, due to strong measures associated with the operational excellence initiative, with an EBITDA margin of 42.3%
• Subscriber base increased by 1% YoY to 36.3 million
• Slowdowns in CAPEX during 1Q13 following the delay in projects planned for the quarter, due to delays in the vendor finalization process for the southern region
185
93 16%
8%
FY12 1Q13 LTM
** CAPEX excluding licenses
CAPEX CAPEX / Revenue
10.9 12.0
11.0 11.7 11.5
42.2% 44.1% 43.0% 43.1% 42.3%
1Q12 2Q12 3Q12 4Q12 1Q13
48
© V
impelC
om
Ltd
2013
10.7 11.6 11.8 11.2 9.3
1Q12 2Q12 3Q12 4Q12 1Q13
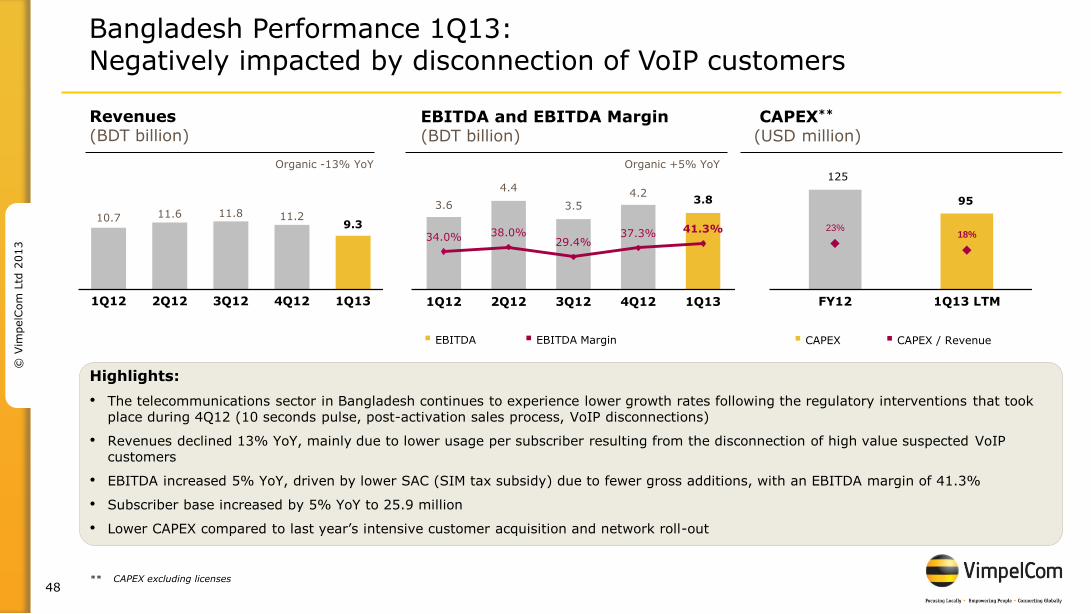
Bangladesh Performance 1Q13: Negatively impacted by disconnection of VoIP customers
Revenues (BDT billion)
Organic -13% YoY
EBITDA and EBITDA Margin (BDT billion)
EBITDA EBITDA Margin
Organic +5% YoY
CAPEX** (USD million)
Highlights:
• The telecommunications sector in Bangladesh continues to experience lower growth rates following the regulatory interventions that took place during 4Q12 (10 seconds pulse, post-activation sales process, VoIP disconnections)
• Revenues declined 13% YoY, mainly due to lower usage per subscriber resulting from the disconnection of high value suspected VoIP customers
• EBITDA increased 5% YoY, driven by lower SAC (SIM tax subsidy) due to fewer gross additions, with an EBITDA margin of 41.3%
• Subscriber base increased by 5% YoY to 25.9 million
• Lower CAPEX compared to last year’s intensive customer acquisition and network roll-out
125
95
23% 18%
FY12 1Q13 LTM
** CAPEX excluding licenses
CAPEX CAPEX / Revenue
3.6
4.4
3.5 4.2
3.8
34.0% 38.0% 29.4%
37.3% 41.3%
1Q12 2Q12 3Q12 4Q12 1Q13

49
© V
impelC
om
Ltd
2013
1.6 1.6 1.8 1.8
1.6
51.1% 50.2% 51.2% 52.5% 49.0%
1Q12 2Q12 3Q12 4Q12 1Q13
2.8 3.0 3.3 3.2 2.9
0.2 0.3 0.3 0.3
0.3
1Q12 2Q12 3Q12 4Q12 1Q13
Thousands
Ukraine Performance 1Q13: Migration to Bundled Offerings Completed
Revenues (UAH billion)
+3% YoY
EBITDA and EBITDA Margin (UAH billion)
-1% YoY
CAPEX* (UAH billion)
Highlights:
• Revenues increased 3% YoY to UAH 3.2 billion, supported by growth of fixed broadband
• Mobile data revenues up 8% YoY
• EBITDA declined 1% YoY to UAH 1.6 billion; EBITDA margin of 49.0%, primarily due to higher costumer acquisition costs resulting from strong mobile subscriber growth
• Mobile subscriber base grew 11% YoY to 27.5 million
1.8 1.8
14% 14%
FY12 1Q13 LTM
CAPEX CAPEX / Revenue
3.0 3.2 3.6
EBITDA EBITDA Margin Mobile Fixed-line
3.2 3.5
* CAPEX excluding licenses

50
© V
impelC
om
Ltd
2013
342 372 440 449 412
36 39
38 38 38
1Q12 2Q12 3Q12 4Q12 1Q13
161 182
234 235 220
42.4% 44.3%
49.0% 48.1% 48.8%
1Q12 2Q12 3Q12 4Q12 1Q13
CIS* Performance 1Q13: Profitable Growth
Revenues (USD million)
411 378
+19% YoY Organic +20% YoY
478
EBITDA and EBITDA Margin (USD million)
+37% YoY Organic +38% YoY
CAPEX CAPEX / Revenue
CAPEX** (USD million)
Highlights:
• Revenues organic growth of 20% YoY, with strong positive impact from Uzbekistan
• EBITDA reached USD 220 million, with organic growth of 38% YoY
• EBITDA margin expanded 6.4 p.p. to 48.8%
• Mobile subscribers increased 16% YoY to 24 million
• Mobile data subscriber base grew 28% YoY to 12.6 million
• Organic growth of revenues and EBITDA would have been respectively 7% and 6% YoY normalizing Uzbekistan to the growth level of 1H12
EBITDA EBITDA Margin
384 413
22% 23%
FY12 1Q13 LTM
Mobile Fixed-line
* This segment includes our operations in Kazakhstan, Uzbekistan, Armenia, Kyrgyzstan,
Tajikistan and Georgia
** CAPEX excluding licenses
451 488

51
© V
impelC
om
Ltd
2013
26.5 28.7 30.6 29.8 26.1
1.8 2.0 2.1 2.3
2.5
1Q12 2Q12 3Q12 4Q12 1Q13
12.7 14.5
16.8 14.8
13.4
45.0% 47.0%
51.6%
46.2% 46.7%
1Q12 2Q12 3Q12 4Q12 1Q13
Kazakhstan Performance 1Q13: Improving EBITDA margin in a highly competitive market
Revenues (KZT billion)
30.7 28.2
flat YoY Organic +1% YoY
32.6
EBITDA and EBITDA Margin (KZT billion)
+3% YoY Organic +5% YoY
CAPEX CAPEX / Revenue
CAPEX** (KZT billion)
Highlights:
• Revenues organic growth of 1% YoY, due to a 1% decline in mobile service revenues, which was offset by strong fixed line revenue growth
• Mobile data revenues increased 38% YoY, as a result of the Company´s focus on increasing data usage for small screens
• EBITDA reached KZT 13.4 billion, with organic growth of 5% YoY
• EBITDA margin expanded 1.7 p.p. to 46.7%
• Mobile Termination Rates cut by 15% in 2013
• VimpelCom is transitioning its subscriber base to bundled tariff plans to solidify its market position
EBITDA EBITDA Margin
24.8
26.7
20% 22%
FY12 1Q13 LTM
Mobile Fixed-line
** CAPEX excluding licenses
28.6 32.1
52
© V
impelC
om
Ltd
2013
76.6 87.1 135.0 156.4 155.3 2.1 2.2
2.0 2.0 1.9
1Q12 2Q12 3Q12 4Q12 1Q13
35 45
77
95 102
44.6%
50.6% 56.2%
60.3% 65.2%
1Q12 2Q12 3Q12 4Q12 1Q13
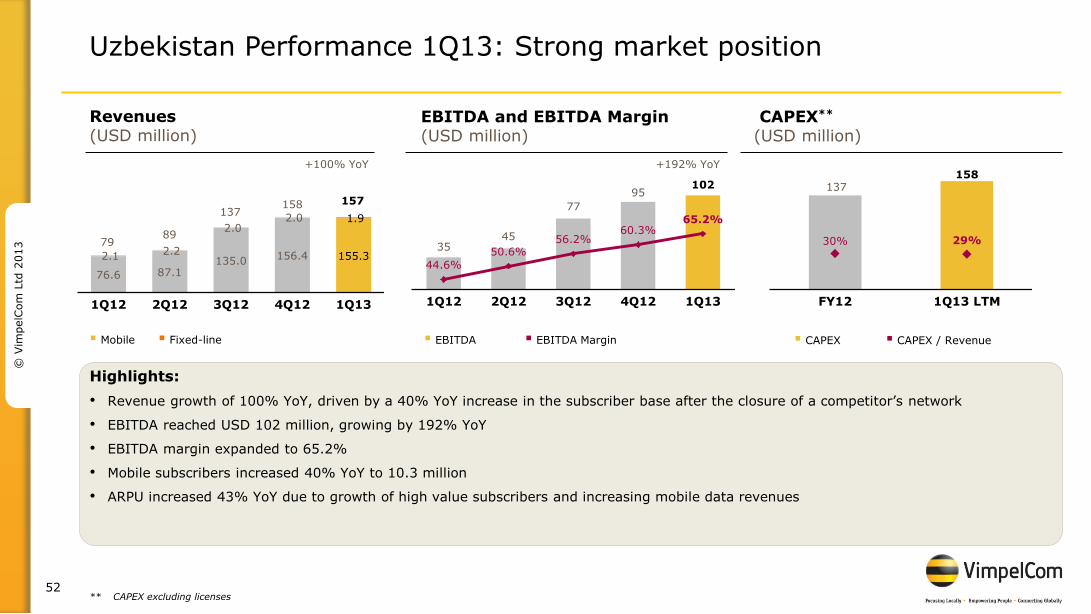
Uzbekistan Performance 1Q13: Strong market position
Revenues (USD million)
89 79
+100% YoY
137
EBITDA and EBITDA Margin (USD million)
+192% YoY
CAPEX CAPEX / Revenue
CAPEX** (USD million)
Highlights:
• Revenue growth of 100% YoY, driven by a 40% YoY increase in the subscriber base after the closure of a competitor’s network
• EBITDA reached USD 102 million, growing by 192% YoY
• EBITDA margin expanded to 65.2%
• Mobile subscribers increased 40% YoY to 10.3 million
• ARPU increased 43% YoY due to growth of high value subscribers and increasing mobile data revenues
EBITDA EBITDA Margin
137 158
30% 29%
FY12 1Q13 LTM
Mobile Fixed-line
** CAPEX excluding licenses
157 158

53
© V
impelC
om
Ltd
2013 BU’s market overviews
54
© V
impelC
om
Ltd
2013
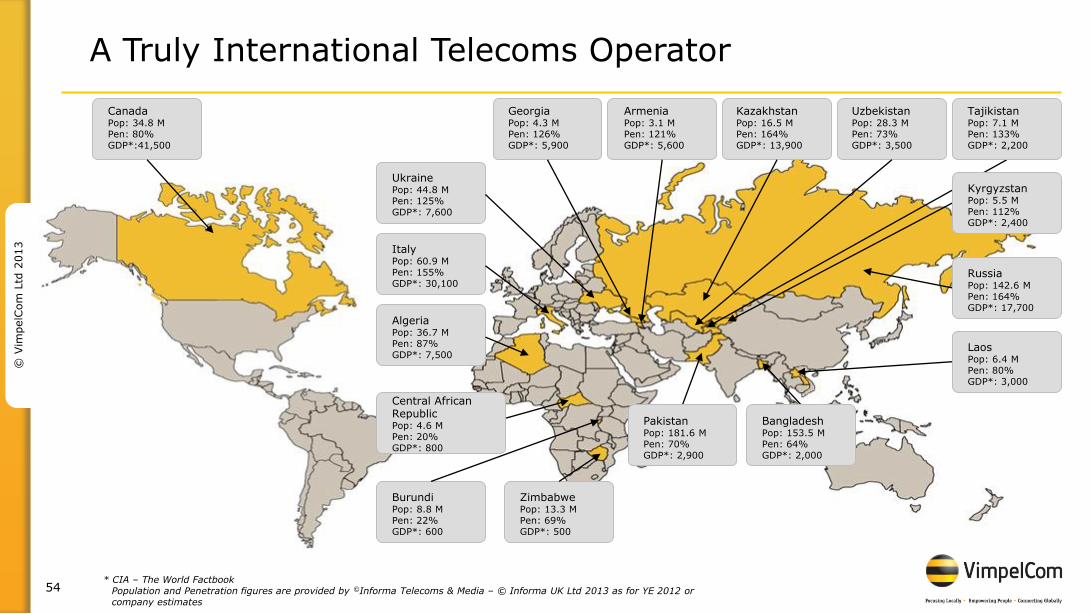
A Truly International Telecoms Operator
Canada Pop: 34.8 M Pen: 80% GDP*:41,500
Tajikistan Pop: 7.1 M Pen: 133% GDP*: 2,200
Uzbekistan Pop: 28.3 M Pen: 73% GDP*: 3,500
Kazakhstan Pop: 16.5 M Pen: 164% GDP*: 13,900
Armenia Pop: 3.1 M Pen: 121% GDP*: 5,600
Georgia Pop: 4.3 M Pen: 126% GDP*: 5,900
Ukraine Pop: 44.8 M Pen: 125% GDP*: 7,600
Italy Pop: 60.9 M Pen: 155% GDP*: 30,100
Algeria Pop: 36.7 M Pen: 87% GDP*: 7,500
Burundi Pop: 8.8 M Pen: 22% GDP*: 600
Zimbabwe Pop: 13.3 M Pen: 69% GDP*: 500
Central African Republic Pop: 4.6 M Pen: 20% GDP*: 800
Kyrgyzstan Pop: 5.5 M Pen: 112% GDP*: 2,400
Russia Pop: 142.6 M Pen: 164% GDP*: 17,700
Laos Pop: 6.4 M Pen: 80% GDP*: 3,000
Bangladesh Pop: 153.5 M Pen: 64% GDP*: 2,000
Pakistan Pop: 181.6 M Pen: 70% GDP*: 2,900
* CIA – The World Factbook Population and Penetration figures are provided by ©Informa Telecoms & Media – © Informa UK Ltd 2013 as for YE 2012 or company estimates
55
© V
impelC
om
Ltd
2013
56.4 53.9 52.9 51.9
7.5 6.9 6.4 6.1
13.2 12.9 11.8 13.1
9.7 11.9 13.1 12.6
13.2 14.4 15.8 16.3
2009 2010 2011 2012
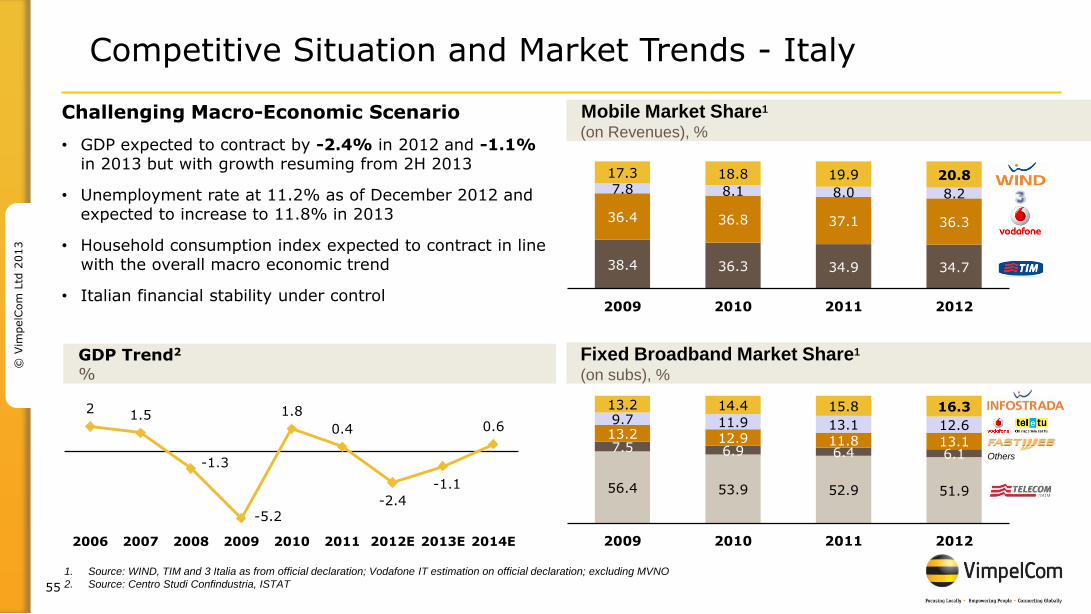
Challenging Macro-Economic Scenario
• GDP expected to contract by -2.4% in 2012 and -1.1% in 2013 but with growth resuming from 2H 2013
• Unemployment rate at 11.2% as of December 2012 and expected to increase to 11.8% in 2013
• Household consumption index expected to contract in line with the overall macro economic trend
• Italian financial stability under control
1. Source: WIND, TIM and 3 Italia as from official declaration; Vodafone IT estimation on official declaration; excluding MVNO
2. Source: Centro Studi Confindustria, ISTAT
Mobile Market Share1
(on Revenues), %
Fixed Broadband Market Share1
(on subs), %
Others
Competitive Situation and Market Trends - Italy
38.4 36.3 34.9 34.7
36.4 36.8 37.1 36.3
7.8 8.1 8.0 8.2
17.3 18.8 19.9 20.8
2009 2010 2011 2012
2 1.5
-1.3
-5.2
1.8
0.4
-2.4
-1.1
0.6
2006 2007 2008 2009 2010 2011 2012E 2013E 2014E
GDP Trend2
%

56
© V
impelC
om
Ltd
2013
Competitive Situation – Africa and Asia
Bangladesh: • In a large market with low penetration
levels, banglalink is one of the fastest growing operator in a rapidly-growing market with strong focus on increasing value share
• Major competitors: Grameephone, Robi, Airtel, CityCell, TeleTalk
Algeria • Despite limitations, Djezzy remains a
profitable market leader with tremendous data potential
• Major competitors: ATM, Nedjma
Mobile subscriber developments VIP (million)
Revenue developments VIP (USD million)
EBITDA and margin VIP (USD million & percentage, %)
Sub Saharan Africa:
• Leading positions in markets with low penetration levels, healthy APPM, and high growth potential. Internet is a mobile story in Africa.
South-East Asia:
• Highly competitive markets offering growth potential
891948 954
913 918953
904937
864
1Q11 2Q11 3Q11 4Q11 1Q12 2Q12 3Q12 4Q12 1Q13
404 413446
335
428466
424 426 412
45.3% 43.6% 46.8%
36.7%
46.6% 48.9% 46.9% 45.5% 47.7%
1Q11 2Q11 3Q11 4Q11 1Q12 2Q12 3Q12 4Q12 1Q13
72.2 73.7 76.079.1
83.3 84.4 86.1 85.2 85.1
1Q11 2Q11 3Q11 4Q11 1Q12 2Q12 3Q12 4Q12 1Q13
Pakistan: • Mobilink leads the maturing market, and
with a large customer base has great potential for revenue enhancement through data and VAS uptake
• Major competitors: Telenor, Ufone, Zong, Warid
57
© V
impelC
om
Ltd
2013
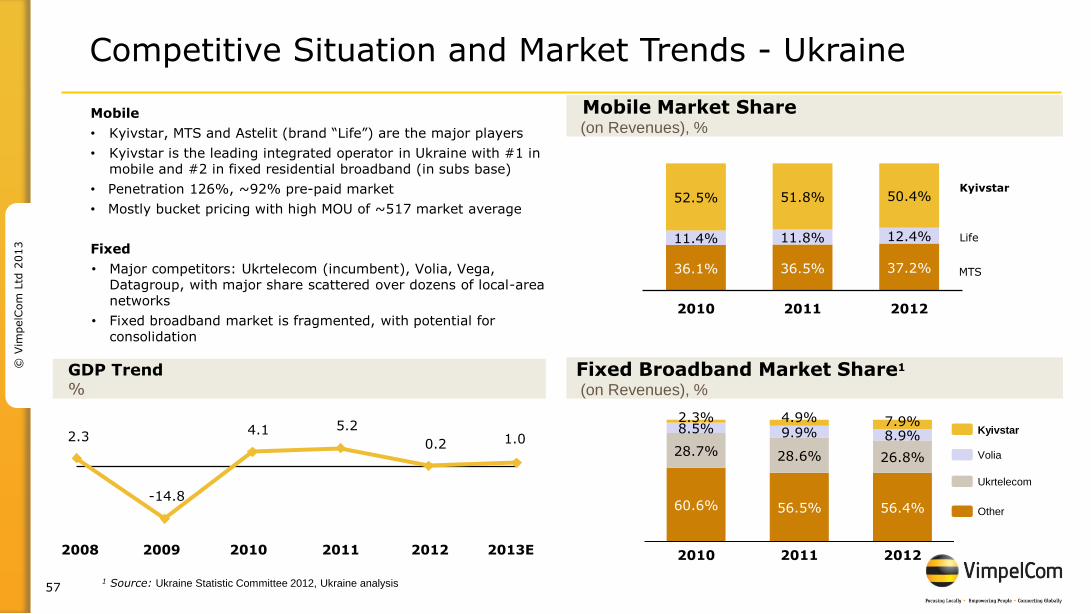
2.3
-14.8
4.1 5.2
0.2 1.0
36.1% 36.5% 37.2%
11.4% 11.8% 12.4%
52.5% 51.8% 50.4%
2010 2011 2012
1 Source: Ukraine Statistic Committee 2012, Ukraine analysis
Mobile Market Share
(on Revenues), %
Fixed Broadband Market Share1
(on Revenues), %
2008 2009 2010 2011 2012 2013E
Competitive Situation and Market Trends - Ukraine
Mobile
• Kyivstar, MTS and Astelit (brand “Life”) are the major players
• Kyivstar is the leading integrated operator in Ukraine with #1 in mobile and #2 in fixed residential broadband (in subs base)
• Penetration 126%, ~92% pre-paid market
• Mostly bucket pricing with high MOU of ~517 market average
Fixed
• Major competitors: Ukrtelecom (incumbent), Volia, Vega, Datagroup, with major share scattered over dozens of local-area networks
• Fixed broadband market is fragmented, with potential for consolidation
Kyivstar
MTS
Life
Kyivstar
Volia
Ukrtelecom
Other
GDP Trend
%
60.6% 56.5% 56.4%
28.7% 28.6% 26.8%
8.5% 9.9% 8.9%
2.3% 4.9% 7.9%
2010 2011 2012

58
© V
impelC
om
Ltd
2013
Georgia
• 3 GSM competitors (Beeline – 3rd and growing), 2G penetration 126%, 3G operations by competitors, 80+% coverage, liberal economy
Tajikistan
• 4 GSM competitors (Beeline 3rd), 2G penetration 133%,3G operations first in CIS, low data usage, collaboration with BU Russia for migrant Subs
Kyrgyzstan
• 3 GSM competitors (Beeline 1st), penetration 112%, 3G developing fast, EBITDA margin leader together with growth
Kazakhstan
• 3 international competitors in GSM (Beeline – 2nd). Telia Sonera (K-Cell) 1st, Tele2 3rd (newcomer)
• 2G penetration 164%, 3G services, LTE test zone first in CIS
• Beeline FTTB as 1st alternative, China Transit project over main-line NW
Uzbekistan
• 2 GSM competitors, Beeline is #1 and Telia Sonera (U-Cell). MTS was the market leader before network closed down.
• 2G penetration 73%, 3G operations, LTE by competitors, Beeline LTE in 2012
• Price wars, tough governance, state monopoly for international communication
Armenia
• 3 international competitors in GSM: Beeline – 2nd, MTS (Russian competitor subsidiary) is 1st, Orange is 3rd
• 2G penetration 121%, 3G operations, LTE license - MTS high data usage
• Beeline fixed monopoly, stagnating voice, ADSL as fixed BB, growing competition urges for FTTx
Competitive Situation - CIS

59
© V
impelC
om
Ltd
2013 Reconciliation Tables and Forex

60
© V
impelC
om
Ltd
2013
Source: National Banks of the respective countries, Company calculations
FOREX Development
1Q13 1Q12 YoY 1Q13 FY12 Delta
Russian Ruble 30.41 30.03 -1.2% 31.08 30.37 -2.3%
Euro 0.76 0.76 0.6% 0.78 0.76 -2.8%
Algerian Dinar 78.65 75.13 -4.5% 79.50 78.94 -0.7%
Pakistan Rupee 97.89 90.61 -7.4% 98.43 97.14 -1.3%
Bangladeshi Taka 79.06 82.78 4.7% 78.08 79.78 2.2%
Ukrainian Hryvnia 7.99 7.99 0.0% 7.99 7.99 0.0%
Kazakh Tenge 150.67 148.14 -1.7% 150.84 150.74 -0.1%
Armenian Dram 409.15 388.47 -5.1% 418.58 403.58 -3.6%
Kyrgyz Som 47.71 46.71 -2.1% 47.96 47.40 -1.2%
Average rates Closing rates

61
© V
impelC
om
Ltd
2013
USD mln 1Q13 1Q12*
Unaudited
EBITDA 2,348 2,311
Depreciation (766) (721)
Amortization (454) (532)
Impairment loss (18) -
Loss on disposals of non-current assets (3) (43)
EBIT 1,107 1,015
Financial Income and Expenses (501) (443)
- including finance income 22 41
- including finance costs (523) (484)
Net foreign exchange (loss)/gain and others (63) 21
- including Other non-operating losses (26) (26)
- including Shares of loss of associates and joint ventures accounted
for using the equity method(65) (16)
- including Net foreign exchange gain 28 63
EBT 543 593
Income tax expense (213) (239)
Profit for the period 330 354
Profit/(loss) for the period attributable to non-controlling interest (78) 36
Profit for the period attributable to the owners of the parent 408 318
Reconciliation Tables
* Income statement 1Q12 has been amended to reflect classification of certain operating costs at the Group level without any impact on net income and performance of the business unit
Reconciliation of consolidated EBITDA of VimpelCom

62
© V
impelC
om
Ltd
2013
Reconciliation of consolidated net debt of VimpelCom
Reconciliation Tables
USD mln 1Q13 4Q12 1Q12
Net debt 22,861 21,971 24,339
Cash and cash equivalents 5,564 4,949 4,033
Long - term and short-term deposits 190 67 219
Gross debt 28,615 26,987 28,591
Interest accrued related to financial liabilities 448 536 450
Fair value adjustment - - 148
Unamortised fair value adjustment under acquisition method of accounting 62 794 909
Other unamortised adjustments to financial liabilities (fees, discounts etc.) 749 73 (103)
Derivatives not designated as hedges 466 453 403
Derivatives designated as hedges 131 237 173
Total other financial liabilities 30,471 29,080 30,570
63
© V
impelC
om
Ltd
2013
Disclaimer
This presentation contains “forward-looking statements”, as the phrase is defined in Section 27A of the Securities Act of 1933 and Section 21E of the Securities Exchange Act of 1934. These statements relate to the Company's anticipated performance, refinancing plans and dividend guidelines. The forward-looking statements included in this presentation are based on management’s best assessment of the Company’s strategic and financial position and of future market conditions and trends. These discussions involve risks and uncertainties. The actual outcome may differ materially from these statements as a result of continued volatility in the economies in our markets, unforeseen developments from competition, governmental regulation of the telecommunications industries, general political uncertainties in our markets and/or litigation with third parties. There can be no assurance that such risks and uncertainties will not have a material adverse effect on the Company. Certain factors that could cause actual results to differ materially from those discussed in any forward-looking statements include the risk factors described in the Company’s Annual Report on Form 20-F for the year ended December 31, 2012 filed with the U.S. Securities and Exchange Commission (the “SEC”) and other public filings made by the Company with the SEC, which risk factors are incorporated herein by reference. The Company disclaims any obligation to update developments of these risk factors or to announce publicly any revision to any of the forward-looking statements contained in this release, or to make corrections to reflect future events or developments.


