ITP Materials: Development of a New Class of Fe-3Cr-W(V ... · Nooter Eriksen . ORNL/TM-2005/82...
84
Industrial Materials for the Future Managed by UT-Battelle, LLC Final Technical Report Development of a New Class of Fe-3Cr-W(V) Ferritic Steels for Industrial Process Applications March 2005 Principal Investigators: Mr. Mann Jawad Nooter Corporation Dr. Vinod K. Sikka Oak Ridge National Laboratory ORNL/TM-2005/82
Transcript of ITP Materials: Development of a New Class of Fe-3Cr-W(V ... · Nooter Eriksen . ORNL/TM-2005/82...

Industrial Materials for the Future
Managed by UT-Battelle, LLC
Final Technical Report Development of a New Class of Fe-3Cr-W(V) Ferritic Steels for Industrial Process Applications March 2005 Principal Investigators:
Mr. Mann Jawad Nooter Corporation Dr. Vinod K. Sikka Oak Ridge National Laboratory
ORNL/TM-2005/82

DOCUMENT AVAILABILITY
Reports produced after January 1, 1996, are generally available free via the U.S. Department of Energy (DOE) Information Bridge.
Web site http://www.osti.gov/bridge Reports produced before January 1, 1996, may be purchased by members of the public from the following source.
National Technical Information Service 5285 Port Royal Road Springfield, VA 22161 Telephone 703-605-6000 (1-800-553-6847) TDD 703-487-4639 Fax 703-605-6900 E-mail [email protected] Web site http://www.ntis.gov/support/ordernowabout.htm
Reports are available to DOE employees, DOE contractors, Energy Technology Data Exchange (ETDE) representatives, and International Nuclear Information System (INIS) representatives from the following source.
Office of Scientific and Technical Information P.O. Box 62 Oak Ridge, TN 37831 Telephone 865-576-8401 Fax 865-576-5728 E-mail [email protected] Web site http://www.osti.gov/contact.html

FINAL TECHNICAL REPORT Project Title: Development of a New Class of Fe-3Cr-W(V) Ferritic Steels for
Industrial Process Applications Award Number: DE-FC36-01ID14239; CPS #1763 Project Period: July 1, 2001–December 31, 2004 PI(s): Mr. Maan Jawad (Nooter)
(314) 378-7808 [email protected]
Dr. Vinod K. Sikka (ORNL) (865) 574-5112 [email protected]
Additional Researchers: Dr. Suresh S. Babu (ORNL) Dr. Ronald L. Klueh (ORNL) Dr. Philip J. Maziasz (ORNL) Dr. Michael L. Santella (ORNL) Recipient: Nooter Corporation
1400 S. Third St. St. Louis, MO 63166
National Laboratory: Oak Ridge National Laboratory (ORNL) One Bethel Valley Road P.O. Box 2008 Oak Ridge, TN 37831 Industrial Partners: ExxonMobil Chemical Co.
BP Amoco DuPont ISG Plate Ellwood Materials Technologies Ellwood National Forge Plymouth Tube Company Stoody Company Nooter Eriksen


ORNL/TM-2005/82
Development of a New Class of Fe-3Cr-W(V) Ferritic Steels for Industrial Process Applications
Maan Jawad Nooter Corporation
Vinod K. Sikka Oak Ridge National Laboratory
March 2005
Prepared jointly by
NOOTER CORPORATION 1400 S. Third Street
St. Louis, Missouri 63166
and
OAK RIDGE NATIONAL LABORATORY P.O. Box 2008
Oak Ridge, Tennessee 37831-6283 managed by
UT-Battelle, LLC for the
U.S. DEPARTMENT OF ENERGY under contract DE-AC05-00OR22725

ii
Acknowledgments and Disclaimer
Acknowledgments This report is based upon work supported by the U.S. Department of Energy, Energy Efficiency and Renewable Energy, Industrial Technologies Program, Industrial Materials for the Future, under Award No. DE-FC36-01ID14239. Research at Oak Ridge National Laboratory was sponsored by the U.S. Department of Energy, Office of Energy Efficiency and Renewable Energy, Industrial Technologies Program, under contract DE-AC05-00OR22725 with UT-Battelle, LLC. The authors wish to thank Dr. Peter Angelini for reviewing the document and Ms. Millie Atchley for preparation of the document.
Disclaimer This report was prepared as an account of work sponsored by an agency of the United States Government. Neither the United States Government nor any agency thereof, nor any of their employees, makes any warranty, express or implied, or assumes any legal liability or responsibility for the accuracy, completeness, or usefulness of any information, apparatus, product, or process disclosed, or represents that its use would not infringe privately owned rights. Reference herein to any specific commercial product, process, or service by trade name, trademark, manufacturer, or otherwise, does not necessarily constitute or imply its endorsement, recommendation, or favoring by the United States Government or any agency thereof. The views and opinions of authors expressed herein do not necessarily state or reflect those of the United States Government or any agency thereof.

iii
Contents List of Figures .............................................................................................................................. v List of Tables ............................................................................................................................... ix Abbreviations and Acronyms ...................................................................................................... xi 1. Executive Summary ....................................................................................................................... 1
1.1 New Class of Fe-3Cr-W(V) Steels..................................................................................... 1 1.2 Technology Transfer .......................................................................................................... 3 1.3 Commercialization ............................................................................................................. 3 1.4 Recommendations .............................................................................................................. 3
2. Introduction .................................................................................................................................... 5
2.1 Potential Applications, Target Industries, and Energy Savings ......................................... 6 2.2 Commercialization Status and Plans .................................................................................. 6
3. Background .................................................................................................................................... 9
3.1 Domestic Technology Status Including Emerging Technologies ...................................... 9 3.2 State of the Art ................................................................................................................... 10
4. Results and Discussion ................................................................................................................... 13
4.1 Project Approach................................................................................................................ 13 4.2 Alloy Phase Stability Analysis........................................................................................... 14 4.3 Alloy Development and Commercial Heat Melting and Processing ................................. 18 4.4 Alloy Compositions ........................................................................................................... 19 4.5 Heat Treatment................................................................................................................... 19 4.6 Mechanical Properties........................................................................................................ 29
4.6.1 Tensile Properties ..................................................................................................... 29 4.6.2 Charpy-Impact Properties......................................................................................... 37 4.6.3 Creep Properties ....................................................................................................... 37
4.7 Weld and Weldment Properties ......................................................................................... 51 4.7.1 GTA Welds .............................................................................................................. 52 4.7.2 SA Welds.................................................................................................................. 53 4.7.3 GTA, SA, and SMA Welds and Properties .............................................................. 57
5. Accomplishments ........................................................................................................................... 59
5.1 Technical Goals.................................................................................................................. 59 5.2 Technology Transfer .......................................................................................................... 59 5.3 Publications and Patents..................................................................................................... 59 5.4 Commercialization ............................................................................................................. 60
6. Summary and Conclusions ............................................................................................................. 61
6.1 Summary ............................................................................................................................ 61 6.2 Conclusions........................................................................................................................ 61 6.3 Commercialization Aspects (Plans, Status, Barriers)......................................................... 63
7. Recommendations .......................................................................................................................... 65 8. References ...................................................................................................................................... 67

iv
Appendices Appendix A: ASME Code Data Package .................................................................................... 69 Appendix B: Publications............................................................................................................ 167
B1: High-Strength Fe-3Cr-W(Mo) Steel for Petrochemical Applications ..................... 169 B2: Mechanical Properties of New Grades of Fe-3Cr-W Alloys ................................... 187
Appendix C: Presentations .......................................................................................................... 199 C1: Application of Neural Network Modeling for Fe-3Cr-1.5W Filler Metal ............... 201 C2: Mechanical Property Evaluation of 3Cr-1.5W-0.75Mo-V(Ta) Steel....................... 209
Appendix D: Creep Data on Grade A, Alloy 315........................................................................ 223 Appendix E: Welding Report ...................................................................................................... 231
E1: Welding and Weldment Properties of GTA, SA, and SMA Welds ......................... 233

v
List of Figures 2.1 Organization plan for project coordination and management. ................................................. 5 4.1 Comparison of stable phases predicted in various commercial and near-
commercial alloys and ORNL alloys (Fe-3Cr-3W based). ...................................................... 17 4.2 Comparison of stable phases predicted in ORNL alloys containing ORNL
Fe-3Cr-3W vs heat 79741 Fe-3Cr-W(Mo) . ............................................................................. 17 4.3 Comparison of phase observed in 2.25Cr-1Mo and 2.25Cr-2WV alloys after
normalizing and tempering treatment ...................................................................................... 18 4.4 Electric furnace melting of 50-ton commercial heats and their casting into ingots
and processing into hot-forged ingots, hot-rolled plate, and tubing. ........................................ 20 4.5 Continuous cooling transformation diagram for Grade A (heat 79741)................................... 23 4.6 Continuous cooling transformation diagram for Grade B (heat 86441). .................................. 23 4.7 Curve for cooling rate of 20°C/min shown on the cooling transformation
temperature plot of Grade B (heat 86441)................................................................................ 24 4.8 Plot of yield strength at room temperature as a function of tempering temperature
for 1.5- and 3-in.-thick plates of Grades A and B steel [A8141 and A8142(Ta)] .................... 25 4.9 Plot of ultimate tensile strength at room temperature as a function of tempering
temperature for 1.5- and 3-in.-thick plates of Grades A and B steel [A8141 and A8142(Ta)] .......................................................................................................... 25
4.10 Plot of total elongation at room temperature as a function of tempering temperature for 1.5- and 3-in.-thick plates of Grades A and B steel [A8141 and A8142(Ta)] ................... 26
4.11 Comparison of tempering response for yield strength at room temperature of 1.5- and 3-in.-thick plates tested at ISG Plate with 6- by 6-in. forging tested at ORNL for Grade A (heat 79741).......................................................................................... 27
4.12 Comparison of tempering response for ultimate tensile strength at room temperature of 1.5- and 3-in.-thick plates tested at ISG Plate with 6- by 6-in. forgings tested at ORNL for Grade A (heat 79741).......................................................................................... 28
4.13 Comparison of tempering response for total elongation at room temperature of 1.5- and 3-in.-thick plates tested at ISG Plate with 6- by 6-in. forgings tested at ORNL for Grade A (heat 79741). ........................................................................................................ 28
4.14 Charpy-impact data at 32°F for 1.5-in.-thick plates of Grades A and B as a function of the Larson-Miller parameter................................................................................................. 30
4.15 Comparison of Charpy-impact data for Fe-3Cr-3W alloy (heat 010293) with alloys containing 1.5 W + 0.75 Mo (heats 18608 and 18609) as opposed to 3 W ............................. 30
4.16 Yield strength as a function of test temperature for three commercial heats of Grade A. ................................................................................................................................... 31
4.17 Ultimate tensile strength as a function of test temperature for three commercial heats of Grade A....................................................................................................................... 32
4.18 Total elongation as a function of test temperature for three commercial heats of Grade A. ............................................................................................................................... 32
4.19 Reduction of area as a function of test temperature for three commercial heats of Grade A. ............................................................................................................................... 33

vi
4.20 Yield strength as a function of test temperature for three commercial heats of Grade B................................................................................................................................ 33
4.21 Ultimate tensile strength as a function of test temperature for three commercial heats of Grade B....................................................................................................................... 34
4.22 Total elongation as a function of test temperature for three commercial heats of Grade B................................................................................................................................ 34
4.23 Reduction of area as a function of test temperature for three commercial heats of Grade B................................................................................................................................ 35
4.24 Comparison of yield strength of Grades A and B as compared to commercial and near-commercial grades of steel in a similar chemical analysis range.............................. 35
4.25 Comparison of ultimate tensile strength of Grades A and B as compared to commercial and near-commercial grades of steel in a similar chemical analysis range. ......... 36
4.26 Comparison of total elongation of Grades A and B as compared to commercial and near-commercial grades of steel in a similar chemical analysis range.............................. 36
4.27 Charpy-impact energy and lateral expansion data for 6- by 6-in. forgings of Grades A and B (heats 79741 and 86441) .............................................................................. 37
4.28 Charpy-impact energy data for 1-in.-thick plate of Grade A (heat 79741) ............................. 38 4.29 Comparison of Charpy-impact properties of 1-in.-thick plate of Grade A
with 6- by 6-in. forgings of Grades A and B ........................................................................... 38 4.30 Isothermal plots of creep-rupture data for three commercial heats of Grade A:
(a) 900 (482°C) and (b) 950°F (510°C) .................................................................................. 39 4.31 Isothermal plots of creep-rupture data for three commercial heats of Grade A:
(a) 1000 (538°C) and (b) 1100°F (593°C) .............................................................................. 40 4.32 Isothermal plots of creep-rupture data for three commercial heats of Grade A:
(a) 1150 (621°C) and (b) 1200°F (649°C) .............................................................................. 41 4.33 Isothermal plots of creep-rupture data for three commercial heats of Grade B:
(a) 900 (482°C) and (b) 1000°F (538°C) ................................................................................ 42 4.34. Isothermal plots of creep-rupture data for three commercial heats of Grade B:
(a) 1100 (593°C) and (b) 1200°F (649°C) .............................................................................. 43 4.35 Isothermal plots of creep-rupture data for three commercial heats of Grade B ...................... 44 4.36 Creep-rupture data for commercial heat 79743 of Grade A tested after
tempering at 1292°F (700°C)................................................................................................... 44 4.37 Creep-rupture data for commercial heats 86441 and 86442 of Grade B tested
after tempering at 1292°F (700°C)........................................................................................... 45 4.38 Larson-Miller parameter plot of creep-rupture data for three commercial
heats of Grade A ..................................................................................................................... 46 4.39 Comparison of Larson-Miller plot for three commercial heats of Grade A,
with average values reported for the commercial grade T23 .................................................. 46 4.40 Larson-Miller plot of creep-rupture data for three commercial heats of Grade B .................. 47 4.41 Comparison of Larson-Miller plot for three commercial heats of Grade B,
with average values reported for the commercial grade T23 .................................................. 47 4.42 Comparison of average values of creep-rupture strength of Grades A and B.......................... 49 4.43 Creep-rupture elongation for creep tests carried out on three commercial
heats of Grade A ..................................................................................................................... 49 4.44 Reduction of area for creep tests carried out on three commercial heats of Grade A ............. 50
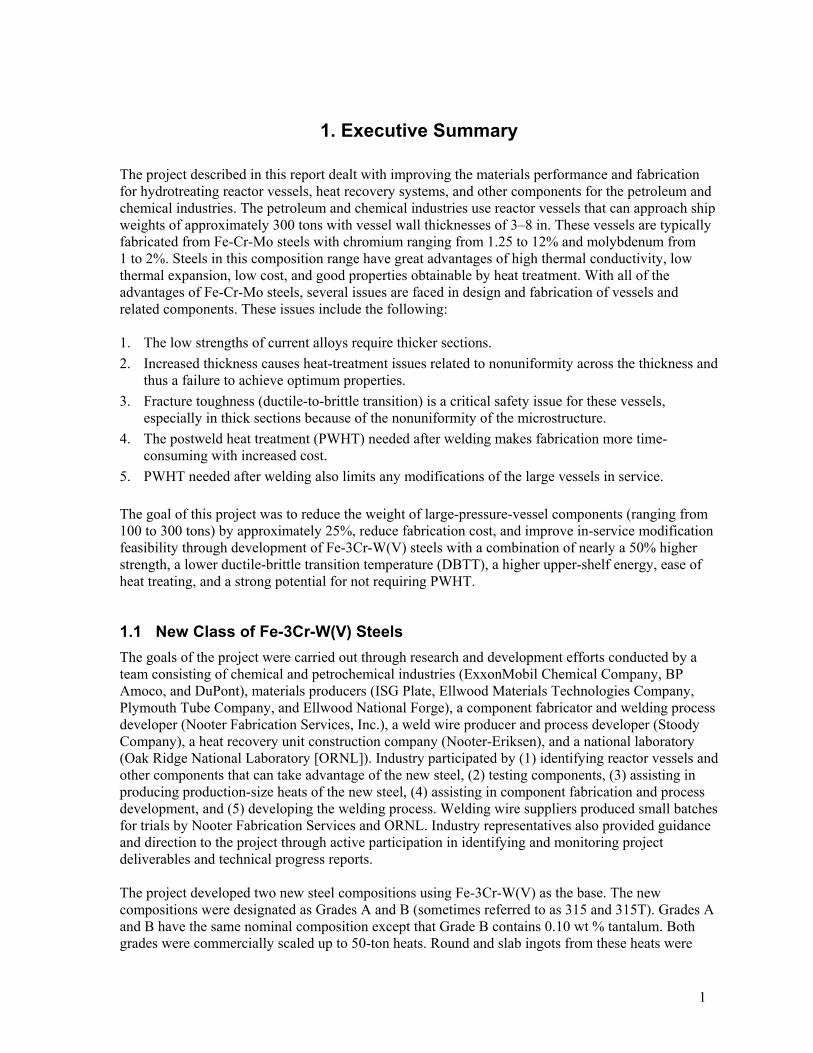
vii
4.45 Creep-rupture elongation for creep tests carried out on three commercial heats of Grade B ............................................................................................................................... 50
4.46 Reduction of area for creep tests carried out on three commercial heats of Grade B .............. 51 4.47 Macrostructure of gas-tungsten-arc and submerged-arc welds ............................................... 52 4.48 Charpy-impact properties of gas-tungsten-arc welds made with filler wire that
requires no postweld heat treatment ........................................................................................ 53 4.49 Charpy-impact properties at room temperature (RT) for submerged-arc welds made
with various filler wires ........................................................................................................... 54 4.50 Charpy-impact properties at room temperature and −40F for submerged-arc welds
made with two filler wires that exceed the criteria of 15 ft-lb of energy and 15 mil of lateral expansion without requiring postweld heat treatment .............................................. 55
4.51 Comparison of tensile properties and fracture locations for submerged-arc welds that met the Charpy-impact requirements without postweld heat treatment. ........................... 55

viii

ix
List of Tables 1.1 Comparison of new Grade A steel composition with two commercial steels ......................... 2 3.1 Work breakdown structure in ferritic steels project ................................................................ 11 4.1 Chemical analysis of commercial or near-commercial alloys used or proposed for the petrochemical industry ....................................................................................................... 15 4.2 Chemical composition of Fe-3Cr-3W (heats 10293 and 10294) and Fe-3Cr-3W(Mo) (heat 79741) alloys .................................................................................................................. 16 4.3 Presence of predicted phases in various alloys after tempering temperatures
of 700 or 730°C ....................................................................................................................... 18 4.4 Vendor and check analysis of two 50-ton heats of Fe-3Cr-W alloy......................................... 20 4.5 Chemical analysis of the electric-furnace-melted 50-ton heat 79741 of Grade A after electroslag remelting heat 79742 and vacuum-arc remelting heat 79743 ....................... 21 4.6 Chemical analysis of the electric-furnace-melted 50-ton heat 86441 of Grade B after electronslag remelting heat 86442 and vacuum-arc remelting heat 86443 ..................... 22 4.7 Critical transformation temperatures for Grades A and B ....................................................... 24 4.8 Charpy-impact properties of 1.5- and 3-in.-thick plates of Grade A (79741) and Grade B (86441) as affected by various tempering temperatures ........................................... 29 4.9 Comparison of base metal and gas-tungsten-arc weld impact properties................................. 52 4.10 Chemical analysis of base metal and filler wire compositions used for gas- tungsten-arc welding ............................................................................................................... 53 4.11 Comparison of base metal and weldment tensile properties at room temperature for gas-tungsten-arc and submerged-arc welds without postweld heat treatment ................... 56 4.12 Chemical analysis of two base metal plates and the submerged-arc weld deposits made with matching fill 10293 and filler wires 25A67-10 and 25A67-11 .............................. 56 6.1 Comparison of new Grade A steel composition with two commercial steels ......................... 62

x

xi
Abbreviations and Acronyms ASME American Society of Mechanical Engineers ASTM American Society for Testing and Materials CCT continuous cooling transformation DBTT ductile brittle transition temperature EQS Ellwood Quality Steel ESR electroslag remelting Grade A a new Fe-3Cr-W(Mo) steel developed in this project (also known as Grade
315 in this report) Grade B a new higher-strength Fe-3Cr-W(Mo) steel with 0.1 Ta developed in this
project (also known as Grade 315T in this report) Grade 22 2.25Cr-1Mo steel GTA gas-tungsten arc LMP Larson-Miller parameter N normalized N/T normalized and tempered ORNL Oak Ridge National Laboratory PWHT postweld heat treatment SA submerged arc SMA shielded metal arc T23 highest strength Fe-2.5Cr-W alloy from Japan TTT time-temperature transformation VAR vacuum-arc remelting VIM vacuum-induction melted

xii
1
1. Executive Summary The project described in this report dealt with improving the materials performance and fabrication for hydrotreating reactor vessels, heat recovery systems, and other components for the petroleum and chemical industries. The petroleum and chemical industries use reactor vessels that can approach ship weights of approximately 300 tons with vessel wall thicknesses of 3–8 in. These vessels are typically fabricated from Fe-Cr-Mo steels with chromium ranging from 1.25 to 12% and molybdenum from 1 to 2%. Steels in this composition range have great advantages of high thermal conductivity, low thermal expansion, low cost, and good properties obtainable by heat treatment. With all of the advantages of Fe-Cr-Mo steels, several issues are faced in design and fabrication of vessels and related components. These issues include the following: 1. The low strengths of current alloys require thicker sections. 2. Increased thickness causes heat-treatment issues related to nonuniformity across the thickness and
thus a failure to achieve optimum properties. 3. Fracture toughness (ductile-to-brittle transition) is a critical safety issue for these vessels,
especially in thick sections because of the nonuniformity of the microstructure. 4. The postweld heat treatment (PWHT) needed after welding makes fabrication more time-
consuming with increased cost. 5. PWHT needed after welding also limits any modifications of the large vessels in service. The goal of this project was to reduce the weight of large-pressure-vessel components (ranging from 100 to 300 tons) by approximately 25%, reduce fabrication cost, and improve in-service modification feasibility through development of Fe-3Cr-W(V) steels with a combination of nearly a 50% higher strength, a lower ductile-brittle transition temperature (DBTT), a higher upper-shelf energy, ease of heat treating, and a strong potential for not requiring PWHT.
1.1 New Class of Fe-3Cr-W(V) Steels The goals of the project were carried out through research and development efforts conducted by a team consisting of chemical and petrochemical industries (ExxonMobil Chemical Company, BP Amoco, and DuPont), materials producers (ISG Plate, Ellwood Materials Technologies Company, Plymouth Tube Company, and Ellwood National Forge), a component fabricator and welding process developer (Nooter Fabrication Services, Inc.), a weld wire producer and process developer (Stoody Company), a heat recovery unit construction company (Nooter-Eriksen), and a national laboratory (Oak Ridge National Laboratory [ORNL]). Industry participated by (1) identifying reactor vessels and other components that can take advantage of the new steel, (2) testing components, (3) assisting in producing production-size heats of the new steel, (4) assisting in component fabrication and process development, and (5) developing the welding process. Welding wire suppliers produced small batches for trials by Nooter Fabrication Services and ORNL. Industry representatives also provided guidance and direction to the project through active participation in identifying and monitoring project deliverables and technical progress reports. The project developed two new steel compositions using Fe-3Cr-W(V) as the base. The new compositions were designated as Grades A and B (sometimes referred to as 315 and 315T). Grades A and B have the same nominal composition except that Grade B contains 0.10 wt % tantalum. Both grades were commercially scaled up to 50-ton heats. Round and slab ingots from these heats were

2
processed into forgings, hot-rolled plate, bar, and tubing. Processing of ingots from large heats was carried out using currently available commercial practice. Both grades were chosen for use in the normalized and tempered condition: 2012/1345°F (1100/730°C). Forging and plate from three commercial heats of each grade were subjected to tensile, Charpy-impact, and creep testing. Tensile tests were conducted from room temperature to 1300°F (704°C), impact tests from −60°F to +150°F (−51 to +65°C), and creep tests from 900 to 1300°F (482 to 704°C). All of the data were generated in accordance with ASME Pressure Vessel and Boiler Code requirements. Welding studies were carried out on 1-in.-thick plate from both Grades A and B. Welding process studies included studies with gas-tungsten arc (GTA), submerged arc (SA), and shielded-metal arc (SMA). Lincoln 880 was found to be the best flux for producing the desired weld chemistry with low oxygen content in SA welds. Filler wire compositions that did not require PWHT were identified for GTA welds. Project team members decided that PWHT had to be used for SA and SMA welds, given their high oxygen content in the weld deposit. A PWHT of 1292°F (700°C) was found to result in acceptable Charpy-impact properties. Table 1.1 shows a comparison of the Grade A steel composition with the commonly used 2.25Cr-1Mo steel and a recent high-strength version from Japan known as T23. The new steels can be welded by all common welding processes (GTA, SA, and SMA). For the GTA process, welds can be used in the as-welded condition. For SA and SMA, a PWHT of 1295°F (700°C) is recommended.
Table 1.1. Comparison of the new Grade A steel composition with two commercial steels
Comparison of Grade A Fe-3Cr-W(V) steel with Property 2.25Cr-1Mo steel T23 steel Yield strength at room temperature 60% higher 25% higher Yield strength at high temperatures 110% higher at 900°F
(482°C) 45% higher at 1110°F (600°C)
Tensile strength at room temperature 50% higher 33% higher Tensile strength at high temperatures 50% higher at 900°F
(482°C) 33% higher at 1110°F (600°C)
Charpy-impact upper shelf energy a a Ductile-to-brittle transition temperature b b Creep-rupture strength — 35% higher for 105h at
932ºF (500ºC) Same for 105h at 1100ºF (590ºC)
aValues of upper shelf energy in the range of 50 to 100 ft-lb. No comparable data available. bDuctile-to-brittle transition temperature of −20 to −40ºF. No comparable data available.
Grade B steel, investigated less detail than Grade A, showed the following attributes: • Tensile property improvements were similar to those described for Grade A. • Impact properties were similar to the impact properties of Grade A. • Grade B showed 10–20% higher creep rupture strength than Grade A for conditions causing
rupture in 105 h at temperatures ≤ 1100°F (593°C). However, for higher test temperatures, Grade B had a slightly lower creep rupture strength than Grade A.

3
• Limited welding trials with Grade B showed no unusual problems. We anticipate that the weld wire for this grade of steel will require a higher tantalum content in order to obtain the target value.
1.2 Technology Transfer As noted in the previous section, the project team consisted of steel producers; producer of products such as forgings, plate, and tubing; a welding wire producer; component and pressure vessel fabricators; and users. The team partners actively participated in all aspects of this project and, thus, acquired significant knowledge of the newly developed steels in this project. The technology transfer beyond the team partners was accomplished through (1) presentations at annual DOE portfolio project review meetings, (2) three presentations at national and international technical review meetings, and (3) publication of two technical papers in conference proceedings. Further technology transfer was also accomplished through presentations by industrial partners at certain committee meetings such as the American Society for Testing and Materials (ASTM) and presentations of data on the new steels to their customers.
1.3 Commercialization Significant progress towards commercialization of the new steels developed in this project has been made through the following steps: 1. ASTM approval of specifications was obtained for both Grades A and B. 2. Progress was made on obtaining American Society of Mechanical Engineers (ASME) Pressure
Vessel and Boiler Code approved design-allowable stresses for Grade A by submitting its comprehensive mechanical properties data package to the code committees.
3. Dr. Maan Jawad was retained as a consultant to the project for participation in the ASME Code Committee review meetings to answer any questions that might arise during deliberations.
4. Further commercialization will occur through visits by Dr. Maan Jawad to various companies. The purpose of these visits will be to familiarize their system design engineers with the advantages of using the new steels.
1.4 Recommendations This project has accomplished nearly all of the planned goals. However, the following additional activities are recommended to further advance the potential of this project: 1. Provide additional long-term creep testing of the Grade A steel. These data are essential for
obtaining ASME code approval and gaining confidence from users in the long-term stability of the new steels.
2. Perform creep tests on the Grade B steel. These tests were discontinued because of lack of funds. 3. Test components from the new steel under commercial production conditions. Successful
installation and operation under production conditions develops user confidence in trying new steels. One example of this installation could include tubing in heat recovery boilers.
4. Develop more extensive data on the mechanical properties of weldment. Although we made progress on the welding process and filler wire development during this project, there is a need to develop a significant amount of mechanical property data of weldment. This effort is needed initially for welds in 2- to 4-in.-thick plates of Grade A steel, and subsequently for welds in Grade B steel.

4
5. Demonstrate the welding process for actual components such as tube-to-tube or tube-to-tube sheet. Again, this is required initially for Grade A, followed by Grade B.

5
2. Introduction This project dealt with the development of a new class of Fe-3Cr-W(V) steels for use in the construction of chemical processing equipment such as hydrocrackers, hydrotreaters, and heat recovery systems. The key attributes targeted for the new steel were the following: (1) 50% higher tensile strength at temperatures up to 1022–1112°F (550–600°C) than is available in current materials, (2) the potential for eliminating postweld heat treatment (PWHT) for certain welding processes, (3) reduction in equipment weight by 25%, and (4) impact properties of approximately 100 ft-lb of upper shelf energy and a ductile-to-brittle transition temperature (DBTT) of −10°F. Quite a number of the components in chemical processing equipment are currently fabricated from Fe-2.25Cr-1Mo steel, commonly known as Grade 22 steel. Section thicknesses of up to 10 in. are required for some of the equipment fabricated from this steel, with equipment weights reaching as much as 100–300 tons. Most of this equipment is built to ASME code specifications. Thus, if PWHT is required, no equipment modifications are possible once the equipment is installed and operating. The 50% higher tensile strength of the newly developed steel will reduce section sizes by nearly half, thereby reducing the equipment weight to 50–150 tons. Furthermore, since some welds are made by the gas tungsten arc (GTA) process, they require no PWHT; once the equipment is erected, it can be modified by using the GTA welding process. The project team and interactions between the team members during the project are shown in Fig. 2.1.
Fig. 2.1. Organization plan for project coordination and management.
Nooter Fabrication Systems Inc.
Petroleum & Chemical Steel Welding BP-Amoco Bethlehem Steel Corp. Stoody Company ExxonMobil Ellwood Forge DuPont Plymouth Tube Energy Company National Forge Nooter-Eriksen
ASTM & ASME Code Committees
Oak Ridge National Laboratory

6
2.1 Potential Applications, Target Industries, and Energy Savings As noted at the beginning of Section 2, the newly developed steel was targeted for chemical process reactors such as hydrocrackers, hydrotreaters, and industrial heat recovery systems. For the chemical process reactors, this alloy is needed as forgings and plate, and for tubing in heat recovery systems. The target industries for this project include chemical and petrochemical companies, energy companies, steel producers and steel product manufacturers, component fabricators, and welding consumable producers. Each of these industries were had one more representatives as part of this project. The development of an advanced steel that meets project goals will result in energy savings from a combination of several factors: (1) reduction in energy use in steel production because 25–50% less steel will be needed for fabricating components, (2) significant reduction in energy needed to weld 25–50% thinner steel sections, and (3) reduction in energy by eliminating PWHT for certain weld practices such as GTA. Energy savings are also anticipated through the following: • Improvement in chemical process efficiencies by operating at higher temperatures through
the use of the new alloy; chemical processes such as hydrotreating could increase by 1.5% • For heat recovery units, the thinner tubes made possible by the new alloy will result in higher
heat transfer and, thus, higher heat recovery; this improvement is estimated at 1% It is estimated that by 2020, full-scale implementation of the advanced alloy developed in this project will result in an energy savings of 21 trillion Btu/year.
2.2 Commercialization Status and Plans A plan that identified steps needed for commercialization of the new steels was developed. The steps identified were the following: (1) getting specifications for the new steels approved by ASTM, (b) getting ASME Pressure Vessel and Boiler Code approved allowable-design stresses for the new steels, (3) familiarizing system designers with the properties of the new steels so that these steels can be specified as the material of choice, and (4) providing test material and welding filler so that fabricators can become familiar with the use of the new steels. Progress towards commercialization is as follows: 1. Both Grade A and Grade B were approved for inclusion in American Standards for Testing
Materials (ASTM) specifications. The new alloys are listed in Specification A1041-04. 2. Design-allowable stresses for the alloy must be set by ASME Boiler and Pressure Vessel
Code committees. Setting of the design allowables requires the submission of a detailed mechanical property data package for review and analysis by the code committees. The data package for the advanced alloy developed in this study was submitted in August 2004 (see Appendix A).
It typically takes 12 to 24 months for ASME code bodies to review all of the information
submitted and perform an analysis to set design-allowable stresses. To expedite this approval

7
process, we have subcontracted Dr. Maan Jawad of Global Engineering (previously with Nooter Corporation) to actively pursue the process by participating in ASME Code Committee meetings on a regular basis and respond to any questions that may be asked.
3. In addition to approvals by ASTM and ASME Code committees, a parallel activity is needed
to educate equipment designers about the benefits of the new alloy. This activity was partially accomplished by presenting papers at technical conferences and by the sharing of information on this alloy by the industrial partners of this project within their companies (for the users) and with their customers (for the alloy producers). Although both of these activities are making users aware of the new alloy, we are relying on our consultant, Dr. Maan Jawad, to further this cause by making visits to individual companies and making presentations about this alloy. Because of his design background gained at Nooter Corporation and his familiarity with both chemical and heat recovery systems, we anticipate that his involvement will further reduce the time for commercial use of the new alloy.
4. For the new alloy to be the material of choice, it has to be commercially available at a
competitive price in various product forms (forgings, plate, tubing, and piping). Furthermore, the welding consumables such as filler wire, flux, and electrodes need to be available commercially. The team members of this project are capable of meeting both of these requirements as they arise.
The component fabricators have been contacting ORNL to receive the plate samples from the
newly developed alloy so that they can develop their own procedures for bending, forming, and welding. The plate samples are currently being offered at no cost to U.S.-based companies for their use. Based on these trials, these companies will be ready to build equipment when the need arises.
In summary, all elements essential for commercialization of the new alloy are in place, and further technology transfer is necessary.

8

9
3. Background
3.1 Domestic Technology Status Including Emerging Technologies Ferritic 1-3Cr-Mo steels have a variety of uses at temperatures of 842–1022°F (450–550°C) and below, due to their combination of better oxidation/corrosion resistance and their elevated temperature strength relative to carbon steels with less chromium [1]. These applications include piping, heat exchangers, superheater tubing and pressure vessels in oil refineries, chemical processing plants, and fossil-fired electrical power generating plants. The most common steel in this class is the 2.25Cr-1Mo steel, designated Grade 22 (ASME code), which was first used in the United States in the 1940s [refs. 2,3]. The improved heat resistance combined with the low thermal expansion and excellent thermal conductivity of such ferritic steels and alloys drive their use in many applications. These steels have good weldability, can be fabricated by various wrought methods, and can be used in the bainitic or tempered-martensitic conditions. They have good impact toughness and a ductile-brittle transition temperature (DBTT) below room temperature. There are a number of domestic producers. The Cr-Mo-V steels were developed in the late 1940s and early 1950s for improved creep strength above 480°C in steam turbine bolting and rotor applications [2]. They are also used for steam turbine casing applications. 1Cr-1Mo-0.25V is a typical composition, with many different minor variants. Bainitic structures (upper bainite) produce the best combination of creep resistance, ductility, and toughness. Several research efforts in the mid-1980s (including work at ORNL) produced vanadium-modified bainitic steels related to Grade 22 but with improved creep strength, including 2.25Cr-1Mo-VTiB and 3Cr-1MoV, for coal-gasification and other advanced coal conversion technologies [2,4–6]. However, the development efforts were essentially Japanese (see next section), and these steels are not produced in the United States. In the United States, new 2.25Cr-2WV and 3Cr-3WV bainitic steels were developed between 1985 and 1990 as part of an effort of the U.S. Fusion Reactor Materials Program to develop new steels with faster radioactivity decay for fusion reactor applications that began to be produced in the mid-1980s [refs. 7–9]. These new steels, which are the subject of this report, were radically different from standard Grade 22, both in terms of their as-processed microstructures and their mechanical properties. These new steels are much stronger than Grade 22 at 1022–1112°F (550– 600°C) and have good toughness properties (see Sect. 1.1) after normal tempering [7]. They were also found to have good toughness in the untempered condition (DBTT of –35°C and upper-shelf impact energy of 100 ft-lb), a property not found in the Grade 22 steel. Normally tempered Grade 22 contains both coarse and finer dispersions of chromium-rich M23C6, whereas the 3Cr-3WV steels contain some coarse iron-rich M3C, chromium-rich M23C6, and uniform dispersions of very fine vanadium- and tungsten-rich MC (which has not been observed previously) [9]. Martensitic 9-12Cr steels cannot be used at all without optimum tempering, and their use necessitates preweld and postweld heat treatment for welding such steels in most engineering applications. The behavior of the 3Cr-3WV steels in the untempered condition strongly suggests that these new steels may be useful after welding without the preweld and postweld heat treatments. These new steels also have not yet been fully optimized with regard to the minor or micro additions of titanium, tantalum, boron, and nitrogen being used in such advanced bainitic steels by the Japanese today. While there have been significant efforts worldwide to continuously improve 9-12Cr-Mo martensitic steels with the addition of tungsten, cobalt, vanadium, niobium, carbon, boron, and nitrogen following the significant improvements achieved in modified 9Cr-1Mo in the late 1970s

10
and early 1980s [refs. 10,11], there have only been Japanese efforts since the mid-1990s to similarly improve Grade 22 [refs. 3,12]. The most advanced of these is the new 2.25Cr-1.6W-V-Nb (T23) steel, developed jointly by Mitsubishi Heavy Industries, Ltd., and Sumitomo Metal Industries, Ltd., and the 2.5Cr-1Mo-V-Ti (T24) steel developed by Japan Steel Works in 1994 [refs. 3,12–14]. These new steels have almost twice the creep strength of Grade 22 at 1112°F (600°C), and have good weldability (it is claimed they can be welded without preweld and postweld heat treatments). The steels were approved in Section 1 of the ASME Boiler and Pressure Vessel Code Committee for construction use as T23 and T24 in 1995. Testing of T23 and T24 continues in large-diameter and thicker wall piping and pressure vessel applications, with examination of components after service, and the effects of different component fabrication methods. More advanced properties testing include aging and creep-fatigue interactions.
3.2 State of the Art After the start of the project reported here, ASME organized a conference held in July 2004 and entitled “Experience with Creep-Strength Enhanced Ferritic Steels and New Emerging Computational Methods” [15]. Most of the work reported in this conference on materials of similar composition to the steels in this project was from Japan—with the exception of one paper from the United States on this DOE project. This project dealt with improving the materials performance and fabrication for the hydrotreating of reactor vessels, heat recovery systems, and other components for the petroleum and chemical industries. The petroleum and chemical industries use reactor vessels that can approach ship weights of approximately 300 tons, with vessel wall thicknesses of 3–8 in. These vessels are typically fabricated from Fe-Cr-Mo steels, with the chromium content ranging from 1.25 to 12% and that of molybdenum from 1 to 2%. Steels in this composition range have great advantages of high thermal conductivity, low thermal expansion, low cost, and good properties obtainable by heat treatment. With all of the advantages of Fe-Cr-Mo steels, several issues are faced in design and fabrication of vessels and related components. These issues are the following:
• Because of their low strength properties, current alloys require thicker sections. • Increased thickness causes heat-treatment issues related to nonuniformity across the
thickness; thus, thicker steels do not have optimum properties. • Fracture toughness (ductile-to-brittle transition) is a critical safety issue for these vessels, and
it is affected in thick sections due to the nonuniformity of the microstructure. • The PWHT needed after welding makes fabrication more time-consuming with increased
cost. • The needed PWHT also limits any modifications of the large vessels in service. The goal of this project was to reduce the weight of large pressure vessel components (ranging from 100 to 300 tons) by approximately 25% and reduce fabrication cost and improve in-service modification feasibility through development of Fe3Cr-W(V) steels with combination of nearly a 50% higher strength, a lower DBTT and a higher upper-shelf energy, ease of heat treating, and a strong potential for not requiring PWHT. The research and development work was conducted by a team consisting of chemical and petrochemical companies (Exxon Mobil Chemical Company, BP Amoco, and DuPont), materials producers (ISG Plate, Ellwood Materials Technologies Company, Plymouth Tube Company, and Ellwood National Forge), a component fabricator and welding process developer (Nooter

11
Fabrication Services, Inc.), a weld wire producer and process developer (Stoody Company), a heat recovery unit construction company (Nooter-Eriksen), and a national laboratory (ORNL). Industry participated by (1) identifying reactor vessels and other components that can take advantage of the new steel, (2) testing components, (3) assisting in producing production-size heats of the new steel, (4) assisting in component fabrication and process development, and (5) developing the welding process. Welding wire suppliers produced small batches for trials by Nooter Fabrication Services and ORNL. Industry representatives also provided guidance and direction to the project through active participation in identifying and monitoring project deliverables and technical progress reports. The work breakdown structure for the project is shown in Table 3.1.
Table 3.1. Work breakdown structure for this project
ID Task Year 1 Year 2 Year 3 1 Alloying Effects and Composition Optimization
1.1 ThermoCalc™ and kinetic modeling to understand effects of tungsten versus molybdenum
1.2 Development of TTT curves for heat treatment
1.3 Verification of compositions and heat treatment
2 Materials/Process Modeling 2.1 Methods for melting pilot (300 to 500 lb) and
large (10 to 50 ton) heats
2.2 Modeling and processing of heats into rolled plate, forged sections, and casting
2.3 Mechanical properties of pilot and large heats
3 Welding Process Development and Weldment Properties
3.1 Process and filler metal development
3.2 Weld and weldment properties
4 Microstructural Thermal Stability and Characterization
4.1 Thermal aging of pilot and large heats to various temperatures and times
4.2 Properties of aged materials
4.3 Microstructural characterization
5 Manufacturing and Testing of Prototype Components
5.1 Fabrication of welded and cast components
5.2 Installation of components in chemical plant
5.3 Cost benefit analysis

12
ID Task Year 1 Year 2 Year 3 6 Preparation of Data Packages for ASTM and
ASME code Approvals
6.1 Complete data package for ASTM Specification
6.2 Complete data package for ASME code approval 7 Meetings and Reports 7.1 Hold at least two technical meetings per year
7.2 Complete final report
13
4. Results and Discussion The main objective of this project was to develop a new class of Fe-3Cr-W(V) ferritic steels for chemical process applications based on a patented ORNL steel. The project goal was to reduce the weight of large pressure vessels and associated components by approximately 25% and eliminate the need for PWHT. These improvements can yield an estimated energy savings of 21 trillion Btu/year and cost savings of approximately $237 million for chemical vessels and related components used in the United States.
4.1 Project Approach The objectives of the project were achieved through the successful completion of the following steps, which included application of several concepts.
1. Understanding the role of replacing molybdenum with tungsten in currently used
Fe-2.25Cr-1Mo alloys Work reported in the literature as well as the preliminary background work on ORNL alloy compositions has shown that Fe-Cr-W alloys with partial or complete replacement of molybdenum with tungsten have superior strength properties at room temperature and retain those properties at high temperatures. We carried out a systematic prediction of phase formation during heat treatment of Fe-Cr-W alloys and compared those predictions with similar predictions for Fe-Cr-Mo and Fe-Cr-Mo(W) alloys. Phase and stability predictions were conducted by using ThermoCalc™ and kinetic modeling. The predicted results were verified with experimental data, and once verified, these data were used to optimize alloy compositions to desired levels of strength and thermal stability. In addition to developing nominal compositions, ThermoCalc™ was also used to set limits on residual elements such as manganese, silicon, and phosphorus. Predicted results for residual elements were verified by producing and testing experimental-size heats.
2. Development of time-temperature-transformation (TTT) curves for conducting heat
treatment for selected properties Ferritic steels derive their strength, toughness, and thermal stability from the microstructure that develops during heat treatment. A TTT diagram was developed for each of the identified compositions through the use of Gleeble equipment available at ORNL. The TTT diagrams provide information on critical phase transformation temperatures and the cooling steps (continuous vs step cooling) required for generating a desired microstructure. This information is needed for selecting cooling parameters for a range of component section thicknesses.
3. Melting and processing of Fe-Cr-W alloy compositions
In this step, experimental-size heats of the alloy compositions identified in Step 1 above were melted and processed into plate product. Both hot forging and rolling processes were carried out. The results of experimental heats become the input for selecting the composition and processing of large production-size heats and component fabrication.
4. Mechanical properties characterization
The most important aspect of this project was to develop an alloy or alloys that will reduce component weights by approximately 25%. In order to achieve such weight

14
reductions, the new alloy or alloys had to have nearly 50% higher strength than that of currently used Fe-Cr-Mo alloys. This step required determining the mechanical properties such as tensile, toughness, and creep for both the experimental- and commercial-size heats.
5. Welding process development and weldment properties For the Fe-Cr-W steels to be useful for fabrication of large components, development of a
process for their welding is essential. The work in this area consisted of (a) validation of the applicability of currently used processes for Fe-Cr-Mo steels, (b) identification of weld wire compositions, and (c) determination of the need for any PWHT. For the sake of comparison with base metal and currently used Fe-Cr-Mo steels, we measured the mechanical properties of the weldments such as hardness, tensile, creep, and toughness.
6. Microstructural thermal stability As noted above, ferritic steels derive their properties from the microstructural features
that result from phase transformations during heat treatment and precipitation. The thermal stability of these structural features determines the life of the component in service. In this step, both base and weldments were subjected to thermal exposures at ranges of temperatures and times. The changes from thermal exposures were measured by mechanical property tests such as tensile, creep, toughness, and hardness. Thermal stability results carried out in the laboratory were modeled using kinetic model and verified. The results of this analysis were used to predict the end-of-life of components in service.
7. Manufacturing and testing of prototype components This step will encompass fabricating prototype components with the selected Fe-Cr-W
alloy composition and evaluating the alloy’s performance by installing these components in a chemical plant environment and in other potential applications in basic oxygen furnace (BOF) hoods and recovery boilers. Testing of the prototype components will provide additional data about corrosion performance of the alloy under actual operating conditions.
8. Preparation of data packages for ASTM and ASME code approvals Chemical pressure vessels are designed and constructed to ASME code design stress
values. For Fe-Cr-W alloys to find applications in pressure vessels and other components for the chemical industry, data on alloy composition and properties, along with information on the welding process and component testing results, were assembled into a data package for approvals from the appropriate ASTM and ASME code bodies.
Significant results were obtained during this project for each of the proposed concepts. The most relevant and important results are described below. Details are presented in the appendices to this report.
4.2 Alloy Phase Stability Analysis One focus during this project was to develop an alloy that would be superior to the currently available commercial or near-commercial alloys in the composition range of Fe-3 to 9Cr-Mo(W) and containing refractory carbide formers such as niobium and vanadium. These alloys included a well-known base alloy Fe-2.25Cr-1Mo, designated as Grade 22; two recent high-strength versions of the alloy from Japan, designated as T23 and T24; and a high-strength Fe-9Cr-1Mo

15
grade developed nearly 22 years ago at ORNL, designated as T91. Detailed chemical compositions of these alloys are presented in Table 4.1. In addition to the commercial alloys, R. L. Klueh at ORNL had developed patented alloys [16] of nominal Fe-3Cr-3W composition. Detailed chemical analysis of two Fe-3Cr-3W compositions that were scaled up to 400-lb heats is shown in Table 4.2. Although the proposed project was based on Fe-3Cr-3W alloys, early in the project the industrial team recommended that those alloys be replaced with new compositions so that new U.S. and international patents could be obtained. The new alloys developed during this project replaced part of the tungsten in Klueh’s alloys [16] with molybdenum. Nominal compositions of the new alloys are also included in Table 4.2. Both U.S. and international patents were filed for the new compositions. A detailed phase analysis was carried out using ThermoCalc™ modeling for the alloy compositions listed in Tables 4.1 and 4.2. The results presented in Fig. 4.1 show that after a 700°C temper, the base Fe-2.25Cr-1Mo alloy contains only the M23C6 phase. By comparison, alloy T23 contains V(C,N), M6C, M23C6, and M2B. Alloy T24 contains the same phase as T23 with the exception of the absence of the M6C phase. The ORNL alloys (Klueh’s base patents) containing the Fe-3Cr-3W base (identified as “ORNL” in the figure) and that containing 0.1 wt % tantalum (ORNL-VT) showed only V(C,N) M6C, and M7C3 phases. The M23C6 phase was absent in both ORNL alloys. It was recognized that the absence of M23C6 in the Fe-3Cr-3W alloys was the one important reason for their unique mechanical properties of high-temperature strength and toughness.
Table 4.1. Chemical analysis of commercial or near-commercial alloys used or proposed for the petrochemical industry
Alloy (wt %)
Element T22a T23a,b T24a,c T91a,d C 0.15 max 0.04–0.10 0.05–0.10 0.08–0.12 Si 0.25–1.00 0.50 max 0.15–0.45 0.20–0.50 Mn 0.30–0.60 0.10–0.60 0.30–0.70 0.30–0.60 P 0.030 max 0.030 max 0.020 max 0.020 max S 0.030 max 0.010 max 0.010 max 0.010 max Cr 1.9–2.6 1.9–2.6 2.2–2.6 8.0–9.5 Mo 0.87–1.13 0.05–0.30 0.90–1.10 0.85–1.05 N e 0.030 max 0.12 max 0.030–0.070 W e 1.45–1.75 e e V e 0.20–0.30 0.20–0.30 0.18–0.25 Nb e 0.02–0.08 e 0.06–0.10 Ta e e e e B e 0.0005–0.0060 0.0015–0.0070 e Ti e e 0.05–0.10 e Ni e e e 0.40 max Al e 0.030 max 0.020 max 0.040 max Fe f f f f aASTM A213. bCode Case 2199. cCode Case draft. dCode approved. eNot specified. fBalance.

16
Figure 4.2 shows the comparative phase analysis for the baseline Fe-3Cr-3W alloy (ORNL) and the newly developed composition based on Fe-3Cr-W(Mo), A79741. The compositions of both of these alloys are given in Table 4.2. Results in Fig. 4.2 are for tempering temperatures of 700 and 730°C and show that the partial replacement of tungsten with tungsten plus molybdenum changes the phase stability. The Fe-3Cr-3W alloys contained V(C,N), M6C, and M7C3; and the new alloys contain V(C,N), M6C, and M23C6. A summary of the predicted phases present in various alloys is given in Table 4.3. As this table shows, the lowest-strength alloy contains a simple M23C6 phase. All of the higher-strength alloys contain three or four phases. The ORNL Fe-3Cr-3W and Fe3Cr-3W alloys with 0.1 wt % tantalum (ORNL-VT) are unique in that they do not contain any M23C6. However, when part of the tungsten was replaced in the new alloy (A79741) with tungsten plus molybdenum, the M23C6 phase stabilized instead of the M7C3 phase. The effects of this change in phase stability will be discussed in later sections of this report. Transmission electron micrographs of 2.25Cr-1Mo and 2.25Cr-2WV are compared in Fig. 4.3. These micrographs show the presence of M23C6 in 2.25Cr-1Mo (T22) as predicted and its absence in the molybdenum-free 2.25Cr-2WV alloy, which matches the predicted phases. The 2.25Cr-2WV alloy also showed the presence of fine MC carbides, which is consistent with the prediction of V(C, N), and the presence of M3C +M7C3, which is qualitatively consistent with the prediction of M6C + M7C3.
Table 4.2. Chemical composition of Fe-3Cr-3W (heats 10293 and 10294) and Fe-3Cr-3W(Mo) (heat 79741) alloys
Heat (wt %) Element 10293 10294 A79741 C 0.10 0.1 0.099 Mn 0.39 0.41 0.34 P 0.01 0.011 0.009 S 0.004 0.005 0.003 Si 0.16 0.16 0.21 Ni 0.01 <0.01 0.15 Cr 3.04 3.02 2.97 Mo 0.01 0.01 0.73 V 0.21 0.21 0.22 Cb 0.003 0.004 0.002 Ti 0.001 0.001 0.003 Co 0.005 0.006 0.014 Cu 0.01 0.01 0.11 Al 0.003 0.003 0.008 B 0.001 0.001 <0.001 W 3.05 3.07 1.68 As 0.001 0.001 0.005 Sn 0.003 0.004 0.008 Zr <0.001 <0.001 <0.001 N 0.004 0.003 0.009 O 0.005 0.004 0.004 Ta <0.01 0.09 —

17
Fig. 4.1. Comparison of stable phases predicted in various commercial and near-commercial alloys and ORNL alloys (Fe-3Cr-3W based). All calculations are for a tempering temperature of 700°C.
Fig. 4.2. Comparison of stable phases predicted in ORNL alloys containing ORNL Fe-3Cr-3W vs heat 79741 Fe-3Cr-W(Mo). Calculations were for tempering temperatures of 700 and 730°C.

18
Table 4.3. Presence of predicted phases in various alloys after tempering temperatures of 700 or 730°C
Alloys Phase T22a T23a T24a ORNLa,b,c ORNL-VTa,d A79741a,b,e
V(C,N) No Yes Yes Yes Yes Yes M6C No Yes No Yes Yes Yes M7C3 No No No Yes Yes No M23C6 Yes Yes Yes No No Yes M2B No Yes Yes No No No aAnalysis carried out for tempering temperature of 700°C. bAnalysis also carried out for tempering temperature of 730°C. cORNL heat 10293. dORNL-VT heat 10294. eNewly developed alloy from this project. It is also referred to as Grade A and alloy 315 in the report text and figures.
AEM/XEDS analysis of carbides on extraction replicas
Fig. 4.3. Comparison of phase observed in 2.25Cr-1Mo and 2.25Cr-2WV alloys after normalizing and tempering treatment.
4.3 Alloy Development and Commercial Heat Melting and Processing The alloys were developed based on heats weighing 500 g (1 lb) that were initially melted using nonconsumable-arc melting and casting into water-cooled copper molds. Alloys with acceptable microstructure, impact, and strength properties were vacuum-induction melted (VIM) in 7.5-kg (15-lb) heats. The next incremental steps were 150- and 500-kg (300- and 1000-lb) heats, which were both done at commercial vendors. Based on data for these heats, both Grades A and B [(Fe-3Cr-3(W+Mo)] alloys were melted in 50-ton heats at Ellwood Quality Steel (EQS), New Castle,
M3C + M7C3
M23C6
fine MC carbides

19
Pennsylvania. The heats were melted by an electric-arc furnace, vacuum degassed, and cast into three round ingots and two slab ingots for each heat. The two round ingots from each grade were remelted by electroslag remelting (ESR) and vacuum-arc remelting (VAR) processes and recast in round ingots. The round ingots from the electric furnace, ESR, and VAR heats were hot-forged to 305-mm (12-in.) rounds and 152-mm (6-in.) round-corner square billets at Ellwood City Forge, Ellwood City, Pennsylvania. The slab ingots were hot-rolled to 1.5- by 3-in.-thick plate product at ISG, Coatsville, Pennsylvania. Part of the 152-mm (6-in.) round-corner forgings were hot-rolled to 95-mm (3.75-in.) round bars for processing into seamless tubing at Plymouth Tube Company, Winamac, Indiana. Two different sizes of tubes were produced by the piercing process. No problems were encountered in the processing of slab and round ingots into hot-rolled plate, forgings, or bars and tubing from either Grades A or B. The melting of 50-ton heats, their pouring into various molds, and processed product forms such as forged billets, rolled plates, and seamless tubing are shown in Fig. 4.4.
4.4 Alloy Compositions The chemical composition of 50-ton heats of electric-furnace-melted heats of Grades A and B are shown in Table 4.4. Target compositions (“Aim”) are included for comparison. The chemical composition of the electric-furnace-melted heats changed when they were remelted by VAR and ESR processes. The chemical analyses of Grades A and B steel after the electric-furnace, VAR, and ESR processes are shown in Tables 4.5 and 4.6. These tables show that all elements of the electric-furnace-melted 50-ton heats met the target compositions. The following are the significant changes observed in the chemistry of Grades A and B after the remelting processes: 1. Electroslag remelting reduces the content of silicon in both Grades A and B. It also lowers the
tantalum content for Grade B. 2. VAR reduces the content of manganese in both grades. It also reduces the oxygen content for
both alloys. Both grades still meet the specified chemistry range for these alloys.
4.5 Heat Treatment The alloys developed in this project derive their strength through the generation of a bainitic microstructure. Attaining the desired bainitic structure requires knowing the temperature at which the ferrite is converted into austenite and identifying the cooling rates that produce this structure. The continuous cooling transformation (CCT) diagram that yields such information were developed for both Grades A and B, as shown in Figs. 4.5 and 4.6. These figures indicate that there is only a very minor difference in the transformation behavior of the two grades. Figure 4.7 shows the CCT curve for Grade B, which is also valid for the Grade A steel. A cooling curve showing a cooling rate of 20°C/min is shown on this graph. Based on this figure, it is estimated that a cooling rate of 20°C/min is required to avoid ferrite formation in these steels.

20
Fig. 4.4. Electric furnace melting of 50-ton commercial heats and their casting into ingots and processing into hot-forged ingots, hot-rolled plate, and tubing.
Table 4.4. Vendor and check analysis of two 50-ton heats of Fe-3Cr-W alloy (wt %) Grade A, heat L7974 Grade B, heat L8644
27-in. round 12-in. slab 27-in. round
12-in. slab
Element Aima Vendor Check Vendor Aimb Vendor Check Vendor
Carbon 0.10 0.11 0.099 0.11 0.10 0.11 0.11 0.11
Manganese 0.35 0.36 0.34 0.36 0.35 0.36 0.35 0.36
Phosphorus 0.01c 0.007 0.009 0.007 0.01c 0.008 0.009 0.008
Sulfur 0.01c 0.002 0.003 0.002 0.01c 0.002 0.002 0.002
Silicon 0.2 0.21 0.21 0.21 0.2 0.2 0.2 0.2
Nickel 0.02c 0.15 0.15 0.15 0.02c 0.12 0.12 0.12
Chromium 3.00 2.99 2.97 2.99 3.00 3.01 3.02 3.01
Molybdenum 0.75 0.76 0.73 0.76 0.75 0.74 0.73 0.74
Vanadium 0.25 0.249 0.22 0.249 0.25 0.236 0.21 0.236
Columbium 0.002 0.002
Titanium — 0.003 0.004
Cobalt — 0.014 0.016
Copper 0.11 0.11 0.11 — 0.17 0.17 0.17
Aluminum 0.013 0.008 0.013 — 0.011 0.006 0.011

21
Table 4.4 (continued) Grade A, heat L7974 Grade B, heat L8644
27-in. round 12-in. slab 27-in. round
12-in. slab
Element Aima Vendor Check Vendor Aimb Vendor Check Vendor
Boron 0.01c 0.0002 <0.001 0.0002 0.01c 0.0001 <0.001 0.0001
Tungsten 1.5 1.55 1.68 1.55 1.5 1.48 1.62 1.48
Arsenic 0.005 0.006
Tin 0.008 0.009
Zirconium — <0.001 <0.001
Nitrogen 0.009 0.011
Oxygen 0.004 0.001
Hydrogen 1.6d 2.2d — 1.3d — 2.3d
Tantalum — 0.10 0.107 0.1 0.107 a See Table 4.5 for ranges. b See Table 4.6 for ranges. c Maximum. d Parts per million.
Table 4.5. Chemical analysis of the electric-furnace-melted 50-ton heat 79741 of Grade A after electroslag remelting heat 79742 and vacuum-arc remelting heat 79743 (wt %)
Heat
Element Range 79741
(electric furnace) 79742
(electroslag remelted) 79743
(vacuum-arc remelted) C 0.08–0.12 0.099 0.11 0.11 Mn 0.25–0.45 0.34 0.33 0.25 P 0.01 Max 0.009 0.008 0.008 S 0.01 Max 0.003 0.001 0.001 Si 0.15–0.4 0.21 0.15 0.21 Ni 0.25 Max 0.15 0.15 0.15 Cr 2.8–3.2 2.97 2.95 2.97 Mo 0.65–0.85 0.73 0.74 0.74 V 0.2–0.3 0.22 0.22 0.22 Cb — 0.002 0.001 0.002 Ti — 0.003 0.003 0.003 Co — 0.014 0.013 0.013 Cu — 0.11 0.11 0.1 Al — 0.008 0.005 0.008 B 0.001 Max <0.001 <0.001 <0.001 W 1.35–1.65 1.68 1.67 1.68 As — 0.005 0.007 0.007 Sn — 0.008 0.008 0.008 Zr — <0.001 <0.001 <0.001 N — 0.009 0.013 0.004 O — 0.004 0.001 <0.001 Ta — ––– <0.001 <0.01

22
Table 4.6. Chemical analysis of the electric-furnace-melted 50-ton heat 86441 of Grade B after electroslag remelting heat 86442 and vacuum-arc remelting heat 86443 (wt %)
Heat
Element Range 86441
(electric furnace) 86442
(electroslag remelted) 86443
(vacuum-arc remelted) C 0.08–0.12 0.11 0.11 0.11 Mn 0.25–0.45 0.35 0.33 0.22 P 0.01 Max 0.009 0.009 0.009 S 0.01 Max 0.002 0.001 0.001 Si 0.15–0.4 0.2 0.15 0.2 Ni 0.25 Max 0.12 0.12 0.12 Cr 2.8–3.2 3.02 3.03 3.03 Mo 0.65–0.85 0.73 0.72 0.72 V 0.2–0.3 0.21 0.21 0.21 Cb — 0.002 0.002 0.002 Ti — 0.004 0.003 0.003 Co — 0.016 0.016 0.016 Cu — 0.17 0.17 0.15 Al — 0.006 0.009 0.006 B 0.001 Max <0.01 <0.001 <0.01 W 1.35–1.65 1.62 1.61 1.61 As — 0.006 0.008 0.007 Sn — 0.009 0.01 0.01 Zr — <0.001 <0.001 <0.001 N — 0.011 0.012 0.004 O — 0.001 0.001 <0.001 Ta 0.07–0.13 0.1 0.08 0.1

23
Fig. 4.5. Continuous cooling transformation diagram for Grade A (heat 79741).
Fig. 4.6. Continuous cooling transformation diagram for Grade B (heat 86441).

24
Fig. 4.7. Curve for cooling rate of 20°C/min shown on the cooling transformation temperature plot of Grade B (heat 86441).
The upper-use temperature of ferritic steels is limited by critical transformation temperatures known as A1 and A3. A1 is the lowest temperature at which ferrite transforms to austenite, and A3 is the highest temperature above which the ferrite-to-austenite transformation is complete. The A1 and A3 temperatures for Grades A and B are given in Table 4.7.
Table 4.7. Critical transformation temperatures (°C) for Grades A and B
Critical temperature
Grade A (Heat 79741)
Grade B (Heat 86441)
A1 865 858 A3 967 970
The effect of tempering on the tensile properties of plates of both Grades A and B (alloys 315 and 315T) was studied in a comprehensive manner by Ken Orie of ISG Plate (see Appendix C for his detailed presentation). He investigated the tensile properties of both the 1.5- and 3-in.-thick plates after tempering with temperatures in the range of 1225 to 1380°F (663 to 749°C). Test data were developed on sections of the plates heat-treated in the laboratory heat-treating furnace and on the plates heat-treated in mill heat-treating furnace. The resulting yield strength data at room temperature for both Grades A and B are plotted in Fig. 4.8. In this figure, the plates designated as A8141 refer to electric-furnace-melted heat 79741 of Grade A without tantalum; and the plates marked A8142(Ta) refer to electric-furnace-melted heat 86441 of Grade B, containing 0.1 wt % tantalum. Similar plots for ultimate tensile strength and total elongation are shown in Figs. 4.9 and 4.10. Data in Figs. 4.8, 4.9, and 4.10 show that the strength values for the 3-in.-thick plate are generally lower than those for 1.5-in.-thick plate. The mill-annealed plates showed somewhat lower ductility than plates tempered in the laboratory furnace at ISG Plate.

25
Fig. 4.8. Plot of yield strength at room temperature as a function of tempering temperature for 1.5- and 3-in.-thick plates of Grades A and B steel [A8141 and A8142(Ta)]. (Data from Ken Orie, ISG Plate, Coatesville, Penn.)
Fig. 4.9. Plot of ultimate tensile strength at room temperature as a function of tempering temperature for 1.5- and 3-in.-thick plates of Grades A and B steel [A8141 and A8142(Ta)]. (Data from Ken Orie, ISG Plate)
3Cr-1.5W-.75Mo (Ta) Tensile Curve (all data)
80
100
120
140
160
180
200
1200 1220 1240 1260 1280 1300 1320 1340 1360 1380 1400
Tempering Temperature (F)
A8141-1.5" A8142(Ta)-1.5" A8141-3" A8142(Ta)-3"
3Cr-1.5W-.75Mo (Ta) Yield Curve (all data)
80
100
120
140
160
180
1200 1250 1300 1350 1400
Tempering Temperature (F)
A8141-1.5" A8142(Ta)-1.5" A8141-3" A8142(Ta)-3"

26
Fig. 4.10. Plot of total elongation at room temperature as a function of tempering temperature for 1.5- and 3-in.-thick plates of Grades A and B steel [A8141 and A8142(Ta)]. (Data from Ken Orie, ISG Plate)
The effect of tempering temperature on the tensile properties of 1.5- and 3-in.-thick plates of Grade A (heat 79741) (data generated by Ken Orie at ISG Plate) are compared with the data generated on 6- by 6-in. forgings at ORNL in Figs. 4.11 through 4.13. These figures show that data on forgings are in good agreement with the data on plate product and, thus, form a good basis for selecting tempering temperature for desired tensile properties. The effect of tempering temperature on the Charpy-impact properties of 1.5- and 3-in.-thick plates of Grades A and B was also extensively investigated by Ken Orie of ISG Plate. These data are summarized in Table 4.8. The Charpy-impact energy at 32°F for 1.5-in.-thick plates of Grades A and B is plotted as a function of the Larson-Miller parameter (LMP) in Fig. 4.14. The LMP for tempering is described as follows: LMP = (T + 460)(20 + log t) , (1) where
T = tempering temperature in °F t = tempering time in hours 460 = factor used to convert °F to °R 20 = Larson-Miller constant
The plot in Fig. 4.14 shows that the Charpy-impact energy at 32°F increases with increasing LMP, which reflects an increase in temperature, time, or both. Ultimate tensile levels of 120 and 140 ksi are also shown in this figure. Based on Fig. 4.14, plates of Grades A and B, tempered for 120-ksi tensile strength, will result in Charpy-impact values at 32°F of ~40–110 ft-lb. The LMP corresponding to a 120-ksi ultimate tensile strength and acceptable Charpy values gives a target

27
tempering temperature of ~1345°F. Thus, a temperature of 1345°F (730°C) was chosen as the tempering temperature for both Grades A and B for all of the remaining studies in this project. In a separate study, we investigated the effect of replacing 3 wt % tungsten with 1.5 W + 0.75 Mo on Charpy-impact properties of Grade A (tantalum-free alloy). Data from this study are shown in Fig. 4.15. The detailed compositions of alloys containing tunsten and tungsten plus molybdenum are also included in this figure. Note that for 1.5 W + 0.75 Mo alloys (heats 18608 and 18609), the carbon contents were 0.075 and 0.14 wt %. All of the data were generated for 5/8-in.-thick plates, normalized at 2012°F (1100°C) and tempered at 700°C. It can be seen that the Charpy-impact data for 3 W (heat 10293) and 1.5 W + 0.75 Mo (heat 18609) are very similar. Furthermore, the lower carbon value of 0.075 results in expected improvement in Charpy-impact properties.
Yield strength comparison
0
20
40
60
80
100
120
140
160
180
1200 1220 1240 1260 1280 1300 1320 1340 1360 1380 1400
Tempering Temperature (F)
YS (k
si)
79741-1.5 in
79741-3 in
79741-6 in
79741-6in 1292 F
6" Forging
6" Forging
Fig. 4.11. Comparison of tempering response for yield strength at room temperature of 1.5- and 3-in.-thick plates tested at ISG Plate with 6- by 6-in. forging tested at ORNL for Grade A (heat 79741).

28
0
20
40
60
80
100
120
140
160
180
200
1200 1220 1240 1260 1280 1300 1320 1340 1360 1380 1400
Tempering Temperature (F)
Tens
ile s
tren
gth
(ksi
)
79741-1.5 inch
79741-3 inch
79741-6 inch
79741-6 in 1292 F
6 " Forging
6 " Forging
Fig. 4.12. Comparison of tempering response for ultimate tensile strength at room temperature of 1.5- and 3-in.-thick plates tested at ISG Plate with 6- by 6-in. forgings tested at ORNL for Grade A (heat 79741).
Fig. 4.13. Comparison of tempering response for total elongation at room temperature of 1.5- and 3-in.-thick plates tested at ISG Plate with 6- by 6-in. forgings tested at ORNL for Grade A (heat 79741).
0
2
4
6
8
10
12
14
16
18
20
22
24
1200 1220 1240 1260 1280 1300 1320 1340 1360 1380 1400
Tempering temperature (F)
Elon
gatio
n (%
)
79741-3 in
79741-1.5 in
79741-6 in
79741-6 in 1292 F
6 " Forging
6 " Forging

29
Table 4.8. Charpy-impact properties of 1.5- and 3-in.-thick plates of Grade A (79741) and Grade B (86441) as affected by various tempering temperatures (data from Ken Orie at ISG Plate)
Im p a c t R e s u lts fo r 3 C r-1 .5 W -.7 5 M o (T a )E nergy (F t -lbs ) E nergy (F t-lbs ) E ne rgy (F t -lbs ) E ne rgy (F t -lbs )
M e lt G a Te m p e r (F ) +6 8 F (L ) +3 2 F (L o ng / Tra ns ) 0 F (L ) -4 0 F (L )
A8141-1 1.5 " 1225 8 8 9 5 /4 6 /4 12/8 5 11 11 3 5 7(L7974) 1275 5 6 14 8 /8 10 /10 11/12 6 10 12 3 5 5
1290(M )B 8 /11 11 /14 12/141290(M )T 20 /7 24 /12 24/131320(M )B 105 /102 107 /105 108/1051320(M )T 112 /111 117 /111 117/116
1325 93 96 104 94 /59 95 /69 100/71 62 82 88 17 33 341375 84 89 92 40 /24 47 /26 69/34 44 49 61 26 30 32
A8142-1 1.5 " 1225 5 6 17 8 /3 9 /9 11/11 2 3 13 5 6 7(T a) 1275 6 7 24 6 /6 14/8 18/14 4 5 8 1 3 5
(L8644) 1290(M )B 7 /8 19 /12 25/171290(M )T 10 /6 11/6 23/151320(M )B 38 /33 39 /34 38/391320(M )T 66 /43 65 /43 60/45
1325 69 86 94 83 /57 93 /62 96/86 64 74 88 4 5 131375 4 7 11 63 /na 67 /na 70/na 7 10 38 3 4 5
1380 (M)B 193 /123 193 /131 195/1311380 (M)T 149 /127 167 /152 184/157
A8141-2 3" 1225 4 7 9 6 /5 8 /6 17/9 3 4 4 2 2 3(L7974) 1275 7 8 13 4 /5 6 /7 8/9 3 5 5 4 4 5
1290(M )B 6 /8 18 /10 25/201290(M )T 10 /6 11 /10 13/131320(M )B 128 /121 126 /122 129/1251320(M )T 110 /100 113 /107 121/104
1325 81 86 88 63 /19 69 /23 75/25 26 29 42 6 6 81375 97 99 114 109 /na 115/na 118/na 43 48 59 20 28 36
A8142-2 3" 1225 9 21 57 5 /13 16 /16 19/29 3 6 6 4 5 6(T a) 1275 4 11 12 6 /7 6 /9 7/9 4 6 8 5 5 7
(L8644) 1290(M )B na na na1290(M )T na na na1320(M )B 69 /63 65 /64 61/661320(M )T 96 /85 98 /88 103/84
1325 69 76 93 75 /35 82 /35 96/40 27 33 39 8 11 181375 105 120 151 111 /71 118/98 121/102 73 67 137 76 86 86
4.6 Mechanical Properties The commercial heats of both Grades A and B were subjected to mechanical properties tests in support of developing the database for approvals by ASTM and ASME code. Although both grades were tested for tensile and impact properties, creep testing of Grade B was limited because of lack of funding to develop the needed data on both grades. The long-term creep testing is continuing on Grade A in order to meet the test time of 10,000 h required by ASME code. The detailed mechanical properties data tables for Grade A are presented in the ASME data package in Appendix A. The data plots and observations are presented here.
4.6.1 Tensile Properties The yield, ultimate tensile, total elongation, and reduction of area for three commercial heats of each for Grades A and B are plotted in Figs. 4.16–4.23. All tests were on specimens taken from 6- by 6-in. forgings and were normalized and tempered for 1 h at 2012 and 1346°F (1100 and 730°C), respectively. General observations from these figures are as follows: 1. There is some variation in properties between the three heats of each alloy. 2. A good combination of strength and ductility are noted for both grades across the entire test
temperature range. Only one data point at 600°F (316°C) for one of the heats showed unusually low ductility.

30
3Cr-1.5W-.75Mo (Ta) IMPACT CURVE (1.5")as a function of total combined times during tempering
0
20
40
60
80
100
120
140
160
180
200
33.5 34 34.5 35 35.5 36 36.5 37 37.5 38
Total Larson Miller Parameter
A8141-1.5" A8142(Ta)-1.5"
LCVN
140ksi
120ksi
Fig. 4.14. Charpy-impact data at 32°F for 1.5-in.-thick plates of Grades A and B as a function of the Larson-Miller parameter.
0
50
100
150
200
250
-50 0 50 100 150 200 250
#18608
#18609
#010293
Temperature (°F)
CRH-215
Normalized/Tempered
Chemical Composition
#18608 #18609 #010293Carbon 0.075 0.14 0.10
Manganese 0.24 0.480 0.39Phosphorus 0.006 0.007 0.01
Sulfur 0.01 0.005 0.004Silicon 0.21 0.21 0.16Nickel <0.01 <0.01 0.01
Chromium 3.01 3.02 3.04Molybdenum 0.75 0.76 0.01
Vanadium 0.24 0.24 0.21Columbium 0.001 0.002 0.003
Titanium 0.003 0.003 0.001Cobalt 0.007 0.006 0.005Copper <0.01 <0.01 0.01
Alumnium 0.004 0.004 0.003Boron 0.001 <0.001 0.001
Tungsten 1.54 1.52 3.05Arsenic 0.002 0.001 0.001
Tin 0.003 0.002 0.003Zirconium <0.001 0.001 0.001Nitrogen <0.001 <0.001 0.004Oxygen 0.001 0.004 0.005
Tantalum <0.01 <0.01
Fig. 4.15. Comparison of Charpy-impact data for Fe-3Cr-3W alloy (heat 010293) with alloys containing 1.5 W + 0.75 Mo (heats 18608 and 18609) as opposed to 3 W. All plates were tested after normalizing at 1100°C and tempering at 700°C.

31
3. Grade B showed lower tensile properties than Grade A across the entire test temperature. There is no obvious explanation for this behavior because as seen later, Grade B with 0.1 wt % tantalum did show higher creep strength.
The tensile properties of commercially melted, electric furnace heats of Grades A and B (heats 79741 and 86441) are compared with the properties of commercial and near-commercial alloys (T22, T23, and T24) in Figs. 4.24–4.26. These figures show the following: 1. Yield strength values for both Grades A and B are over 20 ksi higher across the entire test
temperature range than for the highest-strength alloy, T23. This is especially significant at 1200°F, where yield strength values for Grades A and B are nearly 75% higher than those for T23. Both grades have nearly twice the yield strength of the commercial grade of 2.25Cr-1Mo steel (T22) for the entire use temperature of T22.
2. Ultimate tensile strength values for Grades A and B are also more than 20 ksi higher than for T23 across the entire test temperature range. As compared to 2.25Cr-1Mo steel, Grades A and B are nearly 1.5 times stronger for the entire use temperature range of 2.25Cr-1Mo steel (T23).
3. Total elongation values for Grades A and B are little lower than for T22 and T24. However, these values are generally acceptable for most of the component forming and equipment fabrication needs.
Data in Figs. 4.23 through 4.26 clearly show that the new grades meet the tensile strength objectives set for them in this project.
0
28
56
84
112
140
0 280 560 840 1120 1400
Test temperature (°F)
Yiel
d st
reng
th (K
si)
7974-1
7974-2
7974-3
N/T 1100°C / 730°C -1 Hr
Fig. 4.16. Yield strength as a function of test temperature for three commercial heats of Grade A.
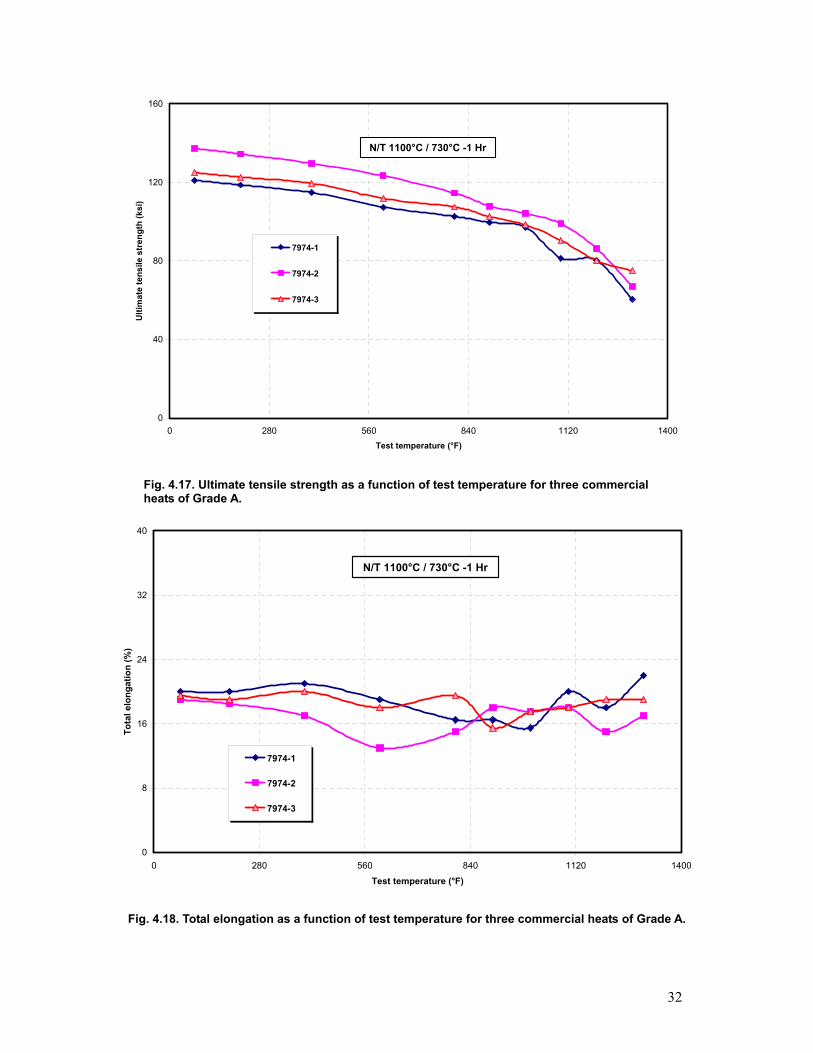
32
0
40
80
120
160
0 280 560 840 1120 1400Test temperature (°F)
Ulti
mat
e te
nsile
str
engt
h (k
si)
7974-1
7974-2
7974-3
N/T 1100°C / 730°C -1 Hr
Fig. 4.17. Ultimate tensile strength as a function of test temperature for three commercial heats of Grade A.
0
8
16
24
32
40
0 280 560 840 1120 1400
Test temperature (°F)
Tota
l elo
ngat
ion
(%)
7974-1
7974-2
7974-3
N/T 1100°C / 730°C -1 Hr
Fig. 4.18. Total elongation as a function of test temperature for three commercial heats of Grade A.

33
0
25
50
75
100
0 280 560 840 1120 1400
Test temperature (°F)
Red
uctio
n of
are
a (%
)
7974-1
7974-2
7974-3
N/T 1100°C / 730°C -1 Hr
Fig. 4.19. Reduction of area as a function of test temperature for three commercial heats of Grade A.
0
28
56
84
112
140
0 280 560 840 1120 1400
Test Temperature (°F)
Yiel
d st
reng
th (k
si)
8644-1
8644-2
8644-3
N/T 1100°C / 730°C -1 Hr
Fig. 4.20. Yield strength as a function of test temperature for three commercial heats of Grade B.

34
0
40
80
120
160
0 280 560 840 1120 1400
Test Temperature (°F)
Ulti
mat
e te
nsile
str
engt
h (k
si)
8644-1
8644-2
8644-3
N/T 1100°C / 730°C -1 Hr
Fig. 4.21. Ultimate tensile strength as a function of test temperature for three commercial heats of Grade B.
0
8
16
24
32
40
0 280 560 840 1120 1400
Test Temperature (°F)
Tota
l elo
ngat
ion
(%)
8644-1
8644-2
8644-3
N/T 1100°C / 730°C -1 Hr
Fig. 4.22. Total elongation as a function of test temperature for three commercial heats of Grade B.

35
0
20
40
60
80
100
0 280 560 840 1120 1400
Test Temperature (°F)
Red
uctio
n of
are
a (%
)
8644-1
8644-2
8644-3
N/T 1100°C / 730°C -1 Hr
Fig. 4.23. Reduction of area as a function of test temperature for three commercial heats of Grade B.
Fig. 4.24. Comparison of yield strength of Grades A and B as compared to commercial and near-commercial grades of steel in a similar chemical analysis range.
0
20
40
60
80
100
120
0 200 400 600 800 1000 1200 1400
Temperature (oF)
Yiel
d st
reng
th (K
si)
8644-1
7974-1
T-22
T-23
T-24
730° C Temper

36
Fig. 4.25. Comparison of ultimate tensile strength of Grades A and B as compared to commercial and near-commercial grades of steel in a similar chemical analysis range.
Fig. 4.26. Comparison of total elongation of Grades A and B as compared to commercial and near-commercial grades of steel in a similar chemical analysis range.
0
5
10
15
20
25
30
35
0 200 400 600 800 1000 1200 1400
Temperature (0F)
Elon
gatio
n (%
)
8644-1
7974-1
T-22
T-24
730° C Temper
0
20
40
60
80
100
120
140
0 200 400 600 800 1000 1200 1400
Temperature (oF)
Ultim
ate
tens
ile s
treng
th (K
si)
8644-17974-1T-22T-23T-24
730° C Temper

37
4.6.2 Charpy-Impact Properties The Charpy-impact properties of electric-furnace-melted commercial heats of Grades A and B are plotted in Fig. 4.27. These data are for samples taken from the 6- by 6-in. forgings. These plots show the following: 1. The impact properties in the longitudinal orientation are superior to those in the transverse
orientation. 2. The impact properties for tantalum containing Grade B (heat 86441) are slightly poorer than
those for tantalum-free Grade A (heat 79741). 3. The impact properties for forgings of both Grades A and B are quite impressive, with 15 ft-lb
DBTT of −20 to −40°F. The corresponding DBTT for 15-mil lateral expansion is also −20 to −40°F.
Fig. 4.27. Charpy-impact energy and lateral expansion data for 6- by 6-in. forgings of Grades A and B (heats 79741 and 86441). Both grades were tested in the normalized and tempered conditions (1100 and 730°C).
Charpy-impact energy data for the 1-in.-thick hot-rolled plate of Grade A (heat 79741) is plotted in Fig. 4.28. The plate data for Grade A are compared with the data on the 6- by 6-in. forgings of Grades A and B in Fig. 4.29. These data show some improvement in the Charpy-impact properties of the plate as opposed to the forgings. Data in Figs. 4.27 through 4.29 also show that the Grades A and B steels developed in this project have upper-shelf Charpy-impact values of ~100 ft and DBTT of −20 to −40°F. Both of these values have met or exceeded the project objectives of 100 ft-lb of upper-shelf energy and a DBTT of −10°F.
4.6.3 Creep Properties Creep tests were conducted on commercial heats of both Grades A and B. As stated earlier, creep testing on Grade A is continuing, but no tests on Grade B are currently in progress because of lack of funds. Tables of creep data on both grades, updated on December 16, 2004, are presented in Appendix D. The isothermal plots of creep-rupture data at 900, 950, 1000, 1100, 1150, and 1200°F (482, 510, 538, 593, 621, and 640°C) are shown in Figs. 4.30 through 4.35. All of the data shown in these figures were developed for a tempering temperature of 1346°F (730°C). A limited set of data was also generated for both Grades A and B after tempering at a temperature of 1292°F (700°C). These data are plotted in Figs. 4.36 and 4.37 for Grades A and B.

38
0
40
80
120
160
-60 -40 -20 0 20 40 60 80
Tem perature (F)
Impa
ct p
rope
rty
(foo
t-lb
s)
7974-1-HZ
7974-1-IA
Rolled Plate (1 " thick)Base metal
Fig. 4.28. Charpy-impact energy data for 1-in.-thick plate of Grade A (heat 79741). Two different plates designated as 79741-HZ and 79741-IA were tested. All data are for plates in the normalized and tempered conditions (1100 and 730°C).
0
20
40
60
80
100
120
140
160
180
200
-100 -50 0 50 100 150 200
Temperature (oF )
Impa
ct E
nerg
y (fo
ot-lb
s)
8644-1
7974-1
7974-1 HZ
7974-1 IA
Fig. 4.29. Comparison of Charpy-impact properties of 1-in.-thick plate of Grade A with 6- by 6-in. forgings of Grades A and B. Both plate and forgings were tested in the normalized and tempered conditions (1100 and 730°C).
The most commonly accepted method for analyzing the creep data for setting the design-allowable is the Lawson-Miller parameter (LMP). This parameter compresses the data at various test temperatures into a single line or curve. Plots are commonly used to set the 105 h creep-rupture strength values for ASME code design stresses. The LMP for creep-rupture data is given as LMP = T(20 + log tr) , (2) where T = test temperature in K and tr = time to rupture in hours.

39
1
10
100
1 10 100 1000 10000
Time (h)
Stre
ss (k
si)
79741 - 73079742 - 73079743 - 730
Grade A Test in Progress Forging
Tempering Temp: 1346° FTest Temperature : 900° F
(a)
1
10
100
1 10 100 1000 10000
Time (h)
Stre
ss (k
si)
79741 - 73079742 - 73079743 - 730
Grade A Test in Progress Forging
Tempering Temp: 1346° FTest Temperature : 950° F
(b)
Fig. 4.30. Isothermal plots of creep-rupture data for three commercial heats of Grade A: (a) 900 (482°C) and (b) 950°F (510°C). All tests are for forgings and plate tested after tempering at 1345°F (730°C).

40
1
10
100
1 10 100 1000 10000
Time (h)
Stre
ss (k
si) 79743 -
730Plate
Grade A Test in Progress Forging and Plate
Tempering Temp: 1346° FTest Temperature : 1000° F
(a)
1
10
100
1 10 100 1000 10000
Time (h)
Stre
ss (k
si)
79741 - 73079742 - 73079743 - 73079741 - 730 - Plate
Grade A Test in Progress Forging and Plate
Tempering Temp: 1346° FTest Temperature : 1100° F
(b)
Fig. 4.31. Isothermal plots of creep-rupture data for three commercial heats of Grade A: (a) 1000 (538°C) and (b) 1100°F (593°C). All tests are for forgings and plate tested after tempering at 1345°F (730°C).

41
1
10
100
1 10 100 1000 10000
Time (h)
Stre
ss (k
si)
79741 - 73079742 - 73079743 - 73079741 - 730 - Plate
Grade A Test in Progress Forging and Plate
Tempering Temp: 1346° FTest Temperature : 1150° F
(a)
1
10
100
1 10 100 1000 10000
Time (h)
Stre
ss (k
si)
79741 - 73079742 - 73079743 - 73079741 - 730 - Plate
Grade A Test in Progress Forging and Plate
Tempering Temp: 1346° FTest Temperature : 1200° F
(b)
Fig. 4.32. Isothermal plots of creep-rupture data for three commercial heats of Grade A: (a) 1150 (621°C) and (b) 1200°F (649°C). All tests are for forgings and plate tested after tempering at 1345°F (730°C).

42
1
10
100
1 10 100 1000 10000
Time (h)
Stre
ss (k
si) 86441 - 730
86441 - 730 - Plate
Grade B
Tempering Temp: 1346° FTest Temperature : 900° F
(a)
1
10
100
1 10 100 1000 10000
Time (h)
Stre
ss (k
si) 86441 - 730
86443 - 730 - Plate
Grade B Tests Discontinued Forging and Plate
Tempering Temp: 1346° FTest Temperature : 1000° F
(b)
Fig. 4.33. Isothermal plots of creep-rupture data for three commercial heats of Grade B: (a) 900 (482°C) and (b) 1000°F (538°C). All tests are for forgings and plate tested after tempering at 1345°F (730°C).

43
1
10
100
1 10 100 1000 10000
Time (h)
Stre
ss (k
si)
86441 - 730
86443 - 730
86441 - 730 - Plate
Grade B Tests Discontinued Forging and Plate
Tempering Temp: 1346° FTest Temperature : 1100° F
(a)
1
10
100
1 10 100 1000 10000
Time (h)
Stre
ss (k
si)
86441 - 730
86443 - 730
86441 - 730 - Plate
Grade B Tests Discontinued Forging and Plate
Tempering Temp: 1346° FTest Temperature : 1200° F
(b)
Fig. 4.34. Isothermal plots of creep-rupture data for three commercial heats of Grade B: (a) 1100 (593°C) and (b) 1200°F (649°C). All tests are for forgings and plate tested after tempering at 1345°F (730°C).

44
1
10
100
1 10 100 1000 10000
Time (h)
Stre
ss (k
si)
86441 - 730
86443 - 730
86441 - 730 - Plate
Grade B Tests Discontinued Forging and Plate
Tempering Temp: 1346° FTest Temperature : 1300° F
Fig. 4.35. Isothermal plots of creep-rupture data for three commercial heats of Grade B. All tests are for forgings and plate tested after tempering at 1345°F (730°C): test temperature is 1300°F (704°C).
1
10
100
1 10 100 1000 10000
Time (h)
Stre
ss (k
si)
N / T = 1100°C / 700°C
1100°F
1200°F
1150°F
Grade AForging (6" x 6")
79743 - 700
Fig. 4.36. Creep-rupture data for commercial heat 79743 of Grade A tested after tempering at 1292°F (700°C).

45
1
10
100
1 10 100 1000 10000
Time (h)
Stre
ss (k
si)
B 700 - 86441B 700 - 86442
N / T = 1100°C / 700°C
1300°F
1200°F
1100°F
Tests Discontinued Forging (6" x 6")
1000°F
Grade B
900°F
Fig. 4.37. Creep-rupture data for commercial heats 86441 and 86442 of Grade B tested after tempering at 1292°F (700°C).
The LMP plot for all of the creep-rupture data on three commercial heats of Grade A is shown in Fig. 4.38. This plot shows a good collapse of data for temperatures in the range of 900 to 1200°F (482 to 649°C). However, it appears that data are best described by two lines: one for the high-stress region and the other for the low-stress region. The transition from high- to low-stress region appears to occur at approximately 50 ksi. The LMP plot for Grade A is compared with the average values reported for the commercially available alloy T23 in Fig. 4.39. It can be seen from this figure that the creep-rupture strength values for Grade A developed in this project exceed the T23 values up to 105 h at 1100°F. At higher temperatures or longer times, the Grade A values match those of T23. The LMP for all the creep-rupture data on three commercial heats of Grade B is shown in Fig. 4.40. Data for Grade B also show a transition in slope from high- to low-stress region similar to that shown for Grade A in Fig. 4.38. The transition for Grade B occurs at approximately 55 ksi, 5 ksi higher than observed for Grade A. The LMP plot for Grade B is compared with the average values for the commercially available alloy T23 in Fig. 4.41. As this figure shows, the creep-rupture values of Grade B, developed in this project, are higher than T23 for conditions of 105 h at 1100°F (593°C). For example, at an LMP value of 20,000, the creep-rupture strength of Grade B is 30 ksi, compared with 20 ksi for T23. However, the creep-rupture strength of Grade B crosses over that of T23 at an LMP corresponding to 105 h rupture at 1100°F (593°C). Beyond this crossover point, the Grade B values are somewhat lower than values for T23. These lower values are believed to have resulted from several creep tests carried out at 1300°F (704°C) for Grade B in which a reduction in creep-rupture strength was expected because excessive oxidation caused a reduction in the specimen cross section. Thus, more longer-term data are needed at test temperatures of ≤1200°F (649°C), to further assess the extent of creep-rupture strength enhancement of Grade B as compared to T23.

46
1
10
100
14000 15000 16000 17000 18000 19000 20000 21000 22000 23000 24000
LMP = T (20+log(tr))
Stre
ss (K
si)
A - 730 - 79743
A - 730 - 79741
A - 730 - 79742
A - 700 - 79743
Plate - 79741
Grade A
Transition point
Fig. 4.38. Larson-Miller parameter plot of creep-rupture data for three commercial heats of Grade A. Note the transition point at 50 ksi for a change in slope from a high-stress to a low-stress region.
1
10
100
14000 15000 16000 17000 18000 19000 20000 21000 22000 23000 24000
LMP = T (20+log(tr))
Stre
ss (K
si)
A - 730 - 79743A - 730 - 79741A - 730 - 79742A - 700 - 79743Plate - 79741T23
Grade A
Transition point
105 h @ 1100° F
Fig. 4.39. Comparison of Larson-Miller plot for three commercial heats of Grade A, with average values reported for the commercial grade T23. Note the crossover point in strength at 105 h at 1100°F (593°C) between Grade A and T23.

47
1
10
100
14000 15000 16000 17000 18000 19000 20000 21000 22000 23000 24000
LMP = T (20+log(tr))
Stre
ss (K
si)
B - 700 - 86441
B - 700 - 86442
B - 730 - 86441
B - 730 - 86443
Plate - 86441
Grade B
Transition point
Fig. 4.40. Larson-Miller plot of creep-rupture data for three commercial heats of Grade B. The transition point for a change in slope from high-stress to low-stress region again occurs at 50 ksi.
1
10
100
14000 15000 16000 17000 18000 19000 20000 21000 22000 23000 24000
LMP = T (20+log(tr))
Stre
ss (K
si)
B - 700 - 86441
B - 700 - 86442
B - 730 - 86441
B - 730 - 86443
Plate - 86441
T23
Grade B
105 h @ 1100° F
Transition point
Fig. 4.41. Comparison of Larson-Miller plot for three commercial heats of Grade B, with average values reported for the commercial grade T23. Note the crossover point in strength at 105 h at 1100°F (593°C) between Grade B and T23.

48
The LMP plots of average values of creep-rupture strength for Grades A and B are compared in Fig. 4.42. As can be seen, Grade B has higher creep-rupture strength than Grade A. For LMP values corresponding to 105 h rupture at 1100°F (593°C), Grade B falls slightly below Grade A. This is again considered the effect of test temperature on oxidation and a corresponding reduction in creep-rupture strength. All tests on Grade A were at temperatures ≤1200°F. For Grade B, several tests were carried out at 1300°F (704°C). Creep-rupture elongation and reduction of area for A and B are plotted as a function of LMP in Figs. 4.43–4.46. These figures show the data for all test temperatures and stresses for which creep rupture has already occurred. The following observations can be made on the basis of the data shown in these figures: • Grade A. Creep-rupture elongation for most tests was more than 10% for all test conditions
(Fig. 4.43). Two data points fell below 10%, but no detailed analysis is available to explain the cause for the observed values of 6 and 7%. Similarly to the case of total elongation (Fig. 4.44), the reduction of area values for most tests was over 40%, with the exception of three tests between 15 and 25%.
• Grade B. The total elongation values for Grade B were mostly over 10% (Fig. 4.45).
However, four very-high-stress tests at 1000 and 1100°F (538 and 593°C) showed low values of 1.5 to ~5%. The low values were only for tests on material tempered at 1292°F (700°C). No values for tempering at 1345°F (730°C) fell below 10%. The reduction of area values for Grade B (Fig. 4.46) was typically over 40%. Only five tests showed lower values, ranging from 4 to ~18%. All of these tests were for a tempering temperature of 1292°F (700°C). The reduction of area values for all tests after a tempering temperature of 1345°F (730°C) was over 40%.
In general, the observed elongation and reduction of area values for Grades A and B are considered acceptable.

49
1
10
100
14000 15000 16000 17000 18000 19000 20000 21000 22000 23000 24000
LMP = T (20+log(tr))
Stre
ss (K
si)
Transition point
Grade B
Grade A
105 h @ 1100° F
Fig. 4.42. Comparison of average values of creep-rupture strength of Grades A and B.
1
10
100
14000 15000 16000 17000 18000 19000 20000 21000 22000 23000 24000
LMP = T (20+log(tr))
Elon
gatio
n (%
)
A - 730 - 79743
A - 730 - 79741
A - 730 - 79742
A - 700 - 79743
Plate - 79741
Grade A
Fig. 4.43. Creep-rupture elongation for creep tests carried out on three commercial heats of Grade A. Data are included for specimens tested after tempering temperatures of 1292 and 1345°F (700 and 730°C).

50
1
10
100
14000 15000 16000 17000 18000 19000 20000 21000 22000 23000 24000
LMP = T (20+log(tr))
Are
a R
educ
tion
(%)
A - 730 - 79743
A - 730 - 79741
A - 730 - 79742
A - 700 - 79743
Plate - 79741 Grade A
Fig. 4.44. Reduction of area for creep tests carried out on three commercial heats of Grade A. Data are included for specimens tested after tempering temperatures of 1292 and 1345°F (700 and 730°C).
1
10
100
14000 15000 16000 17000 18000 19000 20000 21000 22000 23000 24000
LMP = T (20+log(tr))
Elon
gatio
n (%
)
B - 700 - 86441
B - 700 - 86442
B - 730 - 86441
B - 730 - 86443
Plate - 86441
Grade B
Fig. 4.45. Creep-rupture elongation for creep tests carried out on three commercial heats of Grade B. Data are included for specimens tested after tempering temperatures of 1292 and 1345°F (700 and 730°C).

51
1
10
100
14000 15000 16000 17000 18000 19000 20000 21000 22000 23000 24000
LMP = T (20+log(tr))
Are
a R
educ
tion
(%)
B - 700 - 86441
B - 700 - 86442
B - 730 - 86441
B - 730 - 86443
Plate - 86441 Grade B
Fig. 4.46. Reduction of area for creep tests carried out on three commercial heats of Grade B. Data are included for specimens tested after tempering temperatures of 1292 and 1345°F (700 and 730°C).
4.7 Weld and Weldment Properties The most common welding processes used in equipment manufacturing are SA, GTA, and SMA. Of these three processes, SA welding has the highest deposition rate and, thus, is used most in the fabrication of thick-section components. A comparison of the production rate for the SA and GTA processes is shown in Fig. 4.47. For a plate of the same thickness, the SA weld required only 4 passes, while the GTA weld required 14. Other characteristics differentiating the three types of welds include the following: 1. The SA process uses a flux during welding. This process is used for high-production rates. 2. GTA welding uses argon or another inert gas as cover gas. This process is used for specialty
welds. 3. The SMA weld uses filler wire coated with a flux similar to the SA process. The SMA
process is used for manual welding in cases where the automated SA and GTA processes cannot be used.
One focus of this project was to determine the filler wire composition that would yield acceptable Charpy-impact properties without requiring PWHT. This study was carried out for GTA and SA welds. Data and progress made in each case are discussed in the following sections.

52
Fig. 4.47. Macrostructure of gas-tungsten-arc (GTA; left) and submerged-arc (SA; right) welds. Note that the SA weld used only one-third the number of passes of the GTA weld.
4.7.1 GTA Welds Table 4.9 lists the impact properties of GTA welds made in different base metals and with different filler wire compositions. The Charpy-impact data are at room temperature and −40°F. The values for weld and base metal are compared in Table 4.9 and Fig. 4.48.
Table 4.9. Comparison of base metal and gas-tungsten-arc weld impact values (ft-lb)
Room temperature a −40°F a Weld ID Weld type N N/T N N/T
18687 Base metal 84 124 36 32 18687 GTAb 196 172 18707R2 GTA 118 19 18692 Base metal 35 105 16 39 18692 GTAb 73 16 18695 Base metal 45 167 36 35 18695 GTAb 115 32 10293 Base metal 39c 103 27c 5 10293 GTAb 29 15 10293 GTAd 184 124 a N = normalized; N/T = normalized and tempered. bAs-welded data. cQuenched data. All other data are normalized. dPostweld heat-treated at 1292°F (700°C) for 1 h.
02-3667-01 GTA 02-3652-01 SA
13 Passes 4 Passes

53
Figure 4.48 shows that there are two ways to achieve exceptional impact properties in GTA welds. In the first case, use of a PWHT of 1292°F (700°C) can result in significant improve-ment in impact values at room temperature (RT) and −40F. In the second case, the filler wire composition can be modified. This was done by using a solid filler wire of heat 18687, which resulted in Charpy-impact properties similar to those obtained in welds that were given PWHT. The chemical analysis of the base and filler wires used for GTA welding is presented in Table 4.10.
Table 4.10. Chemical analysis of base metal and filler wire compositions used for gas-tungsten-arc welding (wt %)
Element 18687 18692 186595 10293
GTA weld
18687
Weld wire
18707-R2
GTA weld
18692
GTA weld
18695
GTA deposit 10293
C 0.07 0.11 0.095 0.1 0.052 0.1 0.082 0.081 0.058 Mn 0.2 0.29 0.33 0.39 0.2 0.47 0.28 0.34 0.37 P 0.008 0.006 0.008 0.01 0.006 0.006 0.005 0.007 0.004 S 0.005 0.007 0.006 0.004 0.005 0.006 0.006 0.005 0.004 Si 0.21 0.23 0.2 0.16 0.24 0.21 0.26 0.22 0.15 Ni 1 1.13 0.5 0.01 1 2.11 1.12 0.5 0.01 Cr 3.03 3.36 3.03 3.04 3.07 3.01 3.33 3.01 2.92 Mo 0.78 0.84 0.74 0.01 0.77 0.74 0.84 0.75 0.08 V 0.25 0.26 0.23 0.21 0.25 0.23 0.26 0.24 0.23 Cb 0.002 0.005 0.002 0.003 0.003 0.002 0.006 0.003 <0.01 Ti 0.003 0.003 0.003 0.001 0.003 0.003 0.003 0.003 0.003 Co 0.008 0.008 0.006 0.005 0.007 0.009 0.008 0.006 0.008 Cu 0.01 0.01 0.01 0.01 0.01 0.01 0.02 0.02 0.01 Al 0.004 0.002 0.002 0.003 0.004 0.003 0.005 0.002 0.004 B 0.001 <0.001 <0.001 0.001 0.001 0.001 <0.001 <0.001 0.001 W 1.56 1.74 1.54 3.05 1.54 1.52 1.73 1.53 2.84 As 0.001 0.001 0.002 0.001 0.002 0.002 0.003 0.001 <0.001 Sn 0.002 0.003 0.002 0.003 0.002 0.002 0.003 0.003 0.003 Zr <0.001 <0.001 0.001 0.001 <0.001 <0.001 0.001 0.001 <0.001 N 0.001 <0.001 <0.001 0.004 <0.001 <0.001 0.001 <0.001 0.012 O 0.003 0.003 0.001 0.005 0.002 0.001 0.005 0.001 0.007
4.7.2 SA Welds The optimization of filler wire compositions that would allow acceptable Charpy-impact properties of 15 ft-lb of energy and 15 mils lateral expansion at room temperature for SA welds without PWHT was challenging because this welding procedure results in an oxygen content in the weld of nearly ten times that observed for the base metal or GTA welds. A significant effort
GTA - Welds
0
25
50
75
100
125
150
175
200
Impa
ct E
nerg
y (ft
.lbs)
-40F
As-Welded PWHT As-Welded
RT
RT RT
-40F
-40F
Initial CompositionOptimized
Composition
Fig. 4.48. Charpy-impact properties of gas-tungsten-arc welds made with filler wire that requires no postweld heat treatment.

54
in this area yielded progress in improving the Charpy properties of SA welds without requiring PWHT, as shown in Figs. 4.49 and 4.50. The results shown in Fig. 4.49 are for Charpy-impact properties at room temperature. These data show that the initial filler composition, which is the same as base metal, results in low-impact properties without PWHT; these properties are significantly improved with a PWHT at 1292°F (700°C). The composition of the initial filler wire led to further optimization so that the Charpy-impact properties of energy and mils lateral expansions could be met without PWHT. The data graphed in Fig. 4.49 show the progress made in meeting the Charpy-impact property requirements through three incrementally improving filler wire compositions. Filler wire composition-III resulted in impact properties that were nearly three times higher than that of the initial composition and met both the energy and mils lateral expansion requirements of SA welds without requiring PWHT.
SA Welds at RT
0
10
20
30
40
50
60
Impa
ct E
nerg
y (f
t.lbs
)
Initial Composition
As-Welded
PWHT Lateral Expansion
Composition-I Composition-II
Composition-III
As-Welded
As-Welded
Lateral Expansion
Energy Lateral Shear Expansion
Partially Optimized Composition
Fig. 4.49. Charpy-impact properties at room temperature (RT) for submerged-arc welds made with various filler wires. Filler wires were used to obtain 15 ft-lb of energy and 15 mil of lateral expansion at room temperature without any postweld heat treatment.
Two of the filler wire compositions that met the Charpy-impact property requirements at room temperature were used to determine the properties at −40°F. Data in Fig. 4.50 at room temperature and at −40°F show that while we could obtain good impact values at room temperature, values at −40°F were less than 10 ft-lb. Tensile properties at room temperature for the weldments made with the filler wires used in Fig. 4.50 are shown in Fig. 4.51. As this figure shows, one of the filler wires, 25A67-10, resulted in failure in the base metal, indicating that the weld made with this wire is stronger than the base metal in the as-welded condition. However, filler wire 25A67-11 resulted in failure in the weld metal, indicating that it is weaker than the base metal. Still, the weldment properties are very impressive, in both cases. Room-temperature tensile properties of selected GTA and SA welds without PWHT are compared in Table 4.11. Filler wires that resulted in failures in the weld, indicating the weld to be weaker than base metal, generally resulted in acceptable Charpy-impact properties without PWHT. The chemical compositions of filler wires that resulted in acceptable Charpy-impact properties of 15 ft-lb energy and 15 mils of lateral expansion at room temperature are shown in Table 4.12.

55
0
5
10
15
20
25
30
Energy Lateral Shear Expansion
Energy Lateral Shear Expansion
Energy Lateral Shear
Energy Lateral Shear
(ft.lbs)
(ft.lbs)
(ft.lbs)
(ft.lbs)
(Mils)
(Mils)
(Mils)
(Mils)
(%)
(%)
(%)
(%)
Temperature 75oF
25A67-10-54624-880 25A67-11-54624-880
Temperature -40oF
Temperature 75oF
Temperature -40oF
Fig. 4.50. Charpy-impact properties at room temperature and −40F for submerged-arc welds made with two filler wires that exceed the criteria of 15 ft-lb of energy and 15 mil of lateral expansion without requiring postweld heat treatment.
0
20
40
60
80
100
120
140
160
25A67-10-54624-880 25A67-11-54624-880
YS YSUTS UTSTE TERA RA
Fracture at Base
Fracture at Weld
Fig. 4.51. Comparison of tensile properties and fracture locations for submerged-arc welds that met the Charpy-impact requirements without postweld heat treatment.

56
Table 4.11. Comparison of base metal and weldment tensile properties at room temperature for gas-tungsten-arc and submerged-arc welds without postweld heat treatment
Strength
(ksi) Percent
Weld ID Weld type Yield Ultimate tensile Elongation Reduction
Failure location
18718 Base metal 129.9 144.6 16.7 74.4 Base metal 18718/ 18707R2
GTAa 119.8 134.1 13.3 70.8 Weld metal
10293 Base metal 120.0 156.0 16.0 Base metal
10293/ 10293/ 420TTR
SAa 138.0 145.0 14.5 47.6 Base metal
18718 Base metal 129.9 144.6 16.7 74.4 Base metal 18687/ 18660/880
SAa 120.3 132.6 12.9 16.0 Weld metal
aAs-welded condition.
Table 4.12. Chemical analysis of two base metal plates and the submerged-arc weld deposits made with matching fill 10293 and filler wires 25A67-10 and 25A67-11
Base Metal SAW Deposit
Element 54624 10293
54624/ 25A67-10/
880
54624/ 25A67-11/
880
10293/ 10293/
420TTR C 0.093 0.1 0.025 0.027 0.091
Mn 0.24 0.39 0.63 0.62 0.57 P 0.012 0.01 0.009 0.008 0.004 S 0.01 0.004 0.009 0.009 0.003 Si 0.21 0.16 0.33 0.33 0.2 Ni 1.02 0.01 0.99 0.99 0.01 Cr 3.33 3.04 2.63 2.56 2.85 Mo 0.75 0.01 0.69 0.46 0.01 V 0.24 0.21 0.027 0.029 0.22
Cb 0.007 0.003 — — <0.01 Ti 0.027 0.001 — — 0.005 Co 0.009 0.005 — — 0.008 Cu 0.020 0.01 — — 0.01 Al 0.001 0.003 — — 0.016 B <0.001 0.001 — — 0.001 W 1.61 3.05 1.32 1.37 2.98 As 0.001 0.001 — — <0.001 Sn 0.002 0.003 — — 0.003 Zr <0.001 0.001 — — <0.001 N 0.002 0.004 0.009 0.1 0.002 O 0.003 0.005 0.08 0.08 0.029 Ta <0.01 — — — <0.01
57
4.7.3 GTA, SA, and SMA Welds and Properties It was recognized that the GTA welds result in exceptional properties without PWHT and, thus, could be used without PWHT. Although it was demonstrated that acceptable Charpy-impact properties could be obtained for SA welds without PWHT, the project team decided that for consistently acceptable properties, SA welds should be given PWHT. Since SMA welds produce welds of high oxygen composition similar to the composition of the SA welds, SMA welds should also undergo PWHT. During this project, we also used a neural network-based model for identifying the effects of composition and PWHT on the properties of welds. This model is an extremely useful tool and is described in Appendix C. A detailed report on the welding and property status of GTA, SA, and SMA welds was recently prepared and is included as Appendix E in this report. This report also makes recommendations for the final filler wire composition that can result in an optimum combination of impact, tensile, and creep properties. The optimum filler compositions have been prepared by Stoody Company and are currently being tested.

58

59
5. Accomplishments This project has accomplished the technical, technology transfer, and commercialization goals described below.
5.1 Technical Goals A new class of Fe-3Cr-W(V) steels (designated as Grades A and B) were developed during this project. Grade A, which was studied in greater detail, exceeded the goals of the project for its strength, toughness, and PWHT requirements during welding. Both Grades A and B were scaled up to commercial-size heats of 50 tons each and processed commercially into forgings, plate, and tubing. Both alloys were characterized for their mechanical properties, including tensile strength, Charpy-impact toughness, and creep strength. However, we obtained more creep data for Grade A than for Grade B. Both grades were tested for their response to common welding methods (GTA, SA, and SMA). Grade A was investigated in great detail for weld and weldment properties. All of the technical goals were met through the efforts of the project team.
5.2 Technology Transfer The technology of new Fe-3Cr-W(V) steels developed in this project was transferred to industry. Two mechanisms were used: 1. The project team consisted of steel producers; producers of products such as forgings, plate,
and tubing; a welding wire producer; component and pressure vessel fabricators; and users. The team partners actively participated in all aspects of this project and thus acquired significant knowledge of the newly developed steels in this project.
2. The technology transfer beyond the team partners was accomplished through presentations at DOE annual project review meetings, three presentations at national and international technical meetings, and publication of two technical papers in conference proceedings. Further technology transfer was accomplished through presentations by industrial partners at certain committee meetings such as ASTM and presentations of data on the new steels to their customers.
5.3 Publications and Patents Publications from this project are listed below. These publications are reproduced in full in Appendix B of this report. Key presentations from this project are included in Appendix C of this report. 1. V. K. Sikka, R. L. Klueh, P. J. Maziasz, S. Babu, M. L. Santella, M. H. Jawad, J. R. Paules,
and K. E. Orie, “Mechanical Properties of New Grades of Fe-3Cr-W Alloys,” pp. 97-106 in Experience with Creep-Strength Enhanced Ferritic Steels and New and Emerging Computational Methods, PVP-Vol. 476, ASME, New York, 2004.

60
2. V. K. Sikka, “High-Strength Fe-3Cr-W(Mo) Steel for Petrochemical Applications,” in Proceedings of 2004 NPRA Maintenance Conference (published as conference proceedings CD) May 25–28, 2004, San Antonio, Texas.
3. Kenneth Orie, “Mechanical Property Evaluation of New Fe-3Cr-Mo-W(Ta) Steel,” ISG Plate, Coatesville, Penn., March 26, 2004.
4. Standard Specification for Pressure Vessel Plates, Alloy Steel, Chromium-Tungsten- Molybdenum-Vanadium and Chromium-Tungsten-Molybdenum-Vanadium-Tantalum, submitted by Ken Orie at ISG Plate to ASTM for approval, May 2004.
In addition to publications and presentations, two patent disclosures were made as a result of this project. These patent disclosures are listed below. 1. A new invention disclosure (ID 1156, S-99,347) entitled “Improved Cr-W-V Bainitic/Ferritic
Steel Composition” was filed on September 19, 2002.
2. The invention (ID 1156C), retitled “CR-W-V Bainitic/Ferritic Steel Compositions,” has been filed in the U.S. Patent Office and foreign (PCT), December 16, 2003.
5.4 Commercialization Significant progress towards commercialization of the new steels developed in this project was made through the following steps: 1. Obtained approval of specifications in ASTM for both Grades A and B 2. Made progress toward obtaining ASME Pressure Vessel and Boiler Code approved design-
allowable stresses for Grade A by submitting its comprehensive mechanical properties data package to the code committees
3. Retained Dr. Maan Jawad as a consultant to the project for participating at the ASME Code Committee Review meetings to answer any questions that might arise during deliberations
4. Ensured further commercialization through visits by Dr. Jawad to various companies and by making their system design engineers familiar with the advantages of using the new steels

61
6. Summary and Conclusions
6.1 Summary This project developed a new class of Fe-3Cr-W(V) ferritic steels for chemical processing equipment such as hydrocrackers, hydrotreaters, and heat recovery systems. The key property targets for the new steels were (1) 50% higher tensile strength at temperatures up to 932–1112°F (500–600°C) than currently available materials in the class; (2) a potential for not requiring PWHT for certain welding processes; (3) a reduction in equipment weight by 25%; and (4) resulting impact properties of approximately 100 ft-lb of upper shelf energy and a DBTT of −10°F. The competing commercially available alloys in this class include the widely used 2.25Cr-1Mo steel (also known as Grade 22) and the recently available Grades T23 and T24. The research and development work was conducted by a team consisting of chemical and petrochemical companies (ExxonMobil Chemical Company, BP Amoco, and DuPont); materials producers (ISG Plate, Ellwood Materials Technologies Company, Plymouth Tube Company, and Ellwood National Forge); a component fabricator and welding process developer (Nooter Fabrication Services Inc.); a weld wire producer and process developer (Stoody Company); a heat recovery unit construction company (Nooter-Eriksen); and a national laboratory (ORNL). Industry participated by (1) identifying reactor vessels and other components that can take advantage of the new steel, (2) testing components, (3) assisting in conducting production-size heats of the new steel, (4) assisting in component fabrication and process development, and (5) developing the welding process. Welding wire suppliers produced small batches of wire for trials by Nooter and ORNL. Industry representatives also provided guidance and direction to the project through active participation in identifying and monitoring project deliverables and in writing technical progress reports. The project identified two compositions with Fe-3Cr-W(V) as the base. These compositions were designated as Grades A and B, sometimes referred to as Grades 315 and 315T. Grades A and B differ only in that the latter contains 0.10 wt % Ta. Both grades were scaled up to commercial heats of 50 ton each. Ingots from both heats were processed (using commercial practice) into forgings, plate, and tubing. Detailed mechanical property characterization was carried out on both Grades A and B. The most expensive of the mechanical tests was creep strength testing. Because of the budget constraints, the long-term creep strength tests are continuing on Grade A only. A significant effort was devoted to the development of the welding process and weldment properties for the new steel. The steel compositions and mechanical properties database were used to prepare data packages for obtaining ASTM specifications and ASME code approvals for the new steels.
6.2 Conclusions The following are the important conclusions from this project: 1. Through this project, an industry-ORNL team has developed two U.S. versions of high-
strength steels based on Fe-3Cr-W(V) composition (Grades A and B). Grade B has higher creep strength than Grade A, but its higher strength comes through the addition of 0.1 wt % Ta, which adds to the cost of the alloy.

62
2. The newly developed Grade A steel, which was investigated in more detail than Grade B, showed the attributes described in Table 6.1, as compared with the commonly used 2.25Cr-1Mo steel and a recent high-strength version from Japan known as T23:
Table 6.1. Comparison of the new Grade A steel composition with two commercial steels
Comparison of Grade A Fe-3Cr-W(V) steel with Property 2.25Cr-1Mo steel T23 steel Yield strength at room temperature 60% higher 25% higher Yield strength at high temperatures 110% higher at 900°F
(482°C) 45% higher at 1110°F (600°C)
Tensile strength at room temperature 50% higher 33% higher Tensile strength at high temperatures 50% higher at 900°F
(482°C) 33% higher at 1110°F (600°C)
Charpy-impact upper shelf energy a a Ductile-to-brittle transition temperature b b Creep-rupture strength — 35% higher for 105h at
932ºF (500ºC) Same for 105h at 1100ºF (590ºC)
aValues of upper shelf energy in the range of 50 to 100 ft-lb. No comparable data available. bDuctile-to-brittle transition temperature of −20 to −40ºF. No comparable data available. 3. Grade B steel, investigated less detail than Grade A, showed the following attributes:
a. Tensile property improvements were similar to those described for Grade A. b. Impact properties were similar to the impact properties of Grade A. c. Grade B showed 10–20% higher creep rupture strength than Grade A for conditions
causing rupture in 105 h at temperatures ≤1100°F (593°C). However, for higher test temperatures, Grade B had a slightly lower creep-rupture strength than Grade A.
d. Limited welding trials with Grade B showed no unusual problems. We anticipate that the weld wire for this grade of steel will require a higher tantalum content in order to obtain the target value.
4. Grades A and B have been shown to be scalable to 50-ton heats by standard electric furnace
melting techniques. Furthermore, both grades can be processed by commercial methods to forgings, plate, and tubing.
5. The new steels are used in normalized and tempered (N/T) conditions. The N/T treatment consists of austenitizing at 2012°F (1100°C), followed by air cooling to room temperature and tempering at 1345°F (730°C).
6. A significant number of creep tests at temperatures ranging from 900 to 1300°F (482 to 704°C) were conducted on both grades. Several creep tests exceeding 5000 h have been conducted for Grade A. Long-term creep testing of Grade B was discontinued because of lack of funds.
7. Alloy composition, heat treatment, and tensile property data on Grades A and B were used to obtain their ASTM specifications. Both grades are included in ASTM Specification A1041-04. This is the first step in making newly developed steel grades available for recommendation by equipment designers for the construction of chemical processing equipment.

63
8. A detailed mechanical property database on Grade A was compiled and submitted to ASME Pressure Vessel and Piping Code committees. This package will be used to establish the design-allowable stresses for the new steel. This is the second step in making the newly developed steel available for recommendation by the equipment designers for the construction of chemical processing equipment.
9. Commercial use of the new steels requires introducing them to potential users. This was accomplished through presentations about the new steels at national technical meetings sponsored by ASME, ASM International, and others. Part of the commercialization will also occur because steel producers, welding wire producers, component and system fabricators, and steel users were part of this project.
6.3 Commercialization Aspects (Plans, Status, Barriers) A plan that identified steps needed for commercialization of the new steels was developed. The steps identified were (1) getting specifications of the new steels approved in ASTM, (2) getting ASME Pressure Vessel and Boiler Code–approved allowable-design stresses for the new steels, (3) making systems designers familiar with the properties of the new steels so that they can be specified as a material of choice, and (4) providing test material and welding filler for fabricators to become familiar in the use of the new steels. Progress made towards the commercialization was as follows: 1. Both Grades A and B were approved for inclusion in ASTM specifications. The new alloys
are listed in Specification A1041-04. 2. Design-allowable stresses for the alloy have to be set by ASME Boiler and Pressure Vessel
Code committees. Setting of the design allowables by ASME requires the submission of a detailed mechanical properties data package for review and analysis by the code committees. The data package for the advanced alloy developed in this study was submitted in August 2004 (see Appendix A). Typically, 12 to 24 months are needed for code bodies to review all of the information and perform analysis to set the design-allowable stresses. In order to expedite the ASME code approval process, we have subcontracted Dr. Maan Jawad of Global Engineering (previously with Nooter Corporation) to actively pursue the process by participating in ASME Code Committee meetings on a regular basis and responding to any questions that may be asked.
3. New alloys need to be specified by equipment designers. In addition to obtaining approvals from ASTM and ASME code, a parallel activity is needed to educate equipment designers about the benefits of the new alloy. This activity was partially accomplished by presenting papers at technical conferences and having the industrial partners of this project share information on the new alloy within their companies (for the users) and with their customers (for the alloy producers). We are also relying on our consultant, Dr. Jawad, to further this cause by visiting individual companies and making presentations about this alloy. Because of his design background at Nooter Corporation and his familiarity with both chemical and heat recovery systems, we anticipate that his involvement will further reduce the time until the new alloy is in commercial use.
4. In addition to approvals by ASTM and ASME, and designers specifying the new alloy as material of choice, it has to be commercially available at a competitive price in various product forms (forgings, plate, tubing, and piping). Furthermore, the welding consumables such as filler wire, flux, and electrodes need to be available commercially. The team members of this project are capable of meeting both of these requirements as they arise. The

64
component fabricators have been contacting ORNL to receive the plate samples from the newly developed alloy so that they can develop their own procedures for bending, forming, and welding. The plate samples are currently being offered at no cost to U.S.-based companies for their use. Based on these trials, these companies will be ready to build equipment when the need arises.
In summary, all elements essential for commercialization of the new alloy are in place, and further technology transfer is necessary.

65
7. Recommendations This project has accomplished nearly all proposed aspects. However, the following is a list of recommendations that can further take advantage of this project:
1. Provide support to continue long-term creep testing of Grade A. These data are essential for
obtaining ASME code approval and gaining confidence from users in the long-term stability of the new steels.
2. Provide support to initiate the creep tests on Grade B. 3. Provide support for installing components from the new steel in commercial production
conditions. Successful installation and operation under production conditions develops user confidence in trying new steels. One example of this installation could include tubing in heat recovery boilers.
4. Although progress on welding process and filler wire development was made during this project, there is a need to develop a significant amount of mechanical property data on weldment. This effort is needed initially for welds in 2- to 4-in.-thick plates of Grade A and subsequently for welds in Grade B.
5. The welding process also needs to be demonstrated for actual components such as tube-to-tube or tube-to-tube sheet. Again, this is required initially for Grade A, followed by Grade B.
6. In order to be competitive in the global market, the United States needs to stay active in further development of high-strength steels. The new tools of thermodynamic and kinetic modeling and the experience in developing steels in this project will make future developments somewhat easier.

66

67
8. References 1. J. Nutting, “The Structural Stability of Low-Alloy Steels for Power Generation
Applications,” pp. 12–30 in Advanced Heat Resistant Steel for Power Generation, ed. R. Viswanathan and J. Nutting, IOM Communications, London, England (1999).
2. R. L. Klueh, “Elevated Temperature Properties of Ferritic Steels,” pp. 617–652 in Properties and Selection: Irons, Steels and High-Performance Alloys, Metals Handbook, 10th ed., Vol. 1, ASM-International, Materials Park, OH (1990).
3. F. Masuyama, T. Koyoyama, Y. Sawaragi, and A. Iseda, “Development of a Tungsten-Strengthened Low-Alloy Steel with Improved Weldability,” pp. 173–181 in Materials for Advanced Power Engineering (Part 1), ed. D. Coutsouradis et al., Kluwer Academic Publishers, Netherlands (1994).
4. R. L. Klueh and R. W. Swindeman, “The Microstructure and Mechanical Properties of a Modified 2.25-1Mo Steel,” Metall. Trans. A, 17A (1986) 1027–1034.
5. T. Ishiguro, K. Ohnishi, Y. Murakami, S. Mima, and J. Watanabe, “Research on Chrome-Moly Steels,” pp. 43–51 in MPC-21, ed. R. A. Swift, ASME, New York (1984).
6. J. A. Todd, R. W. Swindeman, and R. L. Klueh, “New Low-Chromium Ferritic Pressure Vessel Steels,” pp. 83–115 in MiCon 86: Optimization of Processing, Properties and Service Performanced Through Microstructural Control, ASTM STP 979, ed. B. L. Bramfitt, R. C. Benn, C. R. Brinkman, and G. F. Vander Voort, ASTM, Philadelphia (1988).
7. R. L. Klueh, D. J. Alexander, and P. J. Maziasz, “Bainitic Chromium-Tungsten Steels with 3% Chromium,” Met. Trans. 28A (1997) 335.
8. R. L. Klueh and P. J. Maziasz, “Cr-W-V Bainitic/Ferritic Steel with Improved Strength and Toughness and Methods of Making,” U.S. Patent 5,292,384 (March 8, 1994).
9. R. L. Klueh and P. J. Maziasz, “The Microstructure of Chromium-Tunsten Steels,” Metall. Trans. A, 20A (1988) 373–382.
10. V. K. Sikka, M. G. Cowgill, and B. W. Roberts, “Creep Properties of Modified 9Cr-1Mo Steel,” pp. 413–423 in Conference on Ferritic Alloys for Use in Nuclear Energy Technologies, TMS-AIME, New York (1984).
11. V. K. Sikka, G. T. Ward, and K. C. Thomas, pp. 65–84 in Ferritic Steels for High Temperature Applications, ASM, Materials Park, OH (1982).
12. F. Masuyama, “New Developments in Steels for Power Generation Boilers,” pp. 33–48 in Advanced Heat-Resistant Steel for Power Generation, ed. R. Viswanathan and J. Nutting, IOM Communications, London, England (1999).
13. Y. Sawaragi, K. Miyata, S. Yamamoto, F. Masuyama, N. Komai, and T. Yokoyama, “Properties after Service Exposure of 2.25Cr-1.6W-V,Nb (HCM2S) and 12Cr-0.4Mo-2W-1Cu-V,Nb (HCM12A) Steel Tubes in a Power Boiler,” in Advanced Heat-Resistant Steel for Power Generation, ed. R. Viswanathan and J. Nutting, IOM Cummunictions, London, England (1999).
14. Y. Sawaragi, A. Iseda, F. Masuyama, and T. Yokoyama, “Development of a High-Strength Low-Alloy Steel for Boiler Materials,” pp. 287–294 in Heat-Resistant Materials II, ed. K. Natesan, P. Ganesan, and G. Lai, ASM-International, Materials Park, OH (1995).
15. Experience with Creep-Strength Enhanced Ferritic Steels and New and Emerging Computational Methods, ASME/JSME Pressure Vessels and Piping Conference, PVP-Vol. 476, ed. Y.-Y. Wang, ASME (2004).

68