ITP Chemicals: Chemical Bandwidth Study - Energy Analysis: A ...
67
Industrial Technologies Program Exergy Analysis: A Powerful Tool for Identifying Process Inefficiencies in the U.S. Chemical Industry Chemical Bandwidth Study DRAFT Summary Report December 2006 Study conducted for the U.S. Department of Energy by JVP International, Incorporated and Psage Research, LLC Summary report prepared by Energetics Incorporated
Transcript of ITP Chemicals: Chemical Bandwidth Study - Energy Analysis: A ...

Industrial Technologies Program
Exergy Analysis: A Powerful Tool for Identifying Process Inefficiencies in the U.S. Chemical Industry
Chemical Bandwidth Study
DRAFT Summary Report December 2006 Study conducted for the U.S. Department of Energy by JVP International, Incorporated and Psage Research, LLC Summary report prepared by Energetics Incorporated

Chemical Bandwidth Study Summary Report i
Preface The U.S. Department of Energy, Office of Energy Efficiency and Renewable Energy (DOE/EERE), Industrial Technologies Program (ITP) supports research and development (R&D) to improve the energy efficiency and environmental performance of industrial processes. The program's primary role is to invest in high-risk, high-value R&D projects that will reduce industrial energy requirements while stimulating economic productivity and growth. ITP's Chemicals subprogram supports R&D relevant to the chemical industries. This study, which focuses on energy efficiency in the chemical industry, was initiated in FY2003 by Dr. Dickson Ozokwelu, Lead Technology Manager, ITP Chemicals subprogram, to help guide research decision-making and ensure that Federal funds are spent effectively. The study was overseen by both Dr. Ozokwelu and Dr. Joseph Rogers of the American Institute of Chemical Engineers (AIChE), with analytical studies performed by Psage Research, LLC and JVP International. The intent of the study is to apply energy and exergy analysis to selected chemical manufacturing processes to determine sources of inefficiency and to locate potential process-specific areas for energy recovery. Front-end analysis was performed by Psage Research, LLC, using various software tools developed by Psage, Jacobs Engineering of the Netherlands, and AspenTech (Aspen Plus, and the AspenPEP library, a collaboration between AspenTech and SRI's PEP program). JVP International reviewed and further analyzed the results to prepare recommendations for future research. The study provides valuable insights into potential targets for the development and adoption of advanced, energy-efficient technologies in chemicals manufacture. It will be an important tool at DOE for assessing future directions in chemicals R&D conducted under the ITP Chemicals subprogram.
This summary is a condensation of a much larger work, and does not contain the comprehensive data sets generated in that effort. Questions concerning the original work or this summary report can be directed to the authors shown below. Dickson Ozokwelu U.S. Department of Energy Industrial Technologies Program 1000 Independence Ave, S.W. Washington, DC 20585 Phone: 202-586-8501 Email: [email protected]
Joseph Porcelli JVP International, Incorporated 102 Lincoln Street Staten Island, NY 10314 Phone : 917-912-9804 Email : [email protected]
Peter Akinjiola Psage Research, LLC 234 Village Walk Drive Macungie, PA 10314 Phone: 610-966-7106 Email: [email protected]
This report is available on-line at www.eere.energy.gov/industry/chemicals.

Chemical Bandwidth Study Summary Report ii

Chemical Bandwidth Study Summary Report iii
Table of Contents Introduction
Overview of Chemical Industry Energy Use ........................................................................ 1 Objectives of the Analysis .................................................................................................... 2
Methodology Energy Bandwidth Analysis ................................................................................................. 3 Introduction to Exergy Analysis ........................................................................................... 5 Selection of Chemical Processes .......................................................................................... 8 Energy and Exergy Modeling Methodology......................................................................... 11 Model Integration............................................................................................................. 11 Unit Processes and Equipment......................................................................................... 12 Model Output ................................................................................................................... 13 Limitations of the Approach ................................................................................................. 14
Summary of Results
Overview of Results.............................................................................................................. 15 Trends Observed in the Bandwidth Analysis Results………………………………………17 Chemical Bandwidth Profiles ............................................................................................... 19
Ethylene .........................................................................................................................................20 Chlorine .........................................................................................................................................21 Sulfuric Acid ..................................................................................................................................22 Hydrogen .......................................................................................................................................22 Ammonia ........................................................................................................................................23 Ethylene Oxide...............................................................................................................................23 Propylene .......................................................................................................................................24 Terephthalic Acid...........................................................................................................................24 Carbon Black .................................................................................................................................25 Methyl Tert-Butyl-Ether (MTBE)...................................................................................................25 Methanol ........................................................................................................................................26 Acrylonitrile (ACN)........................................................................................................................27 Ethylene Dichloride .......................................................................................................................28 Formaldehyde ................................................................................................................................28 Phenol ............................................................................................................................................29 Nitric Acid......................................................................................................................................30 Propylene Oxide.............................................................................................................................30 Soda Ash ........................................................................................................................................31 p-Xylene .........................................................................................................................................31 Styrene ...........................................................................................................................................32 Ethylbenzene ..................................................................................................................................33 Ethylene Glycol..............................................................................................................................34 Vinyl Chloride ...............................................................................................................................34 Methyl Methacrylate ......................................................................................................................35 Carbon Dioxide..............................................................................................................................35 Oxygen ...........................................................................................................................................36 Nitrogen .........................................................................................................................................36 Urea ...............................................................................................................................................37 Phosphoric Acid.............................................................................................................................37 Vinyl Acetate (VAM) ......................................................................................................................38 Ammonium Nitrate .........................................................................................................................38
Chemical Bandwidth Study Summary Report iv
Caprolactam ..................................................................................................................................39 Acetic Acid .....................................................................................................................................39 Hydrochloric Acid..........................................................................................................................40 Isobutylene .....................................................................................................................................40 Cumene ..........................................................................................................................................41 Aniline............................................................................................................................................42 Nitrobenzene ..................................................................................................................................42 Ammonium Sulfate .........................................................................................................................43 Butadiene .......................................................................................................................................43 bisPhenol A ....................................................................................................................................44 Cyclohexane...................................................................................................................................44 Isopropyl Alcohol...........................................................................................................................45 Methyl Chloride .............................................................................................................................45
Energy and Exergy Losses in Unit Operations .................................................................... 46 Recommendations for Research..................................................................................................... 51 References ........................................................................................................................................ 57 Appendix A Data Table.............................................................................................................................. 59
Chemical Bandwidth Study Summary Report 1
Overview of Chemical Industry Energy Use
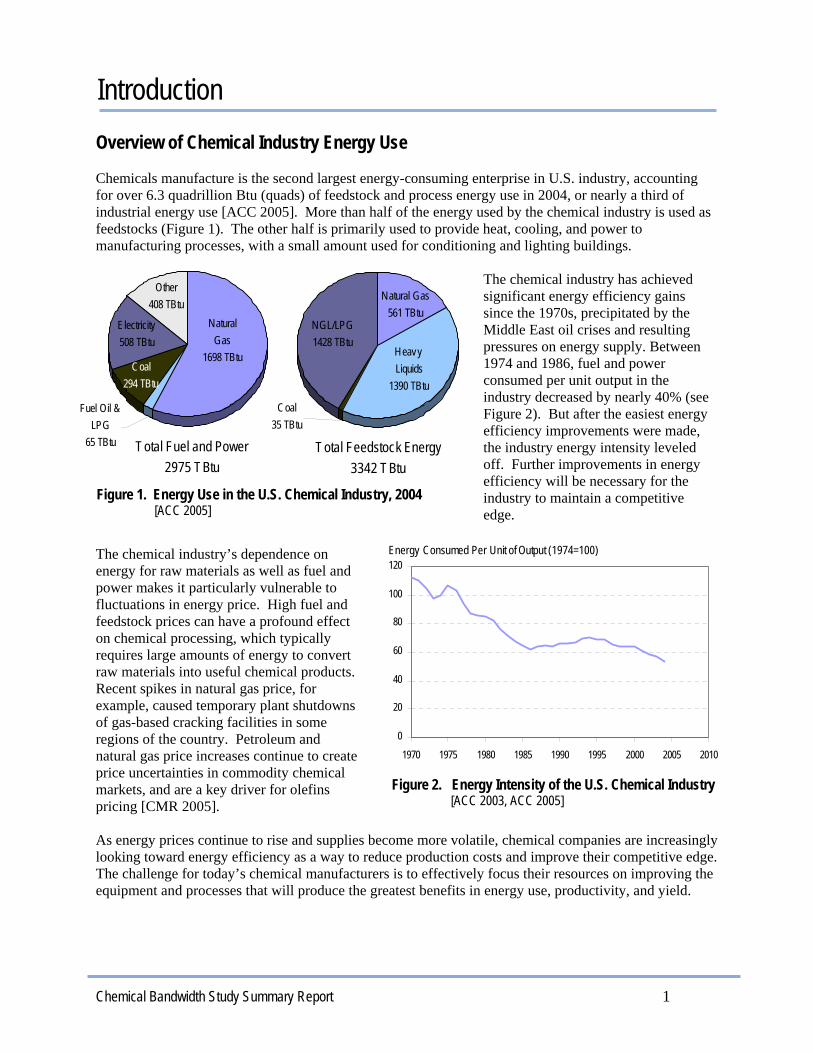
Chemicals manufacture is the second largest energy-consuming enterprise in U.S. industry, accounting for over 6.3 quadrillion Btu (quads) of feedstock and process energy use in 2004, or nearly a third of industrial energy use [ACC 2005]. More than half of the energy used by the chemical industry is used as feedstocks (Figure 1). The other half is primarily used to provide heat, cooling, and power to manufacturing processes, with a small amount used for conditioning and lighting buildings.
The chemical industry has achieved significant energy efficiency gains since the 1970s, precipitated by the Middle East oil crises and resulting pressures on energy supply. Between 1974 and 1986, fuel and power consumed per unit output in the industry decreased by nearly 40% (see Figure 2). But after the easiest energy efficiency improvements were made, the industry energy intensity leveled off. Further improvements in energy efficiency will be necessary for the industry to maintain a competitive edge.
The chemical industry’s dependence on energy for raw materials as well as fuel and power makes it particularly vulnerable to fluctuations in energy price. High fuel and feedstock prices can have a profound effect on chemical processing, which typically requires large amounts of energy to convert raw materials into useful chemical products. Recent spikes in natural gas price, for example, caused temporary plant shutdowns of gas-based cracking facilities in some regions of the country. Petroleum and natural gas price increases continue to create price uncertainties in commodity chemical markets, and are a key driver for olefins pricing [CMR 2005]. As energy prices continue to rise and supplies become more volatile, chemical companies are increasingly looking toward energy efficiency as a way to reduce production costs and improve their competitive edge. The challenge for today’s chemical manufacturers is to effectively focus their resources on improving the equipment and processes that will produce the greatest benefits in energy use, productivity, and yield.
Introduction
Energy Consumed Per Unit of Output (1974=100)
0
20
40
60
80
100
120
1970 1975 1980 1985 1990 1995 2000 2005 2010
Figure 2. Energy Intensity of the U.S. Chemical Industry [ACC 2003, ACC 2005]
Total Fuel and Power2975 TBtu
Fuel Oil & LPG
65 TBtu
Coal294 TBtu
Other 408 TBtu
Electricity 508 TBtu
Natural Gas
1698 TBtu
Total Feedstock Energy3342 TBtu
Natural Gas 561 TBtu
Heavy Liquids
1390 TBtu
NGL/LPG 1428 TBtu
Coal 35 TBtu
Figure 1. Energy Use in the U.S. Chemical Industry, 2004
[ACC 2005]

Chemical Bandwidth Study Summary Report 2
Objectives of the Analysis At the U.S. Department of Energy’s Office of Energy Efficiency and Renewable Energy (DOE/EERE), the Industrial Technologies Program (ITP) is supporting research and development to improve the energy efficiency and environmental performance of processes used in many of the basic materials industries. ITP’s Chemicals and Allied Processes (CAP) subprogram works specifically with the chemicals, petroleum refining, and forest products industries to accelerate the development of advanced, energy-efficient technologies. Projects are cost-shared by industry and typically involve high-risk, pre-competitive research that individual companies could not fund independently. In many cases, the research has national rather than local benefits, i.e., chemical companies across the nation can potentially reap the energy and economics benefits of research. To guide research decision-making and ensure that Federal funds are spent effectively, ITP needs to know which manufacturing processes are the most energy-intensive and least efficient. To gain knowledge of process inefficiencies in chemicals manufacture, the ITP CAP program commissioned a “bandwidth” study to analyze the highest energy-consuming chemical processes. The objectives of the study were to
• identify and quantify the inefficiencies of existing technologies and processes in selected chemicals manufacture;
• pinpoint the location of energy losses;
• calculate the recoverable energies for each process;
• examine energy losses in major unit operations that are common across the chemicals selected; and
• Introduce the concept of exergy into energy usage and recovery.
A chief advantage of this study is the use of exergy analysis as a tool for pinpointing inefficiencies. Prior analyses have focused only on energy and ignored the quality of energy and the degradation of energy quality. Exergy analysis goes a step further to evaluate the quality of the energy lost, and distinguishes between recoverable and non-recoverable energy. A description of the unique characteristics and benefits of exergy analysis and the results of the study comprise the remainder of this report.
Chemical Bandwidth Study Summary Report 3
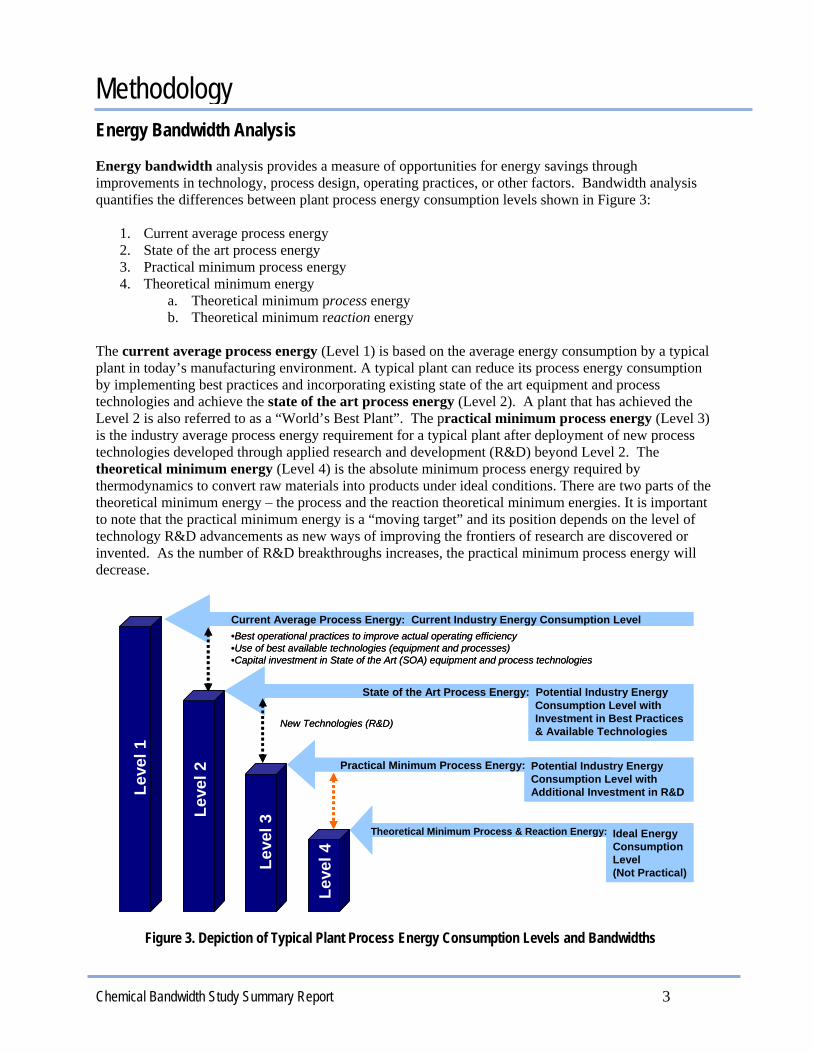
Energy Bandwidth Analysis Energy bandwidth analysis provides a measure of opportunities for energy savings through improvements in technology, process design, operating practices, or other factors. Bandwidth analysis quantifies the differences between plant process energy consumption levels shown in Figure 3:
1. Current average process energy 2. State of the art process energy 3. Practical minimum process energy 4. Theoretical minimum energy
a. Theoretical minimum process energy b. Theoretical minimum reaction energy
The current average process energy (Level 1) is based on the average energy consumption by a typical plant in today’s manufacturing environment. A typical plant can reduce its process energy consumption by implementing best practices and incorporating existing state of the art equipment and process technologies and achieve the state of the art process energy (Level 2). A plant that has achieved the Level 2 is also referred to as a “World’s Best Plant”. The practical minimum process energy (Level 3) is the industry average process energy requirement for a typical plant after deployment of new process technologies developed through applied research and development (R&D) beyond Level 2. The theoretical minimum energy (Level 4) is the absolute minimum process energy required by thermodynamics to convert raw materials into products under ideal conditions. There are two parts of the theoretical minimum energy – the process and the reaction theoretical minimum energies. It is important to note that the practical minimum energy is a “moving target” and its position depends on the level of technology R&D advancements as new ways of improving the frontiers of research are discovered or invented. As the number of R&D breakthroughs increases, the practical minimum process energy will decrease.
Leve
l 1
Leve
l 2
Leve
l 3
Leve
l 4
•Best operational practices to improve actual operating efficiency•Use of best available technologies (equipment and processes)•Capital investment in State of the Art (SOA) equipment and process technologies
Current Average Process Energy: Current Industry Energy Consumption Level
Consumption Level with Investment in Best Practices & Available Technologies
New Technologies (R&D)
State of the Art Process Energy: Potential Industry Energy
Potential Industry Energy Consumption Level with Additional Investment in R&D
Ideal Energy Consumption Level (Not Practical)
Practical Minimum Process Energy:
Theoretical Minimum Process & Reaction Energy:
Leve
l 1
Leve
l 2
Leve
l 3
Leve
l 4
•Best operational practices to improve actual operating efficiency•Use of best available technologies (equipment and processes)•Capital investment in State of the Art (SOA) equipment and process technologies
Current Average Process Energy: Current Industry Energy Consumption Level
Consumption Level with Investment in Best Practices & Available Technologies
New Technologies (R&D)
State of the Art Process Energy: Potential Industry Energy
Potential Industry Energy Consumption Level with Additional Investment in R&D
Ideal Energy Consumption Level (Not Practical)
Practical Minimum Process Energy:
Theoretical Minimum Process & Reaction Energy:
Methodology
Figure 3. Depiction of Typical Plant Process Energy Consumption Levels and Bandwidths
Chemical Bandwidth Study Summary Report 4
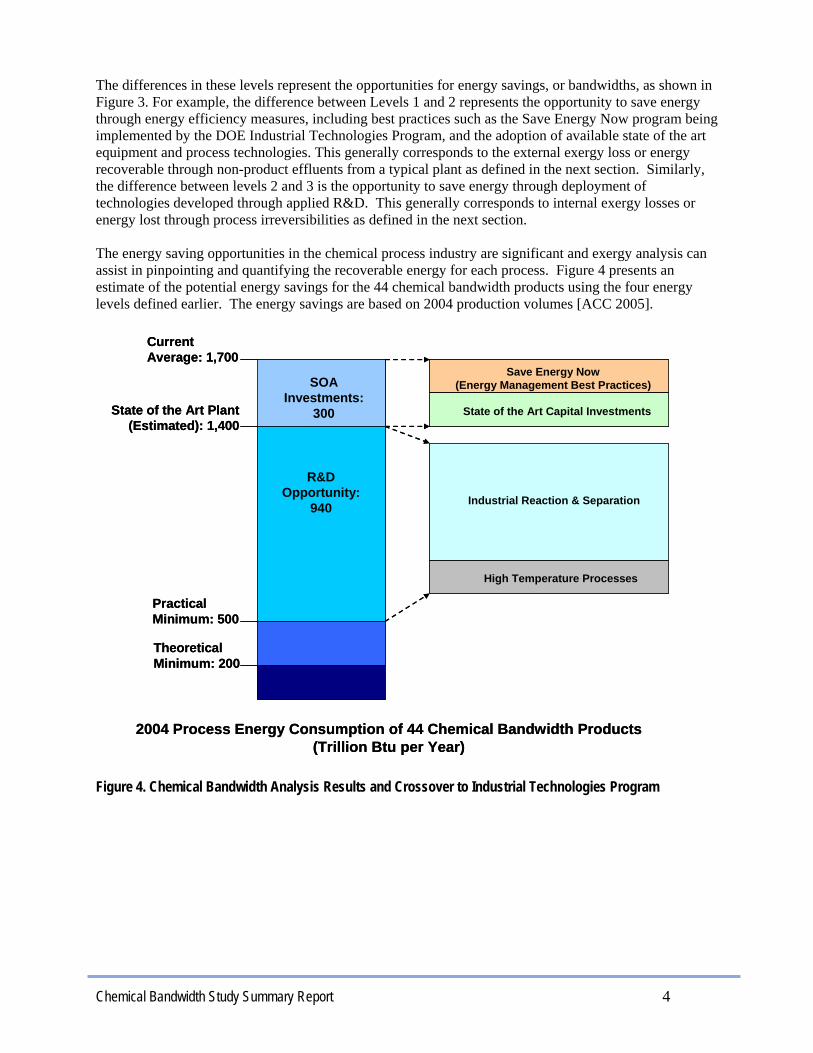
The differences in these levels represent the opportunities for energy savings, or bandwidths, as shown in Figure 3. For example, the difference between Levels 1 and 2 represents the opportunity to save energy through energy efficiency measures, including best practices such as the Save Energy Now program being implemented by the DOE Industrial Technologies Program, and the adoption of available state of the art equipment and process technologies. This generally corresponds to the external exergy loss or energy recoverable through non-product effluents from a typical plant as defined in the next section. Similarly, the difference between levels 2 and 3 is the opportunity to save energy through deployment of technologies developed through applied R&D. This generally corresponds to internal exergy losses or energy lost through process irreversibilities as defined in the next section. The energy saving opportunities in the chemical process industry are significant and exergy analysis can assist in pinpointing and quantifying the recoverable energy for each process. Figure 4 presents an estimate of the potential energy savings for the 44 chemical bandwidth products using the four energy levels defined earlier. The energy savings are based on 2004 production volumes [ACC 2005].
SOA Investments:
300
R&D Opportunity:
940
Current Average: 1,700
State of the Art Plant (Estimated): 1,400
Practical Minimum: 500
Theoretical Minimum: 200
Save Energy Now(Energy Management Best Practices)
State of the Art Capital Investments
Industrial Reaction & Separation
High Temperature Processes
2004 Process Energy Consumption of 44 Chemical Bandwidth Products(Trillion Btu per Year)
Figure 4. Chemical Bandwidth Analysis Results and Crossover to Industrial Technologies Program
Chemical Bandwidth Study Summary Report 5
Introduction to Exergy Analysis
Exergy analysis provides a powerful tool for assessing the quality of energy and quantifying the portion of energy that can be practically recovered. Not all forms of energy are equally valuable for energy recovery. For example, in an energy balance, 1,000 Btu of low pressure steam would compare equally to 1,000 Btu of electricity. In reality, the low-pressure steam has less than a third as much usable energy as the electricity. The steam could be used for heating until its temperature is brought down to the plant environment temperature. At this point the gas still contains energy, but the energy is not useful or available for recovery: it has no exergy. When applied to a system, such as a manufacturing plant, exergy analysis is used to identify exergy losses and thereby show where useful energy is being wasted. Exergy can be destroyed or lost in two ways. External exergy losses are associated with exhaust gasses, cooling water outflow, or other streams leaving the system. These flows contain energy, some portion of which is available for recovery. Internal exergy losses are losses that occur within the system every time energy is used in a heat exchanger or other process equipment. In this case no energy leaves the system; energy is conserved but exergy is lost. Internal and external exergy losses can be recovered through a combination of best practices, state-of-the-art technologies, and technologies that are in various stages of R&D.
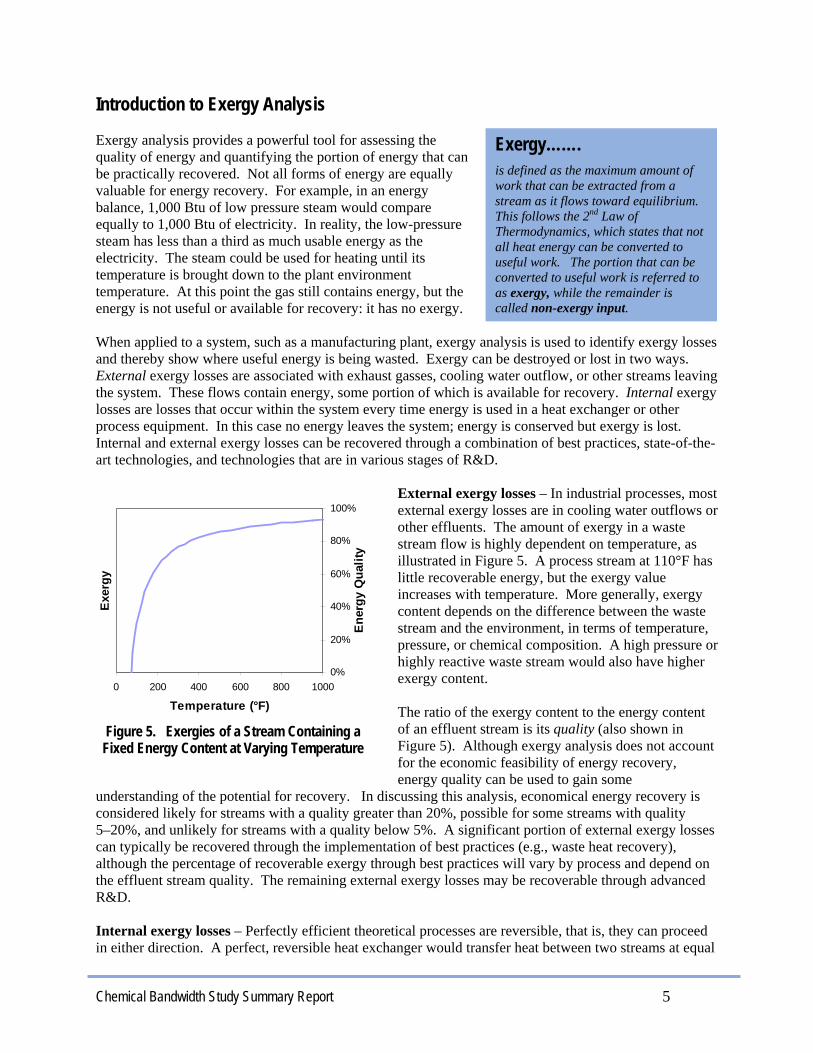
External exergy losses – In industrial processes, most external exergy losses are in cooling water outflows or other effluents. The amount of exergy in a waste stream flow is highly dependent on temperature, as illustrated in Figure 5. A process stream at 110°F has little recoverable energy, but the exergy value increases with temperature. More generally, exergy content depends on the difference between the waste stream and the environment, in terms of temperature, pressure, or chemical composition. A high pressure or highly reactive waste stream would also have higher exergy content. The ratio of the exergy content to the energy content of an effluent stream is its quality (also shown in Figure 5). Although exergy analysis does not account for the economic feasibility of energy recovery, energy quality can be used to gain some
understanding of the potential for recovery. In discussing this analysis, economical energy recovery is considered likely for streams with a quality greater than 20%, possible for some streams with quality 5–20%, and unlikely for streams with a quality below 5%. A significant portion of external exergy losses can typically be recovered through the implementation of best practices (e.g., waste heat recovery), although the percentage of recoverable exergy through best practices will vary by process and depend on the effluent stream quality. The remaining external exergy losses may be recoverable through advanced R&D. Internal exergy losses – Perfectly efficient theoretical processes are reversible, that is, they can proceed in either direction. A perfect, reversible heat exchanger would transfer heat between two streams at equal
Exergy……. is defined as the maximum amount of work that can be extracted from a stream as it flows toward equilibrium. This follows the 2nd Law of Thermodynamics, which states that not all heat energy can be converted to useful work. The portion that can be converted to useful work is referred to as exergy, while the remainder is called non-exergy input.
0 200 400 600 800 1000
Temperature (°F)
Exer
gy
0%
20%
40%
60%
80%
100%
Ene
rgy
Qua
lity
Figure 5. Exergies of a Stream Containing a
Fixed Energy Content at Varying Temperature

Chemical Bandwidth Study Summary Report 6
temperatures. But heat will not transfer without a temperature difference; real heat exchangers transfer heat from a hotter stream to a colder one. This temperature gradient makes heat transfer irreversible, and the irreversibility results in an exergy loss. No real industrial process is perfectly reversible because it is made up of irreversible processes such as heat transfer, spontaneous chemical reactions, and unrestrained gas expansion. High-temperature processes and those involving highly exothermic reactions are especially prone to large internal exergy losses. To a certain extent, internal exergy losses can be addressed through the development of new technologies, such as advanced catalysts (higher selectivities, conversions per pass) and novel microreactor and separation technologies. Depending on the process, a
portion of internal exergy losses (e.g., throttling) may be recovered through best practices. The concept of exergy or energy quality is applied to a chemical process in Figure 6. Total energy input (QIN) is comprised of both exergy and non-exergy input. During the process, some of the total exergy input is converted to useful work (QW), while some is lost due to internal and external energy loss factors (QLOSS). Energy efficiency and energy recovery measures can be used to reduce this loss component. The non-exergy component of total input energy has zero quality and cannot be recovered, but is rejected (QREJECT). Note that Figure 6 represents an endothermic process, in which the chemical reaction requires an energy input. In the case of an exothermic process, the reaction would generate energy, so QW would be negative (or the arrow in Figure 6 would point in the opposite direction).
Figure 7 shows qualitatively how exergy relates to the energy bandwidth shown in Figure 3. The exergy and non-exergy input shown in bar B represent all the energy inputs. C shows the breakdown of input process energy into theoretical minimum requirements, recoverable energy, and non-exergy components. Bar D illustrates processes that operate with actual process energy requirements; input process energies are higher than the theoretical minimum and recoverable energies are therefore lower.
Non-product effluents (external exergy loss) + Process irreversibilities (internal exergy loss)
QIN = Total Energy Input PROCESS
Qw = Useful Process Work
QREJECT = Zero Quality Energy Unrecoverable Energy / Non-Exergy Input
QLOSS = Recoverable Energy
Exergy + Non-Exergy Input
QIN = QW + QLOSS + QREJECT
Figure 6. Concept of Exergy in a Chemical Process
A
NON-EXERGY
INPUT
NON-EXERGY
INPUT
EXERGY
THEORETICAL MINIMUM EXERGY
LOST EXERGY (RECOVERABLE
AVAILABLE EXERGY)
NON- EXERGY INPUT
TOTAL ENERGY
INPUT
ACTUAL PROCESS EXERGY
LOST EXERGY(RECOVERABLE
AVAILABLE EXERGY)
B C DA
NON-EXERGY
INPUT
NON-EXERGY
INPUT
EXERGY
THEORETICAL MINIMUM EXERGY
LOST EXERGY (RECOVERABLE
AVAILABLE EXERGY)
NON- EXERGY INPUT
TOTAL ENERGY
INPUT
ACTUAL PROCESS EXERGY
LOST EXERGY(RECOVERABLE
AVAILABLE EXERGY)
B C D
Figure 7. Concept of Exergy, Theoretical Minimum, and Actual Process Energy

Chemical Bandwidth Study Summary Report 7
Again, note that Figure 7 represents a 100% selective, endothermic process, in which the theoretical minimum energy and actual process energy are both positive quantities. Many processes are based on exothermic reactions, which are net energy generators, and therefore have a negative theoretical minimum energy requirement. Other endothermic processes are not 100 % selective, but consume some of the feedstock in exothermic side reactions. In some processes these side reactions generate enough energy to make the actual process energy a negative quantity.

Chemical Bandwidth Study Summary Report 8
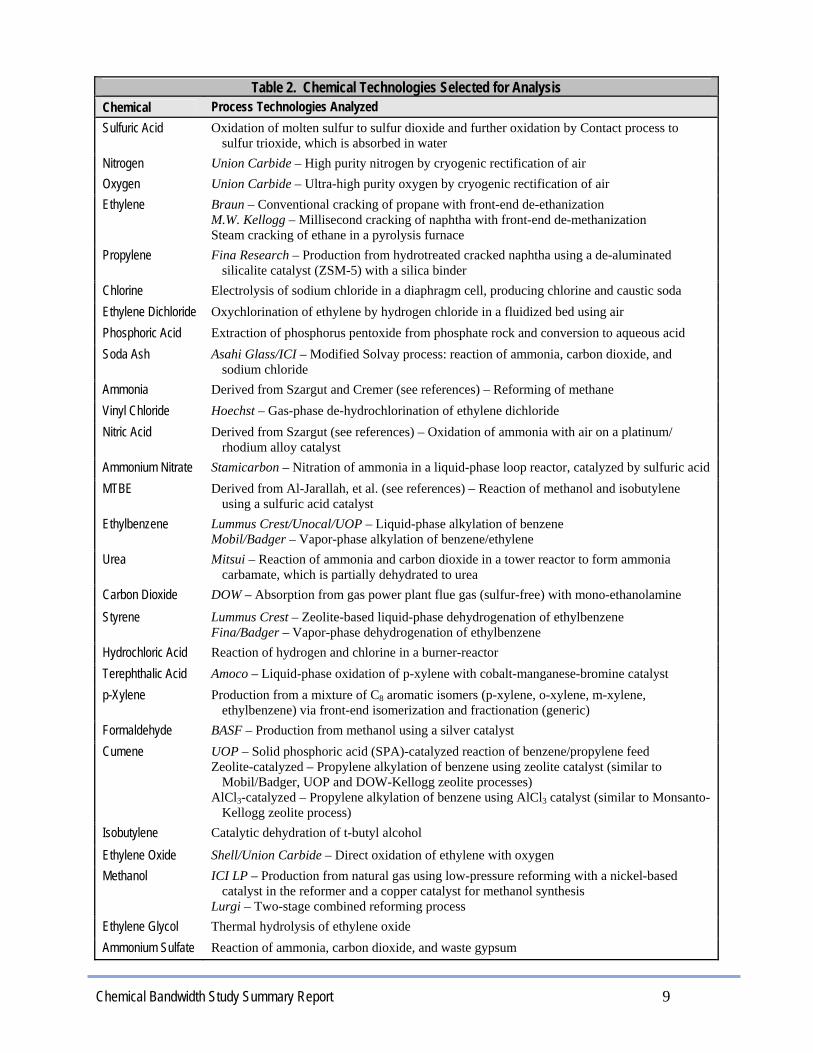
Selection of Chemical Processes A large share of energy consumption in the U.S. chemical industry can be attributed to a relatively small number of chemical manufacturing processes and technologies. For this study, many of the most energy-intensive chemicals and related process technologies were selected from a list of the top 80 chemicals, drawn from lists published by the American Chemistry Council [ACC 2005, ACC 2003]. The technologies selected for study are necessary to the manufacture of 44 major chemical products representing about 70% of the production volume of the top 80 chemicals, as shown in Table 1. The process energy use shown in Table 1 was estimated for each chemical based on current production data (lb) from the American Chemical Council and on total energy input values (Btu/lb) from this analysis. This is a simplified method for deriving the process energy; in several cases the total energy input value computed for one process is applied to the entire production volume, which is actually produced by several different processes (e.g., propylene oxide). Energy for the manufacture of the 44 chemicals in Table 1 accounts for about 60% of energy consumed by the chemical industry for fuels and power in 2004 [ACC 2005]. Analysis was performed on 53 chemical process technologies associated with the selected chemical products shown in Table 1. The licensors of these technologies and a basic description are provided in Table 2. Two or more competing technologies were selected for seven of the chemicals studied.
Table 1. Chemicals Selected for Analysis
Chemical 2004 U.S.
Production (Billion lb)
Estimated Process Energy (TBtu)
Sulfuric Acid 82.7 10.7 Nitrogen 69.6 11.4 Oxygen 58.3 11.8 Ethylene 56.6 488.6 Propylene 33.8 153.6 Chlorine 26.8 314.7 Ethylene Dichloride 26.7 18.7 Phosphoric Acid 25.3 0.6 Soda Ash 24.3 30.3 Ammonia 23.7 109.1 Vinyl Chloride 16.0 b 42.7 Nitric Acid 14.8 3.4 Ammonium Nitrate 13.3 2.3 MTBE 12.8 113.3 Ethylbenzene 12.7 21.1 Urea 12.7 16.2 Carbon Dioxide 12.4 25.8 Styrene 12.1 48.6 Hydrochloric Acid 11.1 0.0 Terephthalic Acid 11.0 a 21.1 p-Xylene 9.2 29.5 Formaldehyde 9.1 6.3 Cumene 8.2 8.2 Isobutylene 8.1 c 18.6 Ethylene Oxide 8.0 61.9 Methanol 6.5 23.2 Ethylene Glycol 6.4 37.2 Ammonium Sulfate 5.8 4.1 Phenol 5.3 37.0 Butadiene 4.8 6.7 Acetic Acid 4.8 7.7 Propylene Oxide 4.5 a 31.3 Carbon Black 3.7 0.0 Acrylonitrile 3.5 15.1 Vinyl Acetate 3.3 9.5 Hydrogen 3.3 1.0 Nitrobenzene 2.8 3.2 Cyclohexane 2.3 a 1.1 bisPhenol A 1.9 a 4.1 Caprolactam 1.8 a 16.7 Aniline 1.8 1.7 Methyl Methacrylate 1.7 6.2 Isopropyl Alcohol 1.6 a 6.1 Methyl Chloride 1.3 0.5 TOTAL (44 Chemicals) 666.0 1780.9 TOTAL (Top 80 Chemicals)a 948.5 --- a 2002 data b Equal to PVC production volume c Volume estimated as a fraction of MTBE
Chemical Bandwidth Study Summary Report 9
Table 2. Chemical Technologies Selected for Analysis Chemical Process Technologies Analyzed Sulfuric Acid Oxidation of molten sulfur to sulfur dioxide and further oxidation by Contact process to
sulfur trioxide, which is absorbed in water Nitrogen Union Carbide – High purity nitrogen by cryogenic rectification of air Oxygen Union Carbide – Ultra-high purity oxygen by cryogenic rectification of air Ethylene Braun – Conventional cracking of propane with front-end de-ethanization
M.W. Kellogg – Millisecond cracking of naphtha with front-end de-methanization Steam cracking of ethane in a pyrolysis furnace
Propylene Fina Research – Production from hydrotreated cracked naphtha using a de-aluminated silicalite catalyst (ZSM-5) with a silica binder
Chlorine Electrolysis of sodium chloride in a diaphragm cell, producing chlorine and caustic soda Ethylene Dichloride Oxychlorination of ethylene by hydrogen chloride in a fluidized bed using air Phosphoric Acid Extraction of phosphorus pentoxide from phosphate rock and conversion to aqueous acid Soda Ash Asahi Glass/ICI – Modified Solvay process: reaction of ammonia, carbon dioxide, and
sodium chloride Ammonia Derived from Szargut and Cremer (see references) – Reforming of methane Vinyl Chloride Hoechst – Gas-phase de-hydrochlorination of ethylene dichloride Nitric Acid Derived from Szargut (see references) – Oxidation of ammonia with air on a platinum/
rhodium alloy catalyst Ammonium Nitrate Stamicarbon – Nitration of ammonia in a liquid-phase loop reactor, catalyzed by sulfuric acid MTBE Derived from Al-Jarallah, et al. (see references) – Reaction of methanol and isobutylene
using a sulfuric acid catalyst Ethylbenzene Lummus Crest/Unocal/UOP – Liquid-phase alkylation of benzene
Mobil/Badger – Vapor-phase alkylation of benzene/ethylene Urea Mitsui – Reaction of ammonia and carbon dioxide in a tower reactor to form ammonia
carbamate, which is partially dehydrated to urea Carbon Dioxide DOW – Absorption from gas power plant flue gas (sulfur-free) with mono-ethanolamine
Styrene Lummus Crest – Zeolite-based liquid-phase dehydrogenation of ethylbenzene Fina/Badger – Vapor-phase dehydrogenation of ethylbenzene
Hydrochloric Acid Reaction of hydrogen and chlorine in a burner-reactor Terephthalic Acid Amoco – Liquid-phase oxidation of p-xylene with cobalt-manganese-bromine catalyst p-Xylene Production from a mixture of C8 aromatic isomers (p-xylene, o-xylene, m-xylene,
ethylbenzene) via front-end isomerization and fractionation (generic) Formaldehyde BASF – Production from methanol using a silver catalyst Cumene UOP – Solid phosphoric acid (SPA)-catalyzed reaction of benzene/propylene feed
Zeolite-catalyzed – Propylene alkylation of benzene using zeolite catalyst (similar to Mobil/Badger, UOP and DOW-Kellogg zeolite processes)
AlCl3-catalyzed – Propylene alkylation of benzene using AlCl3 catalyst (similar to Monsanto-Kellogg zeolite process)
Isobutylene Catalytic dehydration of t-butyl alcohol
Ethylene Oxide Shell/Union Carbide – Direct oxidation of ethylene with oxygen Methanol ICI LP – Production from natural gas using low-pressure reforming with a nickel-based
catalyst in the reformer and a copper catalyst for methanol synthesis Lurgi – Two-stage combined reforming process
Ethylene Glycol Thermal hydrolysis of ethylene oxide Ammonium Sulfate Reaction of ammonia, carbon dioxide, and waste gypsum

Chemical Bandwidth Study Summary Report 10
Table 2. Chemical Technologies Selected for Analysis Chemical Process Technologies Analyzed Phenol Peroxidation of cumene to cumene hyperoxide, followed by cleavage into phenol and acetone
Oxidation of toluene to benzoic acid, followed by conversion to phenol without co-products Butadiene Nippon Zeon – Recovery as by-product from steam cracking of liquid feedstocks (C5s, C6s,
C7s, C8s) Acetic Acid Chiyoda/UOP – Low-pressure methanol carbonylation using a rhodium catalyst and methyl
iodide as a promoter Propylene Oxide Arco/Halcon – Production with co-product t-butyl alcohol from isobutane and propylene Carbon Black Partial oxidation of oil with air in a furnace Acrylonitrile SOHIO/BP – Ammoxidation of propylene using a bismuth molybdate-based catalyst
SOHIO/BP – Ammoxidation of propane in a fluidized bed reactor using a metal catalyst complex of vanadium, tin, and tungsten
Vinyl Acetate BP – Vapor-phase acetoxylation of ethylene Hydrogen Steam reforming of natural gas Nitrobenzene American Cyanamid – Liquid-phase reaction of nitric acid with benzene Cyclohexane Toray – Vapor-phase catalytic hydrogenation of benzene with a nickel catalyst bisPhenol A Liquid-phase reaction of phenol and acetone, catalyzed by hydrochloric acid Caprolactam Beckmann rearrangement of cyclohexanone oxime Aniline Vapor-phase catalytic reduction of nitrobenzene Methyl Methacrylate Reaction of acetone with hydrogen cyanide, followed by rearrangement to methacrylamide
sulfate, which is cracked to produce methyl methacrylate and ammonium bisulfate Isopropyl Alcohol Deutsche Texaco – Hydration of propylene over a cation exchange resin catalyst Methyl Chloride Liquid-phase chlorination of methanol
Chemical Bandwidth Study Summary Report 11
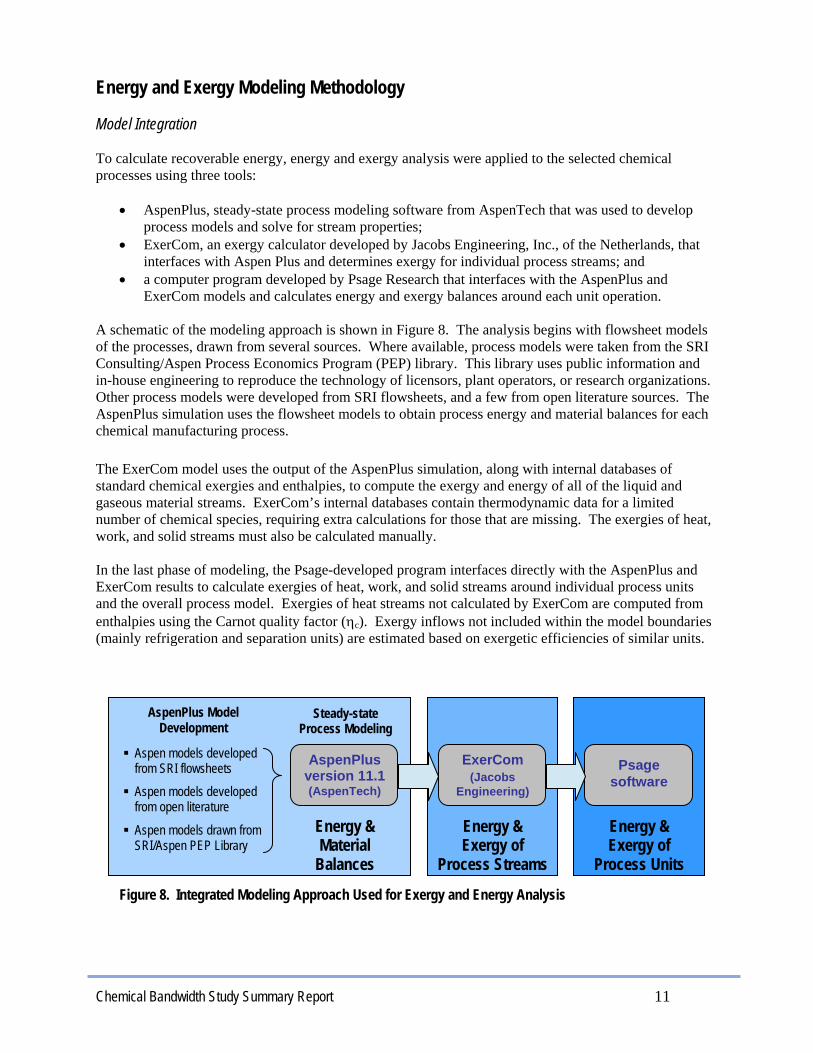
Energy and Exergy Modeling Methodology Model Integration To calculate recoverable energy, energy and exergy analysis were applied to the selected chemical processes using three tools:
• AspenPlus, steady-state process modeling software from AspenTech that was used to develop process models and solve for stream properties;
• ExerCom, an exergy calculator developed by Jacobs Engineering, Inc., of the Netherlands, that interfaces with Aspen Plus and determines exergy for individual process streams; and
• a computer program developed by Psage Research that interfaces with the AspenPlus and ExerCom models and calculates energy and exergy balances around each unit operation.
A schematic of the modeling approach is shown in Figure 8. The analysis begins with flowsheet models of the processes, drawn from several sources. Where available, process models were taken from the SRI Consulting/Aspen Process Economics Program (PEP) library. This library uses public information and in-house engineering to reproduce the technology of licensors, plant operators, or research organizations. Other process models were developed from SRI flowsheets, and a few from open literature sources. The AspenPlus simulation uses the flowsheet models to obtain process energy and material balances for each chemical manufacturing process. The ExerCom model uses the output of the AspenPlus simulation, along with internal databases of standard chemical exergies and enthalpies, to compute the exergy and energy of all of the liquid and gaseous material streams. ExerCom’s internal databases contain thermodynamic data for a limited number of chemical species, requiring extra calculations for those that are missing. The exergies of heat, work, and solid streams must also be calculated manually. In the last phase of modeling, the Psage-developed program interfaces directly with the AspenPlus and ExerCom results to calculate exergies of heat, work, and solid streams around individual process units and the overall process model. Exergies of heat streams not calculated by ExerCom are computed from enthalpies using the Carnot quality factor (ηc). Exergy inflows not included within the model boundaries (mainly refrigeration and separation units) are estimated based on exergetic efficiencies of similar units.
Psagesoftware
Energy & Exergy of
Process Units
ExerCom(Jacobs
Engineering)
Energy & Exergy of
Process Streams
AspenPlus version 11.1 (AspenTech)
Energy & Material
Balances
AspenPlus Model Development
Steady-state Process Modeling
Aspen models developed from SRI flowsheets
Aspen models developed from open literature
Aspen models drawn from SRI/Aspen PEP Library
Figure 8. Integrated Modeling Approach Used for Exergy and Energy Analysis

Chemical Bandwidth Study Summary Report 12
Unit Processes and Equipment A number of assumptions were necessary to calculate the energy and exergy losses of specific equipment included in each process flowsheet. The process units modeled in the analysis are shown in Table 3, along with the basic assumptions made for determining energy and exergy losses. Examining the energy and exergy losses calculated for specific unit operations helps to pinpoint the types of processing units that should be targeted for future efficiency improvement or technology development.
Table 3. Energy and Exergy Assumptions for Process Equipment Models Process Unit Description
Reactors (exothermic)
In exothermic reactors, the heat of reaction is removed by some combination of sensible heat, streams leaving the reactor, or steam generated and used elsewhere in the plant (ordinarily no external exergy loss). Internal exergy losses can be substantial (generally irreversibilities created by mixing of streams of very different temperature and composition and by heat transfer across large temperature differences).
Reactors (endothermic)
In endothermic reactors, feed streams supply all of the energy absorbed in the reaction. Internal exergy losses are considerable because feed streams are much hotter than reactor effluents.
Distillation Columns
Distillation columns separate chemicals by boiling point differences. The energy and exergy of each stream, reboiler, and condenser are calculated. External exergy losses suggest the extent to which energy recovery is possible. Internal exergy losses are created by process irreversibilities arising from large driving forces of temperature and composition differences.
Heat Exchangers Two heat exchanger configurations are possible: (1) process streams on both sides, or (2) process stream on one side and heating or cooling medium on the other. For (1), exchangers have no external exergy loss, and internal exergy losses due to irreversibilities depend on the temperature difference between heated and cooled media. For (2), external exergy loss determines the quality of the energy loss. A low exergy loss, for example, would suggest little opportunity for energy recovery.
Process Furnaces A variety of furnaces are used to superheat steam, heat process streams, or enable chemical reactions (reformers). When the fuel is not included as a stream, energy or external exergy losses due to fuel combustion and stack gasses are not included in the analysis. Large internal exergy losses are typical, due to large changes in process stream temperatures and large driving forces for heat transfer.
Compressors & Expanders
In compressors and expanders, energy and external exergy losses result from intercoolers and process irreversibilities. Internal exergy losses depend on the difference in temperature and pressure between inlet and outlet gas streams and on the assumed pump or compressor efficiency.
Pumps Not all pumps are included in the flowsheets. When they are indicated, they do not contribute significantly to exergy or energy losses.
Drums/Tanks Drums and tanks have no heaters or coolers, and hence no energy or external exergy losses. In flash drums, internal exergy losses are due to changes in pressure, state, and composition between inlet and outlet streams. Receivers with multiple inlets and one outlet stream have internal exergy losses due to changes in stream temperature and composition. Knockout drums and other units have modest internal exergy changes.
Mixers/Splitters Mixers and splitters are essentially artifacts of the model (simulating mixing or splitting of streams) and do not contribute significantly to the exergy analysis. Internal exergy losses indicate the extent of process irreversibilities.
Other Equipment Other equipment includes pressure swing absorption units, multi-effect evaporators, and other separators. Some are modeled as black box units, and not all have energy or exergy losses.
Chemical Bandwidth Study Summary Report 13
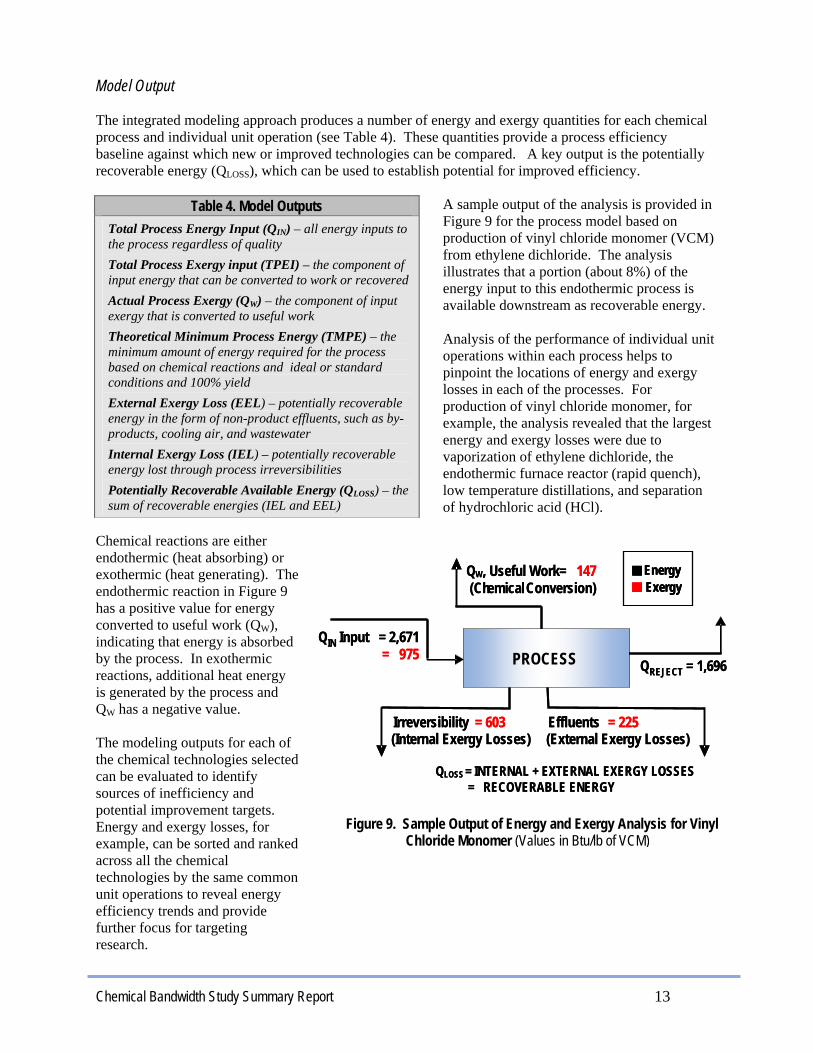
Model Output The integrated modeling approach produces a number of energy and exergy quantities for each chemical process and individual unit operation (see Table 4). These quantities provide a process efficiency baseline against which new or improved technologies can be compared. A key output is the potentially recoverable energy (QLOSS), which can be used to establish potential for improved efficiency.
A sample output of the analysis is provided in Figure 9 for the process model based on production of vinyl chloride monomer (VCM) from ethylene dichloride. The analysis illustrates that a portion (about 8%) of the energy input to this endothermic process is available downstream as recoverable energy. Analysis of the performance of individual unit operations within each process helps to pinpoint the locations of energy and exergy losses in each of the processes. For production of vinyl chloride monomer, for example, the analysis revealed that the largest energy and exergy losses were due to vaporization of ethylene dichloride, the endothermic furnace reactor (rapid quench), low temperature distillations, and separation of hydrochloric acid (HCl).
Chemical reactions are either endothermic (heat absorbing) or exothermic (heat generating). The endothermic reaction in Figure 9 has a positive value for energy converted to useful work (QW), indicating that energy is absorbed by the process. In exothermic reactions, additional heat energy is generated by the process and QW has a negative value. The modeling outputs for each of the chemical technologies selected can be evaluated to identify sources of inefficiency and potential improvement targets. Energy and exergy losses, for example, can be sorted and ranked across all the chemical technologies by the same common unit operations to reveal energy efficiency trends and provide further focus for targeting research.
Table 4. Model Outputs Total Process Energy Input (QIN) – all energy inputs to the process regardless of quality Total Process Exergy input (TPEI) – the component of input energy that can be converted to work or recovered Actual Process Exergy (QW) – the component of input exergy that is converted to useful work Theoretical Minimum Process Energy (TMPE) – the minimum amount of energy required for the process based on chemical reactions and ideal or standard conditions and 100% yield External Exergy Loss (EEL) – potentially recoverable energy in the form of non-product effluents, such as by-products, cooling air, and wastewater Internal Exergy Loss (IEL) – potentially recoverable energy lost through process irreversibilities Potentially Recoverable Available Energy (QLOSS) – the sum of recoverable energies (IEL and EEL)
Figure 9. Sample Output of Energy and Exergy Analysis for Vinyl Chloride Monomer (Values in Btu/lb of VCM)
QW, Useful Work= 147(ChemicalConversion)
QLOSS = INTERNAL + EXTERNAL EXERGY LOSSES= RECOVERABLE ENERGY
QIN Input = 2,671= 975
Q
QREJECT = 1,696PROCESS
Effluents = 225(External Exergy Losses)
Irreversibility = 603(Internal Exergy Losses)
EnergyExergy
QW, Useful Work= 147(ChemicalConversion)
QLOSS = INTERNAL + EXTERNAL EXERGY LOSSES= RECOVERABLE ENERGY
QIN Input = 2,671= 975
Q
QREJECT = 1,696PROCESS
Effluents = 225(External Exergy Losses)
Irreversibility = 603(Internal Exergy Losses)
EnergyExergyEnergyExergy
Chemical Bandwidth Study Summary Report 14
Limitations of the Approach The results of the study provide an overall view of process energy and exergy use and loss trends. However, the results are based on models rather than actual plant data. SRI Consulting utilizes public information and in-house engineering expertise to develop the AspenPlus models that serve as the basis for the energy and exergy analysis. While the SRI AspenPlus models can approximate the process inputs, outputs, and design, the results may not reflect actual plant performance because:
• kinetic data and proprietary process data are not always available; • available thermodynamic data are of limited accuracy, and thermodynamic models are limited in
ability to predict stream properties; • complex process steps may be simplified in the model; • many companies have optimized their plants beyond what is reported in the public domain; and • SRI Aspen model results are composed of a specific mix of technologies and equipment, and may
not apply where a different mix of technologies and equipment is used. In addition, results do not reflect external factors that may influence plant performance. For example, large capital assets that could be improved may not be replaced until they reach the end of their useful life, regardless of the potential benefits. Environmental regulations or other factors (permitting, site limitations) may also have an impact on the feasibility of reducing energy and exergy losses. While potentially recoverable energy does provide a good perspective on efficiency opportunities, the analysis does not provide insight on the true economic feasibility of recovering energy. For example, economic factors such as limited funds for plant upgrades, poor markets, corporate investment philosophy, and the high cost of environmental compliance could all have an impact on economic feasibility. Although the study does not account for economic factors, recoverable energy is measured by the quality factor, which inherently includes the consideration that low quality energy is probably not economically suitable for recovery. Despite the potential for discrepancies between the study results and actual plant performance, this analysis remains a powerful tool for pinpointing targets for improvement, provided the limitations are kept in mind.
Chemical Bandwidth Study Summary Report 15
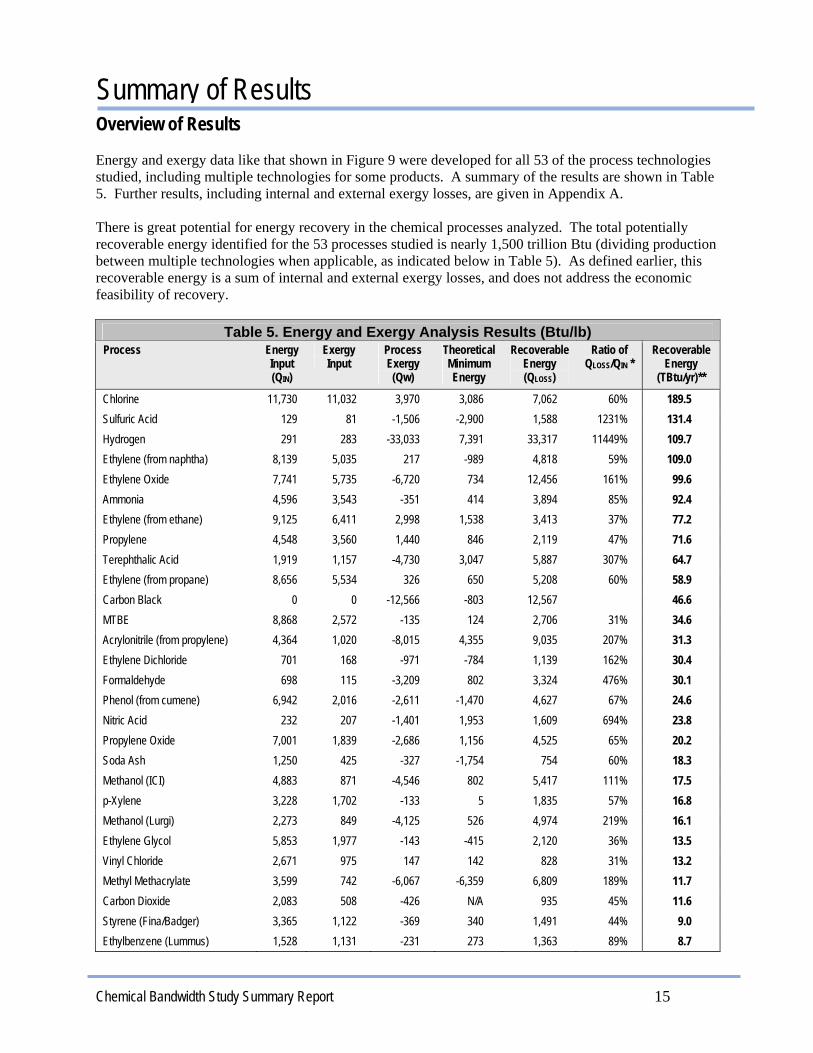
Overview of Results Energy and exergy data like that shown in Figure 9 were developed for all 53 of the process technologies studied, including multiple technologies for some products. A summary of the results are shown in Table 5. Further results, including internal and external exergy losses, are given in Appendix A. There is great potential for energy recovery in the chemical processes analyzed. The total potentially recoverable energy identified for the 53 processes studied is nearly 1,500 trillion Btu (dividing production between multiple technologies when applicable, as indicated below in Table 5). As defined earlier, this recoverable energy is a sum of internal and external exergy losses, and does not address the economic feasibility of recovery.
Table 5. Energy and Exergy Analysis Results (Btu/lb) Process Energy
Input (QIN)
Exergy Input
Process Exergy (Qw)
Theoretical Minimum Energy
Recoverable Energy (QLOSS)
Ratio of QLOSS/QIN *
Recoverable Energy
(TBtu/yr)**
Chlorine 11,730 11,032 3,970 3,086 7,062 60% 189.5 Sulfuric Acid 129 81 -1,506 -2,900 1,588 1231% 131.4 Hydrogen 291 283 -33,033 7,391 33,317 11449% 109.7 Ethylene (from naphtha) 8,139 5,035 217 -989 4,818 59% 109.0 Ethylene Oxide 7,741 5,735 -6,720 734 12,456 161% 99.6 Ammonia 4,596 3,543 -351 414 3,894 85% 92.4 Ethylene (from ethane) 9,125 6,411 2,998 1,538 3,413 37% 77.2 Propylene 4,548 3,560 1,440 846 2,119 47% 71.6 Terephthalic Acid 1,919 1,157 -4,730 3,047 5,887 307% 64.7 Ethylene (from propane) 8,656 5,534 326 650 5,208 60% 58.9 Carbon Black 0 0 -12,566 -803 12,567 46.6 MTBE 8,868 2,572 -135 124 2,706 31% 34.6 Acrylonitrile (from propylene) 4,364 1,020 -8,015 4,355 9,035 207% 31.3 Ethylene Dichloride 701 168 -971 -784 1,139 162% 30.4 Formaldehyde 698 115 -3,209 802 3,324 476% 30.1 Phenol (from cumene) 6,942 2,016 -2,611 -1,470 4,627 67% 24.6 Nitric Acid 232 207 -1,401 1,953 1,609 694% 23.8 Propylene Oxide 7,001 1,839 -2,686 1,156 4,525 65% 20.2 Soda Ash 1,250 425 -327 -1,754 754 60% 18.3 Methanol (ICI) 4,883 871 -4,546 802 5,417 111% 17.5 p-Xylene 3,228 1,702 -133 5 1,835 57% 16.8 Methanol (Lurgi) 2,273 849 -4,125 526 4,974 219% 16.1 Ethylene Glycol 5,853 1,977 -143 -415 2,120 36% 13.5 Vinyl Chloride 2,671 975 147 142 828 31% 13.2 Methyl Methacrylate 3,599 742 -6,067 -6,359 6,809 189% 11.7 Carbon Dioxide 2,083 508 -426 N/A 935 45% 11.6 Styrene (Fina/Badger) 3,365 1,122 -369 340 1,491 44% 9.0 Ethylbenzene (Lummus) 1,528 1,131 -231 273 1,363 89% 8.7
Summary of Results

Chemical Bandwidth Study Summary Report 16
Table 5. Energy and Exergy Analysis Results (Btu/lb) Process Energy
Input (QIN)
Exergy Input
Process Exergy (Qw)
Theoretical Minimum Energy
Recoverable Energy (QLOSS)
Ratio of QLOSS/QIN *
Recoverable Energy
(TBtu/yr)**
Styrene (Lummus) 4,703 1,697 305 340 1,392 30% 8.4 Ethylbenzene (Mobil/Badger) 1,787 965 -317 273 1,282 72% 8.2 Oxygen 202 202 67 N/A 135 67% 7.9 Urea 1,276 503 -63 -289 566 44% 7.2 Nitrogen 164 164 63 N/A 102 62% 7.1 Phosphoric Acid 22 10 -270 -394 279 1268% 7.1 Ammonium Nitrate 171 23 -499 -502 522 305% 6.9 Vinyl Acetate 2,866 891 -1,194 -1,060 2,084 73% 6.9 Caprolactam 9,521 2,304 -1,318 -170 3,622 38% 6.3 Acetic Acid 1,612 786 -512 436 1,297 80% 6.2 Hydrochloric Acid 0 0 -530 -1,124 530 5.9 Isobutylene 2,288 518 53 54 465 20% 3.8 Aniline 956 368 -1,548 -2,093 1,915 200% 3.4 Nitrobenzene 1,147 419 -503 421 922 80% 2.6 Ammonium Sulfate 709 249 -148 -701 397 56% 2.3 Butadiene 1,382 468 55 N/A 413 30% 2.0 Cumene (AlCl3) 1,124 440 -240 526 680 60% 1.9 bisPhenol A 2,131 649 -290 -491 938 44% 1.8 Cyclohexane 465 229 -543 -499 772 166% 1.8 Cumene (Zeolite) 1,061 375 -248 526 623 59% 1.7 Cumene (SPA) 812 328 -245 526 574 71% 1.6 Isopropyl Alcohol 3,880 808 -124 -50 932 24% 1.5 Methyl Chloride 398 249 -455 -250 703 177% 0.9 Phenol (from toluene) 4,787 2,149 -12,860 -3,556 15,009 314% 0.0 Acrylonitrile (from propane) 5,381 1,392 -13,152 5,509 14,544 270% 0.0
- Negative values indicate an exothermic reaction, net chemical conversion exergy inflow N/A A separation process without chemical reaction * Ratios may be higher than 100% because the input energy does not include heat generated by exothermic reactions ** Where multiple processes are modeled for a single product, production is assumed to be evenly divided among the technologies,
except for phenol and acrylonitrile, where only one of the technologies is commercial. For ethylene, production is assigned 40%, 40%, and 20% to naphtha, ethane, and propane technologies, as discussed in the chemical profile.
A comparison of the recovery energy potential for each chemical product is shown in Figure 10, in descending order. Where multiple technologies were evaluated, the sum accounts for the approximate prevalence of the competing technologies. Ethylene, chlorine, sulfuric acid, hydrogen, ethylene oxide, and ammonia exhibit the largest potentials for energy recovery. Many of the energy losses are associated with waste emissions such as cooling water, air, and purge streams, and by-product streams. However, exergy analyses have revealed that such streams may not always contain sufficient recoverable energy to justify energy recovery strategies. Exergy losses associated with waste recovery boilers and throttling can also be significant. Irreversibilities (or internal exergy losses) in the technologies studied were prevalent in furnaces, high temperature reactors, cooling of high temperature reactor effluents, refrigeration, and refrigerated separations.

Chemical Bandwidth Study Summary Report 17
0
50
100
150
200
250Trillion Btu/yr
Ethy
lene
Chl
orin
eSu
lfuric
Aci
dH
ydro
gen
Ethy
lene
Oxi
deAm
mon
ia
Prop
ylen
eTe
reph
thal
ic A
cid
Car
bon
Blac
kM
TBE
Met
hano
l Ac
rylo
nitri
leEt
hyle
ne D
ichl
orid
eFo
rmal
dehy
dePh
enol
N
itric
Aci
dPr
opyl
ene
Oxi
deSo
da A
shSt
yren
e p-
Xyle
ne
Ethy
lben
zene
Ethy
lene
Gly
col
Viny
l Chl
orid
eM
ethy
lC
arbo
n D
ioxi
deO
xyge
nU
rea
Nitr
ogen
Phos
phor
ic A
cid
Viny
l Ace
tate
Amm
oniu
m N
itrat
eC
apro
lact
amAc
etic
Aci
dH
ydro
chlo
ric A
cid
Cum
ene
Isob
utyl
ene
Anilin
eN
itrob
enze
neAm
mon
ium
Sul
fate
Buta
dien
ebi
sPhe
nol A
Cyc
lohe
xane
Isop
ropy
l Alc
ohol
Met
hyl C
hlor
ide
Figure 10. Comparison of Recoverable Energy Across Chemical Technologies
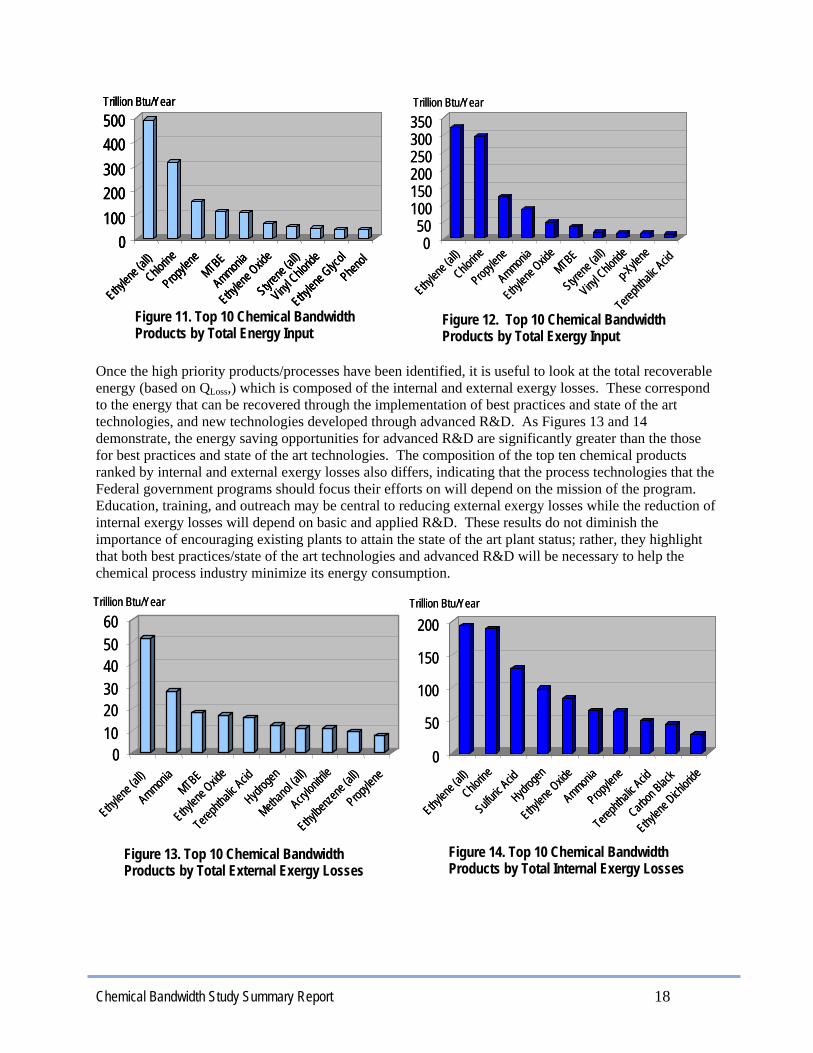
Trends Observed in the Bandwidth Analysis Results The data in Table 5 is presented graphically in Figures 11, 12, 13, and 14 to demonstrate the differences between using energy and exergy analyses to identify and prioritize industrial energy saving opportunities. R&D programs commonly focus funds and personnel on areas with the greatest potential for reducing energy use such as the most energy-intensive processes or technologies, which are determined based on the total energy input. However, in this approach, low and high quality energy inputs are considered equally. As this analysis demonstrates, energy quality can be an important factor when considering which process technologies to pursue for the greatest energy savings potential. Figures 11 and 12 show the top ten bandwidth chemicals by total energy and exergy input, respectively, and it is seen that in the case of ethylene glycol and phenol, a significant portion of the total energy input is low quality energy. When energy quality is considered in the exergy analysis, these chemicals are replaced by p-xylene and terephthalic acid which have higher exergy inputs and offer the potential for greater energy recovery. This poses the question of whether energy or exergy analysis should be used to determine opportunities for energy savings.
Chemical Bandwidth Study Summary Report 18
Once the high priority products/processes have been identified, it is useful to look at the total recoverable energy (based on QLoss,) which is composed of the internal and external exergy losses. These correspond to the energy that can be recovered through the implementation of best practices and state of the art technologies, and new technologies developed through advanced R&D. As Figures 13 and 14 demonstrate, the energy saving opportunities for advanced R&D are significantly greater than the those for best practices and state of the art technologies. The composition of the top ten chemical products ranked by internal and external exergy losses also differs, indicating that the process technologies that the Federal government programs should focus their efforts on will depend on the mission of the program. Education, training, and outreach may be central to reducing external exergy losses while the reduction of internal exergy losses will depend on basic and applied R&D. These results do not diminish the importance of encouraging existing plants to attain the state of the art plant status; rather, they highlight that both best practices/state of the art technologies and advanced R&D will be necessary to help the chemical process industry minimize its energy consumption.
0100200300400500Trillion Btu/Year
Ethylen
e (all)Chlo
rine
Propyle
neMTBE
Ammonia
Ethylen
e Oxid
e
Styrene
(all)
Vinyl C
hloride
Ethylen
e Glyc
ol
Phenol
0100200300400500Trillion Btu/Year
Ethylen
e (all)Chlo
rine
Propyle
neMTBE
Ammonia
Ethylen
e Oxid
e
Styrene
(all)
Vinyl C
hloride
Ethylen
e Glyc
ol
Phenol
0100200300400500Trillion Btu/Year
Ethylen
e (all)Chlo
rine
Propyle
neMTBE
Ammonia
Ethylen
e Oxid
e
Styrene
(all)
Vinyl C
hloride
Ethylen
e Glyc
ol
Phenol
050
100150200250300350Trillion Btu/Year
Ethylen
e (all)
Chlorine
Propyle
ne
Ammonia
Ethylen
e Oxid
eMTBE
Styrene
(all)
Vinyl C
hloride
p-Xyle
ne
Terepht
halic Acid
050
100150200250300350Trillion Btu/Year
Ethylen
e (all)
Chlorine
Propyle
ne
Ammonia
Ethylen
e Oxid
eMTBE
Styrene
(all)
Vinyl C
hloride
p-Xyle
ne
Terepht
halic Acid
Figure 11. Top 10 Chemical Bandwidth Products by Total Energy Input
Figure 12. Top 10 Chemical Bandwidth Products by Total Exergy Input
0102030405060
Ethylen
e (all)
Ammonia
MTBE
Ethylen
e Oxid
e
Terepht
halic Acid
Hydroge
n
Methano
l (all)
Acrylon
itrile
Ethylbe
nzene
(all)
Propyle
ne
Trillion Btu/Year
0102030405060
Ethylen
e (all)
Ammonia
MTBE
Ethylen
e Oxid
e
Terepht
halic Acid
Hydroge
n
Methano
l (all)
Acrylon
itrile
Ethylbe
nzene
(all)
Propyle
ne
Trillion Btu/Year
0
50
100
150
200
Ethylen
e (all)
Chlorine
Sulfuric
Acid
Hydroge
n
Ethylen
e Oxid
e
Ammonia
Propyle
ne
Terepht
halic Acid
Carbon
Black
Ethylen
e Dich
loride
Trillion Btu/Year
0
50
100
150
200
Ethylen
e (all)
Chlorine
Sulfuric
Acid
Hydroge
n
Ethylen
e Oxid
e
Ammonia
Propyle
ne
Terepht
halic Acid
Carbon
Black
Ethylen
e Dich
loride
Trillion Btu/Year
Figure 13. Top 10 Chemical Bandwidth Products by Total External Exergy Losses
Figure 14. Top 10 Chemical Bandwidth Products by Total Internal Exergy Losses

Chemical Bandwidth Study Summary Report 19
Chemical Bandwidth Profiles A brief summary and analysis of the results obtained for each chemical product are provided to give perspective on the assumptions used and the unique aspects of each technology. Insights are given on the largest sources of energy consumption as well as process inefficiencies. Summaries are provided in rank order of descending potential energy recovery (corresponding with Table 5). In addition, the key differences between multiple technologies are analyzed. This is an important benefit of the combined energy and exergy modeling approach – different technologies used to produce the same chemical product can be compared in terms of unit operations and potential for energy and exergy recoveries. Each profile describes the major sources of energy and exergy losses and makes a comparison of the total process energy inputs to theoretical minimum energy requirements. Energy losses provide an overall picture of process inefficiencies; external and internal exergy losses give a better indication of energy that may be recoverable, and are based on energy quality, as discussed earlier. A low ratio of external exergy loss to total energy loss (low energy quality) indicates energy recovery may not be very feasible. High internal exergy losses indicate substantial process irreversibilities that may be difficult or technically impossible to mitigate.
Chemical Bandwidth Study Summary Report 20
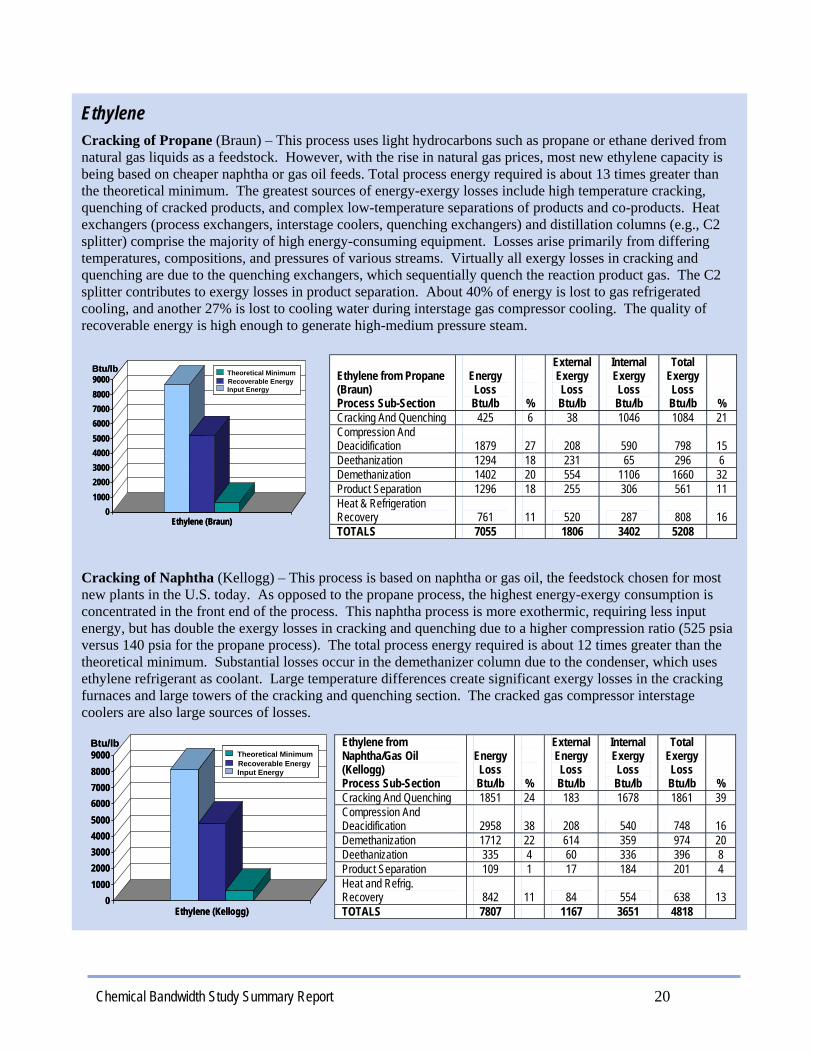
Ethylene Cracking of Propane (Braun) – This process uses light hydrocarbons such as propane or ethane derived from natural gas liquids as a feedstock. However, with the rise in natural gas prices, most new ethylene capacity is being based on cheaper naphtha or gas oil feeds. Total process energy required is about 13 times greater than the theoretical minimum. The greatest sources of energy-exergy losses include high temperature cracking, quenching of cracked products, and complex low-temperature separations of products and co-products. Heat exchangers (process exchangers, interstage coolers, quenching exchangers) and distillation columns (e.g., C2 splitter) comprise the majority of high energy-consuming equipment. Losses arise primarily from differing temperatures, compositions, and pressures of various streams. Virtually all exergy losses in cracking and quenching are due to the quenching exchangers, which sequentially quench the reaction product gas. The C2 splitter contributes to exergy losses in product separation. About 40% of energy is lost to gas refrigerated cooling, and another 27% is lost to cooling water during interstage gas compressor cooling. The quality of recoverable energy is high enough to generate high-medium pressure steam. Cracking of Naphtha (Kellogg) – This process is based on naphtha or gas oil, the feedstock chosen for most new plants in the U.S. today. As opposed to the propane process, the highest energy-exergy consumption is concentrated in the front end of the process. This naphtha process is more exothermic, requiring less input energy, but has double the exergy losses in cracking and quenching due to a higher compression ratio (525 psia versus 140 psia for the propane process). The total process energy required is about 12 times greater than the theoretical minimum. Substantial losses occur in the demethanizer column due to the condenser, which uses ethylene refrigerant as coolant. Large temperature differences create significant exergy losses in the cracking furnaces and large towers of the cracking and quenching section. The cracked gas compressor interstage coolers are also large sources of losses.
Ethylene from Propane (Braun) Process Sub-Section
Energy Loss Btu/lb
%
External Exergy Loss Btu/lb
Internal Exergy Loss Btu/lb
Total Exergy Loss Btu/lb %
Cracking And Quenching 425 6 38 1046 1084 21 Compression And Deacidification
1879
27 208 590 798 15
Deethanization 1294 18 231 65 296 6 Demethanization 1402 20 554 1106 1660 32 Product Separation 1296 18 255 306 561 11 Heat & Refrigeration Recovery
761
11 520 287 808 16
TOTALS 7055 1806 3402 5208
Ethylene from Naphtha/Gas Oil (Kellogg) Process Sub-Section
Energy Loss Btu/lb
%
External Energy Loss Btu/lb
Internal Exergy Loss Btu/lb
Total Exergy Loss Btu/lb %
Cracking And Quenching 1851 24 183 1678 1861 39 Compression And Deacidification
2958
38 208 540 748 16
Demethanization 1712 22 614 359 974 20 Deethanization 335 4 60 336 396 8 Product Separation 109 1 17 184 201 4 Heat and Refrig. Recovery
842
11 84 554 638 13
TOTALS 7807 1167 3651 4818
0100020003000400050006000700080009000
Ethylene (Braun)
Theoretical MinimumRecoverable EnergyInput Energy
Btu/lb
0100020003000400050006000700080009000
Ethylene (Braun)
Theoretical MinimumRecoverable EnergyInput Energy
Theoretical MinimumRecoverable EnergyInput Energy
Btu/lb
0100020003000400050006000700080009000
Ethylene (Kellogg)
Btu/lbTheoretical MinimumRecoverable EnergyInput Energy
0100020003000400050006000700080009000
Ethylene (Kellogg)
Btu/lbTheoretical MinimumRecoverable EnergyInput Energy
Theoretical MinimumRecoverable EnergyInput Energy

Chemical Bandwidth Study Summary Report 21
Chlorine Almost all chlorine is produced by the electrolysis of brine, and most U.S. producers use the diaphragm electrolysis cell modeled here. Two other cells are also used: mercury cells, which are gradually being replaced due to environmental concerns, and newer membrane cells, which have not yet grown to dominate the market. Electrolysis produces chlorine together with by-products sodium hydroxide (caustic soda) and hydrogen, with a theoretical minimum energy of 3,086 Btu/lb chlorine. All the energy and exergy values below are given per pound of chlorine; if energy and exergy losses were also allocated to caustic soda, these figures for chlorine would be lower. In this electrolysis process, the actual input of electrical energy is almost three times the theoretical minimum, and this does not include electrical transmission and generation losses. Energy and external exergy losses are low; most of the exergy losses are internal losses due to irreversibilities in the electrolysis cells.
0
2,000
4,000
6,000
8,000
10,000
12,000
Btu/lb
Chlorine
Input EnergyRecoverable EnergyTheoretical Minimum
Chlorine Process Sub-Section
Energy Loss
External Exergy Loss
Internal Exergy Loss
Total Exergy Loss
Btu/lb % Btu/lb Btu/lb Btu/lb % Brine 663 69 23 40 63 1 Electrolysis 0 0 0 6395 6395 91 Gas Treatment 227 23 13 232 246 3 Liquor 77 8 0 359 359 5 TOTALS 967 100 36 7026 7063 100
Ethane Pyrolysis – This process is based on steam cracking of ethane, which is derived from natural gas. Much of U.S. production using this process was suspended with increasing natural gas prices, but then resumed when crude oil prices also began to rise. Total energy losses for this process (3,632 Btu/lb) are about half those of the other two ethylene processes, and exergy losses are also significantly lower for this ethane process. However, these losses are given per pound of ethylene product, and the naptha- and propane-based processes yield more valuable co-products, such as propylene, pyrolysis gasoline, and fuel gasses. Some of the difference may also be due to modeling, as the analysis of this ethane process is based on a more detailed Aspen model than the other two processes. The largest energy loss is from a propylene condenser in the refrigeration section. This is the last in a series of methane, ethylene, and propylene refrigeration compressors, each of which cools against the next cooler circuit. The last condenser represents the energy loss for the whole group of compressors, and has an energy quality of only 2%, indicating no further energy recovery is possible. Other large energy losses are also of fairly low quality. The main internal exergy loss is from the cracking furnace, which has a large temperature difference between process fluid entering the furnace and burner gasses.
01,0002,0003,0004,0005,0006,0007,0008,0009,000
10,000
Btu/lb
Ethylene (ex ethane)
Input EnergyRecoverable EnergyTheoretical Minimum
Ethylene from Ethane Process Sub-Section
Energy Loss
External Exergy Loss
Internal Exergy Loss
Total Exergy Loss
Btu/lb % Btu/lb Btu/lb Btu/lb % Thermal Cracking 495 14 39 1602 1641 48 Compression 1245 34 120 338 459 13 Refrigeration 1888 52 67 891 958 28 Demethanization 0 0 0 103 103 3 Deethanization 4 0 0 100 100 3 Purification 0 0 0 152 152 4 TOTALS 3,632 100 226 3186 3413 100
Chemical Bandwidth Study Summary Report 22
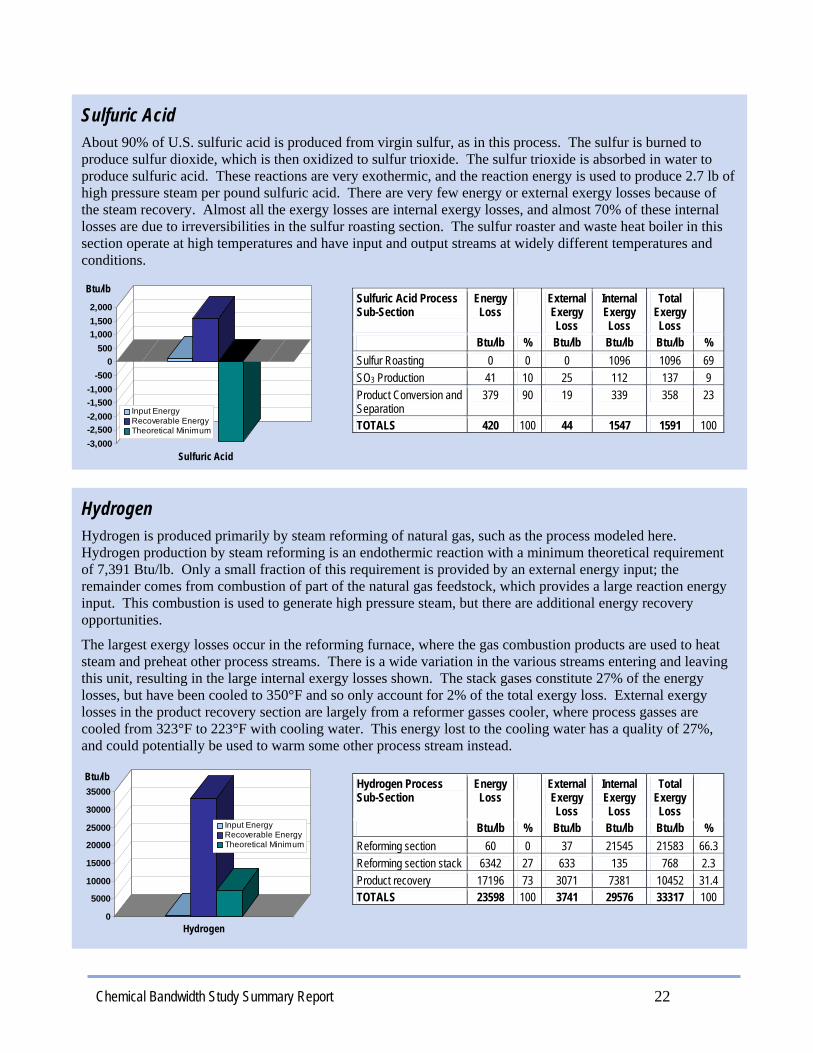
Hydrogen Hydrogen is produced primarily by steam reforming of natural gas, such as the process modeled here. Hydrogen production by steam reforming is an endothermic reaction with a minimum theoretical requirement of 7,391 Btu/lb. Only a small fraction of this requirement is provided by an external energy input; the remainder comes from combustion of part of the natural gas feedstock, which provides a large reaction energy input. This combustion is used to generate high pressure steam, but there are additional energy recovery opportunities.
The largest exergy losses occur in the reforming furnace, where the gas combustion products are used to heat steam and preheat other process streams. There is a wide variation in the various streams entering and leaving this unit, resulting in the large internal exergy losses shown. The stack gases constitute 27% of the energy losses, but have been cooled to 350°F and so only account for 2% of the total exergy loss. External exergy losses in the product recovery section are largely from a reformer gasses cooler, where process gasses are cooled from 323°F to 223°F with cooling water. This energy lost to the cooling water has a quality of 27%, and could potentially be used to warm some other process stream instead.
0
5000
10000
15000
20000
25000
30000
35000Btu/lb
Hydrogen
Input EnergyRecoverable EnergyTheoretical Minimum
Hydrogen Process Sub-Section
Energy Loss
External Exergy Loss
Internal Exergy Loss
Total Exergy Loss
Btu/lb % Btu/lb Btu/lb Btu/lb % Reforming section 60 0 37 21545 21583 66.3 Reforming section stack 6342 27 633 135 768 2.3 Product recovery 17196 73 3071 7381 10452 31.4 TOTALS 23598 100 3741 29576 33317 100
Sulfuric Acid About 90% of U.S. sulfuric acid is produced from virgin sulfur, as in this process. The sulfur is burned to produce sulfur dioxide, which is then oxidized to sulfur trioxide. The sulfur trioxide is absorbed in water to produce sulfuric acid. These reactions are very exothermic, and the reaction energy is used to produce 2.7 lb of high pressure steam per pound sulfuric acid. There are very few energy or external exergy losses because of the steam recovery. Almost all the exergy losses are internal exergy losses, and almost 70% of these internal losses are due to irreversibilities in the sulfur roasting section. The sulfur roaster and waste heat boiler in this section operate at high temperatures and have input and output streams at widely different temperatures and conditions.
-3,000-2,500-2,000-1,500-1,000
-5000
5001,0001,5002,000
Btu/lb
Sulfuric Acid
Input EnergyRecoverable EnergyTheoretical Minimum
Sulfuric Acid Process Sub-Section
Energy Loss
External Exergy Loss
Internal Exergy Loss
Total Exergy Loss
Btu/lb % Btu/lb Btu/lb Btu/lb % Sulfur Roasting 0 0 0 1096 1096 69 SO3 Production 41 10 25 112 137 9 Product Conversion and Separation
379 90 19 339 358 23
TOTALS 420 100 44 1547 1591 100
Chemical Bandwidth Study Summary Report 23
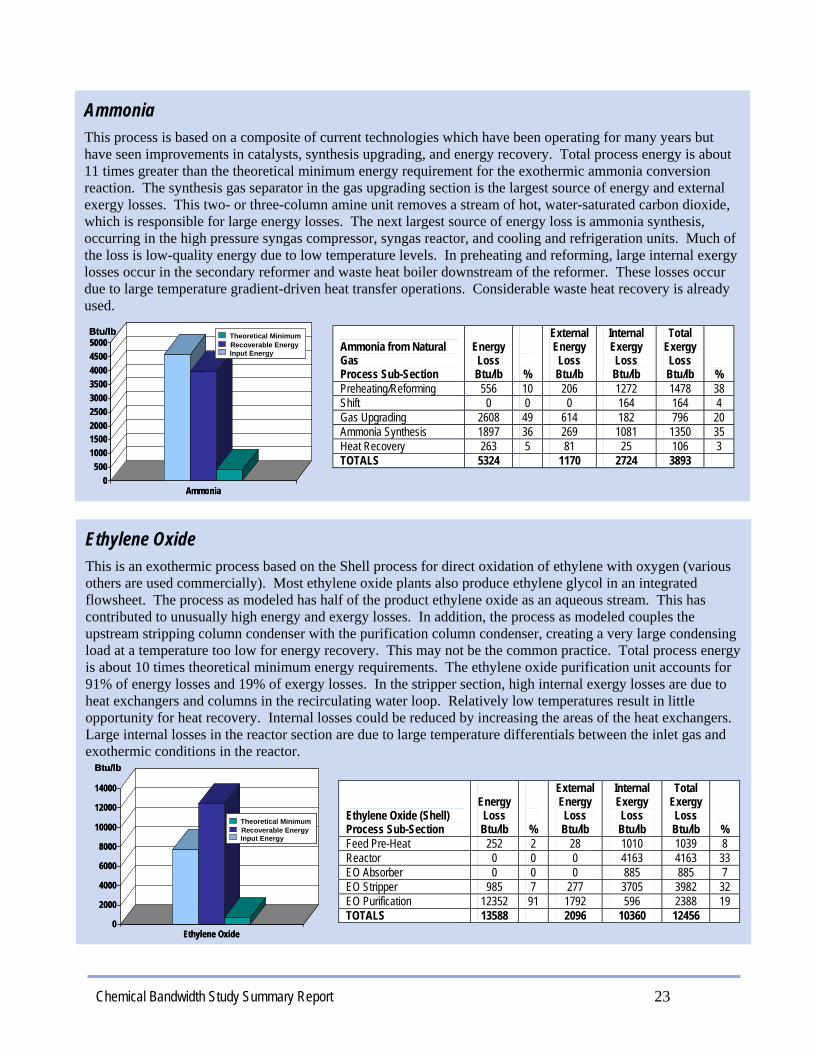
Ammonia This process is based on a composite of current technologies which have been operating for many years but have seen improvements in catalysts, synthesis upgrading, and energy recovery. Total process energy is about 11 times greater than the theoretical minimum energy requirement for the exothermic ammonia conversion reaction. The synthesis gas separator in the gas upgrading section is the largest source of energy and external exergy losses. This two- or three-column amine unit removes a stream of hot, water-saturated carbon dioxide, which is responsible for large energy losses. The next largest source of energy loss is ammonia synthesis, occurring in the high pressure syngas compressor, syngas reactor, and cooling and refrigeration units. Much of the loss is low-quality energy due to low temperature levels. In preheating and reforming, large internal exergy losses occur in the secondary reformer and waste heat boiler downstream of the reformer. These losses occur due to large temperature gradient-driven heat transfer operations. Considerable waste heat recovery is already used.
0500
100015002000250030003500400045005000
Ammonia
Btu/lb Theoretical MinimumRecoverable EnergyInput Energy
0500
100015002000250030003500400045005000
Ammonia
Btu/lb Theoretical MinimumRecoverable EnergyInput Energy
Theoretical MinimumRecoverable EnergyInput Energy
Ammonia from Natural Gas Process Sub-Section
Energy Loss Btu/lb
%
External Energy Loss Btu/lb
Internal Exergy Loss Btu/lb
Total Exergy Loss Btu/lb %
Preheating/Reforming 556 10 206 1272 1478 38 Shift 0 0 0 164 164 4 Gas Upgrading 2608 49 614 182 796 20 Ammonia Synthesis 1897 36 269 1081 1350 35 Heat Recovery 263 5 81 25 106 3 TOTALS 5324 1170 2724 3893
Ethylene Oxide This is an exothermic process based on the Shell process for direct oxidation of ethylene with oxygen (various others are used commercially). Most ethylene oxide plants also produce ethylene glycol in an integrated flowsheet. The process as modeled has half of the product ethylene oxide as an aqueous stream. This has contributed to unusually high energy and exergy losses. In addition, the process as modeled couples the upstream stripping column condenser with the purification column condenser, creating a very large condensing load at a temperature too low for energy recovery. This may not be the common practice. Total process energy is about 10 times theoretical minimum energy requirements. The ethylene oxide purification unit accounts for 91% of energy losses and 19% of exergy losses. In the stripper section, high internal exergy losses are due to heat exchangers and columns in the recirculating water loop. Relatively low temperatures result in little opportunity for heat recovery. Internal losses could be reduced by increasing the areas of the heat exchangers. Large internal losses in the reactor section are due to large temperature differentials between the inlet gas and exothermic conditions in the reactor.
Ethylene Oxide (Shell) Process Sub-Section
Energy Loss Btu/lb
%
External Energy Loss Btu/lb
Internal Exergy Loss Btu/lb
Total Exergy Loss Btu/lb %
Feed Pre-Heat 252 2 28 1010 1039 8 Reactor 0 0 0 4163 4163 33 EO Absorber 0 0 0 885 885 7 EO Stripper 985 7 277 3705 3982 32 EO Purification 12352 91 1792 596 2388 19 TOTALS 13588 2096 10360 12456
0
2000
4000
6000
8000
10000
12000
14000
Ethylene Oxide
Btu/lb
Theoretical MinimumRecoverable EnergyInput Energy
0
2000
4000
6000
8000
10000
12000
14000
Ethylene Oxide
Btu/lb
Theoretical MinimumRecoverable EnergyInput Energy
Theoretical MinimumRecoverable EnergyInput Energy
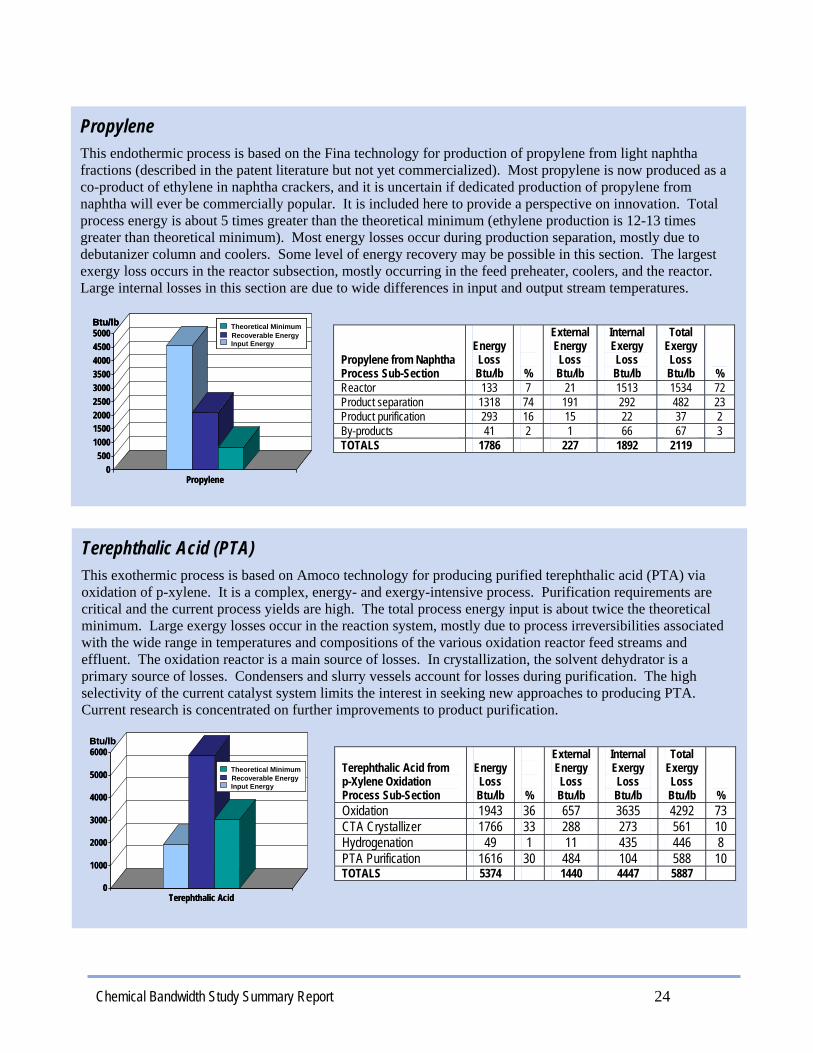
Chemical Bandwidth Study Summary Report 24
Propylene This endothermic process is based on the Fina technology for production of propylene from light naphtha fractions (described in the patent literature but not yet commercialized). Most propylene is now produced as a co-product of ethylene in naphtha crackers, and it is uncertain if dedicated production of propylene from naphtha will ever be commercially popular. It is included here to provide a perspective on innovation. Total process energy is about 5 times greater than the theoretical minimum (ethylene production is 12-13 times greater than theoretical minimum). Most energy losses occur during production separation, mostly due to debutanizer column and coolers. Some level of energy recovery may be possible in this section. The largest exergy loss occurs in the reactor subsection, mostly occurring in the feed preheater, coolers, and the reactor. Large internal losses in this section are due to wide differences in input and output stream temperatures.
Propylene from Naphtha Process Sub-Section
Energy Loss Btu/lb
%
External Energy Loss Btu/lb
Internal Exergy Loss Btu/lb
Total Exergy Loss Btu/lb %
Reactor 133 7 21 1513 1534 72 Product separation 1318 74 191 292 482 23 Product purification 293 16 15 22 37 2 By-products 41 2 1 66 67 3 TOTALS 1786 227 1892 2119
0500
100015002000250030003500400045005000
Propylene
Btu/lb Theoretical MinimumRecoverable EnergyInput Energy
0500
100015002000250030003500400045005000
Propylene
Btu/lb Theoretical MinimumRecoverable EnergyInput Energy
Btu/lb Theoretical MinimumRecoverable EnergyInput Energy
Theoretical MinimumRecoverable EnergyInput Energy
Terephthalic Acid (PTA) This exothermic process is based on Amoco technology for producing purified terephthalic acid (PTA) via oxidation of p-xylene. It is a complex, energy- and exergy-intensive process. Purification requirements are critical and the current process yields are high. The total process energy input is about twice the theoretical minimum. Large exergy losses occur in the reaction system, mostly due to process irreversibilities associated with the wide range in temperatures and compositions of the various oxidation reactor feed streams and effluent. The oxidation reactor is a main source of losses. In crystallization, the solvent dehydrator is a primary source of losses. Condensers and slurry vessels account for losses during purification. The high selectivity of the current catalyst system limits the interest in seeking new approaches to producing PTA. Current research is concentrated on further improvements to product purification.
Terephthalic Acid from p-Xylene Oxidation Process Sub-Section
Energy Loss Btu/lb
%
External Energy Loss Btu/lb
Internal Exergy Loss Btu/lb
Total Exergy Loss Btu/lb %
Oxidation 1943 36 657 3635 4292 73 CTA Crystallizer 1766 33 288 273 561 10 Hydrogenation 49 1 11 435 446 8 PTA Purification 1616 30 484 104 588 10 TOTALS 5374 1440 4447 5887
0
1000
2000
3000
4000
5000
6000
Terephthalic Acid
Btu/lb
Theoretical MinimumRecoverable EnergyInput Energy
0
1000
2000
3000
4000
5000
6000
Terephthalic Acid
Btu/lb
Theoretical MinimumRecoverable EnergyInput Energy
Theoretical MinimumRecoverable EnergyInput Energy

Chemical Bandwidth Study Summary Report 25
Carbon Black Carbon black is a very fine, fluffy powder of essentially elemental carbon, used mainly to reinforce rubber. Almost all U.S. production uses this oil furnace process, in which oil is decomposed at high temperature to carbon and hydrogen. Part of the oil feedstock is oxidized with air to maintain the process temperature, and the reaction products are quenched with water to prevent the carbon black from reacting with the products of combustion. The high temperature reaction section is used to generate 3.4 lb of high-pressure steam per pound carbon black. Hot effluent gasses are used to preheat the combustion air, but then leave the plant and are modeled as an energy loss (accounting for the entire process energy and external exergy losses). These effluent gasses still have a considerable heating value because of their hydrogen and carbon monoxide content and moderately high temperature. The process flow-sheet does indicate that they are fed to downstream boilers and incinerators outside the process. The remaining exergy losses are mainly due to irreversibilities in the reaction section. The high-temperature furnace and quenching operations are highly irreversible and account for about 70% of the internal exergy losses.
-2000
0
2000
4000
6000
8000
10000
12000
14000
Btu/lb
Carbon Black
Input EnergyRecoverableEnergyTheoreticalMinimum
Carbon Black Process Sub-Section
Energy Loss
External Exergy Loss
Internal Exergy Loss
Total Exergy Loss
Btu/lb % Btu/lb Btu/lb Btu/lb % Reaction & Filtration 0 0 0 10103 10103 80 Purification Separation & Pelletization
8704 100 939 1524 2463 20
TOTALS 8704 100 939 11627 12566 100
MTBE (methyl tert-butyl ether) This exothermic “first generation” process uses a liquid acid to catalyze the etherification of isobutylene with methanol. Other technologies in use today use an acid ion exchange resin catalyst in a reactor or within a distillation column (catalytic distillation). The total process energy input is more than 70 times greater than the theoretical minimum energy requirements. Nearly all energy and exergy losses occur in the MTBE recovery section, primarily due to the MTBE distillation column which has a large condensing load. Contributing factors are the low temperature of the overhead streams which require cooling water, and large temperature differences among the overheads, feed, and bottoms stream temperatures.
MTBE Process Sub-Section
Energy Loss Btu/lb
%
External Energy Loss Btu/lb
Internal Exergy Loss Btu/lb
Total Exergy Loss Btu/lb %
Reactor 297 3 26 137 163 6 Methanol Recovery 63 1 9 7 16 1 MTBE Recovery 8744 96 1373 1155 2527 93 TOTALS 1786 227 1892 2119
0100020003000400050006000700080009000
MTBE
Btu/lbTheoretical MinimumRecoverable EnergyInput Energy
0100020003000400050006000700080009000
MTBE
Btu/lbTheoretical MinimumRecoverable EnergyInput Energy
Theoretical MinimumRecoverable EnergyInput Energy

Chemical Bandwidth Study Summary Report 26
Methanol ICI LP – This exothermic process is based on the ICI low-pressure technology that includes steam reforming of natural gas, high pressure synthesis of methanol, and distillation for product recovery and separation. The total process energy input is about 6 times the theoretical minimum energy requirement. The sources of large exergy losses in the refining section are a primary distillation column and large heat exchanger. The reforming furnace has large internal exergy losses, primarily due to large differences in temperature of inlet and effluent streams and combustion gases.
0
1000
2000
3000
4000
5000
6000
Methanol (ICI LP)
Btu/lb
Theoretical MinimumRecoverable EnergyInput Energy
0
1000
2000
3000
4000
5000
6000
Methanol (ICI LP)
Btu/lb
Theoretical MinimumRecoverable EnergyInput Energy
Theoretical MinimumRecoverable EnergyInput Energy
Methanol from Natural Gas (ICI LP) Process Sub-Section
Energy Loss
External Exergy Loss
Internal Exergy Loss
Total Exergy Loss
Btu/lb % Btu/lb Btu/lb Btu/lb % Reforming section 176 2 8 2,791 2,799 52 Synthesis section 313 3 47 516 562 10 Refining section 9,391 95 1,234 822 2,056 38 TOTALS 9880 1289 4128 5416
Lurgi – This process varies from the ICI LP process in that it utilizes a combined reforming process with two stages of reforming in series, the second with oxygen injection. Process energy input is about 3 times greater than the theoretical minimum energy requirement. The heat recovery section exhibits the greatest external exergy losses and indicates the potential for significant energy recovery if low temperature users were available. The methanol column in the refining section also makes a large contribution to energy losses, although it is lower than the similar column in the ICI process. Condenser steam generation could reduce energy losses. Relatively large losses are also attributed to a process exchanger and combustion furnace in the reforming section, and to methanol reactors, condensers and air coolers in the synthesis section. The process exchanger is a candidate for steam generation with substantial energy recovery. The combustion furnace has a lower energy loss but the high external energy ratio suggests the possible use of a waste heat boiler to recover energy. Exergy losses occur in the reforming and heat recovery sections due to the wide range of inlet and outlet temperatures involved. Large temperature differences are also responsible for significant internal exergy losses in the synthesis section.
0500
100015002000250030003500400045005000
Methanol (Lurgi)
Btu/lb
Theoretical MinimumRecoverable EnergyInput Energy
0500
100015002000250030003500400045005000
Methanol (Lurgi)
Btu/lb
Theoretical MinimumRecoverable EnergyInput Energy
Theoretical MinimumRecoverable EnergyInput Energy
Methanol from Natural Gas (Lurgi) Process Sub-Section
Energy Loss
External Exergy Loss
Internal Exergy Loss
Total Exergy Loss
Btu/lb % Btu/lb Btu/lb Btu/lb % Reforming section 1483 20 608 2131 2739 55 Synthesis section 1918 25 471 489 960 19 Refining section 1234 16 164 98 262 5 Heat recovery 2958 39 922 99 1021 20 TOTALS 7594 2165 2816 4982
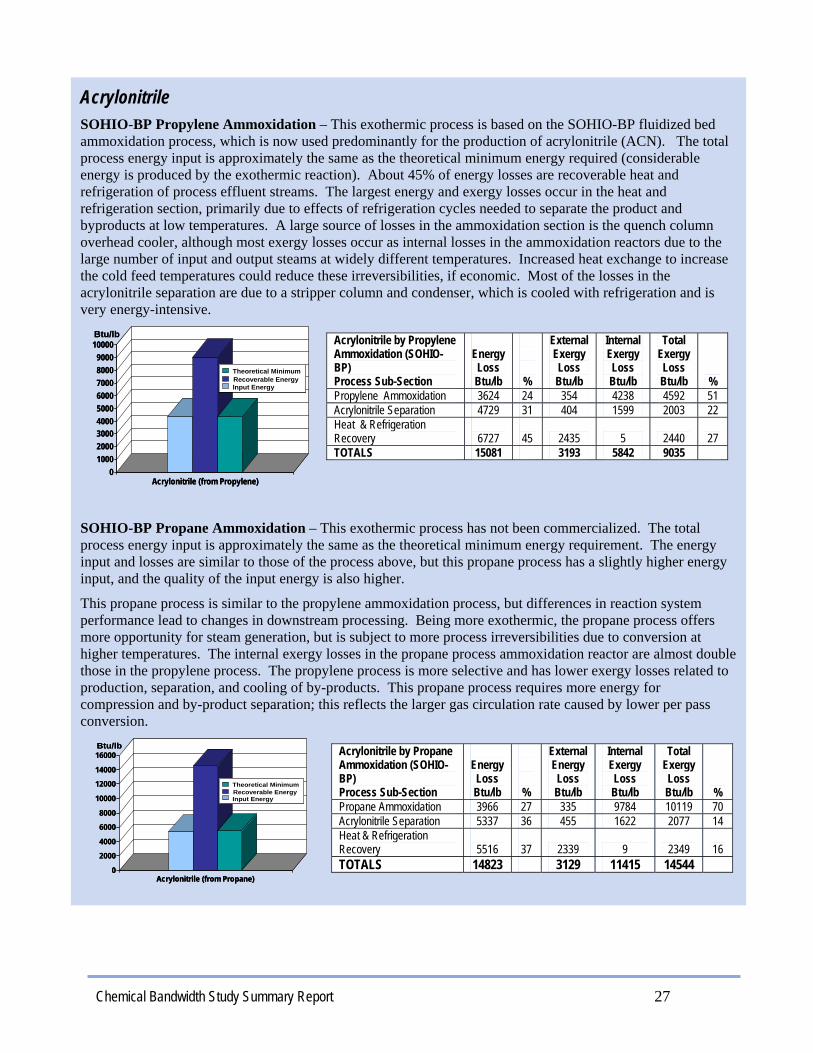
Chemical Bandwidth Study Summary Report 27
Acrylonitrile SOHIO-BP Propylene Ammoxidation – This exothermic process is based on the SOHIO-BP fluidized bed ammoxidation process, which is now used predominantly for the production of acrylonitrile (ACN). The total process energy input is approximately the same as the theoretical minimum energy required (considerable energy is produced by the exothermic reaction). About 45% of energy losses are recoverable heat and refrigeration of process effluent streams. The largest energy and exergy losses occur in the heat and refrigeration section, primarily due to effects of refrigeration cycles needed to separate the product and byproducts at low temperatures. A large source of losses in the ammoxidation section is the quench column overhead cooler, although most exergy losses occur as internal losses in the ammoxidation reactors due to the large number of input and output steams at widely different temperatures. Increased heat exchange to increase the cold feed temperatures could reduce these irreversibilities, if economic. Most of the losses in the acrylonitrile separation are due to a stripper column and condenser, which is cooled with refrigeration and is very energy-intensive. SOHIO-BP Propane Ammoxidation – This exothermic process has not been commercialized. The total process energy input is approximately the same as the theoretical minimum energy requirement. The energy input and losses are similar to those of the process above, but this propane process has a slightly higher energy input, and the quality of the input energy is also higher.
This propane process is similar to the propylene ammoxidation process, but differences in reaction system performance lead to changes in downstream processing. Being more exothermic, the propane process offers more opportunity for steam generation, but is subject to more process irreversibilities due to conversion at higher temperatures. The internal exergy losses in the propane process ammoxidation reactor are almost double those in the propylene process. The propylene process is more selective and has lower exergy losses related to production, separation, and cooling of by-products. This propane process requires more energy for compression and by-product separation; this reflects the larger gas circulation rate caused by lower per pass conversion.
Acrylonitrile by Propylene Ammoxidation (SOHIO-BP) Process Sub-Section
Energy Loss Btu/lb
%
External Exergy Loss Btu/lb
Internal Exergy Loss Btu/lb
Total Exergy Loss Btu/lb %
Propylene Ammoxidation 3624 24 354 4238 4592 51 Acrylonitrile Separation 4729 31 404 1599 2003 22 Heat & Refrigeration Recovery
6727
45 2435 5 2440 27
TOTALS 15081 3193 5842 9035
Acrylonitrile by Propane Ammoxidation (SOHIO-BP) Process Sub-Section
Energy Loss Btu/lb
%
External Energy Loss Btu/lb
Internal Exergy Loss Btu/lb
Total Exergy Loss Btu/lb %
Propane Ammoxidation 3966 27 335 9784 10119 70 Acrylonitrile Separation 5337 36 455 1622 2077 14 Heat & Refrigeration Recovery
5516
37 2339 9 2349 16
TOTALS 14823 3129 11415 14544 0
2000
4000
6000
8000
10000
12000
14000
16000
Acrylonitrile (from Propane)
Btu/lb
Theoretical MinimumRecoverable EnergyInput Energy
0
2000
4000
6000
8000
10000
12000
14000
16000
Acrylonitrile (from Propane)
Btu/lb
Theoretical MinimumRecoverable EnergyInput Energy
Theoretical MinimumRecoverable EnergyInput Energy
0100020003000400050006000700080009000
10000
Acrylonitrile (from Propylene)
Btu/lb
Theoretical MinimumRecoverable EnergyInput Energy
0100020003000400050006000700080009000
10000
Acrylonitrile (from Propylene)
Btu/lb
Theoretical MinimumRecoverable EnergyInput Energy
Theoretical MinimumRecoverable EnergyInput Energy

Chemical Bandwidth Study Summary Report 28
Ethylene Dichloride This process is the oxychlorination of ethylene by hydrogen chloride in a fluidized bed using air. Several other versions of oxychlorination technology are also used in the United States. This process uses steam generation for energy recovery in the reactions section and in the gas treatment section, where an incinerator removes all hydrocarbons and waste chlorinated hydrocarbons from the vent gas stream. The exothermic oxychlorination reactor generates 5.3 lb of 25 psig steam per pound product, and the gas treatment section generates a further 1.0 lb per pound product. Energy losses in the purification section are from distillation columns, and are of too low quality for steam generation. The high-temperature reactor and incinerator units account for over 75% of the internal exergy losses.
-800-600-400-200
0200400600800
1,0001,200
Btu/lb
Ethylene Dichloride
Input EnergyRecoverable EnergyTheoretical Minimum
Ethylene Dichloride Process Sub-Section
Energy Loss
External Exergy Loss
Internal Exergy Loss
Total Exergy Loss
Btu/lb % Btu/lb Btu/lb Btu/lb % Reactions 648 53 50 794 843 74 Purification 521 42 31 14 45 4 Gas Treatment 62 5 0 251 251 22 TOTALS 1231 100 81 1059 1139 100
Formaldehyde This exothermic process produces formaldehyde from methanol using a silver-based catalyst, and is based on BASF technology. (A second technology using a mixed oxide catalyst is also widely used.) The total energy from the process input and from the reaction is about 4 times greater than the theoretical minimum energy requirement. In this relatively simple process configuration, the low temperature quench of the reactor effluent is responsible for most of the energy consumption as well as energy and exergy losses. The very large driving forces around the exothermic reactor contribute to the substantial internal exergy losses.
Formaldehyde from Methanol Process Sub-Section
Energy Loss Btu/lb
%
External Energy Loss Btu/lb
Internal Exergy Loss Btu/lb
Total Exergy Loss Btu/lb %
Feed Air/Recycle Air Mixer 0 0 0 19 19 0.56 Feed Air Compressor 0 0.0 0 17 17 0.51 Feed Heater 0 0.0 0 97 97 2.91 Reactor 2268 94.8 487 2463 2950 88.9 Absorber 0 0.0 0 235 235 7.07 Recycle Air Purge 124 5.2 4 2 6 0.19 TOTALS 2392 491 2833 3324 0
500
1000
1500
2000
2500
3000
3500
Formaldehyde
Btu/lb
Theoretical MinimumRecoverable EnergyInput Energy
0
500
1000
1500
2000
2500
3000
3500
Formaldehyde
Btu/lb
Theoretical MinimumRecoverable EnergyInput Energy
Theoretical MinimumRecoverable EnergyInput Energy

Chemical Bandwidth Study Summary Report 29
Phenol Oxidation of Cumene – All major U.S. phenol producers use this process, which generates 0.62 lb of acetone for every pound of phenol. The process is based on two exothermic reactions: cumene is first oxidized to its hydroperoxide, which is then decomposed into phenol and acetone. The reactions occur at relatively low temperatures and the process does not offer much opportunity for energy recovery. If the process could be safely run at a higher temperature with a less active catalyst, there may be more opportunity for useful steam generation.
The main energy losses in the cumene oxidation section occur in two distillation column concentrator units. These are operated at a vacuum due to the hazardous nature of cumene hydroperoxide. The energy quality is low and the overheads temperatures are too low for steam cooling. Energy losses in the product recovery section are also largely in separation columns with no good opportunity for steam generation. Two thirds of the exergy losses in the product recovery section occur in a product cooler unit, where phenol is cooled by tempered water. The tempered water is considered a process stream, so the associated exergy change is an internal loss.
-2000
-1000
0
1000
2000
3000
4000
5000
Btu/lb
Phenol
Input EnergyRecoverable EnergyTheoretical Minimum
Phenol Process Sub-Section
Energy Loss
External Exergy Loss
Internal Exergy Loss
Total Exergy Loss
Btu/lb % Btu/lb Btu/lb Btu/lb % Cumene Oxidation 1841 30 219 254 473 10 Cleavage Section 152 2 10 1014 1024 22 Product Recovery 4065 66 850 2233 3083 67 Water Treatment 51 1 10 4 14 0 AMS Hydrogenation 81 1 21 10 31 1 TOTALS 6190 100 1110 3515 4625 100
Oxidation of Toluene – The dominant cumene production process for phenol produces a fixed ratio of co-product acetone, but the demand for acetone is growing slower than the demand for phenol. In light of this trend, several processes for producing phenol without co-product are under development. This process has been commercialized in one U.S plant, and is based on toluene, a feedstock with a lower and more stable price than cumene. The toluene is first oxidized to benzoic acid, which is then oxidized to phenol via phenyl benzoate. The reactions are all exothermic and generate considerably more energy than the cumene oxidation process above. The reaction energy is used much less efficiently here, so the total energy input for this process is roughly equal to the cumene process. The two largest high-quality energy losses are in the toluene oxidation section. The toluene oxidation reactor and cooler account for 35% of total energy losses, but there is little opportunity for energy recovery or for using low pressure steam in the process.
-4000-2000
02000400060008000
10000120001400016000
Btu/lb
Phenol
Input EnergyRecoverable EnergyTheoretical Minimum
Phenol Process Sub-Section
Energy Loss
External Exergy Loss
Internal Exergy Loss
Total Exergy Loss
Btu/lb % Btu/lb Btu/lb Btu/lb % Toluene Oxidation 6827 63 1831 4603 6434 43 Phenol Production & Separation
3954 37 524 8050 8574 57
TOTALS 10781 100 2355 12653 15008 100
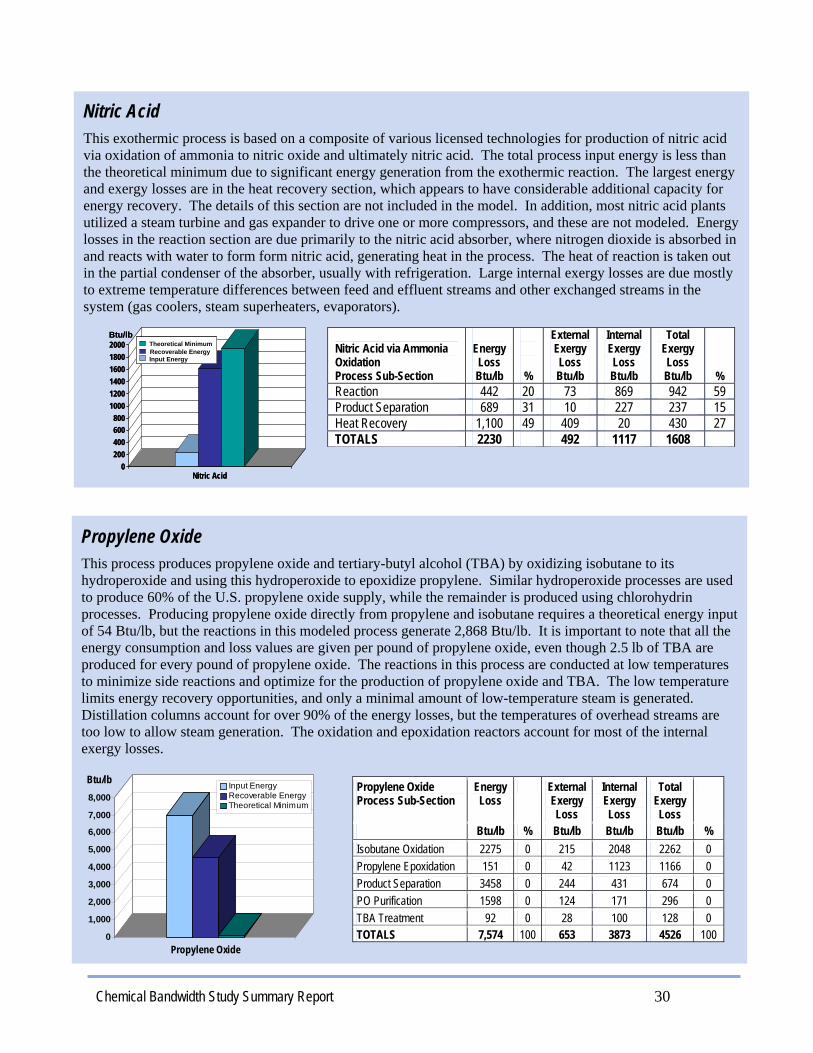
Chemical Bandwidth Study Summary Report 30
Propylene Oxide This process produces propylene oxide and tertiary-butyl alcohol (TBA) by oxidizing isobutane to its hydroperoxide and using this hydroperoxide to epoxidize propylene. Similar hydroperoxide processes are used to produce 60% of the U.S. propylene oxide supply, while the remainder is produced using chlorohydrin processes. Producing propylene oxide directly from propylene and isobutane requires a theoretical energy input of 54 Btu/lb, but the reactions in this modeled process generate 2,868 Btu/lb. It is important to note that all the energy consumption and loss values are given per pound of propylene oxide, even though 2.5 lb of TBA are produced for every pound of propylene oxide. The reactions in this process are conducted at low temperatures to minimize side reactions and optimize for the production of propylene oxide and TBA. The low temperature limits energy recovery opportunities, and only a minimal amount of low-temperature steam is generated. Distillation columns account for over 90% of the energy losses, but the temperatures of overhead streams are too low to allow steam generation. The oxidation and epoxidation reactors account for most of the internal exergy losses.
0
1,000
2,000
3,000
4,000
5,000
6,000
7,000
8,000
Btu/lb
Propylene Oxide
Input EnergyRecoverable EnergyTheoretical Minimum
Propylene Oxide Process Sub-Section
Energy Loss
External Exergy Loss
Internal Exergy Loss
Total Exergy Loss
Btu/lb % Btu/lb Btu/lb Btu/lb % Isobutane Oxidation 2275 0 215 2048 2262 0 Propylene Epoxidation 151 0 42 1123 1166 0 Product Separation 3458 0 244 431 674 0 PO Purification 1598 0 124 171 296 0 TBA Treatment 92 0 28 100 128 0 TOTALS 7,574 100 653 3873 4526 100
Nitric Acid This exothermic process is based on a composite of various licensed technologies for production of nitric acid via oxidation of ammonia to nitric oxide and ultimately nitric acid. The total process input energy is less than the theoretical minimum due to significant energy generation from the exothermic reaction. The largest energy and exergy losses are in the heat recovery section, which appears to have considerable additional capacity for energy recovery. The details of this section are not included in the model. In addition, most nitric acid plants utilized a steam turbine and gas expander to drive one or more compressors, and these are not modeled. Energy losses in the reaction section are due primarily to the nitric acid absorber, where nitrogen dioxide is absorbed in and reacts with water to form form nitric acid, generating heat in the process. The heat of reaction is taken out in the partial condenser of the absorber, usually with refrigeration. Large internal exergy losses are due mostly to extreme temperature differences between feed and effluent streams and other exchanged streams in the system (gas coolers, steam superheaters, evaporators).
Nitric Acid via Ammonia Oxidation Process Sub-Section
Energy Loss Btu/lb
%
External Exergy Loss Btu/lb
Internal Exergy Loss Btu/lb
Total Exergy Loss Btu/lb %
Reaction 442 20 73 869 942 59 Product Separation 689 31 10 227 237 15 Heat Recovery 1,100 49 409 20 430 27 TOTALS 2230 492 1117 1608
0200400600800
100012001400160018002000
Nitric Acid
Btu/lbTheoretical MinimumRecoverable EnergyInput Energy
0200400600800
100012001400160018002000
Nitric Acid
Btu/lbTheoretical MinimumRecoverable EnergyInput Energy
Theoretical MinimumRecoverable EnergyInput Energy
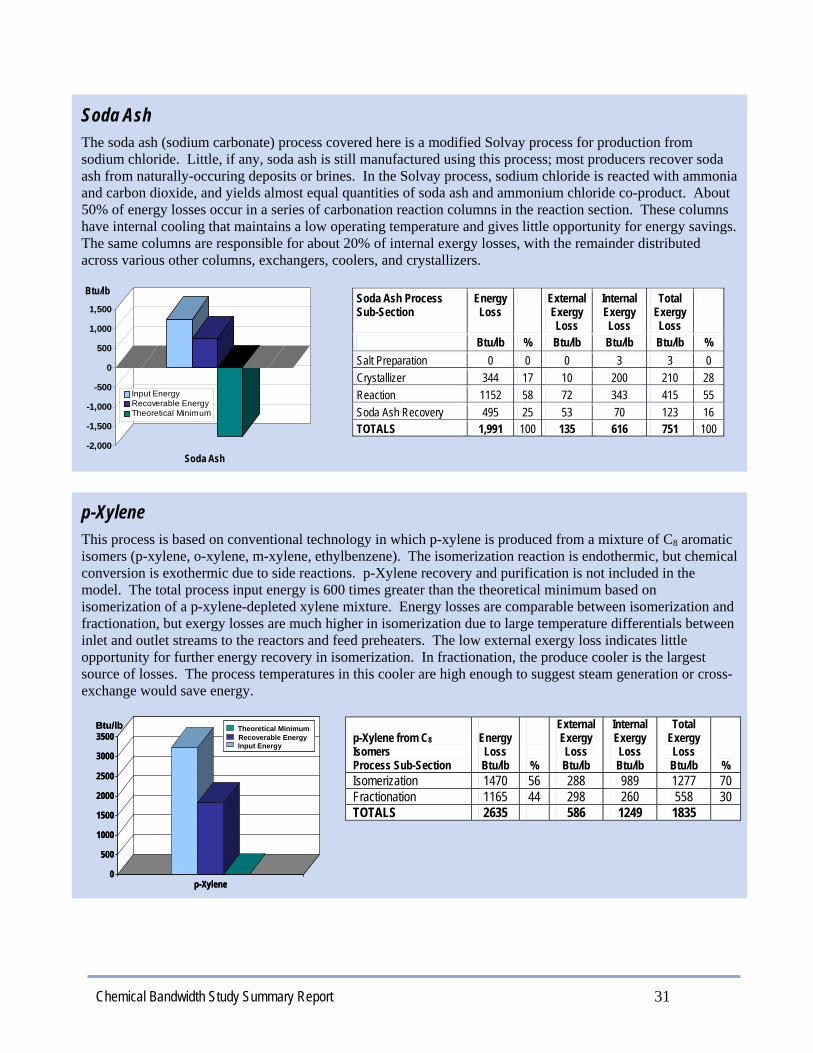
Chemical Bandwidth Study Summary Report 31
Soda Ash The soda ash (sodium carbonate) process covered here is a modified Solvay process for production from sodium chloride. Little, if any, soda ash is still manufactured using this process; most producers recover soda ash from naturally-occuring deposits or brines. In the Solvay process, sodium chloride is reacted with ammonia and carbon dioxide, and yields almost equal quantities of soda ash and ammonium chloride co-product. About 50% of energy losses occur in a series of carbonation reaction columns in the reaction section. These columns have internal cooling that maintains a low operating temperature and gives little opportunity for energy savings. The same columns are responsible for about 20% of internal exergy losses, with the remainder distributed across various other columns, exchangers, coolers, and crystallizers.
-2,000
-1,500
-1,000
-500
0
500
1,000
1,500
Btu/lb
Soda Ash
Input EnergyRecoverable EnergyTheoretical Minimum
Soda Ash Process Sub-Section
Energy Loss
External Exergy Loss
Internal Exergy Loss
Total Exergy Loss
Btu/lb % Btu/lb Btu/lb Btu/lb % Salt Preparation 0 0 0 3 3 0 Crystallizer 344 17 10 200 210 28 Reaction 1152 58 72 343 415 55 Soda Ash Recovery 495 25 53 70 123 16 TOTALS 1,991 100 135 616 751 100
p-Xylene This process is based on conventional technology in which p-xylene is produced from a mixture of C8 aromatic isomers (p-xylene, o-xylene, m-xylene, ethylbenzene). The isomerization reaction is endothermic, but chemical conversion is exothermic due to side reactions. p-Xylene recovery and purification is not included in the model. The total process input energy is 600 times greater than the theoretical minimum based on isomerization of a p-xylene-depleted xylene mixture. Energy losses are comparable between isomerization and fractionation, but exergy losses are much higher in isomerization due to large temperature differentials between inlet and outlet streams to the reactors and feed preheaters. The low external exergy loss indicates little opportunity for further energy recovery in isomerization. In fractionation, the produce cooler is the largest source of losses. The process temperatures in this cooler are high enough to suggest steam generation or cross-exchange would save energy.
p-Xylene from C8 Isomers Process Sub-Section
Energy Loss Btu/lb
%
External Exergy Loss Btu/lb
Internal Exergy Loss Btu/lb
Total Exergy Loss Btu/lb %
Isomerization 1470 56 288 989 1277 70 Fractionation 1165 44 298 260 558 30 TOTALS 2635 586 1249 1835
0
500
1000
1500
2000
2500
3000
3500
p-Xylene
Btu/lb Theoretical MinimumRecoverable EnergyInput Energy
0
500
1000
1500
2000
2500
3000
3500
p-Xylene
Btu/lb Theoretical MinimumRecoverable EnergyInput Energy
Theoretical MinimumRecoverable EnergyInput Energy

Chemical Bandwidth Study Summary Report 32
Styrene Lummus/Monsanto/UOP – This process is based on production of styrene via adiabatic dehydrogenation of ethylbenzene, an endothermic reaction. The total process energy input is about 13 times greater than the theoretical minimum energy requirement. The largest energy losses occur in air coolers, primarily due to inlet and outlet temperature differences. Generating low-pressure steam could reduce these losses, if an economic use for the steam could be identified. Large exergy losses are also found in the feed preheat section, where superheated steam is mixed with fresh and recycle ethylbenzene streams at lower temperatures. Other losses are associated with the steam superheater, stripper units, and fractionators; these are due primarily to large temperature differences leading to process irreversibilities. Fina/Badger – This endothermic process is very similar to the Lummus process, except for modest differences in the reactor section. The total process energy input is about 10 times greater than the theoretical minimum. The largest energy losses are found in air coolers used to condense and cool the reactor effluent, but the quality of this energy loss is relatively low. The feed preheat accounts for half of the exergy losses, due to large temperature differences in reactor effluent exchangers and in the dehydrogenation reactors. Losses also occur in the ethylbenzene/styrene stripper column, which must be operated under vacuum. The large condenser load for this column is removed with cooling water at a temperature too low for heat recovery. The Lummus process uses a higher steam/ethylbenzene ratio than the Fina/Badger technology, and requires higher energy input. However, the Lummus process recovers low-temperature heat from the ethylbenzene/styrene stripper and exergy losses are lower than those in the same Fina/Badger unit operation.
Styrene (Lummus/Monsanto/UOP) Process Sub-Section
Energy Loss Btu/lb
%
External Exergy Loss Btu/lb
Internal Exergy Loss Btu/lb
Total Exergy Loss Btu/lb %
Steam Compressor 17 0 17 11 28 2 Steam Super heater 0 0 0 193 193 14 Feed- Preheat/Reactor 0 0 0 371 371 27 Air Coolers 3597 84 408 142 550 39 Condensate Recovery 87 2 5 101 106 8 EB/Styrene Stripper 255 6 21 64 85 6 Styrene Fractionator 261 6 26 17 43 3 EB Stripper 63 1 0 15 16 1 Benzene/Toluene Stripper 7 0 1 1 1 0 TOTALS 4286 478 914 1392
Styrene (Fina/Badger) Process Sub-Section
Energy Loss Btu/lb
%
External Energy Loss Btu/lb
Internal Exergy Loss Btu/lb
Total Exergy Loss Btu/lb %
Steam Compressor 1 0 1 0 1 0 Steam Super heater 0 0 0 29 29 2 Feed- Preheat/Reactor 0 0 0 759 759 51 Air Coolers 2716 51 158 48 206 14 Condensate Recovery 125 2 13 77 90 6 EB/Styrene Stripper 1943 37 192 104 296 20 Styrene Fractionator 331 6 33 28 62 4 Benzene/ Toluene Stripper 177 3 13 36 49 3 TOTALS 5293 410 1081 1491
0500
100015002000250030003500400045005000
Styrene (Lummus)
Btu/lbTheoretical MinimumRecoverable EnergyInput Energy
0500
100015002000250030003500400045005000
Styrene (Lummus)
Btu/lbTheoretical MinimumRecoverable EnergyInput Energy
Theoretical MinimumRecoverable EnergyInput Energy
0
500
1000
1500
2000
2500
3000
3500
Styrene (Fina/Badger)
Btu/lbTheoretical MinimumRecoverable EnergyInput Energy
0
500
1000
1500
2000
2500
3000
3500
Styrene (Fina/Badger)
Btu/lbTheoretical MinimumRecoverable EnergyInput Energy
Theoretical MinimumRecoverable EnergyInput Energy
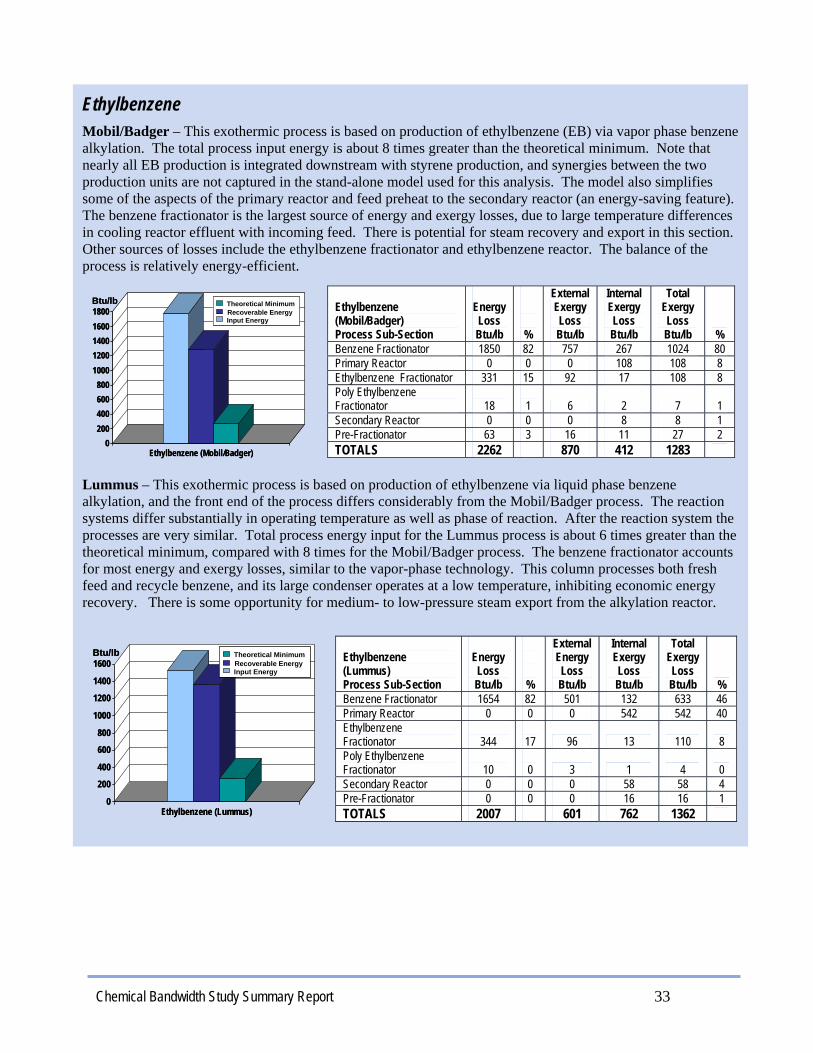
Chemical Bandwidth Study Summary Report 33
Ethylbenzene Mobil/Badger – This exothermic process is based on production of ethylbenzene (EB) via vapor phase benzene alkylation. The total process input energy is about 8 times greater than the theoretical minimum. Note that nearly all EB production is integrated downstream with styrene production, and synergies between the two production units are not captured in the stand-alone model used for this analysis. The model also simplifies some of the aspects of the primary reactor and feed preheat to the secondary reactor (an energy-saving feature). The benzene fractionator is the largest source of energy and exergy losses, due to large temperature differences in cooling reactor effluent with incoming feed. There is potential for steam recovery and export in this section. Other sources of losses include the ethylbenzene fractionator and ethylbenzene reactor. The balance of the process is relatively energy-efficient. Lummus – This exothermic process is based on production of ethylbenzene via liquid phase benzene alkylation, and the front end of the process differs considerably from the Mobil/Badger process. The reaction systems differ substantially in operating temperature as well as phase of reaction. After the reaction system the processes are very similar. Total process energy input for the Lummus process is about 6 times greater than the theoretical minimum, compared with 8 times for the Mobil/Badger process. The benzene fractionator accounts for most energy and exergy losses, similar to the vapor-phase technology. This column processes both fresh feed and recycle benzene, and its large condenser operates at a low temperature, inhibiting economic energy recovery. There is some opportunity for medium- to low-pressure steam export from the alkylation reactor.
Ethylbenzene (Mobil/Badger) Process Sub-Section
Energy Loss Btu/lb
%
External Exergy Loss Btu/lb
Internal Exergy Loss Btu/lb
Total Exergy Loss Btu/lb %
Benzene Fractionator 1850 82 757 267 1024 80 Primary Reactor 0 0 0 108 108 8 Ethylbenzene Fractionator 331 15 92 17 108 8 Poly Ethylbenzene Fractionator
18
1 6 2 7 1
Secondary Reactor 0 0 0 8 8 1 Pre-Fractionator 63 3 16 11 27 2 TOTALS 2262 870 412 1283
Ethylbenzene (Lummus) Process Sub-Section
Energy Loss Btu/lb
%
External Energy Loss Btu/lb
Internal Exergy Loss Btu/lb
Total Exergy Loss Btu/lb %
Benzene Fractionator 1654 82 501 132 633 46 Primary Reactor 0 0 0 542 542 40 Ethylbenzene Fractionator
344
17 96 13 110 8
Poly Ethylbenzene Fractionator
10
0 3 1 4 0
Secondary Reactor 0 0 0 58 58 4 Pre-Fractionator 0 0 0 16 16 1 TOTALS 2007 601 762 1362
0200400600800
10001200140016001800
Ethylbenzene (Mobil/Badger)
Btu/lb Theoretical MinimumRecoverable EnergyInput Energy
0200400600800
10001200140016001800
Ethylbenzene (Mobil/Badger)
Btu/lb Theoretical MinimumRecoverable EnergyInput Energy
Theoretical MinimumRecoverable EnergyInput Energy
0
200
400
600
800
1000
1200
1400
1600
Ethylbenzene (Lummus)
Btu/lb Theoretical MinimumRecoverable EnergyInput Energy
0
200
400
600
800
1000
1200
1400
1600
Ethylbenzene (Lummus)
Btu/lb Theoretical MinimumRecoverable EnergyInput Energy
Theoretical MinimumRecoverable EnergyInput Energy

Chemical Bandwidth Study Summary Report 34
Ethylene Glycol All U.S. producers of ethylene glycol use this thermal hydration process, with variations related to energy efficiency improvements. All U.S. plants are also co-located with ethylene oxide plants, which provide the feedstock and steam for ethylene glycol. This process produces about 10% higher glycols (primarily diethylene glycol) and uses a very high water-to-ethylene oxide feed ratio to minimize the production of these co-products. The hydration reaction is exothermic, but removing excess water from the ethylene glycol product requires much energy. Multiple-effect evaporation is used to reduce the energy requirement: three effects at successively lower pressures, each using the steam driven off from the previous effect as heat source. The final condenser for this evaporation scheme accounts for all the energy losses in the reaction section. The condensing water stream is at 222°F and could potentially be used for process heating. Some larger plants use additional lower-pressure effects, and some plants overseas use catalytic hydration to minimize production of higher glycols and reduce the excess water feed. Energy losses from the purification section are from purification columns, which are operated at low temperatures to protect the product quality. The low condenser temperatures do not allow for further energy savings.
-1000
0
1000
2000
3000
4000
5000
6000
Btu/lb
Ethylene Glycol
Input EnergyRecoverable EnergyTheoretical Minimum
Ethylene Glycol Process Sub-Section
Energy Loss
External Exergy Loss
Internal Exergy Loss
Total Exergy Loss
Btu/lb % Btu/lb Btu/lb Btu/lb % Reaction 2455 49 521 803 1324 62 Purification 2607 52 376 419 795 38 TOTALS 5062 100 897 1222 2119 100
Vinyl Chloride This endothermic process is based on the Hoechst et al. process for gas phase pyrolysis (dehydrochlorination) of ethylene dichloride (EDC). The total process input energy is about 19 times greater than the theoretical minimum energy required. The reaction is carried in the tubes of a fired furnace and the resulting effluent gases are at a higher temperature than input gases. The largest energy losses are in the quench section where reaction effluent is cooled from over 900oF to 120oF, a temperature too low for steam generation. EDC recovery also has high energy losses (source – four distillation columns). The low-pressure HCl column with a refrigerated condenser accounts for losses in the HCl recovery section.
Vinyl Chloride via Gas Phase Pyrolysis Process Sub-Section
Energy Loss Btu/lb
%
External Exergy Loss Btu/lb
Internal Exergy Loss Btu/lb
Total Exergy Loss Btu/lb %
Pre-Heater 0 0 0 143 143 17 Dehydrogenation Reaction
0
0 0 360 360 43
Quenching 867 42 69 15 84 10 HCl Recovery 281 14 44 24 68 8 VCM Recovery 203 10 10 30 40 5 EDC Recovery 721 35 102 31 133 16 TOTALS 2071 225 603 828
0
500
1000
1500
2000
2500
3000
Vinyl Chloride
Btu/lb Theoretical MinimumRecoverable EnergyInput Energy
0
500
1000
1500
2000
2500
3000
Vinyl Chloride
Btu/lb Theoretical MinimumRecoverable EnergyInput Energy
Theoretical MinimumRecoverable EnergyInput Energy
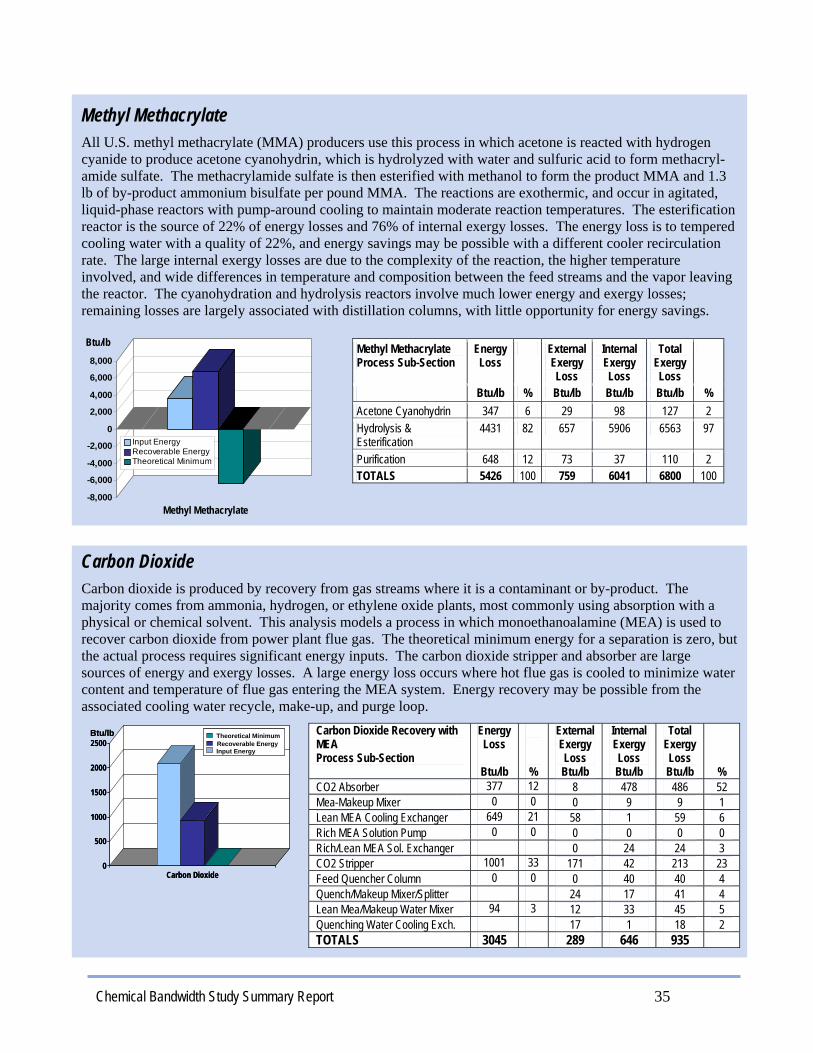
Chemical Bandwidth Study Summary Report 35
Methyl Methacrylate All U.S. methyl methacrylate (MMA) producers use this process in which acetone is reacted with hydrogen cyanide to produce acetone cyanohydrin, which is hydrolyzed with water and sulfuric acid to form methacryl-amide sulfate. The methacrylamide sulfate is then esterified with methanol to form the product MMA and 1.3 lb of by-product ammonium bisulfate per pound MMA. The reactions are exothermic, and occur in agitated, liquid-phase reactors with pump-around cooling to maintain moderate reaction temperatures. The esterification reactor is the source of 22% of energy losses and 76% of internal exergy losses. The energy loss is to tempered cooling water with a quality of 22%, and energy savings may be possible with a different cooler recirculation rate. The large internal exergy losses are due to the complexity of the reaction, the higher temperature involved, and wide differences in temperature and composition between the feed streams and the vapor leaving the reactor. The cyanohydration and hydrolysis reactors involve much lower energy and exergy losses; remaining losses are largely associated with distillation columns, with little opportunity for energy savings.
-8,000
-6,000
-4,000
-2,000
0
2,000
4,000
6,000
8,000
Btu/lb
Methyl Methacrylate
Input EnergyRecoverable EnergyTheoretical Minimum
Methyl Methacrylate Process Sub-Section
Energy Loss
External Exergy Loss
Internal Exergy Loss
Total Exergy Loss
Btu/lb % Btu/lb Btu/lb Btu/lb % Acetone Cyanohydrin 347 6 29 98 127 2 Hydrolysis & Esterification
4431 82 657 5906 6563 97
Purification 648 12 73 37 110 2 TOTALS 5426 100 759 6041 6800 100
Carbon Dioxide Carbon dioxide is produced by recovery from gas streams where it is a contaminant or by-product. The majority comes from ammonia, hydrogen, or ethylene oxide plants, most commonly using absorption with a physical or chemical solvent. This analysis models a process in which monoethanoalamine (MEA) is used to recover carbon dioxide from power plant flue gas. The theoretical minimum energy for a separation is zero, but the actual process requires significant energy inputs. The carbon dioxide stripper and absorber are large sources of energy and exergy losses. A large energy loss occurs where hot flue gas is cooled to minimize water content and temperature of flue gas entering the MEA system. Energy recovery may be possible from the associated cooling water recycle, make-up, and purge loop.
Carbon Dioxide Recovery with MEA Process Sub-Section
Energy Loss
Btu/lb
%
External Exergy Loss Btu/lb
Internal Exergy Loss Btu/lb
Total Exergy Loss Btu/lb %
CO2 Absorber 377 12 8 478 486 52 Mea-Makeup Mixer 0 0 0 9 9 1 Lean MEA Cooling Exchanger 649 21 58 1 59 6 Rich MEA Solution Pump 0 0 0 0 0 0 Rich/Lean MEA Sol. Exchanger 0 24 24 3 CO2 Stripper 1001 33 171 42 213 23 Feed Quencher Column 0 0 0 40 40 4 Quench/Makeup Mixer/Splitter 24 17 41 4 Lean Mea/Makeup Water Mixer 94 3 12 33 45 5 Quenching Water Cooling Exch. 17 1 18 2 TOTALS 3045 289 646 935
0
500
1000
1500
2000
2500
Carbon Dioxide
Btu/lb Theoretical MinimumRecoverable EnergyInput Energy
0
500
1000
1500
2000
2500
Carbon Dioxide
Btu/lb Theoretical MinimumRecoverable EnergyInput Energy
Theoretical MinimumRecoverable EnergyInput Energy

Chemical Bandwidth Study Summary Report 36
Nitrogen This version of the cryogenic distillation process is designed primarily for producing nitrogen, which does not require as low temperature or high pressure as oxygen. Cryogenic separation is typically used for producing high-purity nitrogen; low-purity nitrogen, or “inert gas,” is sometimes produced by consuming the oxygen content of an air stream and then removing the carbon dioxide produced. A substantial quantity of nitrogen is also produced by membrane separation and pressure swing adsorption (PSA). Like the process for oxygen, the cryogenic process modeled here is very efficient. The only energy input is electrical energy, used primarily to compress the air. Energy losses occur only in the compressor and expander units, while some internal exergy losses are associated with process heat exchangers in the nitrogen purification section.
0
20
40
60
80
100
120
140160
180Btu/lb
Nitrogen
Input EnergyRecoverable EnergyTheoretical Minimum
Nitrogen Process Sub-Section
Energy Loss
External Exergy Loss
Internal Exergy Loss
Total Exergy Loss
Btu/lb % Btu/lb Btu/lb Btu/lb % Compression/Expansion 170 100 6 61 67 66 Nitrogen Purification 0 0 0 35 35 34 TOTALS 170 100 6 96 102 100
Oxygen Most of the U.S. supply of oxygen and nitrogen are produced by cryogenic distillation of air. Typically both are produced together, with oxygen as the main desired product in some cases and nitrogen as the product in others. Argon is sometimes separated as a third, and most valuable, product. Some plants produce lower-quality oxygen by membrane separation. The cryogenic process modeled here yields ultra-high purity (99.998%) oxygen, and is representative of many U.S. air separation plants. Cryogenic air separation processes have been highly engineered for energy efficiency through better process integration and heat exchangers. All of the energy loss, and 72% of the exergy losses are associated with the air compressor that feeds the unit and an expansion turbine that expands and cools a portion of the air stream. All heating and cooling in the rest of the process is achieved with Joule-Thomson expansions through valves.
0
50
100
150
200
250Btu/lb
Oxygen
Input EnergyRecoverable EnergyTheoretical Minimum
Oxygen Process Sub-Section
Energy Loss
External Exergy Loss
Internal Exergy Loss
Total Exergy Loss
Btu/lb % Btu/lb Btu/lb Btu/lb % Compression/Expansion 216 100 14 83 96 72 Purification 0 0 0 37 37 28 TOTALS 216 100 14 120 133 100
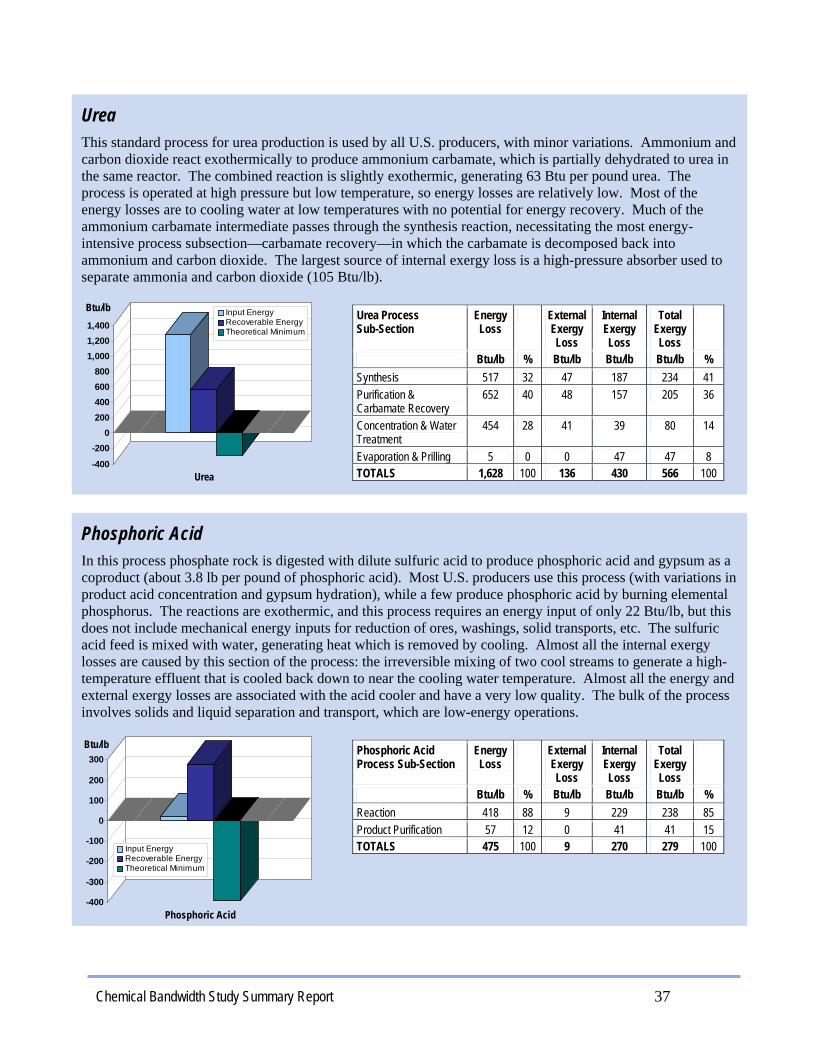
Chemical Bandwidth Study Summary Report 37
Phosphoric Acid In this process phosphate rock is digested with dilute sulfuric acid to produce phosphoric acid and gypsum as a coproduct (about 3.8 lb per pound of phosphoric acid). Most U.S. producers use this process (with variations in product acid concentration and gypsum hydration), while a few produce phosphoric acid by burning elemental phosphorus. The reactions are exothermic, and this process requires an energy input of only 22 Btu/lb, but this does not include mechanical energy inputs for reduction of ores, washings, solid transports, etc. The sulfuric acid feed is mixed with water, generating heat which is removed by cooling. Almost all the internal exergy losses are caused by this section of the process: the irreversible mixing of two cool streams to generate a high-temperature effluent that is cooled back down to near the cooling water temperature. Almost all the energy and external exergy losses are associated with the acid cooler and have a very low quality. The bulk of the process involves solids and liquid separation and transport, which are low-energy operations.
-400
-300
-200
-100
0
100
200
300Btu/lb
Phosphoric Acid
Input EnergyRecoverable EnergyTheoretical Minimum
Phosphoric Acid Process Sub-Section
Energy Loss
External Exergy Loss
Internal Exergy Loss
Total Exergy Loss
Btu/lb % Btu/lb Btu/lb Btu/lb % Reaction 418 88 9 229 238 85 Product Purification 57 12 0 41 41 15 TOTALS 475 100 9 270 279 100
Urea This standard process for urea production is used by all U.S. producers, with minor variations. Ammonium and carbon dioxide react exothermically to produce ammonium carbamate, which is partially dehydrated to urea in the same reactor. The combined reaction is slightly exothermic, generating 63 Btu per pound urea. The process is operated at high pressure but low temperature, so energy losses are relatively low. Most of the energy losses are to cooling water at low temperatures with no potential for energy recovery. Much of the ammonium carbamate intermediate passes through the synthesis reaction, necessitating the most energy-intensive process subsection—carbamate recovery—in which the carbamate is decomposed back into ammonium and carbon dioxide. The largest source of internal exergy loss is a high-pressure absorber used to separate ammonia and carbon dioxide (105 Btu/lb).
-400
-2000
200400600800
1,0001,2001,400
Btu/lb
Urea
Input EnergyRecoverable EnergyTheoretical Minimum
Urea Process Sub-Section
Energy Loss
External Exergy Loss
Internal Exergy Loss
Total Exergy Loss
Btu/lb % Btu/lb Btu/lb Btu/lb % Synthesis 517 32 47 187 234 41 Purification & Carbamate Recovery
652 40 48 157 205 36
Concentration & Water Treatment
454 28 41 39 80 14
Evaporation & Prilling 5 0 0 47 47 8 TOTALS 1,628 100 136 430 566 100

Chemical Bandwidth Study Summary Report 38
Ammonium Nitrate The reaction of nitric acid and ammonia to produce ammonium nitrate is exothermic and requires an energy input of only 171 Btu/lb. But ammonium nitrate is one of the largest volume inorganic chemicals, so the total annual energy use and losses are still significant. The process modeled here produces high-density ammonium nitrate prills and is typical of processes used in almost all U.S. plants. Most of the energy and exergy losses are in the neutralization (reaction) and concentration sections, with the main loop reactor as the largest consumer of both energy and exergy. The other energy losses are losses from relatively low temperature streams to cooling water, with little opportunity for energy recovery.
-600
-400
-200
0
200
400
600Btu/lb
Ammonium Nitrate
Input EnergyRecoverable EnergyTheoretical Minimum
Ammonium Nitrate Process Sub-Section
Energy Loss
External Exergy Loss
Internal Exergy Loss
Total Exergy Loss
Btu/lb % Btu/lb Btu/lb Btu/lb % Neutralization 472 65 117 300 417 80 Concentration 255 35 36 36 71 14 Prilling 0 0 0 29 29 6 Finishing 3 0 0 3 3 1 TOTALS 730 100 153 368 520 100
Vinyl Acetate (VAM) The vapor phase acetoxylation of ethylene process modeled is a generic one representative of U.S. production. This process includes combustion of ethylene as a side reaction to the main conversion reaction of ethylene with acetic acid and oxygen. These reactions are exothermic and the relatively high temperature and pressure of the reaction leads to significant irreversibilities.
The acetoxylation reactor unit is responsible for the major irreversibilities, and accounts for 53% of exergy losses and 27% of energy losses. The reactor energy losses have a moderately high quality of 30% and are associated with low pressure steam that is generated to maintain the reactor at 302°F but is not used elsewhere in the process. The other significant external exergy loss is from the reactor effluent cooler. This accounts for an energy loss equal to that of the reactor, but at lower quality, with less opportunity for recovery.
-1,500-1,000
-5000
5001,0001,5002,0002,5003,000
Btu/lb
Vinyl Acetate
Input EnergyRecoverable EnergyTheoretical Minimum
Vinyl Acetate Process Sub-Section
Energy Loss
External Exergy Loss
Internal Exergy Loss
Total Exergy Loss
Btu/lb % Btu/lb Btu/lb Btu/lb % Reaction Section 2656 59 610 1008 1618 78 Vapor Recovery 418 9 88 51 140 7 VAM Recovery 1462 32 218 109 327 16 TOTALS 4536 100 916 1168 2085 100
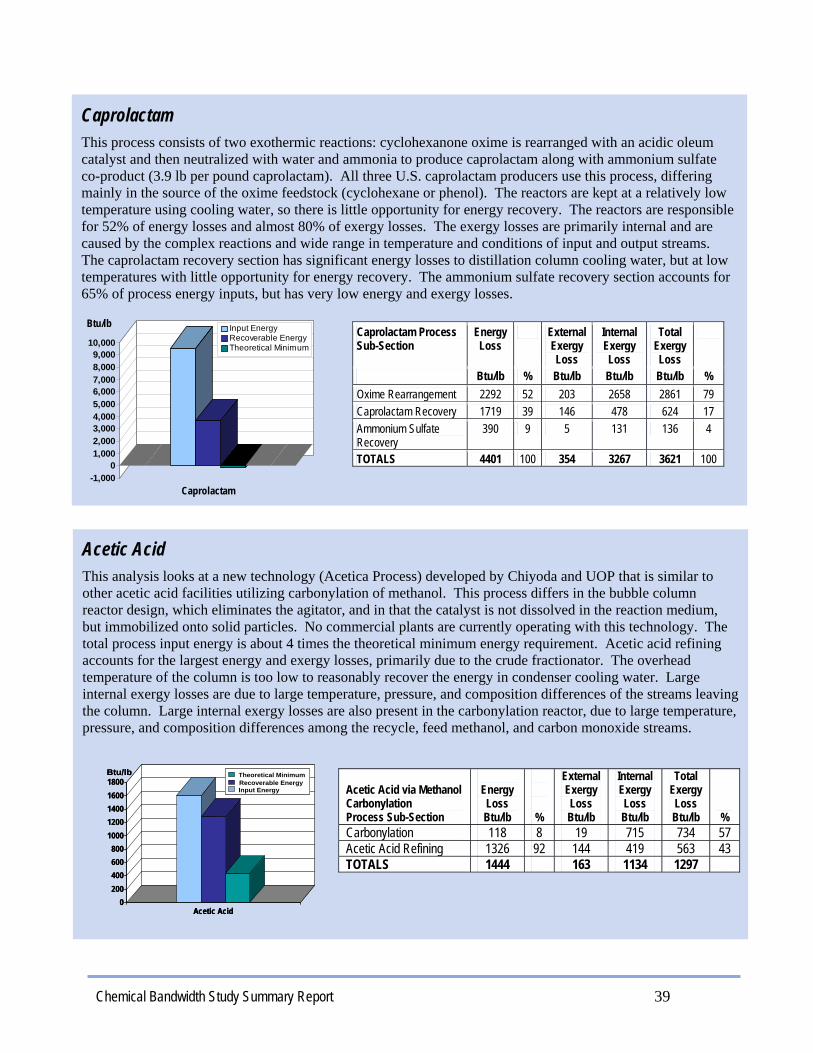
Chemical Bandwidth Study Summary Report 39
Caprolactam This process consists of two exothermic reactions: cyclohexanone oxime is rearranged with an acidic oleum catalyst and then neutralized with water and ammonia to produce caprolactam along with ammonium sulfate co-product (3.9 lb per pound caprolactam). All three U.S. caprolactam producers use this process, differing mainly in the source of the oxime feedstock (cyclohexane or phenol). The reactors are kept at a relatively low temperature using cooling water, so there is little opportunity for energy recovery. The reactors are responsible for 52% of energy losses and almost 80% of exergy losses. The exergy losses are primarily internal and are caused by the complex reactions and wide range in temperature and conditions of input and output streams. The caprolactam recovery section has significant energy losses to distillation column cooling water, but at low temperatures with little opportunity for energy recovery. The ammonium sulfate recovery section accounts for 65% of process energy inputs, but has very low energy and exergy losses.
-1,0000
1,0002,0003,0004,0005,0006,0007,0008,0009,000
10,000
Btu/lb
Caprolactam
Input EnergyRecoverable EnergyTheoretical Minimum
Caprolactam Process Sub-Section
Energy Loss
External Exergy Loss
Internal Exergy Loss
Total Exergy Loss
Btu/lb % Btu/lb Btu/lb Btu/lb % Oxime Rearrangement 2292 52 203 2658 2861 79 Caprolactam Recovery 1719 39 146 478 624 17 Ammonium Sulfate Recovery
390 9 5 131 136 4
TOTALS 4401 100 354 3267 3621 100
Acetic Acid This analysis looks at a new technology (Acetica Process) developed by Chiyoda and UOP that is similar to other acetic acid facilities utilizing carbonylation of methanol. This process differs in the bubble column reactor design, which eliminates the agitator, and in that the catalyst is not dissolved in the reaction medium, but immobilized onto solid particles. No commercial plants are currently operating with this technology. The total process input energy is about 4 times the theoretical minimum energy requirement. Acetic acid refining accounts for the largest energy and exergy losses, primarily due to the crude fractionator. The overhead temperature of the column is too low to reasonably recover the energy in condenser cooling water. Large internal exergy losses are due to large temperature, pressure, and composition differences of the streams leaving the column. Large internal exergy losses are also present in the carbonylation reactor, due to large temperature, pressure, and composition differences among the recycle, feed methanol, and carbon monoxide streams.
Acetic Acid via Methanol Carbonylation Process Sub-Section
Energy Loss Btu/lb
%
External Exergy Loss Btu/lb
Internal Exergy Loss Btu/lb
Total Exergy Loss Btu/lb %
Carbonylation 118 8 19 715 734 57 Acetic Acid Refining 1326 92 144 419 563 43 TOTALS 1444 163 1134 1297
0200400600800
10001200140016001800
Acetic Acid
Btu/lb Theoretical MinimumRecoverable EnergyInput Energy
0200400600800
10001200140016001800
Acetic Acid
Btu/lb Theoretical MinimumRecoverable EnergyInput Energy
Theoretical MinimumRecoverable EnergyInput Energy
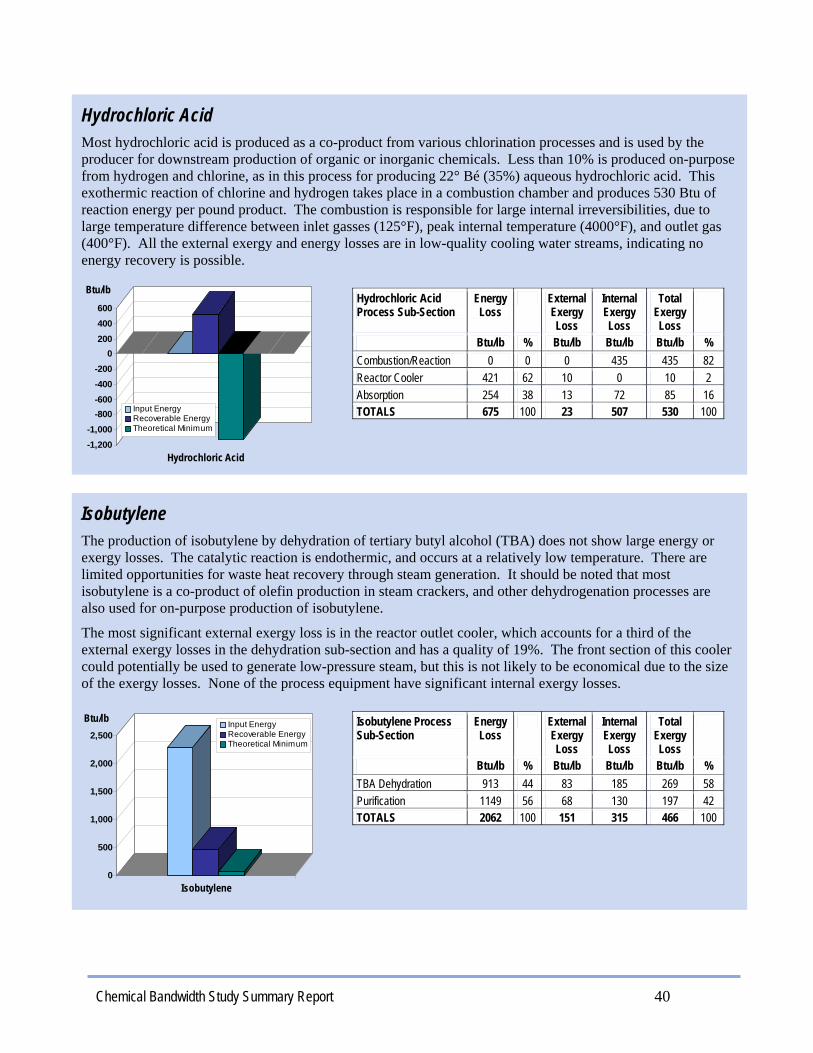
Chemical Bandwidth Study Summary Report 40
Isobutylene The production of isobutylene by dehydration of tertiary butyl alcohol (TBA) does not show large energy or exergy losses. The catalytic reaction is endothermic, and occurs at a relatively low temperature. There are limited opportunities for waste heat recovery through steam generation. It should be noted that most isobutylene is a co-product of olefin production in steam crackers, and other dehydrogenation processes are also used for on-purpose production of isobutylene.
The most significant external exergy loss is in the reactor outlet cooler, which accounts for a third of the external exergy losses in the dehydration sub-section and has a quality of 19%. The front section of this cooler could potentially be used to generate low-pressure steam, but this is not likely to be economical due to the size of the exergy losses. None of the process equipment have significant internal exergy losses.
0
500
1,000
1,500
2,000
2,500
Btu/lb
Isobutylene
Input EnergyRecoverable EnergyTheoretical Minimum
Isobutylene Process Sub-Section
Energy Loss
External Exergy Loss
Internal Exergy Loss
Total Exergy Loss
Btu/lb % Btu/lb Btu/lb Btu/lb % TBA Dehydration 913 44 83 185 269 58 Purification 1149 56 68 130 197 42 TOTALS 2062 100 151 315 466 100
Hydrochloric Acid Most hydrochloric acid is produced as a co-product from various chlorination processes and is used by the producer for downstream production of organic or inorganic chemicals. Less than 10% is produced on-purpose from hydrogen and chlorine, as in this process for producing 22° Bé (35%) aqueous hydrochloric acid. This exothermic reaction of chlorine and hydrogen takes place in a combustion chamber and produces 530 Btu of reaction energy per pound product. The combustion is responsible for large internal irreversibilities, due to large temperature difference between inlet gasses (125°F), peak internal temperature (4000°F), and outlet gas (400°F). All the external exergy and energy losses are in low-quality cooling water streams, indicating no energy recovery is possible.
-1,200-1,000
-800-600-400-200
0200400600
Btu/lb
Hydrochloric Acid
Input EnergyRecoverable EnergyTheoretical Minimum
Hydrochloric Acid Process Sub-Section
Energy Loss
External Exergy Loss
Internal Exergy Loss
Total Exergy Loss
Btu/lb % Btu/lb Btu/lb Btu/lb % Combustion/Reaction 0 0 0 435 435 82 Reactor Cooler 421 62 10 0 10 2 Absorption 254 38 13 72 85 16 TOTALS 675 100 23 507 530 100

Chemical Bandwidth Study Summary Report 41
Cumene Solid Phosphoric Acid (SPA) Catalyzed – This exothermic process is based cumene via propylene alkylation of benzene with an SPA catalyst (UOP design). The total process energy input is about 1.5 times greater than the theoretical minimum. The largest energy losses occur in air coolers, primarily due to their low temperatures. Virtually all energy and exergy losses occur in the cumene recovery section, primarily due to three distillation columns. Additional energy recovery is possible from the cumene fractionator, but may not be economical. There may be opportunity for feed preheat in the alkylation section. Zeolite Catalyzed – The advantage of the zeolite process is that it is non-corrosive and enables operation at lower benzene/propylene ratios, resulting in lower energy and external exergy losses. Recovery of spent catalyst is also easier than the other two processes studied. Fouling of the zeolites, however, could lead to higher catalyst costs. Total process energy input is about 2 times the theoretical minimum. Cumene recovery is again the greatest source of energy and exergy losses, due to several distillation columns, most of which operate at condenser temperatures too low to generate low pressure steam. The cumene column is a candidate for steam generation, with an overhead temperature over 300oF. AlCl3 Catalyzed – This process is very similar to the zeolite process discussed above, except that the spent catalyst is not as easy to recover. There are additional minor energy and exergy losses in the catalyst recovery section, which is not required for the zeolite technology.
Cumene via Propylene Alkylation of Benzene (SPA-catalyzed) Process Sub-Section
Energy Loss Btu/lb
%
External Exergy Loss Btu/lb
Internal Exergy Loss Btu/lb
Total Exergy Loss Btu/lb %
Alkylation 0 0 0 156 156 27 Cumene Recovery 1170 100 192 225 416 71 TOTALS 1172 192 382 573
Cumene via Propylene Alkylation of Benzene (Zeolite-catalyzed) Process Sub-Section
Energy Loss Btu/lb
%
External Energy Loss Btu/lb
Internal Exergy Loss Btu/lb
Total Exergy Loss Btu/lb %
Alkylation 231 17 64 187 250 40 Cumene Recovery 1154 83 240 133 373 60 TOTALS 1385 304 319 623
0
200
400
600
800
1000
1200
Cumene (Zeolite catalyst)
Btu/lb Theoretical MinimumRecoverable EnergyInput Energy
0
200
400
600
800
1000
1200
Cumene (Zeolite catalyst)
Btu/lb Theoretical MinimumRecoverable EnergyInput Energy
Theoretical MinimumRecoverable EnergyInput Energy
0100200300400500600700800900
Cumene (SPA catalyst)
Btu/lb Theoretical MinimumRecoverable EnergyInput Energy
0100200300400500600700800900
Cumene (SPA catalyst)
Btu/lb Theoretical MinimumRecoverable EnergyInput Energy
Theoretical MinimumRecoverable EnergyInput Energy
Cumene via Propylene Alkylation of Benzene (AlCl3-catalyzed) Process Sub-Section
Energy Loss Btu/lb
%
External Exergy Loss Btu/lb
Internal Exergy Loss Btu/lb
Total Exergy Loss Btu/lb %
Alkylation 424 28 68 203 271 40 Catalyst Recovery 3 0 0 1 2 0 Cumene Recovery 1104 72 268 139 407 60 TOTALS 1531 337 343 680
0
200
400
600
800
1000
1200
Cumene (AlCl3 catalyst)
Btu/lb Theoretical MinimumRecoverable EnergyInput Energy
0
200
400
600
800
1000
1200
Cumene (AlCl3 catalyst)
Btu/lb Theoretical MinimumRecoverable EnergyInput Energy
Theoretical MinimumRecoverable EnergyInput Energy

Chemical Bandwidth Study Summary Report 42
Nitrobenzene All five U.S. nitrobenzene plants use processes essentially the same as this liquid-phase nitration of benzene process. Concentrated sulfuric acid catalyst is mixed with the nitric acid reactant, and it is recovered in the last stage of the process. The nitration reactor is responsible for a third of the total energy losses, and almost half of the total exergy losses. The reactor operates at 140°F, a temperature too low for steam generation. There is only one unit that may allow low pressure steam generation. A cooler that accounts for two thirds of the energy loss in the purification section could perhaps be split in two parts, one generating steam and the other using cooling water. The main internal exergy losses are in the nitration reactor, which uses the reactor system to preheat feeds and cool effluents. This is economically attractive, but causes irreversibilities.
0
200
400
600
800
1,000
1,200
Btu/lb
Nitrobenzene
Input EnergyRecoverable EnergyTheoretical Minimum
Nitrobenzene Process Sub-Section
Energy Loss
External Exergy Loss
Internal Exergy Loss
Total Exergy Loss
Btu/lb % Btu/lb Btu/lb Btu/lb % Nitration 549 39 44 444 489 53 Purification 401 28 50 51 100 11 Sulfuric Acid Recovery 462 33 70 262 333 36 TOTALS 1412 100 164 757 922 100
Aniline About 95% of U.S. Aniline is produced by the vapor-phase reduction of nitrobenzene, an exothermic process. The reaction energy is used to generate 1.6 lb of 250-psi steam per pound of aniline, such that the process is a net exporter of energy. It could be designed to be energy self-sufficient, though using this generated steam in the process would involve conversion inefficiencies and other losses. Because of the steam generation, the process energy losses are relatively small and of low quality. The largest energy loss is from a cooler that partially condenses vapor exiting the reactor. This unit is the third in a series of coolers, after two exchangers that heat other process streams. Due to the preheating, streams entering and leaving the main fluidized bed reactor are at widely differing conditions, leading to internal exergy losses of 1,512 Btu/lb in the reactor.
-2500
-2000-1500-1000-500
0500
100015002000
Btu/lb
Aniline
Input EnergyRecoverable EnergyTheoretical Minimum
Aniline Process Sub-Section
Energy Loss
External Exergy Loss
Internal Exergy Loss
Total Exergy Loss
Btu/lb % Btu/lb Btu/lb Btu/lb % Reaction 888 72 158 1653 1811 94 Purification 354 29 40 67 106 6 TOTALS 1242 100 198 1720 1917 100
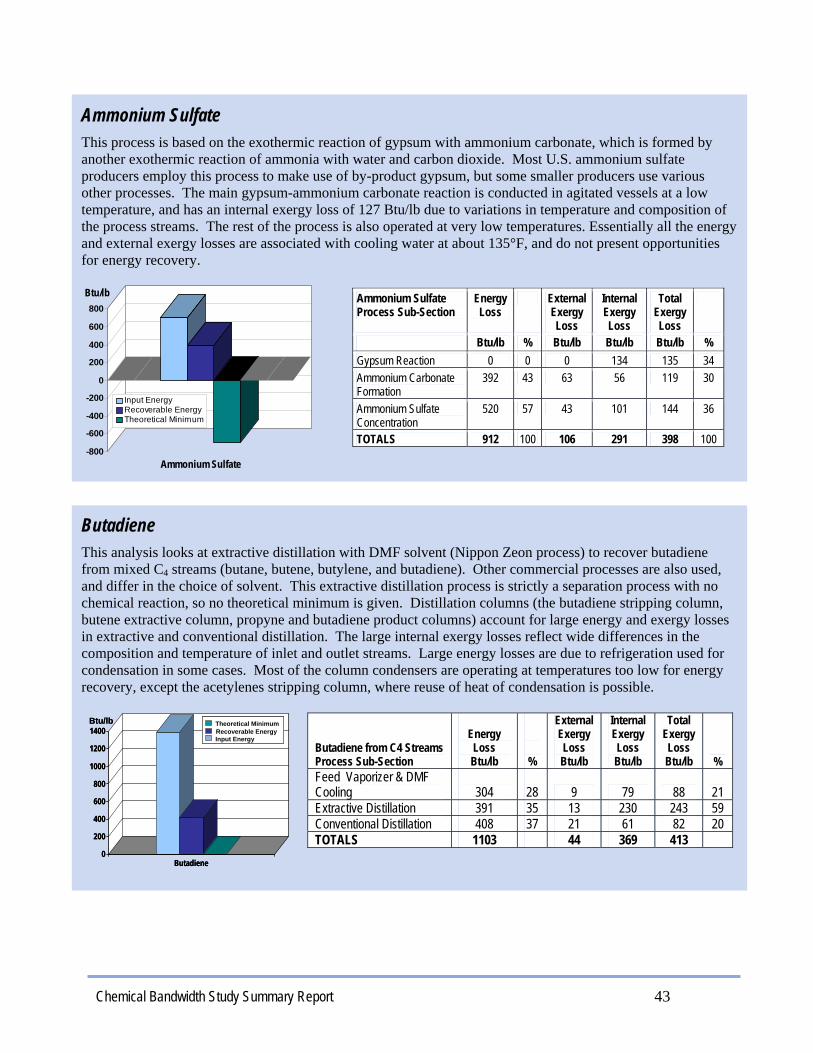
Chemical Bandwidth Study Summary Report 43
Ammonium Sulfate This process is based on the exothermic reaction of gypsum with ammonium carbonate, which is formed by another exothermic reaction of ammonia with water and carbon dioxide. Most U.S. ammonium sulfate producers employ this process to make use of by-product gypsum, but some smaller producers use various other processes. The main gypsum-ammonium carbonate reaction is conducted in agitated vessels at a low temperature, and has an internal exergy loss of 127 Btu/lb due to variations in temperature and composition of the process streams. The rest of the process is also operated at very low temperatures. Essentially all the energy and external exergy losses are associated with cooling water at about 135°F, and do not present opportunities for energy recovery.
-800
-600
-400
-200
0
200
400
600
800Btu/lb
Ammonium Sulfate
Input EnergyRecoverable EnergyTheoretical Minimum
Ammonium Sulfate Process Sub-Section
Energy Loss
External Exergy Loss
Internal Exergy Loss
Total Exergy Loss
Btu/lb % Btu/lb Btu/lb Btu/lb % Gypsum Reaction 0 0 0 134 135 34 Ammonium Carbonate Formation
392 43 63 56 119 30
Ammonium Sulfate Concentration
520 57 43 101 144 36
TOTALS 912 100 106 291 398 100
Butadiene This analysis looks at extractive distillation with DMF solvent (Nippon Zeon process) to recover butadiene from mixed C4 streams (butane, butene, butylene, and butadiene). Other commercial processes are also used, and differ in the choice of solvent. This extractive distillation process is strictly a separation process with no chemical reaction, so no theoretical minimum is given. Distillation columns (the butadiene stripping column, butene extractive column, propyne and butadiene product columns) account for large energy and exergy losses in extractive and conventional distillation. The large internal exergy losses reflect wide differences in the composition and temperature of inlet and outlet streams. Large energy losses are due to refrigeration used for condensation in some cases. Most of the column condensers are operating at temperatures too low for energy recovery, except the acetylenes stripping column, where reuse of heat of condensation is possible.
Butadiene from C4 Streams Process Sub-Section
Energy Loss Btu/lb
%
External Exergy Loss Btu/lb
Internal Exergy Loss Btu/lb
Total Exergy Loss Btu/lb %
Feed Vaporizer & DMF Cooling
304
28 9 79 88 21
Extractive Distillation 391 35 13 230 243 59 Conventional Distillation 408 37 21 61 82 20 TOTALS 1103 44 369 413
0
200
400
600
800
1000
1200
1400
Butadiene
Btu/lb Theoretical MinimumRecoverable EnergyInput Energy
0
200
400
600
800
1000
1200
1400
Butadiene
Btu/lb Theoretical MinimumRecoverable EnergyInput Energy
Theoretical MinimumRecoverable EnergyInput Energy

Chemical Bandwidth Study Summary Report 44
Cyclohexane Almost all cyclohexane is produced by hydrogenation of benzene. This hydrogenation reaction is exothermic, and the process requires only a relatively small energy input for pumps, compressors, and reboilers. Cyclohexane also has one of the lowest production volumes of the chemicals studied in this report, so has a low total energy saving potential. This vapor-phase hydrogenation process may be more energy intensive than newer liquid-phase processes, but it is very selective and has little promise for energy savings by improvement of the catalyst or process. Some additional steam recovery is the main opportunity for energy savings.
The two reactor units in the reaction section account for the bulk of energy and exergy losses. The main hydrogenation reactor is cooled by generating very low pressure steam, but with no obvious place for the steam to be used. If a less active catalyst were used with a higher process temperature the reaction could generate higher-pressure steam, which may be easier to use.
-600
-400
-200
0
200
400
600
800Btu/lb
Cyclohexane
Input EnergyRecoverable EnergyTheoretical Minimum
Cyclohexane Process Sub-Section
Energy Loss
External Exergy Loss
Internal Exergy Loss
Total Exergy Loss
Btu/lb % Btu/lb Btu/lb Btu/lb % Reaction Section 1317 89 294 455 749 94 Product Purification 171 11 33 11 44 6 TOTALS 1488 100 327 466 793 100
Bisphenol A This process is for the production of 99.55% purity bisphenol A by the liquid-phase reaction of acetone and phenol, catalyzed by hydrochloric acid. All producers in the United States use this process, with minor variations related to product purification. The reaction is exothermic, but occurs at a low temperature (about 120°F) so internal exergy losses related to the reaction are low. The main internal energy losses are rather in distillation columns with large temperature differences and a burner used for hydrochloric acid recovery. Most of the energy losses are in distillation columns, most of which have low condensing temperatures. There may be some opportunity for heat integration, but energy losses are mainly to cooling water and of low quality.
-500
0
500
1,000
1,500
2,000
2,500
Btu/lb
Bisphenol A
Input EnergyRecoverable EnergyTheoretical Minimum
Bisphenol A Process Sub-Section
Energy Loss
External Exergy Loss
Internal Exergy Loss
Total Exergy Loss
Btu/lb % Btu/lb Btu/lb Btu/lb % Synthesis 1287 56 174 228 402 43 HCl Recovery 437 19 34 333 367 39 Finishing 593 26 127 42 169 18 TOTALS 2317 100 335 603 938 100

Chemical Bandwidth Study Summary Report 45
Methyl Chloride All U.S. manufacturers of methyl chloride use the exothermic methanol and hydrochloric acid process, and usually produce other chloromethane co-products (methylene chloride, chloroform, and carbon tetrachloride). U.S. Methyl chloride production constitutes relatively small total energy use and losses, but these numbers do not include material produced as a precursor for other chloromethanes or silicones. Over 50% of the energy and internal exergy losses occur in the integrated reactor (reaction section) and rectifying column (purification section) unit. The HCl stripper column (purification section) has energy losses of 271 Btu/lb at a moderate 20% quality. Otherwise energy losses are of low quality, so potential for energy recovery is low without modifications to the process.
-300-200-100
0100200300400500600700800
Btu/lb
Methyl Chloride
Input EnergyRecoverable EnergyTheoretical Minimum
Methyl Chloride Process Sub-Section
Energy Loss
External Exergy Loss
Internal Exergy Loss
Total Exergy Loss
Btu/lb % Btu/lb Btu/lb Btu/lb % Reaction 0 0 0 283 283 40 Purification 1282 100 139 281 420 60 TOTALS 1282 100 139 564 703 100
Isopropyl Alcohol This process is the hydration of propylene to produce equal amounts of premium-grade and lower-purity isopropyl alcohol (IPA). This process uses a cation exchange resin catalyst; most U.S. plants use sulfuric acid as catalyst, an older variation of the process that probably involves higher energy consumption. The hydration reaction is exothermic, but the process uses a considerable amount of energy for purification columns. Almost 90% of the energy losses are from three condenser units in the purification section. These condensers operate at temperatures too low for steam generation and with small temperature differences between condensate and coolant, indicating there is little opportunity for further energy savings.
-5000
50010001500
20002500
300035004000
Btu/lb
Isopropyl Alcohol
Input EnergyRecoverable EnergyTheoretical Minimum
Isopropyl Alcohol Process Sub-Section
Energy Loss
External Exergy Loss
Internal Exergy Loss
Total Exergy Loss
Btu/lb % Btu/lb Btu/lb Btu/lb % Reaction 274 6 29 186 215 23 Purification 3954 94 399 318 717 77 TOTALS 4228 100 428 504 932 100
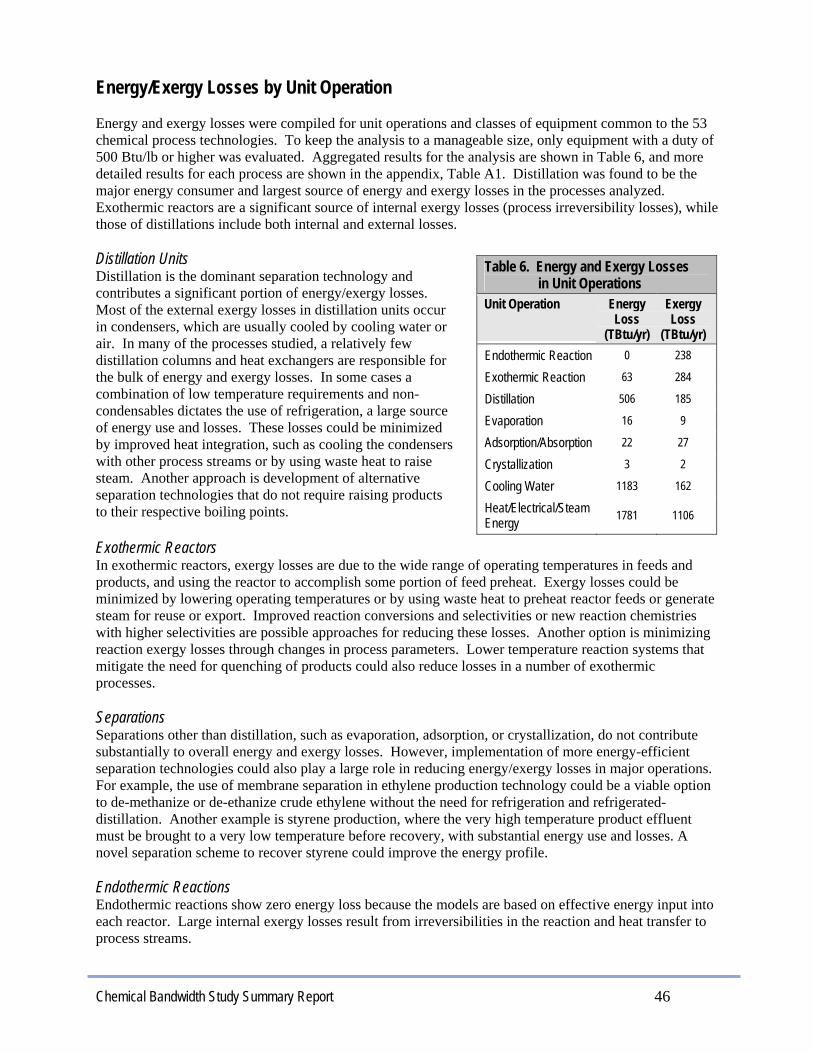
Chemical Bandwidth Study Summary Report 46
Energy/Exergy Losses by Unit Operation Energy and exergy losses were compiled for unit operations and classes of equipment common to the 53 chemical process technologies. To keep the analysis to a manageable size, only equipment with a duty of 500 Btu/lb or higher was evaluated. Aggregated results for the analysis are shown in Table 6, and more detailed results for each process are shown in the appendix, Table A1. Distillation was found to be the major energy consumer and largest source of energy and exergy losses in the processes analyzed. Exothermic reactors are a significant source of internal exergy losses (process irreversibility losses), while those of distillations include both internal and external losses. Distillation Units Distillation is the dominant separation technology and contributes a significant portion of energy/exergy losses. Most of the external exergy losses in distillation units occur in condensers, which are usually cooled by cooling water or air. In many of the processes studied, a relatively few distillation columns and heat exchangers are responsible for the bulk of energy and exergy losses. In some cases a combination of low temperature requirements and non-condensables dictates the use of refrigeration, a large source of energy use and losses. These losses could be minimized by improved heat integration, such as cooling the condensers with other process streams or by using waste heat to raise steam. Another approach is development of alternative separation technologies that do not require raising products to their respective boiling points. Exothermic Reactors In exothermic reactors, exergy losses are due to the wide range of operating temperatures in feeds and products, and using the reactor to accomplish some portion of feed preheat. Exergy losses could be minimized by lowering operating temperatures or by using waste heat to preheat reactor feeds or generate steam for reuse or export. Improved reaction conversions and selectivities or new reaction chemistries with higher selectivities are possible approaches for reducing these losses. Another option is minimizing reaction exergy losses through changes in process parameters. Lower temperature reaction systems that mitigate the need for quenching of products could also reduce losses in a number of exothermic processes. Separations Separations other than distillation, such as evaporation, adsorption, or crystallization, do not contribute substantially to overall energy and exergy losses. However, implementation of more energy-efficient separation technologies could also play a large role in reducing energy/exergy losses in major operations. For example, the use of membrane separation in ethylene production technology could be a viable option to de-methanize or de-ethanize crude ethylene without the need for refrigeration and refrigerated-distillation. Another example is styrene production, where the very high temperature product effluent must be brought to a very low temperature before recovery, with substantial energy use and losses. A novel separation scheme to recover styrene could improve the energy profile. Endothermic Reactions Endothermic reactions show zero energy loss because the models are based on effective energy input into each reactor. Large internal exergy losses result from irreversibilities in the reaction and heat transfer to process streams.
Table 6. Energy and Exergy Losses in Unit Operations Unit Operation Energy
Loss (TBtu/yr)
Exergy Loss
(TBtu/yr) Endothermic Reaction 0 238
Exothermic Reaction 63 284
Distillation 506 185
Evaporation 16 9
Adsorption/Absorption 22 27
Crystallization 3 2
Cooling Water 1183 162
Heat/Electrical/Steam Energy 1781 1106

Chemical Bandwidth Study Summary Report 47
Grouping specific equipment types provides a perspective on where energy losses are greatest. As Table 7 illustrates, energy losses are concentrated in heat exchangers and distillation columns (strippers, fractionators). Condensers, air and product coolers, and heat and refrigeration recovery units account for a large share of heat exchanger losses. The column losses shown in Table 7 are also due primarily to heat exchange losses in condensers, which are not always modeled as separate units. In all processes heat exchange accounts for the overwhelming majority of energy and exergy losses.
Table 8 provides details on the eleven unit operations with annual energy losses over 20 trillion Btu for individual chemical processes. Energy quality indicates the potential for energy recovery. As stated earlier, an energy quality of 15%-20% is moderate and indicates some potential for economical energy recovery. For quality over 20%, the potential for economic energy recovery becomes much greater. Most of the units listed in Table 8 are equipment for distillation and other separations processes. The MTBE distillation column has low overhead temperatures and high losses to cooling water. The Ammonia syn gas separator is also a separations unit, removing carbon dioxide from the product stream. Acrylonitrile separations require refrigeration and quenching, both large sources of energy and exergy losses, and there are significant opportunities for energy recovery (energy quality of 36%). The ethylene oxide condenser consumes 11,621 Btu/lb, and has by far the highest energy intensity on a per-pound-product basis. This condenser separates the product and water from non-condensables in an overhead stream, with no opportunity for steam recovery. The high energy consumption is also due to the very low per pass conversion of ethylene needed to maintain selectivity, which necessitates scrubbing with water and results in a very dilute overhead stream that makes product recovery difficult. These results fortify the conclusion that separation processes not requiring distillation could be developed to greatly improve energy efficiency. Alternatively, fundamental process changes could mitigate the need for difficult separations. In some cases better heat integration (e.g., pinch analysis) can be applied to reduce exergy losses. However, this is limited to pure heat exchanger networks involving pure heat load analysis, and cannot be used, for example, to improve a system with heat pumps. In such cases pinch and exergy analysis could be combined to better evaluate targets for improvement.
Table 8. Highest Energy-Consuming Equipment, Ranked by Energy Loss Technology Item Name Energy Loss
(TBtu/yr) External Exergy Loss (TBtu/yr)
Quality (%)
MTBE MTBE column 110.4 17.3 16% Ethylene Oxide Condenser for stripping column 92.9 14.0 15% Ammonia Syn gas separator 61.9 14.6 24% Ethylene (from naphtha) Air cooler 37.6 4.0 11% Hydrogen Reformer gases cooler 28.4 7.7 27% Methanol (ICI, LP) No. 3 methanol column 25.2 3.3 13% Acrylonitrile (from propylene) Heat & refrig. recovery 23.3 8.4 36% Ethylene (from naphtha) Demethanizer column 22.3 7.9 35% Hydrogen Stack 20.9 2.1 10% Formaldehyde Reactor 20.5 4.4 21% Hydrogen Carbonate stripper column 20.2 2.1 10%
Table 7. Energy and External Exergy Loss for Equipment with External Exergy Loss > 1 TBtu/yr
Type of Equipment Number Energy Loss
(TBtu/yr)
External Exergy Loss
(TBtu/yr) Heat Exchangers 48 1174.7 196.1 Distillation Columns 21 447.5 99.4 Reactors 8 69.0 22.7 Furnace & Stack units 4 37.6 6.3 Vessels & Drums 3 41.0 5.0 Compressors 3 14.3 5.0 Other equipment 5 104.4 32.5
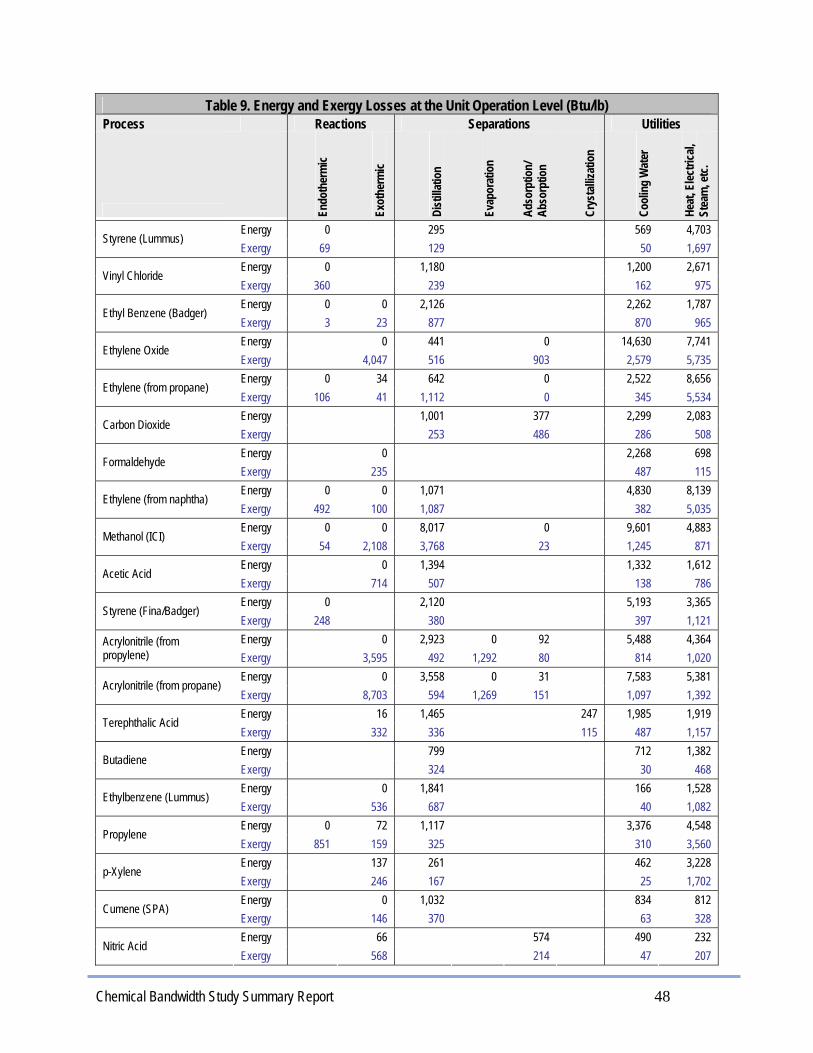
Chemical Bandwidth Study Summary Report 48
Table 9. Energy and Exergy Losses at the Unit Operation Level (Btu/lb)
Process Reactions Separations Utilities
Endo
ther
mic
Exot
herm
ic
Dist
illatio
n
Evap
orat
ion
Adso
rptio
n/
Abso
rptio
n
Crys
talliz
atio
n
Cool
ing
Wat
er
Heat
, Elec
trica
l, St
eam
, etc
.
Energy 0 295 569 4,703 Styrene (Lummus)
Exergy 69 129 50 1,697 Energy 0 1,180 1,200 2,671
Vinyl Chloride Exergy 360 239 162 975 Energy 0 0 2,126 2,262 1,787
Ethyl Benzene (Badger) Exergy 3 23 877 870 965 Energy 0 441 0 14,630 7,741
Ethylene Oxide Exergy 4,047 516 903 2,579 5,735 Energy 0 34 642 0 2,522 8,656
Ethylene (from propane) Exergy 106 41 1,112 0 345 5,534 Energy 1,001 377 2,299 2,083
Carbon Dioxide Exergy 253 486 286 508 Energy 0 2,268 698
Formaldehyde Exergy 235 487 115 Energy 0 0 1,071 4,830 8,139
Ethylene (from naphtha) Exergy 492 100 1,087 382 5,035 Energy 0 0 8,017 0 9,601 4,883
Methanol (ICI) Exergy 54 2,108 3,768 23 1,245 871 Energy 0 1,394 1,332 1,612
Acetic Acid Exergy 714 507 138 786 Energy 0 2,120 5,193 3,365
Styrene (Fina/Badger) Exergy 248 380 397 1,121 Energy 0 2,923 0 92 5,488 4,364 Acrylonitrile (from
propylene) Exergy 3,595 492 1,292 80 814 1,020 Energy 0 3,558 0 31 7,583 5,381
Acrylonitrile (from propane) Exergy 8,703 594 1,269 151 1,097 1,392 Energy 16 1,465 247 1,985 1,919
Terephthalic Acid Exergy 332 336 115 487 1,157 Energy 799 712 1,382
Butadiene Exergy 324 30 468 Energy 0 1,841 166 1,528
Ethylbenzene (Lummus) Exergy 536 687 40 1,082 Energy 0 72 1,117 3,376 4,548
Propylene Exergy 851 159 325 310 3,560 Energy 137 261 462 3,228
p-Xylene Exergy 246 167 25 1,702 Energy 0 1,032 834 812
Cumene (SPA) Exergy 146 370 63 328 Energy 66 574 490 232
Nitric Acid Exergy 568 214 47 207
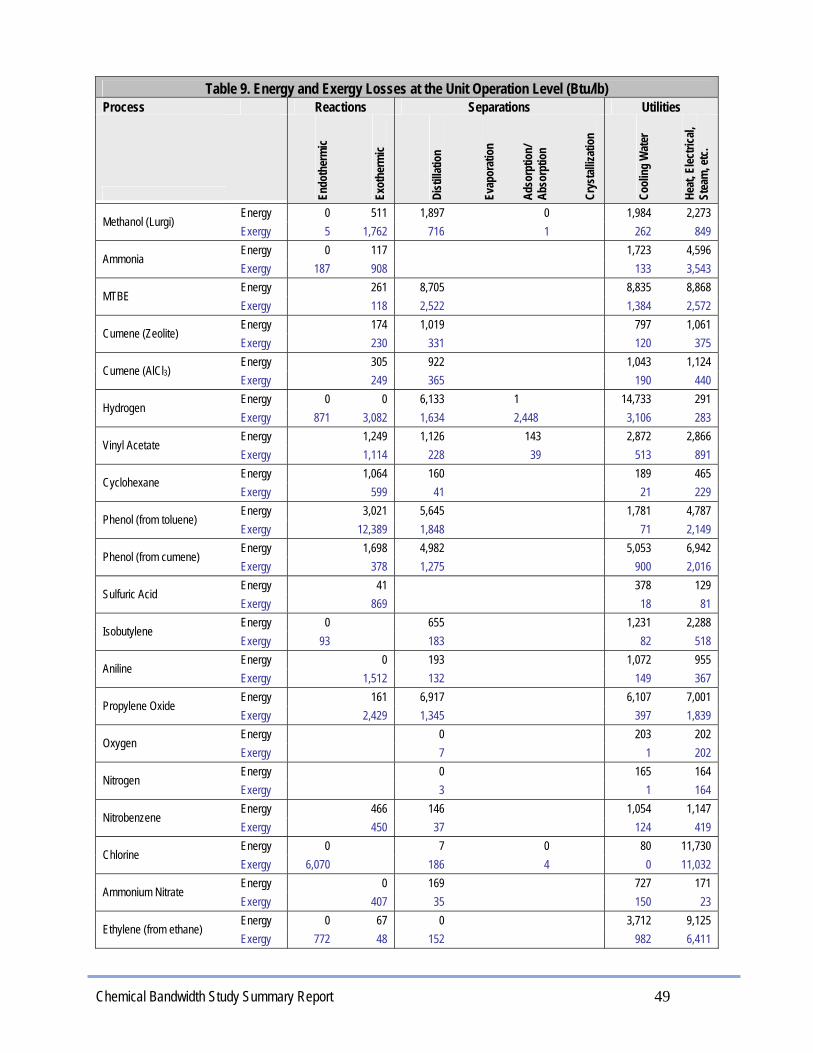
Chemical Bandwidth Study Summary Report 49
Table 9. Energy and Exergy Losses at the Unit Operation Level (Btu/lb) Process Reactions Separations Utilities
Endo
ther
mic
Exot
herm
ic
Dist
illatio
n
Evap
orat
ion
Adso
rptio
n/
Abso
rptio
n
Crys
talliz
atio
n
Cool
ing
Wat
er
Heat
, Elec
trica
l, St
eam
, etc
.
Energy 0 511 1,897 0 1,984 2,273 Methanol (Lurgi)
Exergy 5 1,762 716 1 262 849 Energy 0 117 1,723 4,596
Ammonia Exergy 187 908 133 3,543 Energy 261 8,705 8,835 8,868
MTBE Exergy 118 2,522 1,384 2,572 Energy 174 1,019 797 1,061
Cumene (Zeolite) Exergy 230 331 120 375 Energy 305 922 1,043 1,124
Cumene (AlCl3) Exergy 249 365 190 440 Energy 0 0 6,133 1 14,733 291
Hydrogen Exergy 871 3,082 1,634 2,448 3,106 283 Energy 1,249 1,126 143 2,872 2,866
Vinyl Acetate Exergy 1,114 228 39 513 891 Energy 1,064 160 189 465
Cyclohexane Exergy 599 41 21 229 Energy 3,021 5,645 1,781 4,787
Phenol (from toluene) Exergy 12,389 1,848 71 2,149 Energy 1,698 4,982 5,053 6,942
Phenol (from cumene) Exergy 378 1,275 900 2,016 Energy 41 378 129
Sulfuric Acid Exergy 869 18 81 Energy 0 655 1,231 2,288
Isobutylene Exergy 93 183 82 518 Energy 0 193 1,072 955
Aniline Exergy 1,512 132 149 367 Energy 161 6,917 6,107 7,001
Propylene Oxide Exergy 2,429 1,345 397 1,839 Energy 0 203 202
Oxygen Exergy 7 1 202 Energy 0 165 164
Nitrogen Exergy 3 1 164 Energy 466 146 1,054 1,147
Nitrobenzene Exergy 450 37 124 419 Energy 0 7 0 80 11,730
Chlorine Exergy 6,070 186 4 0 11,032 Energy 0 169 727 171
Ammonium Nitrate Exergy 407 35 150 23 Energy 0 67 0 3,712 9,125
Ethylene (from ethane) Exergy 772 48 152 982 6,411

Chemical Bandwidth Study Summary Report 50
Table 9. Energy and Exergy Losses at the Unit Operation Level (Btu/lb) Process Reactions Separations Utilities
Endo
ther
mic
Exot
herm
ic
Dist
illatio
n
Evap
orat
ion
Adso
rptio
n/
Abso
rptio
n
Crys
talliz
atio
n
Cool
ing
Wat
er
Heat
, Elec
trica
l, St
eam
, etc
.
Energy 0 435 675 0 Hydrochloric Acid
Exergy 435 85 23 0 Energy 0 1,008 0 844 398
Methyl Chloride Exergy 237 342 17 73 249 Energy 0 583 806 701
Ethylene Dichloride Exergy 630 127 69 168 Energy 154 1,415 0 405 57 1,773 2,131
bisPhenol A Exergy 4 405 5 112 3 291 649 Energy 1,844 3,105 4,935 3,599
Methyl Methacrylate Exergy 5,949 557 690 7,42 Energy 0 782 1,000 2 1,450 1,250
Soda Ash Exergy 41 171 285 35 113 425 Energy 0 3,954 2,765 3,880
Isopropyl Alcohol Exergy 3 692 274 808 Energy 0 431 189 1,614 1,276
Urea Exergy 40 168 35 137 503 Energy 0 2,570 2,455 5,025 5,853
Ethylene Glycol Exergy 368 774 769 979 1,977 Energy 2,389 2,187 0 4,576 9,521
Caprolactam Exergy 1,175 729 6 377 2,304 Energy 417 22
Phosphoric Acid Exergy 9 10 Energy 0 19 5 913 709
Ammonium Sulfate Exergy 127 5 50 147 249 Energy 0 0 0
Carbon Black Exergy 4,889 0 0 Energy 0 14,629 86,231 2,455 2,103 311 147,334 165,257
TOTALS Exergy 10,222 62,125 27,287 3,335 2,111 209 21,640 76,003
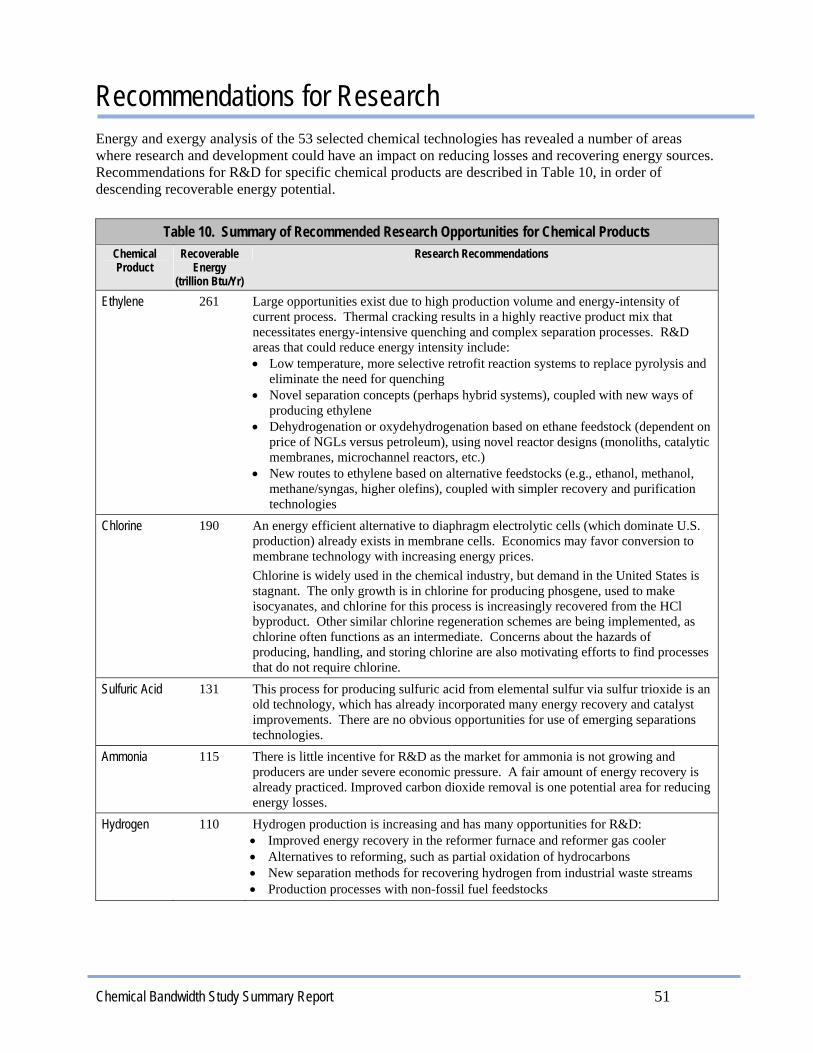
Chemical Bandwidth Study Summary Report 51
Energy and exergy analysis of the 53 selected chemical technologies has revealed a number of areas where research and development could have an impact on reducing losses and recovering energy sources. Recommendations for R&D for specific chemical products are described in Table 10, in order of descending recoverable energy potential.
Table 10. Summary of Recommended Research Opportunities for Chemical Products Chemical Product
Recoverable Energy
(trillion Btu/Yr)
Research Recommendations
Ethylene 261 Large opportunities exist due to high production volume and energy-intensity of current process. Thermal cracking results in a highly reactive product mix that necessitates energy-intensive quenching and complex separation processes. R&D areas that could reduce energy intensity include: • Low temperature, more selective retrofit reaction systems to replace pyrolysis and
eliminate the need for quenching • Novel separation concepts (perhaps hybrid systems), coupled with new ways of
producing ethylene • Dehydrogenation or oxydehydrogenation based on ethane feedstock (dependent on
price of NGLs versus petroleum), using novel reactor designs (monoliths, catalytic membranes, microchannel reactors, etc.)
• New routes to ethylene based on alternative feedstocks (e.g., ethanol, methanol, methane/syngas, higher olefins), coupled with simpler recovery and purification technologies
Chlorine 190 An energy efficient alternative to diaphragm electrolytic cells (which dominate U.S. production) already exists in membrane cells. Economics may favor conversion to membrane technology with increasing energy prices. Chlorine is widely used in the chemical industry, but demand in the United States is stagnant. The only growth is in chlorine for producing phosgene, used to make isocyanates, and chlorine for this process is increasingly recovered from the HCl byproduct. Other similar chlorine regeneration schemes are being implemented, as chlorine often functions as an intermediate. Concerns about the hazards of producing, handling, and storing chlorine are also motivating efforts to find processes that do not require chlorine.
Sulfuric Acid 131 This process for producing sulfuric acid from elemental sulfur via sulfur trioxide is an old technology, which has already incorporated many energy recovery and catalyst improvements. There are no obvious opportunities for use of emerging separations technologies.
Ammonia 115 There is little incentive for R&D as the market for ammonia is not growing and producers are under severe economic pressure. A fair amount of energy recovery is already practiced. Improved carbon dioxide removal is one potential area for reducing energy losses.
Hydrogen 110 Hydrogen production is increasing and has many opportunities for R&D: • Improved energy recovery in the reformer furnace and reformer gas cooler • Alternatives to reforming, such as partial oxidation of hydrocarbons • New separation methods for recovering hydrogen from industrial waste streams • Production processes with non-fossil fuel feedstocks
Recommendations for Research
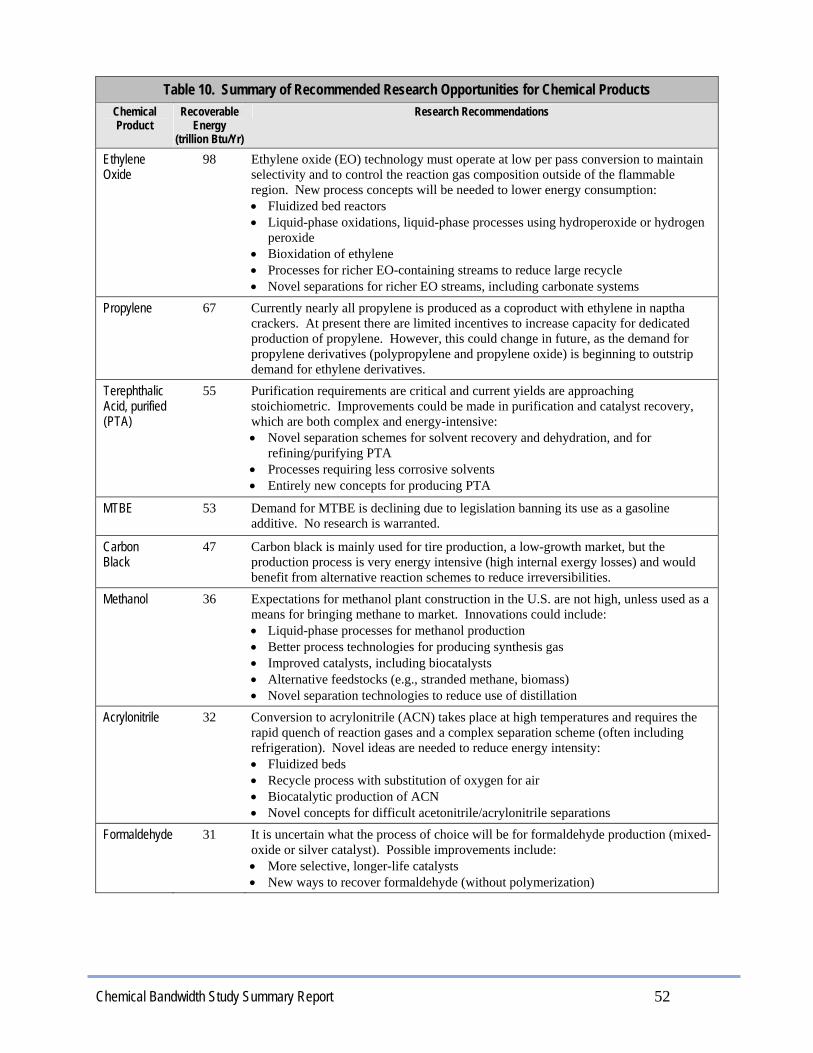
Chemical Bandwidth Study Summary Report 52
Table 10. Summary of Recommended Research Opportunities for Chemical Products Chemical Product
Recoverable Energy
(trillion Btu/Yr)
Research Recommendations
Ethylene Oxide
98 Ethylene oxide (EO) technology must operate at low per pass conversion to maintain selectivity and to control the reaction gas composition outside of the flammable region. New process concepts will be needed to lower energy consumption: • Fluidized bed reactors • Liquid-phase oxidations, liquid-phase processes using hydroperoxide or hydrogen
peroxide • Bioxidation of ethylene • Processes for richer EO-containing streams to reduce large recycle • Novel separations for richer EO streams, including carbonate systems
Propylene 67 Currently nearly all propylene is produced as a coproduct with ethylene in naptha crackers. At present there are limited incentives to increase capacity for dedicated production of propylene. However, this could change in future, as the demand for propylene derivatives (polypropylene and propylene oxide) is beginning to outstrip demand for ethylene derivatives.
Terephthalic Acid, purified (PTA)
55 Purification requirements are critical and current yields are approaching stoichiometric. Improvements could be made in purification and catalyst recovery, which are both complex and energy-intensive: • Novel separation schemes for solvent recovery and dehydration, and for
refining/purifying PTA • Processes requiring less corrosive solvents • Entirely new concepts for producing PTA
MTBE 53 Demand for MTBE is declining due to legislation banning its use as a gasoline additive. No research is warranted.
Carbon Black
47 Carbon black is mainly used for tire production, a low-growth market, but the production process is very energy intensive (high internal exergy losses) and would benefit from alternative reaction schemes to reduce irreversibilities.
Methanol 36 Expectations for methanol plant construction in the U.S. are not high, unless used as a means for bringing methane to market. Innovations could include: • Liquid-phase processes for methanol production • Better process technologies for producing synthesis gas • Improved catalysts, including biocatalysts • Alternative feedstocks (e.g., stranded methane, biomass) • Novel separation technologies to reduce use of distillation
Acrylonitrile 32 Conversion to acrylonitrile (ACN) takes place at high temperatures and requires the rapid quench of reaction gases and a complex separation scheme (often including refrigeration). Novel ideas are needed to reduce energy intensity: • Fluidized beds • Recycle process with substitution of oxygen for air • Biocatalytic production of ACN • Novel concepts for difficult acetonitrile/acrylonitrile separations
Formaldehyde 31 It is uncertain what the process of choice will be for formaldehyde production (mixed-oxide or silver catalyst). Possible improvements include: • More selective, longer-life catalysts • New ways to recover formaldehyde (without polymerization)
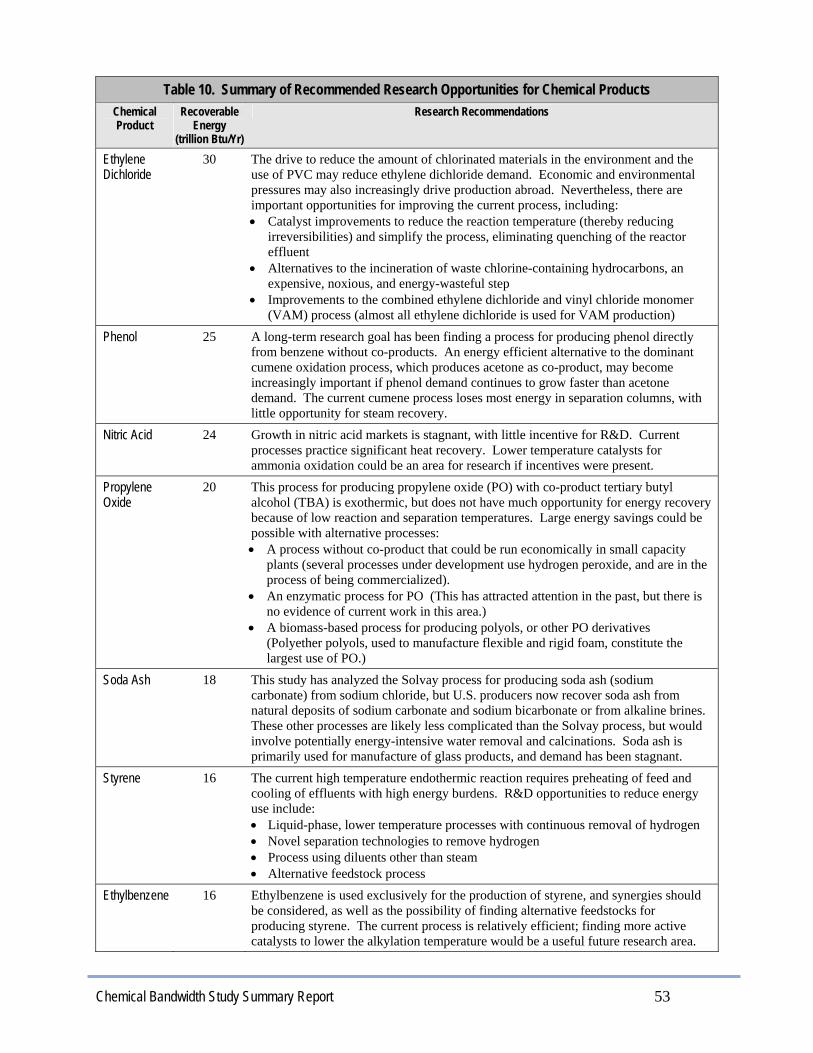
Chemical Bandwidth Study Summary Report 53
Table 10. Summary of Recommended Research Opportunities for Chemical Products Chemical Product
Recoverable Energy
(trillion Btu/Yr)
Research Recommendations
Ethylene Dichloride
30 The drive to reduce the amount of chlorinated materials in the environment and the use of PVC may reduce ethylene dichloride demand. Economic and environmental pressures may also increasingly drive production abroad. Nevertheless, there are important opportunities for improving the current process, including: • Catalyst improvements to reduce the reaction temperature (thereby reducing
irreversibilities) and simplify the process, eliminating quenching of the reactor effluent
• Alternatives to the incineration of waste chlorine-containing hydrocarbons, an expensive, noxious, and energy-wasteful step
• Improvements to the combined ethylene dichloride and vinyl chloride monomer (VAM) process (almost all ethylene dichloride is used for VAM production)
Phenol 25 A long-term research goal has been finding a process for producing phenol directly from benzene without co-products. An energy efficient alternative to the dominant cumene oxidation process, which produces acetone as co-product, may become increasingly important if phenol demand continues to grow faster than acetone demand. The current cumene process loses most energy in separation columns, with little opportunity for steam recovery.
Nitric Acid 24 Growth in nitric acid markets is stagnant, with little incentive for R&D. Current processes practice significant heat recovery. Lower temperature catalysts for ammonia oxidation could be an area for research if incentives were present.
Propylene Oxide
20 This process for producing propylene oxide (PO) with co-product tertiary butyl alcohol (TBA) is exothermic, but does not have much opportunity for energy recovery because of low reaction and separation temperatures. Large energy savings could be possible with alternative processes: • A process without co-product that could be run economically in small capacity
plants (several processes under development use hydrogen peroxide, and are in the process of being commercialized).
• An enzymatic process for PO (This has attracted attention in the past, but there is no evidence of current work in this area.)
• A biomass-based process for producing polyols, or other PO derivatives (Polyether polyols, used to manufacture flexible and rigid foam, constitute the largest use of PO.)
Soda Ash 18 This study has analyzed the Solvay process for producing soda ash (sodium carbonate) from sodium chloride, but U.S. producers now recover soda ash from natural deposits of sodium carbonate and sodium bicarbonate or from alkaline brines. These other processes are likely less complicated than the Solvay process, but would involve potentially energy-intensive water removal and calcinations. Soda ash is primarily used for manufacture of glass products, and demand has been stagnant.
Styrene 16 The current high temperature endothermic reaction requires preheating of feed and cooling of effluents with high energy burdens. R&D opportunities to reduce energy use include: • Liquid-phase, lower temperature processes with continuous removal of hydrogen • Novel separation technologies to remove hydrogen • Process using diluents other than steam • Alternative feedstock process
Ethylbenzene 16 Ethylbenzene is used exclusively for the production of styrene, and synergies should be considered, as well as the possibility of finding alternative feedstocks for producing styrene. The current process is relatively efficient; finding more active catalysts to lower the alkylation temperature would be a useful future research area.

Chemical Bandwidth Study Summary Report 54
Table 10. Summary of Recommended Research Opportunities for Chemical Products Chemical Product
Recoverable Energy
(trillion Btu/Yr)
Research Recommendations
p-Xylene 15 Considerable energy recovery is already practiced. New opportunities include: • New separation technologies, such as removing p-xylene during isomerization • Coupling the p-xylene process with the downstream terephthalic acid process to
achieve reductions in energy use (e.g., unique catalyst for oxidation)
Carbon Dioxide
15 Solvents for recovering carbon dioxide are limited and expensive, and can poison recycle gases. Possible areas for research include: • Better solvents, especially adducts that could loosely and reversibly bind with CO2 • Novel separations or hybrid separations with membranes, PSA, etc.
Vinyl Chloride
14 This process vaporizes ethylene dichloride (EDC), cracks it at high temperatures, and then quenches the reaction gas (to minimize coking). In addition to these energy-intensive operations, many distillation systems are needed to separate the HCl co-product and purify vinyl chloride and EDC. Concepts to reduce reaction temperature and energy for separations include: • Cracking additives • Low-temperature catalysts • Alternative feedstocks (e.g., catalytic dehydrogenation of ethyl chloride) • Novel separation systems to reduce distillation
Ethylene Glycol
14 Ethylene glycol is primarily used for anti-freeze, polyester fibers, and polyester bottles. The last application is a growing rapidly, but ethylene glycol is easily shipped and U.S. producers face strong competition from producers in low energy-cost areas, such as the Middle East. Research opportunities include: • Use of non-thermal separations to remove water from the ethylene glycol—
perhaps a membrane or hybrid system • Use of renewable biomass feedstocks or biocatalysis (Enzymes may be able to
convert ethylene oxide to ethylene glycol at high selectivity and low temperature.)
Methyl Methacrylate (MMA)
12 Energy savings may be possible in the esterification reactor of this acetone cyanohydrin process. Other processes beginning with isobutylene or tert-butyl alcohol are used internationally, but have not been considered in this study.
Oxygen 7.9 Cryogenic distillation has been highly engineered for efficiency, and is well suited to large-scale production of high purity oxygen and nitrogen. Potential research opportunities include: • Membrane separation: Membrane systems have tended to produce low-purity
product, and are limited to low volume applications. New materials that achieve higher purity would be of great interest to low-volume users who are not connected to supply pipelines.
• Pressure swing adsorption (PSA): PSA has received more attention and success than membranes, and is a newer technology with potential for development (such as improved adsorbents).
• Hybrid systems: Increased energy savings may be possible by blending a combination of cryogenic, membrane, and PSA technologies.
Nitrogen 7.1 Research opportunities for nitrogen are the same as for oxygen.
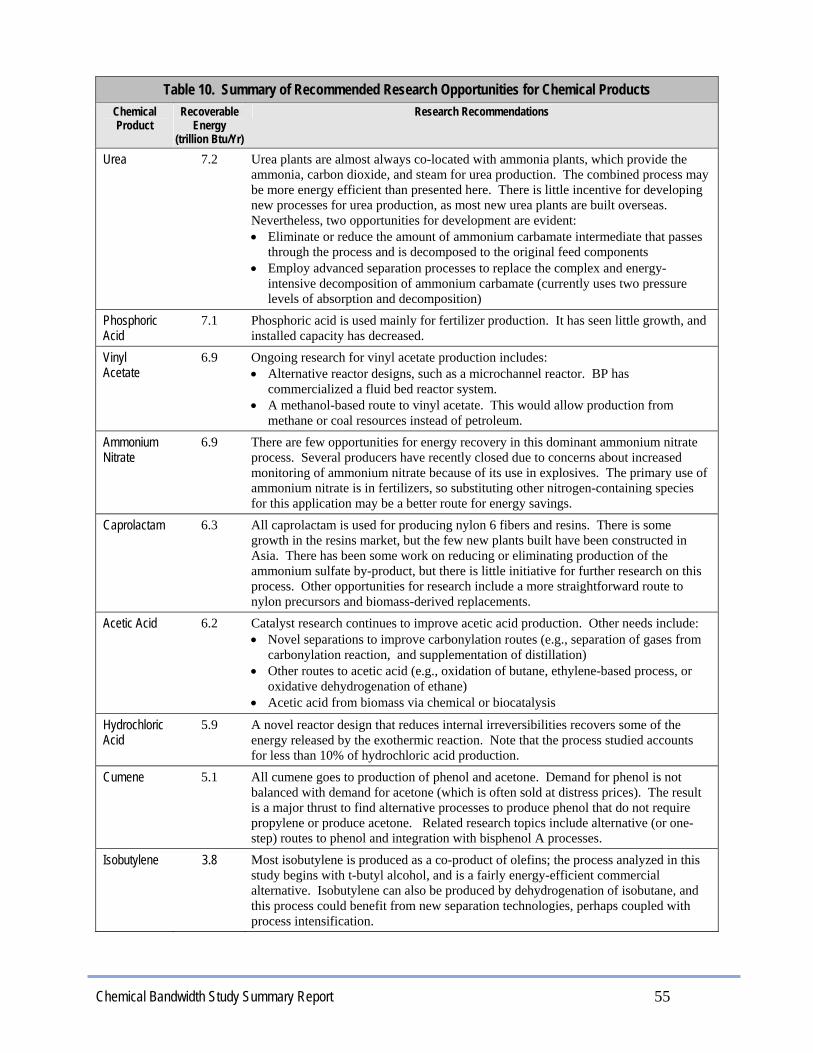
Chemical Bandwidth Study Summary Report 55
Table 10. Summary of Recommended Research Opportunities for Chemical Products Chemical Product
Recoverable Energy
(trillion Btu/Yr)
Research Recommendations
Urea 7.2 Urea plants are almost always co-located with ammonia plants, which provide the ammonia, carbon dioxide, and steam for urea production. The combined process may be more energy efficient than presented here. There is little incentive for developing new processes for urea production, as most new urea plants are built overseas. Nevertheless, two opportunities for development are evident: • Eliminate or reduce the amount of ammonium carbamate intermediate that passes
through the process and is decomposed to the original feed components • Employ advanced separation processes to replace the complex and energy-
intensive decomposition of ammonium carbamate (currently uses two pressure levels of absorption and decomposition)
Phosphoric Acid
7.1 Phosphoric acid is used mainly for fertilizer production. It has seen little growth, and installed capacity has decreased.
Vinyl Acetate
6.9 Ongoing research for vinyl acetate production includes: • Alternative reactor designs, such as a microchannel reactor. BP has
commercialized a fluid bed reactor system. • A methanol-based route to vinyl acetate. This would allow production from
methane or coal resources instead of petroleum.
Ammonium Nitrate
6.9 There are few opportunities for energy recovery in this dominant ammonium nitrate process. Several producers have recently closed due to concerns about increased monitoring of ammonium nitrate because of its use in explosives. The primary use of ammonium nitrate is in fertilizers, so substituting other nitrogen-containing species for this application may be a better route for energy savings.
Caprolactam 6.3 All caprolactam is used for producing nylon 6 fibers and resins. There is some growth in the resins market, but the few new plants built have been constructed in Asia. There has been some work on reducing or eliminating production of the ammonium sulfate by-product, but there is little initiative for further research on this process. Other opportunities for research include a more straightforward route to nylon precursors and biomass-derived replacements.
Acetic Acid 6.2 Catalyst research continues to improve acetic acid production. Other needs include: • Novel separations to improve carbonylation routes (e.g., separation of gases from
carbonylation reaction, and supplementation of distillation) • Other routes to acetic acid (e.g., oxidation of butane, ethylene-based process, or
oxidative dehydrogenation of ethane) • Acetic acid from biomass via chemical or biocatalysis
Hydrochloric Acid
5.9 A novel reactor design that reduces internal irreversibilities recovers some of the energy released by the exothermic reaction. Note that the process studied accounts for less than 10% of hydrochloric acid production.
Cumene 5.1 All cumene goes to production of phenol and acetone. Demand for phenol is not balanced with demand for acetone (which is often sold at distress prices). The result is a major thrust to find alternative processes to produce phenol that do not require propylene or produce acetone. Related research topics include alternative (or one-step) routes to phenol and integration with bisphenol A processes.
Isobutylene 3.8 Most isobutylene is produced as a co-product of olefins; the process analyzed in this study begins with t-butyl alcohol, and is a fairly energy-efficient commercial alternative. Isobutylene can also be produced by dehydrogenation of isobutane, and this process could benefit from new separation technologies, perhaps coupled with process intensification.
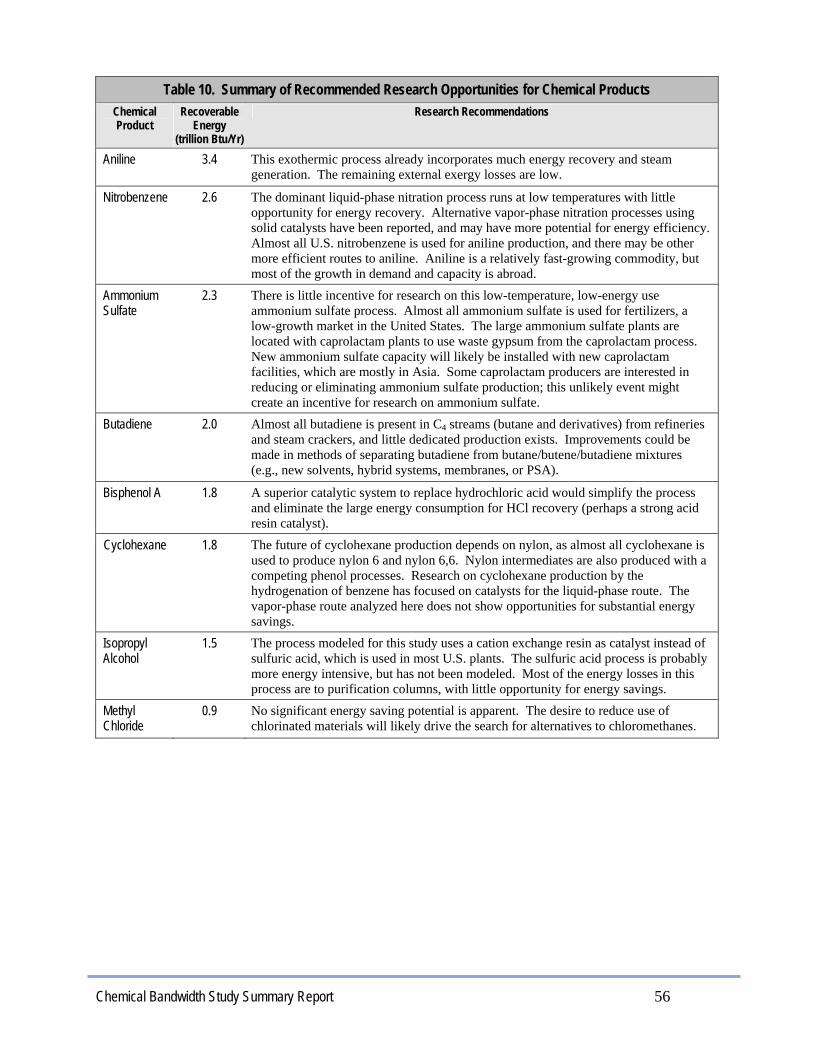
Chemical Bandwidth Study Summary Report 56
Table 10. Summary of Recommended Research Opportunities for Chemical Products Chemical Product
Recoverable Energy
(trillion Btu/Yr)
Research Recommendations
Aniline 3.4 This exothermic process already incorporates much energy recovery and steam generation. The remaining external exergy losses are low.
Nitrobenzene 2.6 The dominant liquid-phase nitration process runs at low temperatures with little opportunity for energy recovery. Alternative vapor-phase nitration processes using solid catalysts have been reported, and may have more potential for energy efficiency. Almost all U.S. nitrobenzene is used for aniline production, and there may be other more efficient routes to aniline. Aniline is a relatively fast-growing commodity, but most of the growth in demand and capacity is abroad.
Ammonium Sulfate
2.3 There is little incentive for research on this low-temperature, low-energy use ammonium sulfate process. Almost all ammonium sulfate is used for fertilizers, a low-growth market in the United States. The large ammonium sulfate plants are located with caprolactam plants to use waste gypsum from the caprolactam process. New ammonium sulfate capacity will likely be installed with new caprolactam facilities, which are mostly in Asia. Some caprolactam producers are interested in reducing or eliminating ammonium sulfate production; this unlikely event might create an incentive for research on ammonium sulfate.
Butadiene 2.0 Almost all butadiene is present in C4 streams (butane and derivatives) from refineries and steam crackers, and little dedicated production exists. Improvements could be made in methods of separating butadiene from butane/butene/butadiene mixtures (e.g., new solvents, hybrid systems, membranes, or PSA).
Bisphenol A 1.8 A superior catalytic system to replace hydrochloric acid would simplify the process and eliminate the large energy consumption for HCl recovery (perhaps a strong acid resin catalyst).
Cyclohexane 1.8 The future of cyclohexane production depends on nylon, as almost all cyclohexane is used to produce nylon 6 and nylon 6,6. Nylon intermediates are also produced with a competing phenol processes. Research on cyclohexane production by the hydrogenation of benzene has focused on catalysts for the liquid-phase route. The vapor-phase route analyzed here does not show opportunities for substantial energy savings.
Isopropyl Alcohol
1.5 The process modeled for this study uses a cation exchange resin as catalyst instead of sulfuric acid, which is used in most U.S. plants. The sulfuric acid process is probably more energy intensive, but has not been modeled. Most of the energy losses in this process are to purification columns, with little opportunity for energy savings.
Methyl Chloride
0.9 No significant energy saving potential is apparent. The desire to reduce use of chlorinated materials will likely drive the search for alternatives to chloromethanes.

Chemical Bandwidth Study Summary Report 57
ACC 2005 Guide to the Business of Chemistry 2005, American Chemistry Council,
Washington, DC ACC 2003 Guide to the Business of Chemistry 2003, American Chemistry Council,
Washington, DC Ahern 1980 Ahern, J. E. “The Exergy Method of Energy System Analysis”, John Wiley &
Sons, New York, 1980. Al-Jarallah, et al. 1988 Al-Jarallah, A. M. and A. K. Lee, “Economics of New MTBE Design”,
Hydrocarbon Processing, July 1988. ANL 1991 Argonne National Laboratory, “Energy Conservation Potentials in the Chemical
Industry” Aspen 2001 Aspen Technology, Inc. “What is New: Aspen Engineering suite Version
11.1”, October 2001. Aspen 2001a Aspen Technology, Inc. Aspen Engineering Suite 11.1 Documentation, October
2001. C&EN 1996 Chemical & Engineering News, 6/24/1996 CMR 2005 R. Brown, “US Gulf Coast Faces Challenges,” Chemical Market Reporter,
Vol. 268, No. 6, August 22, 2005 (p 19). Cremer 1980 Cremer, H. “Thermodynamics Balance and Analysis of a Synthesis Gas and
Ammonia Plant-Exergy Analysis”. In Thermodynamics: Second law Analysis,, ed R.A. Gaggioli, ACS Symposium Series 122, American Chemical Society Washington , D.C., 1980, pp111-130.
EI 2000 Energy and Environmental Profile of the U.S. Chemical Industry, U.S.
Department of Energy, Office of Industrial Technologies, May 2000. Gaggiloi, et al. 1977 Gaggioli, R.A. and P.J. Petit, “Use the Second Law First,” Chemtech, Vol. 7,
1977, pp 496-506. Jacob 2001 Jacobs Engineering Netherlands B.V. “Exercom (Version2) Manual for Aspen
Plus Version 10.2, September 2001 Moran 1982 Moran, M. J. “Availability Analysis A Guide to Efficient Energy Use”
Prentice-Hall, Englewood Cliffs, N.J, 1982 PEP 2002 Process Economic Program, SRI International, Menlo Park, California 2002. Rosen, et al. 1987 Rosen, M.A. and D.S. Scott, “A Thermodynamic Investigation of a Process for
the Production of Ammonia from Natural Gas”. In Analysis of Energy Systems –Design and Applications, ed M.J. Moran, S.S. Stecco and G.M.
References

Chemical Bandwidth Study Summary Report 58
Reistad, American Society of Mechanical Engineers, New York, 1987, pp 95-100.
Rosen, et al. 1985 Rosen, M.A. and D.S. Scott, “The Enhancement of a Process Simulator for
Complete Energy-Exergy Analysis”. In Analysis of Energy Systems –Design and Operations, ed. R.A. Gaggioli, American Society of Mechanical Engineers, New York, 1985, pp 71-80.
Shah, et al. 1988 Shah, V. A. and J. McFarland, “Low Cost Ammonia and C02 Recovery”,
Hydrocarbon Processing. 43-46 March 1988. SRI 1999 SRI PEP Process Module Documentation of 10/18/99, page 2. SRI 43 SRI PEP Report 43 Szargut, et al. 1988 Szargut, J., D.R. Morris, and F.R. Steward, “Exergy Analysis of Thermal,
Chemical and Metallurgical process, Hemisphere Publishing Corp., New York, 1988
Vision 2020 Technology Vision 2020: The US Chemical Industry, American Chemical
Society, December 1996.

Chemical Bandwidth Study Summary Report 59
Table A1. Energy and Exergy Analysis Results, Btu/lb
Appendix A – Data Table
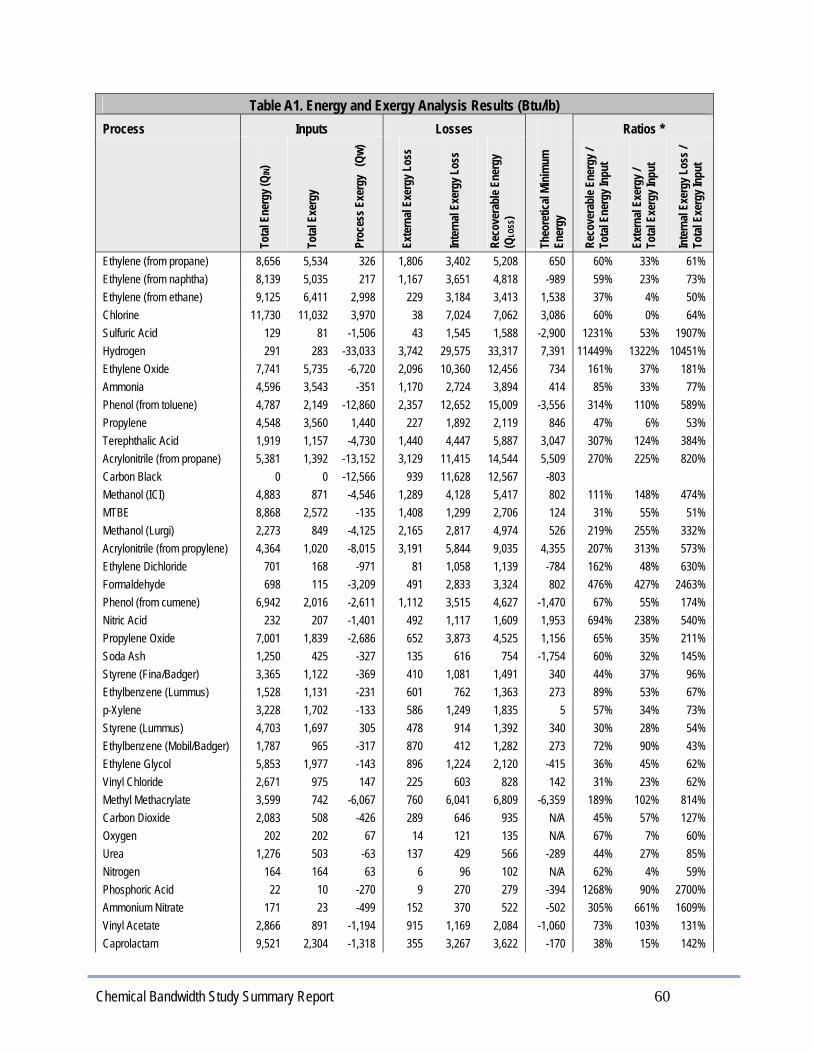
Chemical Bandwidth Study Summary Report 60
Table A1. Energy and Exergy Analysis Results (Btu/lb)
Process Inputs Losses Ratios *
Tota
l Ene
rgy (
Q IN)
Tota
l Exe
rgy
Proc
ess E
xerg
y (Q
w)
Exte
rnal
Exer
gy L
oss
Inte
rnal
Exer
gy L
oss
Reco
vera
ble E
nerg
y
(QLO
SS)
Theo
retic
al Mi
nim
um
Ener
gy
Reco
vera
ble E
nerg
y /
Tota
l Ene
rgy I
nput
Exte
rnal
Exer
gy /
To
tal E
xerg
y Inp
ut
Inte
rnal
Exer
gy L
oss /
To
tal E
xerg
y Inp
ut
Ethylene (from propane) 8,656 5,534 326 1,806 3,402 5,208 650 60% 33% 61% Ethylene (from naphtha) 8,139 5,035 217 1,167 3,651 4,818 -989 59% 23% 73% Ethylene (from ethane) 9,125 6,411 2,998 229 3,184 3,413 1,538 37% 4% 50% Chlorine 11,730 11,032 3,970 38 7,024 7,062 3,086 60% 0% 64% Sulfuric Acid 129 81 -1,506 43 1,545 1,588 -2,900 1231% 53% 1907% Hydrogen 291 283 -33,033 3,742 29,575 33,317 7,391 11449% 1322% 10451% Ethylene Oxide 7,741 5,735 -6,720 2,096 10,360 12,456 734 161% 37% 181% Ammonia 4,596 3,543 -351 1,170 2,724 3,894 414 85% 33% 77% Phenol (from toluene) 4,787 2,149 -12,860 2,357 12,652 15,009 -3,556 314% 110% 589% Propylene 4,548 3,560 1,440 227 1,892 2,119 846 47% 6% 53% Terephthalic Acid 1,919 1,157 -4,730 1,440 4,447 5,887 3,047 307% 124% 384% Acrylonitrile (from propane) 5,381 1,392 -13,152 3,129 11,415 14,544 5,509 270% 225% 820% Carbon Black 0 0 -12,566 939 11,628 12,567 -803 Methanol (ICI) 4,883 871 -4,546 1,289 4,128 5,417 802 111% 148% 474% MTBE 8,868 2,572 -135 1,408 1,299 2,706 124 31% 55% 51% Methanol (Lurgi) 2,273 849 -4,125 2,165 2,817 4,974 526 219% 255% 332% Acrylonitrile (from propylene) 4,364 1,020 -8,015 3,191 5,844 9,035 4,355 207% 313% 573% Ethylene Dichloride 701 168 -971 81 1,058 1,139 -784 162% 48% 630% Formaldehyde 698 115 -3,209 491 2,833 3,324 802 476% 427% 2463% Phenol (from cumene) 6,942 2,016 -2,611 1,112 3,515 4,627 -1,470 67% 55% 174% Nitric Acid 232 207 -1,401 492 1,117 1,609 1,953 694% 238% 540% Propylene Oxide 7,001 1,839 -2,686 652 3,873 4,525 1,156 65% 35% 211% Soda Ash 1,250 425 -327 135 616 754 -1,754 60% 32% 145% Styrene (Fina/Badger) 3,365 1,122 -369 410 1,081 1,491 340 44% 37% 96% Ethylbenzene (Lummus) 1,528 1,131 -231 601 762 1,363 273 89% 53% 67% p-Xylene 3,228 1,702 -133 586 1,249 1,835 5 57% 34% 73% Styrene (Lummus) 4,703 1,697 305 478 914 1,392 340 30% 28% 54% Ethylbenzene (Mobil/Badger) 1,787 965 -317 870 412 1,282 273 72% 90% 43% Ethylene Glycol 5,853 1,977 -143 896 1,224 2,120 -415 36% 45% 62% Vinyl Chloride 2,671 975 147 225 603 828 142 31% 23% 62% Methyl Methacrylate 3,599 742 -6,067 760 6,041 6,809 -6,359 189% 102% 814% Carbon Dioxide 2,083 508 -426 289 646 935 N/A 45% 57% 127% Oxygen 202 202 67 14 121 135 N/A 67% 7% 60% Urea 1,276 503 -63 137 429 566 -289 44% 27% 85% Nitrogen 164 164 63 6 96 102 N/A 62% 4% 59% Phosphoric Acid 22 10 -270 9 270 279 -394 1268% 90% 2700% Ammonium Nitrate 171 23 -499 152 370 522 -502 305% 661% 1609% Vinyl Acetate 2,866 891 -1,194 915 1,169 2,084 -1,060 73% 103% 131% Caprolactam 9,521 2,304 -1,318 355 3,267 3,622 -170 38% 15% 142%

Chemical Bandwidth Study Summary Report 61
Table A1. Energy and Exergy Analysis Results (Btu/lb) Process Inputs Losses Ratios *
Tota
l Ene
rgy (
Q IN)
Tota
l Exe
rgy
Proc
ess E
xerg
y (Q
w)
Exte
rnal
Exer
gy L
oss
Inte
rnal
Exer
gy L
oss
Reco
vera
ble E
nerg
y
(QLO
SS)
Theo
retic
al Mi
nim
um
Ener
gy
Reco
vera
ble E
nerg
y /
Tota
l Ene
rgy I
nput
Exte
rnal
Exer
gy /
To
tal E
xerg
y Inp
ut
Inte
rnal
Exer
gy L
oss /
To
tal E
xerg
y Inp
ut
Acetic Acid 1,612 786 -512 163 1,134 1,297 436 80% 21% 144% Hydrochloric Acid 0 0 -530 23 507 530 -1,124 Cumene (AlCl3) 1,124 440 -240 343 337 680 526 60% 78% 77% Cumene (Zeolite) 1,061 375 -248 304 319 623 526 59% 81% 85% Cumene (SPA) 812 328 -245 192 382 574 526 71% 59% 116% Isobutylene 2,288 518 53 314 151 465 54 20% 61% 29% Aniline 956 368 -1,548 197 1,718 1,915 -2,093 200% 54% 467% Nitrobenzene 1,147 419 -503 164 758 922 421 80% 39% 181% Ammonium Sulfate 709 249 -148 106 291 397 -701 56% 43% 117% Butadiene 1,382 468 55 44 369 413 N/A 30% 9% 79% bisPhenol A 2,131 649 -290 336 602 938 -491 44% 52% 93% Cyclohexane 465 229 -543 327 445 772 -499 166% 143% 194% Isopropyl Alcohol 3,880 808 -124 428 504 932 -50 24% 53% 62% Methyl Chloride 398 249 -455 139 564 703 -250 177% 56% 227%
- Negative values indicate an exothermic reaction, net chemical conversion exergy inflow N/A A separation process without chemical reaction * Ratios may be higher than 100% because the input energy does not include heat generated by exothermic reactions