ITEST 2009 - STELARstelar.edc.org/sites/stelar.edc.org/files/MIS_Summary_Report_2009.pdf ·...
60
ITEST Management Information System (MIS) 2009: Final Report Describing Active ITEST Projects June 2010 Caroline Parker, Alyssa Na’im, Michelle Schamberg Acknowledgements: This report would not have been possible without the dedicated technical support from Dorothea Wheeler and the content expertise of Siobhan Bredin and Joyce Malyn‐ Smith, as well as the willingness of ITEST principal investigators to complete the MIS with such care and accuracy.
Transcript of ITEST 2009 - STELARstelar.edc.org/sites/stelar.edc.org/files/MIS_Summary_Report_2009.pdf ·...

ITEST Management Information System (MIS) 2009: Final Report Describing Active ITEST Projects
June 2010
Caroline Parker, Alyssa Na’im, Michelle Schamberg Acknowledgements: This report would not have been possible without the dedicated technical support from Dorothea Wheeler and the content expertise of Siobhan Bredin and Joyce Malyn‐Smith, as well as the willingness of ITEST principal investigators to complete the MIS with such care and accuracy.

MIS 2009: Introduction 2
Introduction In 2003, the ITEST Learning Resource Center at EDC was funded to provide technical assistance and support to ITEST projects. The LRC’s approach to technical assistance was to develop a community of practice among ITEST project teams who would share expertise and lessons learned with their peers to continuously improve practice across the ITEST portfolio. On occasion the LRC would be asked by NSF to provide “highlights” or examples of ITEST “in action” and information about ITEST projects that might be used to help others understand the ITEST program, its goals and communities served. As the ITEST program matured questions about ITEST projects increased in their frequency and number. Soon it became apparent that the rapid response of the ITEST community to each set of questions was insufficient to meet the informational needs of a mature NSF program. It was clear that ITEST would benefit from a comprehensive information system that contained accurate data describing ITEST projects. This would enable rapid responses to questions about the program, and also periodic, data‐driven snapshots of the ITEST program. The long‐term relationship between the LRC and ITEST projects could facilitate the development of such a management information system. In partnership with ITEST principal investigators and evaluators, the LRC embarked on a process to develop and test the ITEST management information system. The system described below is meant to be an initial step in gathering data needed to describe and document ITEST in ways that will serve the needs of ITEST projects, and also add value to the ongoing work of a mature ITEST program. In coordination with NSF program officers, the LRC defined the following goal for the MIS: To inform NSF, the LRC, the ITEST projects, the field and other stakeholders as to the state of ITEST: who participates, how often, when, and in what kind of activities. The first round of data collection was completed in the fall of 2009, and this report provides results for the 89 projects that completed the MIS. Developing the MIS The first step in the MIS development process was to review existing NSF program data collection systems and to consult with experts in the field. Among the NSF programs consulted were ISE, AYS, REESE, and MSP. Those directly involved with data collection for those programs were contacted and interviewed for ‘lessons learned,’ and all available documentation about each of the systems was reviewed. As a result of this, a number of procedural decisions were made for this first phase of the MIS development, including:
‐ Collect data at the project level; ‐ Collect descriptive rather than evaluative data; ‐ Establish annual data collection points: at baseline, annually, and at project completion.
A second, concurrent set of consultations was done with current and former ITEST project evaluators.1 As the ‘on the ground’ people involved in data collection at the project level, their
1 Rose Shaw, Karen Yanowitz, Charles Giuli, Karen Peterson, and Judith Stull.

MIS 2009: Introduction 3
input helped to keep the MIS development focused and feasible. In addition to consulting at the beginning stages, interested evaluators also reviewed a version of the MIS in the spring of 2009. The initial draft of the MIS questionnaire items was developed based on the consultations. As noted above, it was then reviewed by ITEST project evaluators, as well as NSF program officers. The ITEST LRC Advisory Board dedicated most of one advisory board meeting to an item‐by‐item review, providing specific feedback on both the overall framing of the MIS and the individual items and answer choices. Comments were incorporated in a revised version, which was then piloted with a small group of ITEST projects. Follow‐up interviews were conducted with each of the PIs who completed the pilot, and items were reviewed one‐by‐one to identify issues of clarity and relevance. The third and final revision was completed in June 2009. Two MIS versions were developed: the baseline version to be completed by projects newly funded in 2009, and the annual version to be completed by all projects funded before 2009 and still active. During the summer of 2009 all technical issues were addressed, and the questionnaire was put online for administration in the fall. Format of MIS As noted above, two versions of the MIS were developed for administration in fall 2009. The baseline version asks projects to describe their targets for the project – targeted populations, targeted technologies, etc. The annual version includes all the same questions, but asks PIs to complete the actual results for the previous year. When projects complete the MIS over more than one year, we will be able to track changes in projects over the project life cycle. In this first year of administration, we only have a single data point for each project, whether they are in their first, second, or third year. The MIS administered in 2009 has 43 questions divided into four areas: project background, participant information (youth and teachers), program components (technology, partners, dissemination, data collection), and evaluation methods. The survey was administered to all currently active projects from the four most recently funded cohorts. The first three cohorts of ITEST projects (a total of 52 projects) were not included in the MIS because they are no longer active. Thus, the MIS describes the characteristics of four years of ITEST projects rather than the entire portfolio. It was administered from mid‐September through December 2009. For each project, LRC staff checked all the results and contacted project PIs with any clarifying questions. The data was also compared to existing data submitted by each project to the LRC website of project profiles. This detailed process resulted in high quality and reliable data, with few missing variables. Purpose and organization of this report This report is a first look at the aggregated data, which can give us a bird’s‐eye view of the ITEST projects in 2009. The report is intended to provide ITEST PIs, evaluators, and NSF program officers with information about the kind of data available from the MIS in order to stimulate

MIS 2009: Introduction 4
feedback on requests for additional analyses and revisions of items for later data collection. Further analysis of the data, particularly as we gather annual updates, will provide a more comprehensive picture of the evolution of ITEST projects and their impact on participants. We provide disaggregated data by cohort for all the results presented here in Appendix *. When results varied by cohort, we have presented them directly in the report. In addition to providing a forum for feedback to improve the data collection and reporting process, this report provides the first program‐wide summary of ITEST projects: who the projects serve, how many people they serve, the structure of the projects, their intended outcomes, and the ways in which those outcomes are measured. The report is organized a little bit differently than the order of the questionnaire. It begins with a description of all ITEST projects, including both background information and project components. It then continues with details about youth‐focused projects, followed by teacher‐focused projects. The fourth section includes information only from the three cohorts which were active in 2009 (it does not include the cohort funded in fall 2009 but which will implement in spring/summer 2010) and provides information about actual participants served. The final section describes the data collection and evaluation activities of the projects. This effort represents the first phase of development of a comprehensive management information system serving the needs of the ITEST community. As the ITEST program continues to mature we are working with ITEST projects and the NSF to anticipate the additional types of data that may need to be collected and to streamline the data collection process for projects.

MIS 2009: Description of ITEST projects 5
Description of ITEST projects Of the 108 projects from four cohorts which received an invitation to complete the MIS, 89 (82%) completed it by the deadline (Table 1). The cohort funded in 2009 (Cohort 7) completed the baseline version of the survey, which asks projects to describe their targets for the coming year. The other three cohorts had all completed at least one full year of funding (Cohorts 4, 5, 6) and were asked to complete the annual version of the survey, which asks projects to report on actual activities that occurred in the previous year. For most of the data in this summary, we report on all four cohorts together. When the data on actual vs. targeted results is particularly relevant (i.e. number of participants served), we report only on the three cohorts which completed the annual version of the survey. Table 1. Total projects and number of projects that completed MIS data collection form
Cohort # of projects that completed MIS Total projects Cohort Four 17 24* Cohort Five 24 28** Cohort Six 25 29 Cohort Seven 23 27*** Total 89 108 *Excluding one originally funded, but org went out of business in their second year, so not asked to complete.**Excluding 1‐year WGBH media resources project not asked to complete.***Not counting the 2 that were funded January 1, and not asked to complete for this round. For the first five years of ITEST, projects were submitted either as youth‐based or comprehensive (focused on teacher professional development). Beginning in 2008, the program was revised, and projects were placed into one of four categories: convenings, studies, scale‐up, or strategies. The strategies category encompasses both youth‐based and comprehensive projects, keeping ITEST’s dual focus on both informal and formal education. As shown in Figure 1, almost half of the projects that completed the MIS are identified as Strategies.

MIS 2009: Description of ITEST projects 6
Figure 1. ITEST project type (n=89).
ITEST projects can also be classified by their content focus, as shown in Figure 2. The three largest areas of primary focus are computer science, engineering, and environmental science, followed by bioscience and mathematics. (See Appendix B1 for a breakdown of these categories.) Figure 2. ITEST area of primary focus (n=89).
Over the four years of projects in this report, there has been some variation in the focus of projects, but Computer Science, Environmental Science, and Engineering are consistently the three most common areas of focus (Figure 3).
Comprehensive27%
Convening2%
Scale‐Up4%
Strategies45%
Studies3%
Youth‐Based19%
Bioscience9%
Computer Science39%Engineering
26%
Environmental Science19%
Mathematics4%
Convening2%
Research1%

MIS 2009: Description of ITEST projects 7
Figure 3. Area of primary focus by cohort (n=89).2
ITEST projects work with both youth/students and with teachers. Of the projects that completed the MIS, 78% work with both youth and teachers in some component of the project; 20% work only with youth, and 2% work only with teachers (Figure 4). Figure 4. Targeted population of ITEST projects (n=89).
Youth only20%
Teachers only2%
Both teachers and youth
78%
Figure 5 provides more detail about the 87 projects that work with youth in some form. (Two projects are Convenings with a focus on youth, but do not work directly with youth and so are not included here.) ITEST projects work with youth in many different settings: schools, museums, after school programs, etc. There has been a shift in ITEST projects from working
2 The two research studies in Cohort 7 are classified under their primary subject areas.
0
5
10
15
20
25
30
C4 n=17 C5 n=24 C6 n=25 C7 n=23
Area of primary focus
Research
Convening
Mathematics
Bioscience
Engineering
Environmental Science
Computer Science

MIS 2009: Description of ITEST projects 8
exclusively with youth in out‐of‐school settings (over 50% of projects in Cohorts 4‐6)) to working with youth in in‐school settings (43% of projects in Cohort 7). Figure 5. ITEST project settings for working with youth (n=87)
Of the 89 projects, 71 identified that they work with teachers in some form. Figure 6 shows that the projects work with teachers in diverse contexts: of all cohorts together, 34% of projects work with teachers and with youth in school contexts, 34% work with teachers and youth in out of school contexts, and 29% work with teachers and youth in both in and out of school contexts. Of the two projects that work only with teachers, one is a study of changes in teaching practices. The most recent cohort has seen a large increase in the percentage of projects working exclusively with youth in in‐school settings, and fewer projects working with teachers and youth out‐of‐school. Figure 6. ITEST project settings for working with teachers (n=71).
0%
10%
20%
30%
40%
50%
60%
70%
80%
90%
100%
Total C4 n=17 C5 n=24 C6 n=23 C7 n=23
Youth in and out of school
Youth in school
Youth out of school
0%10%20%30%40%50%60%70%80%90%100%
Total C4 n=15 C5 n=20 C6 n=20 C7 n=16
Project settings for teachers
Teachers only
Teachers and youth out of school
Teachers and both youth groups
Teachers and youth in school

MIS 2009: Description of ITEST projects 9
As noted in Table 2, 39 projects work in more than one geographic area. Almost 80% of the projects work in urban areas.3
Table 2. Number of projects targeting specific geographic areas* (n=86)
# of projects targeting
% of all projects targeting
Urban 68 79 Suburban 35 41 Rural 39 45 *39 projects targeted more than one geographic area. ITEST project characteristics ITEST projects, by definition, use technologies in innovative ways. The kinds of technologies they use are ever changing, as the technologies themselves change. The following table (Table 3) describes the numbers of projects that used particular technologies through 2009. The length of the list shows the diversity of technologies. The five most commonly used technologies are visualization and computer modeling tools, programming tools, data analysis and computation tools, multi‐media tools, and communication tools. The least commonly used are hand‐held devises, imaging technologies, and virtual reality. Table 3. Technologies used in project (n=88)* # of projects % of projects Visualization/computer modeling tools 33 38 Programming tools 32 37 Data analysis/computation tools 31 36 Multi‐media tools 29 34 Communication tools (email, messaging, blogs, video conferencing
29 33
Game development 20 24 Engineering/design tools 19 22 Social networking tools 18 21 Electronics/robotics tools 18 21 Geospatial technologies (GIS/GPS/RS) 17 20 Hand‐held devices 14 16 Imaging technologies 10 12 Virtual reality 9 11 Other 12 14 *Please see Appendix C1 for more information about this table, including missing values by item.
3 We will also present a breakdown of projects by state (pending).

MIS 2009: Description of ITEST projects 10
In addition to specific technology tools, ITEST projects promote different technology skills. Table 4. Technology skills promoted in project (n=88)* # of projects % of projects Visualization/modeling skills 35 41 Computing/data analysis skills 34 39 Programming skills 28 34 Communication/social networking skills 27 31 Digital media skills (photos, imovie, music...) 26 31 Computational thinking skills 25 29 Computer driven equipment skills (e.g. CAM, Robotics..) 20 24 Data management skills 18 21 Web development skills 14 17 Other 12 14 *Please see Appendix C2 for more information about this table, including missing values by item. The specific technology skills promoted in projects have undergone changes from Cohort 4 to Cohort 7, as demonstrated in Figure 7. There has been an increase in communications and social networking skills, and a decrease in programming skills. Figure 7. Technology skills promoted in projects (n=88).
0%
10%
20%
30%
40%
50%
60%
70%
80%
90%
100%
C4 n=17 C5 n=24 C6 n=24 C7 n=23
Other
Web development skills
Data management skills
Computer driven equipment skills (e.g. CAM, Robotics…)
Programming skills
Digital media skills (photos, imovie, music...)
Visualization/modeling skills
Computing/data analysis skills
Computational thinking skills
Communication/social networking skills

MIS 2009: Description of ITEST projects 11
Tables 5 and 6 describe project participants and partners. Undergraduate and graduate students are the most common participants in the projects, while K‐12 schools and colleges or universities are the most commonly used partner institutions. The specific activities requested of the partner institutions is presented in Appendix B2. Among the most common partner activities are participating in project delivery (74% of projects), recruitment, field trip sites, and providing laboratory facilities. Table 5. Other participants in ITEST projects (n=89). # of projects % of projects Undergraduate student volunteers/paid 52 59 Graduate student volunteers/paid 50 56 Community volunteers 29 33 Parents 27 30 Undergraduate student volunteers/unpaid 25 28 Graduate student volunteers/unpaid 21 24 Tribal elders 2 2 Other 22 25 Does not apply 8 9 Table 6. Partner institutions in ITEST projects (n=89). # of projects % of projects K‐12 Schools 73 82 College/University 71 80 Business/Industry 67 75 Community‐based organization 36 40 Informal science education organization 31 35 Not‐for‐profit organization 31 35 Government laboratory 17 19 Historically Black Colleges and Universities 9 10 Hispanic Serving Institutions 7 8 Other Minority Serving Institutions 3 3 Other 7 8 Does not apply 1 1 The most common target audience is educators (93%), but more than 50% of projects also target researchers and/or youth in their dissemination (Table 7). Between 40 and 45% target parents, the public, and/or policymakers.

MIS 2009: Description of ITEST projects 12
Table 7. Target audience of dissemination (n=88) # of projects % of projects Educators 82 93 Researchers 53 60 Youth 48 55 Parents 40 45 Public 38 43 Policymakers 35 40 Other 6 7 *One project did not answer this question.

MIS 2009: Youth participants 13
Youth participants Not surprisingly, almost all ITEST projects work with youth in some form, whether directly in youth‐based projects, or through the teachers that participate in ITEST professional development.4 Of the 87 projects that work with youth, two are ITEST convenings which bring experts together around specific issues of interest to the ITEST community. They do not work directly with youth, and thus are not included in the data here describing the youth participants in ITEST projects. ITEST projects, as part of their mission, target youth who have generally been under‐represented in the STEM fields. Tables 8 and 9 show the projects’ target populations by race/ethnicity and other subgroups. More than 80% of projects target either African American or Hispanic students, or both. A smaller portion of projects target American Indians (25%) and Pacific Islanders (13%). While five projects include Alaska Natives and one project includes Native Hawaiians, there are currently no projects which focus exclusively on either of those groups.5 Table 8. Number of projects targeting youth populations by race/ethnicity (n=85)
# of projects % of projects * African American 69 84 Hispanics 66 83 American Indian 19 25 Pacific Islanders 10 13 Alaska Natives 5 7 Native Hawaiians 1 1 *Percentages based on actual respondents. Each category had from 3 to 9 missing values (see Appendix C3). Almost 73% of projects target students who qualify for free/reduced price lunch, in sync with the ITEST mission to reach underrepresented groups. Of the 27 projects which work with ELLs in some fashion, three projects are designed specifically to address their needs. As noted in Table 9, eight projects are specifically designed to work with girls. The 18 projects working with students with disabilities and the 13 working with students participating in gifted/talented programs work with these groups as part of their overall population, rather than designing the projects to meet their specific needs.
4 One of the projects that does not work with youth is doing research with ITEST teachers, and the other focuses exclusively on teachers and does not have a youth participation component. 5 Two projects in previous cohorts which have completed their grant and thus were not included in the MIS worked in Alaska and one in Hawaii

MIS 2009: Youth participants 14
Table 9. Number of projects targeting specific youth populations (n=85)* # of projects % of projects**
Students qualifying for free/ reduced price lunch 61 73 English language learners (ELL) 27 34 Students with disabilities 18 23
Students participating in gifted/ talented programs 13 16 Only girls 8 10 *Total is more than 82 because projects work with more than one group. **Percentages based on actual respondents. Each category had from 2 to 6 missing values (see Appendix C4). Almost 80% of projects work at the high school level (Table 10), and 61% work in middle schools. Nine projects work in 3rd‐5th grades, while only one project works in grades K‐2. While the ITEST Program began with a focus on middle and high school, and only in the last two years has broadened the target groups to include elementary school, four of the ten projects targeting youth at the elementary level are in cohorts that were funded before this change in focus occurred. Table 10. Number of projects targeting youth at specific grade levels (n=85)
Cohort 4 Cohort 5 Cohort 6 Cohort 7 n=17 % n=24 % n=23 % n=21 %
K‐2 1 6 0 0 0 0 0 0 3‐5 targeted 1 6 2 8 1 4 5 24 6‐8 targeted 14 82 14 58 14 61 10 48 9‐12 targeted 14 82 21 88 14 61 18 86 * Total is greater than 85 because some projects targeted grades across the grade groups (e.g., targeting 5th and 6th grades). The 85 ITEST projects that work with youth in some context do so in varied ways. Table 11 shows the number of youth that each project targets per year. Seven of the projects work with fewer than 25 youth per year, while more than 50% work with more than 100 youth per year. Table 10. Number of projects and size of targeted youth populations (n=85)
# of projects % of all projects Fewer than 25 youth 7 8 25‐50 youth 13 15 51‐100 youth 20 24 More than 100 youth 44 52 When asked to identify the various settings in which they work with students (Table 12), projects most frequently cited: 1‐2 week summer sessions (49%), after school (46%), and in school (45%). While nearly half of projects reported the use of short summer sessions with youth, a much smaller percentage (20%) indicated they hold summer sessions lasting more

MIS 2009: Youth participants 15
than two weeks. Youth employment/internships and distance learning were the least cited categories of settings chosen at 11% and 7%, respectively. Table 11. Formats of working with youth/students (n=84)
# of projects % of projects 1‐2 week summer sessions 41 49 After school 39 46 In school 38 45 Weekend 27 32 Online/social networking 21 25 >2 weeks summer session 17 20 Youth employment/internship 9 11 Distance learning 6 7 Other 5 6 Does not apply 3 4
*One project did not complete this question. Figure 8 shows the shift in formats of working with youth over the four cohorts. As with the shifts in technology skills, there has been a growth in the use of social networking. There has also been an increase in work with youth during the school day, and a decrease in the summer sessions, both short and long sessions. Figure 8. Formats of working with youth/students (n=84).
The following table (Table 13) describes the different focus areas of ITEST projects working with youth. Projects were allowed to choose more than one focus area (they were requested to limit
0%
10%
20%
30%
40%
50%
60%
70%
80%
90%
100%
C4 n=17 C5 n=24 C6 n=22 C7 n=21
Other
>2 weeks summer session
1‐2 week summer sessions
Weekend
After school
In school
Online/social networking
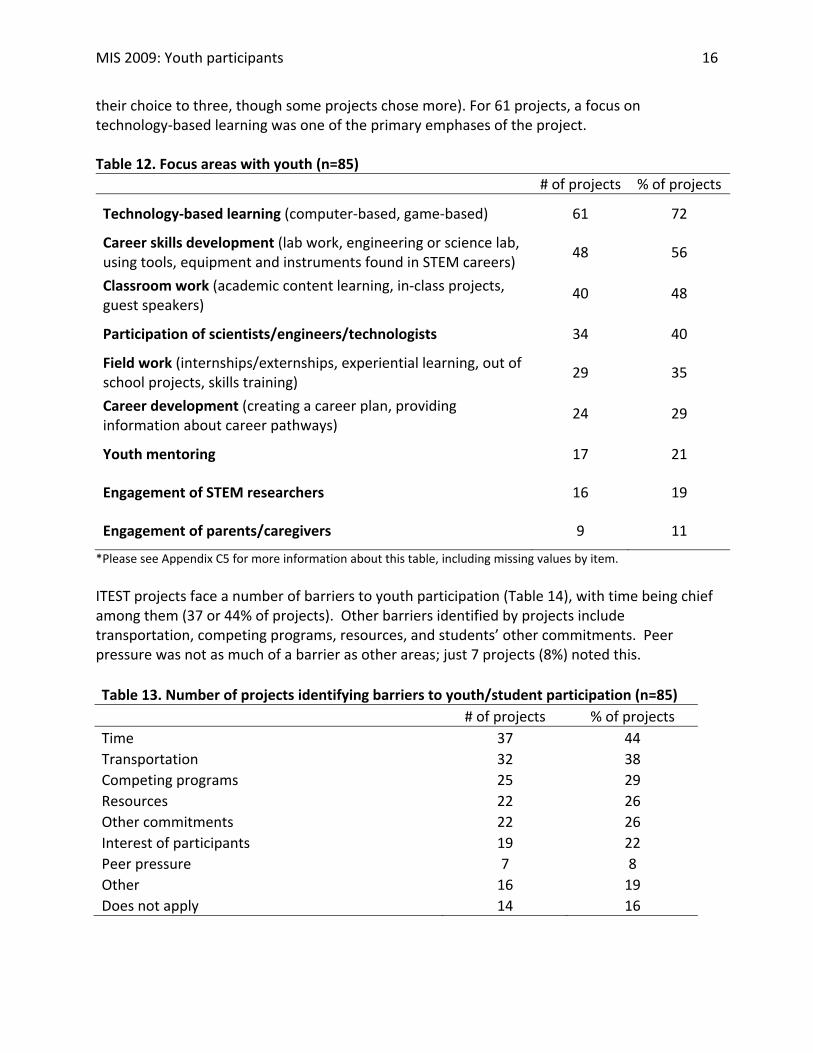
MIS 2009: Youth participants 16
their choice to three, though some projects chose more). For 61 projects, a focus on technology‐based learning was one of the primary emphases of the project. Table 12. Focus areas with youth (n=85)
# of projects % of projects
Technology‐based learning (computer‐based, game‐based) 61 72
Career skills development (lab work, engineering or science lab, using tools, equipment and instruments found in STEM careers)
48 56
Classroom work (academic content learning, in‐class projects, guest speakers)
40 48
Participation of scientists/engineers/technologists 34 40
Field work (internships/externships, experiential learning, out of school projects, skills training)
29 35
Career development (creating a career plan, providing information about career pathways)
24 29
Youth mentoring 17 21
Engagement of STEM researchers 16 19
Engagement of parents/caregivers 9 11
*Please see Appendix C5 for more information about this table, including missing values by item. ITEST projects face a number of barriers to youth participation (Table 14), with time being chief among them (37 or 44% of projects). Other barriers identified by projects include transportation, competing programs, resources, and students’ other commitments. Peer pressure was not as much of a barrier as other areas; just 7 projects (8%) noted this. Table 13. Number of projects identifying barriers to youth/student participation (n=85)
# of projects % of projects Time 37 44 Transportation 32 38 Competing programs 25 29 Resources 22 26 Other commitments 22 26 Interest of participants 19 22 Peer pressure 7 8 Other 16 19 Does not apply 14 16

MIS 2009: Youth participants 17
Projects were also asked to describe how they addressed the barriers to youth participation. To address time constraints, projects adjusted the time of scheduled activities or were flexible with attendance requirements. Transportation problems were solved by providing transportation, offering travel reimbursements, or arranging carpooling. Projects that faced challenges with recruitment mentioned strong partnerships with schools or districts to help identify students. Several projects also mentioned using engaging activities and content as well as offering incentives to attract and retain youth participants. The following quotes illustrate projects’ innovative and flexible approaches to addressing these obstacles: “We kept our program fresh and innovative by offering a variety of new science workshops in robotics, aeronautics, holistic biology, and rocketry. We also offered many weekend field [trip]s and an engaging two week summer program, where the students traveled outside of the East San Jose area to explore and discover science.” “We had difficulty initially finding transportation during the school week to get middle school youth to the program. We were able to establish partnerships with the school buses at the middle schools to add a stop…. We also established a partnership with Metro Transit, the local city bus company, to provide free bus passes to our youth staff.” “We realigned the program to be in class and summers. Also, [we] moved away from schools that had significant problems with scheduling our program versus others. In exchange we brought into the program very engaged schools with similar demographics.” To recruit youth participants, ITEST projects typically utilize school‐based strategies or partners (Table 15). School contacts, teacher‐to‐student, and district administrators were most frequently cited approaches to recruitment. On the other hand, less common recruitment methods include informal contacts or advertisements through TV, radio, newspapers or PSAs. Table 14. Partners/strategies for recruiting YOUTH (n=85)
# of projects % of projects School contacts 67 79 Teacher‐to‐student 60 71 District or school administrators 59 69 Youth‐to‐youth 33 39 Partners 32 38 Parents 30 35 Existing participant pool 28 33 Community groups 20 24 University partnerships 19 22 TV, radio, newspapers, PSAs 8 9 Informal contact 8 9 Other 5 6

MIS 2009: Teacher participants 18
Teacher participants There are 71 projects that work with teachers. Of those, two are not included in most of the descriptions that follow; one of them is a study working across a span of ITEST projects rather than with specific teachers, and one is a convening and so is not working directly with teachers. As noted above, all but two of the 71 projects that work with teachers also work with youth in some setting, both in and outside of school. Figure 9 demonstrates the range of the size of teacher groups targeted by ITEST projects on an annual basis. Thirty‐four percent of projects work with a targeted group of up to ten teachers, while 38% work with 11‐25 teachers and 19% work with 26‐50 teachers. Just under 10% of projects work with more than 50 teachers annually. Figure 9. Percentage of projects by size of teacher groups (n=68)
1‐10 teachers34%
11‐25 teachers38%
26‐50 teachers19%
more than 50 teachers
9%
*One project that works with teachers works only with after school and pre‐certification teachers. Projects were asked to describe their work with different stakeholders. As noted above, 68 of the projects work with certified practicing teachers. Thirteen projects described working with afterschool educators. Of those, nine work with fewer than 10 afterschool educators, and four work with more than 10 afterschool educators. Ten projects work with pre‐certified teachers in some form, working with from 1 to 21 teachers, and 44 of 69 projects work with project staff in some form. Of those, 34 work with 1‐10 staff and ten work with 11‐20 staff.
Of the 69 projects that work directly with teachers, 43 (62%) of them provide some form of teacher credentials, whether continuing education credits, certifications, or some other credential (see Appendix B3).

MIS 2009: Teacher participants 19
When asked to identify the various settings in which they work with teachers, projects most frequently cited: summer programs (68%), after school (44%), and summer youth institutes (44%). Only 32% said that they use online social networking, and 22% distance learning (Table 16). Table 15. Formats of working with teachers (n=68)
# of projects % of projects Summer program 46 68 After school program 30 44 Summer youth institute 30 44 Online social networking 22 32 Weekend program 20 29 Distance learning 16 22 Other 23 34
*One project did not answer this question. As with the youth, there has been a shift in the formats that ITEST projects use with teachers (Figure 10).There has been an increase in social networking and distance learning. A similar percentage of cohorts are using summer programs, but only one project in the most recent cohort has a summer youth institute as part of the summer program. Figure 10. Formats of working with teachers (n=68).
Table 17 describes the different focus areas of ITEST projects. There are many different ways in which the projects engage teachers, and this table describes a few of them. As with the work with youth, a focus on technology‐based learning was one of the primary emphases for 52 projects.
0%
10%
20%
30%
40%
50%
60%
70%
80%
90%
100%
C4 n=14 C5 n=20 C6 n=19 C7 n=15
Other/Does not apply
Distance learning
Summer youth institute
Summer program
Weekend program
After school program
Online social networking

MIS 2009: Teacher participants 20
Table 16. Focus areas with teachers (n=69)* # of projects % of projects
Technology‐based learning (computer‐based, game‐based) 52 76
Classroom work (academic content learning, in‐class projects, guest speakers) 36
54
Career skills development (lab work, engineering or science lab, using tools, equipment and instruments found in STEM careers) 28
42
Field work (internships/externships, experiential learning, out of school projects, skills training) 20
30
Participation of scientists/engineers/technologists 18 28
Youth mentoring 14 21
Career development (creating a career plan, providing information about career pathways) 11
17
Engagement of STEM researchers 11 17
Engagement of parents/caregivers 2 3
*Please see Appendix C6 for more information about this table, including missing values by item. ITEST projects face a number of barriers to teacher participation, with time being chief among them (70% of projects). Other barriers identified by projects include other commitments, competing programs, and interest of participants (Table 18). Table 17. Number of projects identifying barriers to teacher participation (n=68)
# of projects % of projects Time 47 70 Other commitments 33 49 Competing programs 20 30 Interest of participants 15 22 Resources 11 16 Transportation 4 6 Other 10 15 Does not apply 8 12
*Two projects did not answer this question. Projects were also asked to describe how they addressed barriers to teacher participation. To address time constraints, projects most frequently mentioned adjusting the times for scheduled activities. Respondents also mentioned being flexible with program requirements (providing online work or granting extensions) and offering online support. To attract and retain teacher participants, projects also supply stipends, offer course credit, or provide online or in‐person

MIS 2009: Teacher participants 21
follow up support once the project ends. A sample of comments that illustrate a few of these points are cited below: “We carefully scheduled workshops to avoid important school events, and provided on‐line support in between workshops.” We scheduled the course so it would have fewer conflicts and we integrated it into the districts' "Professional Development" program.” “Providing opportunities for distance communication such as on‐line meetings and phone conferences. Project staff makes site visits to each site every year, and usually more than one visit.” To recruit teacher participants, ITEST projects typically utilize school‐based strategies or partners (Table 19). District or school administrators, school contacts, and teacher‐to‐teacher contacts were the most frequently cited approaches to recruitment. On the other hand, less common recruitment methods include community groups or advertisements through TV, radio, newspapers or PSAs. Table 18. Partners/strategies for recruiting TEACHERS (n=70)
# of projects % of projects District or school administrators 58 83 School contacts 49 70 Teacher to teacher 47 67 Existing participant pool 25 36 University partnerships 20 29 Partners 19 27 Community groups 8 11 TV, radio, newspapers, PSAs 5 7 Informal setup 1 1 Other 9 13

MIS 2009: Implementation results 22
2009 Implementation results Of the four cohorts included in this report, one cohort (23 projects from Cohort 7) completed the baseline version of the MIS. They thus report on the targets that they hope to meet, rather than the actual number and kind of participants served. The following table (Table 20) describes the actual number of youth served by ITEST projects in 2009, and thus does not include the group of projects that has just begun. Rather, it includes the three cohorts of projects that actively implemented their project in 2009. Table 19. Total youth participants 2009 (Cohorts 4, 5, & 6 = 64 projects targeting youth)
Number of projects*
Total youth Range Mean youth per project (SD)
Youth in out‐of‐school settings
49 3696 14‐200 75.4 (40.5)
Youth/students in school settings
26 12731 23‐3100 489.6 (673.4)
Total ‐‐ 16,427 14‐3100 219.0 (440.1) *14 projects from cohorts 4, 5, and 6 target students BOTH in and out of school Table 21 includes only those projects which implemented their project work in 2009 and worked with teachers. The mean number of teachers participating in each project is greater at the higher grade levels. Projects worked with more than 1200 teachers, a mean of 23.6 teachers per project (Table 21a). Table 20. Total teacher participants 2009 (n=53)* # of projects** Total teachers Range K‐2 1 5 NA 3‐5 5 31 1‐15 6‐8 34 378 1‐46 9‐12 45 785 1‐76 Out‐of‐school 9 53 1‐17 *Cohorts 4, 5, & 6 = 53 projects targeting teachers **26 out of the 53 projects from cohorts 4, 5, and 6 target teachers in more than one grade span(e.g., 8th and 9th) Table 21a. Total teacher participants 2009 (n=53)
Total teachers Range Mean teachers per
project (SD) K‐12 and out‐of‐school 1252 1‐80 23.6 (17.7) As with the actual numbers of participants, Tables 22 and 23 provide information about actual dissemination activities implemented in 2009. The most common dissemination activity was the development of a website (81% of projects). Sixty‐six percent of projects reported presenting at research conferences, and 52% at teacher professional conferences. Other

MIS 2009: Implementation results 23
dissemination activities included invited presentations, media, and journal articles (Table *). The development of curriculum and/or instructional materials was the most common dissemination product (69% of projects). Other products include professional development materials, data collection instruments, research findings, videos, and evaluation strategies. Fifteen projects produced games, 13 produced software, and three produced virtual environments (Table 23). Table 21. Actual dissemination activities 2009 (n=64) # of projects % of projects Website 52 81 Conference presentations—research conferences 42 66 Conference presentations—teacher professional conferences 33 52 Invited presentations 25 39 Media (TV, video, radio) 21 33 Journal articles 18 28 Meetings/topical convenings 18 28 Social networking 15 23 Blogs 14 22 Book chapters 7 11 Books 1 2 Other 4 6 *2 projects did not answer this question.
Table 22. Actual products produced 2009 (n=64) # of projects % of projects Curriculum/instructional materials 44 69 Professional development materials/teacher training, etc. 37 58 Instruments (e.g. to assess interest, engagement, persistence, motivation, skills, knowledge or dispositions…) 31 48 Research findings 21 33 Videos 20 31 Evaluation strategies 20 31 Implementation models 17 27 Games 15 23 Software 13 20 Theoretical constructs 5 8 Technology designs 4 6 Virtual environments 3 5 Textbooks 1 2 Other 3 5 *2 projects did not answer this question.

MIS 2009: Project research and evaluation 24
Project research and evaluation The final section describes the data collection methods of ITEST projects. The 2009 MIS asked project PIs to describe their summative evaluation design in an open response format. For this report, those responses were coded using research design definitions also used in the NSF REESE program. As shown in Table 24, 55% of the projects either did not answer the question at all or did not specify the evaluation design in their response. Of the 40 projects that did identify a research design, three are using quasi‐experimental design, one longitudinal, 10 pre‐ and post‐assessments, and 26 are using mixed methods. Table 23. Evaluation Design as Reported by ITEST Projects Active in 2009 (Cohorts 4‐7) (n=89)
Cohort 4 Cohort 5 Cohort 6 Cohort 7 Total
# % # % # % # % # %
Experimental design 0 0 0 0 0 0 0 0 0 0
Quasi‐experimental design 0 0 0 0 1 4 2 9 3 3
Longitudinal 0 0 0 0 0 0 1 4 1 1 Repeated measures: pre‐ and post‐assessments/surveys* 3 18 4 17 2 8 1 4 10 11
Mixed methods 3 18 7 29 6 24 10 43 26 29
Not Stated/Not applicable/Missing** 11 65 13 54 16 64 9 39 49 55
TOTAL 17 100 24 100 25 100 23 100 89 100 Source: MIS 2009. *No project stated that they are using repeated measures, but 10 described using pre‐ and post‐surveys. **Not stated: As an open response question, 33 projects answered the question but did not identify any of the designs in the table. Not applicable: Two projects reported that this question did not apply to their project. Missing: Fourteen projects did not complete this open response item. Tables 25 and 26 describe the youth and teacher outcomes that the projects target, and Tables 27 and 28 describe the methods that are used to collect data for youth and teachers, respectively. Finally, Tables 29 and 30 describe the external outcome metrics that projects collect for youth and teachers. As seen in Table 25, the three most common target outcomes for youth are gains in STEM interest, gains in STEM career interest, and gains in STEM content knowledge. These goals reflect a dual commitment of projects to have an impact on interest as well as content knowledge.

MIS 2009: Project research and evaluation 25
Table 24. Target youth outcomes of project (n=85)* # of projects % of projects Gains in youth interest in STEM 68 81 Gains in youth interest in STEM careers 63 75 Gains in youth STEM content knowledge 62 74 Gains in youths' skills using technology tools 54 64
Gains in youth knowledge of STEM careers, preparation and/or workplace demands 49
58
Gains in youth engagement in STEM 48 59
Gains in youths' skills applying science, technology, engineering and/or math concepts. 40
48
Gains in youth participation in STEM‐related activities 34 41
Changes in youth preparation for STEM careers (technical/scientific training related to a specific career) 18
22
Youth entry into STEM career paths 13 16 Other 10 12 *Missing values vary from 1 to 3 (see Appendix C7). Table 26 shows the target teacher outcomes of ITEST projects. The most common outcome is changes in teacher practice or pedagogy, reflecting the concrete desires of ITEST project teams to see direct changes in classroom practice. Table 25. Target teacher outcomes of project (n=69)*
# of projects % of projects Changes in teacher practice/pedagogy 41 59
Gains in teacher knowledge of how to use cyberinfrastructure/ technology tools in the context of STEM teaching 38 55 Gains in teacher STEM content knowledge 34 49 Gains in teacher implementation of ITEST materials 33 48 Gains in teacher use of cyberinfrastructure/ technology tools 33 48 Gains in teacher knowledge of STEM career information and/or workplace demands 30 43 Other 10 15 *2 projects did not answer this question. Table 27 shows the different data collection methods used to measure youth outcomes. Pre‐ and post‐assessments of both attitudes and skills are by far the most common data collection methods, used by 70 to 79% of projects. However, other forms of data collection are also used, though by a smaller number of projects. These include interviews (45%), performance‐based assessments (31%), embedded assessments (29%), and web‐based data (28%).

MIS 2009: Project research and evaluation 26
Table 26. Data collection methods for youth (n=85) # of projects % of projects Pre‐assessment of youth attitudes 67 79 Post‐assessment of youth attitudes 66 78 Pre‐assessment of youth content/skills 60 71 Post‐assessment of youth content/skills 59 70 ITEST project observations (summer institutes, youth activities) 53 62 Student/youth interviews 38 45 Youth focus groups 33 39 Performance‐based assessments 26 31 Embedded assessments 25 29 Youth web‐based data (blogging, emails, posts) 24 28 Youth self‐reports (journals) 21 25 Other 11 13 As with the youth, the most common form of data collection for teachers are pre‐ and post‐assessments of content and attitudes (Table 28). Surveys of implementation practices are also used by a number of projects. Table 27. Data collection methods for teachers (n=71) # of projects % of projects Pre‐assessment of teacher content/skills 42 59 Pre‐assessment of teacher attitudes 42 59 Post‐assessment of teacher content/skills 40 56 Teacher survey of implementation practices 39 55 Post‐assessment of teacher attitudes 38 54 Classroom observations 32 45 Teacher interviews 32 45 Teacher focus groups 32 45 Teacher self‐reports (journals) 22 31 Teacher web‐based data (blogging, emails, posts) 22 31 Other 12 17 The MIS asked projects to identify, in addition to the instruments they administer to participants, any external outcome metrics they use (Table 29). Based on the data from the MIS, projects collect far fewer external outcome metrics than the instruments they administer. For youth, 33% collect examples of student academic work, and 30% document participation in high school courses. Thirty percent of projects also use videos of students. Only seven projects collect information about college majors.

MIS 2009: Project research and evaluation 27
Table 28. External youth outcome metrics (n=76) # of projects % of projects Examples of student academic work 25 33 Participation in high school courses 23 30 Videos of students and/or teachers 23 30 Participation in advanced STEM classes 20 26 Participation in science fair or other STEM competitions 15 20 Standardized test scores 15 20 Selection of post‐high school career/school pathway 15 20 High school grades 12 16 Participation in additional extracurricular activities 11 14 Participation in STEM‐related work experience 9 12 College major 7 9 Participation in college courses 3 4 Other 16 21 *9 missing cases. External teacher outcome metrics are also not collected by very many projects (Table 30). Interestingly, 20 projects collect videos of their teachers, a potentially rich data source to document patterns of teaching practices. Table 29. External teacher outcome metrics (n=63)* # of projects % of projects Examples of teacher class plans 21 33 Videos of students and/or teachers 20 32 Competency/skills progress reports 8 13 Other 15 24 *8 missing cases. Finally, Tables 31 and 32 provide background information on the data collection patterns of ITEST projects. More than 90% of projects collect demographic information about their participants, and 68% collect contact information for post‐project follow‐up. Similarly, 94% of projects obtain permission from participants for data collection during the project, while 41% of projects obtain permission to collect data after the project is completed, and 24% obtain permission to request school records. Table 30. Participant‐level data collection (n=85) # of projects % of projects Demographics 78 92 Contact information for post‐project follow‐up 58 68 Other 6 7 *3 missing cases.

MIS 2009: Project research and evaluation 28
Table 31. Permissions obtained from participants (n=86) # of projects % of projects Data collection during project 81 94 Project participation 80 93 Photo releases 71 83 Video releases 62 72 Data collection after participant has left/completed project 35 41 School records 21 24 Other 7 8 *2 missing cases.

MIS 2009: Conclusion 29
Conclusion MIS Development The development of the MIS has incorporated feedback from many different stakeholders at every stage of the process: ITEST principal investigators, evaluators, NSF program officers, and others developing similar systems. Feedback on this report, together with ongoing feedback that we have been collecting during the data collection process, will be used to revise the MIS for the second year of data collection. MIS data collection As noted in the report, 82% (89 of 108) currently funded projects completed the MIS. All PIs were able to access the online questionnaire with minimal technological challenges. LRC staff conducted follow‐up phone calls with many of the PIs to clarify results and improve the quality of the data. Revisions will consider ways to increase participation, improve the online interface, and improve data accuracy. MIS results The information in this preliminary report provides a snapshot of active ITEST projects in 2009. Sixty‐six of the projects had completed their first, second, or third year of implementation, and reported on specific participants and outcomes for 2009. Twenty‐three projects were just starting up and therefore completed the baseline version of the MIS, reporting on targeted outcomes. Among the 89 projects, 87 of them work with youth in some form, while 71 work with teachers. In 2009, a total of 16,427 youth and 1,199 teachers were involved in the 66 active projects. Among the 66 active projects, the most common dissemination activities were websites and conference presentations, and the most common dissemination products were curriculum materials and instructional development materials. All projects were asked about their targeted outcomes and their instruments to measure the outcomes. The most common targeted outcomes for youth are gains in youth interest in STEM, in STEM careers, and gains in youth STEM content knowledge. For teachers, the most common targeted outcomes are changes in teacher practice and pedagogy. For both youth and teachers, the most common instruments for data collection are pre‐ and post‐assessments of attitudes and skills. A smaller number of projects collect external outcome metrics, such as high school grades for youth, or teacher class plans. When looking at the results by cohort, in many areas there has been consistency across the years. Environmental Science, Computer Science, and Engineering have consistently been the three most common thematic areas for ITEST projects. The way that these content areas are delivered has seen a change; in recent years ITEST projects have moved from the out‐of‐school setting towards more projects focusing on the school day. There has also been an increased focus on social networking in recent ITEST projects. Future reports will look at changes both within projects as their work is implemented, as well as between projects over time.

MIS 2009: Conclusion 30
The MIS process appears to be a potentially accessible and useful tool for collecting information across the ITEST portfolio. The ITEST community of practice responded well to this first test of the MIS, likely due to their involvement in its design and development and their ongoing relationship with the LRC. Given the success of the first stage and the growing interest in research about ITEST projects, the MIS has potential to provide data that can be used to answer research questions shared across the portfolio. Revisions and additions to the MIS to address these interests will be explored as we prepare for the second round of data collection in 2010.

MIS 2009: Appendices
Appendix A. All projects by cohort
Table A2. ITEST project type (n=89).
Cohort 4 Cohort 5 Cohort 6 Cohort 7 n=17 % n=24 % n=25 % n=23 %
Comprehensive 11 65 13 54 0 0 0 0 Conference/Workshop 0 0 0 0 0 0 2 9 Scale‐Up 0 0 0 0 0 0 3 13 Strategies 0 0 0 0 23 92 17 74 Studies 0 0 0 0 2 8 1 4 Youth‐Based 6 35 11 46 0 0 0 0 Table A3. ITEST area of primary focus (n=89).
Cohort 4 Cohort 5 Cohort 6 Cohort 7 n=17 % n=24 % n=25 % n=23 %
Bioscience 1 6 2 8 3 12 2 9 Computer Science 7 41 10 42 12 48 6 26 Engineering 6 35 7 29 5 20 5 22 Environmental Science 2 12 5 21 4 16 6 26 Mathematics 1 6 0 0 0 0 2 9 Convening 0 0 0 0 0 0 2 9 Research 0 0 0 0 1 4 0 0
Table A1. Total projects and number of projects that completed MIS data collection form Cohort # of projects that completed MIS Total projects
Cohort Four 17 24* Cohort Five 24 28** Cohort Six 25 29 Cohort Seven 23 27*** Total 89 108 *Excluding one originally funded, but org went out of business in their second year, so not asked to complete.**Excluding 1‐year WGBH media resources project not asked to complete.***Not counting the 2 that were funded January 1, and not asked to complete for this round.

MIS 2009: Youth participants, by cohort 2
Figure A1. Targeted population of ITEST projects (n=89).

MIS 2009: Youth participants, by cohort 3
Figure A2. ITEST project settings for working with youth (n=87)

MIS 2009: Youth participants, by cohort 4
Figure A3. ITEST project settings for working with teachers (n=71).

MIS 2009: Youth participants, by cohort 5
Table A4. Number of projects targeting specific geographic locations (n=85) Cohort 4 Cohort 5 Cohort 6 Cohort 7 n=17 % n=24 % n=23 % n=21 %
Urban 11 65 21 88 19 83 16 76 Rural 10 59 7 29 11 48 10 48 Suburban 6 35 9 38 11 48 8 38 Targets more than one location 6 35 10 42 13 57 8 38 Table A5. Technologies used in project (n=88)*
Cohort 4 Cohort 5 Cohort 6 Cohort 7 n=17 %** n=24 %** n=24 %** n=23 %**
Visualization/computer modeling tools
6 35 11 46 10 42 6 27
Programming tools 9 53 10 43 8 33 5 23 Data analysis/computation tools 2 12 11 46 7 32 11 48 Multi‐media tools 4 24 11 46 4 17 10 45 Communication tools (email, messaging, blogs, video conferencing)
2 12 8 33 7 29 12 55
Game development 4 24 5 23 7 29 4 18 Engineering/design tools 5 29 5 23 7 29 2 9 Social networking tools 1 6 5 22 2 9 10 43 Electronics/robotics tools 7 41 5 22 2 9 4 18 Geospatial technologies (GIS/GPS/RS)
3 18 6 25 4 19 4 18
Hand‐held devices 2 12 4 17 4 17 4 18 Imaging technologies 0 0 6 26 3 13 1 5 Virtual reality 3 18 1 5 1 4 4 18 Other 2 12 1 4 4 17 5 23 *One project was classified as “Studies” and therefore not included.**Percentages based on actual respondents. Each category had 1‐3 missing values.

MIS 2009: Youth participants, by cohort 6
Table A6. Technology skills promoted in project (n=88)*
Cohort 4 Cohort 5 Cohort 6 Cohort 7 n=17 %** n=24 %** n=24 %** n=23 %**
Visualization/modeling skills 5 29 10 45 13 54 7 30 Computing/data analysis skills 4 24 12 50 9 38 9 39 Programming skills 9 56 9 43 6 26 4 18 Communication/social networking skills
1 6 7 29 6 26 13 57
Digital media skills (photos, imovie, music...)
3 18 11 48 6 26 6 27
Computational thinking skills 6 35 2 9 8 33 9 41 Computer driven equipment skills (e.g. CAM, Robotics…)
8 47 5 23 4 17 3 14
Data management skills 2 12 9 39 3 13 4 18 Web development skills 4 24 6 27 0 0 4 18 Other 3 18 1 4 2 9 6 27 *One project was classified as “Studies” and therefore not included.**Percentages based on actual respondents (# primary focus / (88 ‐ # missing)) Table A7. Other participants in ITEST projects (n=89).
Cohort 4 Cohort 5 Cohort 6 Cohort 7 n=17 % n=24 % n=25 % n=23 %
Undergraduate student volunteers/paid
13 76 15 63 14 56 10 43
Graduate student volunteers/paid
10 59 17 71 13 52 10 43
Community volunteers 3 18 10 42 11 44 5 22 Parents 5 29 8 33 5 20 9 39 Undergraduate student volunteers/unpaid
4 24 3 13 9 36 9 39
Graduate student volunteers/unpaid
2 12 6 25 3 12 10 43
Tribal elders 0 0 2 8 0 0 0 0 Other 4 24 5 21 4 16 9 39 Does not apply 1 6 0 0 4 16 3 13

MIS 2009: Youth participants, by cohort 7
Table A8. Partner institutions in ITEST projects (n=89).
Cohort 4 Cohort 5 Cohort 6 Cohort 7 n=17 % n=24 % n=25 % n=23 %
K‐12 Schools 15 88 18 75 21 84 19 83 College/University 12 71 20 83 20 80 19 83 Business/Industry 14 82 19 79 16 64 18 78 Community‐based organization 6 35 12 50 11 44 7 30 Informal science education organization
4 24 10 42 8 32 9 39
Not‐for‐profit organization 4 24 10 42 10 40 7 30 Government laboratory 1 6 9 38 1 4 6 26 Historically Black Colleges and Universities
2 12 0 0 4 16 3 13
Hispanic Serving Institutions 0 0 3 13 1 4 3 13 Other Minority Serving Institutions
0 0 1 4 1 4 1 4
Other 0 0 0 0 4 16 3 13 Does not apply 0 0 0 0 1 4 0 0 Table A9. Partner institution activities (n=88)*.
Cohort 4 Cohort 5 Cohort 6 Cohort 7 n=16 % n=24 % n=25 % n=23 %
Participate in delivery of program
11 69 20 83 17 68 17 74
Assist with recruitment 14 88 14 58 14 56 14 61 Provide field trip sites, shadowships
6 38 17 71 13 52 12 52
Provide tools/equipment/use of laboratory facilities
7 44 18 75 11 44 12 52
Provide real world problems for students to solve
3 19 15 63 7 28 13 57
Provide mentors 8 50 11 46 7 28 11 48 Contribute to dissemination 7 44 7 29 10 40 12 52 Volunteer in classroom/team teaching of lessons
3 19 10 42 10 40 7 30
Provide incentives for participation (prizes, meals, events)
3 19 8 33 7 28 9 39
Provide internships/externships 3 19 6 25 6 24 3 13 Provide funding 2 13 5 21 2 8 6 26 Provide employment to ITEST participants (part/full time)
2 13 5 21 0 0 0 0
Other 0 0 0 0 4 16 0 0

MIS 2009: Youth participants, by cohort 8
*One project from Cohort 4 did not answer this question.Table A10. Target audience of dissemination (n=88)*
Cohort 4 Cohort 5 Cohort 6 Cohort 7 n=17 % n=24 % n=24 % n=23 %
Educators 17 100 22 92 20 83 23 100 Researchers 9 53 10 42 15 63 19 83 Youth 8 47 12 50 14 58 14 61 Parents 7 41 9 38 8 33 16 70 Public 7 41 8 33 9 38 14 61 Policymakers 4 24 5 21 11 46 15 65 Other 0 0 1 4 2 8 3 13 *One project from cohort 6 did not answer this question. Table A11. Number of projects targeting youth populations by race/ethnicity (n=85)
Cohort 4 Cohort 5 Cohort 6 Cohort 7 n=17 % n=24 % n=23 % n=21 %
African American 13 76 19 83 19 86 18 90 Hispanics 13 76 19 83 18 82 16 89 American Indian 2 13 7 32 7 33 3 18 Pacific Islanders 2 13 4 18 3 14 1 6 Alaska Natives 0 0 2 9 2 10 1 6 Native Hawaiians 0 0 1 5 0 0 0 0 *Total is more than 85 because projects work with more than one group.**Percentages based on actual respondents. Each category had 1‐4 missing values. Table A12. Number of projects targeting specific youth populations (n=85)
Cohort 4 Cohort 5 Cohort 6 Cohort 7 n=17 % n=24 % n=23 % n=21 %
Students qualifying for free/ reduced price lunch
9 53 18 78 16 73 18 86
English language learners (ELL) 4 25 5 22 9 41 9 47 Students with disabilities 4 25 4 17 4 19 6 32 Students participating in gifted/ talented programs
4 25 3 13 2 10 4 21
Only girls 1 6 0 0 6 27 1 5 *Total is more than 85 because projects work with more than one group.**Percentages based on actual respondents. Each category had 1‐4 missing values.

MIS 2009: Youth participants, by cohort 9
Table A13. Number of projects targeting youth at specific grade levels (n=85)
Cohort 4 Cohort 5 Cohort 6 Cohort 7 n=17 % n=24 % n=23 % n=21 %
K‐2 1 6 0 0 0 0 0 0 3‐5 targeted 1 6 2 8 1 4 5 24 6‐8 targeted 14 82 14 58 14 61 10 48 9‐12 targeted 14 82 21 88 14 61 18 86 * Total is greater than 85 because some projects targeted grades across the grade groups (e.g., targeting 5th and 6th grades). Table A14. Number of projects and size of targeted youth populations (n=85)
Cohort 4 Cohort 5 Cohort 6 Cohort 7 n=17 % n=24 % n=23 % n=21 %
Fewer than 25 youth 2 12 2 8 2 9 1 5 25‐50 youth 2 12 3 13 5 22 3 14 51‐100 youth 6 35 6 25 6 26 2 10 More than 100 youth 7 41 13 54 9 39 15 71 Table A15. Formats of working with youth/students (n=84)*
Cohort 4 Cohort 5 Cohort 6 Cohort 7 n=17 % n=24 % n=22 % n=21 %
1‐2 week summer sessions 8 47 16 67 10 45 7 33 After school 3 18 13 54 14 64 9 43 In school 5 29 10 42 8 36 15 71 Weekend 5 29 7 29 6 27 9 43 Online/social networking 1 6 5 21 4 18 11 52 >2 weeks summer session 4 24 7 29 4 18 2 10 Youth employment/internship 2 12 3 13 3 14 1 5 Distance learning 1 6 2 8 1 5 2 10 Other 0 0 0 0 1 5 0 0 Does not apply 1 6 1 4 1 5 0 0 *One project from cohort 6 did not complete this question.

MIS 2009: Youth participants, by cohort 10
Table A16. Primary focus areas with YOUTH (n=85)*
Cohort 4 Cohort 5 Cohort 6 Cohort 7 n=17 % n=24 % n=23 % n=21 %
Technology‐based learning (computer‐based, game‐based)
11 65 14 58 18 78 18 86
Career skills development (lab work, engineering or science lab, using tools, equipment and instruments found in STEM careers)
12 71 14 58 11 48 11 52
Classroom work (academic content learning, in‐class projects, guest speakers)
10 59 10 43 11 50 9 43
Participation of scientists/engineers/technologists
4 24 12 52 7 30 11 52
Field work (internships/externships, experiential learning, out of school projects, skills training)
4 24 10 42 8 36 7 33
Career development (creating a career plan, providing information about career pathways)
4 24 7 30 5 23 8 38
Youth mentoring 2 12 2 9 3 14 10 48 Engagement of STEM researchers 1 6 8 35 1 5 6 29 Engagement of parents/caregivers
2 12 4 17 2 9 1 5
*Percentages based on actual respondants Table A17. Number of projects identifying barriers to youth participation, (n=85)
Cohort 4 Cohort 5 Cohort 6 Cohort 7 n=17 % n=24 % n=23 % n=21 %
Time 9 53 9 38 8 35 11 52 Transportation 6 35 16 67 8 35 2 10 Competing programs 6 35 6 25 6 26 7 33 Resources 4 24 9 38 4 17 5 24 Other commitments 6 35 5 21 4 17 7 33 Interest of participants 5 29 7 29 2 9 5 24 Peer pressure 1 6 3 13 2 9 1 5 Other 2 12 5 21 3 13 6 29 Does not apply 5 29 1 4 6 26 2 10

MIS 2009: Youth participants, by cohort 11
Table A18. Partners/strategies for recruiting youth (n=85)
Cohort 4 Cohort 5 Cohort 6 Cohort 7 n=17 % n=24 % n=23 % n=21 %
School contacts 14 82 21 88 19 83 13 62 Teacher‐to‐student 11 65 16 67 18 78 15 71 District or school administrators 13 76 18 75 14 61 14 67 Youth‐to‐youth 3 18 13 54 10 43 7 33 Partners 2 12 13 54 7 30 10 48 Parents 6 35 11 46 6 26 7 33 Existing participant pool 6 35 11 46 5 22 6 29 Community groups 5 29 6 25 5 22 4 19 University partnerships 4 24 7 29 2 9 6 29 TV, radio, newspapers, PSAs 3 18 3 13 0 0 2 10 Informal contact 0 0 5 21 3 13 0 0 Other 1 6 3 13 0 0 1 5

MIS 2009: Implementation results, by cohort 12
Figure A4. Percentage of projects by size of teacher groups (n=67)
*One project from cohort 4 did not answer this question. **One project that works with teachers works only with after school and pre‐certification teachers.

MIS 2009: Implementation results, by cohort 13
Table A19. Formats of working with teachers (n=68)* Cohort 4 Cohort 5 Cohort 6 Cohort 7 n=14 % n=20 % n=19 % n=15 % Summer program 9 64 14 70 12 63 11 73 After school program 4 29 11 55 9 47 6 40 Summer youth institute 5 36 14 70 10 53 1 7 Online social networking 2 14 7 35 3 16 10 67 Weekend program 4 29 8 40 4 21 4 27 Distance learning 3 21 5 25 2 11 5 33 Does not apply 0 0 0 0 1 5 0 0 Other 3 21 3 15 3 16 4 27 *Two projects are convenings and one project from cohort 4 did not complete this question. Table A20. Primary focus areas with TEACHERS (n=69)*
Cohort 4 Cohort 5 Cohort 6 Cohort 7 n=15 %** n=20 %** n=19 %** n=15 %**
Technology‐based learning (computer‐based, game‐based)
10 71 13 65 16 84 13 87
Classroom work (academic content learning, in‐class projects, guest speakers)
9 64 7 37 10 53 10 67
Career skills development (lab work, engineering or science lab, using tools, equipment and instruments found in STEM careers)
8 57 10 53 6 32 4 27
Field work (internships/externships, experiential learning, out of school projects, skills training)
4 31 8 40 4 21 4 27
Participation of scientists/ engineers/ technologists
0 0 7 39 7 37 4 27
Youth mentoring 2 15 5 25 4 21 3 20 Career development (creating a career plan, providing information about career pathways)
1 8 3 16 4 21 3 20
Engagement of STEM researchers
0 0 6 32 2 11 3 20
Engagement of parents/caregivers
1 8 1 5 0 0 0 0
*Two projects are convenings

MIS 2009: Implementation results, by cohort 14
**Percentages based on actual respondants Table A21 . Number of projects identifying barriers to teacher participation, (n=67)*
Cohort 4 Cohort 5 Cohort 6 Cohort 7 n=13 % n=18 % n=19 % n=15 %
Time 9 69 14 78 11 58 13 87 Other commitments 8 62 7 39 9 47 9 60 Competing programs 2 15 8 44 3 16 7 47 Interest of participants 2 15 6 33 2 11 5 33 Resources 2 15 4 22 2 11 3 20 Transportation 2 15 1 6 1 5 0 0 Other 1 8 2 11 3 16 4 27 Does not apply 2 15 2 11 3 16 1 7 *Two projects are convenings and two projects did not answer this question, one from Cohort 4 and the other from Cohort 5. Table A22. Partners/strategies for recruiting teachers (n=70)*
Cohort 4 Cohort 5 Cohort 6 Cohort 7 n=15 % n=20 % n=20 % n=15 %
District or school administrators 10 67 17 85 17 85 14 93 School contacts 11 73 16 80 11 55 11 73 Teacher to teacher 9 60 15 75 13 65 10 67 Existing participant pool 5 33 10 50 6 30 4 27 University partnerships 3 20 8 40 4 20 5 33 Partners 2 13 6 30 5 25 6 40 Community groups 1 7 4 20 2 10 1 7 TV, radio, newspapers, PSAs 1 7 2 10 1 5 1 7 Informal setup 0 0 0 0 1 5 0 0 Other 4 27 3 15 1 5 1 7 *Does not include one convening project Table A23a. Total youth participants 2009, Cohort 4 (n=17)
Number of
projects* Total youth Range
Mean youth per project
(SD) Youth in out‐of‐school settings 13 1072 14‐200 82.5 (54.3) Youth/students in school settings 7 3311 40‐1100 473.0 (409.6)Total ‐‐ 4,383 14‐1100 219.2 (302.3)*4 projects from cohort 4 target students BOTH in and out of school

MIS 2009: Implementation results, by cohort 15
Table A23b. Total youth participants 2009, Cohort 5 (n=24)
Number of
projects* Total youth Range
Mean youth per project
(SD) Youth in out‐of‐school settings 18 1350 20‐120 75.0 (32.5) Youth/students in school settings 11 5544 60‐3100 504.0 (886.9)Total ‐‐ 6,894 20‐3100 237.7 (571.3)*6 projects from cohort 5 target students BOTH in and out of school Table A23c. Total youth participants 2009, Cohort 6 (n=23)
Number of
projects* Total youth Range
Mean youth per project
(SD) Youth in out‐of‐school settings 18 1274 24‐150 70.8 (38.8) Youth/students in school settings 8 3876 23‐1800 484.5 (593.0)Total ‐‐ 5,150 23‐1800 198.1 (370.6)*4 projects from cohort 6 target students BOTH in and out of school Table A24. Total teacher participants 2009 (n=53) Cohort 4 (n=14) Cohort 5 (n=20) Cohort 6 (n=19)
# of projects
**
Total teachers
Range # of
projects***
Total teachers
Range # of
projects****
Total teachers
Range
K‐2 1 0 NA 1 5 NA 0 0 NA 3‐5 3 13 1‐10 1 15 NA 5 3 1‐15 6‐8 12 158 3‐46 9 97 2‐20 13 123 1‐25 9‐12 13 223 2‐44 19 320 1‐43 13 242 1‐76 Out‐of‐school
1 1 NA 5 22 1‐9 3 30 1‐17
*One project from cohort 4 did not answer this question**11 projects from cohort 4 target teachers in more than one grade span(e.g., 8th and 9th) ***8 projects from cohort 5 target teachers in more than one grade span****7 projects from cohort 6 target teachers in more than one grade span Table A25a. Total teacher participants 2009 (n=53) Cohort 4 Cohort 5 Cohort 6 (n=14)* (n=20) (n=19) Total teachers, K‐12 and out‐of‐school 395 459 398 Range 1‐46 1‐43 1‐76

MIS 2009: Implementation results, by cohort 16
Mean teachers per project (SD) 13.6 (13.1) 13.1 (11.1) 13.3 (15.3) Table A25b. Total teacher participants (n=67) Cohort 4 Cohort 5 Cohort 6 Cohort 7 (n=14)* (n=20) (n=19) (n=14)** Total teachers, K‐12 and out‐of‐school 395 459 398 307 Range 1‐46 1‐43 1‐76 1‐55 Mean teachers per project (SD) 13.6 (13.1) 13.1 (11.1) 13.3 (15.3) 12.8 (10.7) *One project from cohort 4 did not answer this question** One project that works with teachers works only with after school and pre‐certification teachers. Table A26. Actual dissemination activities 2009 (n=64)*.
Cohort 4 Cohort 5 Cohort 6 n=17 % n=24 % n=23 %
Website 14 82 21 88 17 74 Conference presentations—research conferences
16 94 14 58 12 52
Conference presentations—teacher professional conferences
11 65 12 50 10 43
Invited presentations 8 47 9 38 8 35 Media (TV, video, radio) 6 35 9 38 6 26 Journal articles 5 29 8 33 5 22 Meetings/topical convenings 4 24 8 33 6 26 Social networking 1 6 10 42 4 17 Blogs 2 12 9 38 3 13 Book chapters 3 18 3 13 1 4 Books 0 0 1 4 0 0 Other 1 6 1 4 2 9 *Two projects from cohort 6 did not answer this question.

MIS 2009: Implementation results, by cohort 17
Table A27. Actual products produced 2009 (n=64)* .
Cohort 4 Cohort 5 Cohort 6 n=17 % n=22 % n=25 %
Curriculum/instructional materials 13 76 15 68 16 64 Professional development materials/teacher training, etc.
9 53 12 55 16 64
Instruments (e.g. to assess interest, engagement, persistence, motivation, skills, knowledge or dispositions…)
6 35 12 55 13 52
Research findings 6 35 10 45 5 20 Videos 4 24 10 45 6 24 Evaluation strategies 3 18 6 27 11 44 Implementation models 3 18 4 18 10 40 Games 4 24 4 18 7 28 Software 3 18 6 27 4 16 Theoretical constructs 0 0 1 5 4 16 Technology designs 1 6 1 5 2 8 Virtual environments 1 6 0 0 2 8 Textbooks 0 0 1 5 0 0 Other 0 0 1 5 1 4 *Two projects from cohort 5 did not answer this question.

MIS 2009: Project research and evaluation, by cohort 18
Table A28. Target youth outcomes of project (n=85) Cohort 4 Cohort 5 Cohort 6 Cohort 7 n=17 %* n=24 %* n=23 %** n=21 %*
Gains in youth interest in STEM 13 76 20 83 17 77 18 86 Gains in youth interest in STEM careers
9 53 19 79 16 73 19 90
Gains in youth STEM content knowledge
10 59 21 88 13 59 18 86
Gains in youths' skills using technology tools
10 59 18 75 14 64 12 57
Gains in youth knowledge of STEM careers, preparation and/or workplace demands
6 35 15 63 13 59 15 71
Gains in youth engagement in STEM
7 41 13 54 13 59 15 71
Gains in youths' skills applying science, technology, engineering and/or math concepts.
8 47 12 50 8 40 12 57
Gains in youth participation in STEM‐related activities
6 35 10 42 5 23 13 62
Changes in youth preparation for STEM careers (technical/scientific training related to a specific career)
2 12 7 29 4 20 5 24
Youth entry into STEM career paths
2 12 5 21 2 10 4 19
Other 0 0 0 0 5 25 5 24 *Percentages based on actual respondents. **Cohort 6 had 1‐3 missing values.

MIS 2009: Project research and evaluation, by cohort 19
Table A29. Target teacher outcomes of project (n=69)*
Cohort 4 Cohort 5 Cohort 6 Cohort 7 n=15 % n=20 % n=18 % n=16 %
Changes in teacher practice/pedagogy
9 60 14 70 5 28 13 81
Gains in teacher knowledge of how to use cyberinfrastructure/ technology tools in the context of STEM teaching
8 53 10 50 9 50 11 69
Gains in teacher STEM content knowledge
7 47 10 50 8 44 9 56
Gains in teacher implementation of ITEST materials
7 47 11 55 5 28 10 63
Gains in teacher use of cyberinfrastructure/ technology tools
5 33 10 50 5 28 13 81
Gains in teacher knowledge of STEM career information and/or workplace demands
5 33 7 35 8 44 10 63
Other 0 0 0 0 6 33 4 25 Two projects from cohort 6 did not answer this question Table A30. Data collection methods for youth (n=85)
Cohort 4 Cohort 5 Cohort 6 Cohort 7 n=17 % n=24 % n=23 % n=21 %
Pre‐assessment of youth attitudes
13 76 19 79 16 70 19 90
Post‐assessment of youth attitudes
13 76 20 83 13 57 20 95
Pre‐assessment of youth content/skills
12 71 20 83 13 57 15 71
Post‐assessment of youth content/skills
12 71 20 83 10 43 17 81
ITEST project observations (summer institutes, youth activities)
9 53 16 67 14 61 14 67
Student/youth interviews 3 18 14 58 7 30 14 67 Youth focus groups 7 41 13 54 6 26 7 33 Performance‐based assessments 2 12 12 50 4 17 8 38 Embedded assessments 6 35 7 29 4 17 8 38 Youth web‐based data (blogging, emails, posts)
5 29 7 29 3 13 9 43
Youth self‐reports (journals) 5 29 6 25 5 22 5 24

MIS 2009: Project research and evaluation, by cohort 20
Other 1 6 1 4 3 13 6 29 Table A31. Data collection methods for teachers (n=71)
Cohort 4 Cohort 5 Cohort 6 Cohort 7 n=15 % n=20 % n=20 % n=16 %
Pre‐assessment of teacher content/skills
10 67 11 55 11 55 10 63
Pre‐assessment of teacher attitudes
8 53 10 50 11 55 13 81
Post‐assessment of teacher content/skills
10 67 11 55 8 40 11 69
Post‐assessment of teacher attitudes
8 53 10 50 7 35 13 81
Classroom observations 9 60 9 45 5 25 9 56 Teacher survey of implementation practices
7 64 10 53 8 47 14 88
Teacher interviews 4 27 10 50 6 30 12 75 Teacher focus groups 6 40 9 45 8 40 9 56 Teacher self‐reports (journals) 5 33 7 35 4 20 6 38 Teacher web‐based data (blogging, emails, posts)
1 7 8 40 4 20 9 56
Other 0 0 1 5 4 20 7 44

MIS 2009: Project research and evaluation, by cohort 21
Table A32. External youth outcome metrics (n=76)*
Cohort 4 Cohort 5 Cohort 6 Cohort 7 n=12 % n=23 % n=20 % n=21 %
Examples of student academic work
1 8 10 43 5 25 9 43
Participation in high school courses
3 25 4 17 5 25 9 43
Videos of students and/or teachers
2 17 8 35 2 10 11 52
Participation in advanced STEM classes
2 17 4 17 4 20 10 48
Participation in science fair or other STEM competitions
0 0 6 26 1 5 8 38
Standardized test scores 1 8 4 17 3 15 7 33 Selection of post‐high school career/school pathway
2 17 6 26 3 15 4 19
High school grades 0 0 4 17 4 20 4 19 Participation in additional extracurricular activities
1 8 4 17 1 5 5 24
Participation in STEM‐related work experience
1 8 2 9 2 10 4 19
College major 1 8 3 13 1 5 2 10 Participation in college courses 0 0 0 0 2 10 1 5 Other 3 25 3 13 4 20 6 29 *9 missing cases. Table A33. External teacher outcome metrics (n=63)*
Cohort 4 Cohort 5 Cohort 6 Cohort 7 n=11 % n=19 % n=17 % n=16 %
Examples of teacher class plans 5 45 8 42 1 6 7 44 Videos of students and/or teachers
2 18 8 42 1 6 9 56
Competency/skills progress reports
0 0 2 11 1 6 5 31
Other 3 27 3 16 5 29 4 25 *8 missing cases.

MIS 2009: Project research and evaluation, by cohort 22
Table A34. Participant‐level data collection (n=85)*
Cohort 4 Cohort 5 Cohort 6 Cohort 7 n=17 % n=24 % n=22 % n=22 %
Demographics 15 88 22 92 20 91 21 95 Contact information 10 59 18 75 14 64 16 73 Other 0 0 1 4 2 9 3 14 *One project was classified as “Studies” and therefore not included.*Also, two projects from cohort 6 as well as 1 project from cohort 7 did not answer this question Table A35. Permissions obtained from participants (n=86)*
Cohort 4 Cohort 5 Cohort 6 Cohort 7 n=17 % n=23 % n=23 % n=23 %
Data collection during project 17 100 21 91 22 96 21 91 Project participation 16 94 22 96 22 96 20 87 Photo releases 12 71 21 91 18 78 20 87 Video releases 10 59 19 83 14 61 19 83 Data collection after participant has left/completed project
7 41 9 39 7 30 12 52
School records 4 24 4 17 3 13 10 43 Other 0 0 1 4 4 17 2 9 *One project was classified as “Studies” and therefore not included.*Also, one project from cohort 5 as well as 1 project from cohort 6 did not answer this question

MIS 2009: Appendices 23
Table A36. ITEST area of primary focus (n=89). Cohort 4 Cohort 5 Cohort 6 Cohort 7 n=17 % n=24 % n=25 % n=23 %
Bioscience 1 6 2 8 2 8 1 4 Bioinformatics 0 0 0 0 1 4 0 0 Biotechnology 0 0 0 0 0 0 1 4 Computer Science ‐ Programming and Other
1 6 5 21 3 12 2 9
General Skills & Mathematics 1 6 1 4 1 4 0 0 Audio, Video and Animation 0 0 0 0 0 0 1 4 Programming 2 12 2 8 2 8 0 0 Web Development 0 0 0 0 0 0 1 4 Computer Science ‐ Gaming & Simulations
3 18 2 8 6 24 2 9
Engineering 0 0 0 0 3 12 3 13 Aerospace 0 0 0 0 0 0 1 4 Astronomy 0 0 1 4 1 4 0 0 Design 3 18 4 17 1 4 0 0 Nanotechnology 0 0 2 8 0 0 0 0 Robotics 3 18 0 0 0 0 1 4 Environmental Science 2 12 3 13 3 12 4 17 Ecological Research & Analysis 0 0 0 0 0 0 1 4 GIS/GPS 0 0 2 8 0 0 1 4 Remote sensing technology 0 0 0 0 1 4 0 0 Mathematics 1 6 0 0 0 0 2 9 Convening 0 0 0 0 0 0 2 9 Research 0 0 0 0 1 4 0 0

MIS 2009: Appendices 24
Table A37. Partner institution activities (n=88)*.
Cohort 4 Cohort 5 Cohort 6 Cohort 7 n=16 % n=24 % n=25 % n=23 %
Participate in delivery of program 11 69 20 83 17 68 17 74 Assist with recruitment 14 88 14 58 14 56 14 61 Provide field trip sites, shadowships
6 38 17 71 13 52 12 52
Provide tools/equipment/use of laboratory facilities
7 44 18 75 11 44 12 52
Provide real world problems for students to solve
3 19 15 63 7 28 13 57
Provide mentors 8 50 11 46 7 28 11 48 Contribute to dissemination 7 44 7 29 10 40 12 52 Volunteer in classroom/team teaching of lessons
3 19 10 42 10 40 7 30
Provide incentives for participation (prizes, meals, events)
3 19 8 33 7 28 9 39
Provide internships/externships 3 19 6 25 6 24 3 13 Provide funding 2 13 5 21 2 8 6 26 Provide employment to ITEST participants (part/full time)
2 13 5 21 0 0 0 0
Other 0 0 0 0 4 16 0 0 *One project from Cohort 4 did not answer this question. Table A38. Project provides teacher credentials/certification/qualifications/continuing education credits/licensing (n=69)* Cohort 4 Cohort 5 Cohort 6 Cohort 7 n=15 % N=20 % n=19 % n=15 % Yes 9 60 14 70 11 58 9 60 No 5 33 5 25 5 26 3 20 Don't know/NA/ Missing 1 7 1 5 3 16 3 20 *Does not include two Convening projects.

MIS 2009: Appendices 25
Appendix B. Additional tables. Table B1. ITEST area of general and sub‐field focus (n=89)
# of projects % of projects
Bioscience 6 7
Bioinformatics 1 1 Biotechnology 1 1 Computer Science ‐ Programming and Other 11 12 Programming 6 7 General Skills and Mathematics 3 3 Multimedia ‐ Audio, Video and Animation 1 1 Web Development 1 1 Computer Science ‐ Gaming & Simulations 13 15 Engineering 6 7 Design 8 9 Robotics 4 5 Astronomy 2 2 Nanotechnology 2 2 Aerospace 1 1 Environmental Science 12 14 GIS/GPS 3 3 Ecological Research and Analysis 1 1 Remote sensing Technology 1 1 Mathematics 3 3 Convenings 2 2 Studies 1 1

MIS 2009: Appendices 26
Table B2. Partner institution activities (n=88)*
Number of projects
% of projects
Participate in delivery of program 65 74% Assist with recruitment 56 64% Provide field trip sites, shadowships 48 55% Provide tools/equipment/use of laboratory facilities 48 55% Provide real world problems for students to solve 38 43% Provide mentors 37 42% Contribute to dissemination 36 41% Volunteer in classroom/team teaching of lessons 30 34% Provide incentives for participation (prizes, meals, events) 27 31% Provide internships/externships 18 20% Provide funding 15 17% Provide employment to ITEST participants (part/full time) 7 8% Other 4 5% *One project did not answer this question. Table B3. Project provides teacher credentials/certification/qualifications/continuing education credits/licensing Frequency Percent Yes 43 62% No 18 26% Don't know/Does not apply/Missing 7 10% Total 69 100%

MIS 2009: Appendices 27
Appendix C. Missing values. Missing values occur when a project did not answer question component. Table C1. Technologies used in project (n=88)*
# of projects with primary
focus
# of projects using
component
% of projects with primary
focus # missing
Visualization/computer modeling tools 33 64 38 1 Programming tools 32 52 37 2 Data analysis/computation tools 31 62 36 2 Multi‐media tools 29 68 34 2 Communication tools (email, messaging, blogs, video conferencing)
29 74 33 1
Game development 20 37 24 3 Engineering/design tools 19 41 22 3 Social networking tools 18 51 21 2 Electronics/robotics tools 18 32 21 3 Geospatial technologies (GIS/GPS/RS) 17 32 20 4 Hand‐held devices 14 37 16 2 Imaging technologies 10 32 12 3 Virtual reality 9 25 11 4 Other 12 12 14 3 *One project was classified as “Studies” and therefore not included. Table C2. Technology skills promoted in project (n=88)*
# of projects with primary
focus
# of projects using
component
% of projects with primary
focus** # missing
Visualization/modeling skills 35 62 41 2 Computing/data analysis skills 34 66 39 0 Programming skills 28 46 34 6 Communication/social networking skills 27 66 31 1 Digital media skills (photos, imovie, music...)
26 59 31 3
Computational thinking skills 25 64 29 2 Computer driven equipment skills (e.g. CAM, Robotics…)
20 34 24 4
Data management skills 18 53 21 3 Web development skills 14 36 17 4 Other 12 13 14 2 *One project was classified as “Studies” and therefore not included. **Percentages based on actual respondents (# primary focus / (88 ‐ # missing))

MIS 2009: Appendices 28
Table C3. Number of projects targeting youth populations by race/ethnicity (n=85)
# of projects targeting*
% of projects targeting**
# missing
African American 69 84 3 Hispanics 66 83 5 American Indian 19 25 9 Pacific Islanders 10 13 8 Alaska Natives 5 7 9 Native Hawaiians 1 1 9 *Total across groups is more than 85 because projects work with more than one population. **Percentages based on actual respondents. Table C4. Number of projects targeting specific youth populations (n=85)
# of projects* % of projects** # missing Students qualifying for free/ reduced price lunch 61 73 2 English language learners (ELL) 27 34 5 Students with disabilities 18 23 6 Students participating in gifted/ talented programs
13 16 6
Only girls 8 10 2 *Total across groups is more than 85 because projects work with more than one population. **Percentages based on actual respondents.

MIS 2009: Appendices 29
Table C5. Focus areas with youth (n=85)
# of projects with primary
focus
# of projects using
component
% of projects
with primary focus
# missing
Technology‐based learning (computer‐based, game‐based)
61 81 72 0
Career skills development (lab work, engineering or science lab, using tools, equipment and instruments found in STEM careers)
48 78 56 0
Classroom work (academic content learning, in‐class projects, guest speakers)
40 68 48 2
Participation of scientists/engineers/technologists
34 77 40 1
Field work (internships/externships, experiential learning, out of school projects, skills training)
29 55 35 1
Career development (creating a career plan, providing information about career pathways)
24 75 29 2
Youth mentoring 17 46 21 3
Engagement of STEM researchers 16 61 19 2
Engagement of parents/caregivers 9 45 11 2

MIS 2009: Appendices 30
Table C6. Focus areas with teachers (n=69)*
# of projects with primary
focus
# of projects using
component
% of projects with primary
focus # missing
Technology‐based learning (computer‐based, game‐based)
52 60 76 1
Classroom work (academic content learning, in‐class projects, guest speakers)
36 54 54 2
Career skills development (lab work, engineering or science lab, using tools, equipment and instruments found in STEM careers)
28 55 42 2
Field work (internships/externships, experiential learning, out of school projects, skills training)
20 40 30 2
Participation of scientists/ engineers/ technologists
18 52 28 4
Youth mentoring 14 45 21 2 Career development (creating a career plan, providing information about career pathways)
11 45 17 3
Engagement of STEM researchers 11 48 17 3 Engagement of parents/caregivers 2 28 3 0 *Two projects are Convenings. Table C7. Target youth outcomes of project (n=85) # of projects % of projects* # missing
Gains in youth interest in STEM 68 81 1 Gains in youth interest in STEM careers 63 75 1 Gains in youth STEM content knowledge 62 74 1 Gains in youths' skills using technology tools 54 64 1 Gains in youth knowledge of STEM careers, preparation and/or workplace demands
49 58 1
Gains in youth engagement in STEM 48 59 1 Gains in youths' skills applying science, technology, engineering and/or math concepts.
40 48 3
Gains in youth participation in STEM‐related activities 34 41 1 Changes in youth preparation for STEM careers (technical/scientific training related to a specific career)
18 22 3
Youth entry into STEM career paths 13 16 3 Other 10 12 3 *Percentages based on actual respondents.