Item No.: 3B Supp Date of Meeting: October 30, 2018
21
2019 Budget Study Session 10/17/2018 1 Managing Member Meeting October 30 th , 2018 Item No.: 3B Supp Date of Meeting: October 30, 2018
Transcript of Item No.: 3B Supp Date of Meeting: October 30, 2018

2019 Budget Study Session
10/17/2018 1
Managing Member MeetingOctober 30th, 2018
Item No.: 3B SuppDate of Meeting: October 30, 2018

Agenda
• Budget Schedule• Cargo Forecast• 2018 Forecast and Key Messages • 2019-2023 Capital Investment Plan• 2019 Budget and Key Messages• 2019 Budget and 2019-2023 Operating Forecast
10/17/2018 2

Budget Schedule• October 30
• Cargo Forecast• Budget study session
• November 13• Approve 2019 operating budget• Approve 2019-2023 Capital Investment Plan• 2019 Capital Construction contribution
10/17/2018 3

Key Financial TermsThree important terms used on several slides1. Net Distributable Revenue – The “Net Income” that is split 50/50
between the home ports• After all expenses including after depreciation
2. Distributable Cash – Per the charter, the “operating” cash per the Cash Flow Statement that is distributed 50/50 back to the home ports
• Excluded depreciation and other cash flows not categorized as operating
• Example 1: capital grant revenue is not distributed automatically • Example 2: Distributable cash does not hold back cash to pay for non-
operating expenses such as the Public expenses for T5
3. Bond Income• Minimum level of net income required for homeports to meet
current bond rate covenants – defined in Charter• Excludes depreciation, capital grants and non operating expenses
10/17/2018 4
2018 Forecasted Operating Results
10/17/2018 5
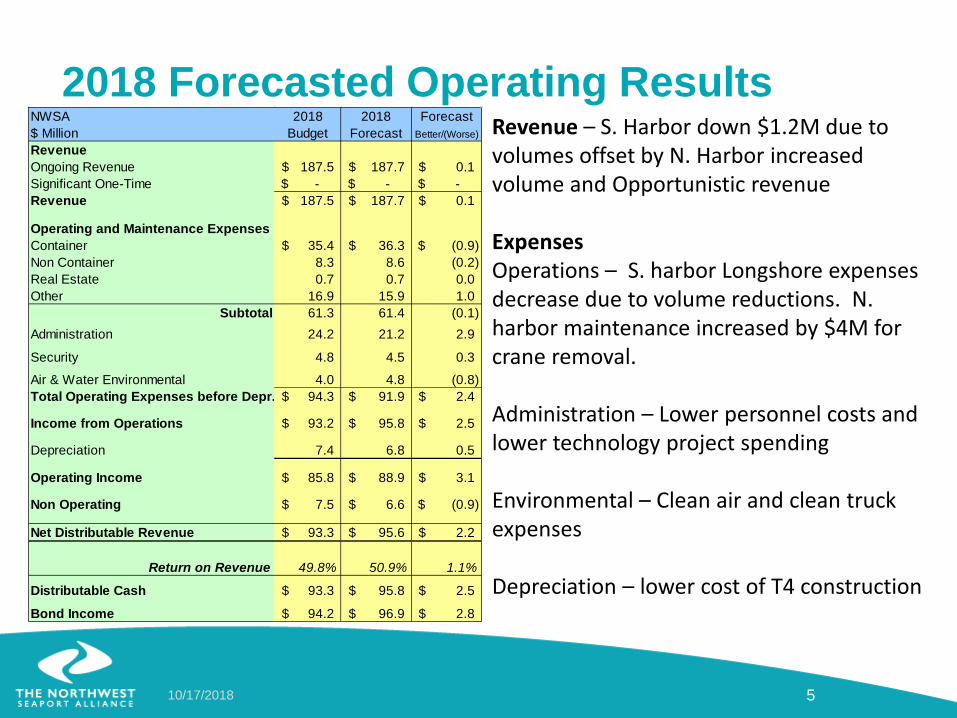
Revenue – S. Harbor down $1.2M due to volumes offset by N. Harbor increased volume and Opportunistic revenue
ExpensesOperations – S. harbor Longshore expenses decrease due to volume reductions. N. harbor maintenance increased by $4M for crane removal.
Administration – Lower personnel costs and lower technology project spending
Environmental – Clean air and clean truck expenses
Depreciation – lower cost of T4 construction
NWSA 2018 2018 Forecast$ Million Budget Forecast Better/(Worse)RevenueOngoing Revenue 187.5$ 187.7$ 0.1$ Significant One-Time -$ -$ -$ Revenue 187.5$ 187.7$ 0.1$
Operating and Maintenance ExpensesContainer 35.4$ 36.3$ (0.9)$ Non Container 8.3 8.6 (0.2)Real Estate 0.7 0.7 0.0Other 16.9 15.9 1.0
Subtotal 61.3 61.4 (0.1)Administration 24.2 21.2 2.9
Security 4.8 4.5 0.3
Air & Water Environmental 4.0 4.8 (0.8)Total Operating Expenses before Depr. 94.3$ 91.9$ 2.4$
Income from Operations 93.2$ 95.8$ 2.5$
Depreciation 7.4 6.8 0.5
Operating Income 85.8$ 88.9$ 3.1$
Non Operating 7.5$ 6.6$ (0.9)$
Net Distributable Revenue 93.3$ 95.6$ 2.2$
Return on Revenue 49.8% 50.9% 1.1%
Distributable Cash 93.3$ 95.8$ 2.5$
Bond Income 94.2$ 96.9$ 2.8$

2018 Forecasted Vs 2017 Actual
10/17/2018 6
Revenue – One time revenue from termination of terminal lease
ExpensesOperations –$4M for crane removal.
Administration - $1.2M Technology project spending, $500K S. harbor deepening study
Environmental – $3.8M Clean air and clean truck expenses
Depreciation – NWSA investments
NWSA 2017 2018 Fcst vs 2017$ Million Actuals Forecast Better/(Worse)RevenueOngoing Revenue 189.3$ 187.7$ (1.6)$ Significant One-Time 5.7$ -$ (5.7)$ Revenue 195.0$ 187.7$ (7.3)$
Operating and Maintenance ExpensesContainer 35.2$ 36.3$ (1.1)$ Non Container 8.3 8.6 (0.2)Real Estate 0.7 0.7 0.1Other 13.9 15.9 (2.0)
Subtotal 58.1 61.4 (3.2)Administration 19.6 21.2 (1.7)
Security 4.2 4.5 (0.2)
Air & Water Environmental 1.8 4.8 (3.0)Total Operating Expenses before Depr. 83.7$ 91.9$ (8.2)$
Income from Operations 111.3$ 95.8$ (15.5)$
Depreciation 2.2 6.8 (4.7)
Operating Income 109.1$ 88.9$ (20.2)$
Non Operating 0.8$ 6.6$ 5.9$
Net Distributable Revenue 109.9$ 95.6$ (14.3)$
Return on Revenue 56.3% 50.9% -5.4%
Distributable Cash 111.4$ 95.8$ (15.6)$
Bond Income 112.2$ 96.9$ (15.3)$

2018 Forecasted Project Spending ($ million)
10/17/2018 7
Original 2018 CIP budget was $162.7 million
Project Amount Description
Husky Terminal Crane Purchase $47.5 Payment of first set of 4 cranes and down payment of second set of 4 cranes
West Sitcum Stormwater Treatment 12.7
Husky Phase 2 Construction 9.2 Reconfigure, design and construction T4
Husky Backland Reconfiguration 6.6 Pavement and stormwater treatment improvement
T18 Stormwater Utility Upgrade 5.5
T46 Dock Rehabilitation 4.9
N. Harbor Crane removal 4.0
T5 Berth Modernization Design 1.0
Others 28.0 74 projects
Total $119.4

2019• The 2019 budget assumptions
• Fixed revenue based on negotiated leases• Variable revenue based on conservative volume forecasts• Allocated general and administrative costs are based on support
services agreements developed by both homeports• Capturing impact of major investments
• Bond Income exceeds minimum revenue required as calculated by the charter and each homeport bond documents
10/17/2018 8

2019 – 2023• This forecast includes significant investments
• Purchase of 4 additional cranes for Husky in S. Harbor• Redevelopment of T5 in N. Harbor• Reinvestment in repairs of T46 in N. Harbor
• These investments impact the operating income through additional costs (depreciation, equipment maintenance, etc.) and where applicable, improve revenue
• Bond Income exceeds minimum revenue required as calculated by the charter and each homeport bond documents
10/17/2018 9

Five Year Capital Investment Plan
• Capitalized• Assets that depreciate over time
• Operating expense• Included in the operating budget
• Projects need to be approved individually by the Managing Members or delegation via Master Policy
• Inclusion in the budget does not mean that the projects are authorized
10/17/2018 10
($ million)
2018 2019 - 2023Forecast 2019 2020 2021 2022 2023 Totals
Capitalized $105.6 $162.7 $112.1 $93.0 $40.0 $5.3 $413.1Operating & Non Op. Expense $13.8 $19.7 $30.1 $13.0 $7.1 $6.6 $76.5Grand Total $119.4 $182.4 $142.2 $106.0 $47.1 $11.9 $489.6

2019 - 2023 Container Terminal Projects
10/17/2018 11
($ million)
Project Amount Description
T5 Berth Modernization Construction $307.6 Design and construction T5, public expense projects & other small projects
Husky Terminal Crane Purchase 42.8 Second set of 4 cranes
T46 Dock Rehabilitation 25.3 Dock rehabilitation and terminal redevelopment, paving. Partially TIGER grant funded
T18 Stormwater Utility Upgrade 5.7
Husky Phase 2 Construction 6.2 Backland reconfigure, design and construction
Husky Crane Disposal 4.2
Others 30.5 16 other projects
Total $422.3

2019 - 2023 Non Container Terminal Projects
10/17/2018 12
($ million)
Project Amount Description
Auto Facility Roof Replacement $4.0
Others 4.1 9 projects
Total $8.1

2019 - 2023 Other Projects ($ million)
10/17/2018 13
($ millions) Project Amount Description
Contingency/Unallocated $25.0 Capital contingency at $3M/year, expense at $2M per year for emergent issues
Northwest Ports Clean Air Strategy 7.1Reduce diesel particulate matter (DPM) by 80% by 2020 and Green House Gases (GHG) by 15% by 2020
T106 NH CBP Office & Facility Improvements 6.3
Clean Truck Program 4.82007 or newer trucks reduce DPM emissions by up to 85%
Industrial Stormwater Compliance 3.5Reduce copper to less than 14 parts per billion, zinc to less than 117 parts per billion
Others 12.7 24 projects
Total $59.4

2019 Operating Budget Key Assumptions
• Conservative Cargo forecast• Lease revenue per contract• Volume revenue per tariff and contracts• TIGER grants and repair of T46• Continuation of shared support services between the home
ports and the NWSA
10/17/2018 14

2019 Preliminary Budget ($ million)
10/17/2018 15
Revenue –Lease increases in S. Harbor and increased equipment rental revenue
ExpensesOperations – EB1 rent payment to POT and outsourced maintenance at W. Sitcum & Log dock
Administration – Vacant positions to be filled, projects initiated
Non-Operating – T5 permit conditions rail quiet zone and electrical substation
NWSA employs 57 people making $115,000 on average plus benefits.
NWSA 2017 2018 2019 Budget v Fcst$ Million Actuals Forecast Budget Better/(Worse)RevenueOngoing Revenue 189.3$ 187.7$ 199.4$ 11.8$ Significant One-Time 5.7$ -$ -$ Revenue 195.0$ 187.7$ 199.4$ 11.8$
Operating and Maintenance ExpensesContainer 35.2$ 36.3$ 37.3$ (1.0)$ Non Container 8.3 8.6 11.3 (2.8)Real Estate 0.7 0.7 0.8 (0.1)Other 13.9 15.9 17.5 (1.6)
Subtotal 58.1 61.4 66.9 (5.5)Administration 19.6 21.2 23.5 (2.2)
Security 4.2 4.5 5.1 (0.6)
Air & Water Environmental 1.8 4.8 3.9 1.0Total Operating Expenses before Depr. 83.7$ 91.9$ 99.3$ (7.4)$
Income from Operations 111.3$ 95.8$ 100.2$ 4.4$
Depreciation 2.2 6.8 13.5 (6.6)
Operating Income 109.1$ 88.9$ 86.7$ (2.2)$
Non Operating 0.8$ 6.6$ 1.1$ (5.5)$
Net Distributable Revenue 109.9$ 95.6$ 87.8$ (7.7)$
Return on Revenue 56.3% 50.9% 44.0% -6.9%
Distributable Cash 111.4$ 95.8$ 99.9$ 4.2$
Bond Income 112.2$ 96.9$ 102.1$ 5.2$

Budget Line Items
10/17/2018 16
NWSA 2017 2018 2018 2019$ Million Actuals Budget Forecast BudgetRevenueProperty Rental 41.4$ 39.2$ 40.4$ 43.3$ Sale of Utilities 0.9 0.9 1.1 1.0 Services Marine Terminals 124.6 119.9 120.5 127.2 Equipment Rentals 17.9 17.6 15.9 18.3 Other Revenue 10.3 9.9 9.8 9.8 Total Revenue 195.0$ 187.5$ 187.7$ 199.4$
ExpensesPort Salaries & Benefits 10.3$ 9.9$ 9.6$ 10.0$ Outside Services 6.5 6.3 4.8 6.7 Longshore Labor & Fringe 11.9 12.8 11.0 10.4 Direct Expenses 9.6 9.5 10.1 11.1 Marketing & Global Outreach 0.5 1.5 1.1 0.7 Travel & Hosting 0.4 0.7 0.6 0.7 Maintenance 17.3 18.5 21.8 25.3 Office Equipment & Supplies 0.2 0.3 0.3 0.4 Utilities 3.8 4.4 4.5 4.8 Other Employee Exp 0.3 0.3 0.3 0.1 Other Expenses 1.0 1.1 1.1 1.0 Environmental 1.8 3.8 4.8 3.7 Operating Expenses before Allocations 63.7 69.2 69.9 75.1 Allocations 20.0 25.1 22.0 24.2 Total Operating Expenses before Dep. 83.7 94.3 91.9 99.3 Operating Income Before Depreciation 111.3 93.2 95.8 100.2 Depreciation 2.2 7.4 6.8 13.5 Total Operating Expenses 85.9 101.7 98.8 112.7 Operating Income 109.1$ 85.8$ 88.9$ 86.7$
Maintenance –• 2018 :$4M for N. harbor
crane removal• 2019: T46 bulkhead repair
& paving of $3M, $0.9M PCT Paving, $2M unallocated
Allocations• 2018 allocations below
budget due to staffing and project spending
• 2019 budget less than original 2018 budget
Depreciation• Increasing due to NWSA
investments
16

MEMBERSHIPS
Organization Annual DuesAmerican Association of Port Authorities
$50,000
Pacific Northwest Waterways Association 28,000WA Council on International Trade 20,000International Association of Ports and Harbors 11,000
All Other Memberships under $10,000 44,000Total NWSA Memberships $153,000
10/17/2018 17
MM approval of NWSA Memberships over $10,000 required per NWSA Master Policy
Actual amounts paid may vary slightly as some dues are calculated based on fiscal year financial results.
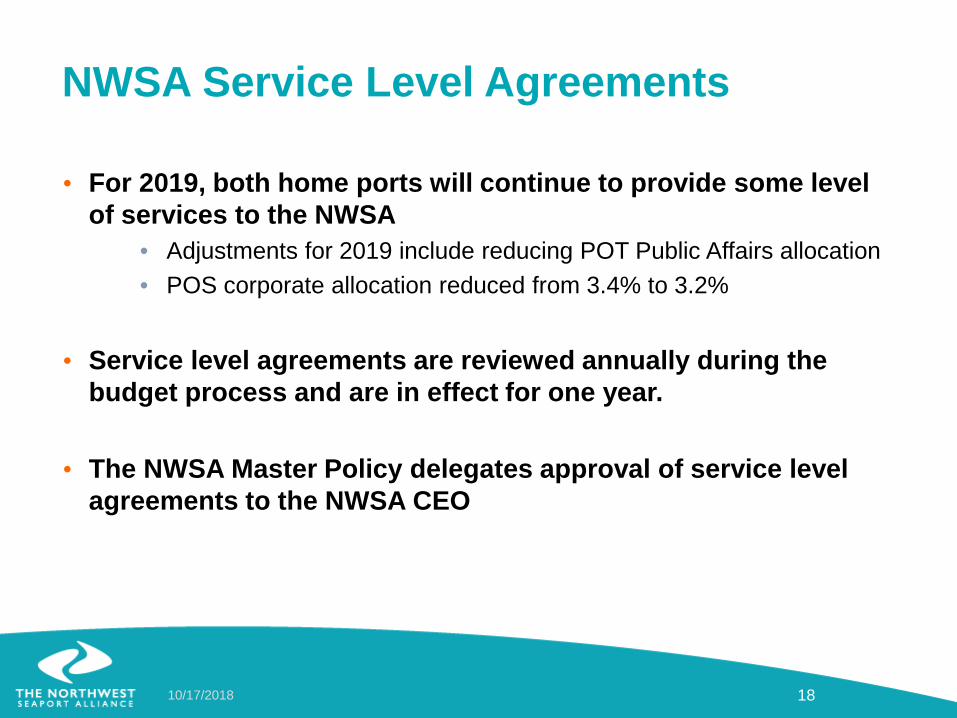
NWSA Service Level Agreements
• For 2019, both home ports will continue to provide some level of services to the NWSA
• Adjustments for 2019 include reducing POT Public Affairs allocation• POS corporate allocation reduced from 3.4% to 3.2%
• Service level agreements are reviewed annually during the budget process and are in effect for one year.
• The NWSA Master Policy delegates approval of service level agreements to the NWSA CEO
10/17/2018 18

NWSA 2019 Budget and Four Year Forecast
10/17/2018 19
NWSA$ Million 2019 2020 2021 2022 2023RevenueOngoing Revenue 199.4$ 203.0$ 214.6$ 223.7$ 235.4$ Significant One-Time -$ -$ -$ -$ -$ Revenue 199.4$ 203.0$ 214.6$ 223.7$ 235.4$
Total Operating Expenses before Depr. 99.3$ 104.1$ 107.7$ 104.3$ 106.3$
Depreciation 13.5 16.1 24.4 24.7 28.3
Operating Income 86.7$ 82.8$ 82.5$ 94.7$ 100.7$
Capital Grants 3.8$ 3.0$ 0.6$ -$ -$ Other Non Operating (net) (2.7)$ (7.6)$ 2.3$ 1.4$ 1.4$
Net Distributable Revenue 87.8$ 78.2$ 85.5$ 96.0$ 102.1$ Return on Revenue 44.0% 38.5% 39.8% 42.9% 43.4%
Distributable Cash 99.9$ 98.9$ 106.9$ 119.3$ 129.0$
Bond Income 102.1$ 102.1$ 109.3$ 120.8$ 130.4$

NWSA Non Operating Details
10/17/2018 20
• Capital Grants for T46• Operating grants for NWSA community system• Public expense for T5 permit conditions: Rail quiet zone, electrical substation, etc.
NWSA$ Million 2019 2020 2021 2022 2023Non Op RevenueCapital Grants 3.8$ 3.0$ 0.6$ -$ -$ Operating Grants 0.5$ 1.8$ 1.0$ -$ -$ Interest Income (Net) 1.5$ 1.4$ 1.4$ 1.4$ 1.4$ Total Non Op Revenue 5.8$ 6.2$ 3.0$ 1.4$ 1.4$
Non Op ExpensePublic Expense 4.4$ 10.8$ 0.0$ -$ -$ Other/Banking Fees 0.2$ 0.0$ 0.0$ 0.0$ 0.0$ Total Non Op Expense 4.6$ 10.8$ 0.1$ 0.0$ 0.0$
Total Non Operating 1.1$ (4.6)$ 3.0$ 1.4$ 1.4$

Budget Messages• 2018 Net Distributable Revenue is projected to be $95.5
million, $2.2 million above budget level of $93.3 million
• 2019 and 2020 are years impacted with investments in technology and infrastructure to support future growth
• Technology investments for improved operations services• Community investments in electrical and rail infrastructure to
support major terminal investments• NWSA investments in terminals in both harbors
10/17/2018 21