Item 5. Operating and Financial Review and Prospects. · Operating and Financial Review and...
56
Item 5. Operating and Financial Review and Prospects. The following discussion and analysis should be read in conjunction with “Item 3.A. Key Information— Selected Financial Data,” “Selected Statistical Data” and our consolidated financial statements and related notes included elsewhere in this Annual Report. Page Roadmap to Reading the Discussion of Our Operating and Financial Review and Prospects A. Operating Results .................................................................. 41 Introduction ...................................................................... 41 Recent Developments ............................................................... 44 Business Environment .............................................................. 46 Critical Accounting Estimates ........................................................ 49 Accounting Changes ................................................................ 53 Recently Issued Accounting Pronouncements ............................................ 56 Results of Operations ............................................................... 59 Business Segment Analysis .......................................................... 67 Geographic Segment Analysis ........................................................ 73 Effect of the Change in Exchange Rates on Foreign Currency Translation ...................... 74 B. Liquidity and Capital Resources ...................................................... 75 Financial Condition ................................................................ 75 Capital Adequacy .................................................................. 88 Off-balance-sheet Arrangements ...................................................... 91 Contractual Cash Obligations ......................................................... 95 Non-exchange Traded Contracts Accounted for at Fair Value ............................... 95 C. Research and Development, Patents and Licenses, etc. ................................... 96 D. Trend Information ................................................................. 96 E. Off-balance-sheet Arrangements ..................................................... 96 F. Tabular Disclosure of Contractual Obligations .......................................... 96 G. Safe Harbor ....................................................................... 96 A. Operating Results Introduction We are a holding company for Bank of Tokyo-Mitsubishi UFJ, or BTMU, Mitsubishi UFJ Trust and Banking Corporation, or MUTB, Mitsubishi UFJ Securities, or MUS, and other subsidiaries. Through our subsidiaries and affiliated companies, we engage in a broad range of financial operations, including commercial banking, investment banking, trust banking and asset management services, securities businesses, and provide related services to individual and corporate customers. 41
Transcript of Item 5. Operating and Financial Review and Prospects. · Operating and Financial Review and...

Item 5. Operating and Financial Review and Prospects.
The following discussion and analysis should be read in conjunction with “Item 3.A. Key Information—Selected Financial Data,” “Selected Statistical Data” and our consolidated financial statements and relatednotes included elsewhere in this Annual Report.
Page
Roadmap to Reading the Discussion of Our Operating and Financial Review and Prospects
A. Operating Results . . . . . . . . . . . . . . . . . . . . . . . . . . . . . . . . . . . . . . . . . . . . . . . . . . . . . . . . . . . . . . . . . . 41
Introduction . . . . . . . . . . . . . . . . . . . . . . . . . . . . . . . . . . . . . . . . . . . . . . . . . . . . . . . . . . . . . . . . . . . . . . 41
Recent Developments . . . . . . . . . . . . . . . . . . . . . . . . . . . . . . . . . . . . . . . . . . . . . . . . . . . . . . . . . . . . . . . 44
Business Environment . . . . . . . . . . . . . . . . . . . . . . . . . . . . . . . . . . . . . . . . . . . . . . . . . . . . . . . . . . . . . . 46
Critical Accounting Estimates . . . . . . . . . . . . . . . . . . . . . . . . . . . . . . . . . . . . . . . . . . . . . . . . . . . . . . . . 49
Accounting Changes . . . . . . . . . . . . . . . . . . . . . . . . . . . . . . . . . . . . . . . . . . . . . . . . . . . . . . . . . . . . . . . . 53
Recently Issued Accounting Pronouncements . . . . . . . . . . . . . . . . . . . . . . . . . . . . . . . . . . . . . . . . . . . . 56
Results of Operations . . . . . . . . . . . . . . . . . . . . . . . . . . . . . . . . . . . . . . . . . . . . . . . . . . . . . . . . . . . . . . . 59
Business Segment Analysis . . . . . . . . . . . . . . . . . . . . . . . . . . . . . . . . . . . . . . . . . . . . . . . . . . . . . . . . . . 67
Geographic Segment Analysis . . . . . . . . . . . . . . . . . . . . . . . . . . . . . . . . . . . . . . . . . . . . . . . . . . . . . . . . 73
Effect of the Change in Exchange Rates on Foreign Currency Translation . . . . . . . . . . . . . . . . . . . . . . 74
B. Liquidity and Capital Resources . . . . . . . . . . . . . . . . . . . . . . . . . . . . . . . . . . . . . . . . . . . . . . . . . . . . . . 75
Financial Condition . . . . . . . . . . . . . . . . . . . . . . . . . . . . . . . . . . . . . . . . . . . . . . . . . . . . . . . . . . . . . . . . 75
Capital Adequacy . . . . . . . . . . . . . . . . . . . . . . . . . . . . . . . . . . . . . . . . . . . . . . . . . . . . . . . . . . . . . . . . . . 88
Off-balance-sheet Arrangements . . . . . . . . . . . . . . . . . . . . . . . . . . . . . . . . . . . . . . . . . . . . . . . . . . . . . . 91
Contractual Cash Obligations . . . . . . . . . . . . . . . . . . . . . . . . . . . . . . . . . . . . . . . . . . . . . . . . . . . . . . . . . 95
Non-exchange Traded Contracts Accounted for at Fair Value . . . . . . . . . . . . . . . . . . . . . . . . . . . . . . . 95
C. Research and Development, Patents and Licenses, etc. . . . . . . . . . . . . . . . . . . . . . . . . . . . . . . . . . . . 96
D. Trend Information . . . . . . . . . . . . . . . . . . . . . . . . . . . . . . . . . . . . . . . . . . . . . . . . . . . . . . . . . . . . . . . . . 96
E. Off-balance-sheet Arrangements . . . . . . . . . . . . . . . . . . . . . . . . . . . . . . . . . . . . . . . . . . . . . . . . . . . . . 96
F. Tabular Disclosure of Contractual Obligations . . . . . . . . . . . . . . . . . . . . . . . . . . . . . . . . . . . . . . . . . . 96
G. Safe Harbor . . . . . . . . . . . . . . . . . . . . . . . . . . . . . . . . . . . . . . . . . . . . . . . . . . . . . . . . . . . . . . . . . . . . . . . 96
A. Operating Results
Introduction
We are a holding company for Bank of Tokyo-Mitsubishi UFJ, or BTMU, Mitsubishi UFJ Trust andBanking Corporation, or MUTB, Mitsubishi UFJ Securities, or MUS, and other subsidiaries. Through oursubsidiaries and affiliated companies, we engage in a broad range of financial operations, including commercialbanking, investment banking, trust banking and asset management services, securities businesses, and providerelated services to individual and corporate customers.
41
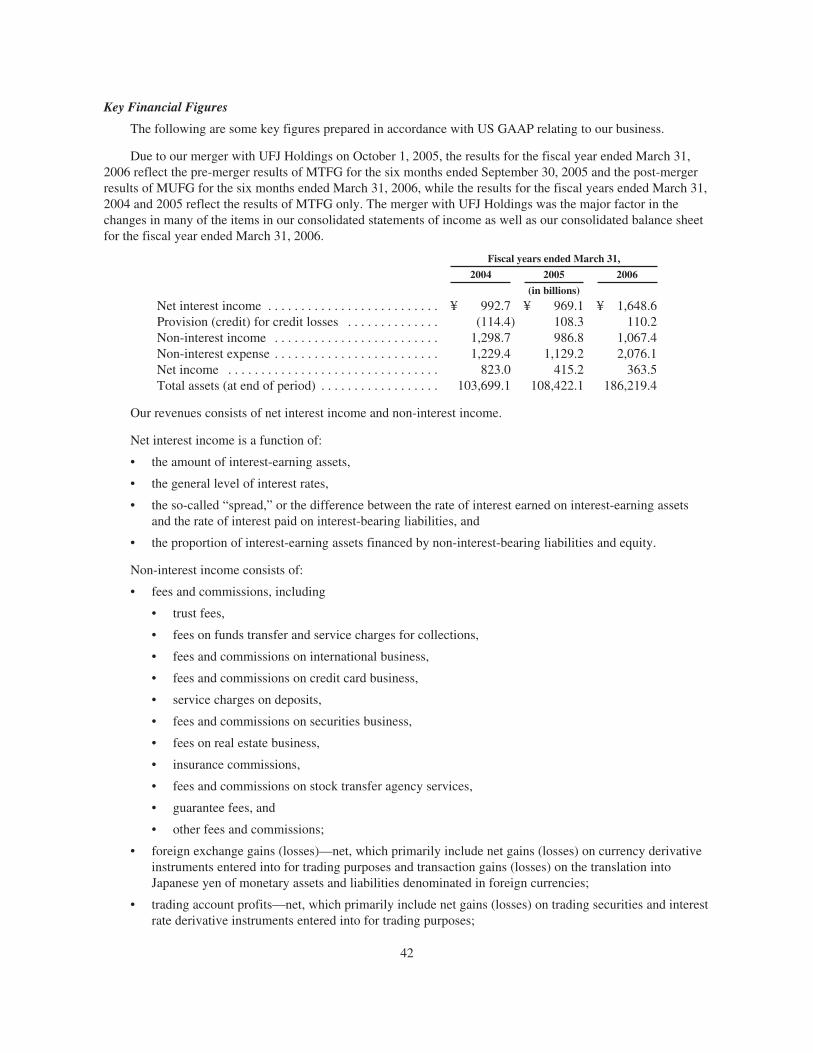
Key Financial Figures
The following are some key figures prepared in accordance with US GAAP relating to our business.
Due to our merger with UFJ Holdings on October 1, 2005, the results for the fiscal year ended March 31,2006 reflect the pre-merger results of MTFG for the six months ended September 30, 2005 and the post-mergerresults of MUFG for the six months ended March 31, 2006, while the results for the fiscal years ended March 31,2004 and 2005 reflect the results of MTFG only. The merger with UFJ Holdings was the major factor in thechanges in many of the items in our consolidated statements of income as well as our consolidated balance sheetfor the fiscal year ended March 31, 2006.
Fiscal years ended March 31,
2004 2005 2006
(in billions)
Net interest income . . . . . . . . . . . . . . . . . . . . . . . . . . ¥ 992.7 ¥ 969.1 ¥ 1,648.6Provision (credit) for credit losses . . . . . . . . . . . . . . (114.4) 108.3 110.2Non-interest income . . . . . . . . . . . . . . . . . . . . . . . . . 1,298.7 986.8 1,067.4Non-interest expense . . . . . . . . . . . . . . . . . . . . . . . . . 1,229.4 1,129.2 2,076.1Net income . . . . . . . . . . . . . . . . . . . . . . . . . . . . . . . . 823.0 415.2 363.5Total assets (at end of period) . . . . . . . . . . . . . . . . . . 103,699.1 108,422.1 186,219.4
Our revenues consists of net interest income and non-interest income.
Net interest income is a function of:
• the amount of interest-earning assets,
• the general level of interest rates,
• the so-called “spread,” or the difference between the rate of interest earned on interest-earning assetsand the rate of interest paid on interest-bearing liabilities, and
• the proportion of interest-earning assets financed by non-interest-bearing liabilities and equity.
Non-interest income consists of:
• fees and commissions, including
• trust fees,
• fees on funds transfer and service charges for collections,
• fees and commissions on international business,
• fees and commissions on credit card business,
• service charges on deposits,
• fees and commissions on securities business,
• fees on real estate business,
• insurance commissions,
• fees and commissions on stock transfer agency services,
• guarantee fees, and
• other fees and commissions;
• foreign exchange gains (losses)—net, which primarily include net gains (losses) on currency derivativeinstruments entered into for trading purposes and transaction gains (losses) on the translation intoJapanese yen of monetary assets and liabilities denominated in foreign currencies;
• trading account profits—net, which primarily include net gains (losses) on trading securities and interestrate derivative instruments entered into for trading purposes;
42

• investment securities gains (losses)—net, which primarily include net gains on sales of marketablesecurities, particularly marketable equity securities;
• equity in earnings (losses) of equity method investees; and
• other non-interest income.
Provision (credit) for credit losses are charged to operations to maintain the allowance for credit losses at alevel deemed appropriate by management.
Core Business Areas
Effective April 1, 2004, we implemented an integrated business group system, which currently integrates theoperations of BTMU, MUTB, MUS and other subsidiaries in the following three areas—Retail, Corporate andTrust Assets. These three businesses serve as the core sources of our revenue. Operations that are not coveredunder the integrated business group system are classified under Global Markets and Other.
Our business segment information is not consistent with our consolidated financial statements prepared inaccordance with US GAAP. The following chart illustrates the relative contributions to operating profit for thefiscal year ended March 31, 2006 of the three core business areas and the other business areas based on oursegment information:
Integrated Retail Banking
Business Group 23%
Integrated Trust
Assets Business
Group 3%
Integrated Corporate
Banking Business Group
(Overseas) 17%
Integrated Corporate
Banking Business Group
(Domestic) 49%
Global Markets
and Other 8%
Establishment of Mitsubishi UFJ Financial Group
In October 2005, Mitsubishi Tokyo Financial Group, Inc. merged with UFJ Holdings, Inc. to formMitsubishi UFJ Financial Group, Inc. At the same time, their respective trust banking and securities companiesmerged to form MUTB and MUS. This was followed in January 2006 by the merger of our subsidiarycommercial banks to form BTMU.
The merger marked the creation of a fully-fledged, comprehensive financial group with a broad andbalanced domestic and international network, and a diverse range of services provided by group companies,complemented by one of the largest customer base in Japan. We aim to complete the integration process andrealize the benefits of integration while enhancing the types and quality of our services in order to flexibly andcomprehensively meet a diverse range of customer needs.
The merger was accounted for under the purchase method of accounting, and the assets and liabilities ofUFJ Holdings and its subsidiaries were recorded at fair value as of October 1, 2005. The purchase price of UFJHoldings amounted to ¥4,406.1 billion, of which ¥4,403.2 billion was recorded in capital surplus relating to themerger with UFJ Holdings and the direct acquisition costs of ¥2.9 billion were included in the purchase price.Shareholders’ equity of UFJ Holdings was ¥2,530.8 billion and the goodwill relating to the merger with UFJHoldings was ¥1,733.1 billion.
43

Related to the merger, UFJ Holdings shareholders of record as of September 30, 2005 received 0.62 sharesof our common stock in exchange for one share of UFJ Holdings common stock. As a result of the merger, weissued 3,215,172 shares of new common stock to UFJ Holdings shareholders, representing a 49.12% increase inour common shares issued as of October 3, 2005. Additionally, each outstanding share of class II, IV, V, VI andVII preferred stock of UFJ Holdings was exchanged for one share of our class 8, 9, 10, 11 and 12 preferred stock,respectively.
For further information, see note 2 and note 20 to our consolidated financial statements.
Recent Developments
Completion of Public Fund Repayment and Repurchase of Our Common Shares
UFJ Holdings was a recipient of public funds from the Resolution and Collection Corporation, a Japanesegovernment entity. The public funds were injected in the form of a convertible preferred stock investment in UFJHoldings. This convertible preferred stock was exchanged in the merger with UFJ Holdings for newly issuedpreferred shares of MUFG that were convertible into common stock.
Between October 2005 and June 2006, the Resolution and Collection Corporation sold in the market666,962 shares of our common stock which were issued upon conversion (or acquisition claim after the CompanyLaw took effect) of our preferred shares held by the Resolution and Collection Corporation. Along with thesesales, we repurchased 681,690 shares of our common stock.
In June 2006, 277,245 shares of the common stock issued upon an acquisition claim for the preferred sharesheld by the Resolution and Collection Corporation were sold by the Resolution and Collection Corporation in asecondary offering of shares and, at the same time, 41,000 shares of the common stock were sold by way of overallotment. For this overallotment, we sold 41,000 treasury shares of our common stock.
The remaining preferred shares held by the Resolution and Collection Corporation were sold to non-governmental institutions.
As a result of the above transactions, there are currently no public funds in our capital base.
Sale of UnionBanCal’s International Correspondent Banking Business
In September 2005, UnionBanCal Corporation, a U.S. subsidiary of BTMU, signed a definitive agreementto sell its international correspondent banking operations to Wachovia Bank, N.A. effective October 6, 2005, andthe principal legal closing of the transaction took place on the same day. At the principal closing, no loans orother assets were acquired by Wachovia Bank, N.A., and no liabilities were assumed. As of June 30, 2006, all ofUnionBanCal Corporation’s offices designated for disposal were closed. The remaining assets include depositswith banks awaiting approval for repatriation of capital and unremitted profits and loans that are maturing byJanuary 2008. The remaining liabilities primarily consist of accrued expenses, which will be settled when due.
We accounted for the transaction as discontinued operations in accordance with SFAS No. 144,“Accounting for Impairment or Disposal of Long-Lived Assets” and presented the financial position and resultsof operations of discontinued operations as a separate line item in our consolidated financial statements. See note3 to our consolidated financial statements for more information.
Establishment of Mitsubishi UFJ Merrill Lynch PB Securities
In May 2006, we established a joint-venture private banking firm named Mitsubishi UFJ Merrill Lynch PBSecurities Co., Ltd., with Merrill Lynch & Co., Inc. and Merrill Lynch Japan Securities Co., Ltd. The jointventure firm offers high-net-worth Japanese individuals and small and medium-sized organizations a full range
44

of innovative financials products and services. BTMU and MUS own 40% and 10%, respectively, of the votingcommon shares of the joint venture company, and Merrill Lynch owns the remaining 50%. Merrill Lynch JapanSecurities contributed its private client business, comprising approximately 8,000 client accounts and more than¥1 trillion in assets under administration, into the joint venture firm. We, in turn, will introduce the capabilitiesand services of the joint venture firm to BTMU’s high-net-worth client base.
Mitsubishi UFJ Securities Becomes a Directly-Held Subsidiary
On July 1, 2005, MTFG made Mitsubishi Securities a directly-held subsidiary by acquiring substantially allof the shares of Mitsubishi Securities common stock then held by our subsidiary banks. As a result of thistransfer of shares within our group and the merger between Mitsubishi Securities and UFJ Tsubasa Securities toform MUS, as of March 31, 2006, we held MUS common stock representing 63% of the voting rights. Since thetransfer was a transaction among our group companies, other than the effect of income tax, the transfer did notimpact our consolidated financial statements.
On August 29, 2006, we and MUS signed a basic agreement regarding a proposed share exchangeagreement to make MUS a wholly-owned subsidiary, subject to approval by MUS shareholders and the relevantauthorities. The purpose of making MUS a wholly-owned subsidiary is, among other factors, to seize theopportunities presented by the deregulation of the Japanese financial markets and further enhance cooperationbetween group companies. We believe that we will be able to further strengthen our securities and investmentbanking businesses and maximize synergies among our banking, trust and securities businesses. As a result of theproposed share exchange which is planned to be completed by March 31, 2007, MUS shareholders will receiveshares of our common stock in exchange for their shares of MUS common stock and become our shareholders.
Strategic Business and Capital Alliance with Norinchukin Bank
In November 2005, we entered into a definitive agreement regarding a strategic business and capital alliancewith Norinchukin Bank. As part of this alliance, we will provide specific infrastructure and know-how in theretail business to Norinchukin Bank while gaining access to Norinchukin Bank’s extensive customer base andoperational network. This alliance will enable us to strengthen our retail business and enhance our revenue baseby increasing the number of credit card customers. In December 2005, as part of the capital alliance, NorinchukinBank purchased 17,700 shares of class 8 preferred stock and 22,400 shares of class 12 preferred stock of MUFGfrom the Resolution and Collection Corporation for ¥101.4 billion. Norinchukin Bank also purchased 50,000,000shares of first series class I stock of UFJ NICOS Co., Ltd., a consolidated subsidiary of BTMU that was formedby the merger of Nippon Shinpan Co., Ltd. and UFJ Card Co., Ltd. in October 2005, for approximately ¥100billion.
Transfer to the Japanese Government of the Substitutional Portion of Employee Pension Fund Plans
The substitutional portion of employee pension fund liabilities of Bank of Tokyo-Mitsubishi weretransferred to the Japanese government in March 2005. Since the transfer was completed after the measurementdate in the fiscal year ended March 31, 2005, we recognized net gains of ¥35.0 billion as a result of the transfer /settlement for the fiscal year ended March 31, 2006. This gain consisted of ¥103.0 billion in non-interest incomeunder a government grant for the transfer of the substitutional portion of employees’ pension fund plans and¥68.0 billion in non-interest expense under salaries and employee benefits. For further information, see note 18to our consolidated financial statements.
Basic Agreement on the Merger of UFJ NICOS and DC Card
On January 26, 2006, we, UFJ NICOS and DC Card, our credit card subsidiaries, and BTMU entered into abasic agreement on the merger of UFJ NICOS and DC Card. The merger is planned to take place on April 1,2007 with UFJ NICOS being the surviving entity. The objective of the merger is to combine UFJ NICOS’ largeand extensive network, reputation and product development capability with DC Card’s co-branding relationshipsand acceptance of regional cards.
45

Purchase of Preferred Stock of Subsidiary
In May 2006, BTMU purchased from Merrill Lynch all of the preferred stock and the rights to subscribe fornew shares issued by MU Strategic Partner Co., Ltd., a subsidiary of BTMU, in consideration of ¥120.0 billionfor the preferred stock and ¥48.6 billion for the rights to subscribe for new shares.
MU Strategic Partner, formerly known as UFJ Strategic Partner Co., Ltd., was incorporated in December2002 for the purpose of promoting the resolution of problem loans and raising equity capital. Pursuant to theInvestors Agreement between the former UFJ Bank and Merrill Lynch in February 2003, MU Strategic Partnerraised equity capital by the issuance of preferred stock of ¥120.0 billion to Merrill Lynch, and has committeditself to restructuring, and resolving problem loans.
MU Strategic Partner has made substantive progress in its measures to resolve problem loans, and BTMUhas dissolved its capital relationship with Merrill Lynch through MU Strategic Partner and has made MUStrategic Partner its wholly owned subsidiary.
Issuance of “Non-dilutive” Preferred Securities
In order to strengthen our capital base, in August 2005, MTFG Capital Finance Limited, a special purposecompany established in the Cayman Islands, issued ¥165 billion in non-cumulative and non-dilutive perpetualpreferred securities in a private placement to institutional investors.
Similarly, in March 2006, MUFG Capital Finance 1 Limited, MUFG Capital Finance 2 Limited and MUFGCapital Finance 3 Limited, special purpose companies established in the Cayman Islands, issued $2.3 billion,€750 million and ¥120 billion, respectively, in non-cumulative and non-dilutive perpetual preferred securities ina global offering targeting overseas institutional investors.
Those preferred securities contribute to our Tier 1 capital at March 31, 2006 under the BIS capital adequacyrequirements. However, for accounting purposes under US GAAP, because those special purpose companies arenot consolidated entities, the loans, which are made to us from the proceeds from the preferred securities issuedby these special purpose companies, are presented as long-term debt in our consolidated balance sheet at March31, 2006.
Purchase of 50% of Bank of Tokyo-Mitsubishi’s Head Office and Nihonbashi Annex
In August 2005, Bank of Tokyo-Mitsubishi purchased from Mitsubishi Estate Co., Ltd., the equivalent of50% of the land and buildings of Bank of Tokyo-Mitsubishi’s head office and Nihonbashi annex, forapproximately ¥111.6 billion. The purchase was undertaken to increase the stability and flexibility of theproperty as the office buildings and land function as a significant part of BTMU’s infrastructure. For furtherinformation, see note 9 to our consolidated financial statements.
Business Environment
We engage, through our subsidiaries and affiliated companies, in a wide range of financial operations,including commercial banking, investment banking, asset management, trust banking and securities-relatedbusinesses, and provide related services to individuals primarily in Japan and the United States and corporatecustomers around the world. Our results of operations and financial condition are exposed to changes in variousexternal economic factors, including:
• General economic conditions;
• Interest rates;
• Currency exchange rates; and
• Stock and real estate prices.
46

Economic Environment in Japan
For the fiscal year ended March 31, 2006, the Japanese economy started off slowly, due mainly to anadjustment in inventory in the IT sector. However, with the rise in exports in the summer, along with increases incapital expenditures and steady increases in private consumption, the Japanese economy moved toward recovery.
With respect to interest rates, the Bank of Japan lifted its easy monetary policy in March 2006 due toincreases in consumer prices, but short-term interest rates remained at near zero percent. As to long-term interestrates, the yield on ten-year Japanese government bonds declined slightly during the first half of the fiscal year,but later rose due to anticipation surrounding the lifting of the easy monetary policy by the Bank of Japan. In July2006, the Bank of Japan abolished its zero interest rate policy and raised the uncollateralized overnight call rateto 0.25%. The following chart shows the interest rate trends in Japan since January 2003:
Newly Issued Japanese Government Bonds Yield (10 years) (End of Month)Uncollateralized Overnight Call Rates (End of Month)
2.0
1.8
1.6
1.4
1.2
1.0
0.8
0.6
0.4
0.2
0.0
Jan-
03
Mar-
03
May
-03
Jul-0
3Sep
-03
Nov-0
3
Jan-
04
Mar-
04
May
-04
Jul-0
4
Sep-0
4
Nov-0
4
Jan-
05
Mar-
05
May
-05
Jul-0
5Ju
l-06
Sep-0
5
Nov-0
5
Jan-
06
Mar-
06
May
-06
The Japanese stock markets continued to rise during the fiscal year ended March 31, 2006. The NikkeiStock Average, which is an average of 225 blue chip stocks listed on the Tokyo Stock Exchange, rose from¥11,668.95 at March 31, 2005 to ¥17,059.66 at March 31, 2006. Similarly, the Tokyo Stock Price Index, orTOPIX, a composite index of all stocks listed on the First Section of the Tokyo Stock Exchange, rose from1,182.18 at March 31, 2005 to 1,728.16 at March 31, 2006. As of mid-September 2006, the Nikkei StockAverage was around ¥16,000, and TOPIX was around 1,600.
47
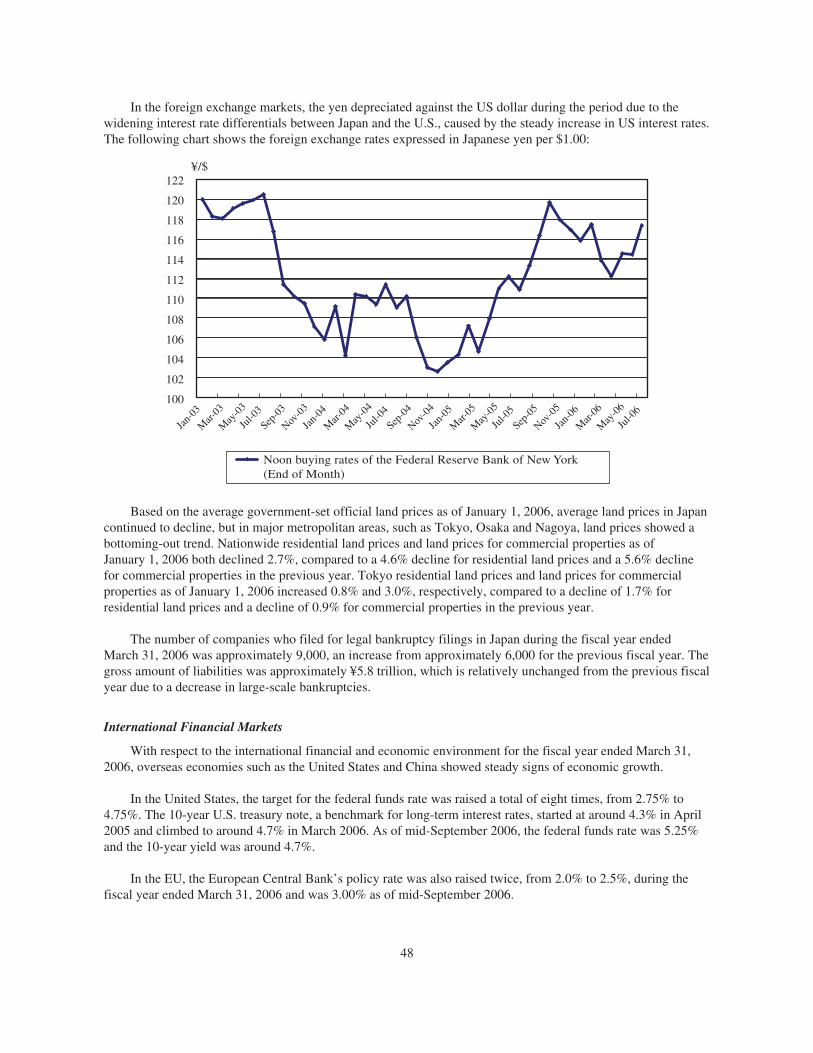
In the foreign exchange markets, the yen depreciated against the US dollar during the period due to thewidening interest rate differentials between Japan and the U.S., caused by the steady increase in US interest rates.The following chart shows the foreign exchange rates expressed in Japanese yen per $1.00:
¥/$122
120
118
116
114
108
106
104
102
100
Noon buying rates of the Federal Reserve Bank of New York (End of Month)
110
112
Jan-
03
Mar-
03
May
-03
Jul-0
3
Sep-0
3
Nov-0
3
Jan-
04
Mar-
04
May
-04
Jul-0
4
Sep-0
4
Nov-0
4
Jan-
05
Mar-
05
May
-05
Jul-0
5
Sep-0
5
Nov-0
5
Jan-
06
Mar-
06
Jul-0
6
May
-06
Based on the average government-set official land prices as of January 1, 2006, average land prices in Japancontinued to decline, but in major metropolitan areas, such as Tokyo, Osaka and Nagoya, land prices showed abottoming-out trend. Nationwide residential land prices and land prices for commercial properties as ofJanuary 1, 2006 both declined 2.7%, compared to a 4.6% decline for residential land prices and a 5.6% declinefor commercial properties in the previous year. Tokyo residential land prices and land prices for commercialproperties as of January 1, 2006 increased 0.8% and 3.0%, respectively, compared to a decline of 1.7% forresidential land prices and a decline of 0.9% for commercial properties in the previous year.
The number of companies who filed for legal bankruptcy filings in Japan during the fiscal year endedMarch 31, 2006 was approximately 9,000, an increase from approximately 6,000 for the previous fiscal year. Thegross amount of liabilities was approximately ¥5.8 trillion, which is relatively unchanged from the previous fiscalyear due to a decrease in large-scale bankruptcies.
International Financial Markets
With respect to the international financial and economic environment for the fiscal year ended March 31,2006, overseas economies such as the United States and China showed steady signs of economic growth.
In the United States, the target for the federal funds rate was raised a total of eight times, from 2.75% to4.75%. The 10-year U.S. treasury note, a benchmark for long-term interest rates, started at around 4.3% in April2005 and climbed to around 4.7% in March 2006. As of mid-September 2006, the federal funds rate was 5.25%and the 10-year yield was around 4.7%.
In the EU, the European Central Bank’s policy rate was also raised twice, from 2.0% to 2.5%, during thefiscal year ended March 31, 2006 and was 3.00% as of mid-September 2006.
48
Critical Accounting Estimates
Our consolidated financial statements are prepared in accordance with US GAAP. Many of the accountingpolicies require management to make difficult, complex or subjective judgments regarding the valuation of assetsand liabilities. The accounting policies are fundamental to understanding our operating and financial review andprospects. The notes to our consolidated financial statements provide a summary of our significant accountingpolicies. The following is a summary of the critical accounting estimates:
Allowance for Credit Losses
The allowance for credit losses represents management’s estimate of probable losses in our loan portfolio.The evaluation process, including credit-ratings and self-assessments, involves a number of estimates andjudgments. The allowance is based on two principles of accounting: (1) Statement of Financial AccountingStandards, or SFAS, No. 5, “Accounting for Contingencies,” which requires that losses be accrued when they areprobable of occurring and can be estimated; and (2) SFAS No. 114, “Accounting by Creditors for Impairment ofa Loan” and SFAS No. 118, “Accounting by Creditors for Impairment of a Loan—Income Recognition andDisclosures,” which require that losses be accrued based on the difference between the present value of expectedfuture cash flows discounted at the loan’s effective interest rate, the fair value of collateral or the loan’sobservable market value and the loan balance.
Our allowance for credit losses consists of an allocated allowance and an unallocated allowance. Theallocated allowance comprises (a) the allowance for specifically identified problem loans, (b) the allowance forlarge groups of smaller balance homogeneous loans, (c) the allowance for loans exposed to specific country riskand (d) the formula allowance. Both the allowance for loans exposed to specific country risk and formulaallowance are provided to performing loans that are not subject to either the allowance for specifically identifiedproblem loans or the allowance for large groups of smaller balance homogeneous loans. The allowance for loansexposed to specific country risk covers transfer risk which is not specifically covered by other types ofallowance. Each of these components is determined based upon estimates that can and do change when actualevents occur.
The allowance for specifically identified problem loans, which represent large-balance, non-homogeneousloans that have been individually determined to be impaired, uses various techniques to arrive at an estimate ofloss. Historical loss information, discounted cash flows, fair value of collateral and secondary market informationare all used to estimate those losses.
Large groups of smaller balance homogeneous loans are collectively evaluated for impairment, and theallowance for such loans is established through a process that begins with estimates of probable losses inherent inthe portfolio. These estimates are based upon various analyses, including historical delinquency and credit lossexperience.
The allowance for loans exposed to specific country risk is based on an estimate of probable losses relatingto our exposure to countries that we identify as having a high degree of transfer risk. We use a country riskgrading system that assigns risk ratings to individual countries. To determine the risk rating, we consider theinstability of foreign currency and difficulties regarding our borrowers’ ability to service their debt.
The formula allowance uses a model based on historical losses as an indicator of future probable losses.However, the use of historical losses is inherently uncertain and as a result could differ from losses incurred inthe future. However, since this history is updated with the most recent loss information, the differences thatmight otherwise occur are mitigated.
Our actual losses could be more or less than the estimates. The unallocated allowance captures losses thatare attributable to various economic events, industry or geographic sectors whose impact on the portfolio have
49

occurred but have yet to be recognized in the allocated allowance. For further information regarding ourallowance for credit losses, see “Item 5.B. Liquidity and Capital Resources—Financial Condition—Allowancefor Credit Losses, Nonperforming and Past Due Loans.”
In addition to the allowance for credit losses on our loan portfolio, we maintain an allowance for creditlosses on off-balance-sheet credit instruments, including commitments to extend credit, a variety of guaranteesand standby letters of credit. Such allowance is included in Other liabilities. With regard to the allocatedallowance for specifically identified credit exposure and the allocated formula allowance, we apply the samemethodology that we use in determining the allowance for loan credit losses.
Determining the adequacy of the allowance for credit losses requires the exercise of considerable judgmentand the use of estimates, such as those discussed above. To the extent that actual losses differ frommanagement’s estimates, additional provisions for credit losses may be required that would adversely impact ouroperating results and financial condition in future periods.
Impairment of Investment Securities
US GAAP requires the recognition in earnings of an impairment loss on investment securities for a declinein fair value that is other than temporary. Determinations of whether a decline is other than temporary ofteninvolves estimating the outcome of future events. Management judgment is required in determining whetherfactors exist that indicate that an impairment loss has been incurred at the balance sheet date. These judgmentsare based on subjective as well as objective factors. We conduct a review semi-annually to identify and evaluateinvestment securities that have indications of possible impairment. The assessment of other than temporaryimpairment requires judgment and therefore can have an impact on the results of operations. Impairment isevaluated considering various factors, and their significance varies from case to case.
Debt and marketable equity securities. In determining whether a decline in fair value below cost is otherthan temporary for a particular security, indicators of an other than temporary decline for both debt andmarketable equity securities include, but are not limited to, the extent of decline in fair value below cost and thelength of time that the decline in fair value below cost has continued. If a decline in fair value below cost is 20%or more or has continued for six months or more, we generally deem such decline as an indicator of an other thantemporary decline. We also consider the current financial condition and near-term prospects of issuers primarilybased on the credit standing of the issuers as determined by our credit rating system.
Certain securities held by BTMU, MUTB and certain other subsidiaries, which primarily consist of debtsecurities issued by the Japanese national government and generally considered to be of minimal credit risk, weredetermined not to be impaired in some cases, on the basis of the respective subsidiary’s ability and positive intentto hold such securities to maturity.
The determination of other than temporary impairment for certain securities held by UnionBanCalCorporation, our U.S. subsidiary, which primarily consist of securities backed by the full faith and credit of theU.S. government and corporate asset-backed and debt securities, are made on the basis of a cash flow analysis ofsecurities and/or the ability of UnionBanCal Corporation to hold such securities to maturity.
The aggregate amount of unrealized losses at March 31, 2006 that we determined to be temporary was¥71,528 million.
Nonmarketable equity securities. Nonmarketable equity securities are equity securities of companies thatare not publicly traded or are thinly traded. Such securities are primarily held at cost less other than temporaryimpairment if applicable. For the securities carried at cost, we consider factors such as the credit standing ofissuers and the extent of decline in net assets of issuers to determine whether the decline is other than temporary.When we determine that the decline is other than temporary, nonmarketable equity securities are written down toour share of the amount of the issuer’s net assets, which approximates fair value. When the decline is other than
50
temporary, certain nonmarketable equity securities issued by public companies, such as preferred stockconvertible to marketable common stock in the future, are written down to fair value estimated by commonly-accepted valuation models, such as option pricing models based on a number of factors, including the quotedmarket price of the underlying marketable common stock, volatility and dividend payments as appropriate.
The markets for equity securities and debt securities are inherently volatile, and the values of both types ofsecurities have fluctuated significantly in recent years. Accordingly, our assessment of potential impairmentinvolves risks and uncertainties depending on market conditions that are global or regional in nature and thecondition of specific issuers or industries, as well as management’s subjective assessment of the estimated futureperformance of investments. If we later conclude that a decline is other than temporary, the impairment loss maysignificantly affect our operating results and financial condition in future periods.
Valuation of Deferred Tax Assets
A valuation allowance for deferred tax assets is recognized if, based on the weight of available evidence, itis more likely than not that some portion or all of the deferred tax assets will not be realized. All availableevidence, both positive and negative, is considered to determine whether, based on the weight of that evidence, avaluation allowance is needed. Future realization of the tax benefit of existing deductible temporary differencesor carryforwards ultimately depends on the existence of sufficient taxable income in future periods.
In determining a valuation allowance, we perform a review of future taxable income (exclusive of reversingtemporary differences and carryforwards) and future reversals of existing taxable temporary differences. Futuretaxable income is developed from forecasted operating results, based on recent historical trends and approvedbusiness plans, the eligible carryforward periods and other relevant factors. For certain subsidiaries where strongnegative evidence exists, such as the existence of significant amounts of operating loss carryforwards, cumulativelosses and the expiration of unused operating loss carryforwards in recent years, a valuation allowance isrecognized against the deferred tax assets to the extent that it is more likely than not that they will not be realized.
Among other factors, forecasted operating results, which serve as the basis of our estimation of futuretaxable income, have a significant effect on the amount of the valuation allowance. In developing forecastedoperating results, we assume that our operating performance is stable for certain entities where strong positiveevidence exists, including core earnings based on past performance over a certain period of time. The actualresults may be adversely affected by unexpected or sudden changes in interest rates as well as an increase incredit-related expenses due to the deterioration of economic conditions in Japan and material declines in theJapanese stock market to the extent that such impacts exceed our original forecast. In addition, near-term taxableincome is also influential on the amount of the expiration of unused operating loss carryforwards since taxregulations permit net operating losses to be deducted for a predetermined period generally no longer than sevenyears. At March 31, 2006, we had operating loss carryforwards of ¥4,036.8 billion, the majority of which willexpire by March 31, 2010.
Because the establishment of the valuation allowance is an inherently uncertain process involving estimatesas discussed above, the currently established allowance may not be sufficient. If the estimated allowance is notsufficient, we will incur additional deferred tax expenses, which could materially affect our operating results andfinancial condition in future periods.
Accounting for Goodwill and Intangible Assets
US GAAP requires us to test goodwill for impairment at least annually, or more frequently if events orchanges in circumstances indicate that goodwill may be impaired, using a two-step process that begins with anestimation of the fair value of a reporting unit of our business, which is to be compared with the carrying amountof the unit, to identify potential impairment of goodwill. A reporting unit is an operating segment or componentof an operating segment that constitutes a business for which discrete financial information is available and isregularly reviewed by management. The fair value of a reporting unit is defined as the amount at which the unit
51

as a whole could be bought or sold in a current transaction between willing parties. Since an observable quotedmarket price for a reporting unit is not always available, the fair value of the reporting units are determined usinga combination of valuation techniques consistent with the income approach and market approach. In the incomeapproach, discounted cash flows were calculated by taking the net present value based on each reporting unit’sinternal forecasts. Cash flows were discounted using a discount rate approximating the weighted average cost ofcapital after making adjustments for risks inherent in the cash flows. In the market approach, analysis usingmarket-based trading and transaction multiples was used. If the carrying amount of a reporting unit exceeds itsestimated fair value, the second step of the goodwill impairment test is performed to measure the amount ofimpairment loss recorded in income. This test requires comparison of the implied fair value of the unit’s goodwillwith the carrying amount of that goodwill. The estimate of the implied fair value of the reporting unit’s goodwillrequires us to allocate the fair value of a reporting unit to all of the assets and liabilities of that reporting unit,including unrecognized intangible assets, if any, since the implied fair value is determined as the excess of thefair value of a reporting unit over the net amounts assigned to its assets and liabilities in the allocation.Accordingly, the second step of the impairment test also requires an estimate of the fair value of individual assetsand liabilities, including any unrecognized intangible assets that belong to that unit.
In connection with our merger with UFJ Holdings, we recorded goodwill of ¥1,733.1 billion, and goodwillwas not impaired as of March 31, 2006, nor was any goodwill written off during the fiscal year ended March 31,2006. See note 2 to our consolidated financial statements for more information on the goodwill acquired inconnection with the merger with UFJ Holdings, and note 10 to our consolidated financial statements for moreinformation on goodwill by major business segments.
Intangible assets are amortized over their estimated useful life unless they have indefinite useful lives.Amortization for intangible assets is computed in a manner that best reflects the economic benefits of theintangible assets. Intangible assets having indefinite useful lives are subject to annual impairment tests. Animpairment exists if the carrying value of an indefinite-lived asset exceeds its fair value. For other intangibleassets subject to amortization, an impairment is recognized if the carrying amount exceeds the fair value of theintangible asset.
Accrued Severance Indemnities and Pension Liabilities
We have defined benefit retirement plans, including lump-sum severance indemnities and pension plans,which cover substantially all of our employees. Severance indemnities and pension costs are calculated basedupon a number of actuarial assumptions, including discount rates, expected long-term rates of return on our planassets and rates of increase in future compensation levels. In accordance with US GAAP, actual results that differfrom the assumptions are accumulated and amortized over future periods, and affect our recognized net periodicpension costs and accrued severance indemnities and pension obligations in future periods. We had anunrecognized net actuarial gain for domestic severance indemnities and pension plans of ¥58.7 billion atMarch 31, 2006. Differences in actual experience or changes in assumptions may affect our financial conditionand operating results in future periods.
The discount rates for the domestic plans are set to reflect the interest rates of high-quality fixed-rateinstruments with maturities that correspond to the timing of future benefit payments.
In developing our assumptions for expected long-term rates of return, we refer to the historical averagereturns earned by the plan assets and the rates of return expected to be available for reinvestment of existing planassets, which reflect recent changes in trends and economic conditions, including market price. We also evaluateinput from our actuaries, including their reviews of asset class return expectations.
Valuation of Financial Instruments with No Available Market Prices
Fair values for the substantial majority of our portfolio of financial instruments, including available-for-saleand held-to-maturity securities, trading accounts and derivatives, with no available market prices are determinedbased upon externally verifiable model inputs and quoted prices. All financial models, which are used for
52

independent risk monitoring, must be validated and periodically reviewed by qualified personnel independent ofthe area that created the model. The fair value of derivatives is determined based upon liquid market pricesevidenced by exchange-traded prices, broker-dealer quotations or prices of other transactions with similarly ratedcounterparties. If available, quoted market prices provide the best indication of value. If quoted market prices arenot available for fixed maturity securities and derivatives, we discount expected cash flows using market interestrates commensurate with the credit quality and maturity of the investment. Alternatively, we may use matrix ormodel pricing to determine an appropriate fair value. In determining fair values, we consider various factors,including time value, volatility factors and underlying options, warrants and derivatives.
The estimated fair values of financial instruments without quoted market prices were as follows:
At March 31,
2005 2006
(in billions)
Financial assets:Trading account assets, excluding derivatives . . . . . . . . . . . . . . . . . ¥ 5,268 ¥ 6,790Investment securities . . . . . . . . . . . . . . . . . . . . . . . . . . . . . . . . . . . . . 25,385 40,343Derivative financial instruments, net . . . . . . . . . . . . . . . . . . . . . . . . 34 —
Financial liabilities:Trading account liabilities, excluding derivatives . . . . . . . . . . . . . . 7 119Obligations to return securities received as collateral . . . . . . . . . . . 3,015 3,946Derivative financial instruments, net . . . . . . . . . . . . . . . . . . . . . . . . — 219
A significant portion of trading account assets and liabilities, excluding derivatives, investment securitiesand obligations to return securities received as collateral consists of Japanese national government and agencybonds, and foreign government and official institutions bonds, for which prices are actively quoted amongbrokers and are readily available but are not publicly reported and therefore are not considered quoted marketprices. Additionally, a substantial portion of derivative financial instruments are comprised of over-the-counterinterest rate and currency swaps and options. Estimates of fair value of these derivative transactions aredetermined using quantitative models with multiple market inputs, which can be validated through externalsources, including brokers and market transactions with third parties.
Accounting Changes
Variable Interest Entities—In January 2003, the Financial Accounting Standards Board, or the FASB,issued FASB Interpretation, or FIN, No. 46, “Consolidation of Variable Interest Entities, an interpretation ofARB No. 51.” FIN No. 46 addresses consolidation by business enterprises of variable interest entities, or VIEs.The consolidation requirements of FIN No. 46 applied immediately to VIEs created after January 31, 2003. Wehave applied, as required, FIN No. 46 to all VIEs created after January 31, 2003. The consolidation requirementsapply to older entities in the first fiscal year or interim period beginning after June 15, 2003, which has beenamended by the FASB as described below.
In December 2003, the FASB issued FIN No. 46 (revised December 2003), “Consolidation of VariableInterest Entities, an interpretation of ARB No. 51,” or FIN No. 46R. FIN No. 46R modified FIN No. 46 in certainrespects, including the scope exception, the definition of VIEs, and other factors that effect the determination ofVIEs and primary beneficiaries that must consolidate VIEs. FIN No. 46R, as written, applies to VIEs createdbefore February 1, 2003 no later than the end of the first reporting period that ends after March 15, 2004, and toall special purpose entities no later than the first reporting period that ends after December 15, 2003. Subsequentto the issuance of FIN No. 46R, the Chief Accountant of the U.S. Securities and Exchange Commission, or SEC,stated the SEC staff’s position in a letter to the American Institute of Certified Public Accountants, or AICPA,dated March 3, 2004, that the SEC staff did not object to the conclusion that FIN No. 46R should not be requiredto be applied at a date earlier than the original FIN No. 46 and that foreign private issuers would be required to
53

apply FIN No. 46R at various dates depending on the entity’s year-end and the frequency of interim reporting. Inaccordance with the letter, we adopted FIN No. 46R on April 1, 2004, except for certain investment companies,for which the effective date of FIN No. 46R was deferred. Under FIN No. 46R, any difference between the netamount added to the balance sheet and the amount of any previously recognized interest in the VIE is recognizedas a cumulative effect of a change in accounting principle. The cumulative effect of the change in accountingprinciple was to decrease net income by ¥977 million for the fiscal year ended March 31, 2005. See note 27 toour consolidated financial statements for further discussion of VIEs in which we hold variable interests.
Accounting for Certain Loans and Debt Securities Acquired in a Transfer—In December 2003, the AICPAissued Statement of Position 03-3, “Accounting for Certain Loans or Debt Securities Acquired in a Transfer,” orSOP 03-3, which supersedes AICPA Practice Bulletin 6, “Amortization of Discounts on Certain Acquired Loans”and addresses accounting for differences between contractual cash flows and cash flows expected to be collectedfrom an investor’s initial investment in loans or debt securities acquired in a transfer if those differences areattributable, at least, in part, to credit quality. SOP 03-3 requires acquired impaired loans for which it is probablethat the investor will be unable to collect all contractually required payments receivable to be recorded at thepresent value of amounts expected to be received and prohibits carrying over or creation of valuation allowancesin the initial accounting for these loans. SOP 03-3 also limits accretable yield to the excess of the investor’sestimate of undiscounted cash flows over the investor’s initial investment in the loan and prohibits therecognition of the non-accretable difference. Subsequent increases in cash flows expected to be collectedgenerally should be recognized prospectively through adjustment of the loan’s yield over its remaining life whileany decreases in such cash flows should be recognized as impairments. SOP 03-3 also provides guidance withregard to presentation and disclosures. SOP 03-3 was effective for loans and debt securities acquired in fiscalyears beginning after December 15, 2004. Effective April 1, 2005, we adopted SOP 03-3 for loans and debtsecurities acquired subsequent to March 31, 2005, including those due to the merger. See note 7 to ourconsolidated financial statements for disclosures of acquired loans within the scope of SOP 03-3. We did notacquire any material debt securities covered by SOP 03-3 during the fiscal year ended March 31, 2006.
Accounting for Conditional Asset Retirement Obligations—In March 2005, the FASB issued FIN No. 47,“Accounting for Conditional Asset Retirement Obligations—an interpretation of FASB Statement No. 143.” FINNo. 47 clarifies that the term “conditional asset retirement obligation” as used in SFAS No. 143, “Accounting forAsset Retirement Obligations” refers to a legal obligation to perform an asset retirement activity in which thetiming and (or) method of settlement are conditional on a future event that may or may not be within the controlof the entity. The obligation to perform the asset retirement activity is unconditional even though uncertaintyexists about the timing and (or) method of settlement. SFAS No. 143 acknowledges that in some cases, sufficientinformation may not be available to reasonably estimate the fair value of an asset retirement obligation. FIN No.47 also clarifies when an entity would have sufficient information to reasonably estimate the fair value of anasset retirement obligation. FIN No. 47 is effective no later than the end of fiscal years ending after December15, 2005. Effective March 31, 2006, we adopted FIN No. 47 to existing asset retirement obligations associatedwith commitments to return property subject to operating leases to its original condition upon lease termination.The cumulative effect of the change in accounting principle was to decrease net income by ¥9,662 million. Thisadjustment represents the cumulative depreciation and accretion that would have been recognized through thedate of adoption of FIN No. 47 had the statement applied to our existing asset retirement obligations at the timethey were initially incurred.
54

Had the asset retirement obligations been accounted for under this Interpretation at the inception ofoperating leases requiring restoration, our net income and net income per share would have been the pro formaamounts indicated in the following table:
Fiscal years ended March 31,
2004 2005 2006
(in millions)
Reported net income . . . . . . . . . . . . . . . . . . . . . . . . . . . . . . . . . . . . . . . . ¥ 823,002 ¥ 415,155 ¥ 363,511Cumulative effect of a change in accounting principle related to
adoption of FIN No. 47, net of taxes:Reported . . . . . . . . . . . . . . . . . . . . . . . . . . . . . . . . . . . . . . . . . . . . . — — 9,662Pro forma . . . . . . . . . . . . . . . . . . . . . . . . . . . . . . . . . . . . . . . . . . . . . 672 667 516
Pro forma net income, after cumulative effect of a change inaccounting principle related to adoption of FIN No. 47, net oftaxes . . . . . . . . . . . . . . . . . . . . . . . . . . . . . . . . . . . . . . . . . . . . . . . . . . . ¥ 822,330 ¥ 414,488 ¥ 372,657
Basic earnings per common share—net income available to commonshareholders: (in Yen)
Reported . . . . . . . . . . . . . . . . . . . . . . . . . . . . . . . . . . . . . . . . . . . . . ¥128,350.88 ¥62,717.21 ¥19,313.78Pro forma . . . . . . . . . . . . . . . . . . . . . . . . . . . . . . . . . . . . . . . . . . . . . 128,350.77 62,717.11 19,314.91
Diluted earnings per common share—net income available to commonshareholders:
Reported . . . . . . . . . . . . . . . . . . . . . . . . . . . . . . . . . . . . . . . . . . . . . 125,033.96 62,476.76 18,951.87Pro forma . . . . . . . . . . . . . . . . . . . . . . . . . . . . . . . . . . . . . . . . . . . . . 125,033.85 62,476.66 18,953.00
Impairment of Securities Investments—In November 2003, the FASB Emerging Issues Task Force, or theEITF, reached a consensus on Issue No. 03-1, “The Meaning of Other-Than-Temporary Impairment and ItsApplication to Certain Investments,” or EITF 03-1. EITF 03-1 requires certain additional quantitative andqualitative disclosures in addition to the disclosures already required by SFAS No. 115, “Accounting for CertainInvestments in Debt and Equity Securities”. The new disclosure requirements apply to financial statements forthe fiscal years ending after December 15, 2003. See note 6 to our consolidated financial statements for therequired disclosures. In March 2004, the EITF also reached a consensus on additional accounting guidance forother than temporary impairments, which requires an evaluation and recognition of other than temporaryimpairment by a three-step impairment test. The guidance should be applied for reporting periods beginning afterJune 15, 2004. On September 30, 2004, FASB Staff Position EITF Issue 03-1-1, “The Meaning of Other-Than-Temporary Impairment and Its Application to Certain Investments” delayed the effective date for themeasurement and recognition guidance contained in paragraphs 10 through 20 of EITF 03-1. In November 2005,the FASB staff issued an FSP on SFAS No. 115 and No. 124, “The Meaning of Other-Than-TemporaryImpairment and Its Application to Certain Investments” to provide implementation guidance related to this topic.See Recently Issued Accounting Pronouncements for our evaluation of the effect of the measurement andrecognition provision of the FSP.
Transfer to the Japanese Government of the Substitutional Portion of Employee Pension Fund Liabilities—In January 2003, the EITF reached a consensus on Issue No. 03-2, “Accounting for the Transfer to the JapaneseGovernment of the Substitutional Portion of Employee Pension Fund Liabilities,” or EITF 03-2, which wasratified by the FASB in February 2003. EITF 03-2 addresses accounting for a transfer to the Japanesegovernment of a substitutional portion of an employee pension fund and requires employers to account for theentire separation process of the substitutional portion from an entire plan upon completion of the transfer to thegovernment of the substitutional portion of the benefit obligation and related plan assets as the culmination of aseries of steps in a single settlement transaction. It also requires that the difference between the fair value of theobligation and the assets required to be transferred to the government, if any, should be accounted for as asubsidy from the government, separately from gain or loss on settlement of the substitutional portion of theobligation, upon completion of the transfer.
55

In June 2003, ex-BTM submitted to the government an application to transfer the obligation to pay benefitsfor future employee service related to the substitutional portion and the application was approved in August2003. In August 2004, ex-BTM made another application for transfer to the government of the remainingsubstitutional portion and the application was approved in November 2004. The substitutional obligation andrelated plan assets were transferred to a government agency in March 2005 and ex-BTM was released frompaying the substitutional portion of the benefits to its employees. The completion of the transfer to the JapaneseGovernment of the substitutional portion of the employee pension plan constituted a settlement of such plan.However, since there remains a defined benefit plan and the settlement occurred subsequent to December 31,2004 (the measurement date of such plan), we recognized net gains of ¥34,965 million as a result of the transfer /settlement for the fiscal year ended March 31, 2006. See note 18 for further discussion.
Recently Issued Accounting Pronouncements
Share-Based Payment—In December 2004, the FASB issued SFAS No. 123 (revised 2004), “Share-BasedPayment,” or SFAS No. 123R, which replaces SFAS No. 123, “Accounting for Stock-Based Compensation,” andsupersedes Accounting Principles Board Opinion, or APB, No. 25, “Accounting for Stock Issued to Employees.”In March 2005, the SEC issued Staff Accounting Bulletin, or SAB, No. 107, which provides interpretiveguidance on SFAS No. 123R. SFAS No. 123 preferred a fair-value-based method of accounting for share-basedpayment transactions with employees, but it permitted the option of continuing to apply the intrinsic-value-basedmeasurement method in APB No. 25, as long as the footnotes to the financial statements disclosed what netincome would have been had the preferable fair-value-based method been used. SFAS No. 123R eliminates thealternative to use the intrinsic value method of accounting and requires entities to recognize the costs of share-based payment transactions with employees based on the grant-date fair value of those awards over the periodduring which an employee is required to provide service in exchange for the award. SFAS No. 123R is effectiveas of the beginning of the fiscal year or interim period beginning after June 15, 2005. We adopted SFASNo. 123R on April 1, 2006 under the modified prospective method, which is expected, based upon currentprojections, to result in an increase in non-interest expense of approximately ¥2 billion for the fiscal year endingMarch 31, 2007. See note 1 to our consolidated financial statements for the pro forma information as if the fairvalue based method had been applied to all awards in accordance with SFAS No. 123.
Exchanges of Nonmonetary Assets—In December 2004, the FASB issued SFAS No. 153, “Exchanges ofNonmonetary Assets, an amendment of APB Opinion No. 29.” The guidance in APB No. 29, “Accounting forNonmonetary Transactions,” is based on the principle that exchanges of nonmonetary assets should be measuredbased on the fair value of the assets exchanged. The guidance in APB No. 29, however, included certainexceptions to that principle. SFAS No. 153 amends APB No. 29 to eliminate the exception for nonmonetaryexchanges of similar productive assets and replaces it with a general exception for exchanges of nonmonetaryassets that do not have commercial substance. A nonmonetary exchange has commercial substance if the futurecash flows of the entity are expected to change significantly as a result of the exchange. SFAS No. 153 iseffective for nonmonetary asset exchanges occurring in fiscal periods beginning after June 15, 2005, with earlieradoption permitted. We have not completed the study of what effect SFAS No. 153 will have on our financialposition and results of operations.
Accounting Changes and Error Corrections—In May 2005, the FASB issued SFAS No. 154, “AccountingChanges and Error Corrections—a replacement of APB Opinion No. 20 and FASB Statement No. 3.” SFASNo. 154 replaces APB No. 20, “Accounting Changes,” and SFAS No. 3, “Reporting Accounting Changes inInterim Financial Statements,” and changes the requirements for the accounting for and reporting of a change inaccounting principle. SFAS No. 154 applies to all voluntary changes in accounting principle. SFAS No. 154 alsoapplies to changes required by an accounting pronouncement in the unusual instance that the pronouncementdoes not include specific transition provisions. SFAS No. 154 is effective for accounting changes and correctionsof errors made in fiscal years beginning after December 15, 2005, with earlier adoption permitted. Accordingly,we cannot reasonably estimate the ultimate impact of SFAS No. 154.
56

The Meaning of Other Than Temporary Impairment and Its Application to Certain Investments—InNovember 2005, the FASB staff issued an FSP on SFAS No. 115 and No. 124. This FSP addresses thedetermination as to when an investment is considered impaired, whether that impairment is other than temporary,and the measurement of an impairment loss. This FSP also includes accounting considerations subsequent to therecognition of an other than temporary impairment and requires certain disclosures about unrealized losses thathave not been recognized as other than temporary impairments. The guidance in this FSP is applicable for certaininvestments such as debt and equity securities that are within the scope of SFAS No. 115 and equity securitiesthat are not subject to the scope of SFAS No. 115 and not accounted for under the equity method pursuant toAPB No. 18, “The Equity Method of Accounting for Investments in Common Stock,” and related interpretations.This FSP nullifies the requirements of paragraphs 10-18 of EITF 03-1 and supersedes EITF Topic No. D-44,“Recognition of Other-Than-Temporary Impairment upon the Planned Sale of a Security Whose Cost ExceedsFair Value.” This FSP carries forward the requirements of paragraphs 8 and 9 of EITF 03-1 with respect to cost-method investments, and carries forward the disclosure requirements included in paragraphs 21 and 22 of EITF03-1. Also the guidance in this FSP amends SFAS No. 115, SFAS No. 124, “Accounting for Certain InvestmentsHeld by Not-for-Profit Organizations,” and APB No. 18. The guidance in this FSP shall be applied to reportingperiods beginning after December 15, 2005, with earlier application permitted. We have not completed the studyof what effect the FSP will have on our financial position and results of operations.
Accounting for Certain Hybrid Financial Instruments—In February 2006, the FASB issued SFAS No. 155,“Accounting for Certain Hybrid Financial Instruments.” SFAS No. 155 amends SFAS No. 133, “Accounting forDerivative Instruments and Hedging Activities,” and SFAS No. 140, “Accounting for Transfers and Servicing ofFinancial Assets and Extinguishments of Liabilities” and resolves issues addressed in SFAS No. 133Implementation Issue D1, “Application of Statement 133 to Beneficial Interests in Securitized Financial Assets.”SFAS No. 155 permits fair value remeasurement for any hybrid financial instrument that contains an embeddedderivative that otherwise would require bifurcation and clarifies which interest-only strips and principal-onlystrips are not subject to the requirements of SFAS No. 133. SFAS No. 155 establishes a requirement to evaluateinterests in securitized financial assets to identify interests that are freestanding derivatives or that are hybridfinancial instruments that contain an embedded derivative requiring bifurcation. SFAS No. 155 also clarifies thatconcentrations of credit risk in the form of subordination are not embedded derivatives and amends SFASNo. 140 to eliminate the prohibition on a qualifying special purpose entity from holding a derivative financialinstrument that pertains to a beneficial interest other than another derivative financial instrument. SFAS No. 155is effective for all financial instruments acquired or issued after the beginning of an entity’s first fiscal year thatbegins after September 15, 2006. We have not completed the study of what effect SFAS No. 155 will have on ourfinancial position and results of operations.
Accounting for Servicing of Financial Assets—In March 2006, the FASB issued SFAS No. 156,“Accounting for Servicing of Financial Assets.” SFAS No. 156 amends SFAS No. 140 with respect to theaccounting for separately recognized servicing assets and servicing liabilities. SFAS No. 156 requires an entity torecognize a servicing asset or servicing liability each time it undertakes an obligation to service a financial assetby entering into a servicing contract, and requires all separately recognized servicing assets and servicingliabilities to be initially measured at fair value, if practicable. SFAS No. 156 permits an entity to choose eitherthe amortization method or the fair value measurement method for each class of separately recognized servicingassets and servicing liabilities. SFAS No. 156 requires separate presentation of servicing assets and servicingliabilities subsequently measured at fair value in the statement of financial position and additional disclosures forall separately recognized servicing assets and servicing liabilities. SFAS No. 156 is effective for the fiscal yearbeginning after September 15, 2006. Earlier adoption is permitted. We have not completed the study of whateffect SFAS No. 156 will have on our financial position and results of operations.
Determining the Variability to Be Considered in Applying FIN No. 46R—In April 2006, the FASB staffissued an FSP on FIN No. 46R-6, “Determining the Variability to Be Considered in Applying FASBInterpretation No. 46(R).” This FSP states that the variability to be considered in applying FIN No. 46R shall bebased on an analysis of the design of the entity as outlined in the following two steps: (a) analyze the nature ofthe risks in the entity, (b) determine the purpose for which the entity was created and determine the variability
57

(created by the risks identified in step (a)) the entity is designed to create and pass along to its interest holders.For the purposes of this FSP, interest holders include all potential variable interest holders (including contractual,ownership, or other pecuniary interests in the entity). After determining the variability to be considered, thereporting enterprise can determine which interests are designed to absorb that variability. The FSP should beapplied prospectively to all entities (including newly created entities) with which an enterprise first becomesinvolved, and to all entities previously required to be analyzed under FIN No. 46R when a reconsideration eventhas occurred beginning the first day of the first reporting period beginning after June 15, 2006. Early applicationis permitted for periods for which financial statements have not yet been issued. Retrospective application to thedate of the initial application of FIN No. 46R is permitted but not required. If retrospective application is elected,it must be completed no later than the end of the first annual reporting period ending after July 15, 2006. Wehave not completed the study of what effect the FSP will have on our financial position and results of operations.
Uncertainty in Income Taxes—In June 2006, the FASB issued FIN No. 48, “Accounting for Uncertainty inIncome Taxes.” FIN No. 48 requires recognition of a tax benefit to the extent of management’s best estimate ofthe impact of a tax position, provided it is more likely than not that the tax position will be sustained uponexamination, including resolution of any related appeals or litigation processes, based on the technical merits ofthe position. FIN No. 48 also provides guidance on derecognition, classification, interest and penalties,accounting in interim periods, disclosure, and transition. FIN No. 48 is effective for fiscal years beginning afterDecember 15, 2006. We have not completed the study of what effect FIN No. 48 will have on our financialposition and results of operations.
Fair Value Measurements—In September 2006, the FASB issued SFAS No. 157, “Fair ValueMeasurements.” SFAS No. 157 defines fair value, establishes a framework for measuring fair value in generallyaccepted accounting principles, and expands disclosures about fair value measurements. SFAS No. 157 appliesunder other accounting pronouncements that require or permit fair value measurements, the FASB havingpreviously concluded in those accounting pronouncements that fair value is the relevant measurement attribute.Accordingly, SFAS No. 157 does not require any new fair value measurements. Under SFAS No. 157, fair valuerefers to the price that would be received to sell an asset or paid to transfer a liability in an orderly transactionbetween market participants in the market in which the reporting entity transacts. SFAS No. 157 clarifies theprinciple that fair value should be based on the assumptions market participants would use when pricing the assetor liability. In support of this principle, SFAS No. 157 establishes a fair value hierarchy that prioritizes theinformation used to develop those assumptions. The fair value hierarchy gives the highest priority to quotedprices in active markets and the lowest priority to unobservable data, for example, the reporting entity’s owndata. Under SFAS No. 157, fair value measurements would be separately disclosed by level within the fair valuehierarchy. SFAS No. 157 is effective for financial statements issued for fiscal years beginning after November15, 2007, and interim periods within those fiscal years, with early adoption permitted. We have not completedthe study of what effect SFAS No. 157 will have on our financial position and results of operations.
58

Results of Operations
The following table sets forth a summary of our results of operations for the fiscal years ended March 31,2004, 2005 and 2006:
As discussed in “Recent Developments—Sale of UnionBanCal’s International Correspondent BankingBusiness,” certain figures in prior fiscal years were reclassified to discontinued operations to conform to thepresentation for the fiscal year ended March 31, 2006.
Fiscal years ended March 31,
2004 2005 2006
(in billions)
Interest income . . . . . . . . . . . . . . . . . . . . . . . . . . . . . . . . . . . . . . . . . . . . . . . . . . . ¥1,417.9 ¥1,438.7 ¥2,530.7Interest expense . . . . . . . . . . . . . . . . . . . . . . . . . . . . . . . . . . . . . . . . . . . . . . . . . . . 425.2 469.6 882.1
Net interest income . . . . . . . . . . . . . . . . . . . . . . . . . . . . . . . . . . . . . . . . . . . . . . . . 992.7 969.1 1,648.6
Provision (credit) for credit losses . . . . . . . . . . . . . . . . . . . . . . . . . . . . . . . . . . . . (114.4) 108.3 110.2Non-interest income . . . . . . . . . . . . . . . . . . . . . . . . . . . . . . . . . . . . . . . . . . . . . . . 1,298.7 986.8 1,067.4Non-interest expense . . . . . . . . . . . . . . . . . . . . . . . . . . . . . . . . . . . . . . . . . . . . . . . 1,229.4 1,129.2 2,076.1
Income from continuing operations before income tax expense and cumulativeeffect of a change in accounting principle . . . . . . . . . . . . . . . . . . . . . . . . . . . . 1,176.4 718.4 529.7
Income tax expense . . . . . . . . . . . . . . . . . . . . . . . . . . . . . . . . . . . . . . . . . . . . . . . . 355.3 303.8 165.5
Income from continuing operations before cumulative effect of a change inaccounting principle . . . . . . . . . . . . . . . . . . . . . . . . . . . . . . . . . . . . . . . . . . . . . 821.1 414.6 364.2
Income from discontinued operations—net . . . . . . . . . . . . . . . . . . . . . . . . . . . . . 1.9 1.5 9.0Cumulative effect of a change in accounting principle, net of tax . . . . . . . . . . . . — (0.9) (9.7)
Net income . . . . . . . . . . . . . . . . . . . . . . . . . . . . . . . . . . . . . . . . . . . . . . . . . . . . . . ¥ 823.0 ¥ 415.2 ¥ 363.5
We reported ¥363.5 billion of net income for the fiscal year ended March 31, 2006, compared to ¥415.2billion of net income for the fiscal year ended March 31, 2005. Our basic earnings per common share (net incomeavailable to common shareholders) for the fiscal year ended March 31, 2006 was ¥19,313.78, compared with anearnings per share of ¥62,717.21 for the fiscal year ended March 31, 2005. Income from continuing operationsbefore income tax expense and cumulative effect of a change in accounting principle for the fiscal year endedMarch 31, 2006 was ¥529.7 billion, compared with ¥718.4 billion for the fiscal year ended March 31, 2005.
Due to our merger with UFJ Holdings on October 1, 2005, the results for the fiscal year ended March 31,2006 reflect six months of results for MTFG prior to the merger and six months of results for MUFG after themerger, while the results for the fiscal years ended March 31, 2004 and 2005 reflect the results of MTFG only.The merger with UFJ Holdings was the major factor in the changes in many of the items in our consolidatedstatement of income as well as our consolidated balance sheet for the fiscal year ended March 31, 2006.
Net Interest Income
Net interest income is a function of:
• the amount of interest-earning assets;
• the general level of interest rates;
• the so-called “spread,” or the difference between the rate of interest earned on interest-earning assetsand the rate of interest paid on interest-bearing liabilities; and
• the proportion of interest-earning assets financed by non-interest-bearing liabilities and equity.
Our net interest income for the fiscal years ended March 31, 2004, 2005 and 2006 were not materiallyaffected by gains or losses resulting from derivative financial instruments used for hedging purposes.
59

The following is a summary of the interest rate spread for the fiscal years ended March 31, 2004, 2005 and2006:
Fiscal years ended March 31,
2004 2005 2006
Averagebalance
Averagerate
Averagebalance
Averagerate
Averagebalance
Averagerate
(in billions, except percentages)
Interest-earning assets:Domestic . . . . . . . . . . . . . . . . . . . . . . . . . ¥67,520.7 1.06% ¥76,424.5 0.96% ¥104,942.8 1.30%Foreign . . . . . . . . . . . . . . . . . . . . . . . . . . 23,132.8 3.04 22,857.6 3.07 30,442.5 3.85
Total . . . . . . . . . . . . . . . . . . . . . . . . ¥90,653.5 1.56% ¥99,282.1 1.45% ¥135,385.3 1.87%
Financed by:Interest-bearing funds:
Domestic . . . . . . . . . . . . . . . . . . . . . . . . . ¥70,151.2 0.31% ¥77,195.3 0.30% ¥ 98,788.9 0.37%Foreign . . . . . . . . . . . . . . . . . . . . . . . . . . 14,709.1 1.41 15,031.5 1.58 19,331.3 2.65
Total . . . . . . . . . . . . . . . . . . . . . . . . 84,860.3 0.50 92,226.8 0.51 118,120.2 0.75Non-interest-bearing funds . . . . . . . . . . . . . . . 5,793.2 — 7,055.3 — 17,265.1 —
Total . . . . . . . . . . . . . . . . . . . . . . . . . . . . ¥90,653.5 0.46% ¥99,282.1 0.47% ¥135,385.3 0.65%
Spread on:Interest-bearing funds . . . . . . . . . . . . . . . 1.06% 0.94% 1.12%Total funds . . . . . . . . . . . . . . . . . . . . . . . 1.10% 0.98% 1.22%
Fiscal Year Ended March 31, 2006 Compared to Fiscal Year Ended March 31, 2005
Net interest income for the fiscal year ended March 31, 2006 was ¥1,648.6 billion, an increase of ¥679.5billion, from ¥969.1 billion for the fiscal year ended March 31, 2005. This increase was mainly due to the mergerwith UFJ Holdings on October 1, 2005. For the fiscal year ended March 31, 2006, interest rates in the United Statesand Europe generally increased. The increase in foreign interest rates also contributed to the increase in our netinterest income, as the effect of higher foreign interest rates had a larger contributory effect on our interest incomecompared to our interest expense, partly due to the fact that our foreign interest-earning assets’ average balance of¥30,442.5 billion is much larger than the average balance of our foreign interest-bearing liabilities of ¥19,331.3billion.
The average interest rate spread increased, showing an increase of 18 basis points from 0.94% for the fiscalyear ended March 31, 2005 to 1.12% for the fiscal year ended March 31, 2006.
Net interest income as a percentage of average total funds also increased, showing an increase of 24 basispoints from 0.98% for the fiscal year ended March 31, 2005 to 1.22% for the fiscal year ended March 31, 2006.
Average interest-earning assets for the fiscal year ended March 31, 2006 were ¥135,385.3 billion, anincrease of ¥36,103.2 billion, from ¥99,282.1 billion for the fiscal year ended March 31, 2005. The increase wasprimarily attributable to an increase of ¥19,073.1 billion in domestic loans, and an increase of ¥8,302.6 billion indomestic investment securities, which were mainly due to the merger with UFJ Holdings.
Average interest-bearing liabilities for the fiscal year ended March 31, 2006 were ¥118,120.2 billion, anincrease of ¥25,893.4 billion, from ¥92,226.8 billion for the fiscal year ended March 31, 2005. The increase wasalso primarily attributable to the merger with UFJ Holdings, as domestic interest-bearing liabilities increased by¥21,593.6 billion after we acquired the domestic deposit base of UFJ Holdings.
Fiscal Year Ended March 31, 2005 Compared to Fiscal Year Ended March 31, 2004
Net interest income for the fiscal year ended March 31, 2005 was ¥969.1 billion, a decrease of ¥23.6 billion,from ¥992.7 billion for the fiscal year ended March 31, 2004. This decrease was due primarily to the decline inthe average interest rate on domestic interest earning assets and the increase in average rate of foreign interest-
60

bearing funds. In addition, a decrease in the average balance of foreign investment securities which earnrelatively higher yields, contributed to the decrease in net interest income.
The average interest rate spread decreased 12 basis points from 1.06% for the fiscal year ended March 31,2004 to 0.94% for the fiscal year ended March 31, 2005. This decrease was due primarily to the increase inaverage interest rate of foreign interest-bearing funds, reflecting the rise in interest rates on foreign deposits asinterest rates in foreign markets such as the United States rose, and also due to the decline in average interest rateof domestic investment securities and domestic loans. The decline in average interest rate of domestic investmentsecurities was mainly due to the increase in our holdings of Japanese government bonds, as the interest rates onJapanese government bonds are generally lower compared to other domestic investment securities reflecting thelow risk. The decline in average interest rate of domestic loans was mainly due to the reduction of loans withrelatively high interest rates, and due to increased competition in lending to large corporations and in retailhousing loans, which negatively affected the interest rate spread of our loans.
Net interest income as a percentage of average total funds decreased 12 basis points from 1.10% for thefiscal year ended March 31, 2004 to 0.98% for the fiscal year ended March 31, 2005.
Average interest-earning assets for the fiscal year ended March 31, 2005 were ¥99,282.1 billion, an increaseof ¥8,628.6 billion, from ¥90,653.5 billion for the fiscal year ended March 31, 2004. The increase was primarilyattributable to an increase of ¥6,988.7 billion in domestic investment securities, which reflected an increase inour holdings of Japanese government bonds, and an increase of ¥2,054.9 billion in domestic loans. The increasein domestic loans was primarily due to an increase in loans to industries such as manufacturing, real estate,wholesale and retail, and other industries, reflecting the consolidation of certain VIEs in accordance with FINNo. 46R. These increases were partially offset by a decrease of ¥690.0 billion in foreign investment securitiesreflecting the decrease in our holdings of US treasury bonds.
Average interest-bearing liabilities for the fiscal year ended March 31, 2005 were ¥92,226.8 billion, anincrease of ¥7,366.5 billion, from ¥84,860.3 billion for the fiscal year ended March 31, 2004. The increase inaverage interest-bearing liabilities primarily reflected an increase of ¥5,874.0 billion in domestic other short-termborrowings and trading account liabilities, reflecting an increase of funding from the Bank of Japan in connectionwith our daily money market operations, and an increase in commercial paper issued by VIEs consolidated inaccordance with FIN No. 46R.
Provision (Credit) for Credit Losses
Provision (credit) for credit losses are charged to operations to maintain the allowance for credit losses at alevel deemed appropriate by management. For a description of the approach and methodology used to establishthe allowance for credit losses, see “Item 5.B. Liquidity and Capital Resources—Financial Condition—Allowance for Credit Losses, Nonperforming and Past Due Loans.”
Fiscal Year Ended March 31, 2006 Compared to Fiscal Year Ended March 31, 2005
Provision for credit losses for the fiscal year ended March 31, 2006 was ¥110.2 billion, an increase of ¥1.9billion from ¥108.3 billion for the fiscal year ended March 31, 2005. Our loan portfolio and allowance for creditlosses were favorably affected by the upgrades of many borrowers’ credit ratings resulting from improvements intheir business performance mainly attributable to the general recovery in the Japanese economy, as well as upgradesof credit ratings of borrowers to whom we had large exposures who made progress in their restructuring plans.
However, most of the foregoing favorable impact on the quality of our loan portfolio was not reflected inour provision for credit losses in the fiscal year ended March 31, 2006, because any subsequent increases in theexpected cash flows from impaired loans acquired in the merger with UFJ Holdings were not accounted for asreversals of the allowance for credit losses but rather as adjustments to accretable yields under SOP 03-3. On theother hand, the favorable impact on the quality of these loans was reflected in the increase in interest income andthe gains on sales of loans included in non-interest income.
For a further discussion of the adoption of SOP 03-3, see “Basis of Financial Statements and Summary ofSignificant Accounting Policies—Accounting Changes” in note 1 to our consolidated financial statements, and
61

for the allowance for credit losses, see “Item 5.B. Liquidity and Capital Resources—Financial Condition—Allowance for Credit Losses, Nonperforming and Past Due Loans.”
Fiscal Year Ended March 31, 2005 Compared to Fiscal Year Ended March 31, 2004
For the fiscal year ended March 31, 2005, a provision for credit losses of ¥108.3 billion was recorded. Incontrast, for the fiscal year ended March 31, 2004, a reversal of the allowance for credit losses of ¥114.4 billionwas recorded. Although reversals of the allowance for credit losses were recorded for both March 31, 2004 and2005 due to improvements in our loan portfolio as evidenced by the reduction in our nonperforming loans, for thefiscal year ended March 31, 2005, the additional provisions recognized as a result of downgrades of severalborrowers to which we extended relatively large amounts of loans were greater than the reversals recognized.
Non-Interest Income
The following table is a summary of our non-interest income for the fiscal years ended March 31, 2004,2005 and 2006:
Fiscal years ended March 31,
2004 2005 2006
(in billions)
Fees and commissions:Trust fees . . . . . . . . . . . . . . . . . . . . . . . . . . . . . . . . . . . . . . . . . . . . . ¥ 90.0 ¥102.8 ¥ 121.4Fees on funds transfer and service charges for collections . . . . . . . 57.6 60.2 105.5Fees and commissions on international business . . . . . . . . . . . . . . . 47.1 45.1 62.2Fees and commissions on credit card business . . . . . . . . . . . . . . . . 61.0 62.2 110.1Service charges on deposits . . . . . . . . . . . . . . . . . . . . . . . . . . . . . . . 35.6 36.5 35.9Fees and commissions on securities business . . . . . . . . . . . . . . . . . 79.9 104.5 145.2Fees on real estate business . . . . . . . . . . . . . . . . . . . . . . . . . . . . . . . 20.5 31.4 45.8Insurance commissions . . . . . . . . . . . . . . . . . . . . . . . . . . . . . . . . . . 22.6 36.0 48.5Fees and commissions on stock transfer agency services . . . . . . . . 17.4 20.1 39.4Guarantee fees . . . . . . . . . . . . . . . . . . . . . . . . . . . . . . . . . . . . . . . . . 18.3 19.4 53.1Fees on investment funds business . . . . . . . . . . . . . . . . . . . . . . . . . 7.5 11.7 65.9Other fees and commissions . . . . . . . . . . . . . . . . . . . . . . . . . . . . . . . 107.2 111.2 200.3
Total . . . . . . . . . . . . . . . . . . . . . . . . . . . . . . . . . . . . . . . . . . . . . 564.7 641.1 1,033.3
Foreign exchange gains (losses)—net . . . . . . . . . . . . . . . . . . . . . . . . . . . 413.8 (47.2) (322.4)Trading account profits—net . . . . . . . . . . . . . . . . . . . . . . . . . . . . . . . . . . 103.9 62.1 16.4Investment securities gains—net . . . . . . . . . . . . . . . . . . . . . . . . . . . . . . . 117.4 198.0 89.9Equity in earnings of equity method investees . . . . . . . . . . . . . . . . . . . . 5.2 26.3 22.3Refund of the local taxes by the Tokyo Metropolitan Government . . . . . 42.0 — —Government grant for transfer of substitutional portion of Employees’
Pension Fund Plans . . . . . . . . . . . . . . . . . . . . . . . . . . . . . . . . . . . . . . . — — 103.0Gains on sales of loans . . . . . . . . . . . . . . . . . . . . . . . . . . . . . . . . . . . . . . . 0.3 0.6 34.8Other non-interest income . . . . . . . . . . . . . . . . . . . . . . . . . . . . . . . . . . . . 51.4 105.9 90.1
Total non-interest income . . . . . . . . . . . . . . . . . . . . . . . . . . . . ¥1,298.7 ¥986.8 ¥1,067.4
Net foreign exchange gains (losses) primarily include net gains (losses) on currency derivative instrumentsentered into for trading purposes and transaction gains (losses) on the translation into Japanese yen of monetaryassets and liabilities denominated in foreign currencies. The transaction gains (losses) on the translation intoJapanese yen fluctuate from period to period depending upon the spot rates at the end of each fiscal year. This isprimarily because the transaction gains (losses) on translation of securities available for sale, such as bondsdenominated in foreign currencies, are not included in current earnings, but are reflected in other changes inequity from nonowner sources, while in principle all transaction gains (losses) on translation of monetaryliabilities denominated in foreign currencies are included in current earnings.
62

Net trading account profits primarily include net gains (losses) on trading securities and interest ratederivative instruments entered into for trading purposes. Trading account assets or liabilities are carried at fairvalue and any changes in the value of trading account assets or liabilities, including interest rate derivatives, arerecorded in net trading account profits. Derivative instruments for trading purposes also include those used ashedges of net exposures rather than for specifically identified assets or liabilities, which do not meet the specificcriteria for hedge accounting.
Net investment securities gains primarily include net gains on sales of marketable securities, particularlymarketable equity securities. In addition, impairment losses are recognized as an offset of net investment securitiesgains when management concludes that declines in fair value of investment securities are other than temporary.
Fiscal Year Ended March 31, 2006 Compared to Fiscal Year Ended March 31, 2005
Non-interest income for the fiscal year ended March 31, 2006 was ¥1,067.4 billion, an increase of ¥80.6billion, from ¥986.8 billion for the fiscal year ended March 31, 2005. This increase was primarily due to anincrease in fees and commissions of ¥392.2 billion, resulting from the merger with UFJ Holdings. This increasewas partially offset by the increase in foreign exchange losses of ¥275.2 billion.
Regarding factors other than the merger, fees and commissions for the fiscal year ended March 31, 2006increased from our securities business due mainly to the improvement in the Japanese stock market, andincreased fees related to the real estate business and sales of investment and insurance products to retailcustomers.
Net foreign exchange losses for the fiscal year ended March 31, 2006 were ¥322.4 billion, compared to netforeign exchange losses of ¥47.2 billion for the fiscal year ended March 31, 2005. The increase in foreignexchange losses was due mainly to the larger depreciation of the yen against foreign currencies in the fiscal yearended March 31, 2006, compared to the fiscal year ended March 31, 2005. For reference, the noon buying rateexpressed in Japanese yen per $1.00 was ¥104.18 at March 31, 2004, ¥107.22 at March 31, 2005, and ¥117.48 atMarch 31 2006. This increase in net foreign exchange losses primarily reflected an increase in transaction losseson translation of monetary liabilities denominated in foreign currencies. All transaction gains or losses ontranslation of monetary liabilities denominated in foreign currencies are included in current earnings. However,the transaction gains or losses on translation of securities available for sale, such as bonds denominated in foreigncurrencies, are not included in current earnings but are reflected in other changes in equity from nonownersources. As we maintain monetary liabilities denominated in foreign currencies for our asset liabilitymanagement, net foreign exchange gains (losses) fluctuate with the appreciation (depreciation) of the yen.
Net trading account profits of ¥16.4 billion were recorded for the fiscal year ended March 31, 2006,compared to net trading account profits of ¥62.1 billion for the fiscal year ended March 31, 2005. The net tradingaccount profits for the fiscal years ended March 31, 2005 and 2006 consisted of the following:
Fiscal years ended March 31,
2005 2006
(in billions)
Net profits (losses) on derivative instruments, primarily interest-rate futures, swapsand options . . . . . . . . . . . . . . . . . . . . . . . . . . . . . . . . . . . . . . . . . . . . . . . . . . . . . . . . . ¥ 6.4 ¥(347.1)
Net profits on trading securities . . . . . . . . . . . . . . . . . . . . . . . . . . . . . . . . . . . . . . . . . . . 55.7 363.5
Net trading account profits . . . . . . . . . . . . . . . . . . . . . . . . . . . . . . . . . . . . . . . . . . . ¥62.1 ¥ 16.4
The net losses on derivative instruments, primarily interest-rate futures, swaps and options mainly reflectedlosses due to the rise in interest rates. These losses were partially offset by the increase in profits on tradingsecurities, caused by an increase in profits from trading of debt and equity securities at MUS, and trading accountprofits from gains in investment trusts.
63

Net investment securities gains for the fiscal year ended March 31, 2006 were ¥89.9 billion, a decrease of¥108.1 billion, from ¥198.0 billion for the fiscal year ended March 31, 2005. Major components of netinvestment securities gains for the fiscal years ended March 31, 2005 and 2006 are summarized below:
Fiscal years ended March 31,
2005 2006
(in billions)
Net gains on sales of marketable equity securities . . . . . . . . . . . . . . . . . . . . . . . . . . . . . ¥246.0 ¥ 196.7Impairment losses on marketable equity securities . . . . . . . . . . . . . . . . . . . . . . . . . . . . . (17.9) (5.2)Other (primarily impairment losses on Japanese government bonds) . . . . . . . . . . . . . . (30.1) (101.6)
Net investment securities gains . . . . . . . . . . . . . . . . . . . . . . . . . . . . . . . . . . . . . . . . ¥198.0 ¥ 89.9
The decrease in net investment securities gains for the fiscal year ended March 31, 2006 mainly reflectedthe increase in losses on debt securities, primarily Japanese government bonds, compared to the previous fiscalyear, as long-term interest rates in Japan, such as the yield on ten-year Japanese government bonds climbed fromapproximately 1.3% in April 2005 to approximately 1.8% in March 2006.
Equity in earnings of equity method investees for the fiscal year ended March 31, 2006 were ¥22.3 billion, adecrease of ¥4.0 billion, from ¥26.3 billion for the fiscal year ended March 31, 2005. The decrease was mainlydue to the impairment losses on our equity holdings of an affiliate in the consumer lending business, which waspartially offset by increases of affiliates due to the merger with UFJ Holdings.
Government grant for transfer of substitutional portion of Employees’ Pension Fund Plans amounted to ¥103.0billion, as the difference between the accumulated benefit obligations settled and the assets transferred to the Japanesegovernment as a government grant for transfer of the substitutional portion of Employee’s Pension Fund Plans.
Fiscal Year Ended March 31, 2005 Compared to Fiscal Year Ended March 31, 2004
Non-interest income for the fiscal year ended March 31, 2005 was ¥986.8 billion, a decrease of ¥311.9billion, from ¥1,298.7 billion for the fiscal year ended March 31, 2004. This decrease was primarily attributableto a decrease in net foreign exchange gains of ¥460.9 billion and a decrease in net trading account profits of¥41.8 billion. These decreases were partially offset by an increase in net investment securities gains of ¥80.6billion and an increase in fees and commissions of ¥76.4 billion.
Fees and commissions for the fiscal year ended March 31, 2005 increased ¥76.4 billion from the previous fiscalyear. This increase primarily reflected an increase in fees and commissions on securities business as well as other feesand commissions. Fees and commissions on securities business increased ¥24.6 billion from the previous fiscal yearprimarily due to an increase in commissions in brokerage, underwriting and distribution at Mitsubishi Securities, whichwere in line with the increased trading volume of the Japanese stock markets during the same period and the increasein fees related to securitization business at Mitsubishi Securities. Other fees and commissions increased ¥4.0 billionfrom the previous fiscal year, as fees related to the sales of investment products and fees in investment bankingbusinesses, such as arrangement of syndicated loans, increased at our subsidiary banks.
Net foreign exchange losses for the fiscal year ended March 31, 2005 were ¥47.2 billion, compared to netforeign exchange gains of ¥413.7 billion for the fiscal year ended March 31, 2004. The decrease in foreignexchange gains was due to the depreciation of the yen against foreign currencies in the fiscal year endedMarch 31, 2005, compared to an appreciation of the yen in the fiscal year ended March 31, 2004. This decreasein net foreign exchange gains primarily reflected a decrease in transaction gains on translation of monetaryliabilities denominated in foreign currencies. All transaction gains or losses on translation of monetary liabilitiesdenominated in foreign currencies are included in current earnings. However, the transaction gains or losses ontranslation of securities available for sale, such as bonds denominated in foreign currencies, are not included incurrent earnings but are reflected in other changes in equity from nonowner sources. As we maintain monetaryliabilities denominated in foreign currencies for our asset liability management, net foreign exchange gains(losses) fluctuate with the appreciation (depreciation) of the yen.
64

Net trading account profits for the fiscal year ended March 31, 2005 were ¥62.1 billion, a decrease of ¥41.8billion, or 40.3%, from ¥103.9 billion for the fiscal year ended March 31, 2004. The net trading account profitsfor the fiscal years ended March 31, 2004 and 2005 consisted of the following:
Fiscal years ended March 31,
2004 2005
(in billions)Net profits (losses) on derivative instruments, primarily interest-rate futures, swaps and
options . . . . . . . . . . . . . . . . . . . . . . . . . . . . . . . . . . . . . . . . . . . . . . . . . . . . . . . . . . . . . . . . . . . . . ¥ (2.0) ¥ 6.4Net profits on trading securities . . . . . . . . . . . . . . . . . . . . . . . . . . . . . . . . . . . . . . . . . . . . . . . . . . . 105.9 55.7
Net trading account profits . . . . . . . . . . . . . . . . . . . . . . . . . . . . . . . . . . . . . . . . . . . . . . . . . . . ¥103.9 ¥62.1
The decrease in net profits on trading securities primarily reflected the decrease in profits of trading in debtand equity securities at Mitsubishi Securities compared to the previous fiscal year.
Net investment securities gains for the fiscal year ended March 31, 2005 were ¥198.0 billion, an increase of¥80.6 billion, from a gain of ¥117.4 billion for the fiscal year ended March 31, 2004. Major components of netinvestment securities gains for the fiscal years ended March 31, 2004 and 2005 are summarized below:
Fiscal years ended March 31,
2004 2005
(in billions)Net gains on sales of marketable equity securities . . . . . . . . . . . . . . . . . . . . . . . . . . . . . . . . . . . . . ¥ 371.2 ¥246.0Impairment losses on marketable equity securities . . . . . . . . . . . . . . . . . . . . . . . . . . . . . . . . . . . . (15.4) (17.9)Other . . . . . . . . . . . . . . . . . . . . . . . . . . . . . . . . . . . . . . . . . . . . . . . . . . . . . . . . . . . . . . . . . . . . . . . . (238.4) (30.1)
Net investment securities gains . . . . . . . . . . . . . . . . . . . . . . . . . . . . . . . . . . . . . . . . . . . . . . . . ¥ 117.4 ¥198.0
The increase in net investment securities gains for the fiscal year ended March 31, 2005 mainly reflected adecrease in losses on debt securities compared to the previous fiscal year, which in turn was primarily a result ofsmaller impairment losses on Japanese government bonds, as long-term interest rates in Japan remainedrelatively low and stable compared to the previous fiscal year. This improvement was partially offset by thedecrease in net gains on sales of marketable equity securities and impairment losses on equity securities whichare not classified as marketable equity securities, such as preferred stocks.
We had a ¥21.1 billion increase in equity in earnings of equity method investees mainly due to our increasedshareholdings in ACOM, which also reported improved results for the fiscal year ended March 31, 2005.
Other non-interest income increased by ¥54.5 billion reflecting, among other items, a ¥10.1 billion gain onthe sale of a merchant card portfolio at UnionBanCal Corporation and ¥10.0 billion in net gains on sales ofpremises and equipment.
Non-Interest Expense
The following table shows a summary of our non-interest expense for the fiscal years ended March 31,2004, 2005 and 2006:
Fiscal years ended March 31,
2004 2005 2006
(in billions)Salaries and employee benefits . . . . . . . . . . . . . . . . . . . . . . . . . . . . . . . . . . . . . . . . . . . . . . . . ¥ 503.5 ¥ 473.1 ¥ 746.4Occupancy expenses—net . . . . . . . . . . . . . . . . . . . . . . . . . . . . . . . . . . . . . . . . . . . . . . . . . . . . 120.0 116.3 187.3Fees and commission expenses . . . . . . . . . . . . . . . . . . . . . . . . . . . . . . . . . . . . . . . . . . . . . . . . 80.3 87.2 218.4Amortization of intangible assets . . . . . . . . . . . . . . . . . . . . . . . . . . . . . . . . . . . . . . . . . . . . . . . 63.4 69.3 179.6Insurance premiums, including deposit insurance . . . . . . . . . . . . . . . . . . . . . . . . . . . . . . . . . . 54.4 57.0 89.7Minority interest in income of consolidated subsidiaries . . . . . . . . . . . . . . . . . . . . . . . . . . . . . 40.9 36.7 157.2Communications . . . . . . . . . . . . . . . . . . . . . . . . . . . . . . . . . . . . . . . . . . . . . . . . . . . . . . . . . . . . 27.0 27.4 44.4Other non-interest expenses . . . . . . . . . . . . . . . . . . . . . . . . . . . . . . . . . . . . . . . . . . . . . . . . . . . 339.9 262.2 453.1
Total non-interest expense . . . . . . . . . . . . . . . . . . . . . . . . . . . . . . . . . . . . . . . . . . . . . . . . ¥1,229.4 ¥1,129.2 ¥2,076.1
65

Fiscal Year Ended March 31, 2006 Compared to Fiscal Year Ended March 31, 2005
Non-interest expense for the fiscal year ended March 31, 2006 was ¥2,076.1 billion, an increase of ¥946.9billion from the previous fiscal year. This increase was primarily due to the merger with UFJ Holdings, whichincreased most types of expenses, especially salaries and employee benefits and other non-interest expenses. Otherfactors which contributed to the increase in non-interest expenses include a ¥120.5 billion increase in minorityinterest in income of consolidated subsidiaries due to an increase of income resulting from the improvement in theJapanese stock market and increased profits at UNBC. The transfer to the Japanese government of the substitutionalportion of employees’ pension fund plans also increased salaries and employee benefits by ¥68.0 billion.
Fiscal Year Ended March 31, 2005 Compared to Fiscal Year Ended March 31, 2004
Non-interest expense for the fiscal year ended March 31, 2005 was ¥1,129.2 billion, a decrease of ¥100.2billion from the previous fiscal year. This decrease was primarily due to a ¥77.7 billion decrease in othernon-interest expenses, principally reflecting a decrease in the provision for off-balance-sheet credit instrumentscaused by the decrease in off-balance-sheet exposure.
In addition, a decrease of ¥30.4 billion in salaries and employee benefits contributed to the decrease innon-interest expense. The decrease in salaries and employee benefits was primarily due to a decrease in the netperiodic pension cost. The reduction in the net periodic pension cost was primarily the result of loweramortization charges, reflecting a decrease in the unrecognized net actuarial loss at the beginning of the fiscalyears ended March 31, 2004 and 2005. The increase in the expected rates of return on plan assets also contributedto the decrease in the net periodic pension cost.
Income Tax Expense
The following table presents a summary of our income tax expense:
Fiscal years ended March 31,
2004 2005 2006
(in billions, except percentages)
Income from continuing operations before income tax expense and cumulativeeffect of a change in accounting principle . . . . . . . . . . . . . . . . . . . . . . . . . . . . ¥1,176.4 ¥718.4 ¥529.7
Income tax expense . . . . . . . . . . . . . . . . . . . . . . . . . . . . . . . . . . . . . . . . . . . . . . . . ¥ 355.3 ¥303.8 ¥165.5Effective tax rate . . . . . . . . . . . . . . . . . . . . . . . . . . . . . . . . . . . . . . . . . . . . . . . . . . 30.2 % 42.3% 31.2%Normal effective statutory tax rate . . . . . . . . . . . . . . . . . . . . . . . . . . . . . . . . . . . . 39.9 % 40.6% 40.6%
In September 2002, we applied to the tax authorities for approval to file our national income tax returnsbased on the consolidated corporate-tax system starting from the fiscal year ended March 31, 2003, and receivedthe approval in March 2003. The consolidated corporate-tax system allowed companies to base tax payments onthe combined profits or losses of a parent company and its wholly-owned domestic subsidiaries, and required usto pay, for the fiscal years ended March 31, 2003 and 2004, a surcharge tax of 2.0% of taxable income in additionto the national corporate income tax rate of 30.0% applied to separate tax return filers.
In February 2005, our application to suspend the consolidated corporate-tax system was approved by theJapanese tax authorities. We filed our tax returns under the consolidated corporate-tax system for the fiscal yearended March 31, 2005.
In addition, under the new local tax laws which were enacted in March 2003 for the fiscal years beginningafter March 31, 2004, new uniform local taxes became effective. These new rules introduce value-added taxesand replace part of the existing local taxes based on income. The new local taxes are computed based on threecomponents: (a) amount of profit, (b) amount of value-added (total payroll, net interest paid or received, net rentpaid and income before use of net operating losses) and (c) amount of total paid-in capital. The taxes arecomputed by adding together the totals of each of the three components which are calculated separately.
66

Reconciling items between the combined normal effective statutory tax rates and the effective income taxrates for the fiscal years ended March 31, 2004, 2005 and 2006 are summarized as follows:
Fiscal years ended March 31,
2004 2005 2006
Combined normal effective statutory tax rate . . . . . . . . . . . . . . . . . . . . . . . . . . . . 39.9% 40.6% 40.6%Increase (decrease) in taxes resulting from:
Nondeductible expenses . . . . . . . . . . . . . . . . . . . . . . . . . . . . . . . . . . . . . . . . . 0.1 0.4 0.7Dividends from foreign subsidiaries . . . . . . . . . . . . . . . . . . . . . . . . . . . . . . . 0.7 1.1 1.6Foreign tax credit and payments . . . . . . . . . . . . . . . . . . . . . . . . . . . . . . . . . . 0.5 1.6 1.4Higher (lower) tax rates applicable to income of subsidiaries . . . . . . . . . . . . 0.1 (0.8) (6.9)Foreign tax assessment (refund) . . . . . . . . . . . . . . . . . . . . . . . . . . . . . . . . . . . (0.1) — —Minority interests . . . . . . . . . . . . . . . . . . . . . . . . . . . . . . . . . . . . . . . . . . . . . . 1.2 1.6 9.5Change in valuation allowance . . . . . . . . . . . . . . . . . . . . . . . . . . . . . . . . . . . . (12.6) (2.6) 0.2Enacted change in tax rates . . . . . . . . . . . . . . . . . . . . . . . . . . . . . . . . . . . . . . (0.3) — —Realization of previously unrecognized tax effects of subsidiaries . . . . . . . . (1.2) (0.1) (16.5)Nontaxable dividends received . . . . . . . . . . . . . . . . . . . . . . . . . . . . . . . . . . . (0.6) (1.2) (1.7)Tax expense on capital transactions by a subsidiary . . . . . . . . . . . . . . . . . . . — — 4.4Other—net . . . . . . . . . . . . . . . . . . . . . . . . . . . . . . . . . . . . . . . . . . . . . . . . . . . 2.5 1.7 (2.1)
Effective income tax rate . . . . . . . . . . . . . . . . . . . . . . . . . . . . . . . . . . . . . . . . . . . . 30.2% 42.3% 31.2%
The effective income tax rate of 31.2% for the fiscal year ended March 31, 2006 was 9.4 percentage pointslower than the normal effective statutory tax rate of 40.6%. This lower tax rate primarily reflected realization ofpreviously unrecognized tax effects in conjunction with the liquidation of certain subsidiaries and recognition oftax benefits through reorganization of business within the group, which were partly offset by certain itemsincluding minority interests and tax expense on capital transactions by a subsidiary.
The effective income tax rate of 42.3% for the fiscal year ended March 31, 2005 was 1.7 percentage pointshigher than the normal effective statutory tax rate of 40.6%. The 2.6 percentage point decrease due to the changein valuation allowance was offset by certain increases, including reconciliations related to minority interests,dividends from foreign subsidiaries and foreign tax credit and payments.
The effective income tax rate of 30.2% for the fiscal year ended March 31, 2004 was 9.7 percentage pointslower than the normal effective statutory tax rate of 39.9%. This lower tax rate primarily reflected a decrease inthe valuation allowance against deferred tax assets which accounted for 12.6 percentage points of the difference.The valuation allowance decreased ¥184.9 billion from ¥318.7 billion at March 31, 2003, to ¥133.8 billion atMarch 31, 2004, as a result of achieving taxable income for the fiscal year in excess of the amount previouslyprojected at March 31, 2003 and improved realizability of future tax benefits based on increased expected taxableincome in future periods.
Business Segment Analysis
We measure the performance of each of our business segments primarily in terms of “operating profit”.Operating profit and other segment information are based on the financial information prepared in accordancewith Japanese GAAP as adjusted in accordance with internal management accounting rules and practices and arenot consistent with our consolidated financial statements prepared on the basis of US GAAP. For example,operating profit does not reflect items such as a part of provisions (credit) for credit losses, foreign exchangegains (losses) and equity investment securities gains (losses).
We implemented an integrated business group system, which currently integrates the operations of BTMU,MUTB and MUS and other subsidiaries in the following three areas—Retail, Corporate, and Trust Assets. Thisintegrated business group system is intended to enhance synergies by promoting more effective and efficient
67

collaboration between our subsidiaries. Under this system, as the holding company, we formulate strategy for thegroup on an integrated basis, which is then executed by the subsidiaries. Through this system, we aim to reduceoverlapping of functions within the group, thereby increasing efficiency and realizing the benefits of groupresources and scale of operations. Moreover, through greater integration of our shared expertise in banking, trustand securities businesses, we aim to deliver a more diverse but integrated lineup of products and services for ourcustomers.
Effective April 1, 2005, we have changed the classification of our business segments and included UNBC asa part of the Integrated Corporate Banking Business Group. We have also introduced a unified core depositconcept when measuring the performance of each business segment and made minor changes in the managementaccounting method. The unified core deposit concept takes into account that, a portion of the Japanese yen short-term deposits of our customers’ can be deemed as a long-term source of funding from an interest riskmanagement perceptive, and therefore the interest rate spread gained from the long-term funds should beallocated to the relevant business segments.
Effective October 1, 2005, we have changed the name of the Treasury business segment to Global Markets,in line with the name of the business segment in our subsidiary banks. The operations that constitute GlobalMarkets have not been changed.
Operations that are not covered by the integrated business group system are classified under Global Marketsand Other.
The following is a brief explanation of our business segments:
Integrated Retail Banking Business Group—Covers all domestic retail businesses, including commercialbanking, trust banking and securities businesses. This business group integrates the retail business of BTMU,MUTB and MUS and other subsidiaries as well as retail product development, promotion and marketing in a singlemanagement structure. At the same time, the business group has developed and implemented MUFG Plaza, aone-stop, comprehensive financial services concept that provides integrated banking, trust and securities services.
Integrated Corporate Banking Business Group—Covers all domestic and overseas corporate businesses,including commercial banking, investment banking, trust banking and securities businesses as well as UNBC.UNBC consists of BTMU subsidiaries in California, UnionBanCal Corporation and Union Bank of California,N.A. Through the integration of these business lines, diverse financial products and services are provided to ourcorporate clients. The business group has clarified strategic domains, sales channels and methods to match thedifferent growth stages and financial needs of our corporate customers. Regarding UNBC, as of March 31, 2006,BTMU owned 63% of UnionBanCal Corporation, a public company listed on the New York Stock Exchange.UnionBanCal is a U.S. commercial bank holding company. Union Bank of California, N.A., UnionBanCal’sbank subsidiary, is one of the largest commercial banks in California based on total assets and total deposits.UNBC provides a wide range of financial services to consumers, small businesses, middle market companies andmajor corporations, primarily in California, Oregon and Washington but also nationally and internationally.
Integrated Trust Assets Business Group—Covers asset management and administration services forproducts such as pension trusts and security trusts by integrating the trust banking expertise of MUTB and theglobal network of BTMU. The business group provides a full range of services to corporate and other pensionfunds, including stable and secure pension fund management and administration, advice on pension schemes, andpayment of benefits to scheme members.
Global Markets—Global Markets consists of the treasury operations of BTMU, MUTB and MUS. GlobalMarkets also conducts asset liability management and liquidity management and provides various financialoperations such as money markets and foreign exchange operations and securities investments.
Other—Other mainly consists of the corporate center of MUFG, BTMU and MUTB. The elimination ofduplicated amounts of net revenue among business segments is also reflected in Other.
68

The presentation for the fiscal year ended March 31, 2004 and 2005 has been reclassified to conform to thenew basis of segmentation and managerial accounting, including the method of inter-segment allocation, for thefiscal year ended March 31, 2006.
IntegratedRetail
BankingBusinessGroup
Integrated Corporate Banking Business Group IntegratedTrustAssets
BusinessGroup
GlobalMarkets Other TotalDomestic
Overseas
TotalOther than
UNBC UNBCOverseas
total
(in billions)
Fiscal year endedMarch 31, 2004
Net revenue . . . . . . . . . . ¥411.6 ¥ 656.1 ¥147.2 ¥253.5 ¥400.7 ¥1,056.8 ¥ 56.7 ¥321.7 ¥ (23.4) ¥1,823.4Operating expenses . . . . 312.8 266.2 107.6 150.9 258.5 524.7 47.9 42.9 84.2 1,012.5
Operating profit (loss) . . ¥ 98.8 ¥ 389.9 ¥ 39.6 ¥102.6 ¥142.2 ¥ 532.1 ¥ 8.8 ¥278.8 ¥(107.6) ¥ 810.9
Fiscal year endedMarch 31, 2005
Net revenue . . . . . . . . . . ¥454.8 ¥ 684.2 ¥146.2 ¥274.9 ¥421.1 ¥1,105.3 ¥ 59.9 ¥285.0 ¥ (8.7) ¥1,896.3Operating expenses . . . . 323.7 267.6 102.2 158.8 261.0 528.6 46.6 38.9 91.3 1,029.1
Operating profit (loss) . . ¥131.1 ¥ 416.6 ¥ 44.0 ¥116.1 ¥160.1 ¥ 576.7 ¥ 13.3 ¥246.1 ¥(100.0) ¥ 867.2
Fiscal year endedMarch 31, 2006
Net revenue . . . . . . . . . . ¥887.5 ¥1,107.4 ¥214.6 ¥350.3 ¥564.9 ¥1,672.3 ¥108.7 ¥315.7 ¥ (15.2) ¥2,969.0Operating expenses . . . . 576.9 428.1 136.3 202.3 338.6 766.7 73.9 43.8 141.5 1,602.8
Operating profit (loss) . . ¥310.6 ¥ 679.3 ¥ 78.3 ¥148.0 ¥226.3 ¥ 905.6 ¥ 34.8 ¥271.9 ¥(156.7) ¥1,366.2
Fiscal Year Ended March 31, 2006 Compared to Fiscal Year Ended March 31, 2005
Net revenue of the Integrated Retail Banking Business Group increased ¥432.7 billion, from ¥454.8 billionfor the fiscal year ended March 31, 2005 to ¥887.5 billion for the fiscal year ended March 31, 2006. Net revenueof the Integrated Retail Banking Business Group mainly consists of revenue from commercial banking operationssuch as deposits and lending operations, and fees related to the sales of investment products to retail customers,as well as fees of subsidiaries within the Integrated Retail Banking Business Group. The increase in net revenuewas mainly due to the merger with UFJ Holdings, as UFJ Holdings’ large domestic retail customer baseincreased net fees, as well as revenue from the deposits and consumer finance businesses, including those of UFJNICOS. Other factors which increased net revenue are increases in fee income from investment trusts andsecurities intermediary business.
Operating expenses of the Integrated Retail Banking Business Group increased ¥253.2 billion, from ¥323.7billion for the fiscal year ended March 31, 2005 to ¥576.9 billion for the fiscal year ended March 31, 2006. Themerger with UFJ Holdings, along with an increase in general expenses due to the expansion of our consumerfinance business, increased our operating expenses.
Operating profit of the Integrated Retail Banking Business Group increased ¥179.5 billion from ¥131.1billion for the fiscal year ended March 31, 2005 to ¥310.6 billion for the fiscal year ended March 31, 2006. Thisincrease was mainly due to the increase in net revenue, as stated above.
Net revenue of the Integrated Corporate Banking Business Group increased ¥567.0 billion, from ¥1,105.3billion for the fiscal year ended March 31, 2005 to ¥1,672.3 billion for the fiscal year ended March 31, 2006. Netrevenue of the Integrated Corporate Banking Business Group mainly consists of revenue from lending and othercommercial banking operations, investment banking and trust banking businesses to corporate clients, as well asfees of subsidiaries within the Integrated Corporate Banking Business Group. The increase in net revenue wasdue mainly to increased net revenue in domestic businesses, resulting from the merger with UFJ Holdings.
69

With regard to the domestic businesses, net revenue of ¥1,107.4 billion, an increase of ¥423.2 billion, wasrecorded for the fiscal year ended March 31, 2006. This increase was mainly due to the merger with UFJHoldings, which had a large customer base in domestic businesses. Other factors which increased net revenueinclude fees related to foreign exchange transactions such as currency options, and fees related to investmentbanking businesses. The increase in fees in the investment banking business, reflects an increase in fees fromsales of derivative products, an increase in fees from arrangement of syndicated loans, and an increase in feesfrom real estate securization transactions.
With regard to the overseas businesses, net revenue of ¥564.9 billion, an increase of ¥143.8 billion, wasrecorded for the fiscal year ended March 31, 2006. This increase was also mainly due to the merger with UFJHoldings, which had a large customer base in overseas businesses mainly consisting of loans to Japanesecorporate clients situated outside Japan. Other factors which increased net revenue include the increase in netrevenue at UNBC. At UNBC, the increase in loans and deposits in California, the increase in net interestmargins, and profits from the sale of its international correspondent banking operations contributed to theincrease in net revenue. In addition, the depreciation of the Japanese yen against the US dollar compared to theprevious fiscal period increased the UNBC revenue included in our consolidated results.
Operating expenses of the Integrated Corporate Banking Business Group increased ¥238.1 billion, from¥528.6 billion for the fiscal year ended March 31, 2005 to ¥766.7 billion for the fiscal year ended March 31,2006. The merger with UFJ Holdings was the primary factor for this increase.
Operating profit of the Integrated Corporate Banking Business Group increased ¥328.9 billion, from ¥576.7billion for the fiscal year ended March 31, 2005 to ¥905.6 billion for the fiscal year ended March 31, 2006. Thisincrease was due mainly to the increase in net revenue as stated above.
Net revenue of the Integrated Trust Assets Business Group increased ¥48.8 billion, from ¥59.9 billion forthe fiscal year ended March 31, 2005 to ¥108.7 billion for the fiscal year ended March 31, 2006. Net revenue ofthe Integrated Trust Assets Business Group mainly consists of fees from asset management and administrationservices for products such as pension trusts and security trusts. The increase in net revenue was mainly due to themerger with UFJ Holdings, which had a large trust asset business. Other factors which increased net revenueinclude increase in revenue from our asset management and administration services due to increased business ininvestment trusts, as well as increased revenue from our global custodian services due to the increase in assetsunder custody.
Operating expenses of the Integrated Trust Assets Business Group increased ¥27.3 billion, from ¥46.6billion for the fiscal year ended March 31, 2005 to ¥73.9 billion for the fiscal year ended March 31, 2006. Themerger with UFJ Holdings, along with the increase in operating expenses relating to our trust assetsadministration services and custody services, were factors that increased operating expenses.
Operating profit of the Integrated Trust Assets Business Group increased ¥21.5 billion, from ¥13.3 billionfor the fiscal year ended March 31, 2005 to ¥34.8 billion for the fiscal year ended March 31, 2006. This increasewas due mainly to the increase in net revenue as stated above.
Net revenue of Global Markets increased ¥30.7 billion, from ¥285.0 billion for the fiscal year endedMarch 31, 2005 to ¥315.7 billion for the fiscal year ended March 31, 2006. The increase in net revenue wasmainly due to the merger with UFJ Holdings, which had a large treasury operation. Other factors which increasednet revenue include increased revenue from our foreign exchange currency option sales. These increases werepartially offset by the increase in funding costs caused by the rise in foreign short-term interest rates.
70

Fiscal Year Ended March 31, 2005 Compared to Fiscal Year Ended March 31, 2004
Net revenue of the Integrated Retail Banking Business Group increased ¥43.2 billion, from ¥411.6 billionfor the fiscal year ended March 31, 2004 to ¥454.8 billion for the fiscal year ended March 31, 2005. Net revenueof the Integrated Retail Banking Business Group mainly consists of revenue from commercial banking operationssuch as deposits and lending operations, and fees related to the sales of investment products to retail customers,as well as fees of subsidiaries belonging to the Integrated Retail Banking Business Group. The increase in netrevenue was mainly due to an increase in net fees, reflecting an increase of ¥24.0 billion in fees on sales ofannuity and investment trusts, an increase of ¥14.0 billion in revenue from deposits, and an increase of ¥5.2billion in revenue from consumer finance.
Operating expenses of the Integrated Retail Banking Business Group increased ¥10.9 billion, from ¥312.8billion for the fiscal year ended March 31, 2004 to ¥323.7 billion for the fiscal year ended March 31, 2005. Thisincrease was mainly due to an increase of ¥3.9 billion in general expenses due to the expansion of our consumerfinance business, and an increase of ¥3.5 billion in advertisement and general publicity expenses relating to oursales of investment products to retail customers.
Operating profit of the Integrated Retail Banking Business Group increased ¥32.3 billion, from ¥98.8 billionfor the fiscal year ended March 31, 2004 to ¥131.1 billion for the fiscal year ended March 31, 2005. This increasewas mainly due to an increase in net revenue, as explained above.
Net revenue of the Integrated Corporate Banking Business Group increased ¥48.5 billion, from ¥1,056.8billion for the fiscal year ended March 31, 2004 to ¥1,105.3 billion for the fiscal year ended March 31, 2005. Netrevenue of the Integrated Corporate Banking Business Group mainly consists of revenue from lending and othercommercial banking operations, investment banking and trust banking businesses to corporate clients, as well asfees of subsidiaries belonging to the Integrated Corporate Banking Business Group. The increase in net revenuewas due mainly to improved net revenue in domestic businesses and at UNBC.
With regard to the domestic businesses, net revenue of ¥684.2 billion, an increase of ¥28.1 billion, wasrecorded for the fiscal year ended March 31, 2005. This increase was mainly due to an increase in fees in theinvestment banking business of ¥36.0 billion, reflecting an increase in fees from sales of derivative products,arrangement of syndicated loans, and real estate securization transactions. Fees from foreign exchangetransactions also increased by ¥7.6 billion. These increases were partially offset by a decrease in net interestincome of ¥13.9 billion, reflecting the decrease in nonperforming loan assets and in profits of our subsidiaries of¥8.6 billion, mainly reflecting lower trading profits at our securities subsidiary.
With regard to the overseas businesses including UNBC, net revenue of ¥421.1 billion, an increase of ¥20.4billion, was recorded for the fiscal year ended March 31, 2005. This increase was mainly due to an increase innon-interest income at UNBC, such as service charges on deposit accounts and an increase in net interest income,which was favorably influenced by higher earning asset volumes and strong deposit growth. Gains on sales of themerchant card portfolio as well as gains on the sale of real property also contributed to the increase in netrevenue. In overseas businesses other than UNBC, net revenue decreased by ¥1.0 billion mainly due to adecrease in interest income from corporate lending to non-Japanese corporate clients, reflecting weak loandemand. This decrease was partially offset by an increase in fees in the investment banking business of ¥4.0billion, reflecting the increase in fees from sales of derivative products and leasing transactions, and an increasein interest income from deposits due to an increase in volume of settlement accounts and the positive effects of ahigher interest rate environment in overseas financial markets.
Operating expenses of the Integrated Corporate Banking Business Group increased ¥3.9 billion, from¥524.7 billion for the fiscal year ended March 31, 2004 to ¥528.6 billion for the fiscal year ended March 31,2005. This increase was due to an increase of ¥7.9 billion at UNBC and an increase of ¥1.4 billion in domesticbusinesses reflecting higher nonpersonnel expenses, which was partially offset by a decrease of ¥5.4 billion inoverseas businesses other than UNBC mainly reflecting lower personnel expenses.
71

Operating profit of the Integrated Corporate Banking Business Group increased ¥44.6 billion, from ¥532.1billion for the fiscal year ended March 31, 2004 to ¥576.7 billion for the fiscal year ended March 31, 2005. Thisincrease was due mainly to the increase in fees in net revenue as stated above.
Net revenue of the Integrated Trust Asset Business Group increased ¥3.2 billion, from ¥56.7 billion for thefiscal year ended March 31, 2004 to ¥59.9 billion for the fiscal year ended March 31, 2005. Net revenue of theIntegrated Trust Assets Business Group mainly consists of fees from asset management and administrationservices for products such as pension trusts and security trusts. The increase in net revenue was due mainly to a¥0.3 billion increase in revenue from our asset management services and a ¥3.2 billion increase in administrationservices. The increase in asset management services primarily reflected increased revenue from sales of newinvestment trust products in our asset management subsidiaries. The increase in administration services primarilyreflected an increase in investment trust fee income due to the increase in investment trust assets and the increasein assets under global custody.
Operating expenses of the Integrated Trust Asset Business Group decreased ¥1.3 billion, from ¥47.9 billionfor the fiscal year ended March 31, 2004 to ¥46.6 billion for the fiscal year ended March 31, 2005. This decreasewas mainly due to a decrease in expenses in asset management services at the trust bank.
Operating profit of the Integrated Trust Asset Business Group increased ¥4.5 billion, from ¥8.8 billion forthe fiscal year ended March 31, 2004 to ¥13.3 billion for the fiscal year ended March 31, 2005. This increasereflected a ¥1.3 billion increase in operating profit of asset management services and a ¥2.4 billion increase inoperating profit of asset administration services.
Net revenue of Global Markets decreased ¥36.7 billion, from ¥321.7 billion for the fiscal year endedMarch 31, 2004 to ¥285.0 billion for the fiscal year ended March 31, 2005. This decrease was mainly due to adecrease in other income, which primarily reflected a loss in hedging operations on foreign currency interest rateoperations. This decrease was partially offset by increases in trading profits on Japanese yen denominated bonds,alternative investments and Japanese yen money market operations, as well as an increase in fees on loan trusts.
72

Geographic Segment Analysis
The following table sets forth our total revenue, income from continuing operations before income taxexpense and cumulative effect of a change in accounting principle and net income on a geographic basis, basedprincipally on the domicile of activities for the fiscal years ended March 31, 2004, 2005 and 2006:
Fiscal years ended March 31,
2004 2005 2006
(in billions)
Total revenue (interest income and non-interest income):Domestic . . . . . . . . . . . . . . . . . . . . . . . . . . . . . . . . . . . . . . . . . . . . . . . . . . . . ¥1,651.9 ¥1,610.1 ¥2,520.0
Foreign:United States of America . . . . . . . . . . . . . . . . . . . . . . . . . . . . . . . . . . . 575.1 487.7 594.5Europe . . . . . . . . . . . . . . . . . . . . . . . . . . . . . . . . . . . . . . . . . . . . . . . . . . 277.2 153.1 194.3Asia/Oceania excluding Japan . . . . . . . . . . . . . . . . . . . . . . . . . . . . . . . 64.8 96.8 176.1Other areas* . . . . . . . . . . . . . . . . . . . . . . . . . . . . . . . . . . . . . . . . . . . . . . 147.6 77.8 113.1
Total foreign . . . . . . . . . . . . . . . . . . . . . . . . . . . . . . . . . . . . . . . . . 1,064.7 815.4 1,078.0
Total . . . . . . . . . . . . . . . . . . . . . . . . . . . . . . . . . . . . . . . . . . . ¥2,716.6 ¥2,425.5 ¥3,598.0
Income from continuing operations before income tax expense and cumulativeeffect of a change in accounting principle:
Domestic . . . . . . . . . . . . . . . . . . . . . . . . . . . . . . . . . . . . . . . . . . . . . . . . . . . . ¥ 711.1 ¥ 289.7 ¥ 325.7
Foreign:United States of America . . . . . . . . . . . . . . . . . . . . . . . . . . . . . . . . . . . 166.4 236.7 55.0Europe . . . . . . . . . . . . . . . . . . . . . . . . . . . . . . . . . . . . . . . . . . . . . . . . . . 183.1 49.6 26.8Asia/Oceania excluding Japan . . . . . . . . . . . . . . . . . . . . . . . . . . . . . . . 43.2 84.7 62.3Other areas* . . . . . . . . . . . . . . . . . . . . . . . . . . . . . . . . . . . . . . . . . . . . . . 72.6 57.7 59.9
Total foreign . . . . . . . . . . . . . . . . . . . . . . . . . . . . . . . . . . . . . . . . . 465.3 428.7 204.0
Total . . . . . . . . . . . . . . . . . . . . . . . . . . . . . . . . . . . . . . . . . . . ¥1,176.4 ¥ 718.4 ¥ 529.7
Net income:Domestic . . . . . . . . . . . . . . . . . . . . . . . . . . . . . . . . . . . . . . . . . . . . . . . . . . . . ¥ 464.2 ¥ 110.0 ¥ 197.4
Foreign:United States of America . . . . . . . . . . . . . . . . . . . . . . . . . . . . . . . . . . . 158.3 180.5 39.7Europe . . . . . . . . . . . . . . . . . . . . . . . . . . . . . . . . . . . . . . . . . . . . . . . . . . 120.8 24.2 23.4Asia/Oceania excluding Japan . . . . . . . . . . . . . . . . . . . . . . . . . . . . . . . 26.5 61.7 54.0Other areas* . . . . . . . . . . . . . . . . . . . . . . . . . . . . . . . . . . . . . . . . . . . . . . 53.2 38.8 49.0
Total foreign . . . . . . . . . . . . . . . . . . . . . . . . . . . . . . . . . . . . . . . . . 358.8 305.2 166.1
Total . . . . . . . . . . . . . . . . . . . . . . . . . . . . . . . . . . . . . . . . . . . ¥ 823.0 ¥ 415.2 ¥ 363.5
* Other areas primarily include Canada, Latin America and the Caribbean.
Fiscal Year Ended March 31, 2006 Compared to Fiscal Year Ended March 31, 2005
Domestic net income for the fiscal year ended March 31, 2006 was ¥197.4 billion, compared to ¥110.0billion for the fiscal year ended March 31, 2005. This increase primarily reflected the increase in net interestincome due to the merger with UFJ Holdings.
Foreign net income for the fiscal year ended March 31, 2006 was ¥166.1 billion, compared to ¥305.2 billionfor the fiscal year ended March 31, 2005. This decrease primarily reflected the decline in net income in theUnited States of America.
73

Fiscal Year Ended March 31, 2005 Compared to Fiscal Year Ended March 31, 2004
Domestic net income for the fiscal year ended March 31, 2005 was ¥110.0 billion, compared to ¥464.2billion for the fiscal year ended March 31, 2004. This decline primarily reflected a decrease in non-interestincome due to a decrease in foreign exchange gains and an increase in the provision for credit losses compared tothe previous fiscal year.
Foreign net income for the fiscal year ended March 31, 2005 was ¥305.2 billion, compared to ¥358.8 billionfor the fiscal year ended March 31, 2004. This decrease primarily reflected a decline in net income in Europe, whichwas partially offset by increases in the Asia/Oceania region (excluding Japan) and in the United States of America.
Effect of Change in Exchange Rates on Foreign Currency Translation
Fiscal Year Ended March 31, 2006 Compared to Fiscal Year Ended March 31, 2005
The average exchange rate for the fiscal year ended March 31, 2006 was ¥113.31 per $1.00, compared to theprior fiscal year’s average exchange rate of ¥107.55 per $1.00. The average exchange rate for the conversion ofthe US dollar financial statements of some of our foreign subsidiaries for the fiscal year ended December 31,2005 was ¥110.21 per $1.00, compared to the average exchange rate for the fiscal year ended December 31, 2004of ¥108.24 per $1.00.
The change in the average exchange rate of the yen against the US dollar and other foreign currencies hadthe effect of increasing total revenue by approximately ¥68 billion, net interest income by approximately ¥21billion and income before income taxes by approximately ¥20 billion, respectively, for the fiscal year endedMarch 31, 2006.
Fiscal Year Ended March 31, 2005 Compared to Fiscal Year Ended March 31, 2004
The average exchange rate for the fiscal year ended March 31, 2005 was ¥107.55 per $1.00, compared to theprior fiscal year’s average exchange rate of ¥113.07 per $1.00. The average exchange rate for the conversion ofthe US dollar financial statements of some of our foreign subsidiaries for the fiscal year ended December 31,2004 was ¥108.24 per $1.00, compared to the average exchange rate for the fiscal year ended December 31, 2003of ¥115.98 per $1.00.
The change in the average exchange rate of the yen against the US dollar and other foreign currencies hadthe effect of decreasing total revenue by approximately ¥39 billion, net interest income by approximately ¥18billion and income before income taxes by approximately ¥15 billion, respectively, for the fiscal year endedMarch 31, 2005.
74

B. Liquidity and Capital Resources
Financial Condition
Total Assets
Our total assets at March 31, 2006 were ¥186.22 trillion, representing an increase of ¥77.80 trillion, from¥108.42 trillion at March 31, 2005. This increase was due primarily to the merger with UFJ Holdings, which hada large asset base, with total assets of ¥82.04 trillion as of September 30, 2005 before the merger with us. Theincrease in total assets reflected an increase of ¥44.33 trillion in net loans, and an increase of ¥19.02 trillion intotal investment securities.
We have allocated a substantial portion of our assets to international activities. As a result, reported amountsare affected by changes in the value of the yen against the US dollar and other foreign currencies. Foreign assetsare denominated primarily in US dollars. The following table shows our total assets at March 31, 2005 and 2006by geographic region based principally on the domicile of the obligors:
At March 31,
2005 2006
(in trillions)
Japan . . . . . . . . . . . . . . . . . . . . . . . . . . . . . . . . . . . . . . . . . . . . . . . . . . . . . . . . . . . . . . . . . . . . . ¥ 84.41 ¥152.05
Foreign:United States of America . . . . . . . . . . . . . . . . . . . . . . . . . . . . . . . . . . . . . . . . . . . . . . . . . 12.33 16.65Europe . . . . . . . . . . . . . . . . . . . . . . . . . . . . . . . . . . . . . . . . . . . . . . . . . . . . . . . . . . . . . . . . 5.97 9.48Asia/Oceania excluding Japan . . . . . . . . . . . . . . . . . . . . . . . . . . . . . . . . . . . . . . . . . . . . . 3.47 5.24Other areas* . . . . . . . . . . . . . . . . . . . . . . . . . . . . . . . . . . . . . . . . . . . . . . . . . . . . . . . . . . . . 2.24 2.80
Total foreign . . . . . . . . . . . . . . . . . . . . . . . . . . . . . . . . . . . . . . . . . . . . . . . . . . . . . . . 24.01 34.17
Total . . . . . . . . . . . . . . . . . . . . . . . . . . . . . . . . . . . . . . . . . . . . . . . . . . . . . . . . . ¥108.42 ¥186.22
* Other areas primarily include Canada, Latin America and the Caribbean.
Total assets in Japan increased by ¥67.64 trillion mainly due to UFJ Holdings’ large asset base in Japan.
At March 31, 2006, the noon buying rate of the Federal Reserve Bank of New York was ¥117.48 per $1.00,as compared with ¥107.22 per $1.00 at March 31, 2005. The yen equivalent amount of foreign currencydenominated assets and liabilities increases as the relevant exchange rate indicating the yen value per one foreigncurrency unit becomes higher, evidencing a “weaker” yen, and decreases as the relevant exchange rate indicatingthe yen value per one foreign currency unit becomes lower, evidencing a “stronger” yen. The depreciation of theyen against the US dollar and other foreign currencies during the fiscal year ended March 31, 2006 increased theyen value of our total assets by approximately ¥3.47 trillion. See “Item 3.A. Key Information—SelectedFinancial Data—Exchange Rate Information.”
75

Loan Portfolio
The following table sets forth our loans outstanding by domicile and type of industry of borrower, beforededuction of allowance for credit losses, at March 31, 2005 and 2006, based on classification by industrysegment as defined by the Bank of Japan for regulatory reporting purposes, which is not necessarily based on useof proceeds:
At March 31,
2005 2006
(in billions)
Domestic:Manufacturing . . . . . . . . . . . . . . . . . . . . . . . . . . . . . . . . . . . . . . . . . . . . . . . . . . . . . . . ¥ 6,475.4 ¥10,796.6Construction . . . . . . . . . . . . . . . . . . . . . . . . . . . . . . . . . . . . . . . . . . . . . . . . . . . . . . . . 974.1 1,968.4Real estate . . . . . . . . . . . . . . . . . . . . . . . . . . . . . . . . . . . . . . . . . . . . . . . . . . . . . . . . . . 5,266.5 8,616.6Services . . . . . . . . . . . . . . . . . . . . . . . . . . . . . . . . . . . . . . . . . . . . . . . . . . . . . . . . . . . . 3,621.7 6,154.3Wholesale and retail . . . . . . . . . . . . . . . . . . . . . . . . . . . . . . . . . . . . . . . . . . . . . . . . . . 5,228.3 9,532.8Banks and other financial institutions . . . . . . . . . . . . . . . . . . . . . . . . . . . . . . . . . . . . . 3,691.9 5,798.1Communication and information services . . . . . . . . . . . . . . . . . . . . . . . . . . . . . . . . . 784.3 1,182.5Other industries . . . . . . . . . . . . . . . . . . . . . . . . . . . . . . . . . . . . . . . . . . . . . . . . . . . . . . 6,783.2 12,171.0Consumer . . . . . . . . . . . . . . . . . . . . . . . . . . . . . . . . . . . . . . . . . . . . . . . . . . . . . . . . . . 8,162.1 23,727.8
Total domestic . . . . . . . . . . . . . . . . . . . . . . . . . . . . . . . . . . . . . . . . . . . . . . . . . . . 40,987.5 79,948.1
Foreign:Governments and official institutions . . . . . . . . . . . . . . . . . . . . . . . . . . . . . . . . . . . . . 212.7 325.1Banks and other financial institutions . . . . . . . . . . . . . . . . . . . . . . . . . . . . . . . . . . . . . 917.4 1,152.6Commercial and industrial . . . . . . . . . . . . . . . . . . . . . . . . . . . . . . . . . . . . . . . . . . . . . 8,521.7 13,403.0Other . . . . . . . . . . . . . . . . . . . . . . . . . . . . . . . . . . . . . . . . . . . . . . . . . . . . . . . . . . . . . . 283.4 666.7
Total foreign . . . . . . . . . . . . . . . . . . . . . . . . . . . . . . . . . . . . . . . . . . . . . . . . . . . . 9,935.2 15,547.4
Unearned income, unamortized premium—net and deferred loan fees—net . . . . . . . . . . . (18.7) 11.3
Total . . . . . . . . . . . . . . . . . . . . . . . . . . . . . . . . . . . . . . . . . . . . . . . . . . . . . . ¥50,904.0 ¥95,506.8
Domestic loans within the “consumer” category in the above table include loans to individuals who utilizeloan proceeds to finance their proprietor activities and not for their personal financing needs.
Manufacturing ConstructionRealestate Services
Wholesaleand
retail
Banks andother
financialinstitutions
Communicationand
informationservice
Otherindustries
Totalincluded
inConsumer
(in billions)March 31, 2005 . . . ¥23.0 ¥16.2 ¥543.0 ¥193.4 ¥39.8 ¥1.1 ¥3.7 ¥7.8 ¥828.0March 31, 2006 . . . ¥17.2 ¥13.9 ¥425.9 ¥160.8 ¥30.9 ¥1.0 ¥3.0 ¥6.3 ¥659.0
Loans are our primary use of funds. The average loan balance accounted for 51.1% of total interest-earningassets for the fiscal year ended March 31, 2005 and 53.9% for the fiscal year ended March 31, 2006.
At March 31, 2006, our total loans were ¥95.51 trillion, representing an increase of ¥44.61 trillion, or87.6%, from ¥50.90 trillion at March 31, 2005. This increase was primarily due to the merger with UFJHoldings. For reference, loans extended by UFJ Holdings were ¥41.91 trillion at March 31, 2005 and ¥42.40trillion at September 30, 2005. Before the addition of unearned income, unamortized premiums—net anddeferred loan fees-net, our loan balance at March 31, 2006 consisted of ¥79.95 trillion of domestic loans and¥15.55 trillion of foreign loans while the loan balance at March 31, 2005 consisted of ¥40.99 trillion of domesticloans and ¥9.94 trillion of foreign loans.
Domestic loans increased ¥38.96 trillion and foreign loans increased ¥5.61 trillion compared to the previousfiscal year. For reference, domestic loans extended by UFJ Holdings were ¥39.33 trillion at March 31, 2005 and
76

¥39.77 trillion at September 30, 2005. Foreign loans extended by UFJ Holdings were ¥2.60 trillion at March 31,2005 and ¥2.65 trillion at September 30, 2005. Regarding foreign loans, loans to non-Japanese companiesincreased steadily.
Analyzing the change of domestic loans by industry segments, domestic loans increased in all segmentsprimarily due to the merger with UFJ Holdings, and the largest increase was seen in consumer loans. The mainreason for the increase in consumer loans was the larger consumer loan portfolio formerly held by UFJ Holdings,including subsidiaries such as UFJ NICOS, a consumer finance company, as compared to that of MTFG.
As for foreign loans, loans also increased in all segments, especially in the commercial and industrialsegments. Loans to non-Japanese corporate customers in the United States of America and Europe increased.
Allowance for Credit Losses, Nonperforming and Past Due Loans
The following table shows a summary of the changes in the allowance for credit losses for the fiscal yearsended March 31, 2004, 2005 and 2006:
Year ended March 31,
2004 2005 2006
(in billions)
Balance at beginning of fiscal year . . . . . . . . . . . . . . . . . . . . . . . . . . . . . . . . . . . . . ¥1,360.1 ¥ 888.1 ¥ 739.9Additions resulting from the merger with UFJ Holdings(1) . . . . . . . . . . . . . . . . . . — — 287.5Provision (credit) for credit losses . . . . . . . . . . . . . . . . . . . . . . . . . . . . . . . . . . . . . (114.4) 108.3 110.2Charge-offs:
Domestic . . . . . . . . . . . . . . . . . . . . . . . . . . . . . . . . . . . . . . . . . . . . . . . . . . . . . (294.2) (217.5) (153.6)Foreign . . . . . . . . . . . . . . . . . . . . . . . . . . . . . . . . . . . . . . . . . . . . . . . . . . . . . . (83.7) (80.4) (11.2)
Total . . . . . . . . . . . . . . . . . . . . . . . . . . . . . . . . . . . . . . . . . . . . . . . . . . . . (377.9) (297.9) (164.8)Recoveries:
Domestic . . . . . . . . . . . . . . . . . . . . . . . . . . . . . . . . . . . . . . . . . . . . . . . . . . . . . 17.3 22.1 11.4Foreign . . . . . . . . . . . . . . . . . . . . . . . . . . . . . . . . . . . . . . . . . . . . . . . . . . . . . . 23.7 15.2 17.2
Total . . . . . . . . . . . . . . . . . . . . . . . . . . . . . . . . . . . . . . . . . . . . . . . . . . . . 41.0 37.3 28.6
Net charge-offs . . . . . . . . . . . . . . . . . . . . . . . . . . . . . . . . . . . . . . . . . . . . . . . . . . . . (336.9) (260.6) (136.2)Others(2) . . . . . . . . . . . . . . . . . . . . . . . . . . . . . . . . . . . . . . . . . . . . . . . . . . . . . . . . . . (20.7) 4.1 10.8
Balance at end of fiscal year . . . . . . . . . . . . . . . . . . . . . . . . . . . . . . . . . . . . . . . . . . ¥ 888.1 ¥ 739.9 ¥1,012.2
Notes:(1) Additions resulting from the merger with UFJ Holdings represent the valuation allowance for acquired loans outside the scope of
SOP 03-3. The allowance for credit losses on loans within the scope of SOP 03-3 was not carried over.(2) “Others” principally include foreign currency translation and discontinued operations adjustments.
Provision for credit losses for the fiscal year ended March 31, 2006 was ¥110.2 billion, an increase of ¥1.9billion from ¥108.3 billion for the fiscal year ended March 31, 2005. Our loan portfolio and allowance for creditlosses were favorably affected by the upgrades of many borrowers’ credit ratings resulting from improvements intheir business performance mainly attributable to the general recovery in the Japanese economy, as well asupgrades of credit ratings of borrowers to whom we had large exposures who made progress in their restructuringplans.
However, most of the foregoing favorable impact on the quality of our loan portfolio was not reflected inour provision for credit losses in the fiscal year ended March 31, 2006, because any subsequent increases in theexpected cash flows from impaired loans acquired in the merger with UFJ Holdings were not accounted for asreversals of the allowance for credit losses but rather as adjustments to accretable yields under SOP 03-3. On theother hand, the favorable impact on the quality of these loans was reflected in the increase in interest income andthe gains on sales of loans included in non-interest income.
77

For a further discussion of the adoption of SOP 03-3, see “Basis of Financial Statements and Summary ofSignificant Accounting Policies—Accounting Changes” in note 1 to our consolidated financial statements.
The ratio of a provision for credit losses of ¥110.2 billion is 0.15% to the average loan balance of ¥72.92trillion and 0.08% to the total interest-earning assets of ¥135.39 trillion.
Charge-offs for the fiscal year ended March 31, 2006 were ¥164.8 billion, a decrease of ¥133.1 billion, or44.7%, from ¥297.9 billion for the fiscal year ended March 31, 2005.
Charge-offs have decreased for the last two fiscal years, from ¥377.9 billion for the fiscal year ended March31, 2004, to ¥297.9 billion for the fiscal year ended March 31, 2005 and ¥164.8 billion for the fiscal year endedMarch 31, 2006, reflecting the general recovery of businesses in Japan.
The following table presents comparative data in relation to the principal amount of nonperforming loanssold and additional provision for credit losses (reversal of allowance):
Principalamount of
loans(1)Allowance forcredit losses(2)
Loans,net of
allowance
Additionalprovision forcredit losses(reversal ofallowance)
(in billions)
For the fiscal year ended March 31, 2004 . . . . . . . . . . . . . . . . . . ¥315.9 ¥133.2 ¥182.7 ¥(10.2)For the fiscal year ended March 31, 2005 . . . . . . . . . . . . . . . . . . 101.7 40.5 61.2 (15.5)For the fiscal year ended March 31, 2006 . . . . . . . . . . . . . . . . . . 108.1 38.7 69.4 (13.4)
Notes:(1) Represents principal amount after the deduction of charge-offs made before the sales of nonperforming loans.(2) Represents allowance for credit losses at the latest balance-sheet date.
Through the sale of nonperforming loans to third parties, additional provisions or gains may arise fromfactors such as a change in the credit quality of the borrowers or the value of the underlying collateral subsequentto the prior reporting date, and the risk appetite and investment policy of the purchasers. Along with a reductionof nonperforming loans, conditions surrounding the sales of loans have improved in recent years.
Due to the inherent uncertainty of factors that may affect negotiated prices which reflect the borrowers’financial condition and the value of underlying collateral, the results during the reported periods are notnecessarily indicative of the results that we may record in the future.
In connection with the sale of loans including performing loans, we recorded gains of ¥8.7 billion, ¥15.4billion and ¥47.1 billion for the fiscal years ended March 31, 2004, 2005 and 2006, respectively.
The following table summarizes the allowance for credit losses by component at March 31, 2004, 2005 and2006:
At March 31,
2004 2005 2006
(in billions)
Allocated allowance:Specific—specifically identified problem loans . . . . . . . . . . . . . . . . . . . . . . . . . ¥563.6 ¥460.4 ¥ 441.4Large groups of smaller balance homogeneous loans . . . . . . . . . . . . . . . . . . . . . 38.8 37.4 152.3Loans exposed to specific country risk . . . . . . . . . . . . . . . . . . . . . . . . . . . . . . . . 6.1 0.1 0.1Formula—substandard, special mention and other loans . . . . . . . . . . . . . . . . . . 261.1 233.4 410.7
Unallocated allowance . . . . . . . . . . . . . . . . . . . . . . . . . . . . . . . . . . . . . . . . . . . . . . . . 18.5 8.6 7.7
Total allowance . . . . . . . . . . . . . . . . . . . . . . . . . . . . . . . . . . . . . . . . . . . . . . . . . . ¥888.1 ¥739.9 ¥1,012.2
78

Allowance Policy
Our credit rating system is closely linked to the risk grading standards set by the Japanese regulatoryauthorities for asset evaluation and assessment, and is used as a basis for establishing the allowance for creditlosses and charge-offs. The categorization is based on conditions that may affect the ability of borrowers toservice their debt, such as current financial condition and results of operations, historical payment experience,credit documentation, other public information and current trends. For a discussion of our credit rating system,see “Item 11. Quantitative and Qualitative Disclosures about Credit, Market and Other Risk—Credit RiskManagement—Credit Rating System.”
Change in total allowance and provision for credit losses
At March 31, 2006, the total allowance for credit losses was ¥1,012.2 billion, representing 1.06% of ourtotal loan portfolio or 49.51% of our total nonaccrual and restructured loans and accruing loans contractually pastdue 90 days or more. At March 31, 2005, the total allowance for credit losses was ¥739.9 billion, representing1.45% of our total loan portfolio or 57.57% of our total nonaccrual and restructured loans and accruing loanscontractually past due 90 days or more.
The total allowance at March 31, 2006 increased ¥272.3 billion compared to the previous year mainly due tothe merger with UFJ Holdings, which resulted in an additional allowance of ¥287.5 billion. Apart from thisfactor, other components of the total allowance remained relatively unchanged. The proportion of the allowancefor credit losses to the total loan portfolio actually decreased, as the merger with UFJ Holdings led to an increasein total loans.
The proportion of the allowance for credit losses to nonaccrual and restructured loans and accruing loanscontractually past due 90 days or more has decreased mainly due to the fact that the impaired loans of UFJHoldings were offset by the allocated allowance through the application of SOP 03-3.
During the fiscal years ended March 31, 2004, 2005 and 2006, there were no significant additions to theallowance for credit losses resulting from directives, advice or counsel from governmental or regulatory bodies.
Provision for credit losses for the fiscal year ended March 31, 2006 was ¥110.2 billion, an increase of ¥1.9billion from ¥108.3 billion for the fiscal year ended March 31, 2005. Our loan portfolio and allowance for creditlosses were favorably affected by the upgrades of many borrowers’ credit ratings resulting from improvements intheir business performance mainly attributable to the general recovery in the Japanese economy, as well asupgrades of credit ratings of borrowers to whom we had large exposures who made progress in their restructuringplans.
However, most of the foregoing favorable impact on the quality of our loan portfolio was not reflected inour provision for credit losses in the fiscal year ended March 31, 2006, because any subsequent increases in theexpected cash flows from impaired loans acquired in the merger with UFJ Holdings were not accounted for asreversals of the allowance for credit losses but rather as adjustments to accretable yields under SOP 03-3. On theother hand, the favorable impact on the quality of these loans was reflected in the increase in interest income andthe gains on sales of loans included in non-interest income.
For a further discussion of the adoption of SOP 03-3, see “Basis of Financial Statements and Summary ofSignificant Accounting Policies—Accounting Changes” in note 1 to our consolidated financial statements.
Allocated allowance for specifically identified problem loans
The allocated credit loss allowance for specifically identified problem loans represents the allowanceagainst impaired loans called for in SFAS No. 114, “Accounting by Creditors for Impairment of a Loan.”Impaired loans primarily include nonaccrual loans and restructured loans. We generally discontinue accrual ofinterest income on loans when substantial doubt exists as to the full and timely collection of either principal orinterest, or when principal or interest is contractually past due one month or more with respect to loans of our
79

domestic banking subsidiaries, including BTMU and MUTB, and 90 days or more with respect to loans of certainforeign banking subsidiaries. Loans are classified as restructured loans when we grant a concession to theborrowers for economic or legal reasons related to the borrowers’ financial difficulties.
Detailed reviews of impaired loans are performed after a borrower’s annual or semi-annual financialstatements first become available. In addition, as part of an ongoing credit review process, our credit officersmonitor changes in all customers’ creditworthiness, including bankruptcy, past due principal or interest,downgrading of external credit rating, declining stock price, business restructuring and other events, and reassessborrowers’ ratings in response to such events. This credit monitoring process form an integral part of our overallcontrol process. An impaired loan is evaluated individually based on the present value of expected future cashflows discounted at the loan’s effective interest rate, the loan’s observable market price or the fair value of thecollateral at the annual and semi-annual fiscal year end, if the loan is collateral-dependent at a balance-sheet date.
The following table summarizes nonaccrual and restructured loans, and accruing loans that are contractuallypast due 90 days or more as to principal or interest payments, at March 31, 2004, 2005 and 2006:
At March 31,
2004 2005 2006
(in billions, except percentages)Nonaccrual loans:
Domestic:Manufacturing . . . . . . . . . . . . . . . . . . . . . . . . . . . . . . . . . . . . . . . . . . . . . . ¥ 175.7 ¥ 113.9 ¥ 126.9Construction . . . . . . . . . . . . . . . . . . . . . . . . . . . . . . . . . . . . . . . . . . . . . . . . 59.0 47.8 37.7Real estate . . . . . . . . . . . . . . . . . . . . . . . . . . . . . . . . . . . . . . . . . . . . . . . . . 154.8 122.0 162.8Services . . . . . . . . . . . . . . . . . . . . . . . . . . . . . . . . . . . . . . . . . . . . . . . . . . . 73.0 169.6 60.7Wholesale and retail . . . . . . . . . . . . . . . . . . . . . . . . . . . . . . . . . . . . . . . . . . 108.5 85.7 128.6Banks and other financial institutions . . . . . . . . . . . . . . . . . . . . . . . . . . . . 21.4 4.3 15.8Communication and information services . . . . . . . . . . . . . . . . . . . . . . . . . 5.1 11.8 12.8Other industries . . . . . . . . . . . . . . . . . . . . . . . . . . . . . . . . . . . . . . . . . . . . . 39.8 22.3 29.2Consumer . . . . . . . . . . . . . . . . . . . . . . . . . . . . . . . . . . . . . . . . . . . . . . . . . . 141.8 119.2 360.7
Total domestic . . . . . . . . . . . . . . . . . . . . . . . . . . . . . . . . . . . . . . . . . . 779.1 696.6 935.2Foreign . . . . . . . . . . . . . . . . . . . . . . . . . . . . . . . . . . . . . . . . . . . . . . . . . . . . . . . . . . . . 303.9 124.3 74.6
Total nonaccrual loans . . . . . . . . . . . . . . . . . . . . . . . . . . . . . . . . . . . . 1,083.0 820.9 1,009.8
Restructured loans:Domestic:
Manufacturing . . . . . . . . . . . . . . . . . . . . . . . . . . . . . . . . . . . . . . . . . . . . . . 88.7 30.8 50.9Construction . . . . . . . . . . . . . . . . . . . . . . . . . . . . . . . . . . . . . . . . . . . . . . . . 41.2 54.1 30.8Real estate . . . . . . . . . . . . . . . . . . . . . . . . . . . . . . . . . . . . . . . . . . . . . . . . . 131.0 116.1 149.7Services . . . . . . . . . . . . . . . . . . . . . . . . . . . . . . . . . . . . . . . . . . . . . . . . . . . 87.5 36.6 58.4Wholesale and retail . . . . . . . . . . . . . . . . . . . . . . . . . . . . . . . . . . . . . . . . . . 149.3 87.3 379.9Banks and other financial institutions . . . . . . . . . . . . . . . . . . . . . . . . . . . . 1.6 0.3 0.1Communication and information services . . . . . . . . . . . . . . . . . . . . . . . . . 4.7 3.6 8.2Other industries . . . . . . . . . . . . . . . . . . . . . . . . . . . . . . . . . . . . . . . . . . . . . 12.4 48.0 157.4Consumer . . . . . . . . . . . . . . . . . . . . . . . . . . . . . . . . . . . . . . . . . . . . . . . . . . 61.0 54.2 101.8
Total domestic . . . . . . . . . . . . . . . . . . . . . . . . . . . . . . . . . . . . . . . . . . 577.4 431.0 937.2Foreign . . . . . . . . . . . . . . . . . . . . . . . . . . . . . . . . . . . . . . . . . . . . . . . . . . . . . . . . . . . . 55.0 23.2 74.7
Total restructured loans . . . . . . . . . . . . . . . . . . . . . . . . . . . . . . . . . . . 632.4 454.2 1,011.9
Accruing loans contractually past due 90 days or more:Domestic . . . . . . . . . . . . . . . . . . . . . . . . . . . . . . . . . . . . . . . . . . . . . . . . . . . . . . . . . . . 14.7 9.2 21.9Foreign . . . . . . . . . . . . . . . . . . . . . . . . . . . . . . . . . . . . . . . . . . . . . . . . . . . . . . . . . . . . 0.9 0.9 1.1
Total accruing loans contractually past due 90 days or more . . . . . . . . . . . . . . 15.6 10.1 23.0
Total . . . . . . . . . . . . . . . . . . . . . . . . . . . . . . . . . . . . . . . . . . . . . . . . . . ¥ 1,731.0 ¥ 1,285.2 ¥ 2,044.7
Total loans . . . . . . . . . . . . . . . . . . . . . . . . . . . . . . . . . . . . . . . . . . . . . ¥48,357.7 ¥50,904.0 ¥95,506.8
Nonaccrual and restructured loans, and accruing loans contractually past due 90 days ormore as a percentage of total loans . . . . . . . . . . . . . . . . . . . . . . . . . . . . . . . . . . . . . . . . 3.58% 2.52% 2.14%
80

Domestic nonaccrual loans and restructured loans within the “consumer” category in the above table includeloans to individuals who utilize loan proceeds to finance their proprietor activities and not for their personalfinancing needs.
Manufacturing ConstructionRealestate Services
Wholesaleand
retail
Banks andother
financialinstitutions
Communicationand
informationservices
Otherindustries
Totalincluded
inConsumer
(in billions)March 31, 2005
Nonaccrual loans . . . . . . . ¥1.3 ¥1.0 ¥43.3 ¥13.7 ¥3.2 ¥— ¥0.2 ¥0.5 ¥63.2Restructured loans . . . . . . 1.2 0.3 19.2 2.9 1.9 — — — 25.5
March 31, 2006Nonaccrual loans . . . . . . . ¥1.1 ¥0.8 ¥27.9 ¥ 9.7 ¥1.6 ¥— ¥0.2 ¥0.3 ¥41.6Restructured loans . . . . . . 0.3 0.1 14.4 1.3 0.9 — — — 17.0
We have been actively making efforts to reduce our nonperforming loans. These efforts have been made toimprove the quality of our own loan assets, which conforms to the policy to decrease nonperforming loans underthe program for financial revival announced by the Japanese government in October 2002. Nonaccrual andrestructured loans, and accruing loans contractually past due 90 days or more increased ¥759.5 billion fromMarch 31, 2005, to ¥2,044.7 billion at March 31, 2006, primarily due to the merger with UFJ Holdings. Forreference, the nonperforming loans formerly held by UFJ Holdings were ¥2,326.9 billion at March 31, 2005 and¥2,225.9 billion at September 30, 2005. In contrast, the percentage of nonperforming loans to the total loansdecreased to 2.14% at March 31, 2006 from 2.52% at March 31, 2005.
Total nonaccrual loans were ¥1,009.8 billion at March 31, 2006, an increase of ¥188.9 billion, or 23.0%,from ¥820.9 billion at March 31, 2005. Domestic nonaccrual loans increased ¥238.6 billion while foreignnonaccrual loans decreased ¥49.7 billion. Domestic nonaccrual loans increased due to the merger with UFJHoldings. These increases were partially offset by the decrease caused by upgrades of many borrowers’ creditratings which were driven by the improved business performance or sales of loans. Foreign nonaccrual loansdecreased primarily due to upgrades in credit ratings through the turnaround of the business performance ofborrowers to whom we had large exposures, as a result of progress in their restructuring plans. The decrease waspartially offset by the increases due to the merger with UFJ Holdings.
Analyzing by industry segments, nonaccrual loans increased in a number of industry segments due to themerger with UFJ Holdings, including ¥241.5 billion in consumer, ¥42.9 billion in wholesale and retail, and¥40.8 billion in real estate, while nonaccrual loans decreased ¥108.9 billion in services. Regarding the servicesindustry segment, the merger with UFJ Holdings had less of an impact on the increase of nonaccrual loanscompared to the positive impact caused by upgrades of credit ratings due to the improved business performanceof borrowers to whom we had large exposures, as a result of progress in their restructuring plans.
Total restructured loans were ¥1,011.9 billion at March 31, 2006, an increase of ¥557.7 billion, or 122.8%,from ¥454.2 billion at March 31, 2005. Domestic restructured loans increased ¥506.2 billion and foreignrestructured loans increased ¥51.5 billion. These increases were mainly due to the merger with UFJ Holdings.
Analyzing by industry segments, restructured loans increased in most industry segments, particularly inwholesale and retail by ¥292.6 billion. This increase was mainly attributable to the addition of loans to borrowersfor which UFJ Holdings had extended relatively large amounts in this industry segment. Other industries increasedby ¥109.4 billion mainly because loans to borrowers to whom we had large exposures which were booked asnonaccrual loans at March 31, 2005 were upgraded due to the progress of their restructuring plans and instead werebooked as restructured loans at March 31, 2006.
81

The following table summarizes the balances of impaired loans and related impairment allowances atMarch 31, 2004, 2005 and 2006, excluding smaller-balance homogeneous loans:
At March 31,
2004 2005 2006
Loanbalance
Impairmentallowance
Loanbalance
Impairmentallowance
Loanbalance
Impairmentallowance
(in billions)Requiring an impairment allowance . . . . . . . . ¥1,405.7 ¥563.6 ¥1,042.0 ¥460.4 ¥1,205.6 ¥441.4Not requiring an impairment allowance . . . . . 183.1 — 147.3 — 254.0 —
Total . . . . . . . . . . . . . . . . . . . . . . . . . . . . ¥1,588.8 ¥563.6 ¥1,189.3 ¥460.4 ¥1,459.6 ¥441.4
Percentage of the allocated allowance to totalimpaired loans . . . . . . . . . . . . . . . . . . . . . . . 35.5% 38.7% 30.2%
In addition to impaired loans presented in the above table, there were loans held for sale that were impairedof ¥12.6 billion, ¥15.3 billion and ¥0.2 billion at March 31, 2004, 2005 and 2006, respectively.
Impaired loans increased ¥270.3 billion, or 22.7%, from ¥1,189.3 billion at March 31, 2005 to ¥1,459.6billion at March 31, 2006. This increase was primarily due to the merger with UFJ Holdings.
The percentage of the allocated allowance to total impaired loans at March 31, 2006 was 30.2%, a decreaseof 8.5 percentage points from 38.7% at March 31, 2005. This decrease was mainly due to the overallimprovement of the credit quality of the nonaccrual loans portfolio, and the upgrade of large borrowers whichwere formerly classified as nonaccrual loans. The upgrades of large borrowers also led to the decrease in theproportion of nonaccrual loans as compared to the balance of total impaired loans.
Based upon a review of borrowers’ financial status, from time to time each of our banking subsidiariesgrants various concessions (modification of loan terms) to troubled borrowers at the borrowers’ request,including reductions in the stated interest rates or the principal amount of loans, and extensions of the maturitydate. According to the policies of each of our banking subsidiaries, such modifications are made to mitigate thenear-term burden of the borrowers and to better match the payment terms with the borrowers’ expected futurecash flows or, in cooperation with other creditors, to reduce the overall debt burden of the borrowers so that theymay normalize their operations, in each case to improve the likelihood that the loans will be repaid in accordancewith the revised terms. The nature and amount of the concessions depend on the particular financial condition ofeach borrower. In principle, however, each of our banking subsidiaries do not modify the terms of loans toborrowers that are considered “Likely to Become Bankrupt,” “Virtually Bankrupt” or “Bankrupt” because inthese cases there is little likelihood that the modification of loan terms would enhance recovery of the loans.
Allocated allowance for large groups of smaller-balance homogeneous loans
The allocated credit loss allowance for large groups of smaller-balance homogeneous loans is focused onloss experience for the pool rather than on an analysis of individual loans. Large groups of smaller-balancehomogeneous loans primarily consist of first mortgage housing loans to individuals. The allowance for groups ofperforming loans is based on historical loss experience over a period. In determining the level of the allowancefor delinquent groups of loans, we classify groups of homogeneous loans based on the risk rating and/or thenumber of delinquencies. We determine the credit loss allowance for delinquent groups of loans based on theprobability of insolvency by the number of actual delinquencies and actual loss experience. The loss experienceis usually determined by reviewing the historical loss rate. The allocated credit loss allowance for large groups ofsmaller-balance homogeneous loans was ¥152.3 billion at March 31, 2006, an increase of ¥114.9 billion from
82

¥37.4 billion at March 31, 2005. This increase was mainly attributable to the allowance of ¥118.9 billionacquired in the merger with UFJ Holdings. The allowance allocated for the loans made by our subsidiaries in theconsumer finance sector and mortgage guarantee sector comprised a large portion of the ¥118.9 billion.
Allocated allowance for country risk exposure
The allocated credit loss allowance for country risk exposure is based on an estimate of probable lossesrelating to the exposure to countries that we identify as having a high degree of transfer risk. The countriesapplicable to the allowance for country risk exposure are decided based on a country risk grading system used toassess and rate the transfer risk to individual countries. The allowance is generally determined based on afunction of default probability and expected recovery ratios, taking external credit ratings into account. Theallocated allowance for country risk exposure was approximately ¥0.1 billion at March 31, 2005 and 2006.
The following is a summary of cross-border outstandings to counterparties in major Asian and LatinAmerican countries at March 31, 2005 and 2006:
At March 31,
2005 2006
(in billions)
Hong Kong . . . . . . . . . . . . . . . . . . . . . . . . . . . . . . . . . . . . . . . . . . . . . . . . . . . . . . . . . . ¥358.3 ¥554.7People’s Republic of China . . . . . . . . . . . . . . . . . . . . . . . . . . . . . . . . . . . . . . . . . . . . . . 288.7 512.6Singapore . . . . . . . . . . . . . . . . . . . . . . . . . . . . . . . . . . . . . . . . . . . . . . . . . . . . . . . . . . . . 291.4 457.6South Korea . . . . . . . . . . . . . . . . . . . . . . . . . . . . . . . . . . . . . . . . . . . . . . . . . . . . . . . . . . 256.3 301.5Thailand . . . . . . . . . . . . . . . . . . . . . . . . . . . . . . . . . . . . . . . . . . . . . . . . . . . . . . . . . . . . . 235.3 291.9Malaysia . . . . . . . . . . . . . . . . . . . . . . . . . . . . . . . . . . . . . . . . . . . . . . . . . . . . . . . . . . . . 109.2 213.8Indonesia . . . . . . . . . . . . . . . . . . . . . . . . . . . . . . . . . . . . . . . . . . . . . . . . . . . . . . . . . . . . 36.6 132.7Philippines . . . . . . . . . . . . . . . . . . . . . . . . . . . . . . . . . . . . . . . . . . . . . . . . . . . . . . . . . . . 44.4 58.4Brazil . . . . . . . . . . . . . . . . . . . . . . . . . . . . . . . . . . . . . . . . . . . . . . . . . . . . . . . . . . . . . . . 72.0 137.4Mexico . . . . . . . . . . . . . . . . . . . . . . . . . . . . . . . . . . . . . . . . . . . . . . . . . . . . . . . . . . . . . . 47.4 89.3
We record allocated allowance for country risk exposure for specific countries, but not necessarily for all ofthe countries above.
Through the merger with UFJ Holdings, cross-border outstandings to Asia and Latin America haveincreased. Our cross-border outstandings to countries such as Singapore and Indonesia have also increased due totheir stable economies.
Formula allowance for substandard, special mention and unclassified loans
The formula allowance is calculated by applying estimated loss factors to outstanding substandard, specialmention and unclassified loans. In evaluating the inherent loss for these loans, we rely on a statistical analysisthat incorporates a percentage of total loans based on historical loss experience.
Each of our banking subsidiaries has computed the formula allowance based on estimated credit losses usinga methodology defined by the credit rating system. Estimated losses inherent in the loan portfolio at the balancesheet date are calculated by multiplying the default ratio by the nonrecoverable ratio (determined as acomplement of the recovery ratio). The default ratio is determined by each credit risk rating, taking into accountthe historical number of defaults of borrowers within each credit risk rating divided by the total number ofborrowers within that credit risk rating existing at the beginning of the three-year observation period. Therecovery ratio is mainly determined by the historical experience of collections against loans in default.
UnionBanCal Corporation, our largest overseas subsidiary, calculates the formula allowance by applyingloss factors to outstanding loans and certain unused commitments, in each case based on the internal risk grade of
83

such loans, leases and commitments. Changes in risk grades affect the amount of the formula allowance. Lossfactors are based on their historical loss experience and may be adjusted for significant factors that, inmanagement’s judgment, affect the collectibility of the portfolio as of the evaluation date. Loss factors aredeveloped in the following ways:
• loss factors for individually graded credits are derived from a migration model that tracks historicallosses over a period, which we believe captures the inherent losses in our loan portfolio; and
• pooled loan loss factors (not individually graded loans) are based on expected net charge-offs. Pooledloans are loans that are homogeneous in nature, such as consumer installment, home equity, residentialmortgage loans and certain small commercial and commercial real estate loans.
Though there are a few technical differences in the methodology used for the allowance for credit losses asmentioned above, we examine overall sufficiency of the formula allowance periodically by back-test comparisonwith the actual loss experience subsequent to the balance sheet date.
The formula allowance increased ¥177.3 billion from ¥233.4 billion at March 31, 2005 to ¥410.7 billion atMarch 31, 2006. This increase was mainly attributable to the allowance of ¥168.6 billion acquired in the mergerwith UFJ Holdings.
Unallocated allowance
The unallocated allowance is based on management’s evaluation of conditions that are not directly reflectedin the determination of the formula and specific allowances. The evaluation of the inherent loss with respect tothese conditions is subject to a higher degree of uncertainty because they may not be identified with specificproblem credits or portfolio segments. The conditions evaluated in connection with the unallocated allowanceinclude the following, which were considered to exist at the balance sheet date:
• general economic and business conditions affecting our key lending areas;
• credit quality trends (including trends in nonperforming loans expected to result from existingconditions);
• collateral values;
• loan volumes and concentrations;
• specific industry conditions within portfolio segments;
• recent loss experience in particular segments of the portfolio;
• duration of the current economic cycle;
• bank regulatory examination results; and
• findings of internal credit examination.
Executive management reviews these conditions quarterly in discussion with our senior credit officers. Tothe extent that any of these conditions is evidenced by a specifically identifiable problem credit or portfoliosegment as of the evaluation date, management’s estimate of the effect of such conditions may be reflected as aspecific allowance, applicable to such credit or portfolio segment. Where any of these conditions is not evidencedby a specifically identifiable problem credit or portfolio segment as of the evaluation date, management’sevaluation of the probable loss related to such condition is reflected in the unallocated allowance.
The unallocated allowance decreased ¥0.9 billion from ¥8.6 billion at March 31, 2005 to ¥7.7 billion atMarch 31, 2006. This decrease resulted mainly from management’s assessment of economic and specificindustry conditions.
84

Allowance for Off-balance-sheet Credit Instruments
In addition to the allowance for credit losses on the loan portfolio, we maintain an allowance for creditlosses on off-balance-sheet credit instruments, including commitments to extend credit, a variety of guaranteesand standby letters of credit. This allowance is included in other liabilities. With regard to the specific allocatedallowance for specifically identified credit exposure and the allocated formula allowance, we apply the samemethodology that we use in determining the allowance for loan credit losses. The allowance for credit losses onoff-balance-sheet credit instruments was ¥102.3 billion at March 31, 2006, an increase of ¥32.8 billion, or 47.2%,from ¥69.5 billion at March 31, 2005. This increase was mainly due to the merger with UFJ Holdings.
Investment Portfolio
Our investment securities are primarily comprised of marketable equity securities and Japanese governmentand Japanese government agency bonds, which are mostly classified as available-for-sale securities. We alsohold Japanese government bonds which are classified as securities being held to maturity.
Historically, we have held equity securities of some of our customers for strategic purposes, in particular tomaintain long-term relationships with these customers. However, we have been reducing the aggregate value ofour equity securities because we believe that, from a risk management perspective, it is important to reduce theprice fluctuation risk in our equity portfolio. As of March 31, 2006, the aggregate value of our marketable equitysecurities under Japanese GAAP satisfies the requirements of the legislation forbidding banks from holdingequity securities in excess of their Tier I capital after September 30, 2006.
Investment securities increased ¥19.02 trillion, from ¥29.79 trillion at March 31, 2005 to ¥48.81 trillion atMarch 31, 2006 due primarily to the merger with UFJ Holdings, as UFJ Holdings also had a large holding ofinvestment securities, ¥20.36 trillion as of September 30, 2005, before the merger with us. Factors which increasedinvestment securities other than the merger include the increase in accumulated net unrealized gains on marketableequity securities, due to the improvement in the Japanese stock market. These increases were partially offset by the¥0.70 trillion preferred shares of UFJ Bank being converted into common shares of BTMU and then eliminated inconsolidation at March 31, 2006, although they were recognized as investment securities at March 31, 2005.
The following table shows information as to the value of our investment securities available for sale andbeing held to maturity at March 31, 2005 and 2006:
At March 31,
2005 2006
Amortizedcost
Estimatedfair value
Netunrealized
gainsAmortized
costEstimatedfair value
Netunrealized
gains (losses)
(in billions)
Securities available for sale:
Debt securities, principallyJapanese government bondsand corporate bonds . . . . . . . . ¥22,463.7 ¥22,604.3 ¥ 140.6 ¥36,737.2 ¥36,939.1 ¥ 201.9
Marketable equity securities . . . . 2,333.4 3,953.6 1,620.2 4,852.9 8,546.8 3,693.9
Total securities available forsale . . . . . . . . . . . . . . . . . . ¥24,797.1 ¥26,557.9 ¥1,760.8 ¥41,590.1 ¥45,485.9 ¥3,895.8
Debt securities being held to maturity,principally Japanese governmentbonds . . . . . . . . . . . . . . . . . . . . . . . . ¥ 2,191.3 ¥ 2,213.6 ¥ 22.3 ¥ 2,466.1 ¥ 2,451.8 ¥ (14.3)
The amortized cost of securities being held to maturity increased ¥0.27 trillion as our treasury operationsincreased holdings in Japanese government bonds for asset-liability management purposes, mainly due to the fact thatour balance of deposits exceeded our loans, and Japanese government bonds were a viable investment option for us.
85

The estimated fair value of available-for-sale securities increased ¥18.93 trillion from ¥26.56 trillion atMarch 31, 2005 to ¥45.49 trillion at March 31, 2006, primarily due to the merger with UFJ Holdings, whichincreased our investment in Japanese governments bonds, private placement debt securities and equity securities.Other factors which increased the estimated fair value of our available-for-sale securities were mainly the resultof the rise in Japanese equity prices in general.
Net unrealized gains on available-for-sale securities included in the investment portfolio at March 31, 2005and 2006 were ¥1.76 trillion and ¥3.90 trillion, respectively. These net unrealized gains related principally tomarketable equity securities.
Cash and Due from Banks
Cash and due from banks at March 31, 2006 was ¥6.24 trillion, an increase of ¥2.03 trillion from ¥4.21trillion at March 31, 2005. The increase was primarily due to the merger with UFJ Holdings.
Interest-earning Deposits in Other Banks
Interest-earning deposits in other banks fluctuate significantly from day to day depending upon financialmarket conditions. Interest-earning deposits in other banks at March 31, 2006 were ¥6.24 trillion, an increase of¥1.72 trillion, from ¥4.52 trillion at March 31, 2005. This increase primarily reflected an increase in foreigncurrency deposits.
Goodwill
Goodwill at March 31, 2006 was ¥1.84 trillion, an increase of ¥1.75 trillion from ¥0.09 trillion at March 31,2005. The ¥1.73 trillion of goodwill relating to the merger with UFJ Holdings mainly contributed to the increasein goodwill.
Deferred Tax Assets
Deferred tax assets increased ¥0.44 trillion, or 56.6%, from ¥0.77 trillion at March 31, 2005 to ¥1.21 trillionat March 31, 2006. This increase was primarily due to the recognition of deferred tax assets for operating losscarryforwards and the temporary differences between the assigned values and the tax bases of the assets acquiredand liabilities assumed in the purchase business combination with UFJ Holdings, which was partly offset by anincrease of deferred tax liabilities including those related to investment securities. The valuation allowancesignificantly decreased as compared to that provided by UFJ Holdings and its subsidiaries as of September 30,2005 as a result of our analysis based on all available evidence concerning the updated projection of futuretaxable income of the combined entity.
Total Liabilities
At March 31, 2006, total liabilities were ¥176.55 trillion, an increase of ¥72.50 trillion from ¥104.05 trillionat March 31, 2005. The increase was primarily due to the merger with UFJ Holdings, which also had a largedomestic customer deposit base. This increase primarily reflected increases of ¥55.50 trillion in total deposits and¥7.91 trillion in long-term debt.
The depreciation of the yen against the US dollar and other foreign currencies during the fiscal year endedMarch 31, 2006 increased the yen values for liabilities denominated in foreign currencies by approximately ¥3.11trillion.
Deposits
Deposits are our primary source of funds. Total average deposits increased ¥27.93 trillion from ¥70.33trillion for the fiscal year ended March 31, 2005 to ¥98.26 trillion for the fiscal year ended March 31, 2006. Thisincrease primarily reflected a ¥17.15 trillion increase in average domestic interest-bearing deposits primarilyresulting from the merger with UFJ Holdings.
86

Domestic deposits increased ¥52.03 trillion from ¥58.03 trillion at March 31, 2005 to ¥110.06 trillion atMarch 31, 2006, while foreign deposits increased ¥3.47 trillion from ¥13.11 trillion at March 31, 2005 to ¥16.58trillion at March 31, 2006.
Short-term Borrowings
We use short-term borrowings as a funding source and in our management of interest rate risk. Formanagement of interest rate risk, short-term borrowings are used in asset-liability management operations tomatch interest rate risk exposure resulting from loans and other interest-earning assets and for managing fundingcosts of various financial instruments at an appropriate level, based on our forecast of future interest rate levels.Short-term borrowings consist of call money and funds purchased, payables under repurchase agreements,payables under securities lending transactions, due to trust accounts and other short-term borrowings.
Short-term borrowings increased ¥5.34 trillion from ¥19.01 trillion at March 31, 2005 to ¥24.35 trillion atMarch 31, 2006 due mainly to the merger with UFJ Holdings.
Long-term debt
Long-term debt at March 31, 2006 was ¥13.89 trillion, an increase of ¥7.91 trillion from ¥5.98 trillion atMarch 31, 2005. This increase was primarily due to the merger with UFJ Holdings. Another factor whichcontributed to the increase in long-term debt was an increase of subordinated loans made to BTMU byunconsolidated special purpose companies using proceeds from non-dilutive, nonconvertible preferred securitiesissued during the fiscal year ended March 31, 2006.
Severance Indemnities and Pension Liabilities
As discussed in “Item 5.A. Operating Results—Recent Developments—Transfer to the JapaneseGovernment of the Substitutional Portion of Employee Pension Fund Liabilities” and “Item 5.A. OperatingResults—Accounting Changes—Transfer to the Japanese Government of the Substitutional Portion of EmployeePension Fund Liabilities,” in March 2005, the substitutional portion of the employee pension fund liabilities ofBank of Tokyo-Mitsubishi was transferred to a government agency and Bank of Tokyo-Mitsubishi was releasedfrom the obligation to pay the substitutional portion of the benefits to its employees. Although the completion ofthe transfer constituted a settlement of such plan, since there remains a defined benefit plan and the settlementoccurred subsequent to December 31, 2004 (the measurement date of such plan), the impact of the transfer /settlement of a pre-tax income of ¥35.0 billion was recognized in the fiscal year ended March 31, 2006. See note18 to our consolidated financial statements for details of our defined benefit pension plans and the effect of thetransfer / settlement.
Sources of Funding and Liquidity
Our primary source of liquidity is from a large balance of deposits, mainly ordinary deposits, certificates ofdeposit and time deposits. Time deposits have shown a historically high rollover rate among our corporatecustomers and individual depositors. Due to the economic and financial environment in Japan, as well as ourrelatively high financial standing in Japan, our deposits have steadily increased during recent years, and increasedsignificantly due to the merger with UFJ Holdings. As of March 31, 2006, our deposits of ¥126.64 trillion exceededour loans, net of allowance for credit losses of ¥94.49 trillion, by ¥32.15 trillion. These deposits provide us with asizable source of stable and low-cost funds. While approximately 50.3% of certificates of deposit and time depositsmature within three months, we continuously monitor relevant interest rate characteristics of these funds and utilizeasset and liability management techniques to manage the possible impact of the rollovers on our net interest marginand liquidity. Our average deposits, combined with average shareholders’ equity, funded 66.1% of our average totalassets of ¥159.35 trillion during the fiscal year ended March 31, 2006.
Most of the remaining funding was provided by short-term borrowings and long-term senior andsubordinated debt. Short-term borrowings consist of call money and funds purchased, payables under repurchaseagreements, payables under securities lending transactions, due to trust account and other short-term borrowings.
87

From time to time, we have issued long-term instruments such as straight bonds with mainly three to five years’maturity. Liquidity may also be provided by the sale of financial assets, including securities available for sale,trading account securities and loans. Additional liquidity may be provided by the maturity of loans.
Total Shareholders’ Equity
The following table presents a summary of our total shareholders’ equity at March 31, 2005 and 2006:
At March 31,
2005 2006
(in billions, except percentages)
Preferred stock . . . . . . . . . . . . . . . . . . . . . . . . . . . . . . . . . . . . . . . . . . . . . . . . . . . . . . . ¥ 247.1 ¥ 247.1Common stock . . . . . . . . . . . . . . . . . . . . . . . . . . . . . . . . . . . . . . . . . . . . . . . . . . . . . . . 1,084.7 1,084.7Capital surplus . . . . . . . . . . . . . . . . . . . . . . . . . . . . . . . . . . . . . . . . . . . . . . . . . . . . . . . 1,080.5 5,566.9Retained earnings . . . . . . . . . . . . . . . . . . . . . . . . . . . . . . . . . . . . . . . . . . . . . . . . . . . . 1,567.5 1,664.2Accumulated other changes in equity from nonowner sources, net of taxes . . . . . . . 396.6 1,880.2Treasury stock, at cost . . . . . . . . . . . . . . . . . . . . . . . . . . . . . . . . . . . . . . . . . . . . . . . . . (3.3) (774.9)
Total shareholders’ equity . . . . . . . . . . . . . . . . . . . . . . . . . . . . . . . . . . . . . . . . . . ¥4,373.1 ¥9,668.2
Ratio of total shareholders’ equity to total assets . . . . . . . . . . . . . . . . . . . . . . . . . . . . 4.03% 5.19%
Total shareholders’ equity increased ¥5,295.1 billion, from ¥4,373.1 billion at March 31, 2005 to ¥9,668.2billion at March 31, 2006. The ratio of total shareholders’ equity to total assets also showed an increase of 1.16percentage points from 4.03% at March 31, 2005 to 5.19% at March 31, 2006. The increase in total shareholders’equity at March 31, 2006, and the resulting increase in the ratio to total assets, were principally attributable to anincrease of ¥4,486.4 billion in capital surplus mainly due to the issuance of new shares of common stock in themerger with UFJ Holdings, and an increase of ¥1,483.6 billion in accumulated other changes in equity fromnonowner sources. These increases were partially offset by the increase in treasury stock, which reflectedrepurchases of our own shares.
Due to our holdings of a large amount of marketable Japanese equity securities and the volatility of theequity markets in Japan, changes in the fair value of marketable equity securities have significantly affected ourshareholders’ equity. The following table presents information relating to the accumulated net unrealized gainsbefore tax effect in respect of marketable equity securities classified as available for sale at March 31, 2005 and2006:
At March 31,
2005 2006
(in billions, except percentages)
Accumulated net unrealized gains . . . . . . . . . . . . . . . . . . . . . . . . . . . . . . . . . . . . . . . ¥1,620.2 ¥3,693.9Accumulated net unrealized gains to total assets . . . . . . . . . . . . . . . . . . . . . . . . . . . . 1.49% 1.98%
Capital Adequacy
We are subject to various regulatory capital requirements promulgated by the regulatory authorities of thecountries in which we operate. Failure to meet minimum capital requirements can initiate mandatory actions byregulators that, if undertaken, could have a direct material effect on our consolidated financial statements.
We continually monitor our risk-adjusted capital ratio closely and manage our operations in consideration ofthe capital ratio requirements. These ratios are affected not only by fluctuations in the value of our assets,including our marketable securities and deferred tax assets, but also by fluctuations in the value of the yenagainst the US dollar and other foreign currencies and by general price levels of Japanese equity securities.
88

Capital Requirements for Banking Institutions in Japan
A Japanese banking institution is subject to the minimum capital adequacy requirements both on aconsolidated basis and a stand-alone basis, and is required to maintain the minimum capital irrespective ofwhether it operates independently or as a subsidiary under the control of another company. A bank holdingcompany is also subject to the minimum capital adequacy requirements on a consolidated basis. Under theFinancial Services Agency’s guidelines, capital is classified into three tiers, referred to as Tier I, Tier II and TierIII. Our Tier I capital generally consists of shareholders’ equity items, including common stock, non-cumulativepreferred stock, capital surplus, minority interests and retained earnings (which includes deferred tax assets), butrecorded goodwill and other items, such as treasury stock, are deducted from Tier I capital. Our Tier II generallyconsists of general reserves for credit losses up to 1.25% of risk-weighted assets, 45% of the unrealized gains oninvestment securities available for sale, 45% of the land revaluation excess, the balance of perpetual subordinateddebt and the balance of subordinated term debt with an original maturity of over five years subject to certainlimitations, up to 50% of Tier I capital. Our Tier III capital consists of short-term subordinated debt with anoriginal maturity of at least two years, subject to certain limitations. At least 50% of the minimum capitalrequirements must be maintained in the form of Tier I capital.
Under the Japanese regulatory capital requirements, our consolidated capital components, including Tier I,Tier II and Tier III and risk-weighted assets are calculated from our consolidated financial statements preparedunder Japanese GAAP. Also, each of the consolidated and stand-alone capital components of our bankingsubsidiaries in Japan is calculated from consolidated and non-consolidated financial statements prepared underJapanese GAAP, respectively.
For a detailed discussion of the capital adequacy guidelines adopted by the Financial Service Agency andproposed amendments, see “Item 4.B. Information on the Company—Business Overview—Supervision andRegulation—Japan—Capital Adequacy.”
Capital Requirements for Banking Institutions in the United States
In the United States, UnionBanCal Corporation and its banking subsidiary, Union Bank of California, N.A.,our largest subsidiaries operating outside Japan, are subject to various regulatory capital requirementsadministered by U.S. Federal banking agencies, including minimum capital requirements. Under capitaladequacy guidelines and the regulatory framework for prompt corrective action, they must meet specific capitalguidelines that involve quantitative measures of their assets, liabilities and certain off-balance-sheet items ascalculated under U.S. regulatory accounting practices. Their capital amounts and prompt corrective actionclassification are also subject to qualitative judgments by the regulators about components, risk weightings andother factors.
For a detailed discussion of the capital adequacy guidelines applicable to our U.S. bank subsidiaries, see“Item 4.B. Information on the Company—Business Overview—Supervision and Regulation—United States—Bank Capital Requirements and Capital Distributions.”
Capital Requirements for Securities Firms in Japan and Overseas
We have securities subsidiaries in Japan and overseas, which are also subject to regulatory capitalrequirements. In Japan, the Securities and Exchange Law of Japan and related ordinance require securities firms tomaintain a minimum capital ratio of 120% calculated by as a percentage of capital accounts less certain illiquidassets, as determined in accordance with Japanese GAAP, against amounts equivalent to market, counterparty creditand operations risks. Specific guidelines are issued as a ministerial ordinance which detail the definition of essentialcomponents of the capital ratios, including capital, illiquid assets deductions, risks and related measures. Failure tomaintain a minimum capital ratio will trigger mandatory regulatory actions. A capital ratio of less than 140% willcall for regulatory reporting and a capital ratio of 100% or less may lead to a suspension of all or part of the businessfor a period of time and cancellation of registration. Overseas securities subsidiaries are subject to the relevantregulatory capital requirements of the countries or jurisdictions in which they operate.
89

Mitsubishi UFJ Financial Group Ratios
The table below presents our consolidated risk-based capital, risk-adjusted assets and risk-based capitalratios at March 31, 2005 and 2006 (underlying figures are calculated in accordance with Japanese bankingregulations based on information derived from our consolidated financial statements prepared in accordance withJapanese GAAP, as required by the Financial Services Agency):
At March 31, Minimum capitalratios required2005 2006
(in billions, except percentages)Capital components:
Tier I capital . . . . . . . . . . . . . . . . . . . . . . . . . . . . . . . . . . . . ¥ 4,286.8 ¥ 7,501.7Tier II capital includable as qualifying capital . . . . . . . . . 3,250.9 6,293.7Tier III capital includable as qualifying capital . . . . . . . . . — —Deductions from total qualifying capital . . . . . . . . . . . . . . 915.1 335.0
Total risk-based capital . . . . . . . . . . . . . . . . . . . . . . . . . . . ¥ 6,622.6 ¥ 13,460.4
Risk-weighted assets . . . . . . . . . . . . . . . . . . . . . . . . . . . . . . . . . ¥56,270.6 ¥110,292.7Capital ratios:
Tier I capital . . . . . . . . . . . . . . . . . . . . . . . . . . . . . . . . . . . . 7.62% 6.80% 4.00%Total risk-based capital . . . . . . . . . . . . . . . . . . . . . . . . . . . 11.76 12.20 8.00
Our Tier I ratio decreased 0.82 percentage points from 7.62% at March 31, 2005 to 6.80% at March 31,2006. This decrease reflected, among other things, the merger with UFJ Holdings and the increase of treasurystock resulting from repurchases of our own shares which was completed in connection with the repayment ofpublic funds originally received by UFJ Holdings from the RCC. The increase in our retained earnings underJapanese GAAP and our issuance of non-dilutive preferred securities during the fiscal year ended March 31,2006 partially offset this decrease. Our total risk-based capital ratio increased 0.44 percentage points from11.76% at March 31, 2005 to 12.20% at March 31, 2006 mainly due to an increase in unrealized gains from oursecurities holdings
Capital Ratios of Our Major Subsidiary Banks in Japan
The table below presents the risk-based capital ratios of BTMU and MUTB at March 31, 2005 and 2006(underlying figures are calculated in accordance with Japanese banking regulations based on information derivedfrom their consolidated and non-consolidated financial statements prepared in accordance with Japanese GAAP,as required by the Financial Services Agency):
At March 31, Minimum capitalratios required2005 2006
Consolidated capital ratios:BTMU
Tier I capital . . . . . . . . . . . . . . . . . . . . . . . . . . . . . . . . . . . . . . . . . . . . . . 6.86% 7.05% 4.00%Total risk-based capital . . . . . . . . . . . . . . . . . . . . . . . . . . . . . . . . . . . . . 11.83 12.48 8.00
MUTBTier I capital . . . . . . . . . . . . . . . . . . . . . . . . . . . . . . . . . . . . . . . . . . . . . . 8.87 8.80 4.00Total risk-based capital . . . . . . . . . . . . . . . . . . . . . . . . . . . . . . . . . . . . . 12.72 13.06 8.00
Stand-alone capital ratios:BTMU
Tier I capital . . . . . . . . . . . . . . . . . . . . . . . . . . . . . . . . . . . . . . . . . . . . . . 6.78 7.47 4.00Total risk-based capital . . . . . . . . . . . . . . . . . . . . . . . . . . . . . . . . . . . . . 12.22 13.29 8.00
MUTBTier I capital . . . . . . . . . . . . . . . . . . . . . . . . . . . . . . . . . . . . . . . . . . . . . . 8.76 8.40 4.00Total risk-based capital . . . . . . . . . . . . . . . . . . . . . . . . . . . . . . . . . . . . . 12.68 12.65 8.00
At March 31, 2006, management believes that our subsidiary banks were in compliance with all capitaladequacy requirements to which they are subject.
90

Capital Ratios of Subsidiary Banks in the United States
The table below presents the risk-based capital ratios of UnionBanCal Corporation and Union Bank ofCalifornia, both subsidiaries of BTMU, at December 31, 2004 and 2005:
At December 31, Minimum capitalratios required
Ratios OCC requiresto be “well-capitalized”2004 2005
UnionBanCal Corporation:Tier I capital (to risk-weighted assets) . . . . . . . 9.71% 9.17% 4.00% —Tier I capital (to quarterly average assets)* . . . 8.09 8.39 4.00 —Total capital (to risk-weighted assets) . . . . . . . . 12.17 11.10 8.00 —
Union Bank of California:Tier I capital (to risk-weighted assets) . . . . . . . 9.29% 9.62% 4.00% 6.00%Tier I capital (to quarterly average assets)* . . . 7.72 8.78 4.00 5.00Total capital (to risk-weighted assets) . . . . . . . . 10.57 10.59 8.00 10.00
* Excludes certain intangible assets
Management believes that, as of December 31, 2005 and June 30, 2006, UnionBanCal Corporation andUnion Bank of California met all capital adequacy requirements to which they are subject.
As of December 31, 2005, the Office of the Comptroller of the Currency (OCC) categorized Union Bank ofCalifornia as “well-capitalized.” To be categorized as “well capitalized,” Union Bank of California mustmaintain minimum total risk-based, Tier I risk-based and Tier I leverage ratios as set forth in the table. There areno conditions or events since that notification that management believes have changed Union Bank ofCalifornia’s category.
Capital Adequacy Ratio of Mitsubishi UFJ Securities
At March 31, 2006, Mitsubishi UFJ Securities’ capital accounts, less certain illiquid assets, of ¥680.4billion, were 564.1% of total amounts equivalent to market, counterparty credit and operations risks.
Off-balance-sheet Arrangements
In the normal course of our business, we engage in several types of off-balance-sheet arrangements to meetthe financing needs of our customers, including various types of guarantees, commitments to extend credit andcommercial letters of credit. The following table summarizes these commitments at March 31, 2006:
Amount of commitment expiration by period
Less than1 year
1-5years
Over5 years Total
(in billions)Guarantees:
Standby letters of credit and financial guarantees . . . . . . . . . . . . . ¥ 2,346 ¥ 1,530 ¥1,830 ¥ 5,706Performance guarantees . . . . . . . . . . . . . . . . . . . . . . . . . . . . . . . . . 1,238 610 52 1,900Derivative instruments . . . . . . . . . . . . . . . . . . . . . . . . . . . . . . . . . . 15,034 11,237 3,374 29,645Guarantees for the repayment of trust principal . . . . . . . . . . . . . . . 333 2,106 17 2,456Liabilities of trust account . . . . . . . . . . . . . . . . . . . . . . . . . . . . . . . . 3,478 136 672 4,286Others . . . . . . . . . . . . . . . . . . . . . . . . . . . . . . . . . . . . . . . . . . . . . . . 232 — 11 243
Total guarantees . . . . . . . . . . . . . . . . . . . . . . . . . . . . . . . . . . . 22,661 15,619 5,956 44,236
Other off-balance-sheet instruments:Commitments to extend credit . . . . . . . . . . . . . . . . . . . . . . . . . . . . 45,027 11,296 2,040 58,363Commercial letters of credit . . . . . . . . . . . . . . . . . . . . . . . . . . . . . . 805 14 — 819Others . . . . . . . . . . . . . . . . . . . . . . . . . . . . . . . . . . . . . . . . . . . . . . . 7 12 10 29
Total other off-balance-sheet instruments . . . . . . . . . . . . . . . . 45,839 11,322 2,050 59,211
Total . . . . . . . . . . . . . . . . . . . . . . . . . . . . . . . . . . . . . . . . . . . . ¥68,500 ¥26,941 ¥8,006 ¥103,447
91

See note 26 to our consolidated financial statements for a description of the nature of our guarantees andother off-balance-sheet instruments.
The contractual amounts of these guarantees and other off-balance-sheet instruments represent the amountsat risk should the contracts be fully drawn upon with a subsequent default by our customer and a decline in thevalue of the underlying collateral. Because many of these commitments expire without being drawn upon, thetotal contractual or notional amounts of these commitments do not necessarily represent our future cashrequirements. At March 31, 2006, approximately 66% of these commitments will expire within one year, 26%from one year to five years and 8% after five years. Such risks are monitored and managed as a part of our riskmanagement system as set forth in “Item 11. Quantitative and Qualitative Disclosures about Credit, Market andOther Risk.” In addition, in accordance with SFAS No. 5, we evaluate off-balance-sheet arrangement in themanner described in note 1 to our consolidated financial statements.
In the aggregate, the income generated from fees and commissions is one of our most important sources ofrevenue. Such income amounted to ¥1,033.3 billion during the fiscal year ended March 31, 2006, accounting forapproximately 97% of our non-interest income which amounted to ¥1,067.4 billion for the fiscal year. However,the fees generated specifically from off-balance-sheet arrangements are not a dominant source of our fees andcommissions.
Some of our off-balance-sheet arrangements are related to activities of special purpose entities, most ofwhich are VIEs. As set out in “Item 5.A. Operating Results—Accounting Changes—Variable Interest Entities,”we adopted FIN No. 46R at April 1, 2004. As a result, we have consolidated all VIEs in which we are deemed tobe the primary beneficiary including those created before February 1, 2003.
The following table presents, by type of VIE, the total assets of non-consolidated VIEs and the maximumexposures to non-consolidated VIEs at March 31, 2005 and 2006:
2005 2006
Non-Consolidated VIEs AssetsMaximumexposure Assets
Maximumexposure
(in billions)
Asset-backed commercial paper conduits . . . . . . . . . . . . . . . . . . . ¥ 381.4 ¥ 56.5 ¥ 5,880.0 ¥ 536.3Securitization conduits of client properties . . . . . . . . . . . . . . . . . 1,574.8 618.8 2,539.7 822.6Investment funds . . . . . . . . . . . . . . . . . . . . . . . . . . . . . . . . . . . . . . 30,152.3 869.3 61,263.0 1,766.1Special purpose entities created for structured financing . . . . . . . 16,419.8 1,134.3 22,692.7 1,695.7Repackaged instruments . . . . . . . . . . . . . . . . . . . . . . . . . . . . . . . . 34,851.6 883.2 120,316.6 1,645.6Others . . . . . . . . . . . . . . . . . . . . . . . . . . . . . . . . . . . . . . . . . . . . . . 6,156.3 849.1 5,419.4 881.3
Total . . . . . . . . . . . . . . . . . . . . . . . . . . . . . . . . . . . . . . . . . . . ¥89,536.2 ¥4,411.2 ¥218,111.4 ¥7,347.6
Off-balance sheet arrangements include the following types of special purpose entities:
Asset-backed Commercial Paper Conduits
We administer several multi-seller finance entities (primarily commercial paper conduits) that purchasefinancial assets, primarily pools of receivables, from third-party customers. The assets purchased by theseconduits are generally funded by issuing commercial paper to and/or by borrowings from us or third parties.While customers basically continue to service the transferred trade receivables, we underwrite, distribute, make amarket in commercial paper issued by the conduits, and also provide liquidity and credit support facilities to theentities.
Securitization Conduits of Client Properties
We administer several conduits that acquire client assets, primarily real estate, from third-party customers(“property sellers”) with the property sellers continuing to use the acquired real estate through lease-back
92

agreements. The equity of the conduits is provided by the property sellers but such equity holders have no abilityto make decisions about the activities of the conduits. Thus, we consider those conduits to be VIEs. The assetsacquired by these conduits are generally funded by borrowings from us or third parties. We determined we arenot the primary beneficiary of any of these conduits.
Investment Funds
We hold investments in various investment funds that collectively invest in equity and debt securitiesincluding listed Japanese securities and investment grade bonds, and, to a limited extent, securities and otherinterests issued by companies in a start-up or restructuring stage. Such investment funds are managed byinvestment advisory companies or fund management companies that make investment decisions and administerthe funds.
We not only manage the composition of investment trust funds but also play a major role in composingventure capital funds. We generally do not have significant variable interests through composing these type offunds.
We occasionally sell assets such as nonperforming loans to these funds, in particular the CorporateRecovery Fund, when we believe that such sale may improve our asset quality.
Corporate Recovery Fund. We have non-controlling equity interests in corporate recovery funds whoseprincipal business purpose is to generate profits by investing in companies in the process of restructuring andthen, typically, selling these investments after the companies complete their restructurings. Such funds purchasenonperforming loans from us or others and in some cases acquire majority ownership in the borrower companiesby means of a debt-for-equity swap. Our non-voting interests in these funds amounted to ¥29.5 billion atMarch 31, 2005 and ¥47.4 billion at March 31, 2006, respectively. In addition, at March 31, 2006, we hadcommitments to make additional contributions of up to ¥20.5 billion to these funds.
We sold to corporate recovery funds nonperforming loans with an aggregate net book value of ¥4.2 billionfor ¥1.9 billion during the fiscal year ended March 31, 2005 and an aggregate net book value of ¥4.1 billion for¥1.3 billion during the fiscal year ended March 31, 2006. For a detailed discussion on additional provisions forcredit losses associated with the sale of such loans, see “—Financial Condition—Allowance for Credit Losses,Nonperforming and Past Due Loans.”
Venture Capital Fund. We own non-controlling equity interests in investment funds managed by fundmanagement companies who have discretionary investment powers. These funds seek to invest in start-upcompanies or companies that are rapidly developing. We made contributions to these funds amounting to ¥415.6billion at March 31, 2006. At March 31, 2006, in accordance with the applicable limited partnership agreements,we had commitments to make additional contributions of up to ¥129.2 billion when required by the fundmanagement companies.
Investment Trust. We purchase the share units of investment trusts as mid- to long-term investments.These investment trusts are managed by investment advisory companies with the objective of investing in adiversified portfolio consisting of equity and debt securities, primarily shares of Japanese public companies.
Generally, we are not obligated to invest in or extend funds by purchasing additional share units and ouroff-balance-sheet exposures or commitments relating to this type of special purpose entity were not material.
Special Purpose Entities Created for Structured Financing
We extend non-recourse asset-backed loans to special purpose entities, which hold beneficial interests inreal properties, to provide financing for special purpose projects including real estate development and naturalresource development managed by third parties.
93
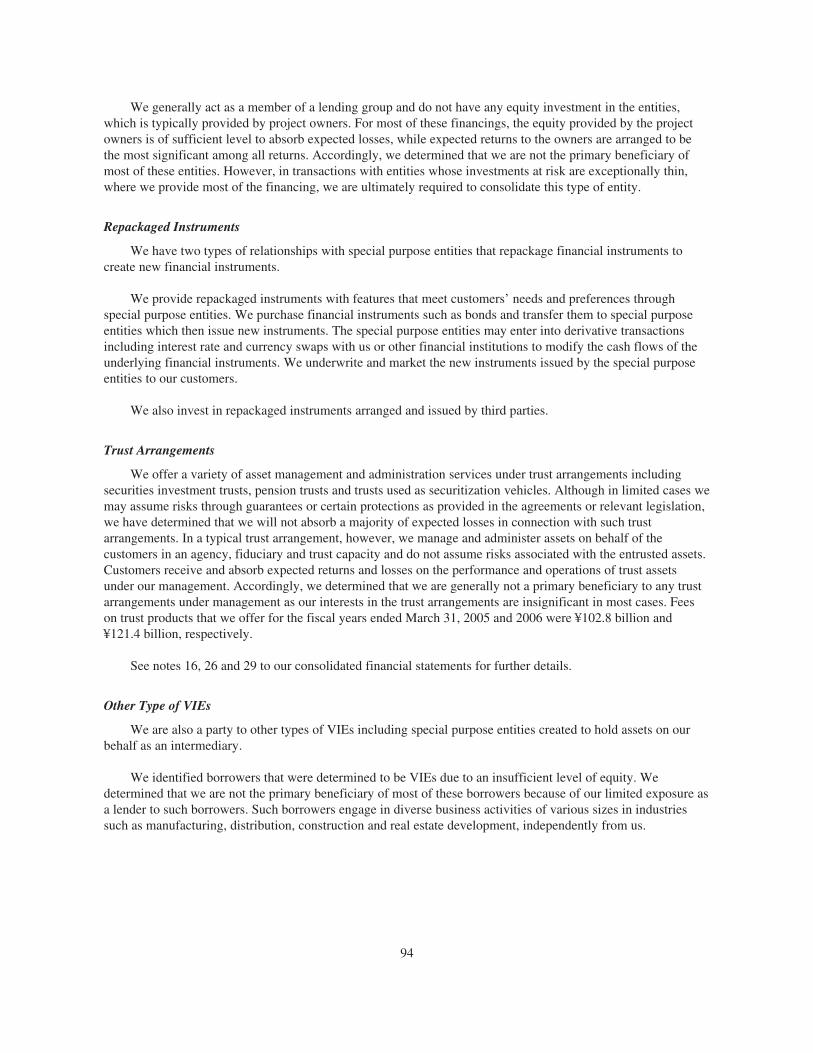
We generally act as a member of a lending group and do not have any equity investment in the entities,which is typically provided by project owners. For most of these financings, the equity provided by the projectowners is of sufficient level to absorb expected losses, while expected returns to the owners are arranged to bethe most significant among all returns. Accordingly, we determined that we are not the primary beneficiary ofmost of these entities. However, in transactions with entities whose investments at risk are exceptionally thin,where we provide most of the financing, we are ultimately required to consolidate this type of entity.
Repackaged Instruments
We have two types of relationships with special purpose entities that repackage financial instruments tocreate new financial instruments.
We provide repackaged instruments with features that meet customers’ needs and preferences throughspecial purpose entities. We purchase financial instruments such as bonds and transfer them to special purposeentities which then issue new instruments. The special purpose entities may enter into derivative transactionsincluding interest rate and currency swaps with us or other financial institutions to modify the cash flows of theunderlying financial instruments. We underwrite and market the new instruments issued by the special purposeentities to our customers.
We also invest in repackaged instruments arranged and issued by third parties.
Trust Arrangements
We offer a variety of asset management and administration services under trust arrangements includingsecurities investment trusts, pension trusts and trusts used as securitization vehicles. Although in limited cases wemay assume risks through guarantees or certain protections as provided in the agreements or relevant legislation,we have determined that we will not absorb a majority of expected losses in connection with such trustarrangements. In a typical trust arrangement, however, we manage and administer assets on behalf of thecustomers in an agency, fiduciary and trust capacity and do not assume risks associated with the entrusted assets.Customers receive and absorb expected returns and losses on the performance and operations of trust assetsunder our management. Accordingly, we determined that we are generally not a primary beneficiary to any trustarrangements under management as our interests in the trust arrangements are insignificant in most cases. Feeson trust products that we offer for the fiscal years ended March 31, 2005 and 2006 were ¥102.8 billion and¥121.4 billion, respectively.
See notes 16, 26 and 29 to our consolidated financial statements for further details.
Other Type of VIEs
We are also a party to other types of VIEs including special purpose entities created to hold assets on ourbehalf as an intermediary.
We identified borrowers that were determined to be VIEs due to an insufficient level of equity. Wedetermined that we are not the primary beneficiary of most of these borrowers because of our limited exposure asa lender to such borrowers. Such borrowers engage in diverse business activities of various sizes in industriessuch as manufacturing, distribution, construction and real estate development, independently from us.
94

Contractual Cash Obligations
In the normal course of our business, we enter into contractual agreements whereby we commit to futurepurchases of products or services from unaffiliated parties. The following table shows a summary of ourcontractual cash obligations at March 31, 2006:
Payments due by period
Less than1 year 1-3 years 3-5 years
Over5 years Total
(in billions)
Contractual cash obligations:Time deposits . . . . . . . . . . . . . . . . . . . . . . . . . . . . . . . . . . ¥40,878 ¥ 8,818 ¥3,244 ¥ 406 ¥53,346Long-term debt . . . . . . . . . . . . . . . . . . . . . . . . . . . . . . . . . 1,680 3,052 2,483 6,464 13,679Capital lease obligations . . . . . . . . . . . . . . . . . . . . . . . . . . 54 116 33 8 211Operating leases . . . . . . . . . . . . . . . . . . . . . . . . . . . . . . . . 42 67 50 48 207Purchase obligations . . . . . . . . . . . . . . . . . . . . . . . . . . . . . 10 14 17 81 122
Total* . . . . . . . . . . . . . . . . . . . . . . . . . . . . . . . . . . . . ¥42,664 ¥12,067 ¥5,827 ¥7,007 ¥67,565
* The total amount of expected future pension payments is not included in the above table or the total amountof commitments outstanding at March 31, 2006 as such amount is not currently determinable. We expect tocontribute approximately ¥58.7 billion to the pension plans of domestic subsidiaries and approximately¥14.2 billion to the pension plans of subsidiaries in the United States of America for the fiscal year endingMarch 31, 2007.
Purchase obligations include any legally binding contractual obligations that require us to spend more than¥100 million annually under the contract. Purchase obligations in the table primarily include commitments tomake investments into corporate recovery or private equity investment funds.
Non-exchange Traded Contracts Accounted for at Fair Value
The use of non-exchange traded or over-the-counter contracts provides us with the ability to adapt to thevaried requirements of a wide customer base while mitigating market risks. Non-exchange traded contracts areaccounted for at fair value, which is generally based on pricing models or quoted market prices for instrumentswith similar characteristics. Gains or losses on non-exchange traded contracts are included in “Trading accountprofits—net” in our consolidated statements of income. These contracts consist primarily of crude oil commoditycontracts. The following table summarizes the changes in fair value of non-exchange traded contracts for thefiscal years ended March 31, 2005 and 2006:
Fiscal years ended March 31,
2005 2006
(in millions)
Net fair value of contracts outstandings at beginning of fiscal year . . . . . . . . . . . . . . ¥12,054 ¥29,823Changes attributable to contracts realized or otherwise settled during the fiscal
year . . . . . . . . . . . . . . . . . . . . . . . . . . . . . . . . . . . . . . . . . . . . . . . . . . . . . . . . . . . . . (5,375) (9,117)Fair value of new contracts when entered into during the fiscal year . . . . . . . . . . . . . (29) 983Other changes in fair value, principally revaluation at end of fiscal year . . . . . . . . . 23,173 49,114
Net fair value of contracts outstandings at end of fiscal year . . . . . . . . . . . . . . . . . . . ¥29,823 ¥70,803
During the fiscal years ended March 31, 2005 and 2006, the fair value of non-exchange traded contractsincreased primarily due to an increase in the fair value of oil commodity contracts indexed to the WTI crude oilprices, reflecting political factors in the Middle East and other factors.
95

The following table summarizes the maturities of non-exchange traded contracts at March 31, 2006:
Net fair value of contracts—unrealized gains
Prices actively quotedPrices based on models and
other valuation methods
(in millions)
Maturity less than 1 year . . . . . . . . . . . . . . . . . . . . . . . . . . . . . . . . ¥14,857 ¥ 678Maturity less than 3 years . . . . . . . . . . . . . . . . . . . . . . . . . . . . . . . 23,786 222Maturity less than 5 years . . . . . . . . . . . . . . . . . . . . . . . . . . . . . . . 16,506 116Maturity 5 years or more . . . . . . . . . . . . . . . . . . . . . . . . . . . . . . . 13,447 1,191
Total fair value . . . . . . . . . . . . . . . . . . . . . . . . . . . . . . . . . . . ¥68,596 ¥2,207
C. Research and Development, Patents and Licenses, etc.
Not applicable.
D. Trend Information
See the discussions under Items 5.A. and 5.B. of this Annual Report.
E. Off-balance-sheet Arrangements
See the discussion under “Item 5.B. Operating and Financial Review and Prospects—Liquidity and CapitalResources.”
F. Tabular Disclosure of Contractual Obligations
See the discussion under “Item 5.B. Operating and Financial Review and Prospects—Liquidity and CapitalResources.”
G. Safe Harbor
See the discussion under “Forward-Looking Statements.”
96