IT/Data _Data_3.4... · 3/4/2020 · Data Governance –the right data to the right people at the...
27
David E. Wawrzynek, MS MBA Wednesday, March 4, 2020 1 – 2 pm IT/Data
Transcript of IT/Data _Data_3.4... · 3/4/2020 · Data Governance –the right data to the right people at the...

David E. Wawrzynek, MS MBA
Wednesday, March 4, 2020 1 – 2 pm
IT/Data

Information Technology
(IT)
• Definition - Use of computers to store, retrieve, and manipulate data or information.
• Technology is now strategic and mandatory –the ability to leverage technology is now essential to competitive advantage and strategic success.
• Technology is expensive – on average organizations in health care spend about 3% of their budgets annually on IT.
• IT is an essential infrastructure necessary to return value to those you serve.

Investment in Technology
Should Be Well Thought Out and
Tied to Your Strategic Plan
Your technology plan should demonstrate and quantify that proposed technology investments deliver return in:
• Increased revenues
• Improved performance
• Reduced operating costs
• Improved stakeholder preference or market position
• Improved consumer outcomes or functioning
• Facilitate new consumer services
• Facilitate new payer relationship

Hardware and Software Selection Process
Analyze Your Requirements
• What are the organization’s objectives?
• What do your end users need?
• Where will the technology be used?
• What can you afford to spend?
Define Your Specifications
• What type of functionality do you require?
• What type and amount of technology (hardware and software) is required to meet your objective?

Hardware and Software Selection Process
Request for Proposal (RFP)
• Draft an RFP and send to selected vendors.
• RFP should include:• Specifications
• Terms and conditions
• Quantity
• Training responsibilities
• Conversion responsibilities
Evaluation and Selection
• Evaluate and select vendors based upon:• Price
• Functionality of their solution
• Vendor experience
• Availability of a hosted solution
• Vendor references
• Vendor support and training plans

How to Assure that Your
Hardware and Software
Implementation is Successful
Recognize Recognize your team and celebrate your success.
Plan Plan your go-live date carefully and have plenty of support available to your staff.
Test Conduct tests of your hardware and software before you sign-off with your vendor.
Train Train your staff.
Support Use principles of change management.
Evaluate Evaluate current workflows and redesign if necessary.
Communicate Communicate – explain the need to your organization.

Understanding and Managing
your Data
• Why is the collection and understanding of your data so important?
• Well organized, consistent, and accurate data will help you make better decisions.
• Data can be used to increase the efficiency of how your organization runs.
• Data is an essential component to guide your strategy.
• Data allows you to quantify your value.
• Data will allow you to asses your performance in value based reimbursement arrangements.

Organize your approach to data
Data Management
Data Science
Data Governance
Data Strategy

Data Management
Data, where to find it, how to store it and how to use it. Your data infrastructure should:
• Identify sources of data:
• Internal: EHR, General Ledger, Payroll
• External: PSYCKES
• Store data in a secure and usable format:
• Structured electronic data
• Create and display actionable data:
• Business intelligence tools
• Dashboards – Data visualization

Data Science –Making the Most of Your Data
• Applying methods, processes, and analytic tools to gain knowledge and insights from data. (data discovery or data mining)
How can we use our data to solve some of our more complicated problems and increase our value?

Data Governance – the right data to the right people at the right time
Data Quality:
Collect all the needed data for a particular use and ensure that it is valid.
Data Literacy:
Provide training and employ hiring practices so that staff have the ability to read, write and communicate with data in the proper context. This includes the ability to describe the use case for data and its resulting value. Excel is an excellent tool collecting, analyzing and visualizing data.
Data use for the organizations benefit:Create a data informed culture that uses data to lowers costs, improve quality and reduces risk. Put skills and data to good use by creating a culture of ongoing quality improvement and innovation supported by data.

Data Strategy – Have a Plan
• Create a clearly stated strategy for gathering, organizing, governing, and deploying your organization’s information assets. Your data strategy should address:• Managing the ever increasing amount of data available to your organization.
• Understanding future trends and technologies that your organization can use.
• The support needed to drive innovation and create a data culture.
• Support data informed decision making at all levels of the organization.
• Creating a sustainable competitive advantage through the strategic use of your information resources.
Your data is an extremely important asset – treat it that way!

Start with the Data You Own
Electronic Health Record
• Client demographics
• Populations Served
• Provision of best practices
• Client diagnosis
• Clinical outcomes
Financial Accounting Software
• Actual expenses and revenues
• Evaluation of performance against budget
• Unit costs
• Direct vs Indirect costs
• Trends over time

Start with the Data You Own
Payroll and Human Resources Software
• Staff credentialing
• Staff turnover
• Staff training
• Paid hours
• Productivity of direct care staff
Billing Software
• Service volume
• Service type
• High utilizers
• Services and volume by location
• Accounts receivable and cash flow
• Denial rates

Start with the Data You Own
Other Data Sources
• Excel spreadsheets
• Data collected on paper
• Standalone databases
Data Inventory
• Undertake a data inventory to find all the sources of critical data.
• Convert important data from paper to structured data when necessary.
• Coordinate your data collection workflows to avoid duplication.

Accessing the Data You Own
Running canned reports created by the software vendor
User created reports –report design and filtering
Data exports using a query language or report generator
Using excel to analyze and visualize your data to gain insights and support decision making
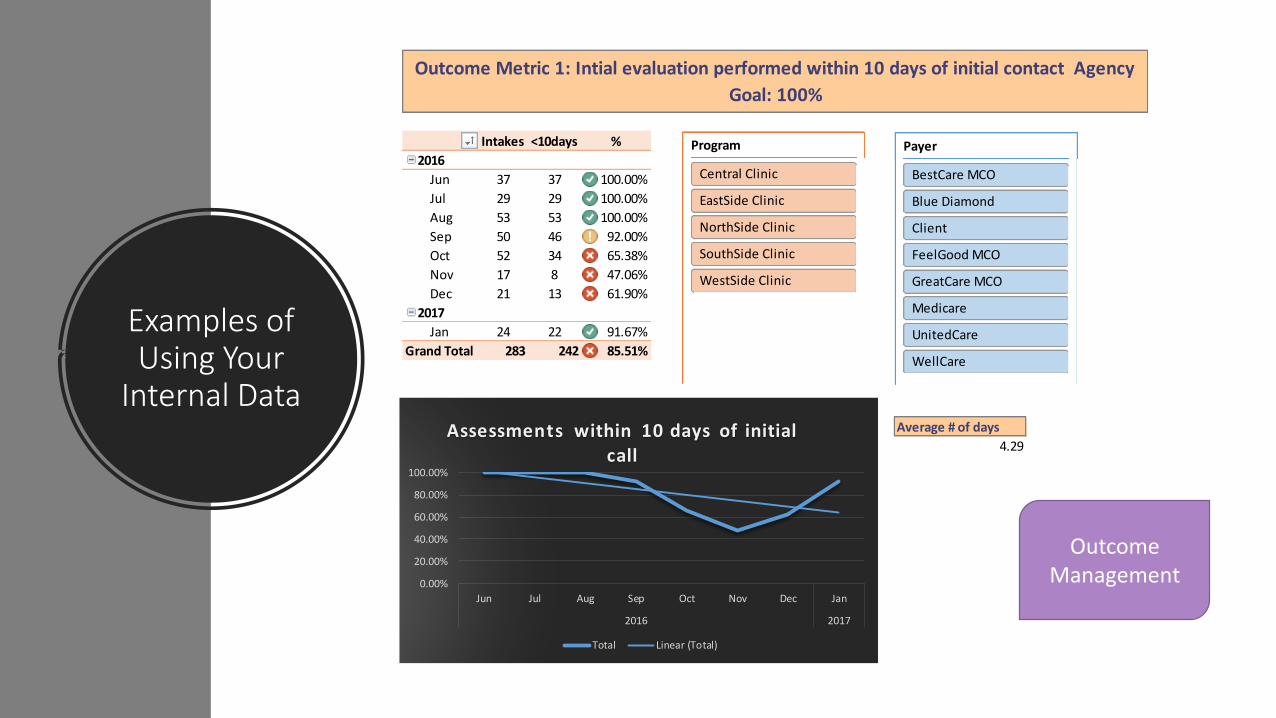
Examples of Using Your
Internal Data
Intakes <10days %
2016
Jun 37 37 100.00%
Jul 29 29 100.00%
Aug 53 53 100.00%
Sep 50 46 92.00%
Oct 52 34 65.38%
Nov 17 8 47.06%
Dec 21 13 61.90%
2017
Jan 24 22 91.67%
Grand Total 283 242 85.51%
Average # of days
4.29
Outcome Metric 1: Intial evaluation performed within 10 days of initial contact Agency
Goal: 100%
0.00%
20.00%
40.00%
60.00%
80.00%
100.00%
Jun Jul Aug Sep Oct Nov Dec Jan
2016 2017
Assessments within 10 days of initial call
Total Linear (Total)
Program
Central Clinic
EastSide Clinic
NorthSide Clinic
SouthSide Clinic
WestSide Clinic
Payer
BestCare MCO
Blue Diamond
Client
FeelGood MCO
GreatCare MCO
Medicare
UnitedCare
WellCare
Outcome Management

Sunny and Nice Day Clinic
Summary Expense and Revenue
Admin Prg 2 Prg 3
A&OH Ad MH CM Total
Personal Services 82,700 432,024 217,712 732,436
Fringe Benefits 25,794 134,747 67,904 228,445
Operating Expenses 25,837 33,126 33,367 92,330
Equipment 2,500 2,800 1,500 6,800
Property 2,250 13,000 9,750 25,000
Total Gross Expense 139,081 615,697 330,233 1,085,011
A&OH (139,081) 90,800 48,281 0
Gross Expense 0 706,497 378,514 1,085,011
Operating Revenue 705,580 384,102 1,089,682
(Surplus) / Loss 917 (5,588) (4,671)
Units of Service 6,192 2,160 8,352
Gross Cost per unit 114.10 175.24
Gross Revenue Per unit 113.95 177.83
(Surplus) / Loss per unit 0.15 (2.59)
Budget

Prg 2 Target: 67%
Ad MH
Budget Actual % Target
Personal Services 288,016 292,467 68%
Fringe Benefits 89,831 92,541 69%
OTPS 22,084 22,144 67%
Equipment 1,867 1,400 50%
Property 8,667 2,500 19%
A&OH 60,533 61,060 67%
Total Expense 470,998 472,112 67%
Total Revenue 470,387 461,255 65%
Variance
(Surplus) / Loss 611 10,857 10,246
Units 4,128 3,502 57%
Cost per unit $114.10 $134.81 $20.71
Revenue per unit $113.95 $131.71 $17.76
Actual to Budget Analysis

Unit Cost Trends Over Time

External Data Source:
PSYCKES
• Psychiatric Service and Clinical Knowledge Enhancement System (PSYCKES)
• What is it?
• Web based set of tools designed to support quality improvement and clinical decision making in the New York State Medicaid population.
• Who can use it?
• Providers with one or more OMH licensed programs or programs with OMH oversight. Providers with one or more OASAS licensed programs and DOH Health Homes and DOH Care Management.

PSYCKES (continued)
• What data is in PSYCKES?
• Claims data for Medicaid enrollees with a behavioral health service, diagnosis, or psychotropic medication.
• How might it be helpful for me?
• You will be able to access a number of quality indicator reports at the state, region, county, agency, site, program and client level to review performance, identify individuals who could benefit from clinical review and inform treatment planning.
• How do I start?
• https://omh.ny.gov/omhweb/psyckes_medicaid/about/protocol-psyckes-access-2017.pdf Protocols for accessing PSYCKES.

Creating a Data Informed Organization
• Here are some of the tools, workflows and processes you should consider to put your data to work:
• Electronic Health Record (EHR) that is fully implemented with staff that are well trained and where compliance, with the accurate and appropriate use of the EHR is monitored. To fully leverage this powerful tool you will need staff that are trained in report generation, data filtering, and data exporting.
• Fully implemented General Ledger Software with a cost center structure that supports program and location level analysis. The software can be used to assure that costs are properly allocated and you will need staff that are trained in report generation, data filtering and data exporting.

Creating a Data Informed Organization
• Fully implemented Human Resources and Payroll System that will allow you to track staff credentials, staff training and education, and properly assign costs to programs for shared staff.
• A well crafted Operating Budget for each program that rolls up for the entire agency.
• Ability to identify and report on your Key Performance Indicators (KPI) for your program and grants. KPIs should address clinical and financial performance.
• Tools to capture data and present it in a user friendly, visual fashion. Start with the Microsoft Excel Business Intelligence tools. (Get and Transform and Power Pivot).

Creating a Data Informed Organization
• CEO and Management support and expectation that KPIs are reviewed at least monthly and are used to support decision making and strategic planning.
• A functioning Quality Improvement Process that can identify variances to expectations, staff who can perform a root cause analysis to accurately identify the cause of the variance, and a change management process to implement changes necessary to eliminate the variances.

Where Do I Start?
• Walk before you run. Identify 6 Key Performance indicators for your organization.
• Identify the data sources that you will need to evaluate your current performance and monitor your progress towards your goals.
• Verify that the data is accurate and put processes in place that assure that the data is collected in a timely fashion.
• Have a staff trained in simple data visualization tools and create visualizations that tell you where you are today vs where you want or need to be.
• Monitor regularly and make changes when appropriate.