ITC Monitoring Report 2016.pdf
24
Document title: Publishing date: 15/11/2016 We appreciate your feedback Please click on the icon to take a 5’ online survey and provide your feedback about this document Share this document
Transcript of ITC Monitoring Report 2016.pdf

Document title:
Publishing date: 15/11/2016
We appreciate your feedback
Please click on the icon to take a 5’ online surveyand provide your feedback about this document
Share this document

Report to the European Commission
on the implementation of
the ITC mechanism in 2015
November 2016

2/22
The Agency for the Cooperation of Energy Regulators accepts no responsibility or liability for any consequences arising from the use of the data contained in this document.
If you have any queries relating to this document, please contact:
ACER Mr. David Merino Tel. +386 (0)8 2053 417 Email: [email protected]
3/22
Table of Contents
Introduction........................................................................................................................... 4
Process of review ................................................................................................................. 5
Review of the 2015 ITC implementation ............................................................................. 5
3.1 ITC fund in 2015 ............................................................................................................. 5
3.2 General alignment between the 2015 ITC implementation and the Regulation .............. 6
3.3 Reduction of transits ....................................................................................................... 6
3.4 Compensation for transmission losses ........................................................................... 7
3.5 Criteria for valuing losses ................................................................................................ 8
3.6 Values of Losses ............................................................................................................. 9
3.7 Compensation for cross-border infrastructure .............................................................. 10
3.8 Contributions to the ITC fund ........................................................................................ 10
3.9 Treatment of third countries .......................................................................................... 11
3.10 Accuracy of data ........................................................................................................... 11
Summary of the findings ................................................................................................... 11
Annex – Tables and Figures .................................................................................................... 13
Table 1 Reduction in Transits ......................................................................................... 13
Table 2 Derivation of compensation for transmission losses .......................................... 14
Table 3 Derivation of compensation for cross-border infrastructure ............................... 15
Table 4 Derivation of contributions to the ITC fund ........................................................ 16
Table 5 Overview of compensation and contribution to the ITC Fund ............................ 17
Table 6 Summary of criteria for valuing losses at national level (2011-2015) ................ 18
Table 7 Losses’ values used in ITC mechanism and actual Losses’ values for years 2013-2015 (€/MWh) ....................................................................................................................... 20
Table 8 Website links of the relevant documents for losses valuation ............................ 21
Figure 1 The evolution of the losses’ values per year and country (€/MWh) ................... 22
4/22
Introduction Pursuant to point 1.4 of Annex Part A of Commission Regulation (EU) No 838/2010 on laying down guidelines relating to the inter-transmission system operator compensation mechanism and a common regulatory approach to transmission charging1 (the “Regulation”), the Agency for the Cooperation of Energy Regulators (the “Agency”) is responsible, since 2012, for preparing a yearly monitoring report on the implementation of the Inter-Transmission System Operator Compensation (“ITC”) mechanism and the management of the ITC Fund. The data and information used for compiling this fifth Report2 have been provided by the European Network of Transmission System Operators for Electricity (“ENTSO-E”) and by the National Regulatory Authorities (“NRAs”) of the Member States participating in the ITC mechanism. The ITC scheme, defined by the Regulation, was implemented on 3 March 2011. Under the Regulation, the ITC Fund was established by the ENTSO-E for the purpose of compensating transmission system operators (“TSOs”) for the costs incurred on national transmission systems due to the hosting of cross-border flows of electricity (“transits”). The ITC Fund consists of two parts, which are aimed at covering, respectively, the costs of the incurred transmission losses and the costs of making infrastructure available. TSOs participating in the ITC mechanism (“ITC Parties”) receive compensation from the ITC Fund based on the transits they carry, and contribute to the ITC Fund based on their net import and export flows. Non-participating countries connected to the ITC Parties (“Perimeter countries”3) pay a transmission system use fee for their scheduled imports from and scheduled exports to the ITC Parties’ networks. The implementation of the provisions of the Regulation regarding the ITC mechanism and the management of the ITC Fund is carried out by ENTSO-E through the legal framework of the ITC Clearing and Settlement Multi-Year Agreement (“ITC Agreement”) concluded between 34 ITC Parties4 on 9 February 2011. This Report focuses on the compliance of the implementation of the ITC mechanism, the criteria for the valuation of losses at national level and the value of losses used for each individual ITC Party. The Report is structured as follows:
Chapter 2 summarises the Agency’s review process; Chapter 3 presents the Agency’s findings with regard to the general alignment of the
implementation of the ITC mechanism in 2015 with the Regulation and with regard to specific aspects;
Chapter 4 provides the Agency’s summary of findings on the implementation of the ITC mechanism in 2015; and
The Annex contains tables of relevant data to the ITC fund and information regarding the criteria for the valuation of losses at national level.
1 OJ L 250, 24.9.2010, p.5 2 The previous ACER ITC Monitoring Reports (regarding ITC implementation in years 2011-2014) are available at the Agency’s website: http://www.acer.europa.eu/Official_documents/Publications/Pages/Publication.aspx 3 Belarus, Moldova, Morocco, Russian Federation, Turkey and Ukraine 4 All EU Member States including Northern Ireland (as a separate ITC party) except Cyprus and Malta and the following third countries: Albania, Bosnia and Herzegovina, FYR of Macedonia, Montenegro, Serbia, Norway and Switzerland

5/22
Process of review
The Agency reviewed the implementation of the ITC mechanism and the management of the ITC fund in 2015 based on:
The ITC Agreement and its amendments; Relevant data and information from ENTSO-E in relation to the implementation of the
ITC mechanism in 2015; NRAs’ criteria for the valuation of transmission losses for the purpose of calculating
the losses’ compensation amount in the ITC mechanism. ENTSO-E operates the ITC mechanism through the ITC Agreement, which contractually sets out ENTSO-E’s and ITC Parties’ duties and entitlements. It also sets out detailed ITC procedures, including the submission, audit and validation of data, calculation of compensation and contribution amounts, and the clearing and settlement of the ITC fund. The ITC settlement lags real time by six months to accommodate data audit and validation steps. The final data relating to the implementation of the ITC mechanism in 2015 was submitted by ENTSO-E to the Agency on 5 August 2016. The Agency appreciates the fact that, beyond the quantitative data, ENTSO-E also provided some descriptive information5. Through the ITC Agreement, ENTSO-E appointed two TSOs (Amprion GmbH and Swissgrid ag) as ‘ITC Data Administrators’ to manage relevant data and to carry out the clearing and settlement. The ITC Agreement includes yearly and monthly data audits and/or validation procedures involving all ITC Parties. The Agency regards that such a self-governance arrangement in the operation of the ITC mechanism is an appropriate approach and ought to be sufficient for assuring the accuracy of the operation of the ITC mechanism. The Agency does not consider it necessary for its own review to conduct a detailed audit or validation of all the input and intermediate data used in the operation of the 2015 ITC mechanism. The exception, however, is the value of transmission losses, on which the Regulation requires a specific view from the Agency (as reported in more detail in Section 3.6 below). Review of the 2015 ITC implementation
3.1 ITC fund in 2015 In 2015, the ITC fund amounted to €253 million, consisting of €100 million relating to infrastructure and €153 million relating to losses. Of the total ITC Fund, €240 million were recovered through contributions from the ITC Parties and the remaining €13 million through the Perimeter countries’ fees.
5 ENTSO-E provided explanations or description of the results for: the calculation of the perimeter country fee; transit reduction and explanations regarding each border where transits are reduced due to the allocation of capacity on interconnections which is not compatible with point 2 of the guidelines of Annex 1 of Regulation 714/2009 (ref. clause 1.6); results of the yearly audit process in terms of identified errors and measures taken for their correction; and the amendments of the ITC Agreement.
6/22
The downward trend in the total amount of the ITC fund observed in 2013 (a 12% decrease compared to 2012) and in 2014 (a 7% decrease compared to 2013, down to €229 million), was reversed in 2015, when the total amount of the ITC fund increased by 11% due to the rise of its losses component (see more details in Section 3.4 below). An overview of the compensations drawn from, and contributions made to, the 2015 ITC Fund by the ITC Parties is provided in Table 5 in the Annex. Table 5 also shows the contributions from Perimeter countries collected through their directly-connected ITC Parties. 3.2 General alignment between the 2015 ITC implementation and the
Regulation The Agency’s review of the relevant parts of the ITC Agreement was carried out in 2012 and described in the Agency’s Report on the implementation of the ITC mechanism for the year 2011. The Agency notes that, in 2015, the TSO of Kosovo (KOSTT) was granted accession as a new party to the ITC Agreement. Besides this, no major amendments to the ITC Agreement were introduced in 20156. The Agency concludes that the general arrangements are still in line with the guidelines set out in the Regulation. 3.3 Reduction of transits Under the Regulation, the transits of electricity carried by an ITC Party are a key input to the determination of the compensation amount the ITC Party is entitled to receive from the ITC Fund (see more details in Sections 3.4 and 3.7 of this Report). Point 1.6 of Annex Part A of the Regulation requires that, for the purpose of calculating transits, the amount of imports and exports at each interconnection between the ITC Parties is reduced in proportion to the share of capacity allocated in a manner which is not compatible with the congestion management methods set out in Point 2 of Annex I to Regulation (EC) No 714/20097. The Agency notes that ENTSO-E took the following steps in line with the definition in the Regulation related to transits reduction:
The affected ITC Parties indicated, for each border concerned, the overall exports and imports, as well as the schedules allocated in a manner which is not compatible with Point 2 of the Guidelines on congestion management set out in Annex I to Regulation (EC) No 714/2009;
The ITC Data Administrators translated this information into the amount by which the relevant transit needs to be reduced; and
6 Amendments in the ITC Agreement were made for: Updated schedules due to results of the last ITC audit and yearly updates: Schedule O (Ex-Ante Financial Spreadsheet), Schedule P (ENTSO-E convention on Business Day), Schedule S (Contact details), Schedule T (List of yearly Vertical Loads), Schedule U (List of lines and measurement points) and Schedule X (Table of losses costs); Technical amendments taken pursuant to Article 7.4.2 of the ITC Agreement and adopted by means of a written notice of the Data Administrators. 7 OJ L 211, 14.8.2009, p.15, Regulation (EC) No 714/2009 of the European Parliament and of the Council on conditions for access to the network for cross-border exchanges in electricity and repealing Regulation (EC) No 1228/2003. Point 2.1 of Annex I of Regulation (EC) No 714/2009 stipulates that “capacity shall be allocated only by means of explicit (capacity) or implicit (capacity and energy) auctions”.

7/22
The reduced transit represented the basis for calculating the compensation amounts relating to both the infrastructure and the losses parts of the ITC Fund.
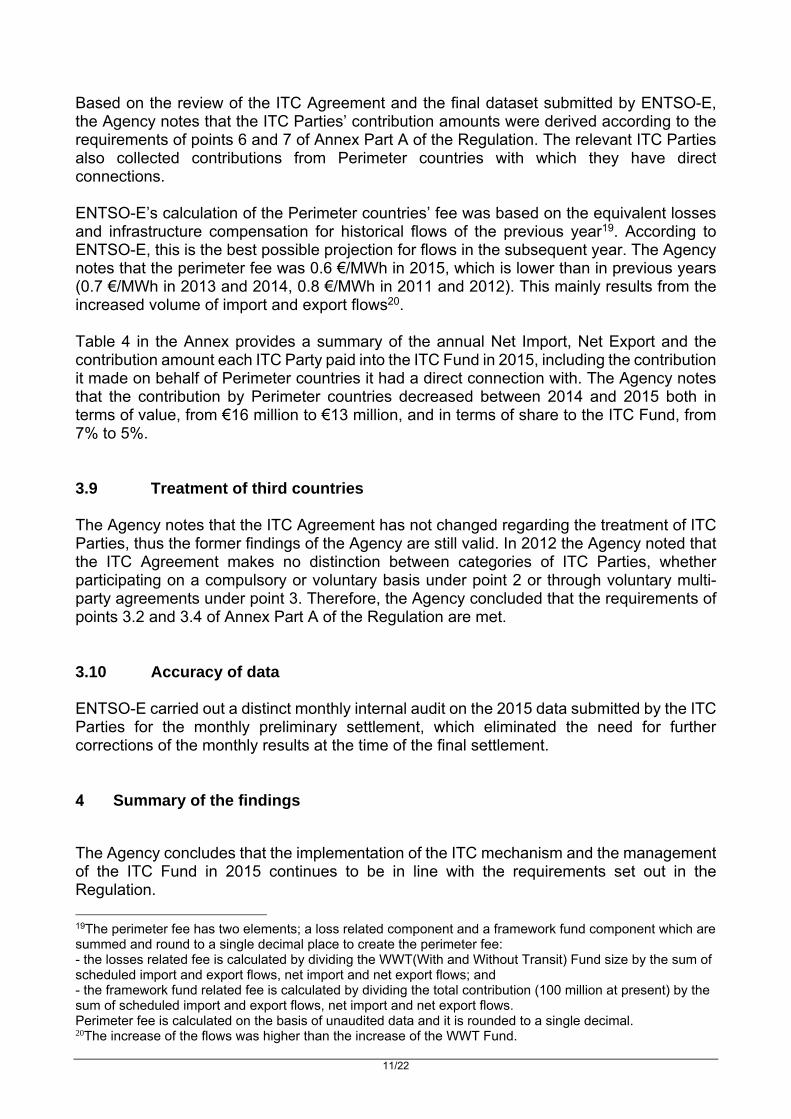
Table 1 in the Annex provides a summary of the transits through each ITC Party’s network before and after such reductions. In 2015, two borders (France - Switzerland and Switzerland - Italy) were still affected by the reduced transit8, due to the existence of long-term priority contracts. The Agency also notes that, as of 31 December 2014, the priority access of long-term contracts was terminated on the German-Swiss border which therefore was not affected by the transit reduction in 2015. The amount of transits after reduction has increased by 8% in 2015 (245 TWh) compared to 2014 (227 TWh). The amount of the reduction (5.4 TWh) represents 2% of the transits before the reduction. 3.4 Compensation for transmission losses Point 4 of Annex Part A of the Regulation defines the key steps for calculating the amount of compensation to be received by an ITC Party for transmission losses incurred by carrying cross-border flows of electricity. These are summarised below:
a) The physical amount of the relevant losses must be calculated by ENTSO-E based on the difference between actual losses with the transit and estimated losses without the transit on the ITC Party’s network; and
b) The value of losses incurred by a national system as a result of transit shall be calculated on the same basis as those approved by the respective NRA in respect of all losses on the national transmission system. Where the relevant NRA has not approved the basis for the calculation of losses, ENTSO-E is required to estimate the value of losses for the purpose of the ITC mechanism.
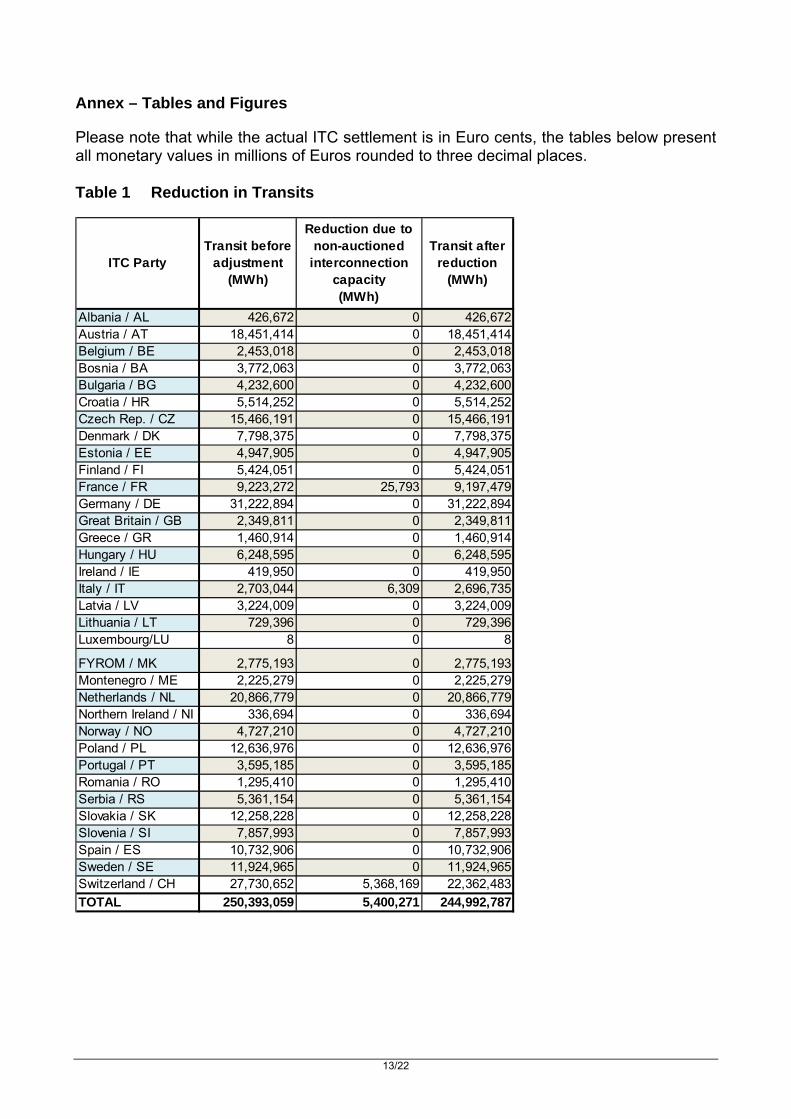
ENTSO-E sets out the detailed method for the calculation of the volume of losses in the ITC Agreement. Based on the review of the ITC Agreement and the dataset submitted by ENTSO-E, the Agency notes that this aspect of the implementation of the ITC mechanism is in line with the definition in the Regulation. Table 2 in the Annex provides a summary of the volume of the annual losses in the ITC Parties’ networks due to transits, the values of losses adopted by them, and the compensation received from the losses component of the ITC Fund in 2015. The Regulation requires ENTSO-E to publish the calculation of the volume of losses and its method. The Agency acknowledges that on 1 September 2016 ENTSO-E published the calculation method and the results for 20159. Although the value of losses decreased for most ITC Parties10, the losses component of the ITC Fund increased to €153 million in 2015 (by 19% compared to 2014), due to the rise by
8 In the direction France to Switzerland, around 80% of the capacity is allocated in a manner which is not compatible with Point 2 of the guidelines on congestion management set out in Annex I of Regulation (EC) No 714/2009. This percentage amounts to 100% in the direction Switzerland to France and 20% in the direction Switzerland to Italy. 9 ENTSO-E’s ITC Transit Losses Data Report 2015, https://www.entsoe.eu/Documents/MC%20documents/ITC_Transit_Losses_Data/160901_ITC_Transit_Losses_Data_Report_2015.pdf?Web=1 10 Out of 34, the value of losses decreased for 20 ITC Parties, remained equal for 3 and increased for 11. The average value of losses decreased by 6% from 2014 to 2015.

8/22
26% in the volume of transmission losses due to transits. The impact of transits on the volume of losses (MWh) for the 27 ITC Parties of 26 EU Member States (“EU ITC Parties”) is shown in Table 2 in the Annex. 3.5 Criteria for valuing losses Pursuant to point 4 of Annex Part A of the Regulation, the value of losses incurred by a national transmission system as a result of the cross-border flows of electricity shall be calculated on the same basis as that approved by the regulatory authority in respect of all losses on the national transmission system. The Agency shall verify the criteria for the valuation of losses at national level, taking particular account that losses are valued in a fair and non-discriminatory way. The Agency received information about the criteria for valuing losses from NRAs of EU ITC Parties. The Agency also required NRAs to verify how the fair and non-discriminatory treatment is ensured. The Agency notes that when calculating the value of losses for the 2015 ITC mechanism, each individual EU ITC Party applied the same criteria for valuing the losses used at national level. The Agency found that, in four Member States, the NRA is not responsible for approving the basis for the calculation of the value of losses.
In Finland, according to the Finnish electricity market legislation, the Energy Authority has no power to approve ex-ante any methodology for network operators to calculate/evaluate network losses. The Energy Authority is only able to supervise calculation methods and costs of losses ex-post. For the purpose of the ITC mechanism, the Finnish TSO consequently estimates the value of losses based on the power-exchange (PX) prices.
In Denmark, the Danish Energy Regulatory Authority (DERA) does not approve the basis for the valuation of losses, but assesses whether the method defined by the TSO meets certain high-level principles, such as being objective, reasonable, non-discriminative and transparent. The value of losses is calculated based on a weighted average of PX forward prices, plus the price of the EPAD contracts and balancing costs.
In Luxemburg, the criteria for valuing losses are already set in the national law on the organisation of the electricity market and calculated based on yearly tenders.
In Spain, the treatment of losses, including its valuation, is defined in operational codes approved by the Government. Losses are valued according to the day-ahead market price.
Regarding the other EU ITC Parties, the Agency notes that PX prices/pool prices and auctions (or their combinations) are the most frequently used criteria by the NRAs for assigning value to losses. In total, 10 NRAs apply criteria based on PX prices and pool prices, 5 NRAs perform auctions/tenders, mostly on a yearly or quarterly basis. Furthermore, 6 NRAs use a combination of PX prices and auctions or PX prices and bilateral contracts.
9/22
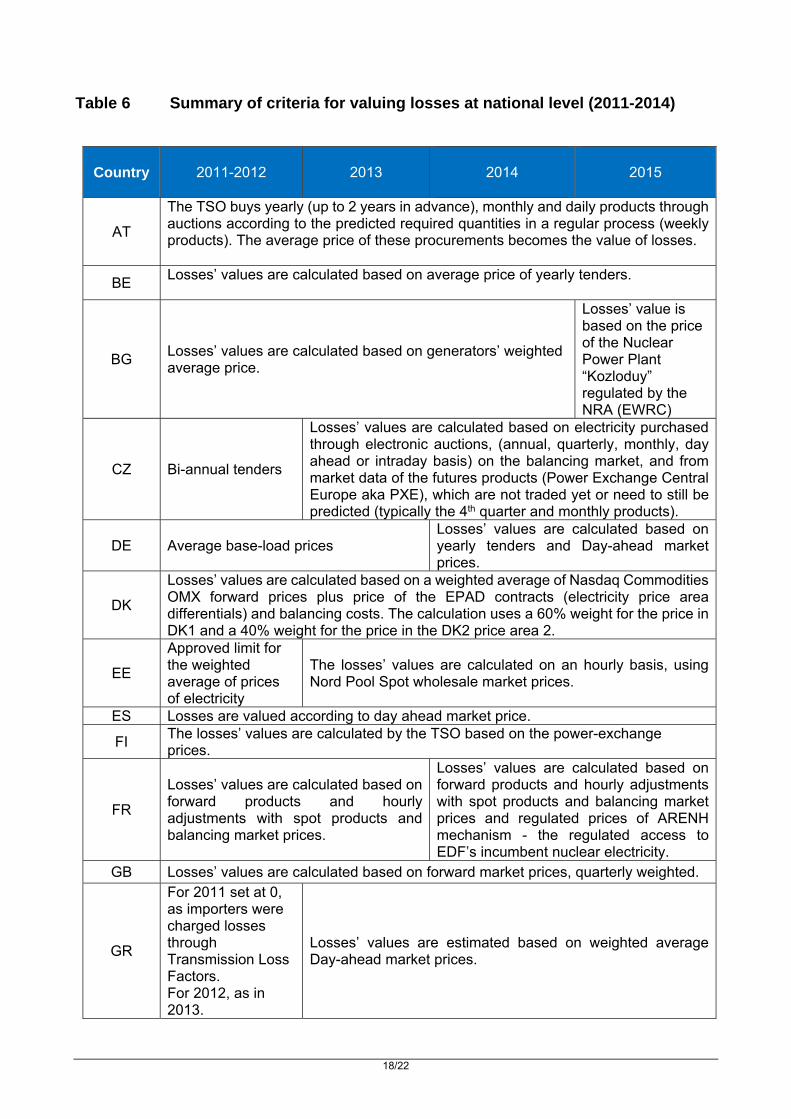
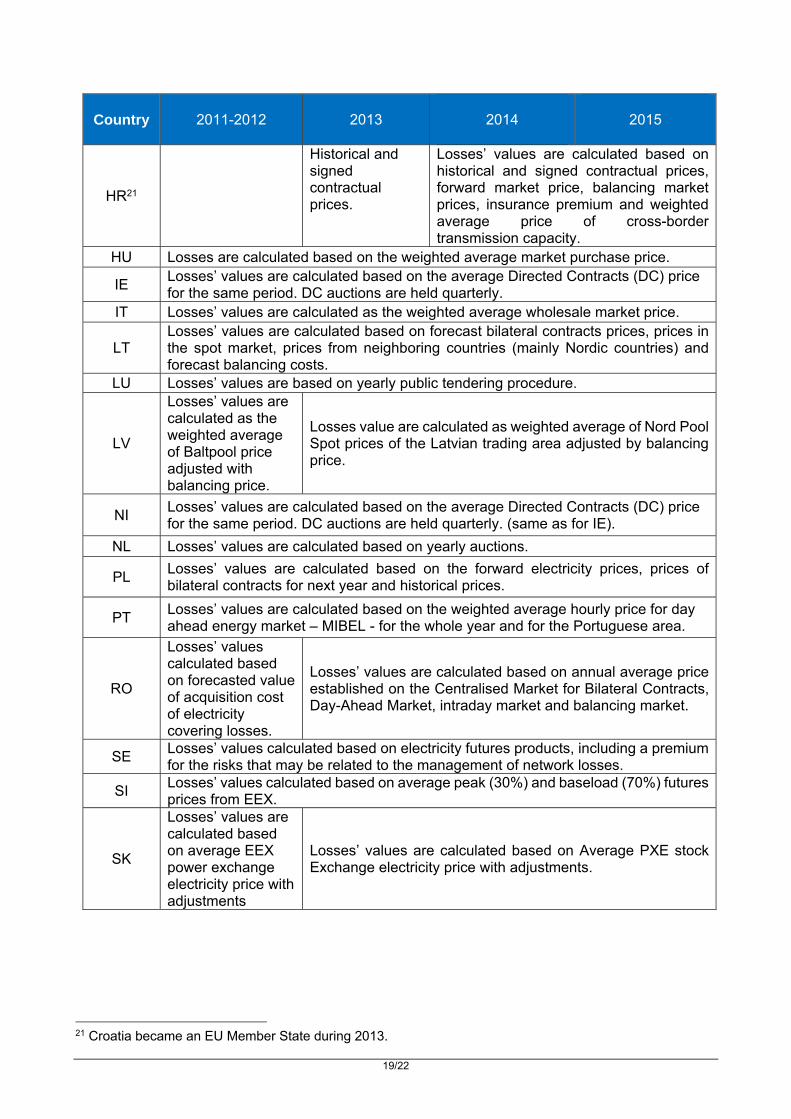
One NRA (France) uses an approach11 based on a combination of PX prices and regulated prices, whilst another NRA (Bulgaria) uses a regulated price only12. A summary of the criteria for valuing losses in each country over the years 2011-2015 is shown in Table 6 in the Annex. The website links to the relevant national documents regarding losses valuation are shown in Table 8 in the Annex. 3.6 Values of Losses For 1613 out of 27 EU ITC Parties, it is the NRA who approves the value of losses for the 2015 ITC mechanism. The variation of energy prices for different products in different markets and from auctions and bilateral contracts resulted in a broad range of values of losses for the EU ITC Parties (from 15.34 €/MWh in Bulgaria to 64.00 €/MWh in Greece), with an average value, weighted by the volumes of losses, of 43.34 €/MWh. As shown in Table 7 in the Annex, for the majority of the EU ITC Parties (17 out of 27), a higher value of losses was provided for the purpose of the 2015 ITC implementation than the actual 2015 value registered at the end of the respective year. The values of losses provided for the ITC implementation are on average 9% (or €3.91) higher than the actual values14. A similar finding can be drawn for the 2013 and 2014 ITC implementation15. In this respect, the Agency notes that had the actual value of losses been used, this would have led to a €8.7 million (8%) decrease in the compensation for losses in 2015. The Agency also reviewed ENTSO-E’s approach for setting the relevant values for the ITC Parties from third countries. ENTSO-E used the losses values received in the annual ITC data submission. The Agency notes that, in 2015, the weighted average value of losses for ITC Parties from third countries (non-EU ITC Parties) was 48.07 €/MWh, which was 11% higher than the weighted average value for the EU ITC Parties (43.34 €/MWh). The weighted average value of losses has been further reduced for both the EU ITC Parties and the third countries in 2015 compared to the previous year (6% and 5% respectively), resulting in the lowest figure of average value (44.15 €/MWh) registered in the last five years16. The Agency notes that Albania’s value of losses of 10.35 €/MWh is still significantly lower than the values provided by other ITC Parties, while this value already represents a 48%
11 Derived from the methodology used to estimate the value of losses for calculation of the network tariffs. 12 In Bulgaria, the losses are covered by the Nuclear Power Plant “Kozloduy” at a regulated price which is set by the NRA. 13 Austria, Bulgaria, Czech Republic, Estonia, Greece, Croatia, Hungary, Ireland, Italy, Netherlands, Northern-Ireland, Portugal, Romania and Spain. In Poland and Slovenia the value of losses which is approved by the NRA for national purposes is used for the ITC mechanism. 14 The highest difference (€13.6) is calculated for Denmark. 15 In 2013 and 2014 the number of ITC Parties with a value of losses for the ITC implementation higher than the actual value was 21 and 22 respectively. For those two years, the average weighted value of losses provided for ITC implementation was 9% higher than actual one. 16 The evolution of losses’ values per country over the years 2011-2015 is illustrated in Figure 1 in Annex.

10/22
increase comparing to the previous year. Given that Albania received a negative losses compensation from the ITC Fund, a change from the value of its current losses to the weighted average value of losses of all ITC Parties would have increased the amount of its negative compensation (which is effectively a payment into the ITC Fund) from €0.03 million to about €0.129 million.17 Further, the value of losses for Bulgaria used for the 2015 ITC implementation (15.34 €/MWh) is remarkably low compared to the other EU ITC parties. Using the weighted average value of losses of all ITC Parties, the losses compensation from the ITC fund to Bulgaria would be more than 3 times higher (from €0.733 million up to about €2.1 million)18. 3.7 Compensation for cross-border infrastructure Point 5 of Annex Part A of the Regulation defines the key parameters for calculating the amount of compensation that an ITC Party should receive for the provision of infrastructures to carry cross-border flows of electricity. These are summarised below:
a) The annual cross-border infrastructure sum is set at €100 million until determined otherwise by the European Commission; and
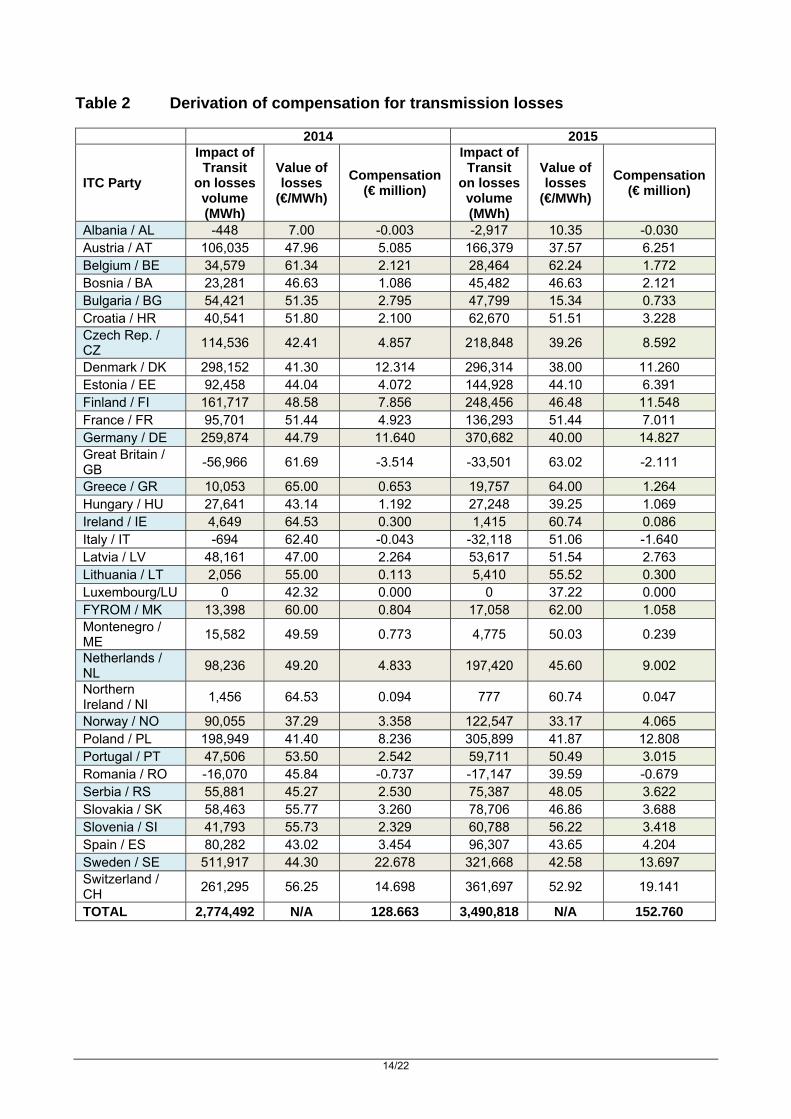
b) The Transit Factor and Load Factor are used to apportion the above sum to each ITC Party. Transit Factor refers to the amount of transits carried by an ITC Party as a proportion of the total transits carried by all ITC Parties. Load Factor refers to the relative amount of transits measured by the square of transits divided by the level of the load plus transits in proportion to the relative amount of transits for all ITC Parties. In apportioning the infrastructure compensation amount for an ITC Party, the Transit Factor has a weighting of 75% and the Load Factor of 25%.
Based on the review of the ITC Agreement and the final dataset submitted by ENTSO-E, the Agency notes that the compensation amounts relating to the provision of cross-border infrastructures were derived according to the above requirements. Table 3 in the Annex provides a summary of the annual amount each ITC Party received in 2015 from the two components based on their Transit Factors and Load Factors. 3.8 Contributions to the ITC fund Point 6 of Annex Part A of the Regulation sets out that each ITC Party shall contribute to the ITC fund based on its share of the total absolute amount of Net Imports and Net Exports of all ITC Parties. Point 7 of Annex Part A of the Regulation sets out that an ITC Party shall levy a transmission system use fee on all scheduled imports and exports between its national transmission system and that of a Perimeter country. ENTSO-E is required to calculate this Perimeter countries’ fee each year in advance based on projected flows for the relevant year.
17 This is an estimate derived from the mere multiplication of the volume of losses generated by transit by the weighted average value of losses for all ITC Parties. 18 Idem.
11/22
Based on the review of the ITC Agreement and the final dataset submitted by ENTSO-E, the Agency notes that the ITC Parties’ contribution amounts were derived according to the requirements of points 6 and 7 of Annex Part A of the Regulation. The relevant ITC Parties also collected contributions from Perimeter countries with which they have direct connections. ENTSO-E’s calculation of the Perimeter countries’ fee was based on the equivalent losses and infrastructure compensation for historical flows of the previous year19. According to ENTSO-E, this is the best possible projection for flows in the subsequent year. The Agency notes that the perimeter fee was 0.6 €/MWh in 2015, which is lower than in previous years (0.7 €/MWh in 2013 and 2014, 0.8 €/MWh in 2011 and 2012). This mainly results from the increased volume of import and export flows20. Table 4 in the Annex provides a summary of the annual Net Import, Net Export and the contribution amount each ITC Party paid into the ITC Fund in 2015, including the contribution it made on behalf of Perimeter countries it had a direct connection with. The Agency notes that the contribution by Perimeter countries decreased between 2014 and 2015 both in terms of value, from €16 million to €13 million, and in terms of share to the ITC Fund, from 7% to 5%. 3.9 Treatment of third countries The Agency notes that the ITC Agreement has not changed regarding the treatment of ITC Parties, thus the former findings of the Agency are still valid. In 2012 the Agency noted that the ITC Agreement makes no distinction between categories of ITC Parties, whether participating on a compulsory or voluntary basis under point 2 or through voluntary multi-party agreements under point 3. Therefore, the Agency concluded that the requirements of points 3.2 and 3.4 of Annex Part A of the Regulation are met. 3.10 Accuracy of data ENTSO-E carried out a distinct monthly internal audit on the 2015 data submitted by the ITC Parties for the monthly preliminary settlement, which eliminated the need for further corrections of the monthly results at the time of the final settlement. Summary of the findings
The Agency concludes that the implementation of the ITC mechanism and the management of the ITC Fund in 2015 continues to be in line with the requirements set out in the Regulation.
19The perimeter fee has two elements; a loss related component and a framework fund component which are summed and round to a single decimal place to create the perimeter fee: - the losses related fee is calculated by dividing the WWT(With and Without Transit) Fund size by the sum of scheduled import and export flows, net import and net export flows; and - the framework fund related fee is calculated by dividing the total contribution (100 million at present) by the sum of scheduled import and export flows, net import and net export flows. Perimeter fee is calculated on the basis of unaudited data and it is rounded to a single decimal. 20The increase of the flows was higher than the increase of the WWT Fund.

12/22
With regard to specific aspects of the ITC implementation in 2015, the major findings include the following:
Contrary to the last two years, the losses component of the ITC Fund increased by
19% (to reach €153 million) compared to 2014. The increase of the losses component of the ITC Fund was mainly triggered by the
significant increase (+26%) of the volume of losses incurred by transit compared to 2014.
For the vast majority of EU ITC Parties, the criteria to calculate the value of losses were still market-based and approved by the respective NRA.
The weighted average value of losses for the 2015 ITC mechanism (44.15 €/MWh) is the lowest figure registered over the last five years.
Regarding EU ITC Parties the actual 2015 values of losses are still on average 9% lower compared to the values used for the 2015 ITC mechanism
In 2015, the perimeter fee decreased to 0.6 €/MWh, (against 0.7€/MWh in 2014). Both the absolute and relative contribution of the Perimeter countries to the ITC Fund decreased compared to 2014.
13/22
Annex – Tables and Figures
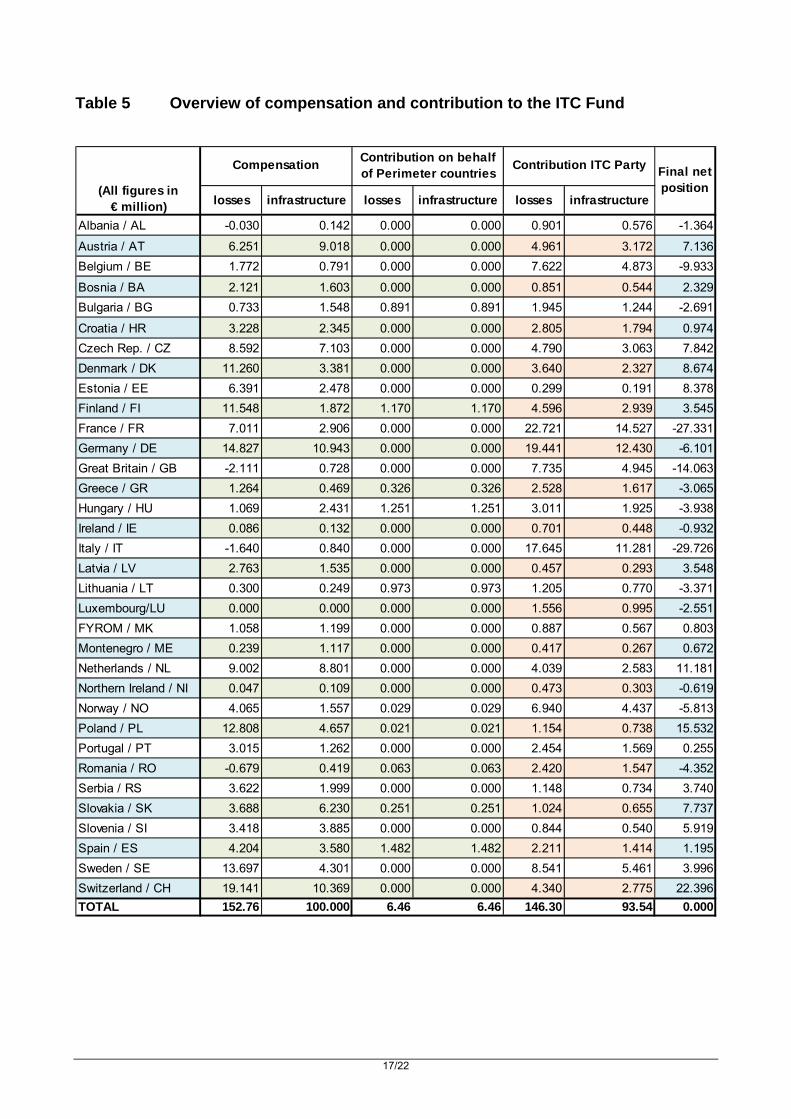
Please note that while the actual ITC settlement is in Euro cents, the tables below present all monetary values in millions of Euros rounded to three decimal places. Table 1 Reduction in Transits
ITC PartyTransit before
adjustment (MWh)
Reduction due to non-auctioned
interconnection capacity (MWh)
Transit after reduction
(MWh)
Albania / AL 426,672 0 426,672Austria / AT 18,451,414 0 18,451,414Belgium / BE 2,453,018 0 2,453,018Bosnia / BA 3,772,063 0 3,772,063Bulgaria / BG 4,232,600 0 4,232,600Croatia / HR 5,514,252 0 5,514,252Czech Rep. / CZ 15,466,191 0 15,466,191Denmark / DK 7,798,375 0 7,798,375Estonia / EE 4,947,905 0 4,947,905Finland / FI 5,424,051 0 5,424,051France / FR 9,223,272 25,793 9,197,479Germany / DE 31,222,894 0 31,222,894Great Britain / GB 2,349,811 0 2,349,811Greece / GR 1,460,914 0 1,460,914Hungary / HU 6,248,595 0 6,248,595Ireland / IE 419,950 0 419,950Italy / IT 2,703,044 6,309 2,696,735Latvia / LV 3,224,009 0 3,224,009Lithuania / LT 729,396 0 729,396Luxembourg/LU 8 0 8
FYROM / MK 2,775,193 0 2,775,193Montenegro / ME 2,225,279 0 2,225,279Netherlands / NL 20,866,779 0 20,866,779Northern Ireland / NI 336,694 0 336,694Norway / NO 4,727,210 0 4,727,210Poland / PL 12,636,976 0 12,636,976Portugal / PT 3,595,185 0 3,595,185Romania / RO 1,295,410 0 1,295,410Serbia / RS 5,361,154 0 5,361,154Slovakia / SK 12,258,228 0 12,258,228Slovenia / SI 7,857,993 0 7,857,993Spain / ES 10,732,906 0 10,732,906Sweden / SE 11,924,965 0 11,924,965Switzerland / CH 27,730,652 5,368,169 22,362,483
TOTAL 250,393,059 5,400,271 244,992,787
14/22
Table 2 Derivation of compensation for transmission losses
2014 2015
ITC Party
Impact of Transit
on losses volume (MWh)
Value of losses
(€/MWh)
Compensation(€ million)
Impact of Transit
on losses volume (MWh)
Value of losses
(€/MWh)
Compensation(€ million)
Albania / AL -448 7.00 -0.003 -2,917 10.35 -0.030 Austria / AT 106,035 47.96 5.085 166,379 37.57 6.251 Belgium / BE 34,579 61.34 2.121 28,464 62.24 1.772 Bosnia / BA 23,281 46.63 1.086 45,482 46.63 2.121 Bulgaria / BG 54,421 51.35 2.795 47,799 15.34 0.733 Croatia / HR 40,541 51.80 2.100 62,670 51.51 3.228 Czech Rep. / CZ
114,536 42.41 4.857 218,848 39.26 8.592
Denmark / DK 298,152 41.30 12.314 296,314 38.00 11.260 Estonia / EE 92,458 44.04 4.072 144,928 44.10 6.391 Finland / FI 161,717 48.58 7.856 248,456 46.48 11.548 France / FR 95,701 51.44 4.923 136,293 51.44 7.011 Germany / DE 259,874 44.79 11.640 370,682 40.00 14.827 Great Britain / GB
-56,966 61.69 -3.514 -33,501 63.02 -2.111
Greece / GR 10,053 65.00 0.653 19,757 64.00 1.264 Hungary / HU 27,641 43.14 1.192 27,248 39.25 1.069 Ireland / IE 4,649 64.53 0.300 1,415 60.74 0.086 Italy / IT -694 62.40 -0.043 -32,118 51.06 -1.640 Latvia / LV 48,161 47.00 2.264 53,617 51.54 2.763 Lithuania / LT 2,056 55.00 0.113 5,410 55.52 0.300 Luxembourg/LU 0 42.32 0.000 0 37.22 0.000 FYROM / MK 13,398 60.00 0.804 17,058 62.00 1.058 Montenegro / ME
15,582 49.59 0.773 4,775 50.03 0.239
Netherlands / NL
98,236 49.20 4.833 197,420 45.60 9.002
Northern Ireland / NI
1,456 64.53 0.094 777 60.74 0.047
Norway / NO 90,055 37.29 3.358 122,547 33.17 4.065 Poland / PL 198,949 41.40 8.236 305,899 41.87 12.808 Portugal / PT 47,506 53.50 2.542 59,711 50.49 3.015 Romania / RO -16,070 45.84 -0.737 -17,147 39.59 -0.679 Serbia / RS 55,881 45.27 2.530 75,387 48.05 3.622 Slovakia / SK 58,463 55.77 3.260 78,706 46.86 3.688 Slovenia / SI 41,793 55.73 2.329 60,788 56.22 3.418 Spain / ES 80,282 43.02 3.454 96,307 43.65 4.204 Sweden / SE 511,917 44.30 22.678 321,668 42.58 13.697 Switzerland / CH
261,295 56.25 14.698 361,697 52.92 19.141
TOTAL 2,774,492 N/A 128.663 3,490,818 N/A 152.760
15/22
Table 3 Derivation of compensation for cross-border infrastructure
* This is the total amount of electricity which exits the national transmission system to distribution systems and to end consumers directly connected to the transmission system, as well as to electricity producers for their consumption in the generation of electricity.
ITC Party Transit(MWh)
Load*(GWh)
Transit Factor based
compensation(€million)
Load Factor based
compensation(€million)
Total Infrastructure compensation
(€million)
Albania / AL 426,672 7,400 0.131 0.011 0.142Austria / AT 18,451,414 30,889 5.649 3.370 9.018Belgium / BE 2,453,018 71,819 0.751 0.040 0.791Bosnia / BA 3,772,063 11,732 1.155 0.448 1.603Bulgaria / BG 4,232,600 30,447 1.296 0.252 1.548Croatia / HR 5,514,252 17,082 1.688 0.657 2.345Czech Rep. / CZ 15,466,191 33,864 4.735 2.368 7.103Denmark / DK 7,798,375 22,094 2.387 0.994 3.381Estonia / EE 4,947,905 7,466 1.515 0.963 2.478Finland / FI 5,424,051 62,394 1.660 0.212 1.872France / FR 9,197,479 445,788 2.816 0.091 2.906Germany / DE 31,222,894 312,703 9.558 1.384 10.943Great Britain / GB 2,349,811 302,600 0.719 0.009 0.728Greece / GR 1,460,914 46,714 0.447 0.022 0.469Hungary / HU 6,248,595 30,533 1.913 0.518 2.431Ireland / IE 419,950 25,835 0.129 0.003 0.132Italy / IT 2,696,735 248,929 0.826 0.014 0.840Latvia / LV 3,224,009 6,044 0.987 0.548 1.535Lithuania / LT 729,396 9,412 0.223 0.026 0.249Luxembourg/LU 8 4,114 0.000 0.000 0.000FYROM / MK 2,775,193 7,989 0.850 0.349 1.199Montenegro / ME 2,225,279 3,324 0.681 0.436 1.117Netherlands / NL 20,866,779 67,261 6.388 2.413 8.801Northern Ireland / NI 336,694 8,881 0.103 0.006 0.109Norway / NO 4,727,210 94,348 1.447 0.110 1.557Poland / PL 12,636,976 86,239 3.869 0.789 4.657Portugal / PT 3,595,185 35,425 1.101 0.162 1.262Romania / RO 1,295,410 35,136 0.397 0.022 0.419Serbia / RS 5,361,154 33,840 1.641 0.358 1.999Slovakia / SK 12,258,228 17,366 3.753 2.477 6.230Slovenia / SI 7,857,993 12,525 2.406 1.479 3.885Spain / ES 10,732,906 180,286 3.286 0.295 3.580Sweden / SE 11,924,965 94,846 3.651 0.650 4.301Switzerland / CH 22,362,483 46,948 6.846 3.524 10.369
TOTAL 244,992,787 2,452,272 75.000 25.000 100.000

16/22
Table 4 Derivation of contributions to the ITC Fund
Perimeter countries
ITC PartyPerimeter countries
ITC Party
Albania / AL 1,928,678 529,269 0.000 0.576 0.000 0.901Austria / AT 12,551,225 989,557 0.000 3.172 0.000 4.961Belgium / BE 20,801,877 1,751 0.000 4.873 0.000 7.622Bosnia / BA 97,102 2,224,748 0.000 0.544 0.000 0.851Bulgaria / BG 0 5,309,945 0.891 1.244 0.891 1.945Croatia / HR 7,642,162 15,257 0.000 1.794 0.000 2.805Czech Rep. / CZ 22,657 13,052,681 0.000 3.063 0.000 4.790Denmark / DK 8,083,074 1,851,712 0.000 2.327 0.000 3.640Estonia / EE 388,024 429,400 0.000 0.191 0.000 0.299Finland / FI 12,543,689 1,776 1.170 2.939 1.170 4.596France / FR 23,912 61,993,419 0.000 14.527 0.000 22.721Germany / DE 919,444 52,145,044 0.000 12.430 0.000 19.441Great Britain / GB 21,056,957 54,836 0.000 4.945 0.000 7.735Greece / GR 6,884,933 16,406 0.326 1.617 0.326 2.528Hungary / HU 8,217,882 753 1.251 1.925 1.251 3.011Ireland / IE 1,295,700 618,845 0.000 0.448 0.000 0.701Italy / IT 48,142,719 18,270 0.000 11.281 0.000 17.645Latvia / LV 1,049,331 199,372 0.000 0.293 0.000 0.457Lithuania / LT 3,288,181 0 0.973 0.770 0.973 1.205Luxembourg/LU 4,247,792 0 0.000 0.995 0.000 1.556FYROM / MK 2,420,095 126 0.000 0.567 0.000 0.887Montenegro / ME 864,722 273,214 0.000 0.267 0.000 0.417Netherlands / NL 9,891,610 1,133,862 0.000 2.583 0.000 4.039Northern Ireland / NI 937,087 354,345 0.000 0.303 0.000 0.473Norway / NO 2,530,534 16,413,027 0.029 4.437 0.029 6.940Poland / PL 1,650,929 1,500,184 0.021 0.738 0.021 1.154Portugal / PT 4,481,920 2,215,512 0.000 1.569 0.000 2.454Romania / RO 34,251 6,570,089 0.063 1.547 0.063 2.420Serbia / RS 1,234,583 1,897,804 0.000 0.734 0.000 1.148Slovakia / SK 2,683,014 112,859 0.251 0.655 0.251 1.024Slovenia / SI 1,186,883 1,117,488 0.000 0.540 0.000 0.844Spain / ES 4,218,049 1,817,741 1.482 1.414 1.482 2.211Sweden / SE 106,892 23,206,167 0.000 5.461 0.000 8.541Switzerland / CH 5,770,608 6,074,656 0.000 2.775 0.000 4.340
TOTAL 197,196,517 202,140,114
ITC Party Net Import
(MWh)Net Export
(MWh)
Contribution to infrastructure
(€million)
Contribution to losses(€million)
100.00 152.76
17/22
Table 5 Overview of compensation and contribution to the ITC Fund
losses infrastructure losses infrastructure losses infrastructure
Albania / AL -0.030 0.142 0.000 0.000 0.901 0.576 -1.364
Austria / AT 6.251 9.018 0.000 0.000 4.961 3.172 7.136
Belgium / BE 1.772 0.791 0.000 0.000 7.622 4.873 -9.933
Bosnia / BA 2.121 1.603 0.000 0.000 0.851 0.544 2.329
Bulgaria / BG 0.733 1.548 0.891 0.891 1.945 1.244 -2.691
Croatia / HR 3.228 2.345 0.000 0.000 2.805 1.794 0.974
Czech Rep. / CZ 8.592 7.103 0.000 0.000 4.790 3.063 7.842
Denmark / DK 11.260 3.381 0.000 0.000 3.640 2.327 8.674
Estonia / EE 6.391 2.478 0.000 0.000 0.299 0.191 8.378
Finland / FI 11.548 1.872 1.170 1.170 4.596 2.939 3.545
France / FR 7.011 2.906 0.000 0.000 22.721 14.527 -27.331
Germany / DE 14.827 10.943 0.000 0.000 19.441 12.430 -6.101
Great Britain / GB -2.111 0.728 0.000 0.000 7.735 4.945 -14.063
Greece / GR 1.264 0.469 0.326 0.326 2.528 1.617 -3.065
Hungary / HU 1.069 2.431 1.251 1.251 3.011 1.925 -3.938
Ireland / IE 0.086 0.132 0.000 0.000 0.701 0.448 -0.932
Italy / IT -1.640 0.840 0.000 0.000 17.645 11.281 -29.726
Latvia / LV 2.763 1.535 0.000 0.000 0.457 0.293 3.548
Lithuania / LT 0.300 0.249 0.973 0.973 1.205 0.770 -3.371
Luxembourg/LU 0.000 0.000 0.000 0.000 1.556 0.995 -2.551
FYROM / MK 1.058 1.199 0.000 0.000 0.887 0.567 0.803
Montenegro / ME 0.239 1.117 0.000 0.000 0.417 0.267 0.672
Netherlands / NL 9.002 8.801 0.000 0.000 4.039 2.583 11.181
Northern Ireland / NI 0.047 0.109 0.000 0.000 0.473 0.303 -0.619
Norway / NO 4.065 1.557 0.029 0.029 6.940 4.437 -5.813
Poland / PL 12.808 4.657 0.021 0.021 1.154 0.738 15.532
Portugal / PT 3.015 1.262 0.000 0.000 2.454 1.569 0.255
Romania / RO -0.679 0.419 0.063 0.063 2.420 1.547 -4.352
Serbia / RS 3.622 1.999 0.000 0.000 1.148 0.734 3.740
Slovakia / SK 3.688 6.230 0.251 0.251 1.024 0.655 7.737
Slovenia / SI 3.418 3.885 0.000 0.000 0.844 0.540 5.919
Spain / ES 4.204 3.580 1.482 1.482 2.211 1.414 1.195
Sweden / SE 13.697 4.301 0.000 0.000 8.541 5.461 3.996
Switzerland / CH 19.141 10.369 0.000 0.000 4.340 2.775 22.396
TOTAL 152.76 100.000 6.46 6.46 146.30 93.54 0.000
(All figures in € million)
CompensationContribution on behalf of Perimeter countries
Contribution ITC Party Final net position
18/22
Table 6 Summary of criteria for valuing losses at national level (2011-2014)
Country 2011-2012 2013
2014
2015
AT
The TSO buys yearly (up to 2 years in advance), monthly and daily products through auctions according to the predicted required quantities in a regular process (weekly products). The average price of these procurements becomes the value of losses.
BE Losses’ values are calculated based on average price of yearly tenders.
BG Losses’ values are calculated based on generators’ weighted average price.
Losses’ value is based on the price of the Nuclear Power Plant “Kozloduy” regulated by the NRA (EWRC)
CZ Bi-annual tenders
Losses’ values are calculated based on electricity purchased through electronic auctions, (annual, quarterly, monthly, day ahead or intraday basis) on the balancing market, and from market data of the futures products (Power Exchange Central Europe aka PXE), which are not traded yet or need to still be predicted (typically the 4th quarter and monthly products).
DE Average base-load prices Losses’ values are calculated based on yearly tenders and Day-ahead market prices.
DK
Losses’ values are calculated based on a weighted average of Nasdaq Commodities OMX forward prices plus price of the EPAD contracts (electricity price area differentials) and balancing costs. The calculation uses a 60% weight for the price in DK1 and a 40% weight for the price in the DK2 price area 2.
EE
Approved limit for the weighted average of prices of electricity
The losses’ values are calculated on an hourly basis, using Nord Pool Spot wholesale market prices.
ES Losses are valued according to day ahead market price.
FI The losses’ values are calculated by the TSO based on the power-exchange prices.
FR
Losses’ values are calculated based on forward products and hourly adjustments with spot products and balancing market prices.
Losses’ values are calculated based on forward products and hourly adjustments with spot products and balancing market prices and regulated prices of ARENH mechanism - the regulated access to EDF’s incumbent nuclear electricity.
GB Losses’ values are calculated based on forward market prices, quarterly weighted.
GR
For 2011 set at 0, as importers were charged losses through Transmission Loss Factors. For 2012, as in 2013.
Losses’ values are estimated based on weighted average Day-ahead market prices.
19/22
Country 2011-2012 2013
2014
2015
HR21
Historical and signed contractual prices.
Losses’ values are calculated based on historical and signed contractual prices, forward market price, balancing market prices, insurance premium and weighted average price of cross-border transmission capacity.
HU Losses are calculated based on the weighted average market purchase price.
IE Losses’ values are calculated based on the average Directed Contracts (DC) price for the same period. DC auctions are held quarterly.
IT Losses’ values are calculated as the weighted average wholesale market price.
LT Losses’ values are calculated based on forecast bilateral contracts prices, prices in the spot market, prices from neighboring countries (mainly Nordic countries) and forecast balancing costs.
LU Losses’ values are based on yearly public tendering procedure.
LV
Losses’ values are calculated as the weighted average of Baltpool price adjusted with balancing price.
Losses value are calculated as weighted average of Nord Pool Spot prices of the Latvian trading area adjusted by balancing price.
NI Losses’ values are calculated based on the average Directed Contracts (DC) price for the same period. DC auctions are held quarterly. (same as for IE).
NL Losses’ values are calculated based on yearly auctions.
PL Losses’ values are calculated based on the forward electricity prices, prices of bilateral contracts for next year and historical prices.
PT Losses’ values are calculated based on the weighted average hourly price for day ahead energy market – MIBEL - for the whole year and for the Portuguese area.
RO
Losses’ values calculated based on forecasted value of acquisition cost of electricity covering losses.
Losses’ values are calculated based on annual average price established on the Centralised Market for Bilateral Contracts, Day-Ahead Market, intraday market and balancing market.
SE Losses’ values calculated based on electricity futures products, including a premium for the risks that may be related to the management of network losses.
SI Losses’ values calculated based on average peak (30%) and baseload (70%) futures prices from EEX.
SK
Losses’ values are calculated based on average EEX power exchange electricity price with adjustments
Losses’ values are calculated based on Average PXE stock Exchange electricity price with adjustments.
21 Croatia became an EU Member State during 2013.

Table 7 Losses’ values used in ITC mechanism and actual Losses’ values for years 2013-2015 (€/MWh)
Losses’ values used in ITC mechanism 2013
Actual losses’ values in 2013
Difference between ITC and actual figures
Losses’ values used in ITC mechanism 2014
Actual losses’ values in 2014
Difference between ITC and actual figures
Losses’ values used in ITC mechanism 2015
Actual losses’ values in 2015
Difference between ITC and actual figures
AT 56.07 56.07 0 47.96 47.96 0 37.57 37.57 0
BE 60.32 53.91 6.41 61.34 46.83 14.51 62.24 49.60 12.64
BG 50.66 45.10 5.56 51.35 34.80 16.55 15.34 23.32 -7.98
CZ 57.60 48.24 9.36 42.41 39.93 2.48 39.26 39.22 0.04
DE 53.42 52.69 0.73 44.79 44.39 0.4 40.00 36.21 3.79
DK 43.69 35.00 8.69 41.30 30.00 11.3 38,0 24,40 13.6
EE 40.67 45.03 -4.36 44.04 39.45 4.59 44.10 32.74 11.36
ES 50.33 45.58 4.75 43.02 42.93 0.09 43.65 51.28 -7.63
FI 52.13 51.23 0.9 48.58 50.99 -2.41 46.48 48.22 -1.74
FR 69.44 55.97 13.47 51.44 48.94 2.5 51.44 43.70 7.74
GB 63.96 58.20 5.76 61.69 59.07 2.62 63.02 55.14 7.88
GR 68.12 45.30 22.82 65.00 60.20 4.8 64.00 54.40 9.6
HR 63.38 57.67 5.71 51.80 44.87 6.93 51.51 43.16 8.35
HU 54.48 53.87 0.61 43.14 40.35 2.79 39.25 42.93 -3.68
IE 66.51 65.59 0.92 64.53 63.76 0.77 60.74 48.92 11.82
IT 75.50 65.15 10.35 62.40 53.96 8.44 51.06 54.31 -3.25
LT 50.10 55.52 -5.42 55.00 53.74 1.26 55.52 44.85 10.67
LU 54.47 54.47 0 42.32 42.32 0 37.22 37.22 0
LV 45.84 51.01 -5.17 47.00 54.10 -7.1 51.54 42.48 9.06
NI 66.51 65.59 0.92 64.53 63.76 0.77 60.74 48.92 11.82
NL 62.70 65.05 -2.35 49.20 48.32 0.88 45.60 44.90 0.7
PL 46.38 43.74 2.64 41.10 39.33 1.77 41.87 42.71 -0.84
PT 57.60 44.81 12.79 53.50 42.45 11.05 50.49 51.18 -0.69
RO 50.22 45.40 4.82 45.84 39.60 6.24 39.59 37.80 1.79
SE 51.38 48.67 2.71 44.30 44.74 -0.44 42.58 41.50 1.08
SI 55.51 47.39 8.12 55.73 45.54 10.19 56.22 46.68 9.54
SK 63.66 52.80 10.86 55.77 40.59 15.18 46.86 46.86 0 Source: ENTSO-E provided the losses’ values used in ITC mechanism; NRAs provided the actual losses’ value
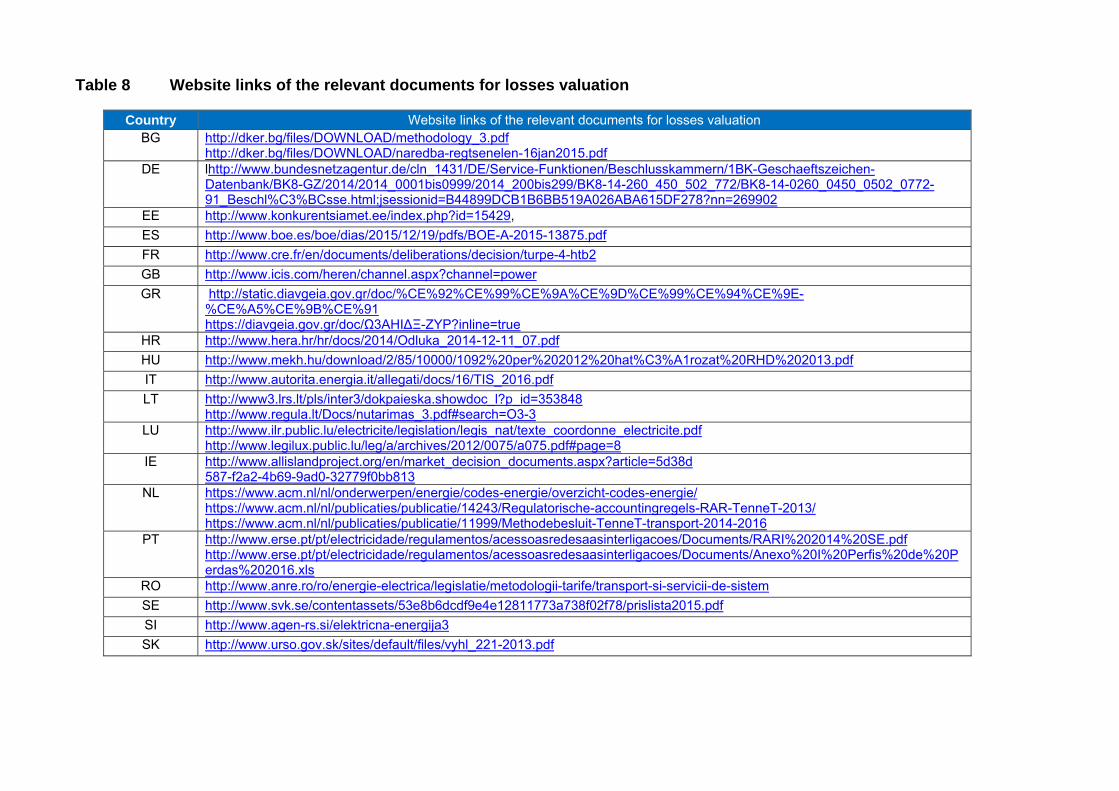
Table 8 Website links of the relevant documents for losses valuation
Country Website links of the relevant documents for losses valuation BG http://dker.bg/files/DOWNLOAD/methodology_3.pdf
http://dker.bg/files/DOWNLOAD/naredba-regtsenelen-16jan2015.pdf DE lhttp://www.bundesnetzagentur.de/cln_1431/DE/Service-Funktionen/Beschlusskammern/1BK-Geschaeftszeichen-
Datenbank/BK8-GZ/2014/2014_0001bis0999/2014_200bis299/BK8-14-260_450_502_772/BK8-14-0260_0450_0502_0772-91_Beschl%C3%BCsse.html;jsessionid=B44899DCB1B6BB519A026ABA615DF278?nn=269902
EE http://www.konkurentsiamet.ee/index.php?id=15429,
ES http://www.boe.es/boe/dias/2015/12/19/pdfs/BOE-A-2015-13875.pdf
FR http://www.cre.fr/en/documents/deliberations/decision/turpe-4-htb2
GB http://www.icis.com/heren/channel.aspx?channel=power
GR http://static.diavgeia.gov.gr/doc/%CE%92%CE%99%CE%9A%CE%9D%CE%99%CE%94%CE%9E-%CE%A5%CE%9B%CE%91 https://diavgeia.gov.gr/doc/Ω3ΑΗΙ∆Ξ-ΖΥΡ?inline=true
HR http://www.hera.hr/hr/docs/2014/Odluka_2014-12-11_07.pdf
HU http://www.mekh.hu/download/2/85/10000/1092%20per%202012%20hat%C3%A1rozat%20RHD%202013.pdf
IT http://www.autorita.energia.it/allegati/docs/16/TIS_2016.pdf
LT http://www3.lrs.lt/pls/inter3/dokpaieska.showdoc_l?p_id=353848 http://www.regula.lt/Docs/nutarimas_3.pdf#search=O3-3
LU http://www.ilr.public.lu/electricite/legislation/legis_nat/texte_coordonne_electricite.pdf http://www.legilux.public.lu/leg/a/archives/2012/0075/a075.pdf#page=8
IE http://www.allislandproject.org/en/market_decision_documents.aspx?article=5d38d 587-f2a2-4b69-9ad0-32779f0bb813
NL https://www.acm.nl/nl/onderwerpen/energie/codes-energie/overzicht-codes-energie/ https://www.acm.nl/nl/publicaties/publicatie/14243/Regulatorische-accountingregels-RAR-TenneT-2013/ https://www.acm.nl/nl/publicaties/publicatie/11999/Methodebesluit-TenneT-transport-2014-2016
PT http://www.erse.pt/pt/electricidade/regulamentos/acessoasredesaasinterligacoes/Documents/RARI%202014%20SE.pdf http://www.erse.pt/pt/electricidade/regulamentos/acessoasredesaasinterligacoes/Documents/Anexo%20I%20Perfis%20de%20Perdas%202016.xls
RO http://www.anre.ro/ro/energie-electrica/legislatie/metodologii-tarife/transport-si-servicii-de-sistem
SE http://www.svk.se/contentassets/53e8b6dcdf9e4e12811773a738f02f78/prislista2015.pdf
SI http://www.agen-rs.si/elektricna-energija3
SK http://www.urso.gov.sk/sites/default/files/vyhl_221-2013.pdf

Figure 1 The evolution of the losses’ values per year and country (€/MWh)
Document title:
Publishing date: 15/11/2016
We appreciate your feedback
Please click on the icon to take a 5’ online surveyand provide your feedback about this document
Share this document