IT Spending, Staffing, and Technology Trends -...
96
2082 Business Center Drive, Suite 240 | Irvine, CA 92612 Telephone (949) 831-8700 | www.computereconomics.com 2016
Transcript of IT Spending, Staffing, and Technology Trends -...
2082 Business Center Dr ive , Suite 240 | I rv ine, CA 92612Telephone (949) 831-8700 | www.computereconomics .com
2 0 1 6

TECHNOLOGY TRENDS 2016
TECHNOLOGY TRENDS 2016 © 2016 COMPUTER ECONOMICS, INC. UNAUTHORIZED DISTRIBUTION OR REPRODUCTION IS PROHIBITED.
PAGE 1
Technology Trends 2016
Computer Economics provides research and advisory services on the strategic and financial management of information technology. Our clients include IT end-user organizations and major consulting firms in North America. Our IT Spending and Staffing Benchmarks study, published annually since 1990, is the definitive source of IT benchmarking data.
Other annual studies include Technology Trends, an assessment of technology adoption, spending, and economic experience; IT Outsourcing Statistics, which provides data on the use of and experience with IT outsourcing; IT Management Best Practices, which measure adoption trends of strategic IT practices; and IT Staffing Ratios, a series of benchmarking studies with metrics for 14 IT job functions.
In addition to these major studies, we publish IT management advisories on various issues of concern to IT managers. These reports are made available through our website. For further information on our custom benchmarking services, website subscriptions, advisory reports, and other services, please contact our office or visit our website at Uwww.computereconomics.comU.
ISBN: 0-645052-86-3
Contact Information: Address: 2082 Business Center Drive, Suite 240, Irvine, CA 92612, USA Telephone: +1 (949) 831-8700 www.computereconomics.com
© 2016, Computer Economics, Inc., All Rights Reserved
Unauthorized reproduction or distribution in whole or in part in any form, including photocopying, faxing, image scanning, e-mailing, or making available for electronic downloading is prohibited without written permission from Computer Economics. Prior to photocopying items for internal or personal use, please contact Computer Economics, Inc. All trade names, trademarks, or registered trademarks are trade names, trademarks, or registered trademarks of their respective owners. Information contained in this publication has been compiled from sources believed to be reliable, but the accuracy of this information is not guaranteed.
Computer Economics disclaims all warranties and conditions with regard to the content, express or implied, including warranties of merchantability and fitness for a particular purpose, nor assumes any legal liability for the accuracy, completeness, or usefulness of any information contained herein. Any reference to a commercial product, process, or service does not imply or constitute an endorsement of the same by Computer Economics. This publication is designed to provide accurate and authoritative information in regard to the subject matter covered. It is sold or distributed with the understanding that Computer Economics is not engaged in rendering legal, accounting, or other professional service. If legal advice or other expert assistance is required, the services of a competent professional person should be sought.
TECHNOLOGY TRENDS 2016
TECHNOLOGY TRENDS 2016 © 2016 COMPUTER ECONOMICS, INC. UNAUTHORIZED DISTRIBUTION OR REPRODUCTION IS PROHIBITED.
PAGE 2
Table of Contents
TECHNOLOGY TRENDS OVERVIEW 3 Introduction 3 Comparative Analysis 4
ENTERPRISE SYSTEMS 10 Enterprise Resource Planning 12 Customer Relationship Management 20 Supply Chain Management 28 Human Capital Management 36 Data Warehouse/Business Intelligence 42 Mobile Applications 48 Social Business/Collaboration Systems 55
INFRASTRUCTURE TECHNOLOGY 61 Software as a Service 63 Infrastructure as a Service 70 Desktop Virtualization 76 Software-Defined Networking 83 Tablet Computers 89
METHODOLOGY AND PARTICIPANTS 95
TECHNOLOGY TRENDS 2016
TECHNOLOGY TRENDS 2016 © 2016 COMPUTER ECONOMICS, INC. UNAUTHORIZED DISTRIBUTION OR REPRODUCTION IS PROHIBITED.
PAGE 3
Technology Trends Overview Introduction
IT initiatives can come in and out of fashion with astonishing rapidity as vendors push the next big service, solution, or strategy. Only with time can IT executives know for certain which emerging IT initiatives will have staying power and which will fall short of the initial hype.
This study is designed to give business leaders insight into the staying power of 12 technology initiatives that are currently top of mind for many companies. It provides a glimpse into how quickly an emerging technology is being adopted, how deeply more-established technologies are penetrating the market, and how positive the customer experience is with each technology. The study also delves into the specific types of solutions under consideration. By understanding the adoption trends, investment activity, and customer experience, business leaders are in a better position to assess the potential risks and rewards of investing in each of these technology initiatives. They also can gain insight into just how aggressively competitors and peers are investing in these initiatives.
The study examines adoption trends, investment activity, and customer experience of 12 selected technology initiatives, including seven initiatives that fall broadly into the category of enterprise systems and five technologies that we categorize as infrastructure initiatives.
This study is based on a survey of 214 IT organizations worldwide conducted from September through December 2015. The IT organizations were asked about their technology adoption plans for the 18-month period stretching into the first half of 2017, as well as their return on investment and total cost of ownership experience over the previous two-year period. A further description of the methodology and sample is at the end of this study.
TECHNOLOGY TRENDS 2016
TECHNOLOGY TRENDS 2016 © 2016 COMPUTER ECONOMICS, INC. UNAUTHORIZED DISTRIBUTION OR REPRODUCTION IS PROHIBITED.
PAGE 4
Comparative Analysis
Before profiling each technology, we compare the technologies as a group to gain perspective on their relative maturity and relative risk associated with investing in each. The comparative analysis provides a context within which to assess each technology.
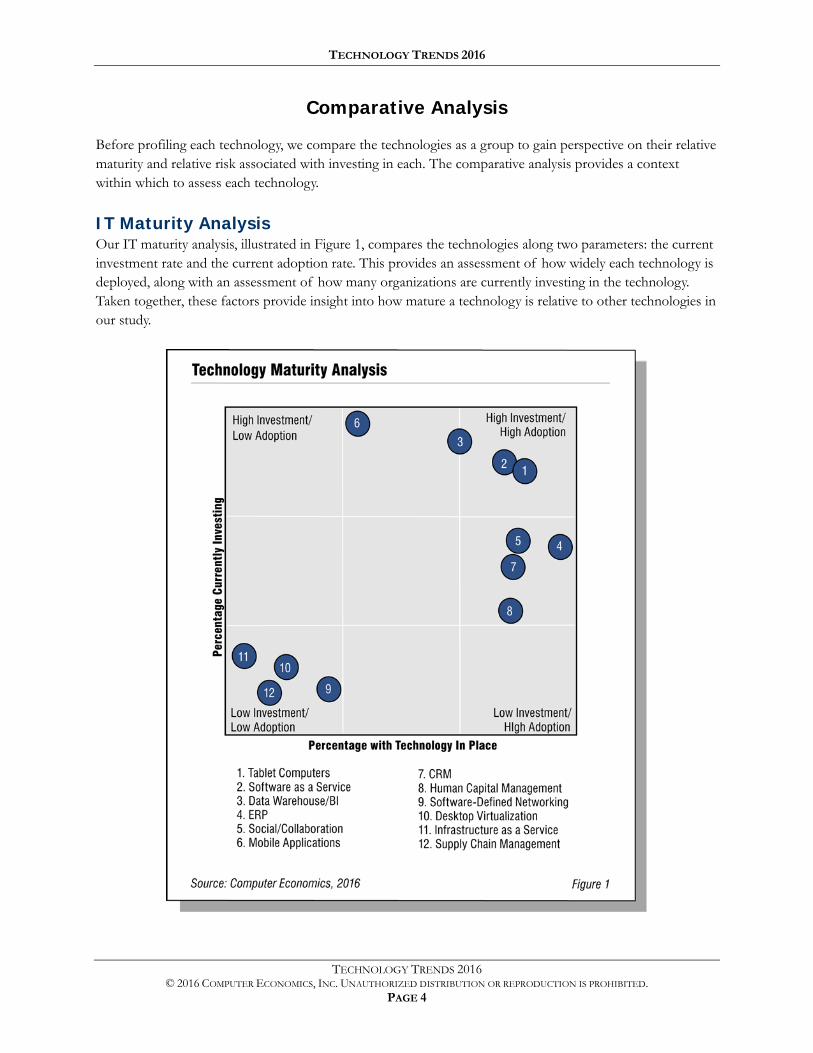
IT Maturity Analysis Our IT maturity analysis, illustrated in Figure 1, compares the technologies along two parameters: the current investment rate and the current adoption rate. This provides an assessment of how widely each technology is deployed, along with an assessment of how many organizations are currently investing in the technology. Taken together, these factors provide insight into how mature a technology is relative to other technologies in our study.
TECHNOLOGY TRENDS 2016
TECHNOLOGY TRENDS 2016 © 2016 COMPUTER ECONOMICS, INC. UNAUTHORIZED DISTRIBUTION OR REPRODUCTION IS PROHIBITED.
PAGE 5
The horizontal axis labeled “Percentage with Technology in Place” represents the current adoption rate. The higher the adoption rate, the farther the technology moves to the right in the chart. The vertical axis is labeled “Percentage Currently Investing,” representing the current investment rate. The greater the percentage of organizations currently investing in a technology, the higher it rises on the chart. Note that the scale on each axis is defined by the lowest and highest values in the study. As such, in this analysis, the words “low” and “high” are relative to the technologies in this study.
As is evident from examining Figure 1, the technologies in this year’s study fall broadly into two groups. One group is clustered in the low-investment, low-adoption sector, representing emerging technologies, such as software-defined networking, as well as those that have more limited appeal, such as supply chain management. The other, more established and broadly appealing technologies are near the high-investment, high-adoption corner of the chart.
The chart is divided into nine sectors, representing low, moderate, and high current investment rates, and low, moderate, and high current adoption rates. Each of the initiatives falls into one of the nine sectors as follows:
High Investment/High Adoption: Three technologies fall into the high-investment, high-adoption sector. Tablet computers (1) as a category is a relative newcomer to this quadrant, but it has emerged as the most widely deployed technology in the study. These devices have entered the mainstream and investment is ongoing. Another newcomer to the sector, Software as a Service (SaaS) (2), is now widely adopted, and it is continuing to attract new investment. The data warehouse and business intelligence category (3), meanwhile, is a repeat visitor to this sector. This broad and multifaceted category has been an ongoing area of investment for companies.
Moderate Investment/High Adoption: Four technologies fall into this sector. While these technologies are widely adopted, they are not being invested in at the same rate as the previous technologies. ERP (4) has become a foundational system and a transactional backbone for most organizations. Social business/collaboration solutions (5) also appear to be maturing. CRM (7) is a widely adopted technology that is attracting only moderate investment. Human capital management (8) has increased as an investment priority since last year. Every organization requires a system for managing its workforce, and this technology has gained a firmer footing due to the inroads made by SaaS vendors and new solutions for workforce management.
High Investment/Moderate Adoption: When the investment rate outpaces the adoption rate, a technology is growing quickly. The one technology in this sector, mobile applications (6), has that distinction. Mobile enterprise applications are on a trajectory to reach a high adoption level but are not there yet.
TECHNOLOGY TRENDS 2016
TECHNOLOGY TRENDS 2016 © 2016 COMPUTER ECONOMICS, INC. UNAUTHORIZED DISTRIBUTION OR REPRODUCTION IS PROHIBITED.
PAGE 6
Low Investment/Low Adoption: Not all technologies are destined for widespread adoption, but at least some of the early stage technologies in this sector will gain greater traction as they mature. Software-defined networking (9) has become a central component of state-of-the-art data centers and its low adoption rating, at this early stage, is indicative of its status as an emerging technology with potential. Desktop virtualization (10) has been the emerging camp for a while, indicating it is facing obstacles to wider adoption. In this study, Infrastructure as a Service (IaaS) (11) initiatives also are in the early stage. Supply chain management systems (12) are vital in some sectors, but the category appears to lack broad appeal outside the manufacturing, distribution, and retail sectors.
Enterprises today are investing in their bread-and-butter ERP systems at a high rate, mobile applications remain hot, and business intelligence continues to be a focus of investment. But there is nothing new in these observations. What does stand out in this analysis is that SaaS applications are no longer just a fast-rising technology. They have now become a top area of investment for many organizations. Tablets, representing a mobility platform, have become common in the enterprise.
In the next section, we assess the economic experience adopters are having with each of these initiatives, regardless of their maturity. This analysis will provide greater insight into the prospects for the emerging technologies.
TECHNOLOGY TRENDS 2016
TECHNOLOGY TRENDS 2016 © 2016 COMPUTER ECONOMICS, INC. UNAUTHORIZED DISTRIBUTION OR REPRODUCTION IS PROHIBITED.
PAGE 7
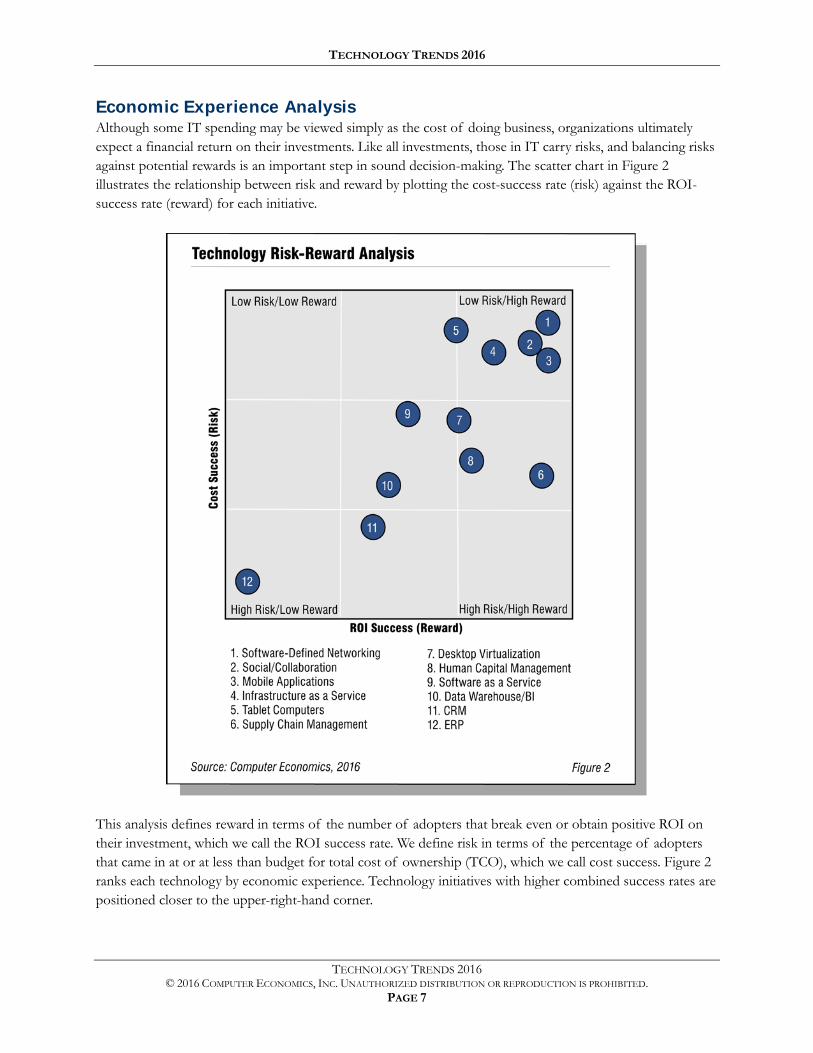
Economic Experience Analysis Although some IT spending may be viewed simply as the cost of doing business, organizations ultimately expect a financial return on their investments. Like all investments, those in IT carry risks, and balancing risks against potential rewards is an important step in sound decision-making. The scatter chart in Figure 2 illustrates the relationship between risk and reward by plotting the cost-success rate (risk) against the ROI-success rate (reward) for each initiative.
This analysis defines reward in terms of the number of adopters that break even or obtain positive ROI on their investment, which we call the ROI success rate. We define risk in terms of the percentage of adopters that came in at or at less than budget for total cost of ownership (TCO), which we call cost success. Figure 2 ranks each technology by economic experience. Technology initiatives with higher combined success rates are positioned closer to the upper-right-hand corner.
TECHNOLOGY TRENDS 2016
TECHNOLOGY TRENDS 2016 © 2016 COMPUTER ECONOMICS, INC. UNAUTHORIZED DISTRIBUTION OR REPRODUCTION IS PROHIBITED.
PAGE 8
Each initiative falls into one of nine sectors, representing low, moderate, or high reward, and low, moderate, or high risk. The findings are as follows:
Low Risk/High Reward: Technologies with the most successful economic experience profiles are in the low-risk, high-reward sector. We have five technologies in this category. For the most part, organizations are achieving success with these technologies. Software-defined networking (1), social collaboration (2), mobile applications (3), IaaS (4) and tablet computers (5) are a group of technologies that all IT executives should be tracking closely because of their positive risk-reward characteristics.
Moderate Risk/High Reward: Supply chain management (6), desktop virtualization (7), and human capital management (8) are the three technologies that fall into this sector. With these technologies, cost is not always predictable and feature creep is common. Nevertheless, investors are finding these solutions worth the risk.
Moderate Risk/Moderate Reward: Technologies in this sector carry some uncertainty in cost, but the risk is not out of the ordinary. While SaaS (9) and data warehouse/BI solutions (10) can exceed budget, the percentage of adopters obtaining positive ROI is relatively typical for technology implementations.
High Risk/Moderate Reward: CRM (11) plays a critical role in organizations, but implementation and maintenance costs can be difficult to predict.
High Risk/Low Reward: The sole technology in this sector, ERP (12), has a poor customer experience track record, and consistently so, but that has not prevented companies from investing in their ERP systems. Because these systems are an essential part of the application portfolio of most organizations, the high-risk/low-reward nature does not mean organizations should not invest in ERP. Rather, it means that they should focus more on mitigating the risks.
TECHNOLOGY TRENDS 2016
TECHNOLOGY TRENDS 2016 © 2016 COMPUTER ECONOMICS, INC. UNAUTHORIZED DISTRIBUTION OR REPRODUCTION IS PROHIBITED.
PAGE 9
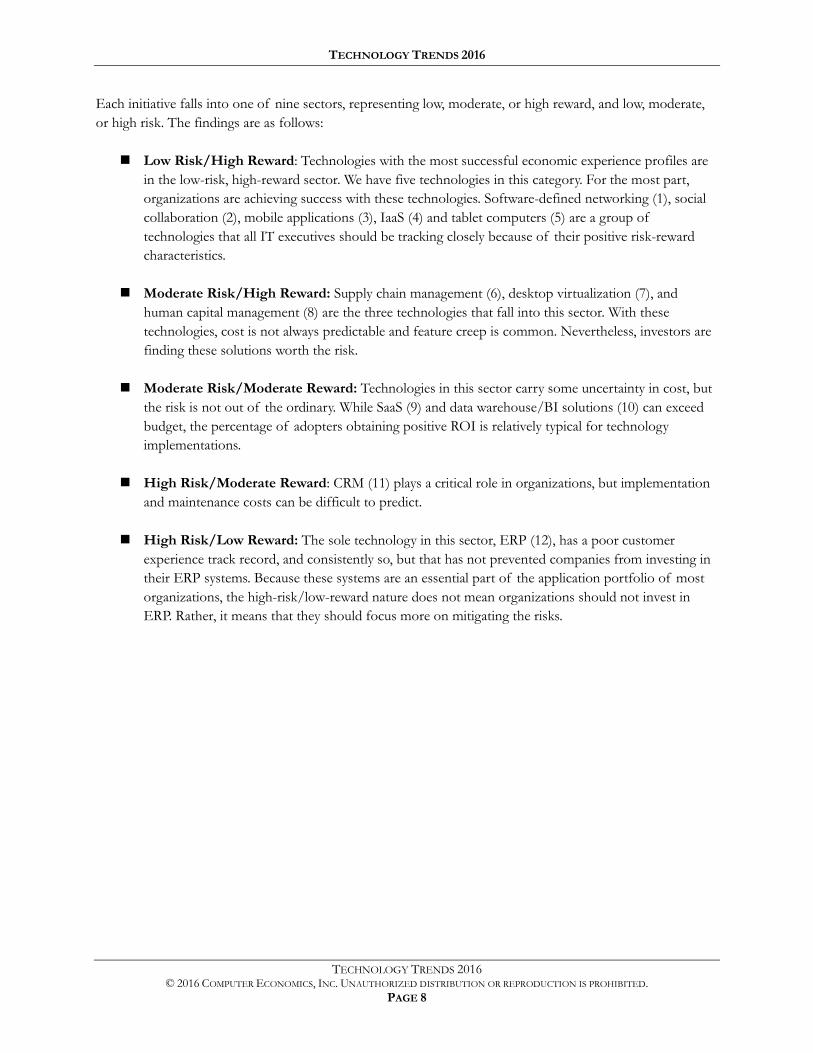
Customer Satisfaction Ratings In our final comparative analysis, Figure 3 shows the scaled satisfaction ratings for the 12 technologies included in our survey. The ratings are based on the percentage of companies saying they are satisfied or very satisfied with their experience with each technology. As with the other charts, the satisfaction ratings are based on a relative scale determined by the highest and lowest values in the survey.
Software-defined networking has the highest satisfaction rating in the study, surpassing other technologies by a wide margin. Our rating comes with a caveat, however. The number of companies that have adopted this technology is small, and the satisfaction level could drop as more companies deploy this cutting-edge data center technology. Two other technologies, IaaS and tablet computers, also gain high satisfaction ratings. While IaaS is also early stage, tablets have become mainstream.
Falling into the moderate range for satisfaction are three fast-growing technologies. SaaS, which is not so much a technology as a deployment option, falls just short of a high rating, putting it among the top performers on this measure. Data warehouse/BI solutions and mobile applications fall further down the list, but still earn a moderate satisfaction rating.
Adopters have lower satisfaction with other technologies in the study based on our relative scale. These technologies include human capital management applications, social business/collaboration systems, CRM solutions, desktop virtualization, and ERP systems. ERP systems, in particular, have a propensity to disappoint.
We present an expanded description of each of these technologies with their individual adoption trend and ROI/TCO profiles in the next two sections.
TECHNOLOGY TRENDS 2016
TECHNOLOGY TRENDS 2016 © 2016 COMPUTER ECONOMICS, INC. UNAUTHORIZED DISTRIBUTION OR REPRODUCTION IS PROHIBITED.
PAGE 10
Enterprise Systems The study includes seven technology initiatives that we place in the category of enterprise systems. They include ERP systems, CRM systems, supply chain management systems, human capital management systems, data warehouse/BI solutions, mobile applications, and social business/collaboration solutions.
In this section, we profile each technology initiative in seven figures as follows:
Adoption and Customer Experience Profile: This figure establishes the context for understanding the metrics. The profile chart shows how each technology compares with other initiatives in the study in adoption rate, investment rate, ROI success rate, and TCO success rate, and overall customer satisfaction.
Stages of Adoption: This figure shows the percentage of organizations at each of five adoption stages. Stage 1 is “no activity.” Organizations studying or piloting technologies fall into the “considering” stage, or stage 2. The implementation stage, stage 3, includes companies that plan to implement an initiative for the first time within the next 18 months. Those at stage 4 have technology in place but show “no further activity” beyond routine maintenance and addition of new users. Organizations at stage 5 have the technology in place and are “increasing” their investment by implementing new features and capabilities.
Adoption and Investment by Organization Size: This chart shows adoption and investment rates by organization size. The adoption rate is the percentage of organizations at stages 4 and 5, with initiatives in place. Investors are organizations at stages 3 and 5, including first-time implementers and those making follow-on investments. We define small organizations as those with from $20 million to less than $350 million in annual revenue, midsize organizations as those with from $350 million to less than $1 billion in revenue, and large organizations as those with at least $1 billion in annual revenue.
Customer Experience with ROI: This figure shows the percentage of adopters that have a return on investment that is positive, break-even, or negative over a two-year period. The ROI success rate is the percentage having positive or break-even ROI.
Customer Experience with TCO: The customer experience with total cost of ownership is measured by the percentage of adopters that find TCO is greater than budgeted, the same as budgeted, or less than budgeted. The cost-success rate is the percentage that experience TCO of less than or the same as the budgeted amount for implementation and ongoing support.
TECHNOLOGY TRENDS 2016
TECHNOLOGY TRENDS 2016 © 2016 COMPUTER ECONOMICS, INC. UNAUTHORIZED DISTRIBUTION OR REPRODUCTION IS PROHIBITED.
PAGE 11
Satisfaction with Customer Experience: We measure overall customer satisfaction by asking adopters to rate their satisfaction with each technology on a five-point scale, from very dissatisfied to very satisfied.
Types of Solutions: This figure shows the percentage of investors that are making an investment or considering investment in each type of solution within the category. We include organizations making follow-on investments and first-time implementations as well as those only considering an investment as being part of the investor population. Respondents can select from among multiple choices.
TECHNOLOGY TRENDS 2016
TECHNOLOGY TRENDS 2016 © 2016 COMPUTER ECONOMICS, INC. UNAUTHORIZED DISTRIBUTION OR REPRODUCTION IS PROHIBITED.
PAGE 12
Enterprise Resource Planning
ERP systems are integrated cross-functional systems that automate back-office business transactions and serve as the system of record for functions such as accounting, sales, human resources management, and operations management. ERP systems today have expanded beyond their roots in manufacturing to support business operations in nearly every industry, including the public sector.
IT investment in ERP—one of the most mature applications in the enterprise—remains strong despite its maturity. ERP investment is being driven by several factors:
The desire for operational improvements is a strong motivation for investment in ERP.
The consolidation of multiple ERP systems drives new ERP investments. Mergers and acquisitions often leave organizations with multiple ERP systems supporting different business units, with duplicate support costs and integration challenges across the enterprise. In such cases, organizations often pick one existing ERP platform as a standard and expand their investment, or they invest in an entirely new ERP platform.
New technology adoption can trigger ERP spending. Areas of investment such as business analytics and mobile applications ultimately arrive back at the ERP platform, which has become a key piece of the software infrastructure that is enabling innovation and process improvement.
Integration of master data and key transactional information can drive new ERP system investment. For example, large and even midsize organizations can have multiple systems that define products, maintain supplier information, or carry sales history. By implementing a common ERP system, the organization can maintain a single source for such critical data.
In short, it is difficult to address ERP as a single, discrete business application. It is an area of ongoing investment and focus for every organization that intends to remain competitive today.
Although ERP is a popular technology for new investment, there are challenges to successful implementation. These have been covered widely, but a few are worth mentioning:
ERP carries a high TCO and many organizations have difficulty staying within budget. ERP implementation costs tend to be underestimated and the ongoing support costs are often exceeded.
Once ERP is implemented, it can be a challenge to remain current on the vendor’s release schedule. Some major version upgrades are, in effect, mini-implementations, requiring a project team and allocation of resources that may be in short supply. Choosing a cloud ERP strategy can mitigate this challenge.
Customer modification of ERP vendor source code makes staying current even more of a challenge, as the customer must retrofit such modifications to the current release. In addition, according to our research, code modifications significantly increase the cost of ongoing support.
TECHNOLOGY TRENDS 2016
TECHNOLOGY TRENDS 2016 © 2016 COMPUTER ECONOMICS, INC. UNAUTHORIZED DISTRIBUTION OR REPRODUCTION IS PROHIBITED.
PAGE 13
Although there has been a consolidation trend among ERP providers over the past decade, there are still many vendors that offer such systems. The high end of the market is dominated by two tier-one providers, SAP AG, which offers its flagship Business Suite that includes ERP, CRM, and a number of other business applications; and Oracle, which offers its E-Business Suite as well as PeopleSoft and JD Edwards suites. In addition, Oracle has introduced its next-generation Fusion line of enterprise applications, which includes ERP, CRM, human capital management, and other categories of business applications.
The midmarket for ERP systems includes a longer list of providers such as Microsoft (with its Dynamics line), Infor, Epicor, IFS, Unit4, Sage, QAD, Exact, Aptean, and Syspro. When niche industry ERP solutions are added, the list grows to dozens or scores of providers.
While ERP is a mature technology, the rise of cloud-based ERP, where ERP systems are offered under a multitenant SaaS model, is changing the landscape. NetSuite and Plex are two established players in this category, but others are moving in quickly, including Workday; Intacct; Acumatica, and offerings built on Salesforce.com’s cloud platform, including FinancialForce, Rootstock, Kenandy, AscentERP, and others. A number of smaller cloud-based systems also are gaining market share. In addition, established players such as Microsoft, Oracle, Epicor, Unit4, and others are offering cloud-based versions of their on-premises offerings.
TECHNOLOGY TRENDS 2016
TECHNOLOGY TRENDS 2016 © 2016 COMPUTER ECONOMICS, INC. UNAUTHORIZED DISTRIBUTION OR REPRODUCTION IS PROHIBITED.
PAGE 14
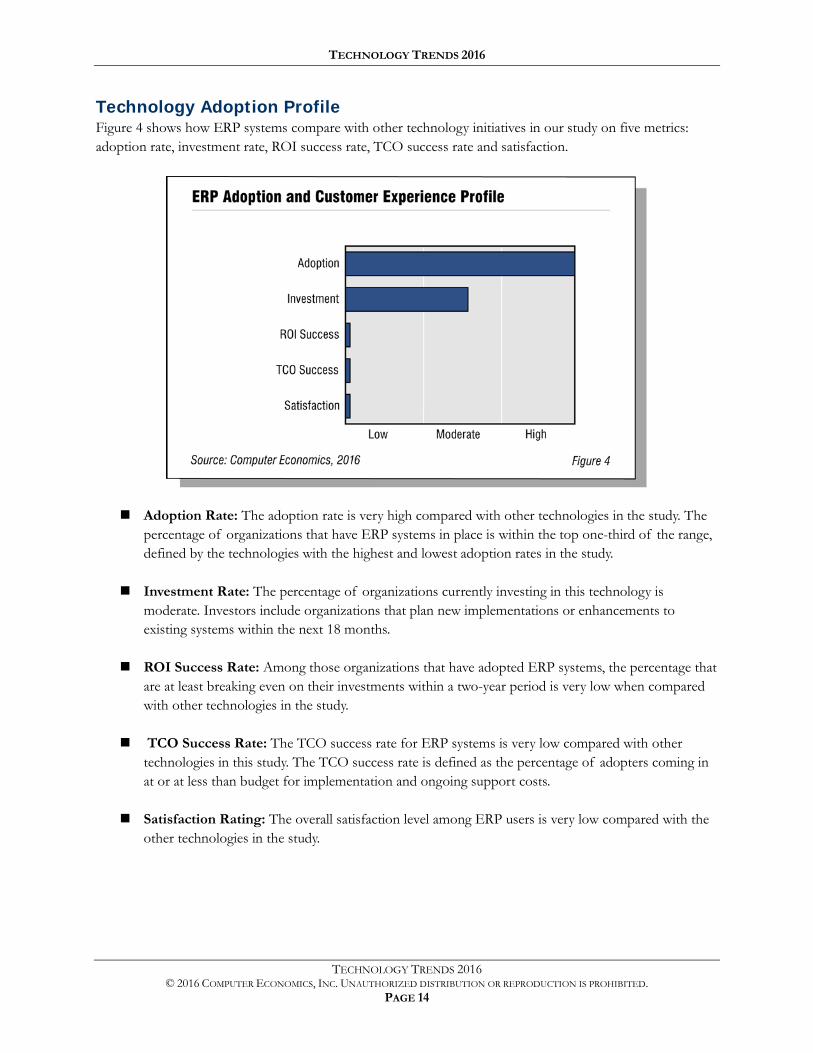
Technology Adoption Profile Figure 4 shows how ERP systems compare with other technology initiatives in our study on five metrics: adoption rate, investment rate, ROI success rate, TCO success rate and satisfaction.
Adoption Rate: The adoption rate is very high compared with other technologies in the study. The percentage of organizations that have ERP systems in place is within the top one-third of the range, defined by the technologies with the highest and lowest adoption rates in the study.
Investment Rate: The percentage of organizations currently investing in this technology is moderate. Investors include organizations that plan new implementations or enhancements to existing systems within the next 18 months.
ROI Success Rate: Among those organizations that have adopted ERP systems, the percentage that are at least breaking even on their investments within a two-year period is very low when compared with other technologies in the study.
TCO Success Rate: The TCO success rate for ERP systems is very low compared with other technologies in this study. The TCO success rate is defined as the percentage of adopters coming in at or at less than budget for implementation and ongoing support costs.
Satisfaction Rating: The overall satisfaction level among ERP users is very low compared with the other technologies in the study.
TECHNOLOGY TRENDS 2016
TECHNOLOGY TRENDS 2016 © 2016 COMPUTER ECONOMICS, INC. UNAUTHORIZED DISTRIBUTION OR REPRODUCTION IS PROHIBITED.
PAGE 15
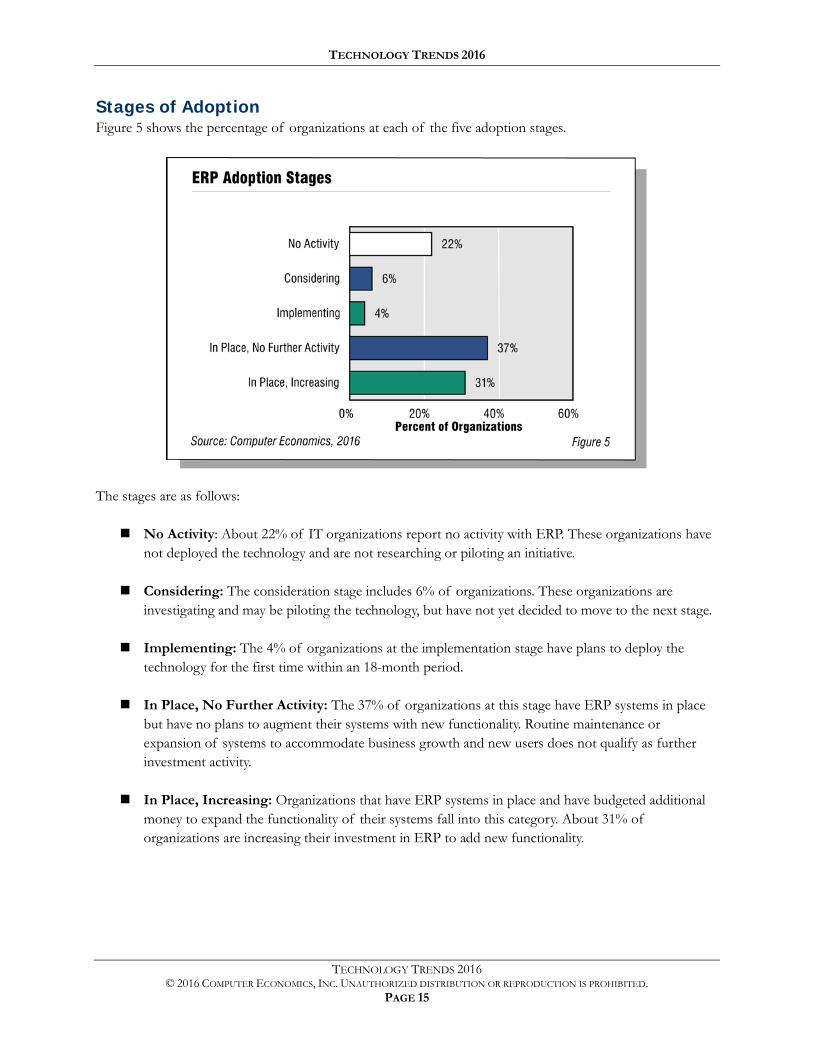
Stages of Adoption Figure 5 shows the percentage of organizations at each of the five adoption stages.
The stages are as follows:
No Activity: About 22% of IT organizations report no activity with ERP. These organizations have not deployed the technology and are not researching or piloting an initiative.
Considering: The consideration stage includes 6% of organizations. These organizations are investigating and may be piloting the technology, but have not yet decided to move to the next stage.
Implementing: The 4% of organizations at the implementation stage have plans to deploy the technology for the first time within an 18-month period.
In Place, No Further Activity: The 37% of organizations at this stage have ERP systems in place but have no plans to augment their systems with new functionality. Routine maintenance or expansion of systems to accommodate business growth and new users does not qualify as further investment activity.
In Place, Increasing: Organizations that have ERP systems in place and have budgeted additional money to expand the functionality of their systems fall into this category. About 31% of organizations are increasing their investment in ERP to add new functionality.
TECHNOLOGY TRENDS 2016
TECHNOLOGY TRENDS 2016 © 2016 COMPUTER ECONOMICS, INC. UNAUTHORIZED DISTRIBUTION OR REPRODUCTION IS PROHIBITED.
PAGE 16
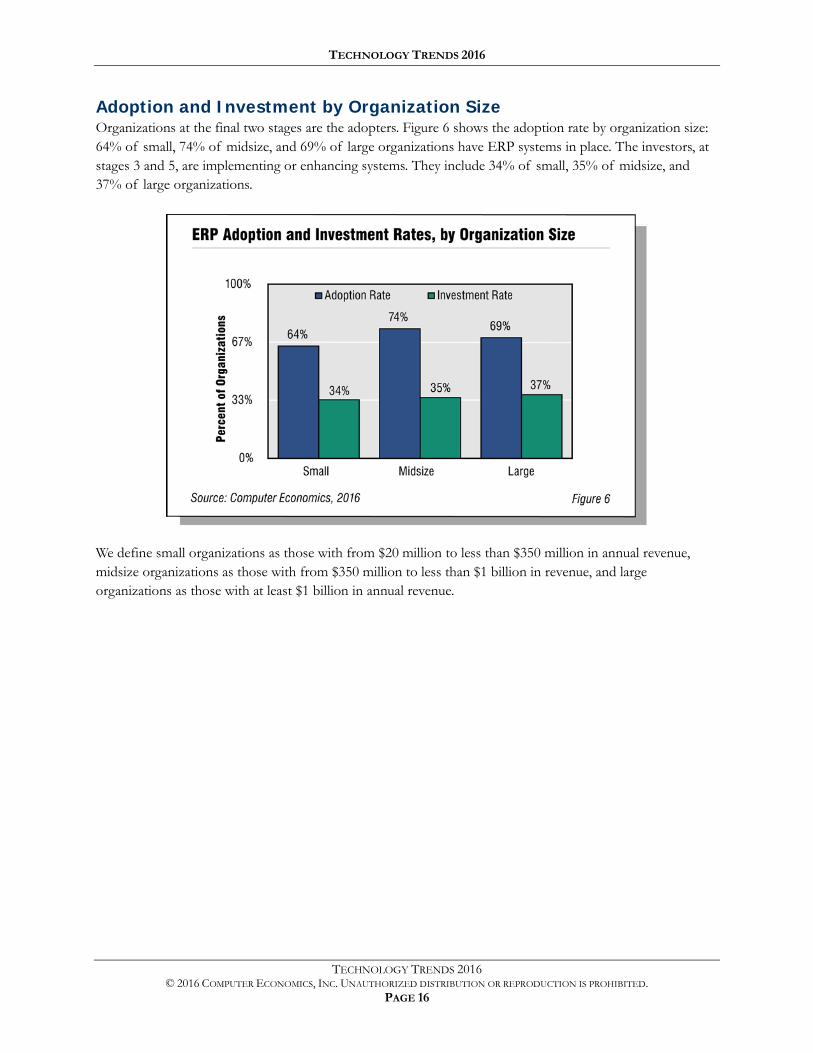
Adoption and Investment by Organization Size Organizations at the final two stages are the adopters. Figure 6 shows the adoption rate by organization size: 64% of small, 74% of midsize, and 69% of large organizations have ERP systems in place. The investors, at stages 3 and 5, are implementing or enhancing systems. They include 34% of small, 35% of midsize, and 37% of large organizations.
We define small organizations as those with from $20 million to less than $350 million in annual revenue, midsize organizations as those with from $350 million to less than $1 billion in revenue, and large organizations as those with at least $1 billion in annual revenue.
TECHNOLOGY TRENDS 2016
TECHNOLOGY TRENDS 2016 © 2016 COMPUTER ECONOMICS, INC. UNAUTHORIZED DISTRIBUTION OR REPRODUCTION IS PROHIBITED.
PAGE 17
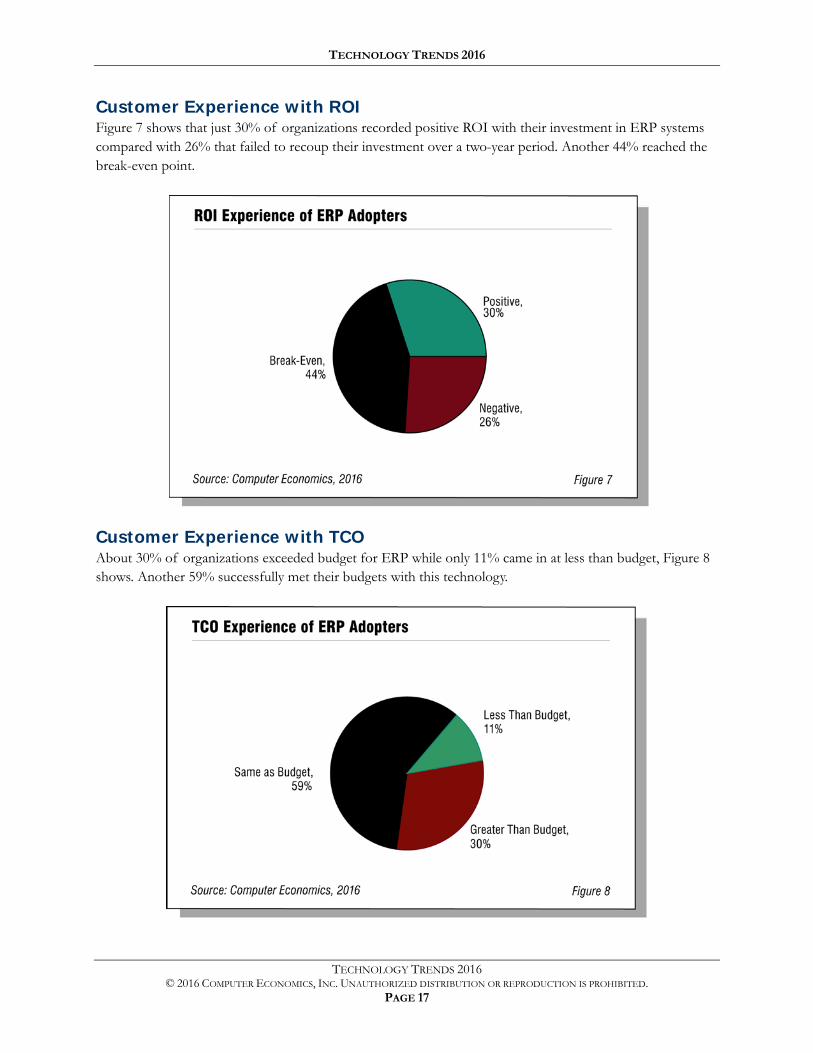
Customer Experience with ROI Figure 7 shows that just 30% of organizations recorded positive ROI with their investment in ERP systems compared with 26% that failed to recoup their investment over a two-year period. Another 44% reached the break-even point.
Customer Experience with TCO About 30% of organizations exceeded budget for ERP while only 11% came in at less than budget, Figure 8 shows. Another 59% successfully met their budgets with this technology.
TECHNOLOGY TRENDS 2016
TECHNOLOGY TRENDS 2016 © 2016 COMPUTER ECONOMICS, INC. UNAUTHORIZED DISTRIBUTION OR REPRODUCTION IS PROHIBITED.
PAGE 18
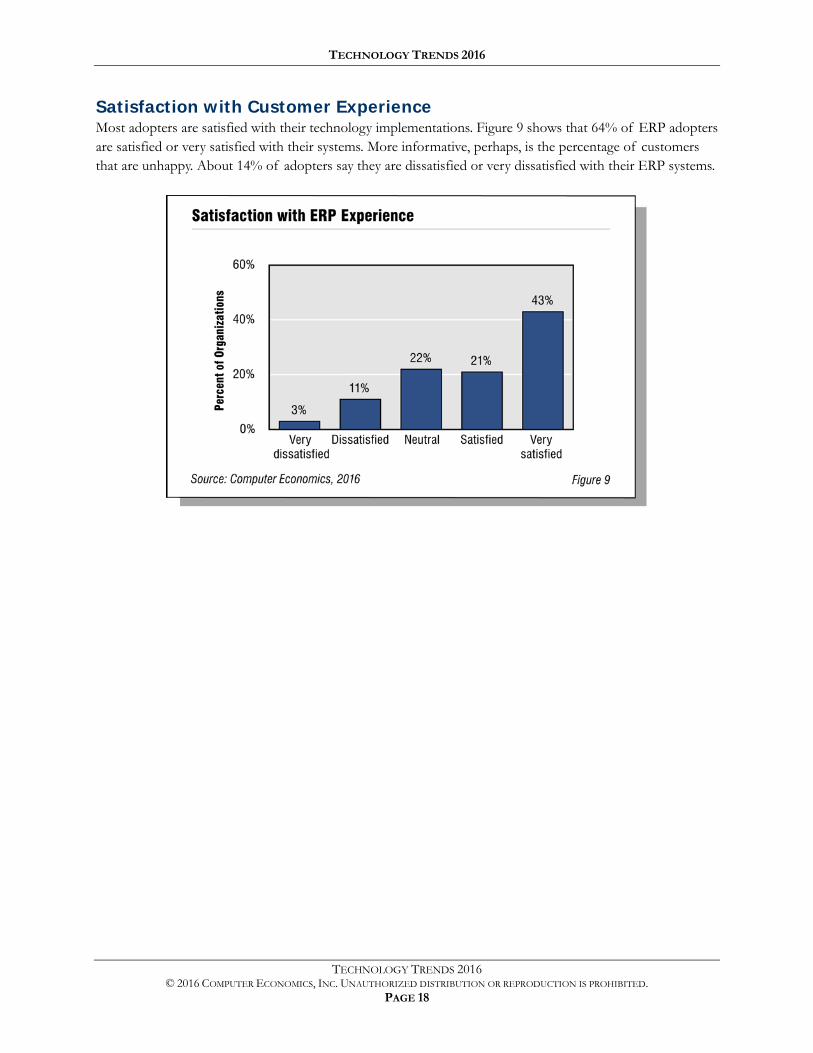
Satisfaction with Customer Experience Most adopters are satisfied with their technology implementations. Figure 9 shows that 64% of ERP adopters are satisfied or very satisfied with their systems. More informative, perhaps, is the percentage of customers that are unhappy. About 14% of adopters say they are dissatisfied or very dissatisfied with their ERP systems.
TECHNOLOGY TRENDS 2016
TECHNOLOGY TRENDS 2016 © 2016 COMPUTER ECONOMICS, INC. UNAUTHORIZED DISTRIBUTION OR REPRODUCTION IS PROHIBITED.
PAGE 19
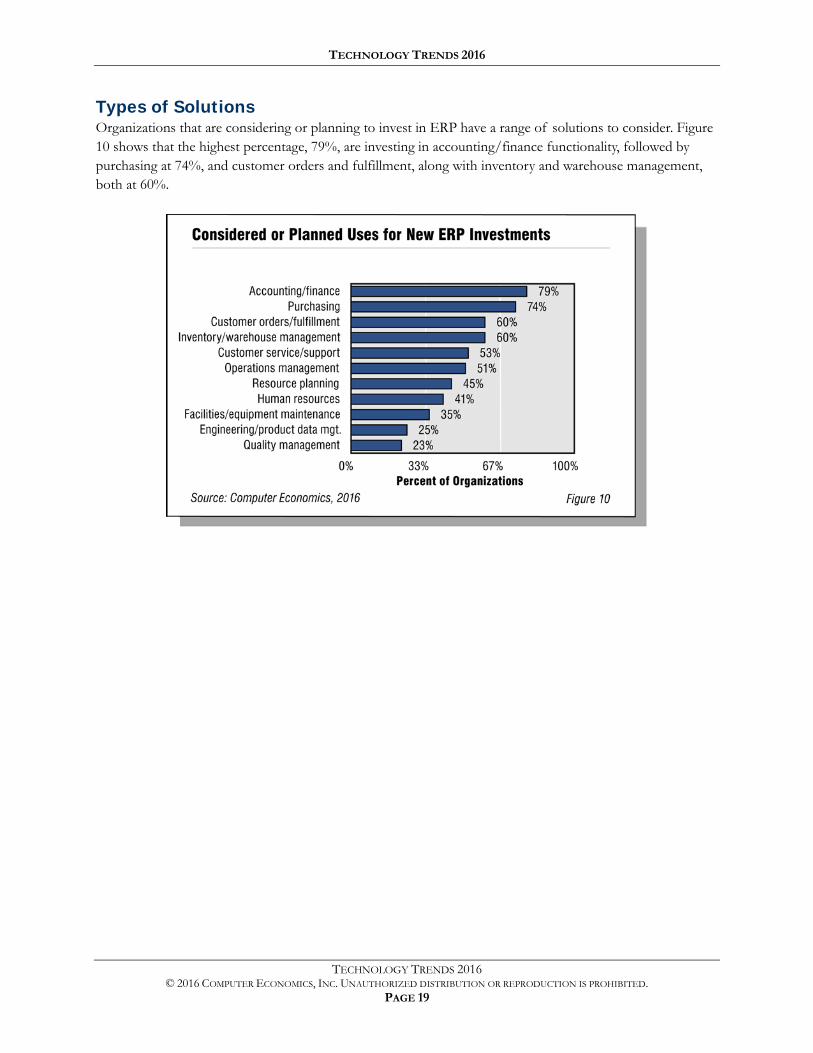
Types of Solutions Organizations that are considering or planning to invest in ERP have a range of solutions to consider. Figure 10 shows that the highest percentage, 79%, are investing in accounting/finance functionality, followed by purchasing at 74%, and customer orders and fulfillment, along with inventory and warehouse management, both at 60%.
TECHNOLOGY TRENDS 2016
TECHNOLOGY TRENDS 2016 © 2016 COMPUTER ECONOMICS, INC. UNAUTHORIZED DISTRIBUTION OR REPRODUCTION IS PROHIBITED.
PAGE 20
Customer Relationship Management
CRM systems are customer-facing systems that coordinate and manage customer activities. They typically include functions such as marketing automation, sales-force automation, customer quoting, call center management and customer support, field service operations, and other systems that directly support customer service and support.
Although these business functions have been served by computer systems for decades, the moniker “CRM” came into popular use in the 1990s as an umbrella term to encompass all of these customer-facing systems. Today, CRM systems are one of the most widely adopted categories of enterprise applications. Widespread adoption of CRM systems is being driven by a number of factors:
In every economic environment, system investments that have a positive effect on top-line sales growth are attractive. CRM systems—which automate and support sales processes—allow sales personnel to devote less time to administrative and reporting activities, freeing time to devote to selling. As a result, organizations perceive CRM as increasing sales per sales representative.
CRM systems also fulfill strategic objectives beyond sales-force automation. Organizations view customer knowledge as a key requirement for business success. By centralizing and organizing all information about customers and their previous interactions with the organization, CRM systems lead to greater upsell and cross-sell opportunities, better segmentation of the organization’s most profitable customers, and a better overall customer experience. New CRM capabilities also enable improvements in customer service such as self-service, knowledge management, and community enablement, leading to higher quality and lower cost of support and improved customer satisfaction.
New technologies also are driving adoption of CRM. For example, digital commerce such as email marketing, web stores, and location-based services generate enormous amounts of customer information that need to be integrated with data from traditional channels to provide a complete view of customers and prospects. The popularity of social media also is driving new requirements for CRM such as the ability to capture customer and prospect interactions taking place via Facebook, Twitter, and other social media. Organizations also are using social channels to deliver customer service and support.
With the proliferation of new technologies, customer expectations are rising. Customers expect businesses that they deal with to know who they are at the point of engagement and not require them to provide information they have previously submitted, whether in-person, by phone, fax, email, web, or social media.
Not only are customer expectations rising, CRM user expectations are increasing as well. First-generation CRM systems were limited to desktop user interfaces, often in a client/server architecture. CRM users, on the other hand, are often on the road, in hotel rooms and airports, or on-site with customers, where it can be difficult to get to a computer or a network connection. With many sales, customer service, and managerial personnel now carrying smartphones or tablet computers, these users are asking why they cannot interact with CRM systems via such devices.
TECHNOLOGY TRENDS 2016
TECHNOLOGY TRENDS 2016 © 2016 COMPUTER ECONOMICS, INC. UNAUTHORIZED DISTRIBUTION OR REPRODUCTION IS PROHIBITED.
PAGE 21
While customer and internal user expectations mandate investment in CRM, adoption also is encouraged by a wealth of new CRM system capabilities. Over the past decade, many ERP providers, including Oracle and SAP, have built CRM capabilities into their existing product portfolios, making it easy for their customers to integrate CRM with their existing ERP implementations. Midmarket players such as Microsoft, Infor, Epicor, Unit4, IFS, Consona, Sage, Exact, and others have followed suit, making CRM capabilities achievable for smaller companies. Most of these vendors have added or are adding support for mobile devices.
Finally, new cloud-based CRM systems from providers such as Salesforce.com, NetSuite, Microsoft, SugarCRM, RightNow (acquired by Oracle), and others are raising the bar in ease of use and rapid implementation. These systems make CRM attractive to an even wider variety of organizations in contrast to first-generation CRM systems such as Siebel, which carried substantial support requirements. CRM is an attractive use case for cloud computing, as its web-based technology allows organizations to easily deploy CRM outside the organization’s firewall for mobile workers. Major enterprise application vendors such as SAP and Oracle have responded with their own cloud-based CRM offerings, further accelerating the trend to cloud CRM.
TECHNOLOGY TRENDS 2016
TECHNOLOGY TRENDS 2016 © 2016 COMPUTER ECONOMICS, INC. UNAUTHORIZED DISTRIBUTION OR REPRODUCTION IS PROHIBITED.
PAGE 22
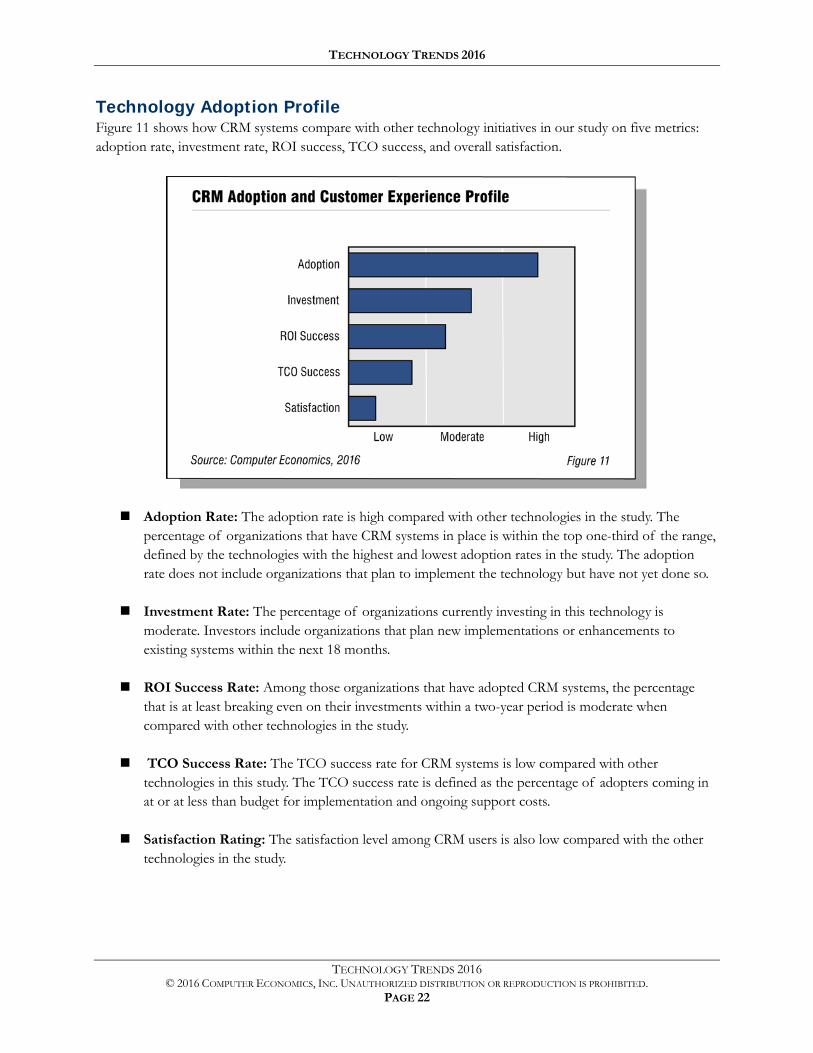
Technology Adoption Profile Figure 11 shows how CRM systems compare with other technology initiatives in our study on five metrics: adoption rate, investment rate, ROI success, TCO success, and overall satisfaction.
Adoption Rate: The adoption rate is high compared with other technologies in the study. The percentage of organizations that have CRM systems in place is within the top one-third of the range, defined by the technologies with the highest and lowest adoption rates in the study. The adoption rate does not include organizations that plan to implement the technology but have not yet done so.
Investment Rate: The percentage of organizations currently investing in this technology is moderate. Investors include organizations that plan new implementations or enhancements to existing systems within the next 18 months.
ROI Success Rate: Among those organizations that have adopted CRM systems, the percentage that is at least breaking even on their investments within a two-year period is moderate when compared with other technologies in the study.
TCO Success Rate: The TCO success rate for CRM systems is low compared with other technologies in this study. The TCO success rate is defined as the percentage of adopters coming in at or at less than budget for implementation and ongoing support costs.
Satisfaction Rating: The satisfaction level among CRM users is also low compared with the other technologies in the study.
TECHNOLOGY TRENDS 2016
TECHNOLOGY TRENDS 2016 © 2016 COMPUTER ECONOMICS, INC. UNAUTHORIZED DISTRIBUTION OR REPRODUCTION IS PROHIBITED.
PAGE 23
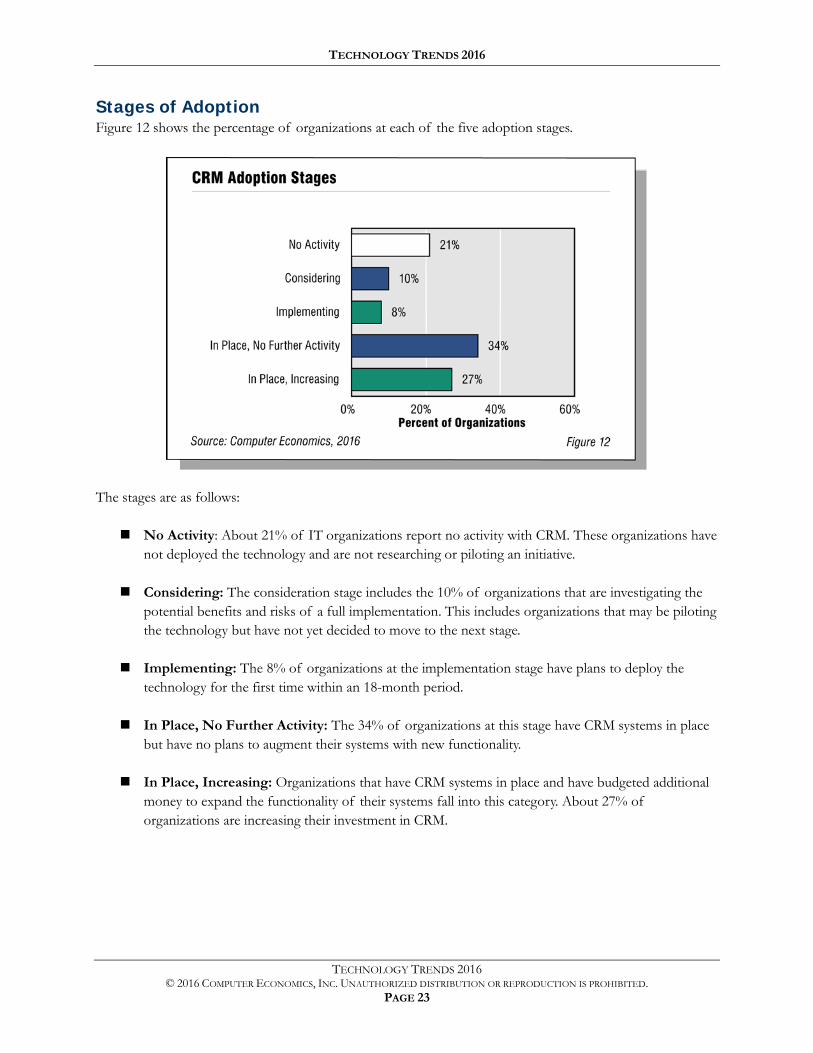
Stages of Adoption Figure 12 shows the percentage of organizations at each of the five adoption stages.
The stages are as follows:
No Activity: About 21% of IT organizations report no activity with CRM. These organizations have not deployed the technology and are not researching or piloting an initiative.
Considering: The consideration stage includes the 10% of organizations that are investigating the potential benefits and risks of a full implementation. This includes organizations that may be piloting the technology but have not yet decided to move to the next stage.
Implementing: The 8% of organizations at the implementation stage have plans to deploy the technology for the first time within an 18-month period.
In Place, No Further Activity: The 34% of organizations at this stage have CRM systems in place but have no plans to augment their systems with new functionality.
In Place, Increasing: Organizations that have CRM systems in place and have budgeted additional money to expand the functionality of their systems fall into this category. About 27% of organizations are increasing their investment in CRM.
TECHNOLOGY TRENDS 2016
TECHNOLOGY TRENDS 2016 © 2016 COMPUTER ECONOMICS, INC. UNAUTHORIZED DISTRIBUTION OR REPRODUCTION IS PROHIBITED.
PAGE 24
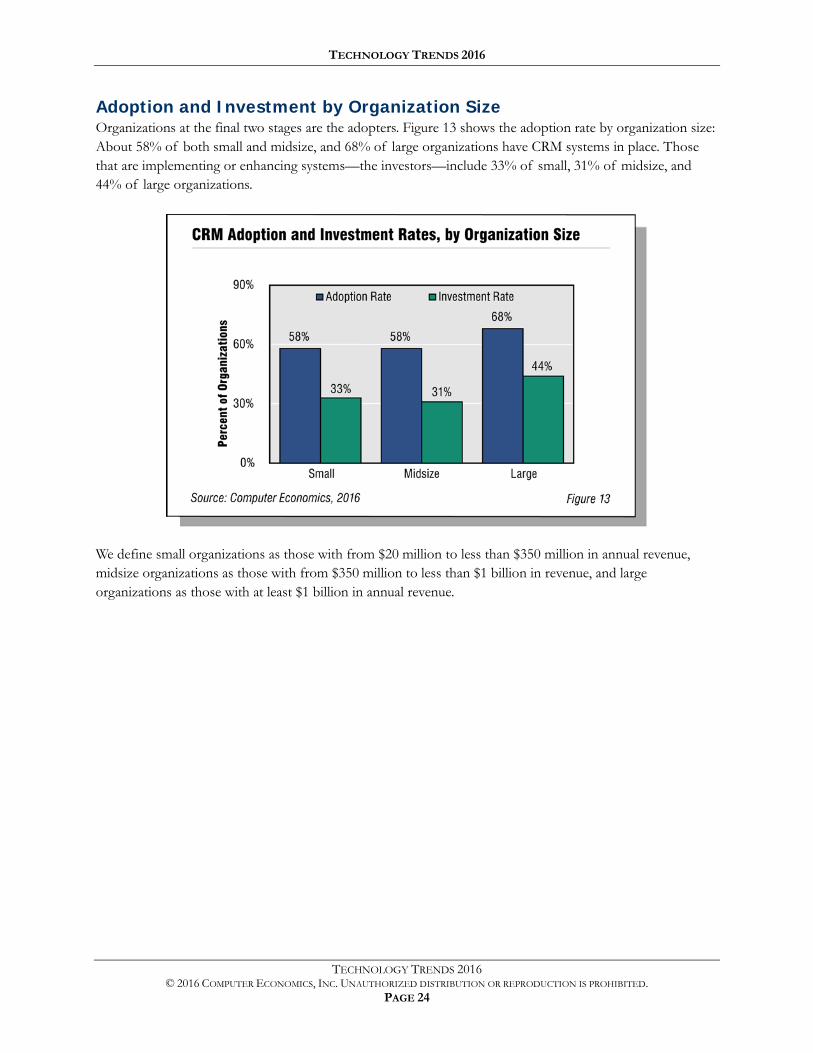
Adoption and Investment by Organization Size Organizations at the final two stages are the adopters. Figure 13 shows the adoption rate by organization size: About 58% of both small and midsize, and 68% of large organizations have CRM systems in place. Those that are implementing or enhancing systems—the investors—include 33% of small, 31% of midsize, and 44% of large organizations.
We define small organizations as those with from $20 million to less than $350 million in annual revenue, midsize organizations as those with from $350 million to less than $1 billion in revenue, and large organizations as those with at least $1 billion in annual revenue.
TECHNOLOGY TRENDS 2016
TECHNOLOGY TRENDS 2016 © 2016 COMPUTER ECONOMICS, INC. UNAUTHORIZED DISTRIBUTION OR REPRODUCTION IS PROHIBITED.
PAGE 25
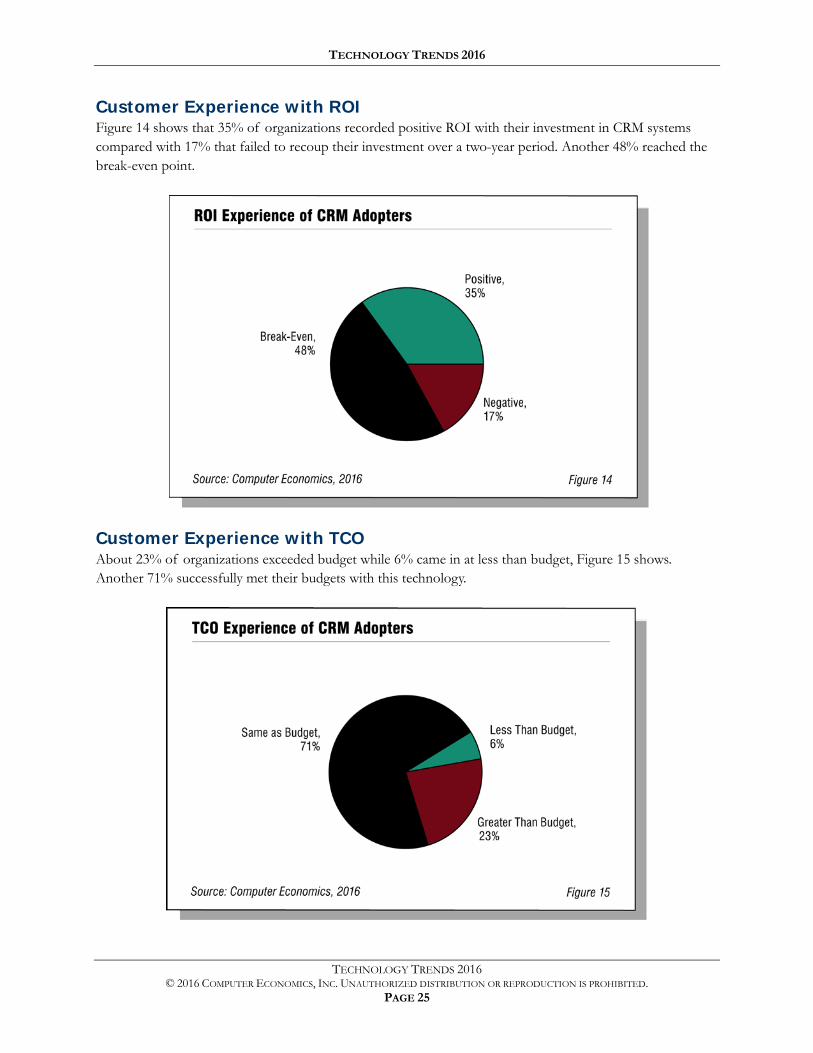
Customer Experience with ROI Figure 14 shows that 35% of organizations recorded positive ROI with their investment in CRM systems compared with 17% that failed to recoup their investment over a two-year period. Another 48% reached the break-even point.
Customer Experience with TCO About 23% of organizations exceeded budget while 6% came in at less than budget, Figure 15 shows. Another 71% successfully met their budgets with this technology.
TECHNOLOGY TRENDS 2016
TECHNOLOGY TRENDS 2016 © 2016 COMPUTER ECONOMICS, INC. UNAUTHORIZED DISTRIBUTION OR REPRODUCTION IS PROHIBITED.
PAGE 26
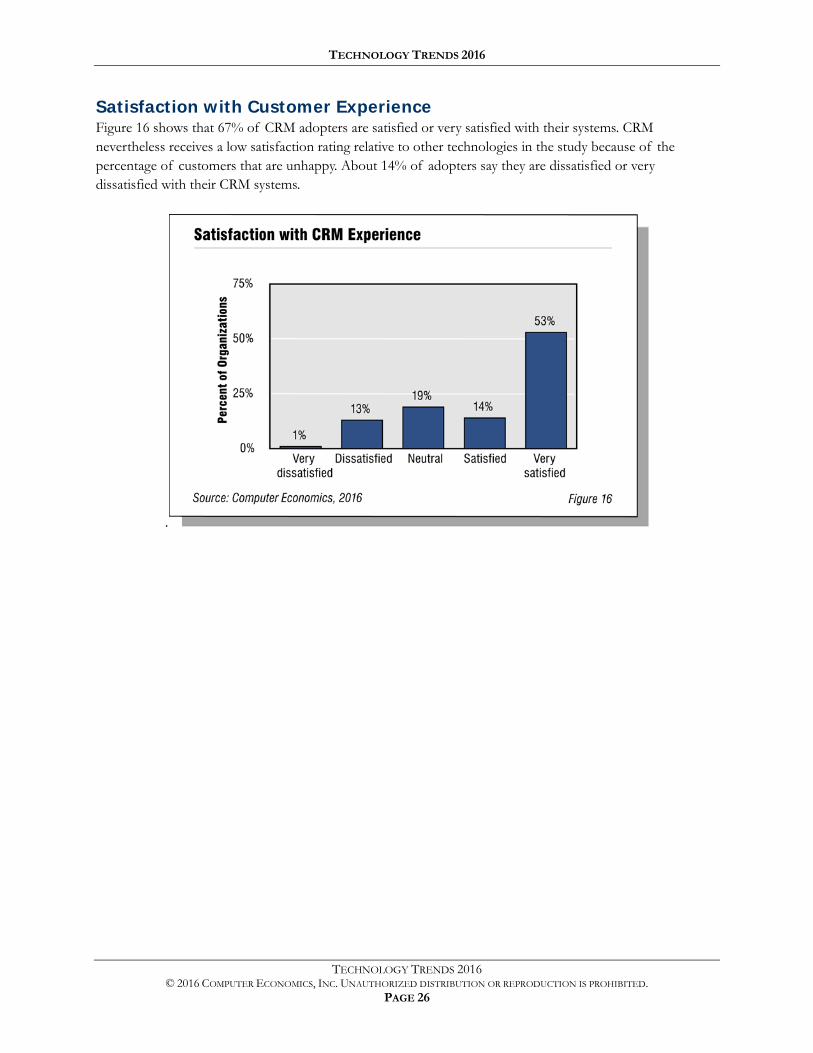
Satisfaction with Customer Experience Figure 16 shows that 67% of CRM adopters are satisfied or very satisfied with their systems. CRM nevertheless receives a low satisfaction rating relative to other technologies in the study because of the percentage of customers that are unhappy. About 14% of adopters say they are dissatisfied or very dissatisfied with their CRM systems.
.
TECHNOLOGY TRENDS 2016
TECHNOLOGY TRENDS 2016 © 2016 COMPUTER ECONOMICS, INC. UNAUTHORIZED DISTRIBUTION OR REPRODUCTION IS PROHIBITED.
PAGE 27
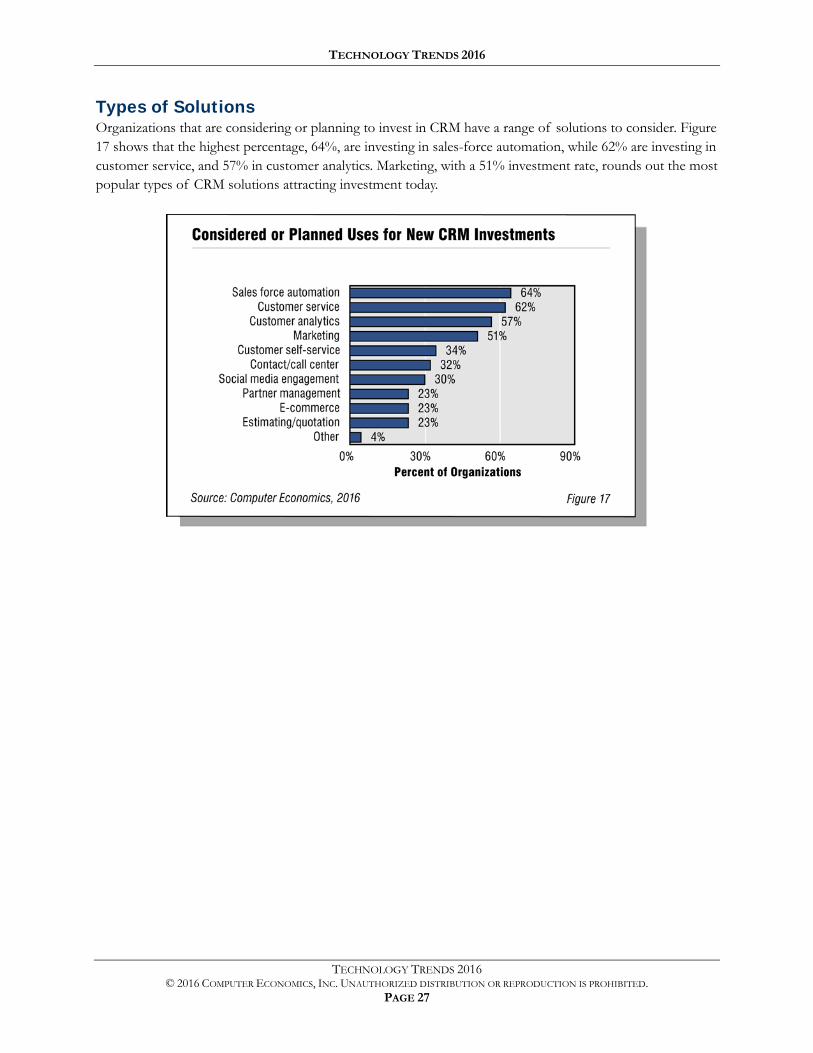
Types of Solutions Organizations that are considering or planning to invest in CRM have a range of solutions to consider. Figure 17 shows that the highest percentage, 64%, are investing in sales-force automation, while 62% are investing in customer service, and 57% in customer analytics. Marketing, with a 51% investment rate, rounds out the most popular types of CRM solutions attracting investment today.
TECHNOLOGY TRENDS 2016
TECHNOLOGY TRENDS 2016 © 2016 COMPUTER ECONOMICS, INC. UNAUTHORIZED DISTRIBUTION OR REPRODUCTION IS PROHIBITED.
PAGE 28
Supply Chain Management
Supply chain management systems manage the planning, movement, and storage of materials from the earliest stages of procurement through intermediate stages of production to final distribution to the end customer.
Supply chain management systems encompass two main subcategories: supply chain planning systems, which support planning of supply and demand, and supply chain execution systems, which carry out those plans on a day-to-day or hour-by-hour basis and react to changes, events, or disruptions. Supply chain management functionality includes systems for sales and operations planning, advanced planning and optimization, warehouse management, transportation management, global trade management, product data synchronization, supplier relationship management, supply chain visibility and analytics, and fleet management.
Supply chain planning systems often incorporate concepts and techniques such as predictive analytics, rapid simulation, in-memory computing, theory of constraints, and linear programming. Supply chain execution systems can incorporate a number of technologies, such as bar coding, radio-frequency identification (RFID), conveyor systems, warehouse automation, automated material handling systems, robotics, global positioning systems, and various machine-to-machine communication systems.
Whereas ERP systems focus primarily on the internal operations of the business, supply chain management looks outward to encompass the activities of suppliers, customers, and partners, as well as internally to the movement and storage of materials within the organization’s operations.
The fundamentals of supply chain management have been known and practiced for decades. Early in the development of material requirements systems, practitioners saw the need to extend the concept into distribution. This led to the development of distribution requirements planning systems in the 1970s. Through the 1980s and 1990s, supply chain management systems continued to evolve with development of systems for sales forecasting and demand planning, advanced warehouse management, and sales and operations planning. The term “supply chain management” first gained a foothold in the mid-1990s to encompass all these disciplines.
Today, the rise of global supply chains and energy-driven transportation costs are providing renewed impetus for adoption. Manufacturers and distributors cannot compete without the visibility into their increasingly complex supply chains, driven in part by the increasing use of contract manufacturers in overseas locations. The cost savings in offshore manufacturing can quickly be lost if transportation and inventory costs skyrocket because of an inability to plan material and resource requirements over long lead times. Supply chain systems, therefore, are a necessity in today’s global economy.
Organizations that have successfully implemented supply chain systems enjoy a number of benefits, including:
Lower inventory levels and improved order fill rates
Ability to respond more quickly to supply disruption or changes in customer demand
TECHNOLOGY TRENDS 2016
TECHNOLOGY TRENDS 2016 © 2016 COMPUTER ECONOMICS, INC. UNAUTHORIZED DISTRIBUTION OR REPRODUCTION IS PROHIBITED.
PAGE 29
Shorter customer order lead times due to better replenishment planning, allowing the organization to compete on delivery times
Better utilization of assets such as warehouse space and transportation fleet equipment, which leads to a reduction in working capital
On the other hand, supply chain systems are complex applications, and organizations seeking to implement them often face challenges. In a complex supply chain, it is unusual to have all the information needed for supply chain management in a single system, necessitating the complex integration of information from disparate systems internally and externally with customers and suppliers. In addition, supply chain professionals—those who know how to manage complex supply and demand plans and the software that supports them—are in short supply. Finally, supply chain systems can be complex undertakings, and the total cost of implementation and ongoing support can exceed budget.
TECHNOLOGY TRENDS 2016
TECHNOLOGY TRENDS 2016 © 2016 COMPUTER ECONOMICS, INC. UNAUTHORIZED DISTRIBUTION OR REPRODUCTION IS PROHIBITED.
PAGE 30
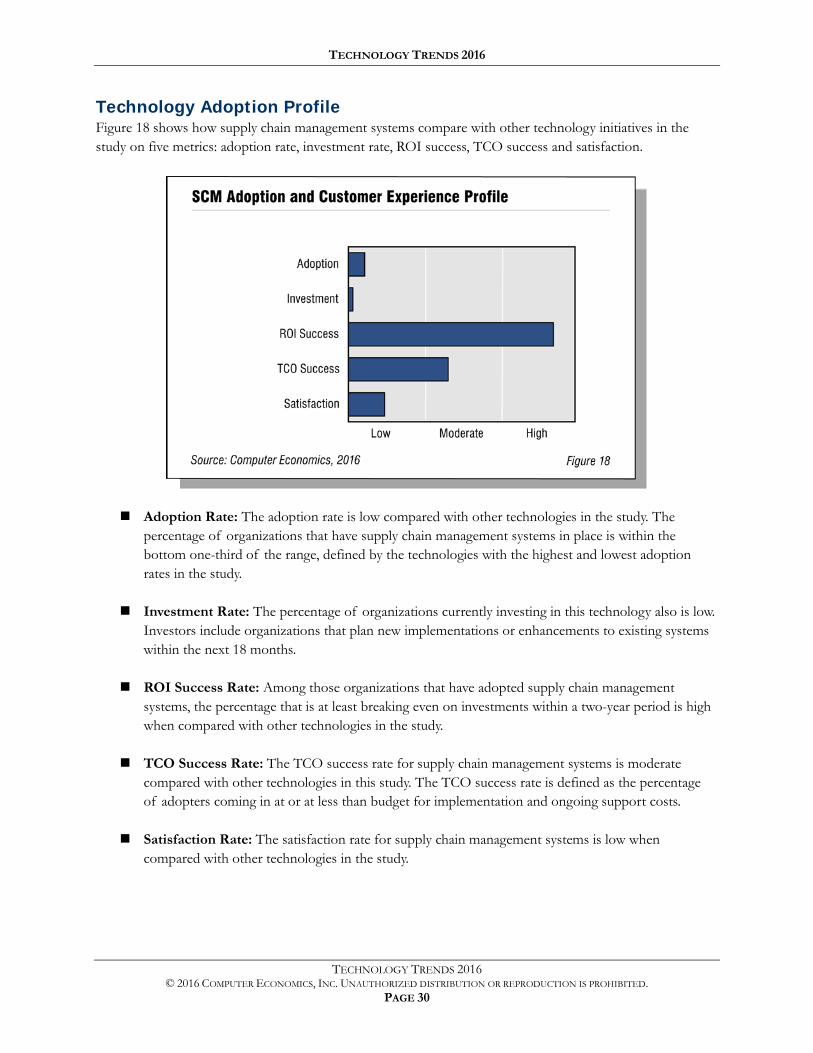
Technology Adoption Profile Figure 18 shows how supply chain management systems compare with other technology initiatives in the study on five metrics: adoption rate, investment rate, ROI success, TCO success and satisfaction.
Adoption Rate: The adoption rate is low compared with other technologies in the study. The percentage of organizations that have supply chain management systems in place is within the bottom one-third of the range, defined by the technologies with the highest and lowest adoption rates in the study.
Investment Rate: The percentage of organizations currently investing in this technology also is low. Investors include organizations that plan new implementations or enhancements to existing systems within the next 18 months.
ROI Success Rate: Among those organizations that have adopted supply chain management systems, the percentage that is at least breaking even on investments within a two-year period is high when compared with other technologies in the study.
TCO Success Rate: The TCO success rate for supply chain management systems is moderate compared with other technologies in this study. The TCO success rate is defined as the percentage of adopters coming in at or at less than budget for implementation and ongoing support costs.
Satisfaction Rate: The satisfaction rate for supply chain management systems is low when compared with other technologies in the study.
TECHNOLOGY TRENDS 2016
TECHNOLOGY TRENDS 2016 © 2016 COMPUTER ECONOMICS, INC. UNAUTHORIZED DISTRIBUTION OR REPRODUCTION IS PROHIBITED.
PAGE 31
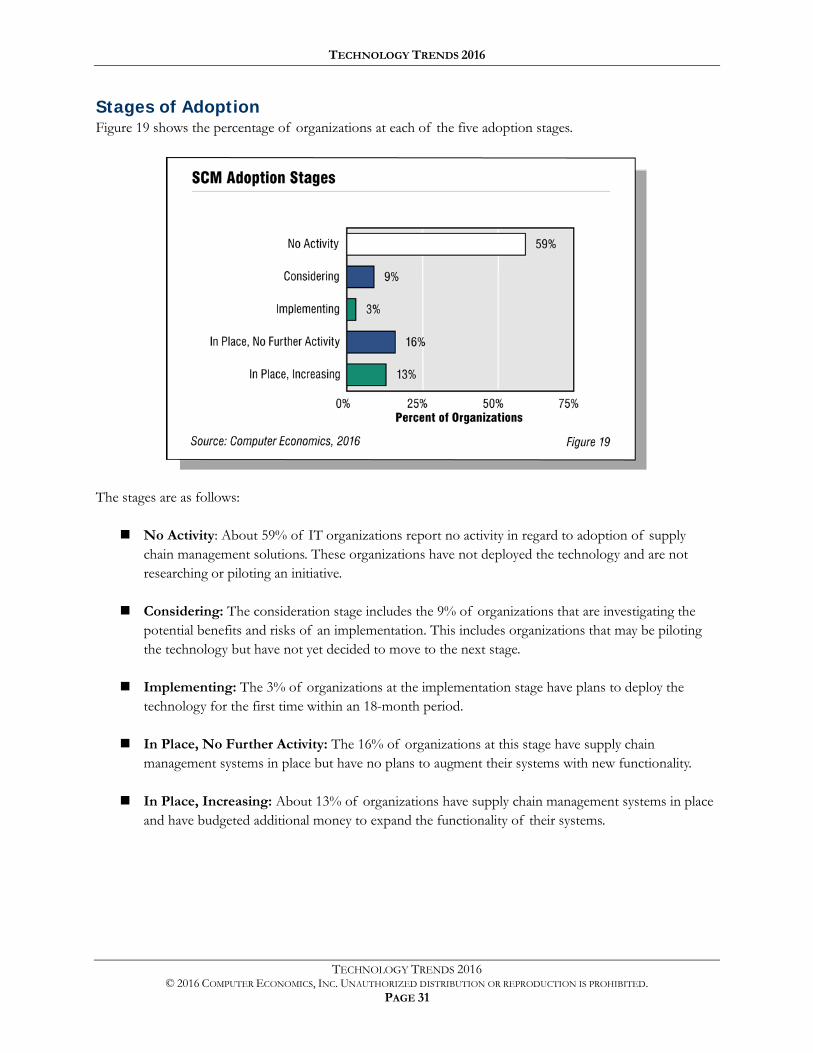
Stages of Adoption Figure 19 shows the percentage of organizations at each of the five adoption stages.
The stages are as follows:
No Activity: About 59% of IT organizations report no activity in regard to adoption of supply chain management solutions. These organizations have not deployed the technology and are not researching or piloting an initiative.
Considering: The consideration stage includes the 9% of organizations that are investigating the potential benefits and risks of an implementation. This includes organizations that may be piloting the technology but have not yet decided to move to the next stage.
Implementing: The 3% of organizations at the implementation stage have plans to deploy the technology for the first time within an 18-month period.
In Place, No Further Activity: The 16% of organizations at this stage have supply chain management systems in place but have no plans to augment their systems with new functionality.
In Place, Increasing: About 13% of organizations have supply chain management systems in place and have budgeted additional money to expand the functionality of their systems.
TECHNOLOGY TRENDS 2016
TECHNOLOGY TRENDS 2016 © 2016 COMPUTER ECONOMICS, INC. UNAUTHORIZED DISTRIBUTION OR REPRODUCTION IS PROHIBITED.
PAGE 32
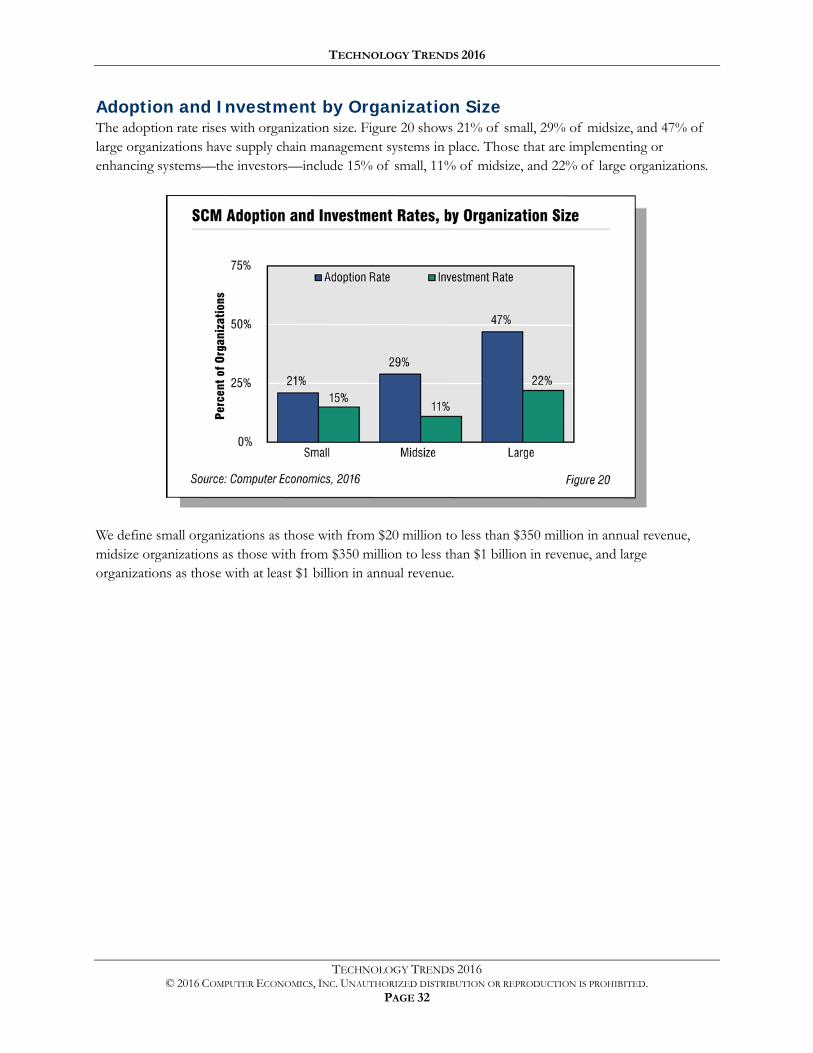
Adoption and Investment by Organization Size The adoption rate rises with organization size. Figure 20 shows 21% of small, 29% of midsize, and 47% of large organizations have supply chain management systems in place. Those that are implementing or enhancing systems—the investors—include 15% of small, 11% of midsize, and 22% of large organizations.
We define small organizations as those with from $20 million to less than $350 million in annual revenue, midsize organizations as those with from $350 million to less than $1 billion in revenue, and large organizations as those with at least $1 billion in annual revenue.
TECHNOLOGY TRENDS 2016
TECHNOLOGY TRENDS 2016 © 2016 COMPUTER ECONOMICS, INC. UNAUTHORIZED DISTRIBUTION OR REPRODUCTION IS PROHIBITED.
PAGE 33
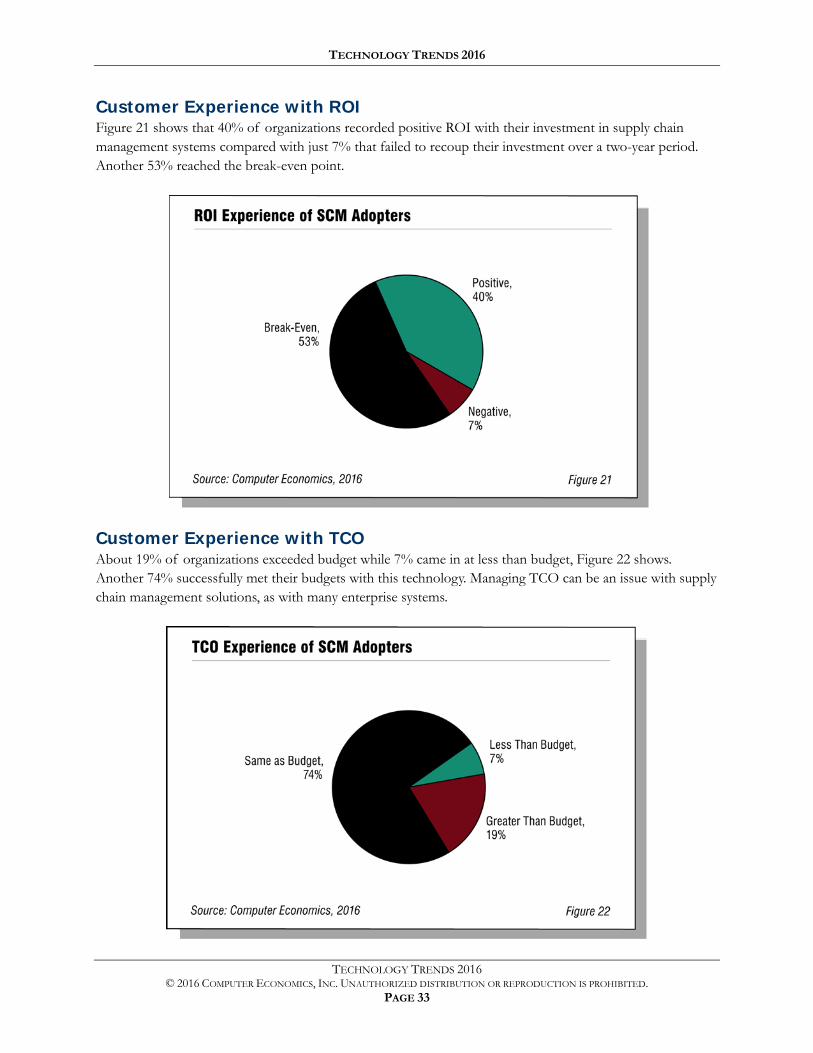
Customer Experience with ROI Figure 21 shows that 40% of organizations recorded positive ROI with their investment in supply chain management systems compared with just 7% that failed to recoup their investment over a two-year period. Another 53% reached the break-even point.
Customer Experience with TCO About 19% of organizations exceeded budget while 7% came in at less than budget, Figure 22 shows. Another 74% successfully met their budgets with this technology. Managing TCO can be an issue with supply chain management solutions, as with many enterprise systems.
TECHNOLOGY TRENDS 2016
TECHNOLOGY TRENDS 2016 © 2016 COMPUTER ECONOMICS, INC. UNAUTHORIZED DISTRIBUTION OR REPRODUCTION IS PROHIBITED.
PAGE 34
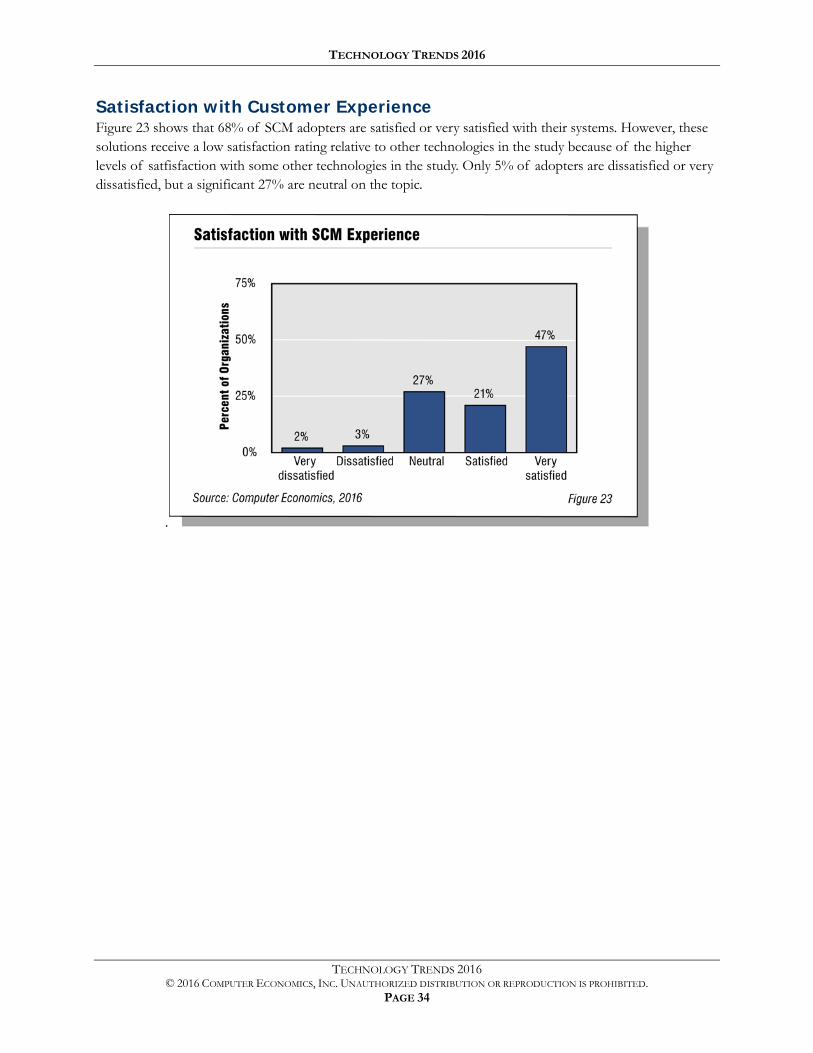
Satisfaction with Customer Experience Figure 23 shows that 68% of SCM adopters are satisfied or very satisfied with their systems. However, these solutions receive a low satisfaction rating relative to other technologies in the study because of the higher levels of satfisfaction with some other technologies in the study. Only 5% of adopters are dissatisfied or very dissatisfied, but a significant 27% are neutral on the topic.
.
TECHNOLOGY TRENDS 2016
TECHNOLOGY TRENDS 2016 © 2016 COMPUTER ECONOMICS, INC. UNAUTHORIZED DISTRIBUTION OR REPRODUCTION IS PROHIBITED.
PAGE 35
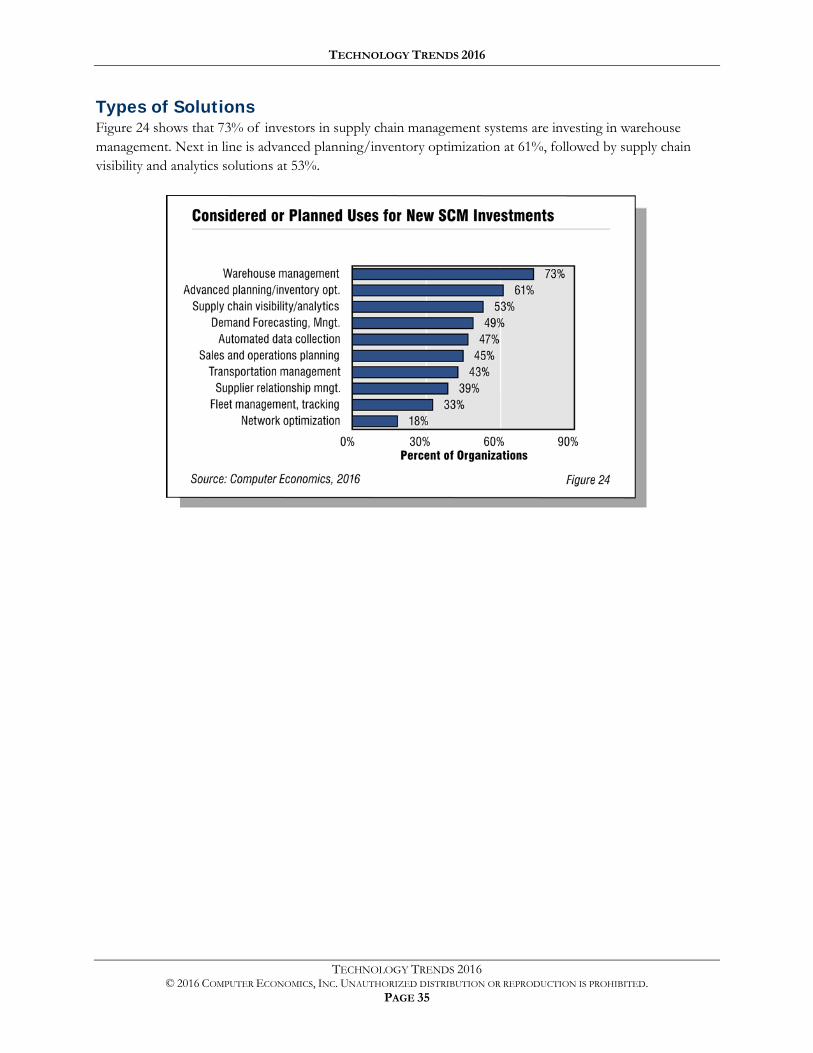
Types of Solutions Figure 24 shows that 73% of investors in supply chain management systems are investing in warehouse management. Next in line is advanced planning/inventory optimization at 61%, followed by supply chain visibility and analytics solutions at 53%.
TECHNOLOGY TRENDS 2016
TECHNOLOGY TRENDS 2016 © 2016 COMPUTER ECONOMICS, INC. UNAUTHORIZED DISTRIBUTION OR REPRODUCTION IS PROHIBITED.
PAGE 36
Human Capital Management
A human capital management system is an integrated suite that serves as the system of record for human resources (employees, contractors, applicants, and other personnel) and supports HR management processes. Human capital management modules include core HR, payroll, workforce management, talent management, learning management, social learning and development, recruiting, workforce analytics, and workforce planning.
Managing human resources is a core aspect of every business organization, and an important driver for investing in human capital management is the realization that optimizing the hiring, training, and managing of human capital is a factor in the success of every business. Leading organizations understand that while best practices can be imitated by competitors, recruiting, developing, and retaining the best people is a sustainable, competitive advantage. Building and maintaining a world-class human capital management system can be an important element in this goal.
Key benefits of human capital management include:
Improved effectiveness in recruiting, retaining, and developing people
Improved productivity for HR-related processes
Ensuring regulatory compliance and risk mitigation
Increased employee satisfaction and retention
While the benefits of a human capital management system are relatively easy to describe, there are at least two major challenges in deployment. First, integrating with other back-office systems can be difficult. Adopting a human capital management system from the same vendor as the organization’s ERP system can facilitate integration, but the best solutions often come from best-of-breed providers. Secondly, unless managed properly, TCO can exceed budget.
TECHNOLOGY TRENDS 2016
TECHNOLOGY TRENDS 2016 © 2016 COMPUTER ECONOMICS, INC. UNAUTHORIZED DISTRIBUTION OR REPRODUCTION IS PROHIBITED.
PAGE 37
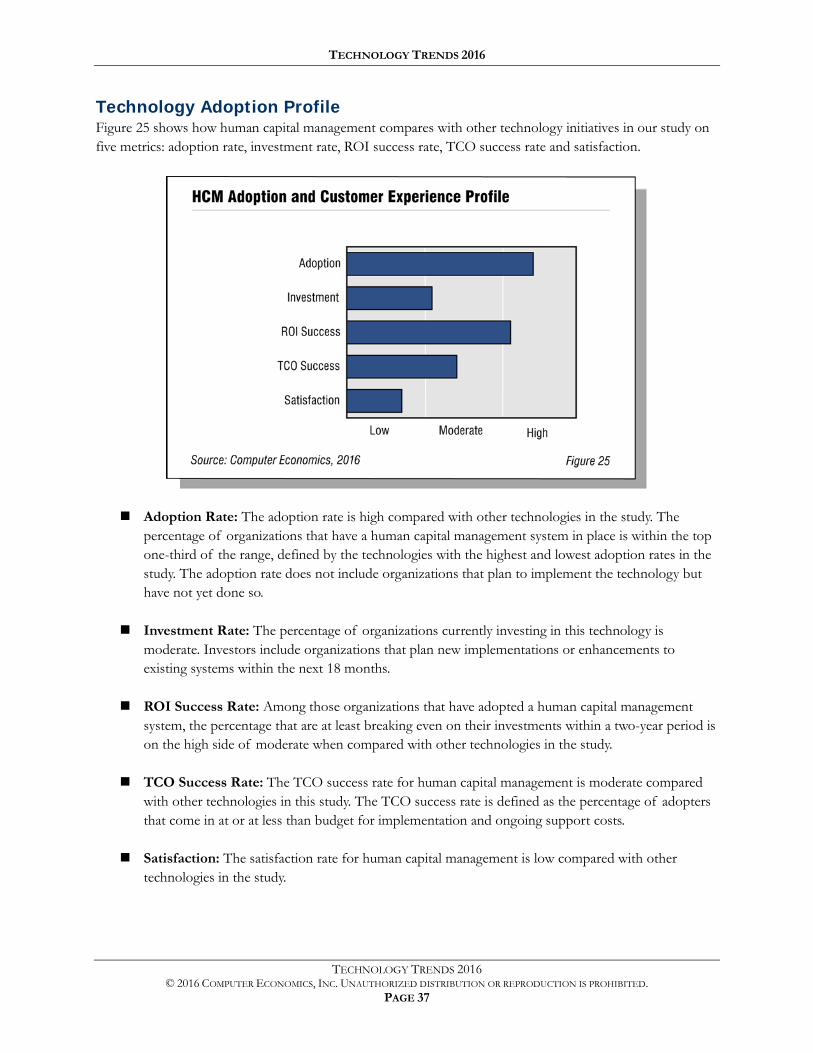
Technology Adoption Profile Figure 25 shows how human capital management compares with other technology initiatives in our study on five metrics: adoption rate, investment rate, ROI success rate, TCO success rate and satisfaction.
Adoption Rate: The adoption rate is high compared with other technologies in the study. The percentage of organizations that have a human capital management system in place is within the top one-third of the range, defined by the technologies with the highest and lowest adoption rates in the study. The adoption rate does not include organizations that plan to implement the technology but have not yet done so.
Investment Rate: The percentage of organizations currently investing in this technology is moderate. Investors include organizations that plan new implementations or enhancements to existing systems within the next 18 months.
ROI Success Rate: Among those organizations that have adopted a human capital management system, the percentage that are at least breaking even on their investments within a two-year period is on the high side of moderate when compared with other technologies in the study.
TCO Success Rate: The TCO success rate for human capital management is moderate compared with other technologies in this study. The TCO success rate is defined as the percentage of adopters that come in at or at less than budget for implementation and ongoing support costs.
Satisfaction: The satisfaction rate for human capital management is low compared with other technologies in the study.
TECHNOLOGY TRENDS 2016
TECHNOLOGY TRENDS 2016 © 2016 COMPUTER ECONOMICS, INC. UNAUTHORIZED DISTRIBUTION OR REPRODUCTION IS PROHIBITED.
PAGE 38
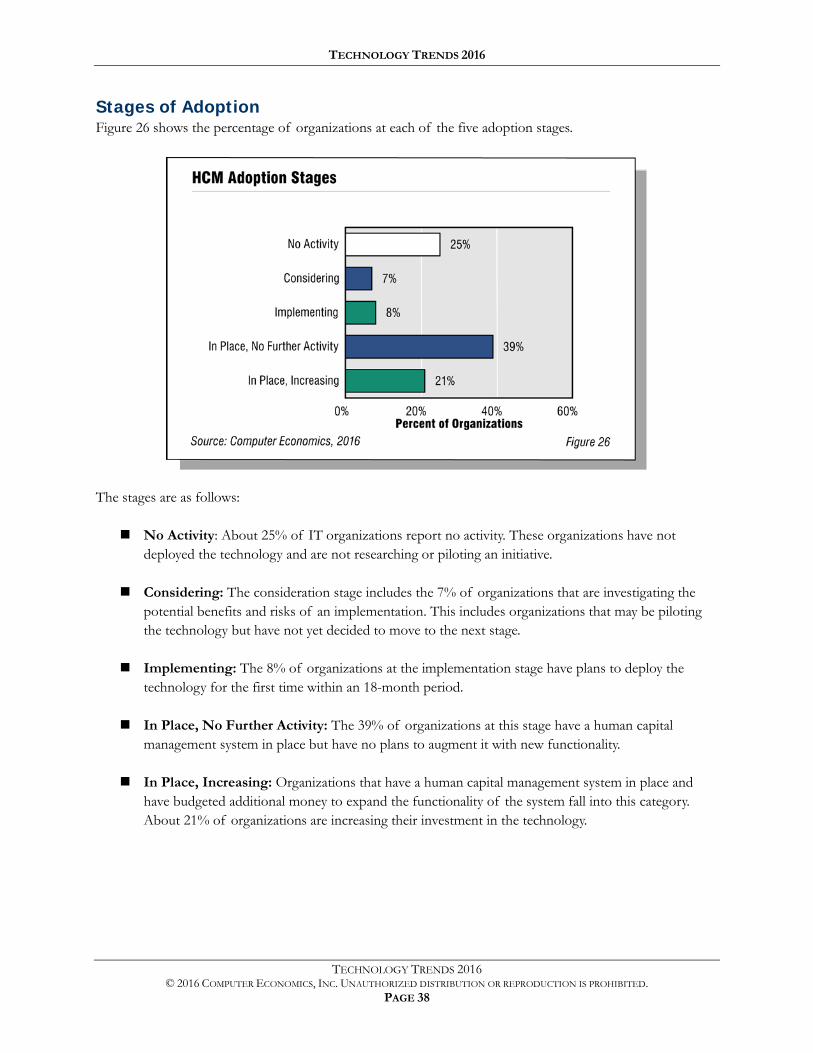
Stages of Adoption Figure 26 shows the percentage of organizations at each of the five adoption stages.
The stages are as follows:
No Activity: About 25% of IT organizations report no activity. These organizations have not deployed the technology and are not researching or piloting an initiative.
Considering: The consideration stage includes the 7% of organizations that are investigating the potential benefits and risks of an implementation. This includes organizations that may be piloting the technology but have not yet decided to move to the next stage.
Implementing: The 8% of organizations at the implementation stage have plans to deploy the technology for the first time within an 18-month period.
In Place, No Further Activity: The 39% of organizations at this stage have a human capital management system in place but have no plans to augment it with new functionality.
In Place, Increasing: Organizations that have a human capital management system in place and have budgeted additional money to expand the functionality of the system fall into this category. About 21% of organizations are increasing their investment in the technology.
TECHNOLOGY TRENDS 2016
TECHNOLOGY TRENDS 2016 © 2016 COMPUTER ECONOMICS, INC. UNAUTHORIZED DISTRIBUTION OR REPRODUCTION IS PROHIBITED.
PAGE 39
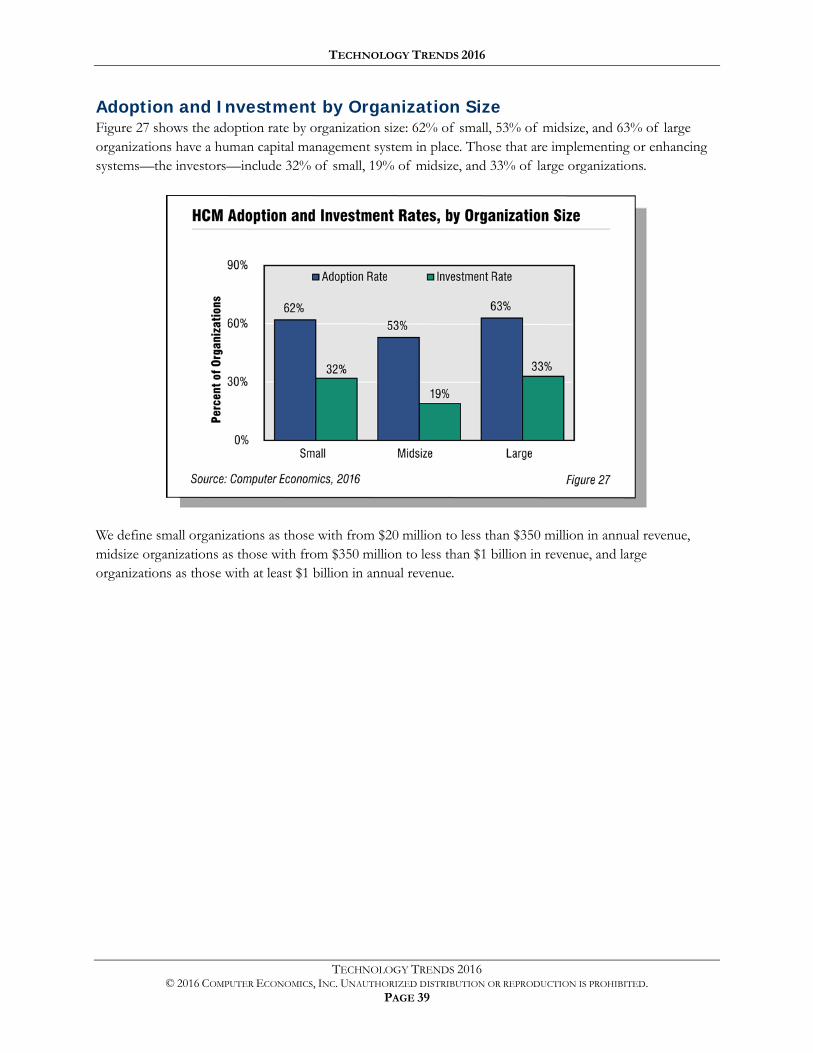
Adoption and Investment by Organization Size Figure 27 shows the adoption rate by organization size: 62% of small, 53% of midsize, and 63% of large organizations have a human capital management system in place. Those that are implementing or enhancing systems—the investors—include 32% of small, 19% of midsize, and 33% of large organizations.
We define small organizations as those with from $20 million to less than $350 million in annual revenue, midsize organizations as those with from $350 million to less than $1 billion in revenue, and large organizations as those with at least $1 billion in annual revenue.
TECHNOLOGY TRENDS 2016
TECHNOLOGY TRENDS 2016 © 2016 COMPUTER ECONOMICS, INC. UNAUTHORIZED DISTRIBUTION OR REPRODUCTION IS PROHIBITED.
PAGE 40
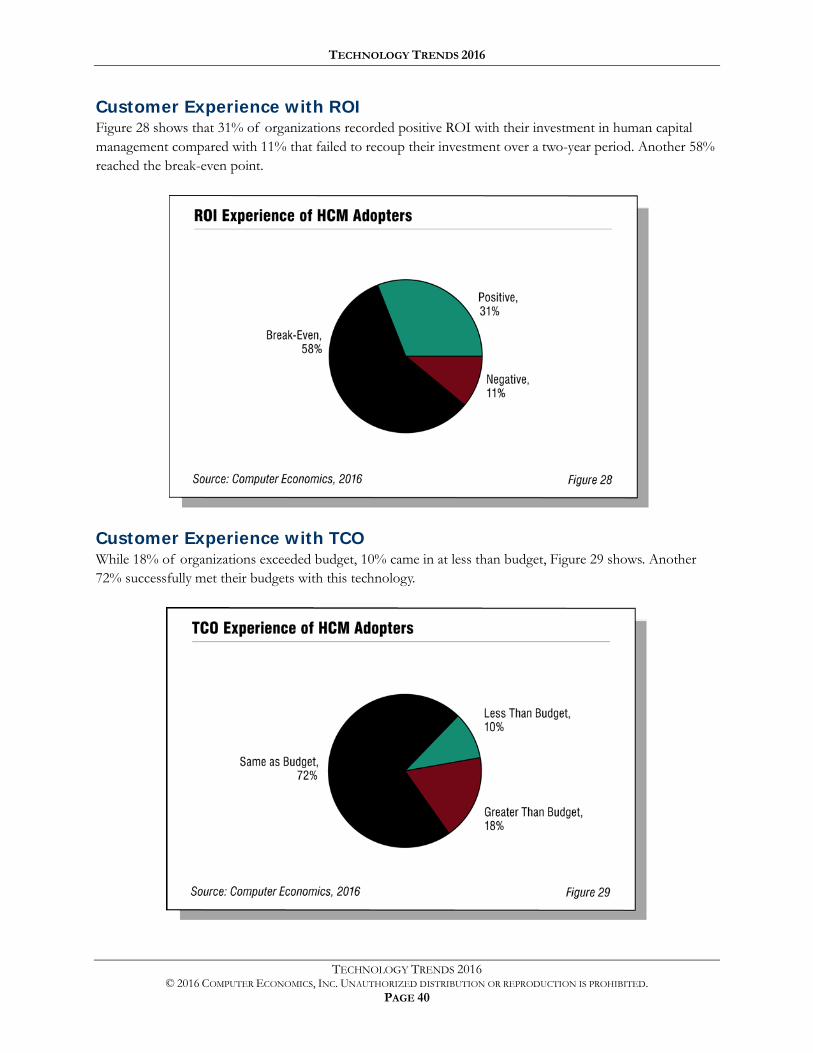
Customer Experience with ROI Figure 28 shows that 31% of organizations recorded positive ROI with their investment in human capital management compared with 11% that failed to recoup their investment over a two-year period. Another 58% reached the break-even point.
Customer Experience with TCO While 18% of organizations exceeded budget, 10% came in at less than budget, Figure 29 shows. Another 72% successfully met their budgets with this technology.
TECHNOLOGY TRENDS 2016
TECHNOLOGY TRENDS 2016 © 2016 COMPUTER ECONOMICS, INC. UNAUTHORIZED DISTRIBUTION OR REPRODUCTION IS PROHIBITED.
PAGE 41
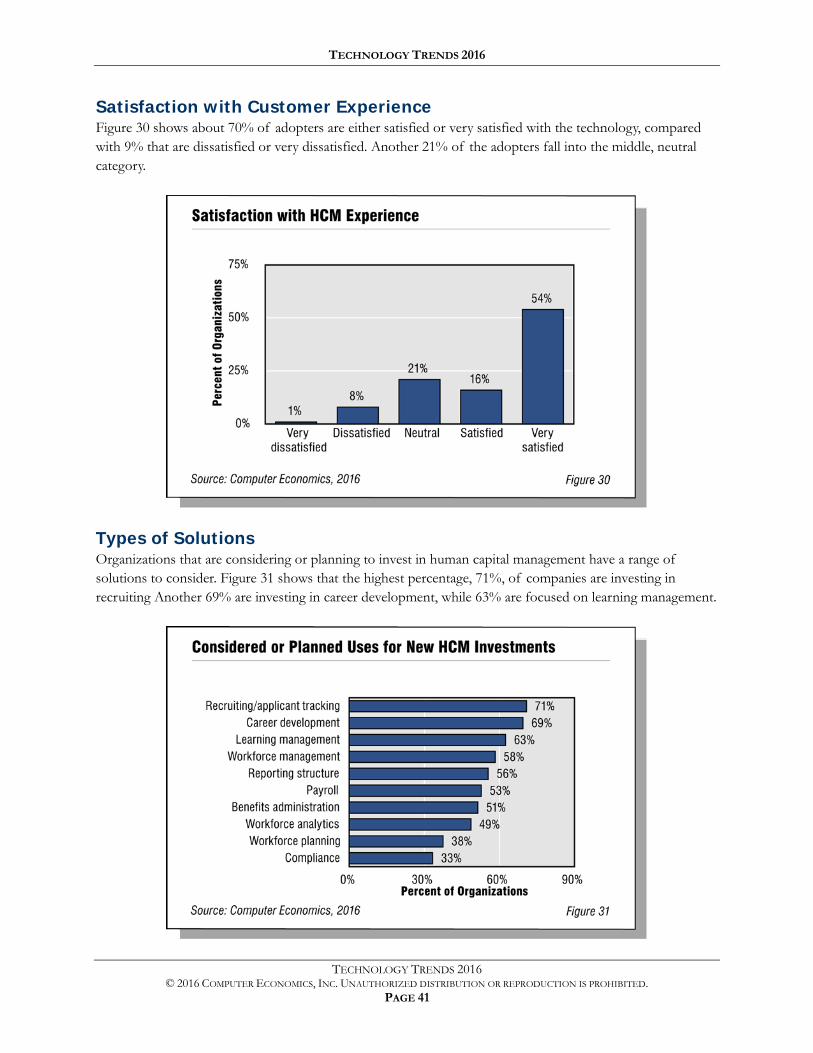
Satisfaction with Customer Experience Figure 30 shows about 70% of adopters are either satisfied or very satisfied with the technology, compared with 9% that are dissatisfied or very dissatisfied. Another 21% of the adopters fall into the middle, neutral category.
Types of Solutions Organizations that are considering or planning to invest in human capital management have a range of solutions to consider. Figure 31 shows that the highest percentage, 71%, of companies are investing in recruiting Another 69% are investing in career development, while 63% are focused on learning management.
TECHNOLOGY TRENDS 2016
TECHNOLOGY TRENDS 2016 © 2016 COMPUTER ECONOMICS, INC. UNAUTHORIZED DISTRIBUTION OR REPRODUCTION IS PROHIBITED.
PAGE 42
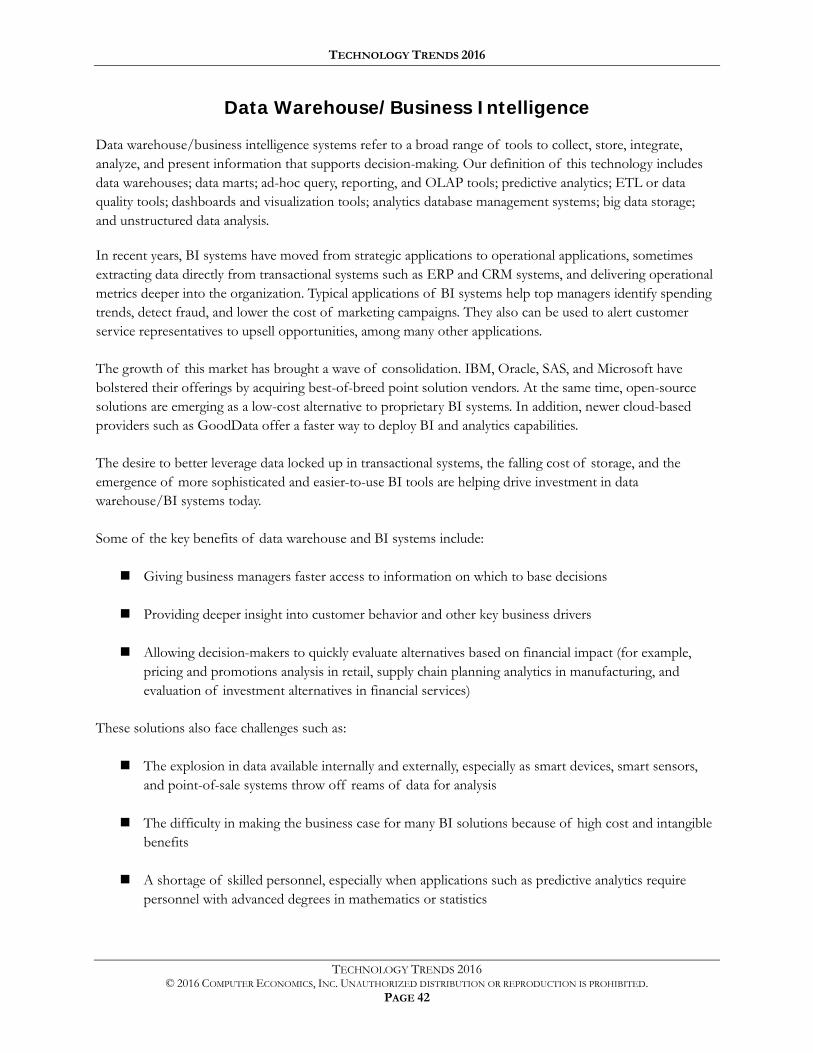
Data Warehouse/Business Intelligence
Data warehouse/business intelligence systems refer to a broad range of tools to collect, store, integrate, analyze, and present information that supports decision-making. Our definition of this technology includes data warehouses; data marts; ad-hoc query, reporting, and OLAP tools; predictive analytics; ETL or data quality tools; dashboards and visualization tools; analytics database management systems; big data storage; and unstructured data analysis.
In recent years, BI systems have moved from strategic applications to operational applications, sometimes extracting data directly from transactional systems such as ERP and CRM systems, and delivering operational metrics deeper into the organization. Typical applications of BI systems help top managers identify spending trends, detect fraud, and lower the cost of marketing campaigns. They also can be used to alert customer service representatives to upsell opportunities, among many other applications.
The growth of this market has brought a wave of consolidation. IBM, Oracle, SAS, and Microsoft have bolstered their offerings by acquiring best-of-breed point solution vendors. At the same time, open-source solutions are emerging as a low-cost alternative to proprietary BI systems. In addition, newer cloud-based providers such as GoodData offer a faster way to deploy BI and analytics capabilities.
The desire to better leverage data locked up in transactional systems, the falling cost of storage, and the emergence of more sophisticated and easier-to-use BI tools are helping drive investment in data warehouse/BI systems today.
Some of the key benefits of data warehouse and BI systems include:
Giving business managers faster access to information on which to base decisions
Providing deeper insight into customer behavior and other key business drivers
Allowing decision-makers to quickly evaluate alternatives based on financial impact (for example, pricing and promotions analysis in retail, supply chain planning analytics in manufacturing, and evaluation of investment alternatives in financial services)
These solutions also face challenges such as:
The explosion in data available internally and externally, especially as smart devices, smart sensors, and point-of-sale systems throw off reams of data for analysis
The difficulty in making the business case for many BI solutions because of high cost and intangible benefits
A shortage of skilled personnel, especially when applications such as predictive analytics require personnel with advanced degrees in mathematics or statistics
TECHNOLOGY TRENDS 2016
TECHNOLOGY TRENDS 2016 © 2016 COMPUTER ECONOMICS, INC. UNAUTHORIZED DISTRIBUTION OR REPRODUCTION IS PROHIBITED.
PAGE 43
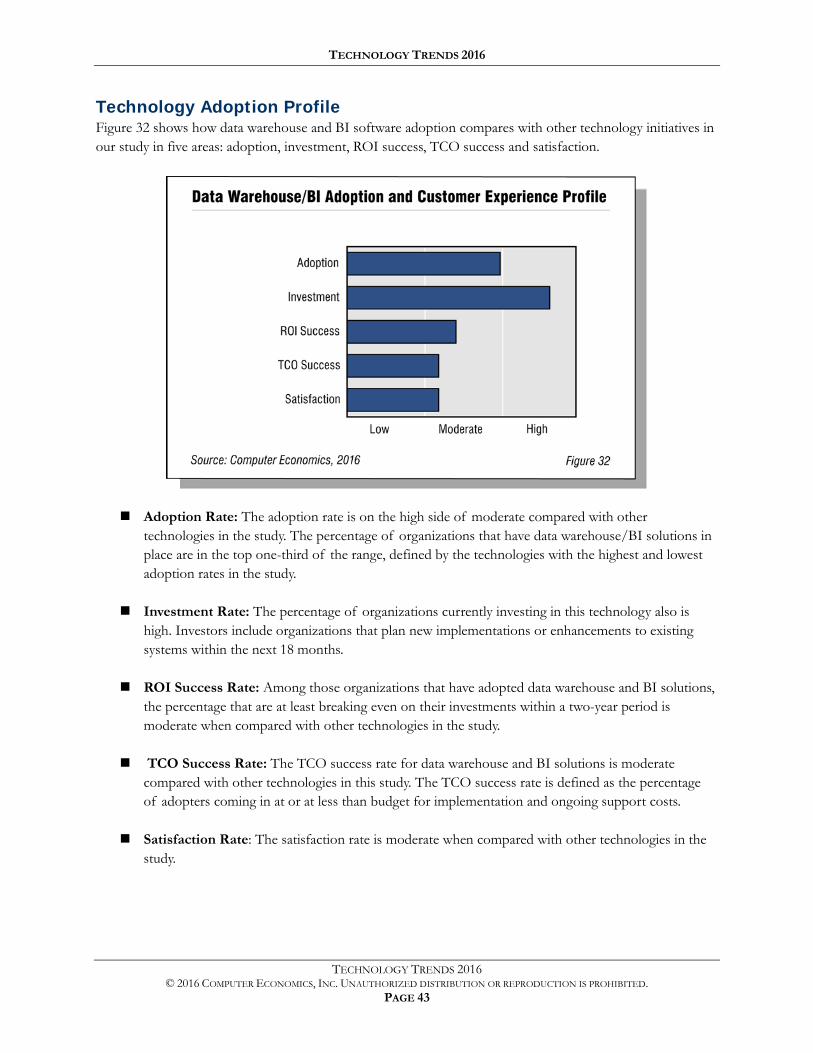
Technology Adoption Profile Figure 32 shows how data warehouse and BI software adoption compares with other technology initiatives in our study in five areas: adoption, investment, ROI success, TCO success and satisfaction.
Adoption Rate: The adoption rate is on the high side of moderate compared with other technologies in the study. The percentage of organizations that have data warehouse/BI solutions in place are in the top one-third of the range, defined by the technologies with the highest and lowest adoption rates in the study.
Investment Rate: The percentage of organizations currently investing in this technology also is high. Investors include organizations that plan new implementations or enhancements to existing systems within the next 18 months.
ROI Success Rate: Among those organizations that have adopted data warehouse and BI solutions, the percentage that are at least breaking even on their investments within a two-year period is moderate when compared with other technologies in the study.
TCO Success Rate: The TCO success rate for data warehouse and BI solutions is moderate compared with other technologies in this study. The TCO success rate is defined as the percentage of adopters coming in at or at less than budget for implementation and ongoing support costs.
Satisfaction Rate: The satisfaction rate is moderate when compared with other technologies in the study.
TECHNOLOGY TRENDS 2016
TECHNOLOGY TRENDS 2016 © 2016 COMPUTER ECONOMICS, INC. UNAUTHORIZED DISTRIBUTION OR REPRODUCTION IS PROHIBITED.
PAGE 44
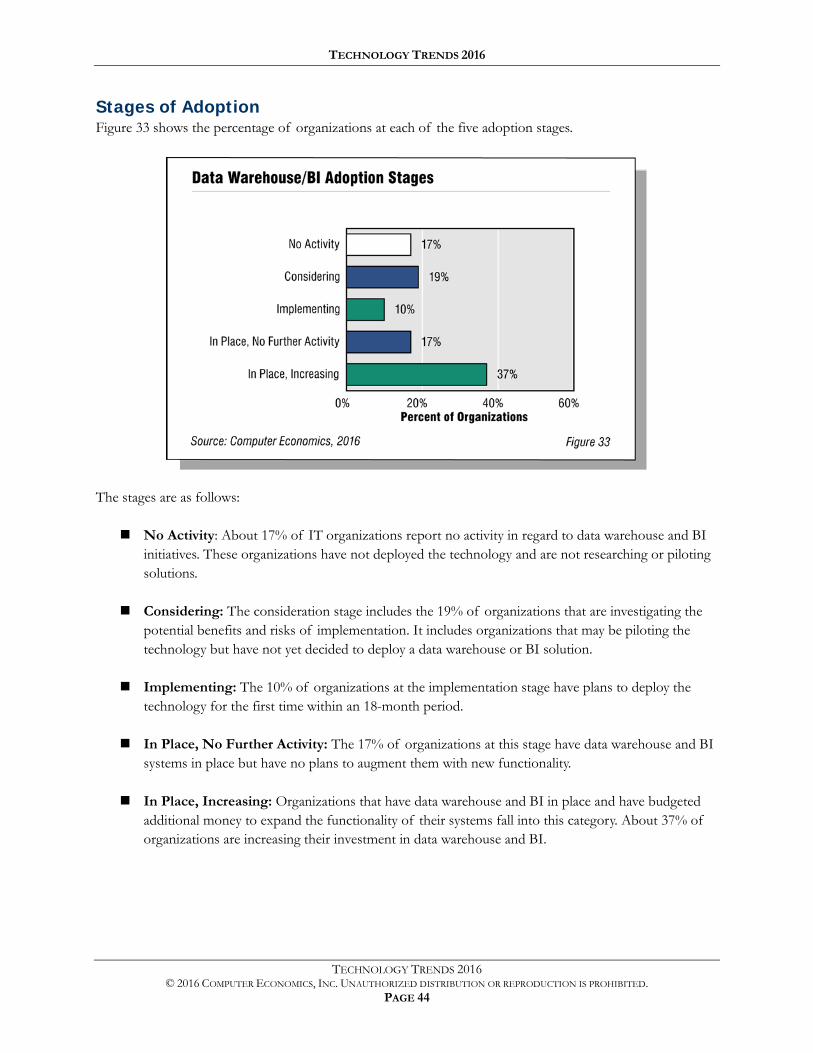
Stages of Adoption Figure 33 shows the percentage of organizations at each of the five adoption stages.
The stages are as follows:
No Activity: About 17% of IT organizations report no activity in regard to data warehouse and BI initiatives. These organizations have not deployed the technology and are not researching or piloting solutions.
Considering: The consideration stage includes the 19% of organizations that are investigating the potential benefits and risks of implementation. It includes organizations that may be piloting the technology but have not yet decided to deploy a data warehouse or BI solution.
Implementing: The 10% of organizations at the implementation stage have plans to deploy the technology for the first time within an 18-month period.
In Place, No Further Activity: The 17% of organizations at this stage have data warehouse and BI systems in place but have no plans to augment them with new functionality.
In Place, Increasing: Organizations that have data warehouse and BI in place and have budgeted additional money to expand the functionality of their systems fall into this category. About 37% of organizations are increasing their investment in data warehouse and BI.
TECHNOLOGY TRENDS 2016
TECHNOLOGY TRENDS 2016 © 2016 COMPUTER ECONOMICS, INC. UNAUTHORIZED DISTRIBUTION OR REPRODUCTION IS PROHIBITED.
PAGE 45
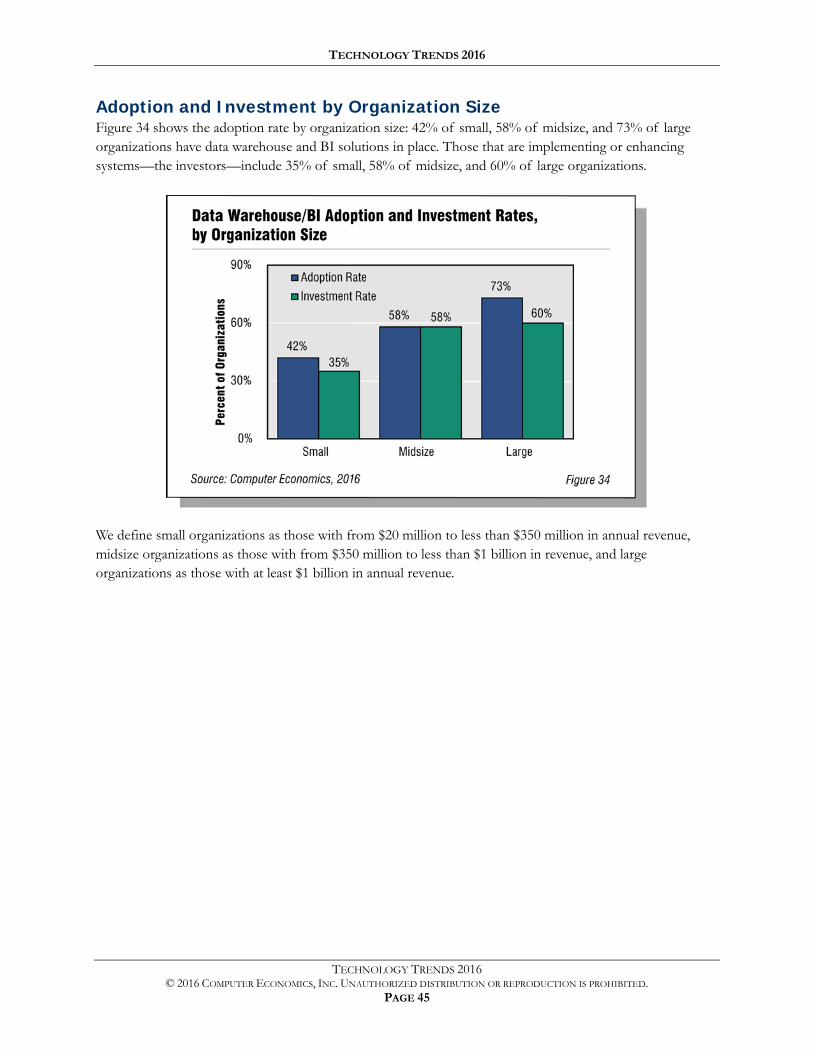
Adoption and Investment by Organization Size Figure 34 shows the adoption rate by organization size: 42% of small, 58% of midsize, and 73% of large organizations have data warehouse and BI solutions in place. Those that are implementing or enhancing systems—the investors—include 35% of small, 58% of midsize, and 60% of large organizations.
We define small organizations as those with from $20 million to less than $350 million in annual revenue, midsize organizations as those with from $350 million to less than $1 billion in revenue, and large organizations as those with at least $1 billion in annual revenue.
TECHNOLOGY TRENDS 2016
TECHNOLOGY TRENDS 2016 © 2016 COMPUTER ECONOMICS, INC. UNAUTHORIZED DISTRIBUTION OR REPRODUCTION IS PROHIBITED.
PAGE 46
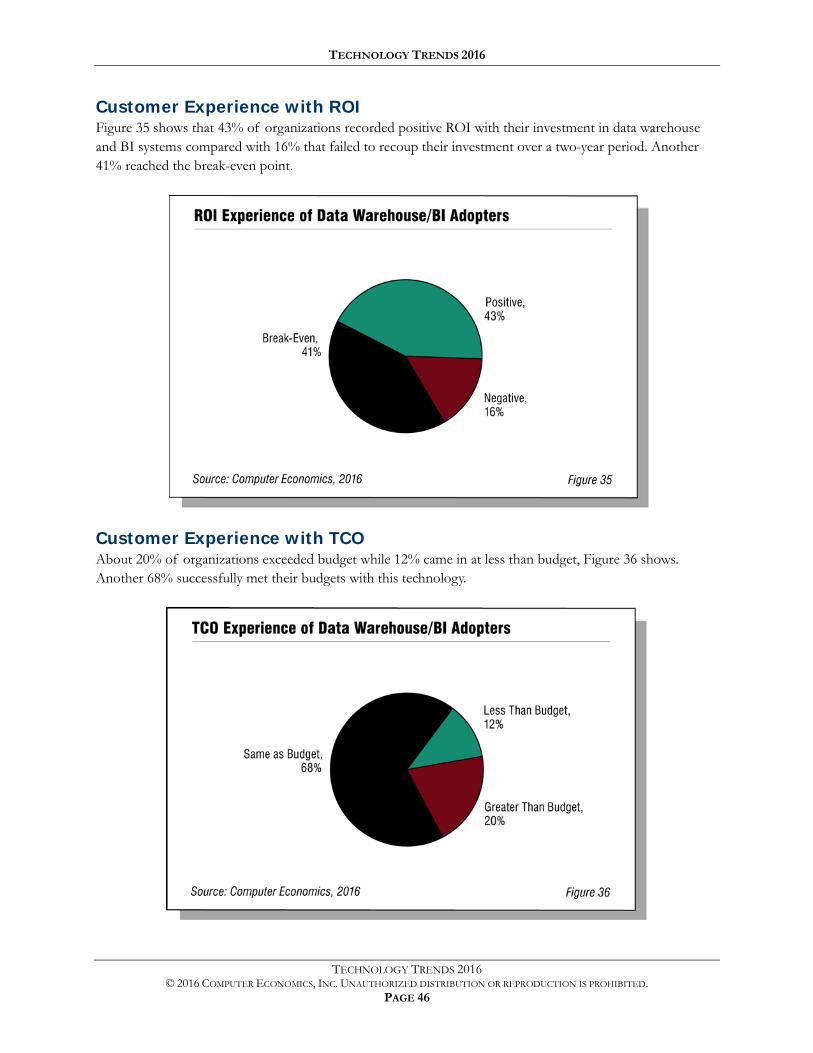
Customer Experience with ROI Figure 35 shows that 43% of organizations recorded positive ROI with their investment in data warehouse and BI systems compared with 16% that failed to recoup their investment over a two-year period. Another 41% reached the break-even point.
Customer Experience with TCO About 20% of organizations exceeded budget while 12% came in at less than budget, Figure 36 shows. Another 68% successfully met their budgets with this technology.
TECHNOLOGY TRENDS 2016
TECHNOLOGY TRENDS 2016 © 2016 COMPUTER ECONOMICS, INC. UNAUTHORIZED DISTRIBUTION OR REPRODUCTION IS PROHIBITED.
PAGE 47
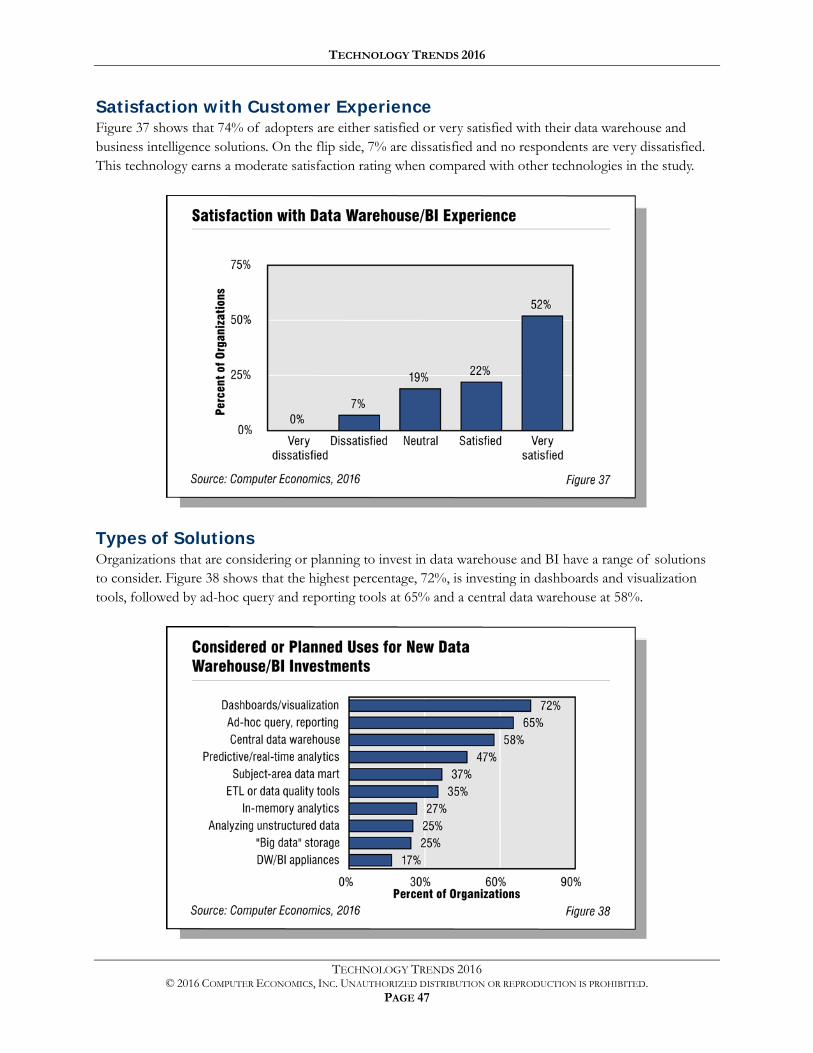
Satisfaction with Customer Experience Figure 37 shows that 74% of adopters are either satisfied or very satisfied with their data warehouse and business intelligence solutions. On the flip side, 7% are dissatisfied and no respondents are very dissatisfied. This technology earns a moderate satisfaction rating when compared with other technologies in the study.
Types of Solutions Organizations that are considering or planning to invest in data warehouse and BI have a range of solutions to consider. Figure 38 shows that the highest percentage, 72%, is investing in dashboards and visualization tools, followed by ad-hoc query and reporting tools at 65% and a central data warehouse at 58%.
TECHNOLOGY TRENDS 2016
TECHNOLOGY TRENDS 2016 © 2016 COMPUTER ECONOMICS, INC. UNAUTHORIZED DISTRIBUTION OR REPRODUCTION IS PROHIBITED.
PAGE 48
Mobile Applications
Mobile applications have been deployed on handheld devices for many years, but the continued growth of smartphones within the enterprise has now brought them into the mainstream. These are business applications that can run on smartphones, tablets, and other handheld devices.
Within our definition of mobile applications we consider only the adoption of business applications that run on smartphones, tablets, and handheld devices. We include under mobile applications new implementations or retrofitting of existing business applications (such as CRM, field service or BI) for access on new mobile platforms such as smartphones, tablets, or special-purpose handhelds. We do not count laptops as a mobile device or email as a mobile application.
The rapid growth of mobile application development is a decidedly double-edged sword for the enterprise. On one hand, an increasingly mobile workforce is more capable, efficient, and flexible than ever before. Mobile applications have enhanced workforce productivity in such areas as sales, inventory and order management, customer support, and analytics. The trend also has led to greater information flow, improved workflow, and increased employee satisfaction.
On the other hand, corporate IT departments face the daunting challenge of supporting a growing number of sophisticated mobile devices and ensuring that security firewalls are not breached. The need to protect internal information and security is a growing challenge. Another challenge is the need to customize internal data for use on a wide array of mobile devices. In some cases, this situation has exposed a skills gap in the organization’s IT staff and has led to greater outsourcing to close that gap.
The use of mobile applications is destined to grow with the maturing sophistication of mobile software operating systems and a widening array of devices. Vendors of enterprise applications such as ERP, CRM, and human capital management have been adding mobile applications to their product offerings, accelerating the momentum. And the rapid uptake in mobile devices in the consumer world has put increased pressure on IT organizations to support these devices for enterprise applications. This has led some organizations to adopt a “bring your own device” (BYOD) policy, whereby employees can use their personal mobile devices for work applications—raising a number of security, privacy, and support issues. These factors are all contributing to the rapid uptake of mobile devices and applications in the enterprise.
TECHNOLOGY TRENDS 2016
TECHNOLOGY TRENDS 2016 © 2016 COMPUTER ECONOMICS, INC. UNAUTHORIZED DISTRIBUTION OR REPRODUCTION IS PROHIBITED.
PAGE 49
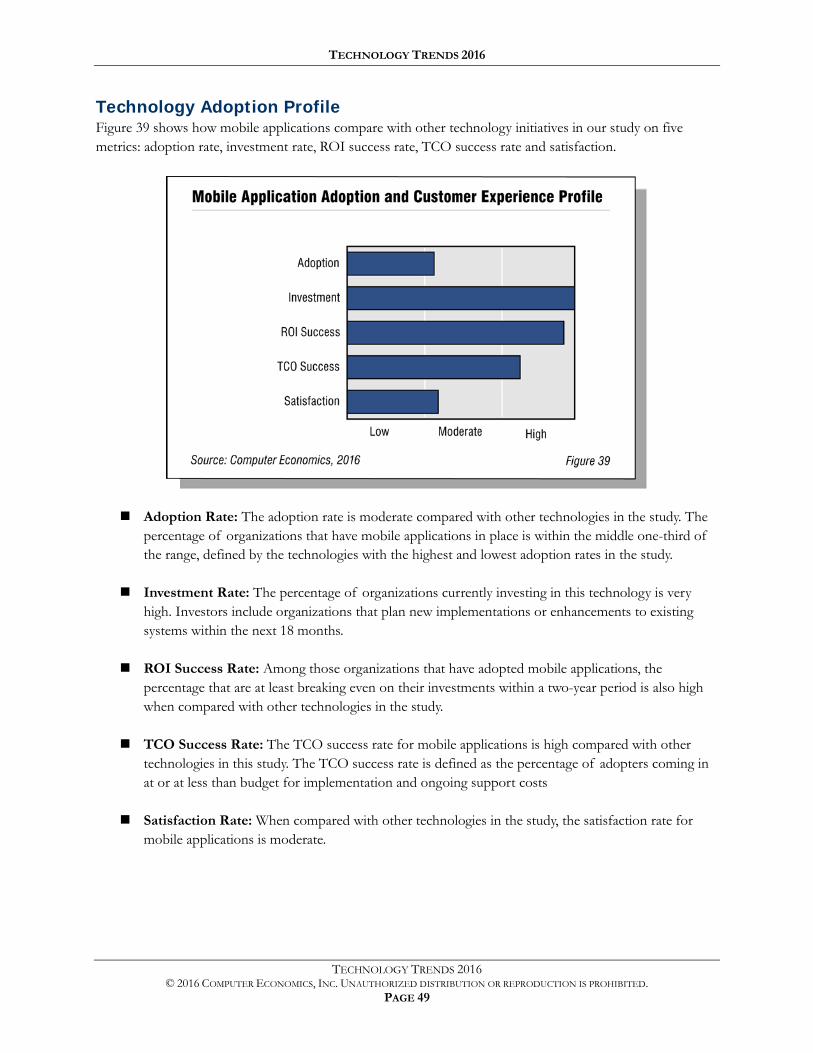
Technology Adoption Profile Figure 39 shows how mobile applications compare with other technology initiatives in our study on five metrics: adoption rate, investment rate, ROI success rate, TCO success rate and satisfaction.
Adoption Rate: The adoption rate is moderate compared with other technologies in the study. The percentage of organizations that have mobile applications in place is within the middle one-third of the range, defined by the technologies with the highest and lowest adoption rates in the study.
Investment Rate: The percentage of organizations currently investing in this technology is very high. Investors include organizations that plan new implementations or enhancements to existing systems within the next 18 months.
ROI Success Rate: Among those organizations that have adopted mobile applications, the percentage that are at least breaking even on their investments within a two-year period is also high when compared with other technologies in the study.
TCO Success Rate: The TCO success rate for mobile applications is high compared with other technologies in this study. The TCO success rate is defined as the percentage of adopters coming in at or at less than budget for implementation and ongoing support costs
Satisfaction Rate: When compared with other technologies in the study, the satisfaction rate for mobile applications is moderate.
TECHNOLOGY TRENDS 2016
TECHNOLOGY TRENDS 2016 © 2016 COMPUTER ECONOMICS, INC. UNAUTHORIZED DISTRIBUTION OR REPRODUCTION IS PROHIBITED.
PAGE 50
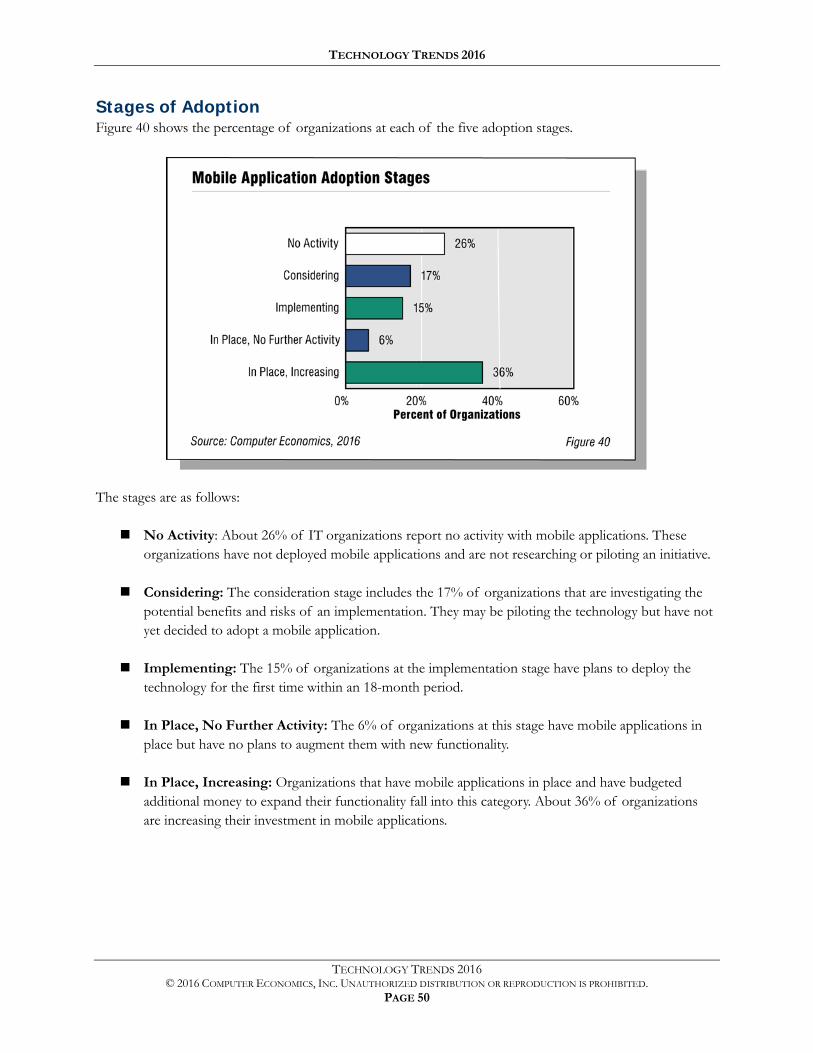
Stages of Adoption Figure 40 shows the percentage of organizations at each of the five adoption stages.
The stages are as follows:
No Activity: About 26% of IT organizations report no activity with mobile applications. These organizations have not deployed mobile applications and are not researching or piloting an initiative.
Considering: The consideration stage includes the 17% of organizations that are investigating the potential benefits and risks of an implementation. They may be piloting the technology but have not yet decided to adopt a mobile application.
Implementing: The 15% of organizations at the implementation stage have plans to deploy the technology for the first time within an 18-month period.
In Place, No Further Activity: The 6% of organizations at this stage have mobile applications in place but have no plans to augment them with new functionality.
In Place, Increasing: Organizations that have mobile applications in place and have budgeted additional money to expand their functionality fall into this category. About 36% of organizations are increasing their investment in mobile applications.
TECHNOLOGY TRENDS 2016
TECHNOLOGY TRENDS 2016 © 2016 COMPUTER ECONOMICS, INC. UNAUTHORIZED DISTRIBUTION OR REPRODUCTION IS PROHIBITED.
PAGE 51
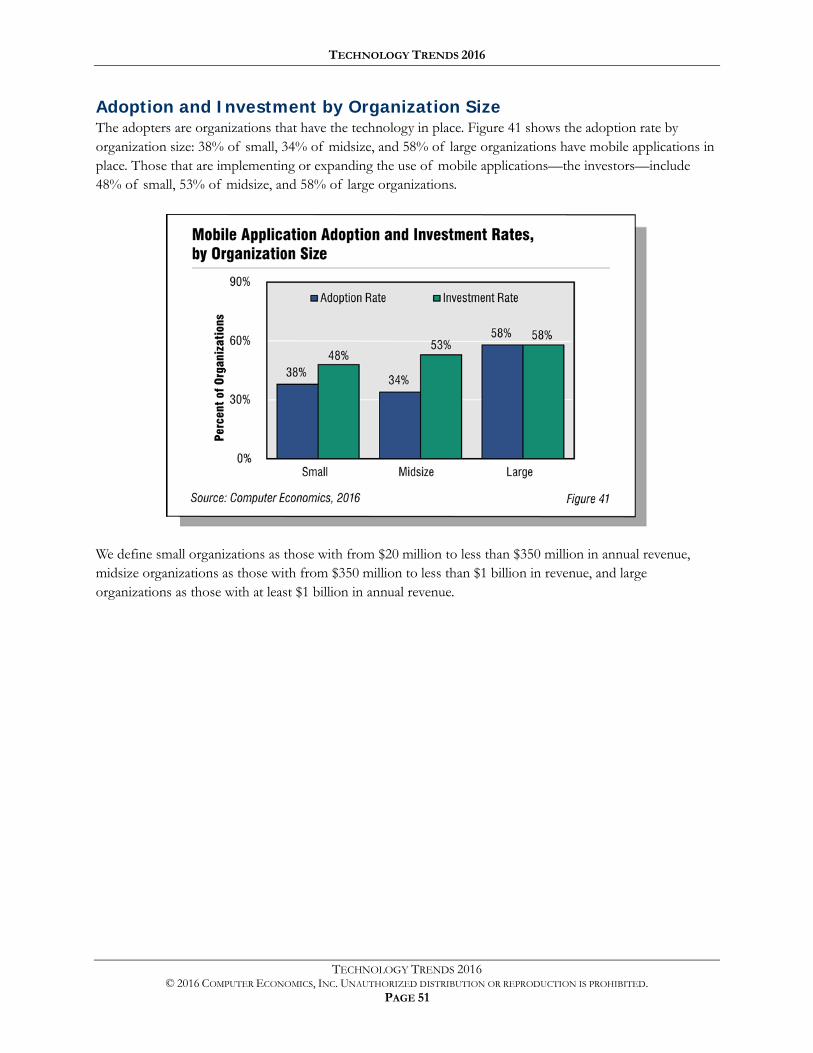
Adoption and Investment by Organization Size The adopters are organizations that have the technology in place. Figure 41 shows the adoption rate by organization size: 38% of small, 34% of midsize, and 58% of large organizations have mobile applications in place. Those that are implementing or expanding the use of mobile applications—the investors—include 48% of small, 53% of midsize, and 58% of large organizations.
We define small organizations as those with from $20 million to less than $350 million in annual revenue, midsize organizations as those with from $350 million to less than $1 billion in revenue, and large organizations as those with at least $1 billion in annual revenue.
TECHNOLOGY TRENDS 2016
TECHNOLOGY TRENDS 2016 © 2016 COMPUTER ECONOMICS, INC. UNAUTHORIZED DISTRIBUTION OR REPRODUCTION IS PROHIBITED.
PAGE 52
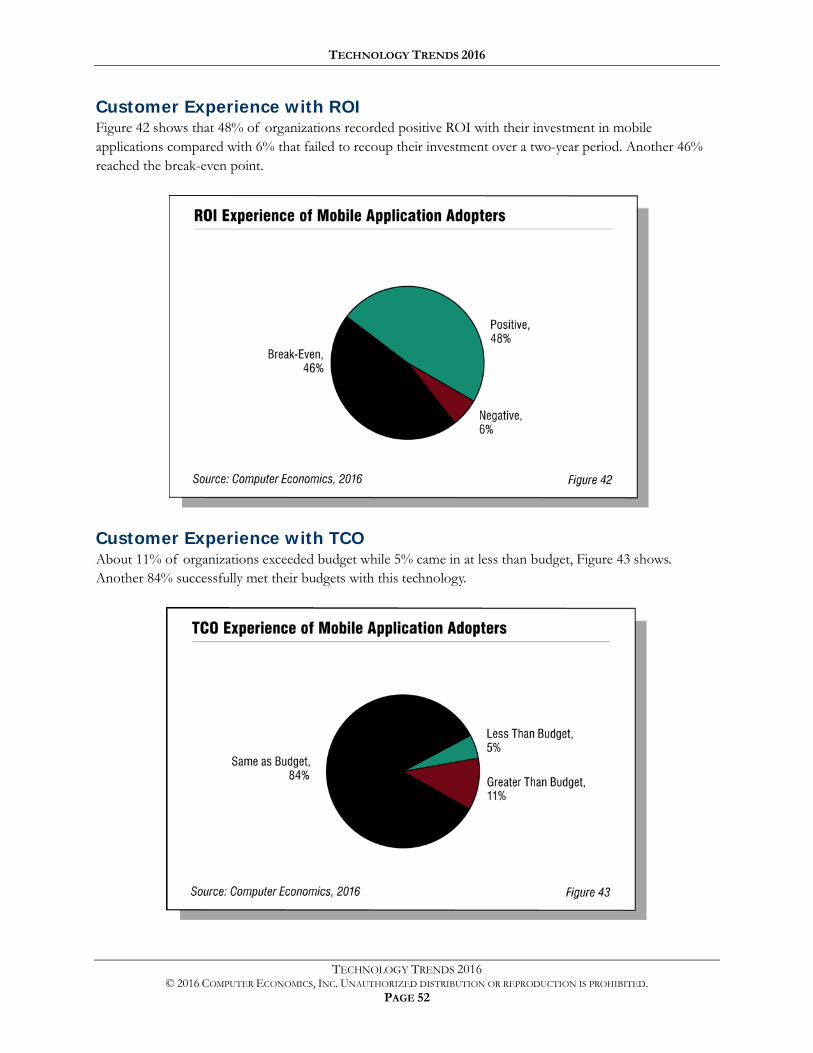
Customer Experience with ROI Figure 42 shows that 48% of organizations recorded positive ROI with their investment in mobile applications compared with 6% that failed to recoup their investment over a two-year period. Another 46% reached the break-even point.
Customer Experience with TCO About 11% of organizations exceeded budget while 5% came in at less than budget, Figure 43 shows. Another 84% successfully met their budgets with this technology.
TECHNOLOGY TRENDS 2016
TECHNOLOGY TRENDS 2016 © 2016 COMPUTER ECONOMICS, INC. UNAUTHORIZED DISTRIBUTION OR REPRODUCTION IS PROHIBITED.
PAGE 53
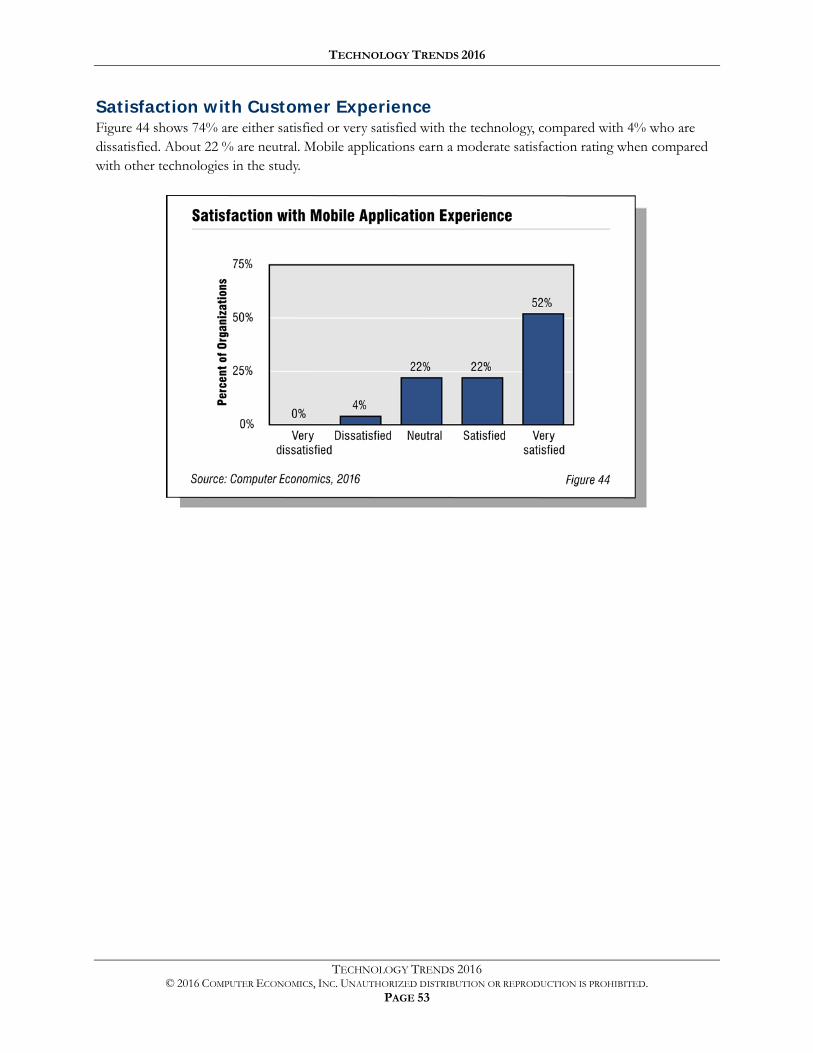
Satisfaction with Customer Experience Figure 44 shows 74% are either satisfied or very satisfied with the technology, compared with 4% who are dissatisfied. About 22 % are neutral. Mobile applications earn a moderate satisfaction rating when compared with other technologies in the study.
TECHNOLOGY TRENDS 2016
TECHNOLOGY TRENDS 2016 © 2016 COMPUTER ECONOMICS, INC. UNAUTHORIZED DISTRIBUTION OR REPRODUCTION IS PROHIBITED.
PAGE 54
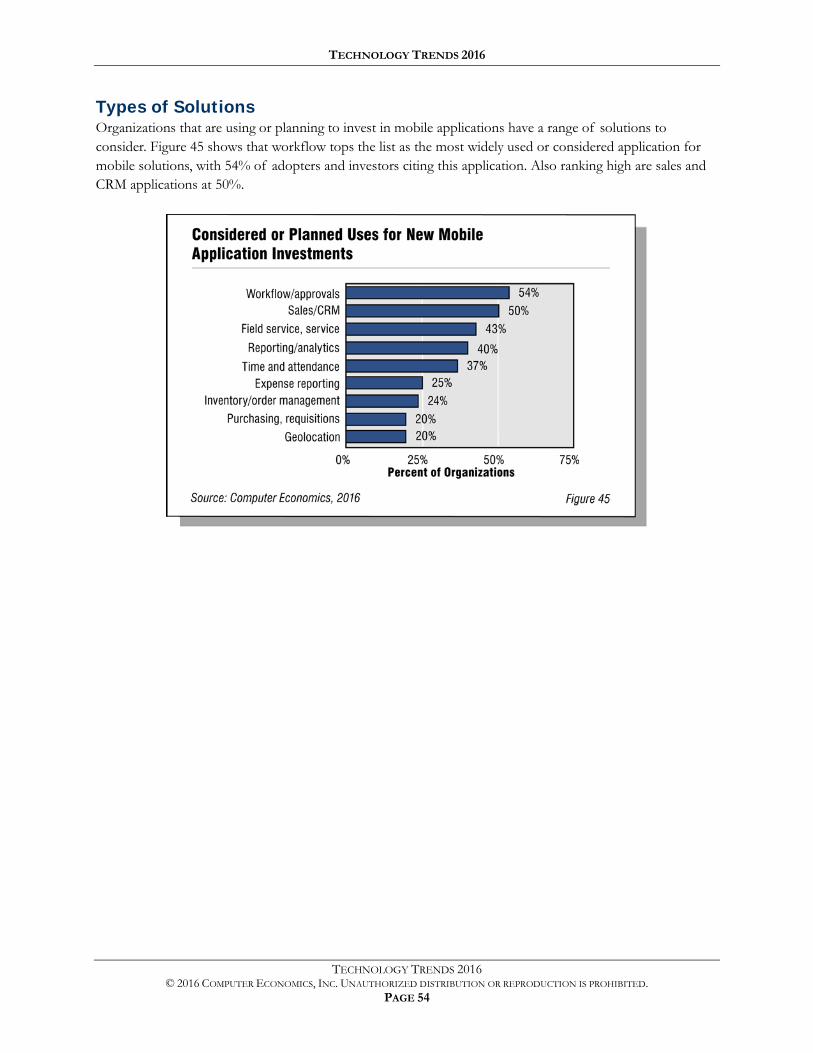
Types of Solutions Organizations that are using or planning to invest in mobile applications have a range of solutions to consider. Figure 45 shows that workflow tops the list as the most widely used or considered application for mobile solutions, with 54% of adopters and investors citing this application. Also ranking high are sales and CRM applications at 50%.
TECHNOLOGY TRENDS 2016
TECHNOLOGY TRENDS 2016 © 2016 COMPUTER ECONOMICS, INC. UNAUTHORIZED DISTRIBUTION OR REPRODUCTION IS PROHIBITED.
PAGE 55
Social Business/Collaboration Systems
Social business and collaboration systems refer to technologies and tools that foster collaboration, information sharing, and interactions among employees or with customers, suppliers, partners, or the general public. There are a wide variety of tools and services that encompass social business systems. They include intranets; user profiles; file-sharing tools; blogs; wikis; forums, communities, message boards, activity streams or news feeds; videoconferencing; and web conferencing.
The category we call social business/collaboration systems can involve the use of social networking services such as Facebook, Twitter, Google+, and LinkedIn. But there also are vendors that sell social business systems for enterprise use, and enterprise software vendors have added social business capabilities to their core offerings. The market for these systems is highly fragmented, and it is not entirely clear whether social business will continue to develop as its own category of technology or whether it will be absorbed as just another feature set in the larger category of enterprise applications.
Businesses are increasingly embracing social business and collaboration tools for a number of reasons:
The popularity of social networks such as Facebook and Twitter in the consumer world have led businesses to look for ways to make enterprise applications not just “systems of record” but also “systems of engagement”—systems that employees want to use as part of their work life and not just something that they are required to use as a matter of policy.
Business leaders realize much of the work performed in business is unstructured—comprising conversations and collaboration activities that do not lend themselves to standardized process workflows. Social business tools let small groups work informally, gathering and sharing information in a variety of ways, and can make information accessible throughout the organization.
Businesses find it beneficial to monitor conversations happening outside the organization’s formal marketing or PR channels, on Facebook, Twitter, and other public forums. They also want to mine that information for sentiment analysis and use social media for marketing, sales, and customer service.
Businesses are looking for more efficient ways of communicating and collaborating. For example, the use of activity feeds and message boards, properly implemented, can move conversations out of email, where they can overwhelm recipients and become difficult to follow, into discussion forums that provide information in context and can be more easily archived for historical lookup.
The use of social business tools, however, is not without challenges. Many organizations rightly fear their employees will waste time on internal social business systems. In addition, many organizations are still working on how to filter information that comes to employees through these tools so that they are not buried in data of marginal value. Finally, as with any technology that promises soft benefits, building the business case for social business/collaboration tools can be difficult. This does not mean that there is no ROI for social business systems: the investment can be relatively low—but the value can be difficult to quantify.
TECHNOLOGY TRENDS 2016
TECHNOLOGY TRENDS 2016 © 2016 COMPUTER ECONOMICS, INC. UNAUTHORIZED DISTRIBUTION OR REPRODUCTION IS PROHIBITED.
PAGE 56
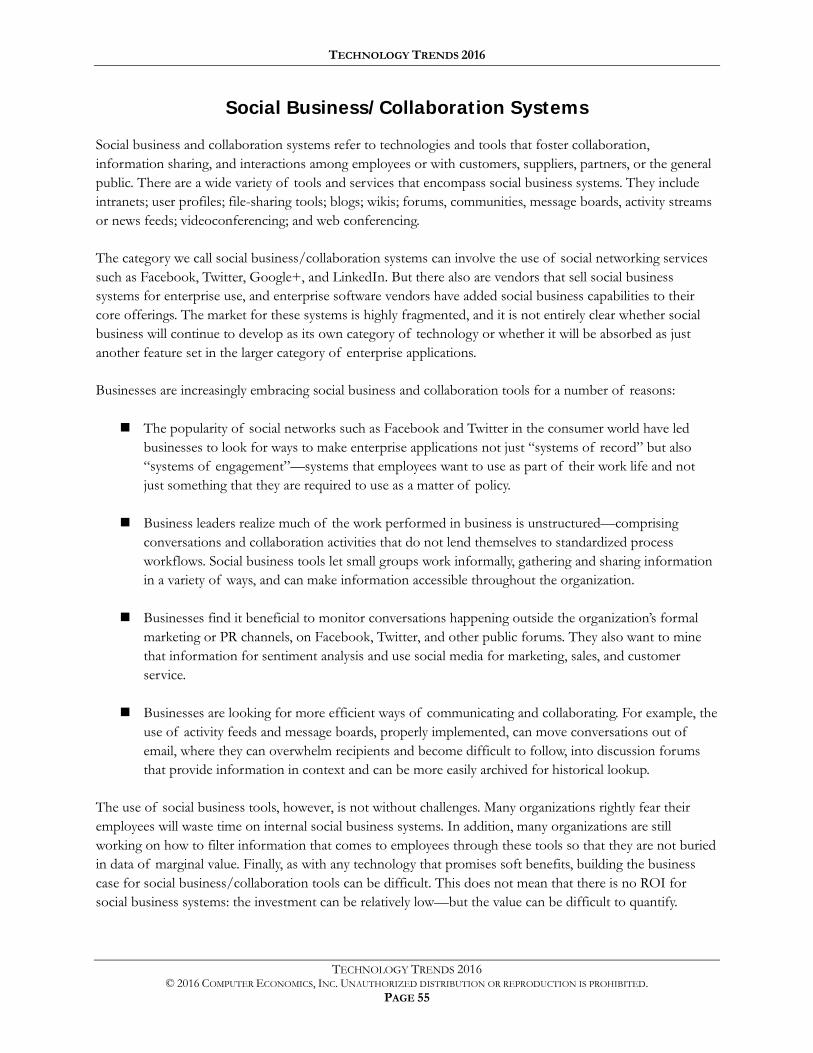
Technology Adoption Profile Figure 46 shows how social business and collaboration technologies compare with other technology initiatives in our study on five metrics: adoption rate, investment rate, ROI success rate, TCO success rate and satisfaction.
Adoption Rate: The adoption rate is high compared with other technologies in the study. The percentage of organizations that have social business/collaboration technology in place is within the top one-third of the range, defined by the technologies with the highest and lowest adoption rates in the study. The adoption rate does not include organizations that plan to implement the technology but have not yet done so.
Investment Rate: The percentage of organizations currently investing in this technology is moderate. Investors include organizations that plan new implementations or enhancements to existing systems within the next 18 months.
ROI Success Rate: Among those organizations that have adopted social business and collaboration technology, the percentage that are at least breaking even on their investments within a two-year period is high when compared with other technologies in the study.
TCO Success Rate: The TCO success rate for social business and collaboration technology also is high compared with other technologies in this study. The TCO success rate is defined as the percentage of adopters coming in at or at less than budget for implementation and ongoing support costs.
Satisfaction Rate: Compared with other technologies in the study, the satisfaction rate is low.
TECHNOLOGY TRENDS 2016
TECHNOLOGY TRENDS 2016 © 2016 COMPUTER ECONOMICS, INC. UNAUTHORIZED DISTRIBUTION OR REPRODUCTION IS PROHIBITED.
PAGE 57
Stages of Adoption Figure 47 shows the percentage of organizations at each of the five adoption stages.
The stages are as follows:
No Activity: About 18% of IT organizations report no activity with social business/collaboration systems. These organizations have not deployed the technology and are not researching or piloting an initiative.
Considering: The consideration stage includes the 11% of organizations that are investigating the potential benefits and risks of a full implementation. This includes organizations that may be piloting the technology but have not yet decided to move to the next stage.
Implementing: The 10% of organizations at the implementation stage have plans to deploy the technology for the first time within an 18-month period.
In Place, No Further Activity: The 34% of organizations at this stage have social business and collaboration in place but have no plans to augment their systems with new functionality.
In Place, Increasing: Organizations that have social business and collaboration in place and have budgeted additional money to expand the functionality of their systems fall into this category. About 27% of organizations are increasing their investment in social business and collaboration.
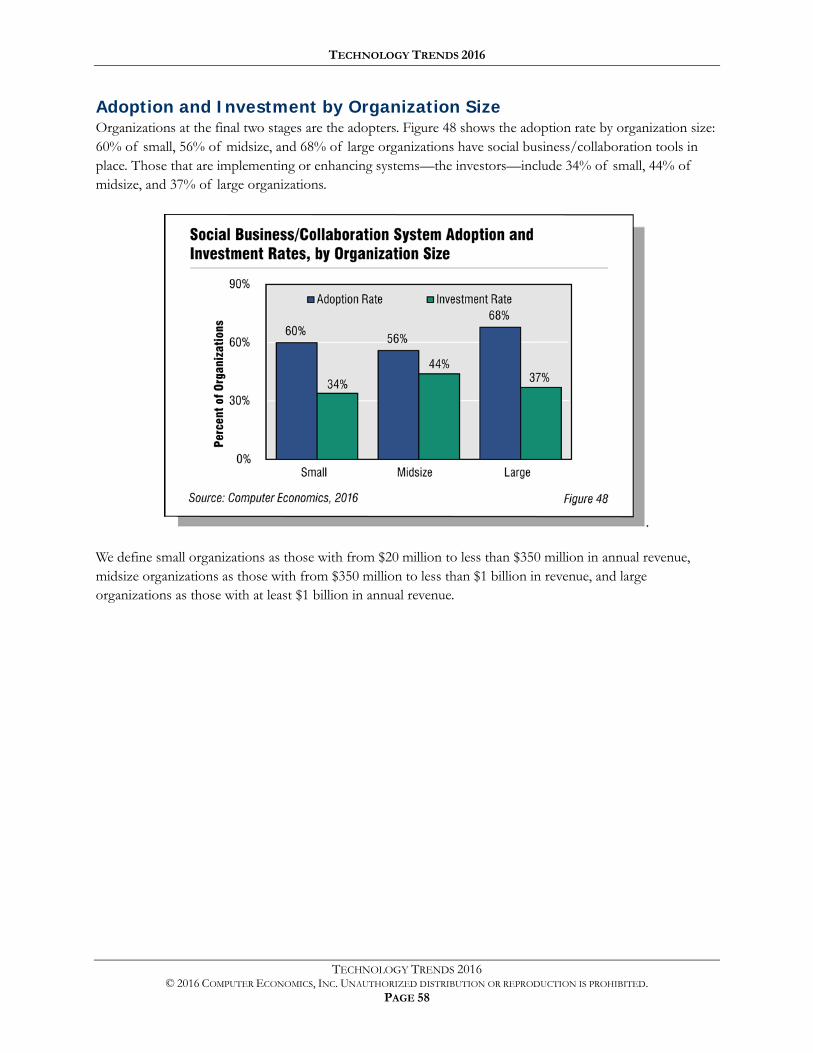
TECHNOLOGY TRENDS 2016
TECHNOLOGY TRENDS 2016 © 2016 COMPUTER ECONOMICS, INC. UNAUTHORIZED DISTRIBUTION OR REPRODUCTION IS PROHIBITED.
PAGE 58
Adoption and Investment by Organization Size Organizations at the final two stages are the adopters. Figure 48 shows the adoption rate by organization size: 60% of small, 56% of midsize, and 68% of large organizations have social business/collaboration tools in place. Those that are implementing or enhancing systems—the investors—include 34% of small, 44% of midsize, and 37% of large organizations.
.
We define small organizations as those with from $20 million to less than $350 million in annual revenue, midsize organizations as those with from $350 million to less than $1 billion in revenue, and large organizations as those with at least $1 billion in annual revenue.
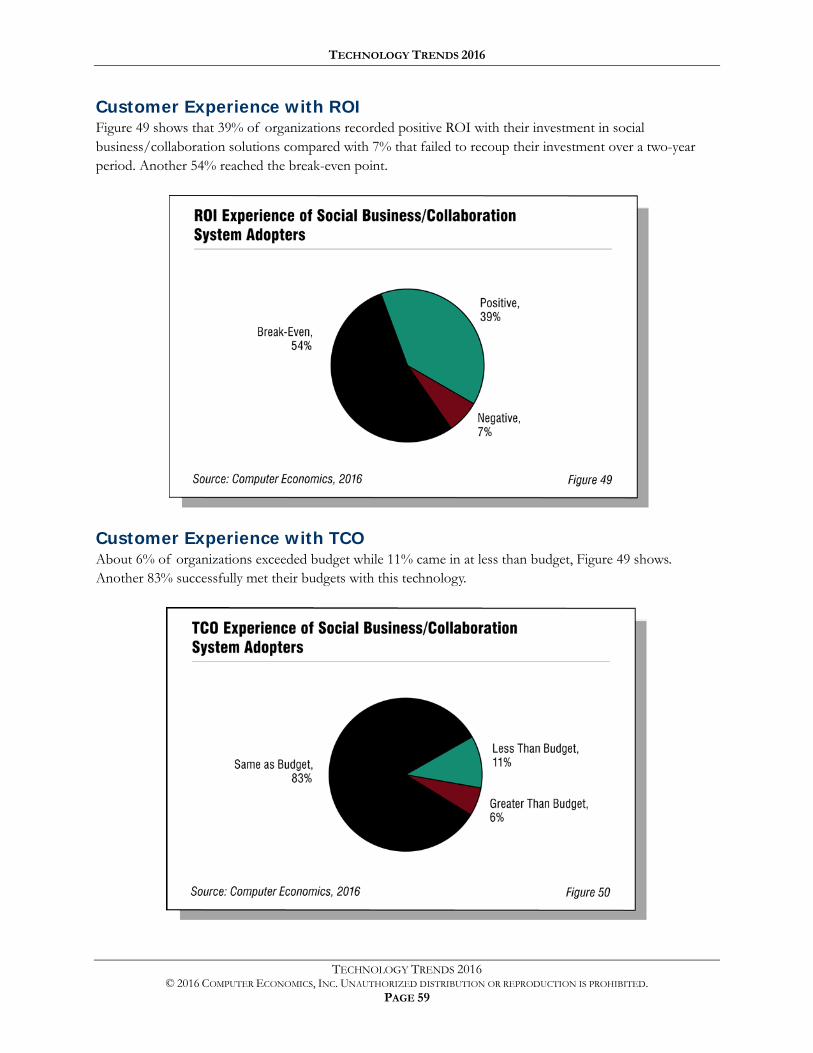
TECHNOLOGY TRENDS 2016
TECHNOLOGY TRENDS 2016 © 2016 COMPUTER ECONOMICS, INC. UNAUTHORIZED DISTRIBUTION OR REPRODUCTION IS PROHIBITED.
PAGE 59
Customer Experience with ROI Figure 49 shows that 39% of organizations recorded positive ROI with their investment in social business/collaboration solutions compared with 7% that failed to recoup their investment over a two-year period. Another 54% reached the break-even point.
Customer Experience with TCO About 6% of organizations exceeded budget while 11% came in at less than budget, Figure 49 shows. Another 83% successfully met their budgets with this technology.
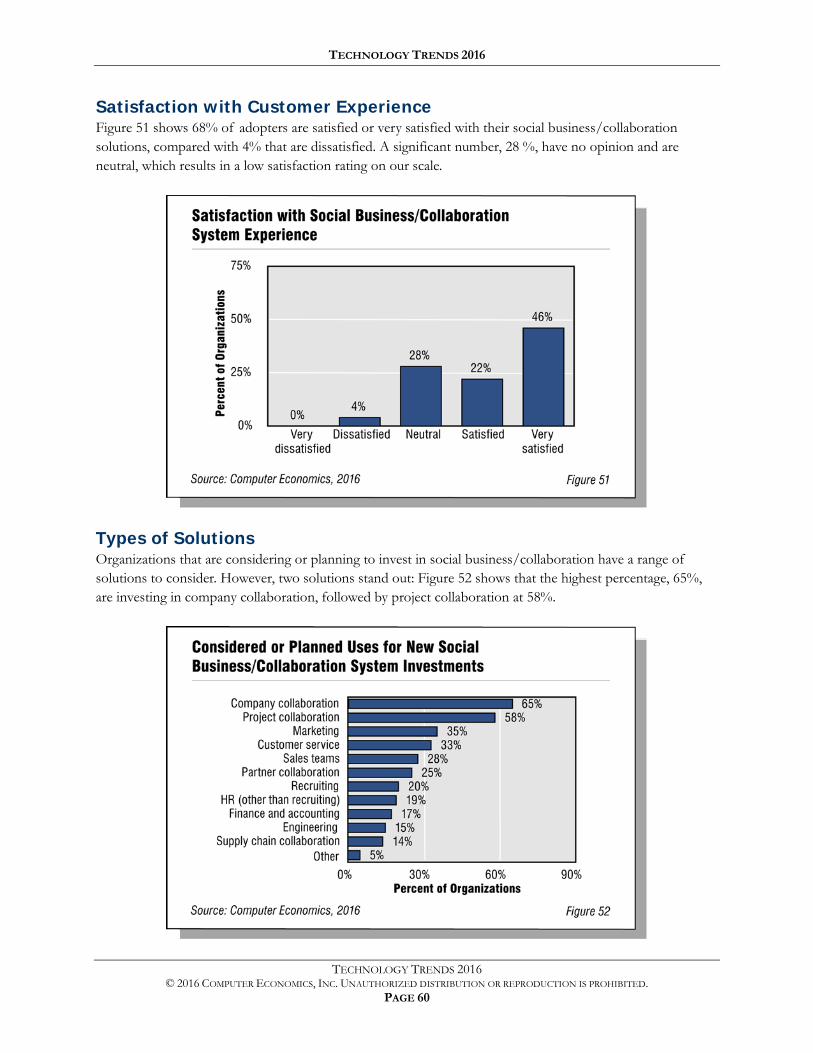
TECHNOLOGY TRENDS 2016
TECHNOLOGY TRENDS 2016 © 2016 COMPUTER ECONOMICS, INC. UNAUTHORIZED DISTRIBUTION OR REPRODUCTION IS PROHIBITED.
PAGE 60
Satisfaction with Customer Experience Figure 51 shows 68% of adopters are satisfied or very satisfied with their social business/collaboration solutions, compared with 4% that are dissatisfied. A significant number, 28 %, have no opinion and are neutral, which results in a low satisfaction rating on our scale.
Types of Solutions Organizations that are considering or planning to invest in social business/collaboration have a range of solutions to consider. However, two solutions stand out: Figure 52 shows that the highest percentage, 65%, are investing in company collaboration, followed by project collaboration at 58%.
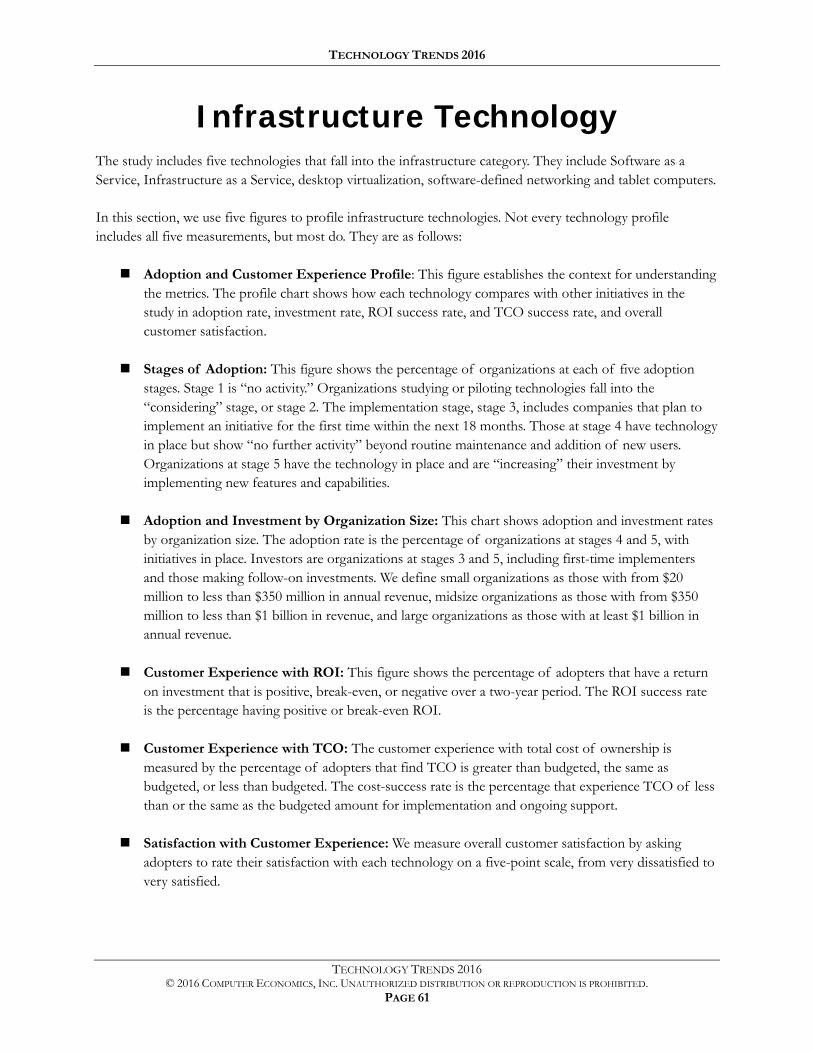
TECHNOLOGY TRENDS 2016
TECHNOLOGY TRENDS 2016 © 2016 COMPUTER ECONOMICS, INC. UNAUTHORIZED DISTRIBUTION OR REPRODUCTION IS PROHIBITED.
PAGE 61
Infrastructure Technology The study includes five technologies that fall into the infrastructure category. They include Software as a Service, Infrastructure as a Service, desktop virtualization, software-defined networking and tablet computers.
In this section, we use five figures to profile infrastructure technologies. Not every technology profile includes all five measurements, but most do. They are as follows:
Adoption and Customer Experience Profile: This figure establishes the context for understanding the metrics. The profile chart shows how each technology compares with other initiatives in the study in adoption rate, investment rate, ROI success rate, and TCO success rate, and overall customer satisfaction.
Stages of Adoption: This figure shows the percentage of organizations at each of five adoption stages. Stage 1 is “no activity.” Organizations studying or piloting technologies fall into the “considering” stage, or stage 2. The implementation stage, stage 3, includes companies that plan to implement an initiative for the first time within the next 18 months. Those at stage 4 have technology in place but show “no further activity” beyond routine maintenance and addition of new users. Organizations at stage 5 have the technology in place and are “increasing” their investment by implementing new features and capabilities.
Adoption and Investment by Organization Size: This chart shows adoption and investment rates by organization size. The adoption rate is the percentage of organizations at stages 4 and 5, with initiatives in place. Investors are organizations at stages 3 and 5, including first-time implementers and those making follow-on investments. We define small organizations as those with from $20 million to less than $350 million in annual revenue, midsize organizations as those with from $350 million to less than $1 billion in revenue, and large organizations as those with at least $1 billion in annual revenue.
Customer Experience with ROI: This figure shows the percentage of adopters that have a return on investment that is positive, break-even, or negative over a two-year period. The ROI success rate is the percentage having positive or break-even ROI.
Customer Experience with TCO: The customer experience with total cost of ownership is measured by the percentage of adopters that find TCO is greater than budgeted, the same as budgeted, or less than budgeted. The cost-success rate is the percentage that experience TCO of less than or the same as the budgeted amount for implementation and ongoing support.
Satisfaction with Customer Experience: We measure overall customer satisfaction by asking adopters to rate their satisfaction with each technology on a five-point scale, from very dissatisfied to very satisfied.
TECHNOLOGY TRENDS 2016
TECHNOLOGY TRENDS 2016 © 2016 COMPUTER ECONOMICS, INC. UNAUTHORIZED DISTRIBUTION OR REPRODUCTION IS PROHIBITED.
PAGE 62
Types of Solutions: This figure shows the percentage of investors at least considering making an investment in each type of solution within the category. We include organizations making follow-on investments and first-time implementations as well as those only considering an investment as being part of the investor population. Respondents can select from among multiple choices.
TECHNOLOGY TRENDS 2016
TECHNOLOGY TRENDS 2016 © 2016 COMPUTER ECONOMICS, INC. UNAUTHORIZED DISTRIBUTION OR REPRODUCTION IS PROHIBITED.
PAGE 63
Software as a Service
SaaS is a model whereby a software vendor hosts and delivers a business application as a service over the Internet. The service provider develops and maintains the application, which generally runs on shared infrastructure. It is usually priced on a per-user basis, sometimes with additional fees for storage, bandwidth, and implementation.
While Salesforce.com’s CRM application became perhaps the first broadly successful SaaS solution, the market today has expanded to include a broad array of applications. Other common applications include ERP, HR management, expense management, email/calendaring, collaboration and file sharing, professional services automation, and business intelligence. There also are a multitude of industry-specific business applications.
After an initial period of uncertainty, the SaaS model has now gained momentum over the past few years with organizations of all sizes. These increased adoption trends are being driven by several factors:
SaaS applications are faster, easier, and less expensive to deploy than traditional commercial software. The economic experience of those who have adopted SaaS is outstanding.
SaaS eliminates the need for business organizations to make large, up-front capital investments in software, which can lower risk and be attractive when capital is scarce.
SaaS is flexible, scalable, and easy to maintain and upgrade. It reduces the number of on-site applications the IT organization must manage from a technical perspective, freeing up IT staff time to focus on higher-value activities.
The use of SaaS can reduce or eliminate spending on data center infrastructure and personnel, reducing overall cost of IT on a per-user and percentage-of-revenue basis.
Despite the momentum behind SaaS, there are still some issues that are holding back adoption.
In many categories of applications, the functionality of traditional on-premises software is richer than what is available on-demand. This is especially true with industry-specific offerings.
Storing critical data on infrastructure not under the organization’s direct management raises concerns about security, data accessibility, privacy, and loss of control.
Organizations may find SaaS costs more over time when comparing subscription costs against the cost of licensing commercial software.
It is also important to note that although the terms “SaaS” and “cloud computing” often are used interchangeably, SaaS is just one segment of the larger cloud computing phenomenon that includes IaaS and PaaS, which we cover separately in this study.
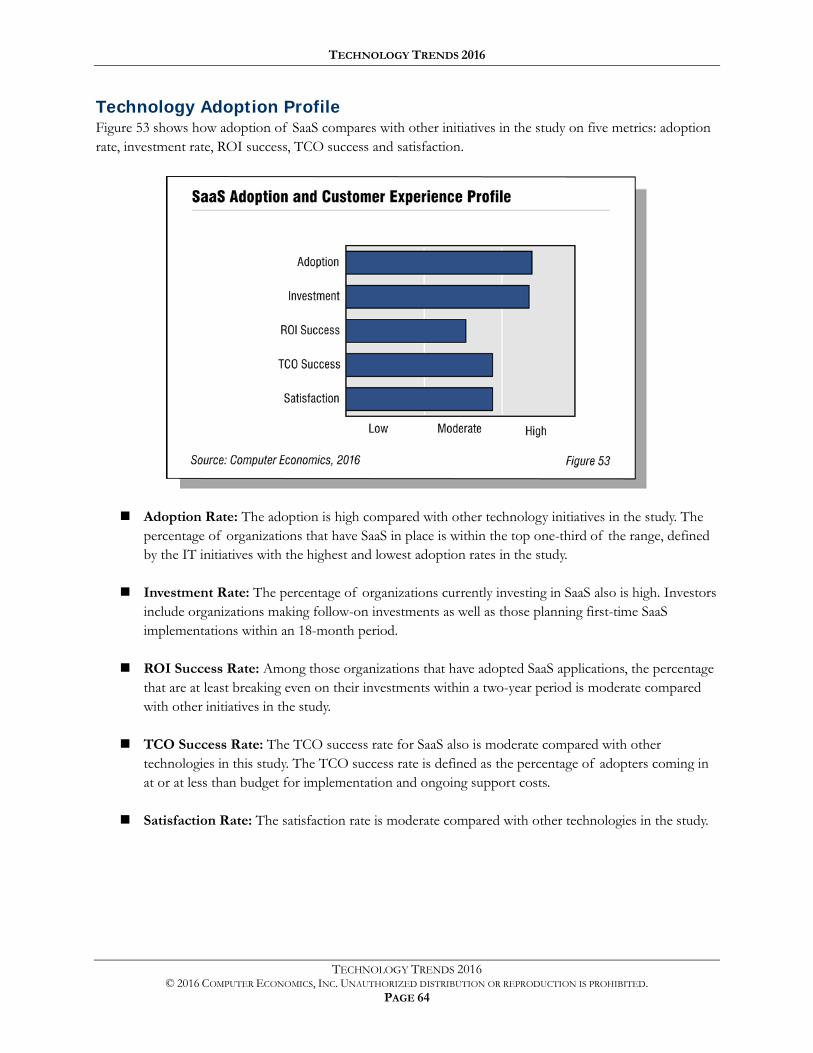
TECHNOLOGY TRENDS 2016
TECHNOLOGY TRENDS 2016 © 2016 COMPUTER ECONOMICS, INC. UNAUTHORIZED DISTRIBUTION OR REPRODUCTION IS PROHIBITED.
PAGE 64
Technology Adoption Profile Figure 53 shows how adoption of SaaS compares with other initiatives in the study on five metrics: adoption rate, investment rate, ROI success, TCO success and satisfaction.
Adoption Rate: The adoption is high compared with other technology initiatives in the study. The percentage of organizations that have SaaS in place is within the top one-third of the range, defined by the IT initiatives with the highest and lowest adoption rates in the study.
Investment Rate: The percentage of organizations currently investing in SaaS also is high. Investors include organizations making follow-on investments as well as those planning first-time SaaS implementations within an 18-month period.
ROI Success Rate: Among those organizations that have adopted SaaS applications, the percentage that are at least breaking even on their investments within a two-year period is moderate compared with other initiatives in the study.
TCO Success Rate: The TCO success rate for SaaS also is moderate compared with other technologies in this study. The TCO success rate is defined as the percentage of adopters coming in at or at less than budget for implementation and ongoing support costs.
Satisfaction Rate: The satisfaction rate is moderate compared with other technologies in the study.
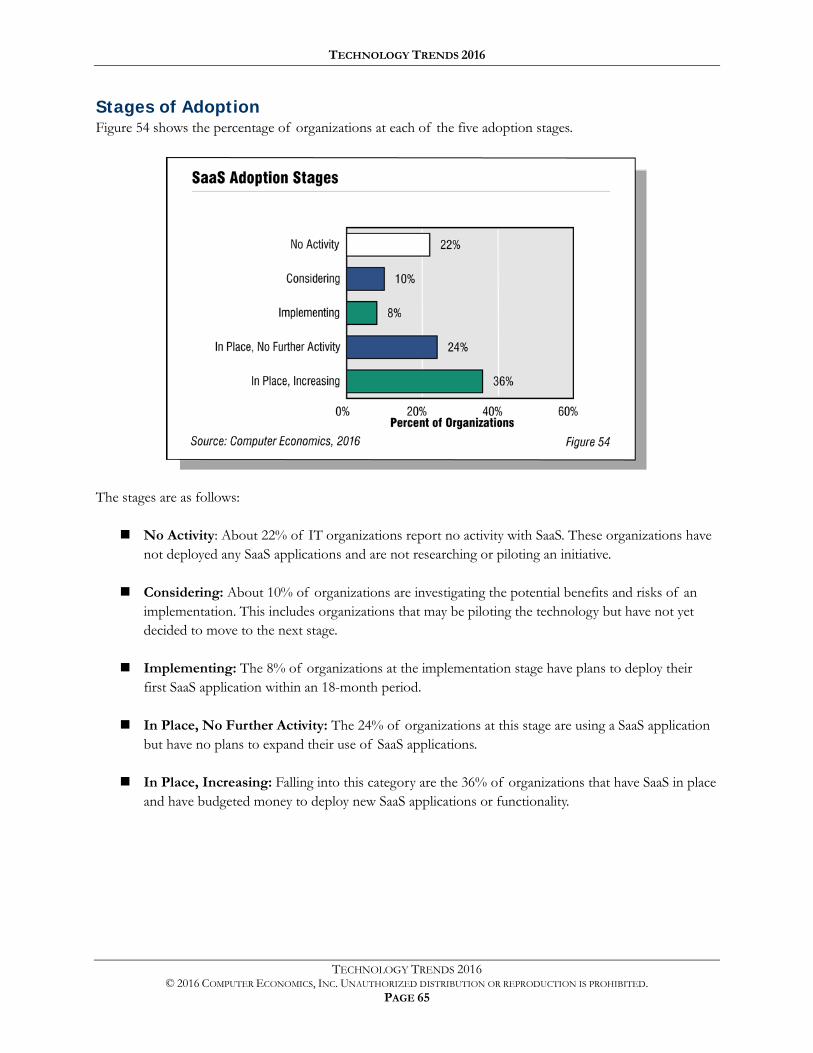
TECHNOLOGY TRENDS 2016
TECHNOLOGY TRENDS 2016 © 2016 COMPUTER ECONOMICS, INC. UNAUTHORIZED DISTRIBUTION OR REPRODUCTION IS PROHIBITED.
PAGE 65
Stages of Adoption Figure 54 shows the percentage of organizations at each of the five adoption stages.
The stages are as follows:
No Activity: About 22% of IT organizations report no activity with SaaS. These organizations have not deployed any SaaS applications and are not researching or piloting an initiative.
Considering: About 10% of organizations are investigating the potential benefits and risks of an implementation. This includes organizations that may be piloting the technology but have not yet decided to move to the next stage.
Implementing: The 8% of organizations at the implementation stage have plans to deploy their first SaaS application within an 18-month period.
In Place, No Further Activity: The 24% of organizations at this stage are using a SaaS application but have no plans to expand their use of SaaS applications.
In Place, Increasing: Falling into this category are the 36% of organizations that have SaaS in place and have budgeted money to deploy new SaaS applications or functionality.
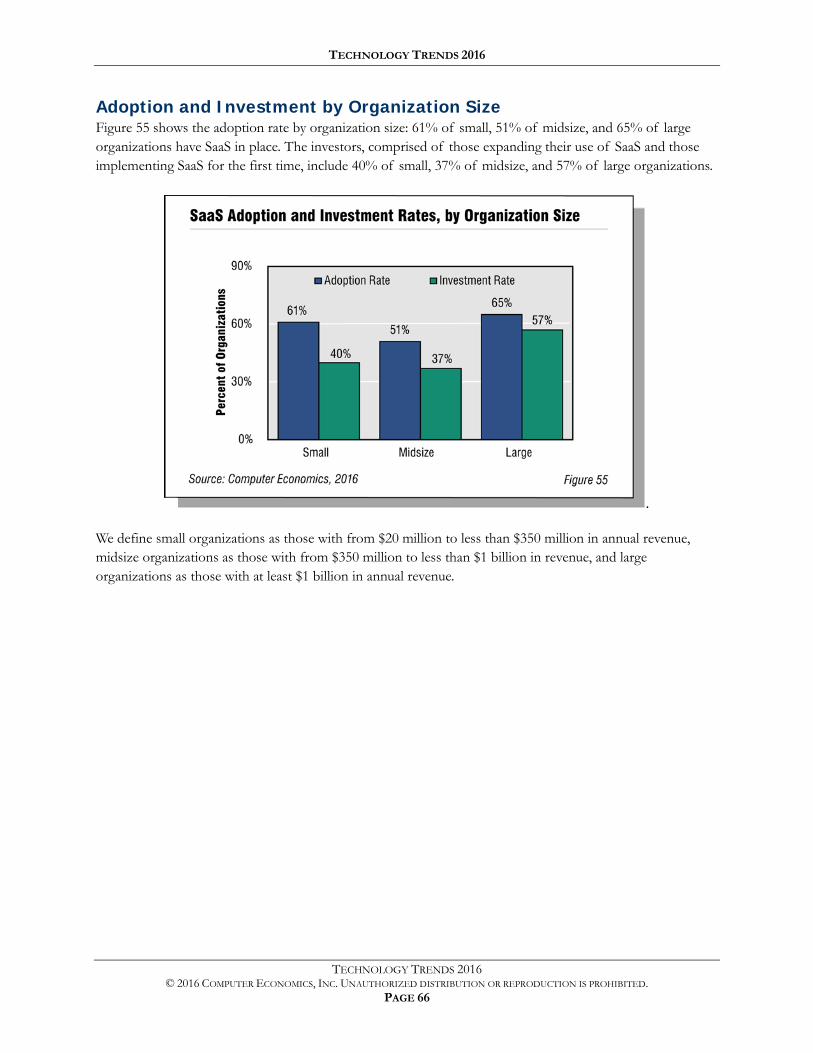
TECHNOLOGY TRENDS 2016
TECHNOLOGY TRENDS 2016 © 2016 COMPUTER ECONOMICS, INC. UNAUTHORIZED DISTRIBUTION OR REPRODUCTION IS PROHIBITED.
PAGE 66
Adoption and Investment by Organization Size Figure 55 shows the adoption rate by organization size: 61% of small, 51% of midsize, and 65% of large organizations have SaaS in place. The investors, comprised of those expanding their use of SaaS and those implementing SaaS for the first time, include 40% of small, 37% of midsize, and 57% of large organizations.
.
We define small organizations as those with from $20 million to less than $350 million in annual revenue, midsize organizations as those with from $350 million to less than $1 billion in revenue, and large organizations as those with at least $1 billion in annual revenue.
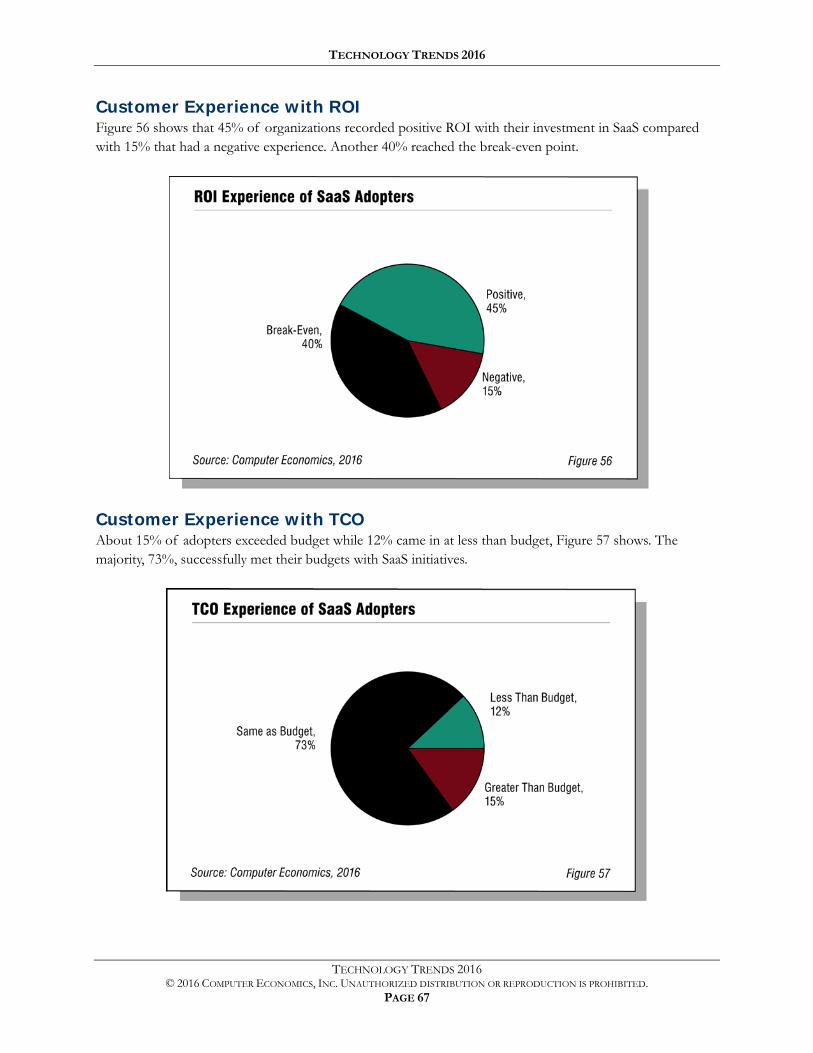
TECHNOLOGY TRENDS 2016
TECHNOLOGY TRENDS 2016 © 2016 COMPUTER ECONOMICS, INC. UNAUTHORIZED DISTRIBUTION OR REPRODUCTION IS PROHIBITED.
PAGE 67
Customer Experience with ROI Figure 56 shows that 45% of organizations recorded positive ROI with their investment in SaaS compared with 15% that had a negative experience. Another 40% reached the break-even point.
Customer Experience with TCO About 15% of adopters exceeded budget while 12% came in at less than budget, Figure 57 shows. The majority, 73%, successfully met their budgets with SaaS initiatives.
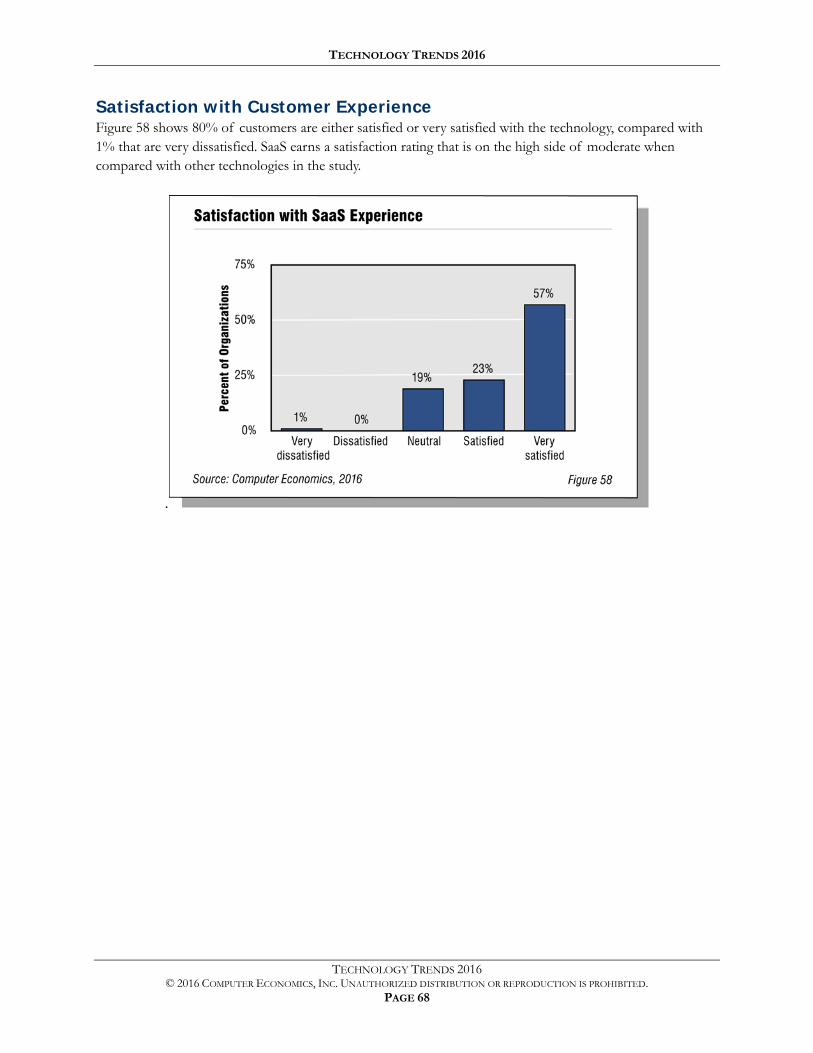
TECHNOLOGY TRENDS 2016
TECHNOLOGY TRENDS 2016 © 2016 COMPUTER ECONOMICS, INC. UNAUTHORIZED DISTRIBUTION OR REPRODUCTION IS PROHIBITED.
PAGE 68
Satisfaction with Customer Experience Figure 58 shows 80% of customers are either satisfied or very satisfied with the technology, compared with 1% that are very dissatisfied. SaaS earns a satisfaction rating that is on the high side of moderate when compared with other technologies in the study.
.
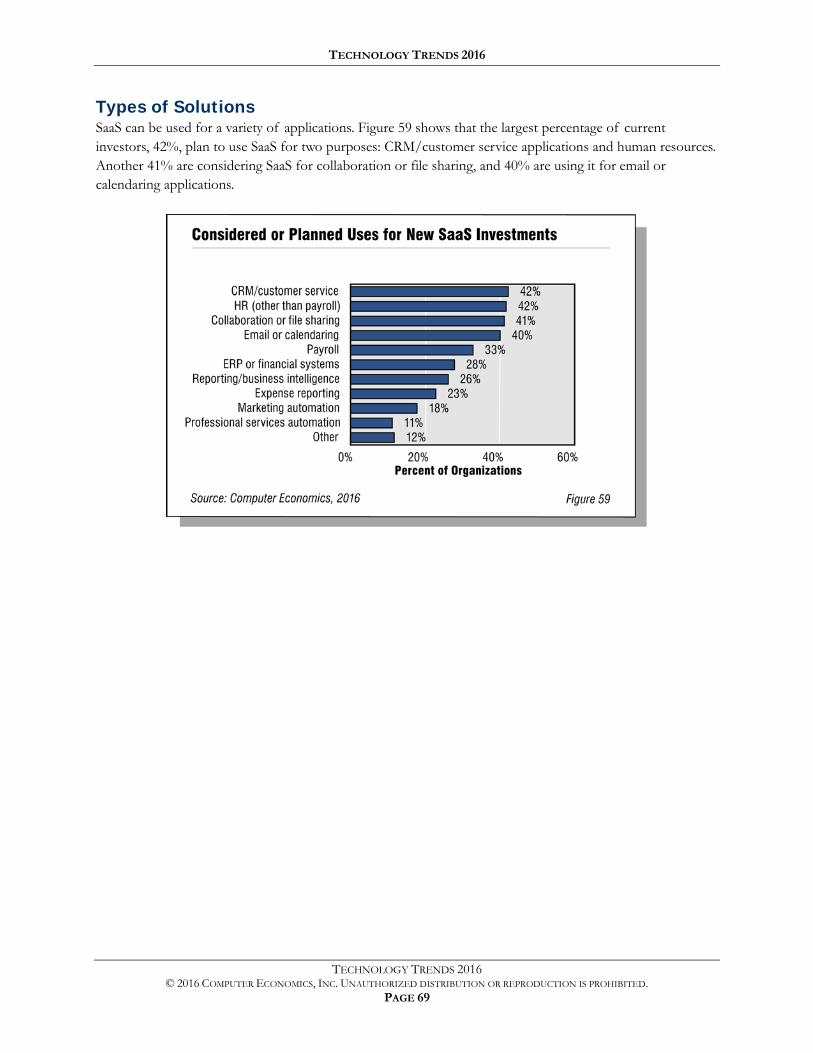
TECHNOLOGY TRENDS 2016
TECHNOLOGY TRENDS 2016 © 2016 COMPUTER ECONOMICS, INC. UNAUTHORIZED DISTRIBUTION OR REPRODUCTION IS PROHIBITED.
PAGE 69
Types of Solutions SaaS can be used for a variety of applications. Figure 59 shows that the largest percentage of current investors, 42%, plan to use SaaS for two purposes: CRM/customer service applications and human resources. Another 41% are considering SaaS for collaboration or file sharing, and 40% are using it for email or calendaring applications.
TECHNOLOGY TRENDS 2016
TECHNOLOGY TRENDS 2016 © 2016 COMPUTER ECONOMICS, INC. UNAUTHORIZED DISTRIBUTION OR REPRODUCTION IS PROHIBITED.
PAGE 70
Infrastructure as a Service
Public cloud IaaS is the use of service providers for computing resources such as storage and processing without concern about the technical infrastructure. IT organizations make use of public cloud IaaS for a variety of reasons, such as testing and system development; production systems/hosting; disaster recovery or business continuity; accommodating spikes in storage or processing requirements; and archival of inactive data. We do not count deployment of hosted or SaaS applications within this category.
Some major providers of IaaS include Amazon, Google, Microsoft, Rackspace, Terremark (a subsidiary of Verizon), and Oracle.
Public cloud IaaS remains in its infancy in business adoption, even while organizations increasingly embrace SaaS. However, increased adoption of the technology is being driven by falling costs, increased availability of commercial offerings, the convenience of metered use, and scalability. Some organizations are finding that IaaS provides a flexible and cost-effective approach to disaster recovery and archiving of historical data that would otherwise be cost-prohibitive to maintain in-house. Finally, the economic experience of early adopters has been outstanding.
Nevertheless, many organizations have been reluctant to trust their computing infrastructure to public cloud providers. In some cases there is resistance within the IT organization to moving the computing infrastructure off-site and losing control. In other cases, organizations raise security and privacy concerns about trusting the public cloud with confidential information.
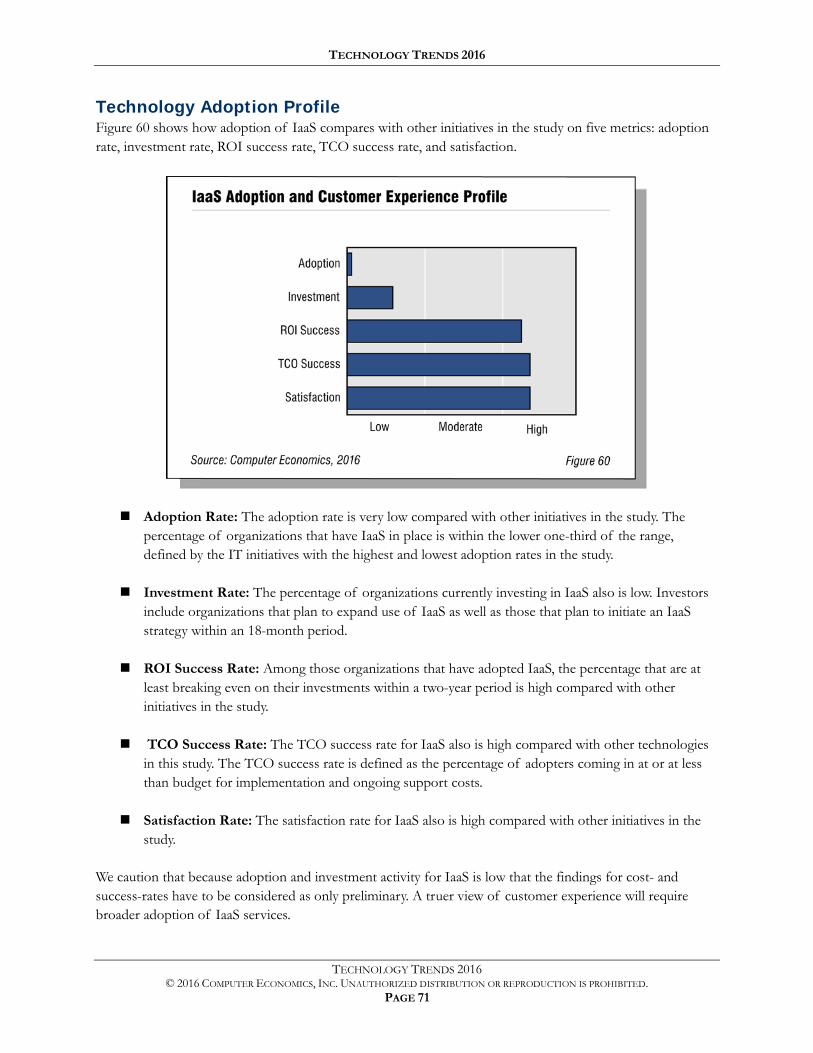
TECHNOLOGY TRENDS 2016
TECHNOLOGY TRENDS 2016 © 2016 COMPUTER ECONOMICS, INC. UNAUTHORIZED DISTRIBUTION OR REPRODUCTION IS PROHIBITED.
PAGE 71
Technology Adoption Profile Figure 60 shows how adoption of IaaS compares with other initiatives in the study on five metrics: adoption rate, investment rate, ROI success rate, TCO success rate, and satisfaction.
Adoption Rate: The adoption rate is very low compared with other initiatives in the study. The percentage of organizations that have IaaS in place is within the lower one-third of the range, defined by the IT initiatives with the highest and lowest adoption rates in the study.
Investment Rate: The percentage of organizations currently investing in IaaS also is low. Investors include organizations that plan to expand use of IaaS as well as those that plan to initiate an IaaS strategy within an 18-month period.
ROI Success Rate: Among those organizations that have adopted IaaS, the percentage that are at least breaking even on their investments within a two-year period is high compared with other initiatives in the study.
TCO Success Rate: The TCO success rate for IaaS also is high compared with other technologies in this study. The TCO success rate is defined as the percentage of adopters coming in at or at less than budget for implementation and ongoing support costs.
Satisfaction Rate: The satisfaction rate for IaaS also is high compared with other initiatives in the study.
We caution that because adoption and investment activity for IaaS is low that the findings for cost- and success-rates have to be considered as only preliminary. A truer view of customer experience will require broader adoption of IaaS services.
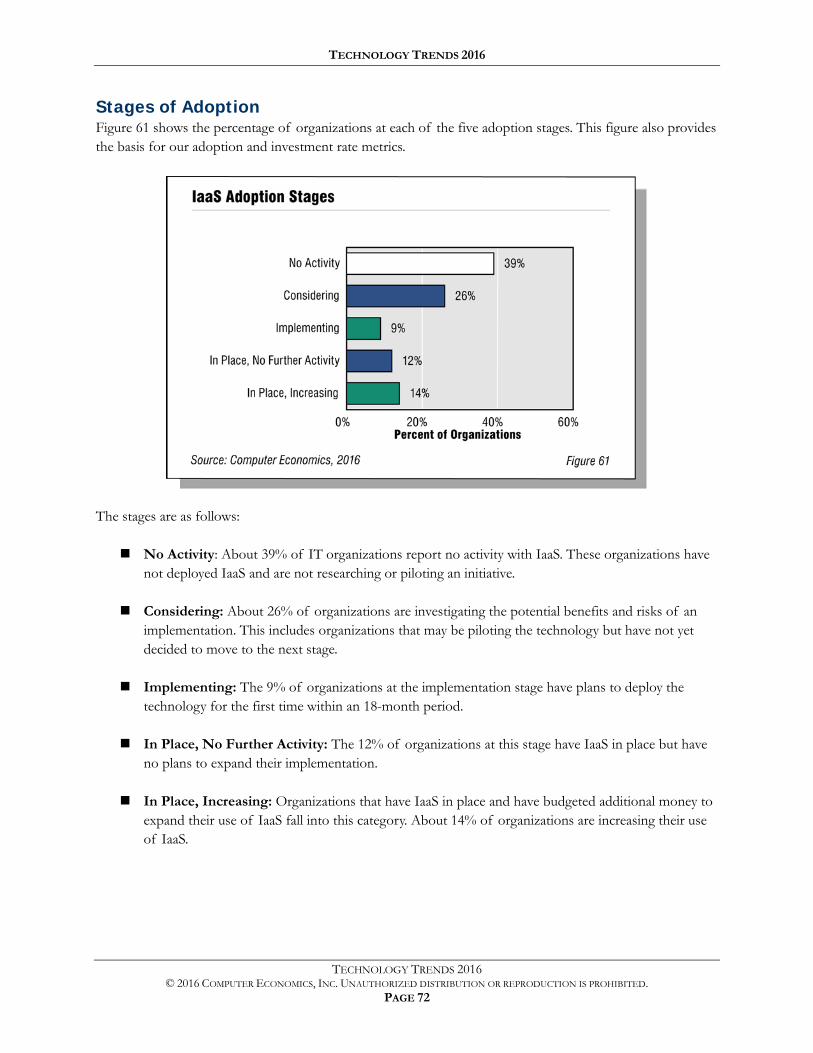
TECHNOLOGY TRENDS 2016
TECHNOLOGY TRENDS 2016 © 2016 COMPUTER ECONOMICS, INC. UNAUTHORIZED DISTRIBUTION OR REPRODUCTION IS PROHIBITED.
PAGE 72
Stages of Adoption Figure 61 shows the percentage of organizations at each of the five adoption stages. This figure also provides the basis for our adoption and investment rate metrics.
The stages are as follows:
No Activity: About 39% of IT organizations report no activity with IaaS. These organizations have not deployed IaaS and are not researching or piloting an initiative.
Considering: About 26% of organizations are investigating the potential benefits and risks of an implementation. This includes organizations that may be piloting the technology but have not yet decided to move to the next stage.
Implementing: The 9% of organizations at the implementation stage have plans to deploy the technology for the first time within an 18-month period.
In Place, No Further Activity: The 12% of organizations at this stage have IaaS in place but have no plans to expand their implementation.
In Place, Increasing: Organizations that have IaaS in place and have budgeted additional money to expand their use of IaaS fall into this category. About 14% of organizations are increasing their use of IaaS.
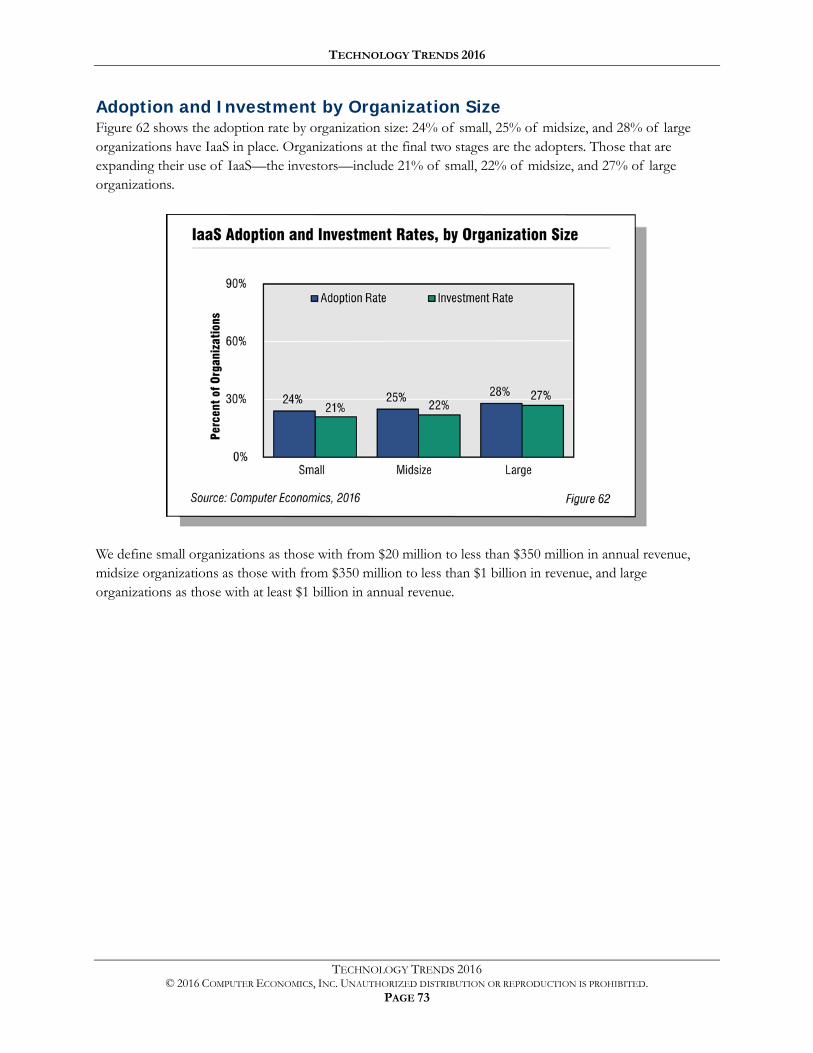
TECHNOLOGY TRENDS 2016
TECHNOLOGY TRENDS 2016 © 2016 COMPUTER ECONOMICS, INC. UNAUTHORIZED DISTRIBUTION OR REPRODUCTION IS PROHIBITED.
PAGE 73
Adoption and Investment by Organization Size Figure 62 shows the adoption rate by organization size: 24% of small, 25% of midsize, and 28% of large organizations have IaaS in place. Organizations at the final two stages are the adopters. Those that are expanding their use of IaaS—the investors—include 21% of small, 22% of midsize, and 27% of large organizations.
We define small organizations as those with from $20 million to less than $350 million in annual revenue, midsize organizations as those with from $350 million to less than $1 billion in revenue, and large organizations as those with at least $1 billion in annual revenue.
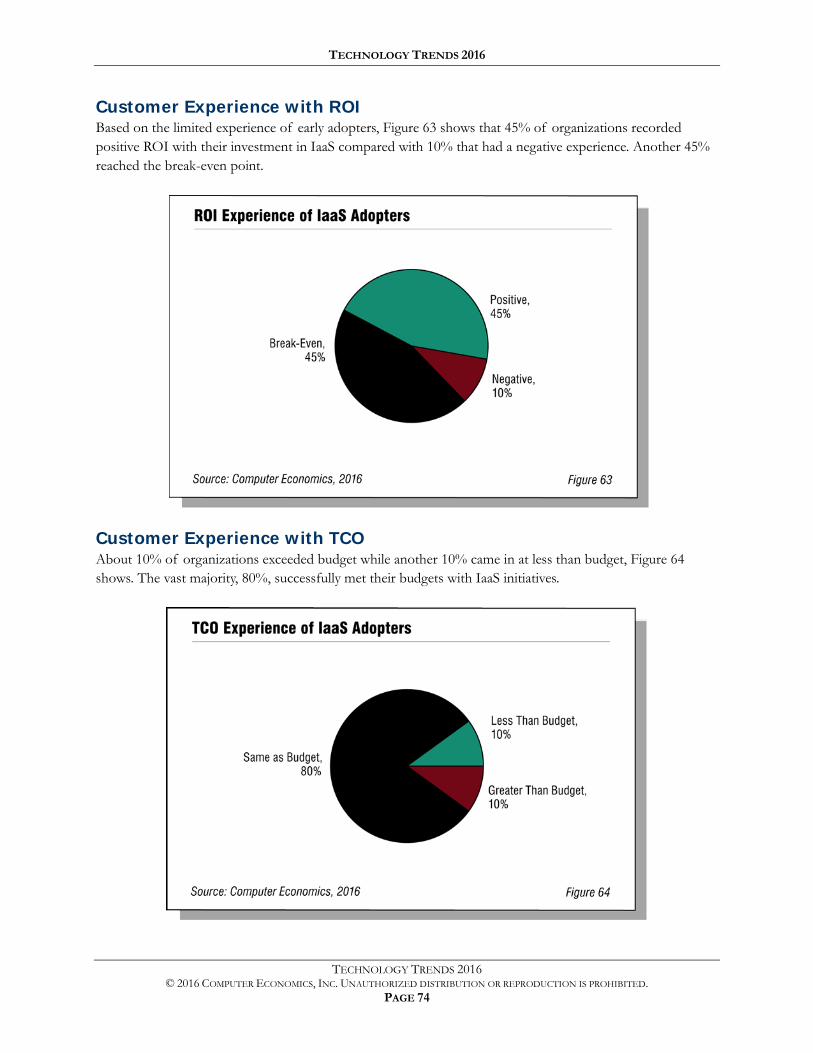
TECHNOLOGY TRENDS 2016
TECHNOLOGY TRENDS 2016 © 2016 COMPUTER ECONOMICS, INC. UNAUTHORIZED DISTRIBUTION OR REPRODUCTION IS PROHIBITED.
PAGE 74
Customer Experience with ROI Based on the limited experience of early adopters, Figure 63 shows that 45% of organizations recorded positive ROI with their investment in IaaS compared with 10% that had a negative experience. Another 45% reached the break-even point.
Customer Experience with TCO About 10% of organizations exceeded budget while another 10% came in at less than budget, Figure 64 shows. The vast majority, 80%, successfully met their budgets with IaaS initiatives.
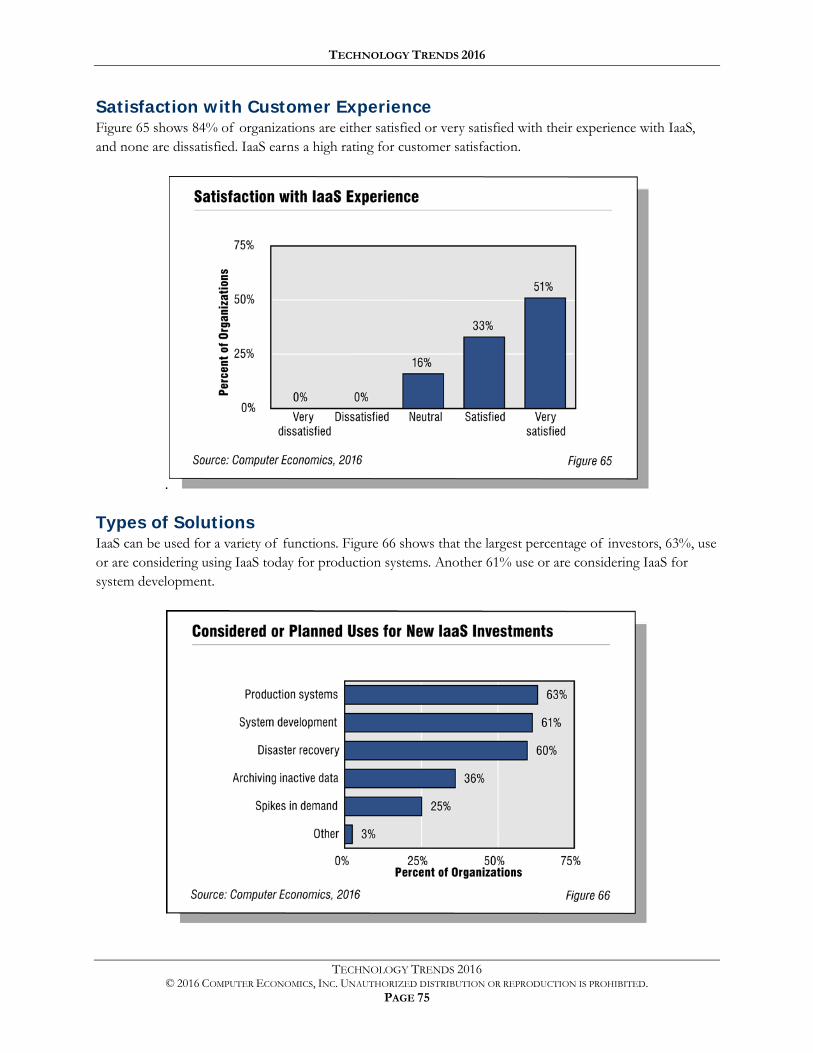
TECHNOLOGY TRENDS 2016
TECHNOLOGY TRENDS 2016 © 2016 COMPUTER ECONOMICS, INC. UNAUTHORIZED DISTRIBUTION OR REPRODUCTION IS PROHIBITED.
PAGE 75
Satisfaction with Customer Experience Figure 65 shows 84% of organizations are either satisfied or very satisfied with their experience with IaaS, and none are dissatisfied. IaaS earns a high rating for customer satisfaction.
.
Types of Solutions IaaS can be used for a variety of functions. Figure 66 shows that the largest percentage of investors, 63%, use or are considering using IaaS today for production systems. Another 61% use or are considering IaaS for system development.
TECHNOLOGY TRENDS 2016
TECHNOLOGY TRENDS 2016 © 2016 COMPUTER ECONOMICS, INC. UNAUTHORIZED DISTRIBUTION OR REPRODUCTION IS PROHIBITED.
PAGE 76
Desktop Virtualization
Like server virtualization, desktop virtualization separates the computing environment from the hardware. While desktop virtualization can be used to allow a PC to run multiple OS instances, the term most often refers to hosting and centrally managing desktop environments on a server and enabling users to access those desktop environments via a network or Internet connection, combining the personalization and functionality of a PC with the manageability of a thin-client computing architecture. Organizations can establish their own desktop virtualization systems, or they can outsource desktop virtualization to vendors that host virtual desktops in a desktop-as-a-service model. In some implementations, remote synchronization enables users to run applications while disconnected from the network.
Desktop virtualization remains early stage. After an initial burst of experimentation, adoption of virtual desktop infrastructure, or VDI, cooled somewhat along with the customer experience. The primary benefit adopters hope to achieve is dramatically lower cost of managing desktops, from provisioning new desktops to deploying and upgrading applications. Advocates also tout greater data security and reduced need to refresh desktop hardware. Desktop virtualization also can accommodate BYOD policies and enable users to access their desktops via multiple devices. Finally, for organizations concerned about security, the VDI environment promotes standardization of desktop environments and can be used to “lock down” desktops, preventing installation of unauthorized software and making it easy to remove access to a user’s desktop environment in the case of a device being lost or stolen.
On the downside, users are dependent on the network and may face network performance issues or downtime. Virtual desktops can face challenges with running multimedia applications and managing client-attached printers and other peripherals. Managing virtual desktops can be complicated, and VDI infrastructure can be expensive.
The widespread availability of VDI products is helping drive adoption. Citrix Systems has been a major player, but other vendors are also in the market. Microsoft has been enhancing its client and server software to accommodate virtualization. Oracle, Red Hat, VMware, and NComputing are in the market, while system vendors such as Hewlett Packard Enterprise, Dell, and IBM have desktop virtualization solutions.
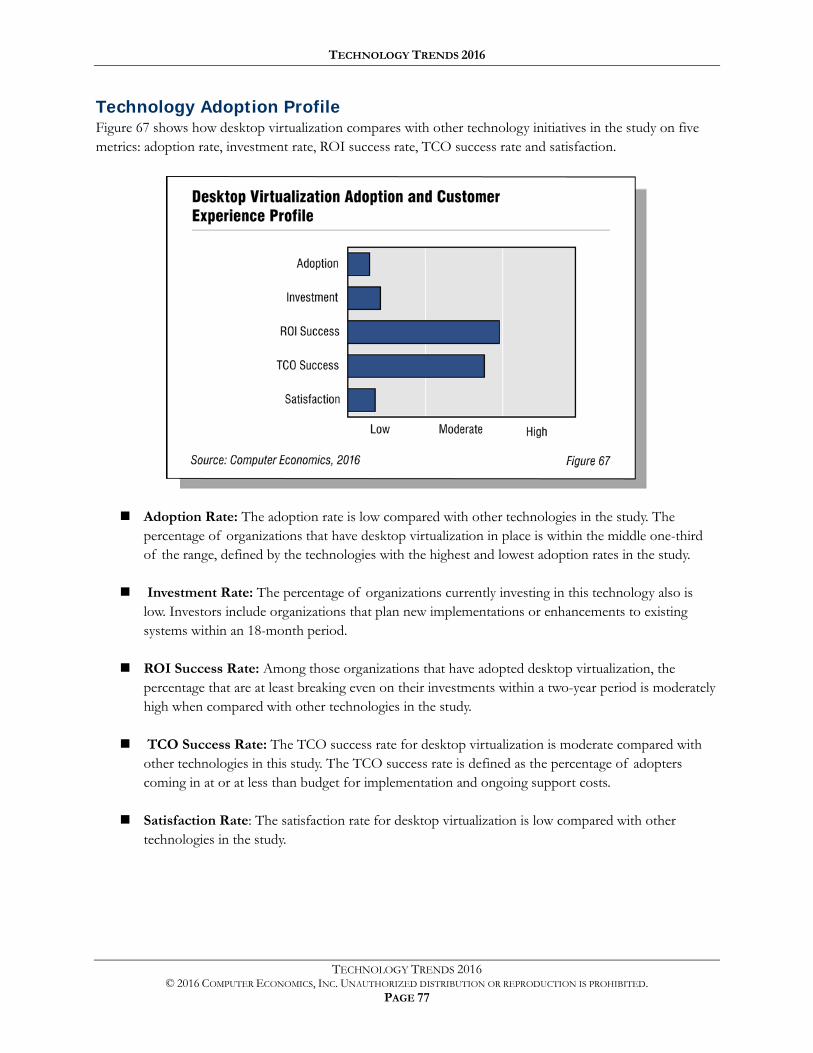
TECHNOLOGY TRENDS 2016
TECHNOLOGY TRENDS 2016 © 2016 COMPUTER ECONOMICS, INC. UNAUTHORIZED DISTRIBUTION OR REPRODUCTION IS PROHIBITED.
PAGE 77
Technology Adoption Profile Figure 67 shows how desktop virtualization compares with other technology initiatives in the study on five metrics: adoption rate, investment rate, ROI success rate, TCO success rate and satisfaction.
Adoption Rate: The adoption rate is low compared with other technologies in the study. The percentage of organizations that have desktop virtualization in place is within the middle one-third of the range, defined by the technologies with the highest and lowest adoption rates in the study.
Investment Rate: The percentage of organizations currently investing in this technology also is low. Investors include organizations that plan new implementations or enhancements to existing systems within an 18-month period.
ROI Success Rate: Among those organizations that have adopted desktop virtualization, the percentage that are at least breaking even on their investments within a two-year period is moderately high when compared with other technologies in the study.
TCO Success Rate: The TCO success rate for desktop virtualization is moderate compared with other technologies in this study. The TCO success rate is defined as the percentage of adopters coming in at or at less than budget for implementation and ongoing support costs.
Satisfaction Rate: The satisfaction rate for desktop virtualization is low compared with other technologies in the study.
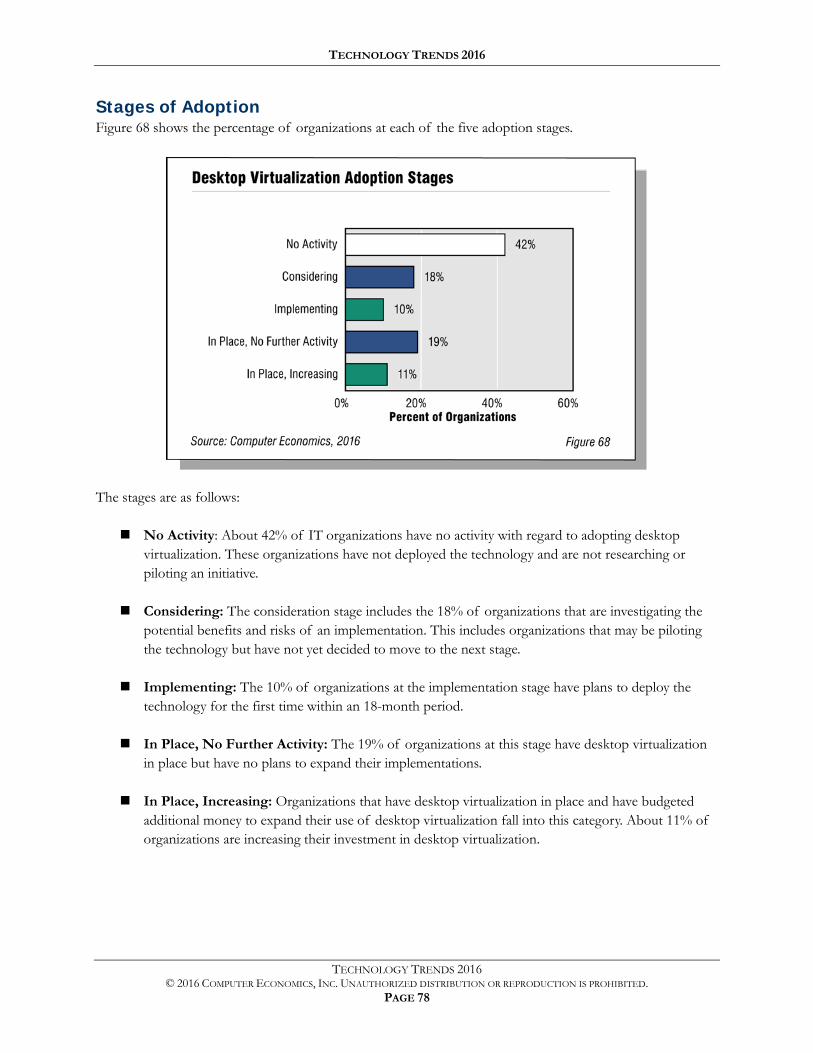
TECHNOLOGY TRENDS 2016
TECHNOLOGY TRENDS 2016 © 2016 COMPUTER ECONOMICS, INC. UNAUTHORIZED DISTRIBUTION OR REPRODUCTION IS PROHIBITED.
PAGE 78
Stages of Adoption Figure 68 shows the percentage of organizations at each of the five adoption stages.
The stages are as follows:
No Activity: About 42% of IT organizations have no activity with regard to adopting desktop virtualization. These organizations have not deployed the technology and are not researching or piloting an initiative.
Considering: The consideration stage includes the 18% of organizations that are investigating the potential benefits and risks of an implementation. This includes organizations that may be piloting the technology but have not yet decided to move to the next stage.
Implementing: The 10% of organizations at the implementation stage have plans to deploy the technology for the first time within an 18-month period.
In Place, No Further Activity: The 19% of organizations at this stage have desktop virtualization in place but have no plans to expand their implementations.
In Place, Increasing: Organizations that have desktop virtualization in place and have budgeted additional money to expand their use of desktop virtualization fall into this category. About 11% of organizations are increasing their investment in desktop virtualization.
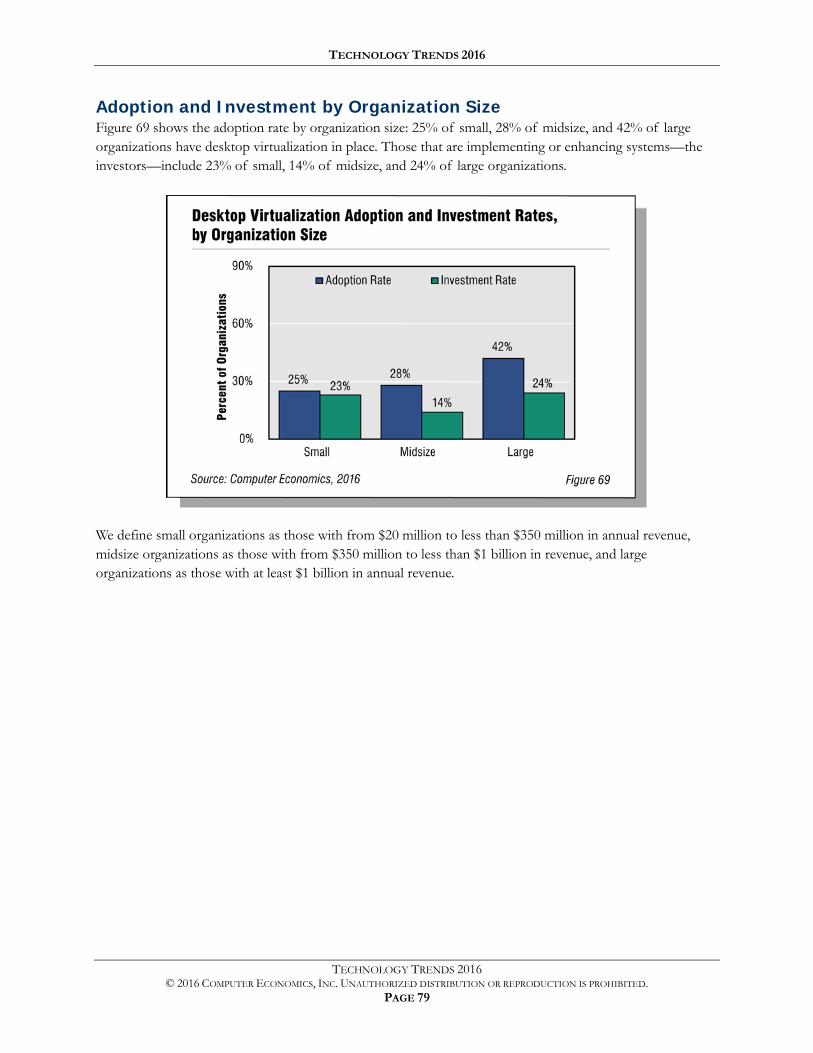
TECHNOLOGY TRENDS 2016
TECHNOLOGY TRENDS 2016 © 2016 COMPUTER ECONOMICS, INC. UNAUTHORIZED DISTRIBUTION OR REPRODUCTION IS PROHIBITED.
PAGE 79
Adoption and Investment by Organization Size Figure 69 shows the adoption rate by organization size: 25% of small, 28% of midsize, and 42% of large organizations have desktop virtualization in place. Those that are implementing or enhancing systems—the investors—include 23% of small, 14% of midsize, and 24% of large organizations.
We define small organizations as those with from $20 million to less than $350 million in annual revenue, midsize organizations as those with from $350 million to less than $1 billion in revenue, and large organizations as those with at least $1 billion in annual revenue.
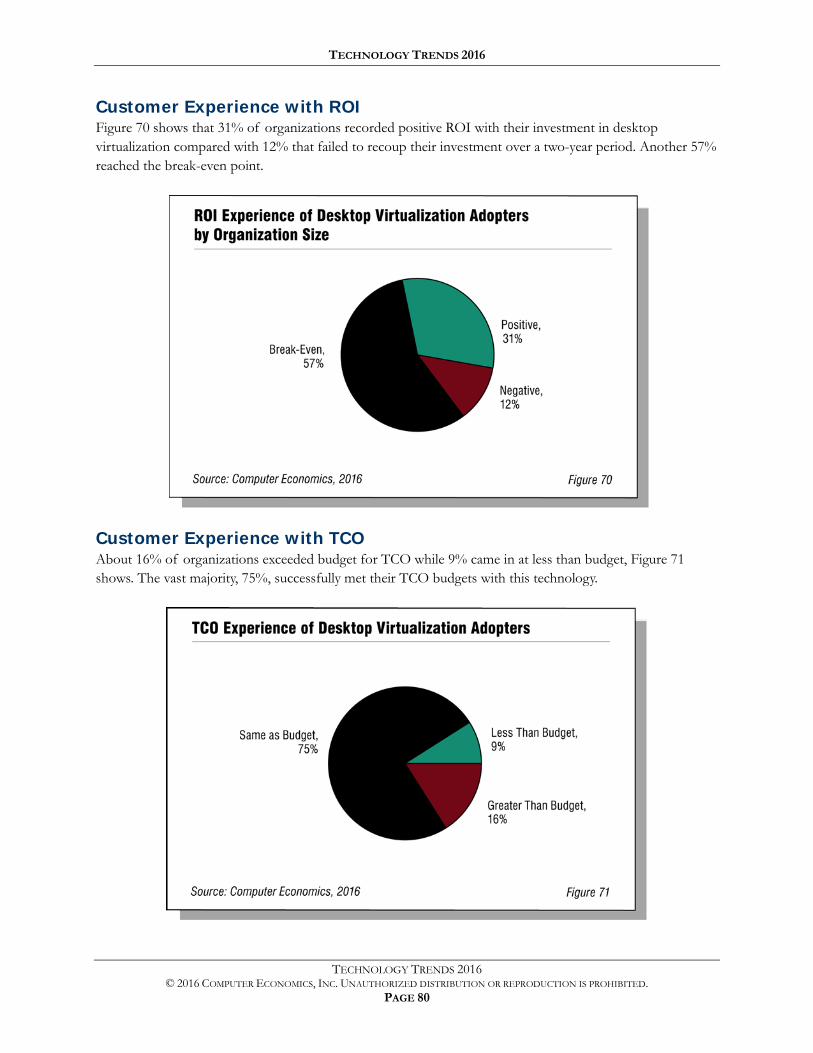
TECHNOLOGY TRENDS 2016
TECHNOLOGY TRENDS 2016 © 2016 COMPUTER ECONOMICS, INC. UNAUTHORIZED DISTRIBUTION OR REPRODUCTION IS PROHIBITED.
PAGE 80
Customer Experience with ROI Figure 70 shows that 31% of organizations recorded positive ROI with their investment in desktop virtualization compared with 12% that failed to recoup their investment over a two-year period. Another 57% reached the break-even point.
Customer Experience with TCO About 16% of organizations exceeded budget for TCO while 9% came in at less than budget, Figure 71 shows. The vast majority, 75%, successfully met their TCO budgets with this technology.
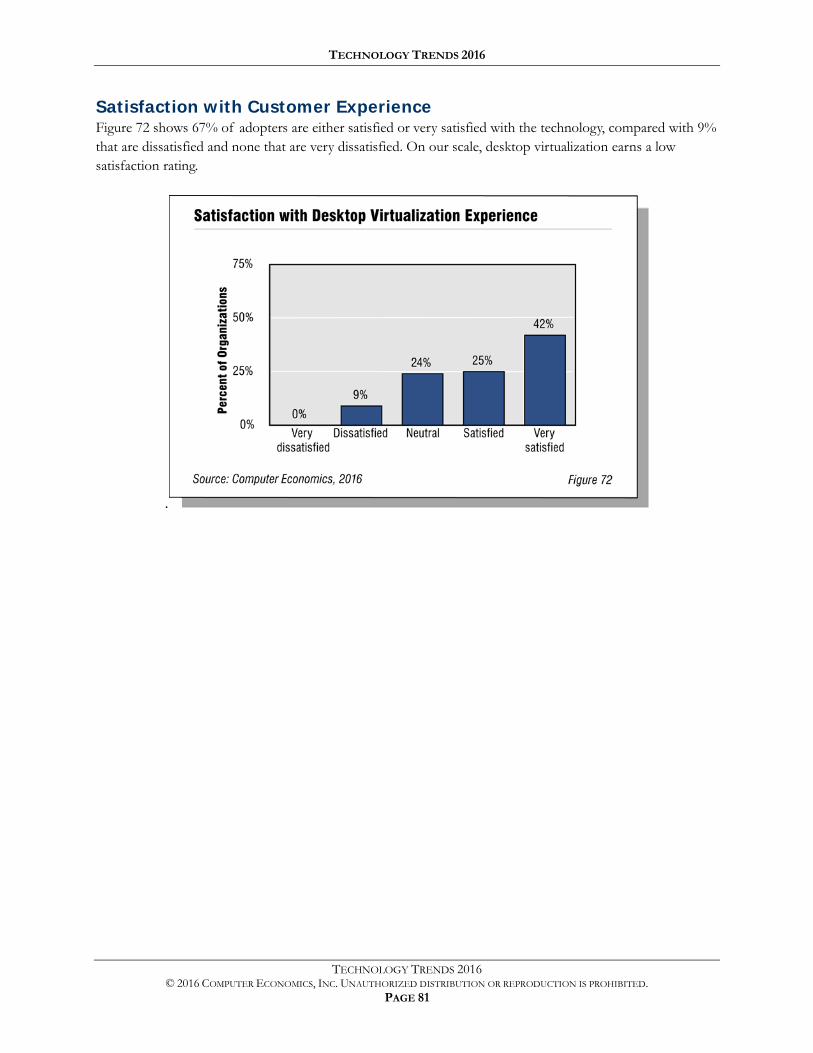
TECHNOLOGY TRENDS 2016
TECHNOLOGY TRENDS 2016 © 2016 COMPUTER ECONOMICS, INC. UNAUTHORIZED DISTRIBUTION OR REPRODUCTION IS PROHIBITED.
PAGE 81
Satisfaction with Customer Experience Figure 72 shows 67% of adopters are either satisfied or very satisfied with the technology, compared with 9% that are dissatisfied and none that are very dissatisfied. On our scale, desktop virtualization earns a low satisfaction rating.
.
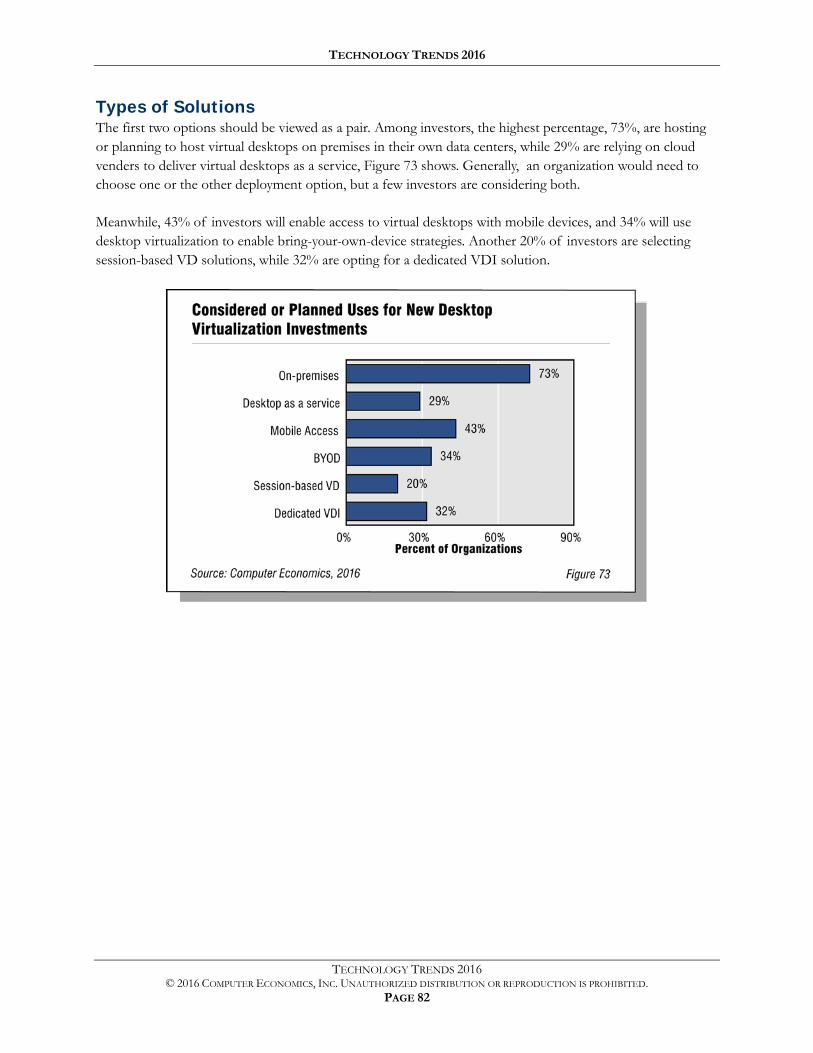
TECHNOLOGY TRENDS 2016
TECHNOLOGY TRENDS 2016 © 2016 COMPUTER ECONOMICS, INC. UNAUTHORIZED DISTRIBUTION OR REPRODUCTION IS PROHIBITED.
PAGE 82
Types of Solutions The first two options should be viewed as a pair. Among investors, the highest percentage, 73%, are hosting or planning to host virtual desktops on premises in their own data centers, while 29% are relying on cloud venders to deliver virtual desktops as a service, Figure 73 shows. Generally, an organization would need to choose one or the other deployment option, but a few investors are considering both.
Meanwhile, 43% of investors will enable access to virtual desktops with mobile devices, and 34% will use desktop virtualization to enable bring-your-own-device strategies. Another 20% of investors are selecting session-based VD solutions, while 32% are opting for a dedicated VDI solution.
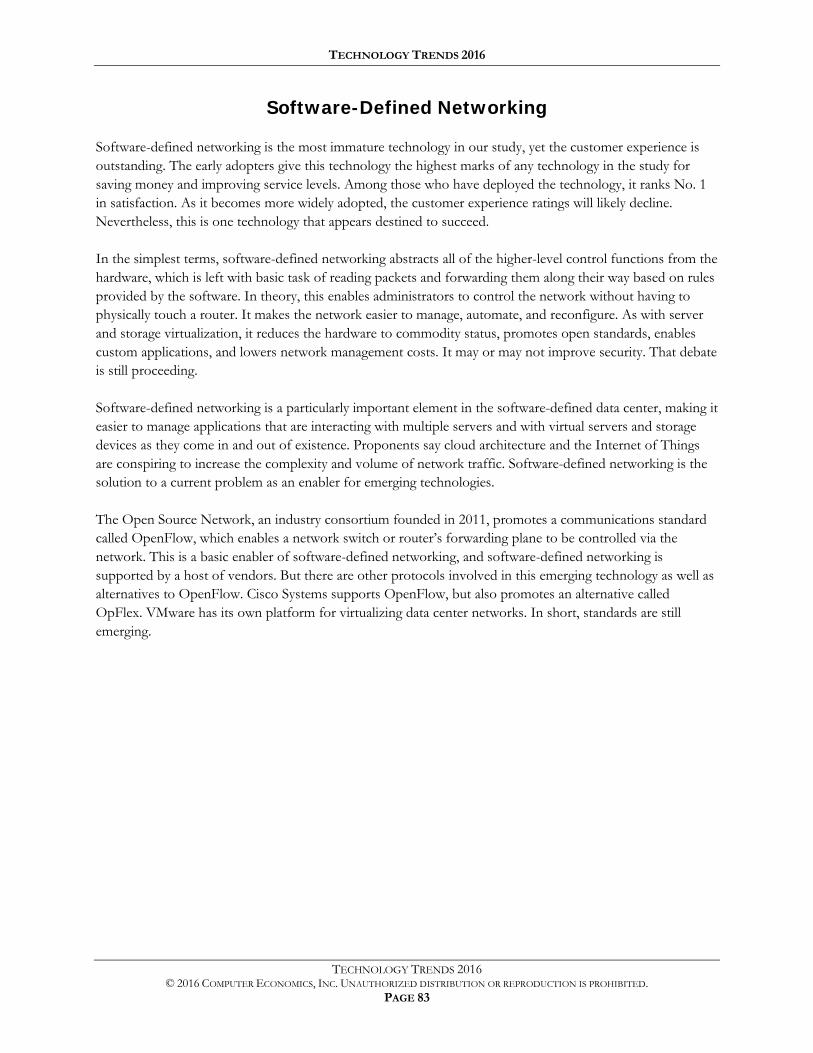
TECHNOLOGY TRENDS 2016
TECHNOLOGY TRENDS 2016 © 2016 COMPUTER ECONOMICS, INC. UNAUTHORIZED DISTRIBUTION OR REPRODUCTION IS PROHIBITED.
PAGE 83
Software-Defined Networking
Software-defined networking is the most immature technology in our study, yet the customer experience is outstanding. The early adopters give this technology the highest marks of any technology in the study for saving money and improving service levels. Among those who have deployed the technology, it ranks No. 1 in satisfaction. As it becomes more widely adopted, the customer experience ratings will likely decline. Nevertheless, this is one technology that appears destined to succeed.
In the simplest terms, software-defined networking abstracts all of the higher-level control functions from the hardware, which is left with basic task of reading packets and forwarding them along their way based on rules provided by the software. In theory, this enables administrators to control the network without having to physically touch a router. It makes the network easier to manage, automate, and reconfigure. As with server and storage virtualization, it reduces the hardware to commodity status, promotes open standards, enables custom applications, and lowers network management costs. It may or may not improve security. That debate is still proceeding.
Software-defined networking is a particularly important element in the software-defined data center, making it easier to manage applications that are interacting with multiple servers and with virtual servers and storage devices as they come in and out of existence. Proponents say cloud architecture and the Internet of Things are conspiring to increase the complexity and volume of network traffic. Software-defined networking is the solution to a current problem as an enabler for emerging technologies.
The Open Source Network, an industry consortium founded in 2011, promotes a communications standard called OpenFlow, which enables a network switch or router’s forwarding plane to be controlled via the network. This is a basic enabler of software-defined networking, and software-defined networking is supported by a host of vendors. But there are other protocols involved in this emerging technology as well as alternatives to OpenFlow. Cisco Systems supports OpenFlow, but also promotes an alternative called OpFlex. VMware has its own platform for virtualizing data center networks. In short, standards are still emerging.
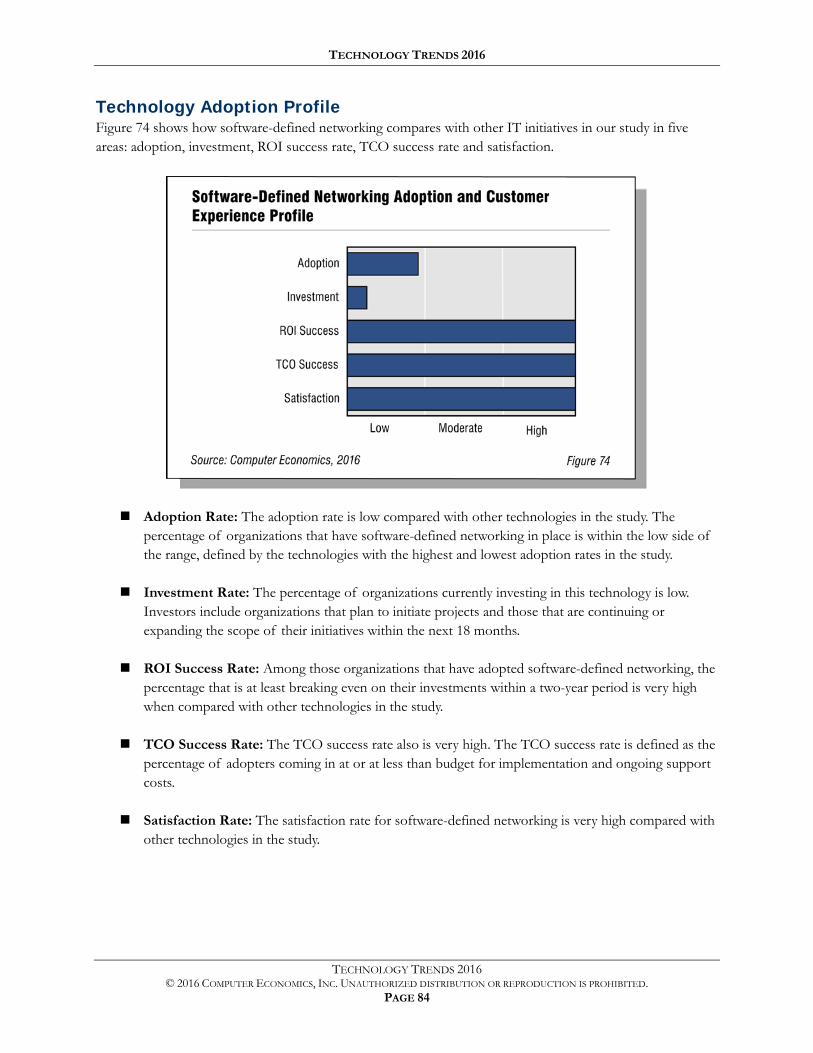
TECHNOLOGY TRENDS 2016
TECHNOLOGY TRENDS 2016 © 2016 COMPUTER ECONOMICS, INC. UNAUTHORIZED DISTRIBUTION OR REPRODUCTION IS PROHIBITED.
PAGE 84
Technology Adoption Profile Figure 74 shows how software-defined networking compares with other IT initiatives in our study in five areas: adoption, investment, ROI success rate, TCO success rate and satisfaction.
Adoption Rate: The adoption rate is low compared with other technologies in the study. The percentage of organizations that have software-defined networking in place is within the low side of the range, defined by the technologies with the highest and lowest adoption rates in the study.
Investment Rate: The percentage of organizations currently investing in this technology is low. Investors include organizations that plan to initiate projects and those that are continuing or expanding the scope of their initiatives within the next 18 months.
ROI Success Rate: Among those organizations that have adopted software-defined networking, the percentage that is at least breaking even on their investments within a two-year period is very high when compared with other technologies in the study.
TCO Success Rate: The TCO success rate also is very high. The TCO success rate is defined as the percentage of adopters coming in at or at less than budget for implementation and ongoing support costs.
Satisfaction Rate: The satisfaction rate for software-defined networking is very high compared with other technologies in the study.
TECHNOLOGY TRENDS 2016
TECHNOLOGY TRENDS 2016 © 2016 COMPUTER ECONOMICS, INC. UNAUTHORIZED DISTRIBUTION OR REPRODUCTION IS PROHIBITED.
PAGE 85
Stages of Adoption Figure 75 shows the percentage of organizations at each of the five adoption stages.
The stages are as follows:
No Activity: About 43% of IT organizations report no activity with software-defined networking. They do not have systems and are not researching or piloting solutions.
Considering: The consideration stage includes the 13% of organizations that are investigating the potential benefits and risks of adopting a solution.
Implementing: The 5% of organizations at the implementation stage have plans to implement software-defined networking in an 18-month period.
In Place, No Further Activity: About 25% of organizations have systems in place but have no plans to add additional functionality to their systems.
In Place, Increasing: Organizations that have software-defined networking technology and are continuing to invest in it fall into this category. About 14% of organizations are increasing their investment in software-defined networking.
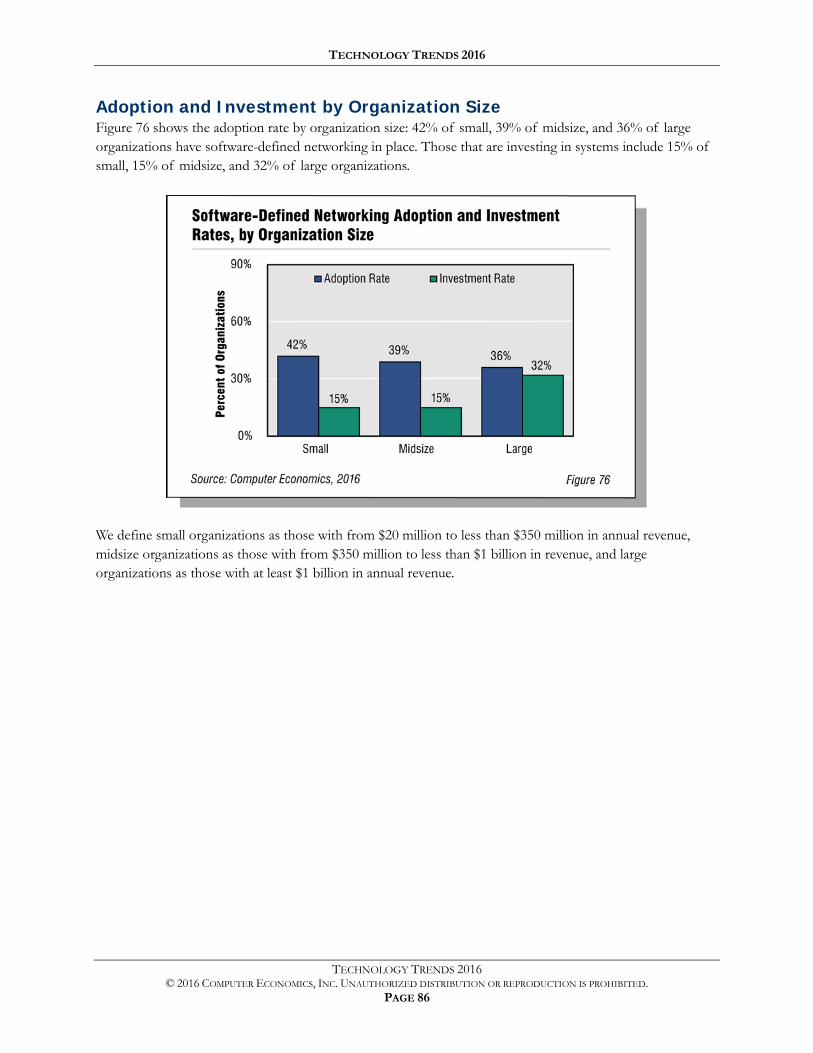
TECHNOLOGY TRENDS 2016
TECHNOLOGY TRENDS 2016 © 2016 COMPUTER ECONOMICS, INC. UNAUTHORIZED DISTRIBUTION OR REPRODUCTION IS PROHIBITED.
PAGE 86
Adoption and Investment by Organization Size Figure 76 shows the adoption rate by organization size: 42% of small, 39% of midsize, and 36% of large organizations have software-defined networking in place. Those that are investing in systems include 15% of small, 15% of midsize, and 32% of large organizations.
We define small organizations as those with from $20 million to less than $350 million in annual revenue, midsize organizations as those with from $350 million to less than $1 billion in revenue, and large organizations as those with at least $1 billion in annual revenue.
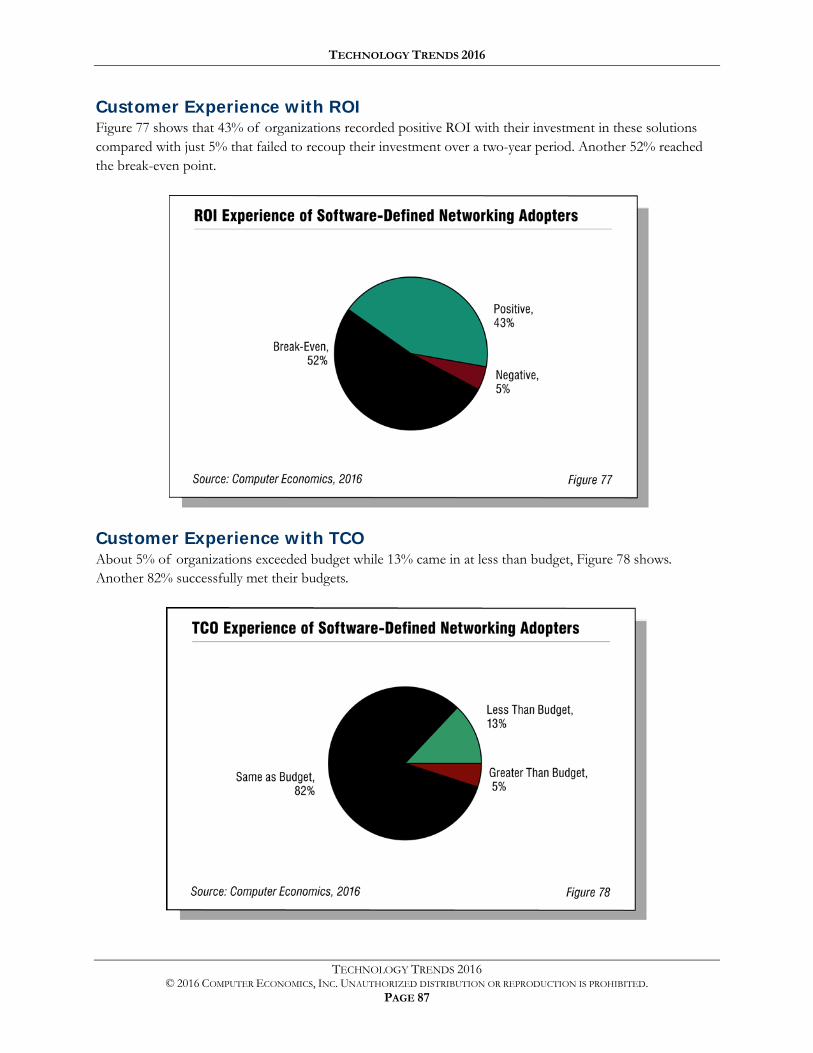
TECHNOLOGY TRENDS 2016
TECHNOLOGY TRENDS 2016 © 2016 COMPUTER ECONOMICS, INC. UNAUTHORIZED DISTRIBUTION OR REPRODUCTION IS PROHIBITED.
PAGE 87
Customer Experience with ROI Figure 77 shows that 43% of organizations recorded positive ROI with their investment in these solutions compared with just 5% that failed to recoup their investment over a two-year period. Another 52% reached the break-even point.
Customer Experience with TCO About 5% of organizations exceeded budget while 13% came in at less than budget, Figure 78 shows. Another 82% successfully met their budgets.
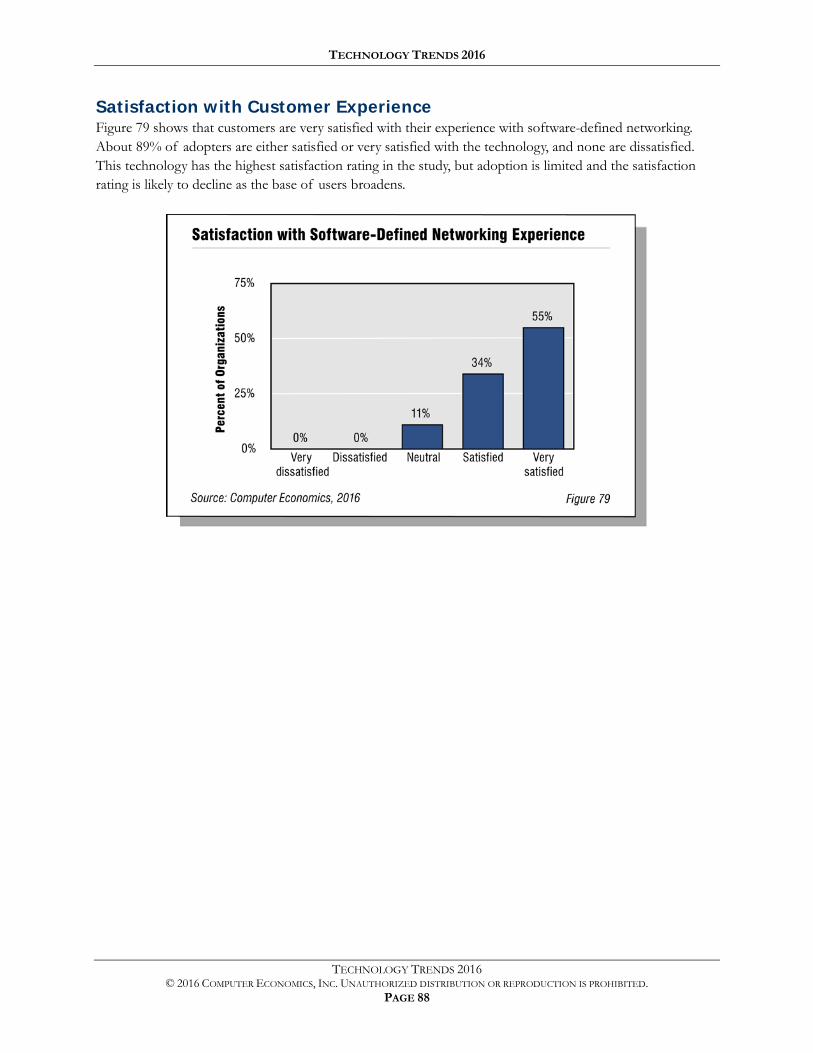
TECHNOLOGY TRENDS 2016
TECHNOLOGY TRENDS 2016 © 2016 COMPUTER ECONOMICS, INC. UNAUTHORIZED DISTRIBUTION OR REPRODUCTION IS PROHIBITED.
PAGE 88
Satisfaction with Customer Experience Figure 79 shows that customers are very satisfied with their experience with software-defined networking. About 89% of adopters are either satisfied or very satisfied with the technology, and none are dissatisfied. This technology has the highest satisfaction rating in the study, but adoption is limited and the satisfaction rating is likely to decline as the base of users broadens.
TECHNOLOGY TRENDS 2016
TECHNOLOGY TRENDS 2016 © 2016 COMPUTER ECONOMICS, INC. UNAUTHORIZED DISTRIBUTION OR REPRODUCTION IS PROHIBITED.
PAGE 89
Tablet Computers
Tablet computers have become mainstream in the enterprise, moving beyond deployment with vertical-market applications in healthcare, insurance, real estate, restaurants, and other industries.
The category is dominated by Apple’s iPad but it also includes Windows- and Android-based systems from vendors such as Microsoft, HP Inc., Samsung, Google, Acer, and others. Falling prices, growing capabilities, competing operating systems, and new, enhanced apps help build momentum for tablet computer sales.
Tablet computers bring certain benefits such as enhanced worker productivity. They enable the use of mobile applications in areas where traditional computers may be cumbersome. They are typically faster to boot up and more convenient to use than laptops, although they may lack their full functionality.
On the other hand, the growing use of tablets present security and privacy concerns for IT organizations that need to support them on the network. Another drawback is the lack of interoperability with other laptops and servers. Many organizations also face a challenge developing acceptable use policies for tablet devices in the workplace.
Nevertheless, tablets are growing in popularity. They are more of a supplement than a replacement for laptops. Tablets are the latest example of the consumerization of IT as individual departments within the organization push for the inclusion of tablets to support mobile users.
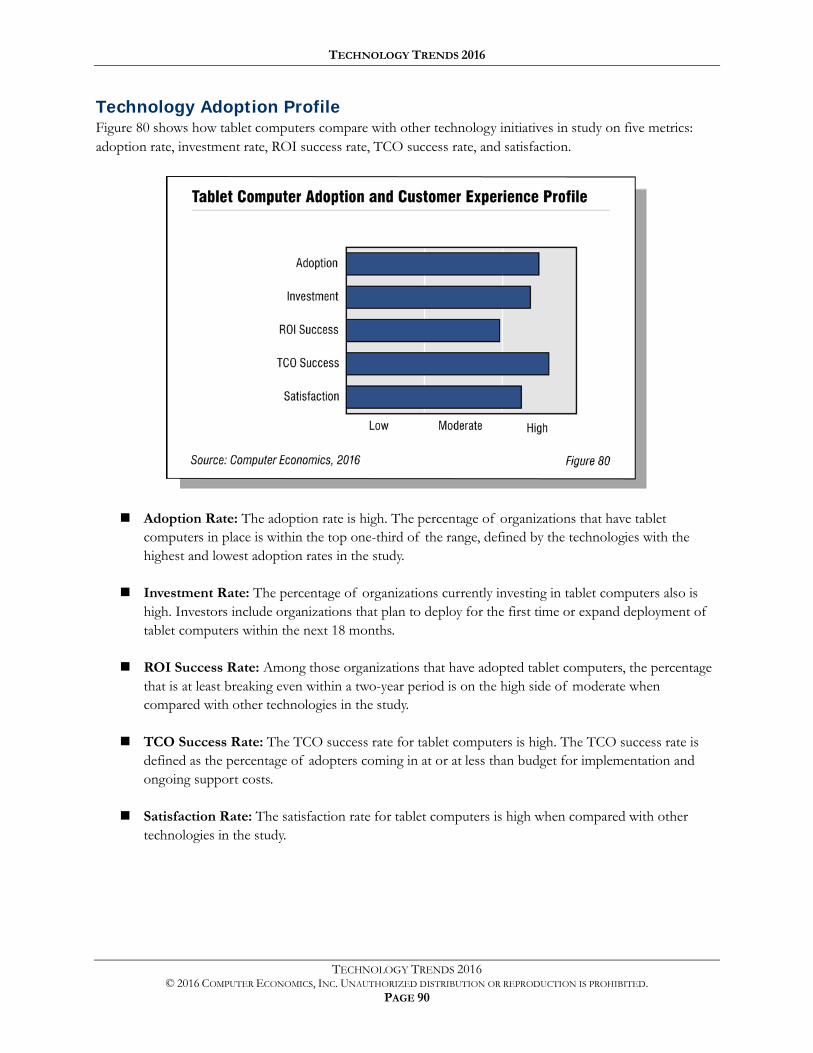
TECHNOLOGY TRENDS 2016
TECHNOLOGY TRENDS 2016 © 2016 COMPUTER ECONOMICS, INC. UNAUTHORIZED DISTRIBUTION OR REPRODUCTION IS PROHIBITED.
PAGE 90
Technology Adoption Profile Figure 80 shows how tablet computers compare with other technology initiatives in study on five metrics: adoption rate, investment rate, ROI success rate, TCO success rate, and satisfaction.
Adoption Rate: The adoption rate is high. The percentage of organizations that have tablet computers in place is within the top one-third of the range, defined by the technologies with the highest and lowest adoption rates in the study.
Investment Rate: The percentage of organizations currently investing in tablet computers also is high. Investors include organizations that plan to deploy for the first time or expand deployment of tablet computers within the next 18 months.
ROI Success Rate: Among those organizations that have adopted tablet computers, the percentage that is at least breaking even within a two-year period is on the high side of moderate when compared with other technologies in the study.
TCO Success Rate: The TCO success rate for tablet computers is high. The TCO success rate is defined as the percentage of adopters coming in at or at less than budget for implementation and ongoing support costs.
Satisfaction Rate: The satisfaction rate for tablet computers is high when compared with other technologies in the study.
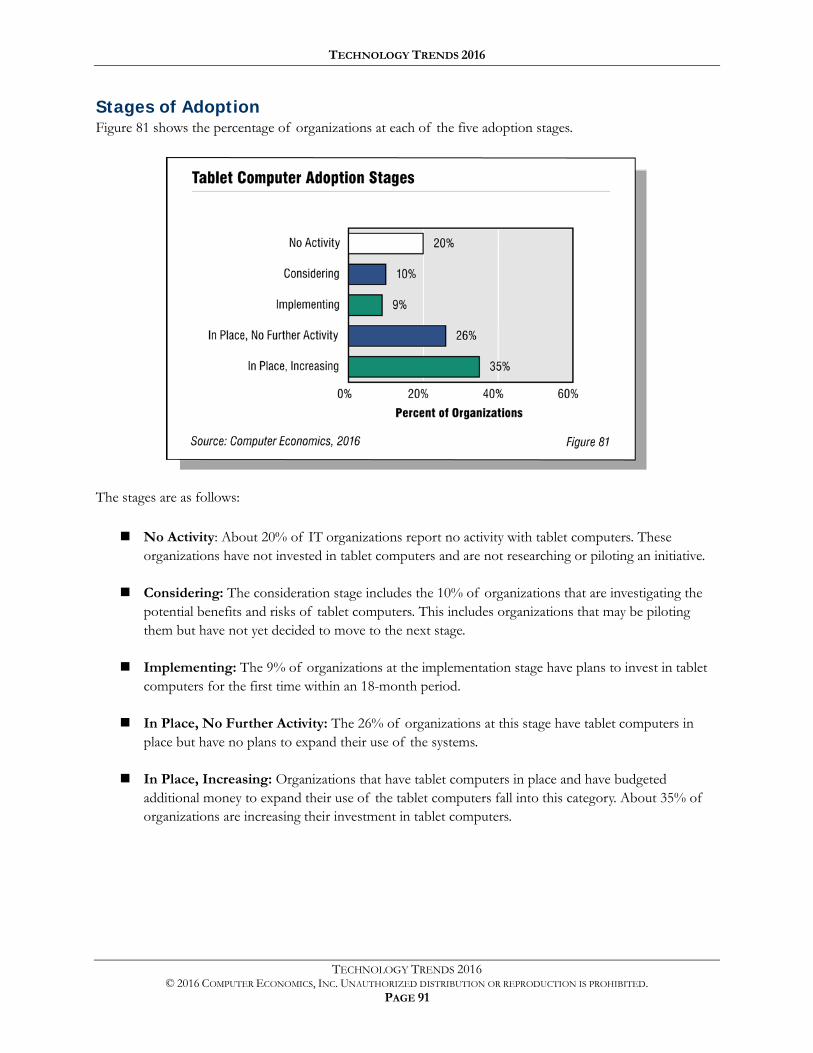
TECHNOLOGY TRENDS 2016
TECHNOLOGY TRENDS 2016 © 2016 COMPUTER ECONOMICS, INC. UNAUTHORIZED DISTRIBUTION OR REPRODUCTION IS PROHIBITED.
PAGE 91
Stages of Adoption Figure 81 shows the percentage of organizations at each of the five adoption stages.
The stages are as follows:
No Activity: About 20% of IT organizations report no activity with tablet computers. These organizations have not invested in tablet computers and are not researching or piloting an initiative.
Considering: The consideration stage includes the 10% of organizations that are investigating the potential benefits and risks of tablet computers. This includes organizations that may be piloting them but have not yet decided to move to the next stage.
Implementing: The 9% of organizations at the implementation stage have plans to invest in tablet computers for the first time within an 18-month period.
In Place, No Further Activity: The 26% of organizations at this stage have tablet computers in place but have no plans to expand their use of the systems.
In Place, Increasing: Organizations that have tablet computers in place and have budgeted additional money to expand their use of the tablet computers fall into this category. About 35% of organizations are increasing their investment in tablet computers.
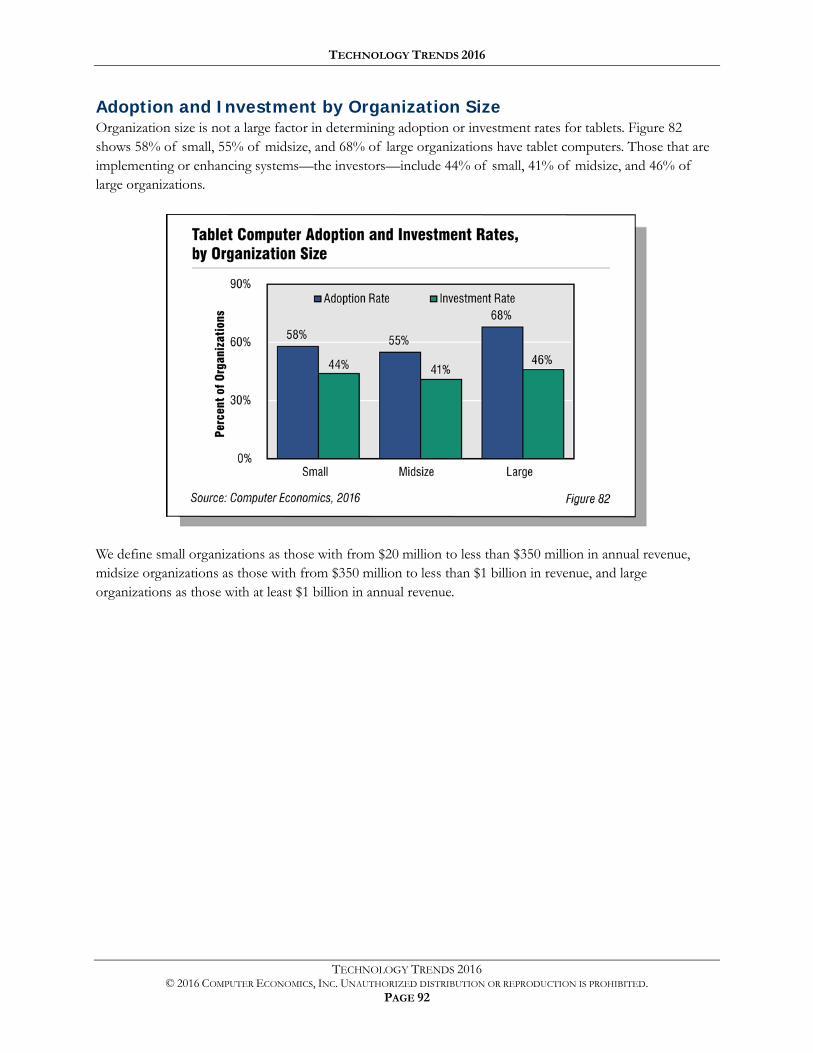
TECHNOLOGY TRENDS 2016
TECHNOLOGY TRENDS 2016 © 2016 COMPUTER ECONOMICS, INC. UNAUTHORIZED DISTRIBUTION OR REPRODUCTION IS PROHIBITED.
PAGE 92
Adoption and Investment by Organization Size Organization size is not a large factor in determining adoption or investment rates for tablets. Figure 82 shows 58% of small, 55% of midsize, and 68% of large organizations have tablet computers. Those that are implementing or enhancing systems—the investors—include 44% of small, 41% of midsize, and 46% of large organizations.
We define small organizations as those with from $20 million to less than $350 million in annual revenue, midsize organizations as those with from $350 million to less than $1 billion in revenue, and large organizations as those with at least $1 billion in annual revenue.
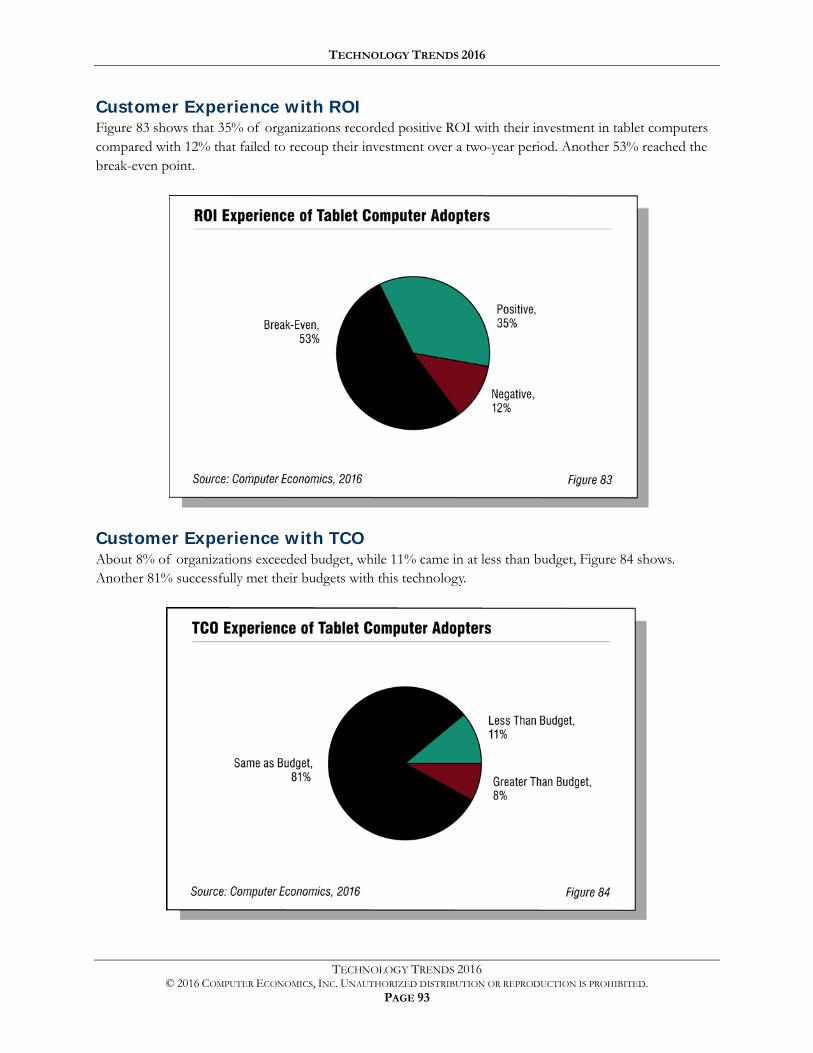
TECHNOLOGY TRENDS 2016
TECHNOLOGY TRENDS 2016 © 2016 COMPUTER ECONOMICS, INC. UNAUTHORIZED DISTRIBUTION OR REPRODUCTION IS PROHIBITED.
PAGE 93
Customer Experience with ROI Figure 83 shows that 35% of organizations recorded positive ROI with their investment in tablet computers compared with 12% that failed to recoup their investment over a two-year period. Another 53% reached the break-even point.
Customer Experience with TCO About 8% of organizations exceeded budget, while 11% came in at less than budget, Figure 84 shows. Another 81% successfully met their budgets with this technology.
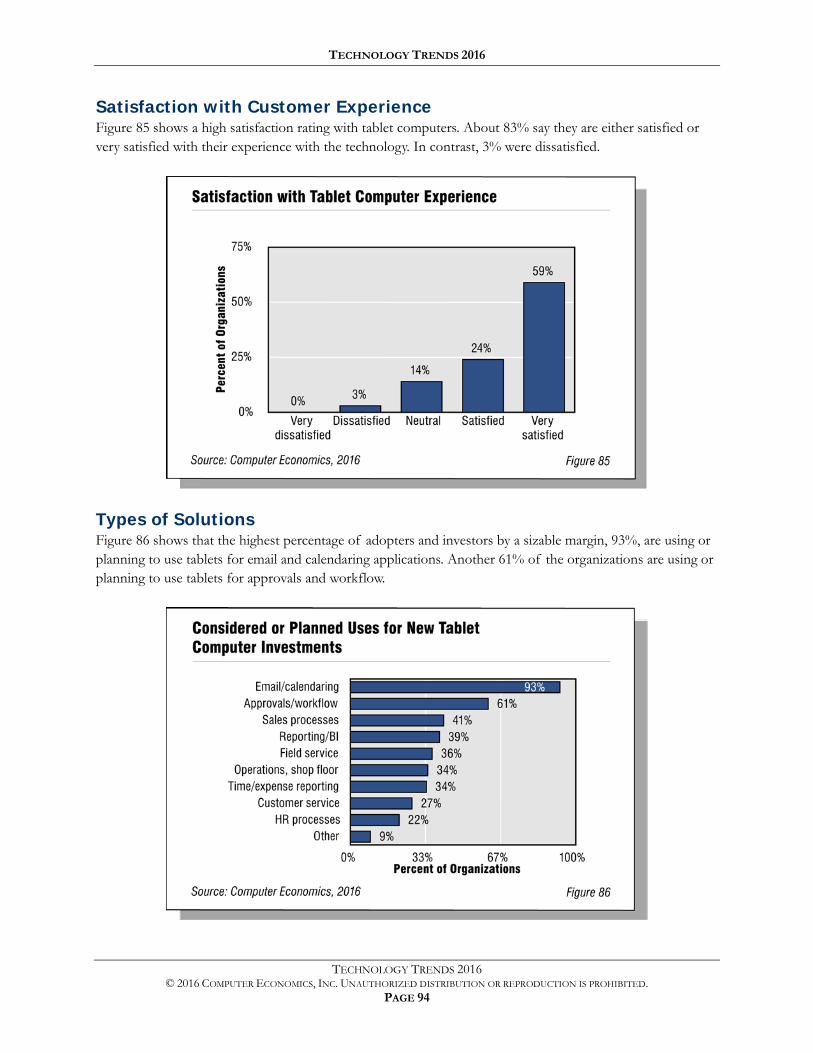
TECHNOLOGY TRENDS 2016
TECHNOLOGY TRENDS 2016 © 2016 COMPUTER ECONOMICS, INC. UNAUTHORIZED DISTRIBUTION OR REPRODUCTION IS PROHIBITED.
PAGE 94
Satisfaction with Customer Experience Figure 85 shows a high satisfaction rating with tablet computers. About 83% say they are either satisfied or very satisfied with their experience with the technology. In contrast, 3% were dissatisfied.
Types of Solutions Figure 86 shows that the highest percentage of adopters and investors by a sizable margin, 93%, are using or planning to use tablets for email and calendaring applications. Another 61% of the organizations are using or planning to use tablets for approvals and workflow.
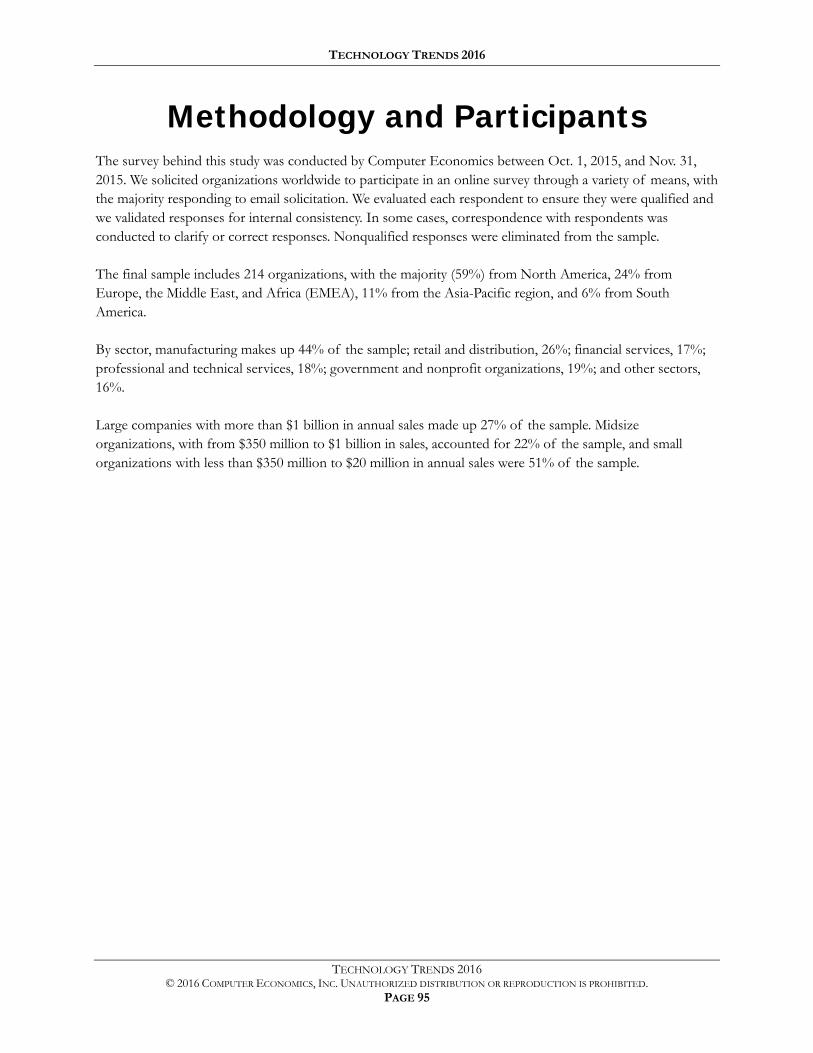
TECHNOLOGY TRENDS 2016
TECHNOLOGY TRENDS 2016 © 2016 COMPUTER ECONOMICS, INC. UNAUTHORIZED DISTRIBUTION OR REPRODUCTION IS PROHIBITED.
PAGE 95
Methodology and Participants The survey behind this study was conducted by Computer Economics between Oct. 1, 2015, and Nov. 31, 2015. We solicited organizations worldwide to participate in an online survey through a variety of means, with the majority responding to email solicitation. We evaluated each respondent to ensure they were qualified and we validated responses for internal consistency. In some cases, correspondence with respondents was conducted to clarify or correct responses. Nonqualified responses were eliminated from the sample.
The final sample includes 214 organizations, with the majority (59%) from North America, 24% from Europe, the Middle East, and Africa (EMEA), 11% from the Asia-Pacific region, and 6% from South America.
By sector, manufacturing makes up 44% of the sample; retail and distribution, 26%; financial services, 17%; professional and technical services, 18%; government and nonprofit organizations, 19%; and other sectors, 16%.
Large companies with more than $1 billion in annual sales made up 27% of the sample. Midsize organizations, with from $350 million to $1 billion in sales, accounted for 22% of the sample, and small organizations with less than $350 million to $20 million in annual sales were 51% of the sample.