

IT Services to Support a Changing Utility Industry · IT Services to Support a Changing Utility...
77
IT Services to Support a Changing Utility Industry Northwest Public Power Association 2016 Information Technology Conference Reno, Nevada March 9, 2016 Charlie Black Charles J. Black Energy Economics [email protected] (425) 765-3321
Transcript of IT Services to Support a Changing Utility Industry · IT Services to Support a Changing Utility...

IT Services to Support a Changing Utility Industry
Northwest Public Power Association 2016 Information Technology Conference
Reno, Nevada
March 9, 2016
Charlie Black Charles J. Black Energy Economics
[email protected] (425) 765-3321

Topics
Presentation Electric Utility Industry Transformation
2

Topics
Presentation Electric Utility Industry Transformation
Conversation Implications for IT Services at NWPPA Member Utilities
3

Disclaimer
Information shown on the following slides was gathered from various sources. This presentation reflects the perspective of CJB Energy Economics and was developed to stimulate conversation.
4

IT Project Team
DOES 99%
Of THE WORK
HAS NO IDEA WHAT’S GOING
ON THE WHOLE TIME
SAYS HE’S
GOING TO HELP BUT HE’S NOT
DISAPPEARS AT THE START AND
DOESN’T
REAPPEAR UNTIL THE END

Industry Transformation
Recent polls have found broad consensus that the electric utility industry is undergoing significant change
• Utility Dive
• PwC
• Black & Veatch
Agreement about how utilities should respond? Not so much.
6

Utility Dive 2016 State of the Electric Utility Survey
7
“If there’s one takeaway from Utility Dive’s third annual State of the Electric Utility industry survey, it’s that the transformation has arrived – but a standardized approach to adapt to it has not.”
www.utilitydive.com/library/state-of-the-electric-utility-2016/

Utility Dive 2016 State of the Electric Utility Survey
8
Respondents’ most pressing challenges for their utility (descending order)
Aging Workforce
Existing Regulatory Model
Aging Infrastructure
Renewables Integration
Stagnant Load Growth
Physical and/or Cyber Grid Security
Clean Power Plan Compliance
www.utilitydive.com/library/state-of-the-electric-utility-2016/

14th PwC Global Power & Utilities Survey
9
“We are witnessing considerable disruption in the power sector arising from a combination of policy, technological and customer change. It’s creating a transformation in how we think about, produce and use electricity.”
www.pwc.com/gx/en/industries/energy-utilities-mining/power-utilities/global-power-and-utilities-survey.html

14th PwC Global Power & Utilities Survey
10
Nearly all respondents expect to see a medium to very high level of market disruption by 2020
More than 7 of 10 anticipate major or very major business model transformation by 2030
6 of 10 say their main home market will be more than “50% transformed” by 2030
www.pwc.com/gx/en/industries/energy-utilities-mining/power-utilities/global-power-and-utilities-survey.html

Black & Veatch 2015 Strategic Directions: U.S. Electric industry Report
11
Disruptive Forces (Ranked by Relative Importance)
Aging Infrastructure
Reliability
Environmental Regulation
Cybersecurity
Aging Workforce
Economic Regulation (Rates)
Emerging Technology
http://bv.com/reports
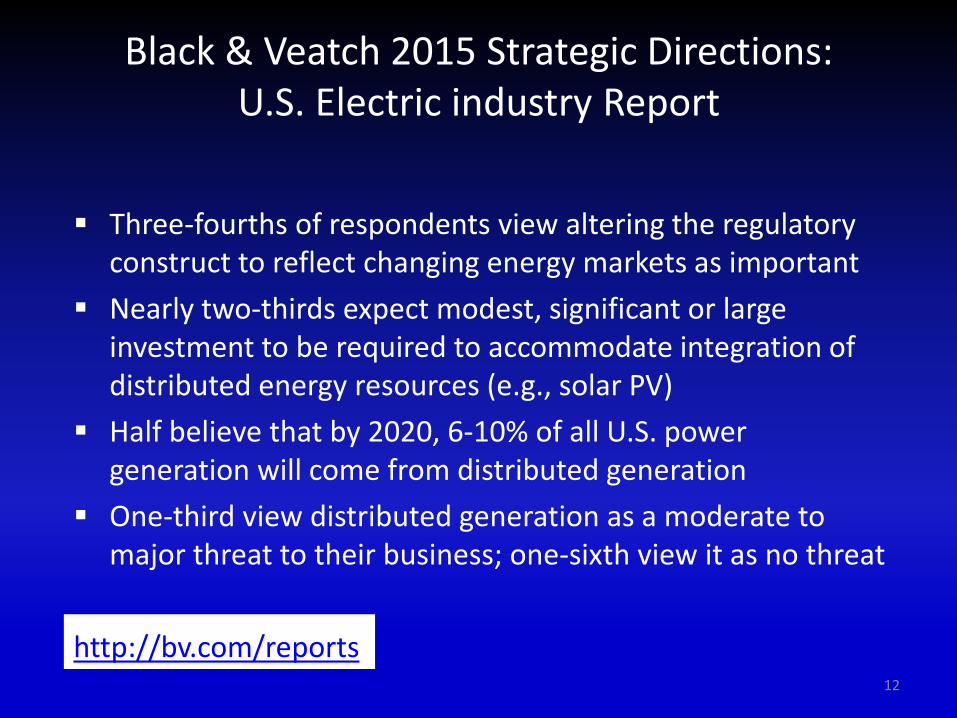
Black & Veatch 2015 Strategic Directions: U.S. Electric industry Report
12
Three-fourths of respondents view altering the regulatory construct to reflect changing energy markets as important
Nearly two-thirds expect modest, significant or large investment to be required to accommodate integration of distributed energy resources (e.g., solar PV)
Half believe that by 2020, 6-10% of all U.S. power generation will come from distributed generation
One-third view distributed generation as a moderate to major threat to their business; one-sixth view it as no threat
http://bv.com/reports

Traditional Electric Utility System
Graphic: Indiana University Kelly School of Business

Microgrid With Distributed Generation
Graphic: www.clean-coalition.org

New York Reforming the Energy Vision (NY REV)
Distribution System Platform Provider Model

Driving Forces for Electric Utility System Transformation
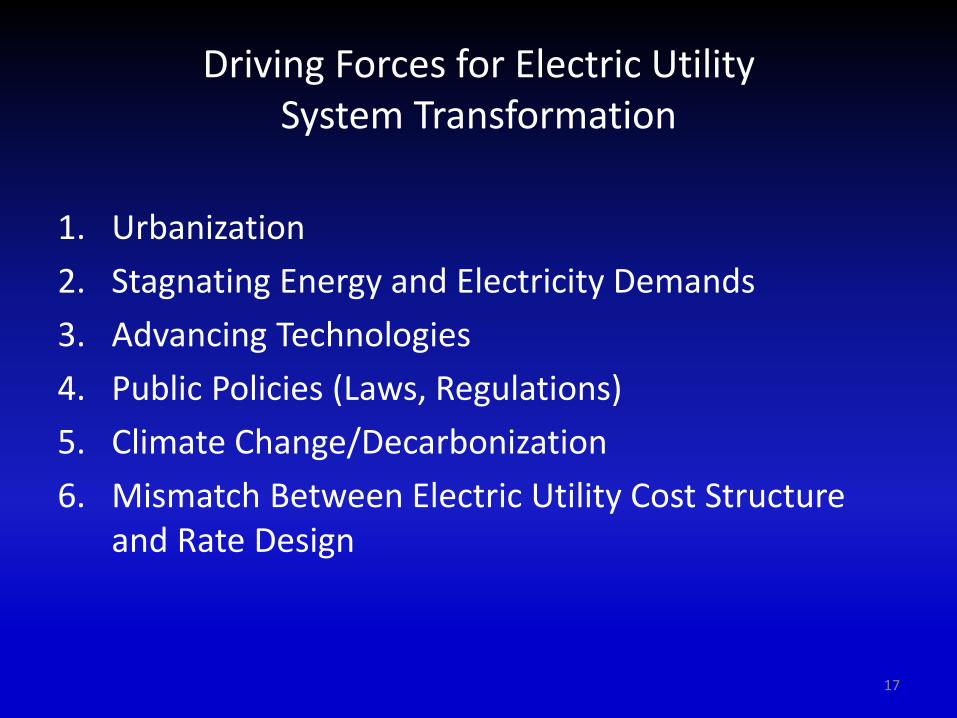
Driving Forces for Electric Utility System Transformation
1. Urbanization
2. Stagnating Energy and Electricity Demands
3. Advancing Technologies
4. Public Policies (Laws, Regulations)
5. Climate Change/Decarbonization
6. Mismatch Between Electric Utility Cost Structure and Rate Design
17

Driving Forces for Electric Utility System Transformation
1. Urbanization
18
Urbanization
19

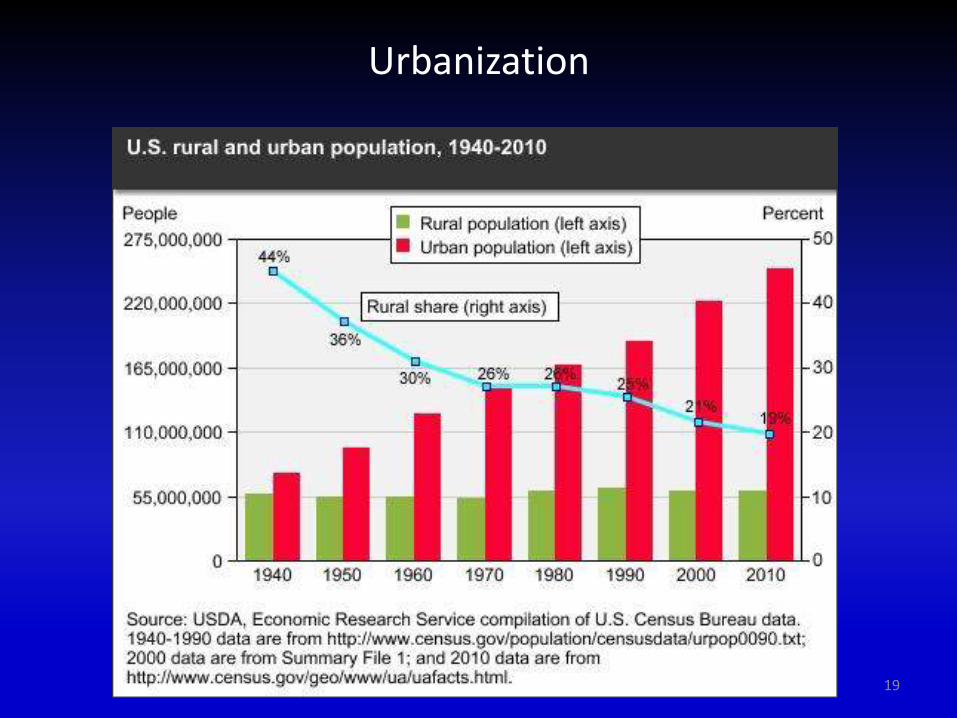
Urbanization
As the U.S. continues to shift toward a services-based economy, the nation is becoming increasingly urban
Population centers are growing, while rural areas are flat, both in population and economic activity
Demographic trend is well-established and expected to continue
Urban voters also tend to be more liberal, environmentalist than voters in rural areas
20

Driving Forces for Electric Utility System Transformation
1. Urbanization
2. Stagnating Energy and Electricity Demands
21

Stagnating Energy and Electricity Demands
22

Stagnating Energy and Electricity Demands
For decades, increasing use of electricity enabled expansion of the economy and population
Since the 1990s, economic and population growth no longer drive growth of electric loads
• urbanization
• shift away from industrial, extraction economy (offshoring)
• cost-effective energy efficiency
• increased use of natural gas for space heating
23

Driving Forces for Electric Utility System Transformation
1. Urbanization
2. Stagnating Energy and Electricity Demands
3. Advancing Technologies
24


Advancing Technologies
LED lighting, automated controls, heat pumps
26

LED Lighting
27

Automated Controls
28

Advancing Technologies
LED lighting, automated controls, heat pumps
Improving performance, falling costs for renewable resources (wind, solar)
29

Wind Power
30

Solar Photovoltaic Generation
31
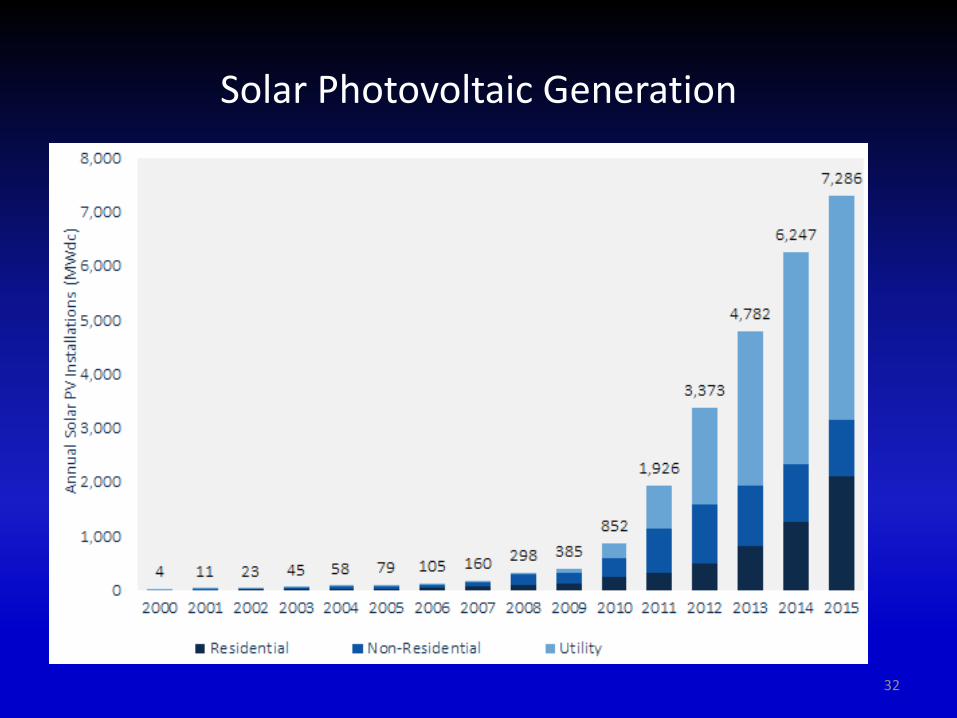
Solar Photovoltaic Generation
32
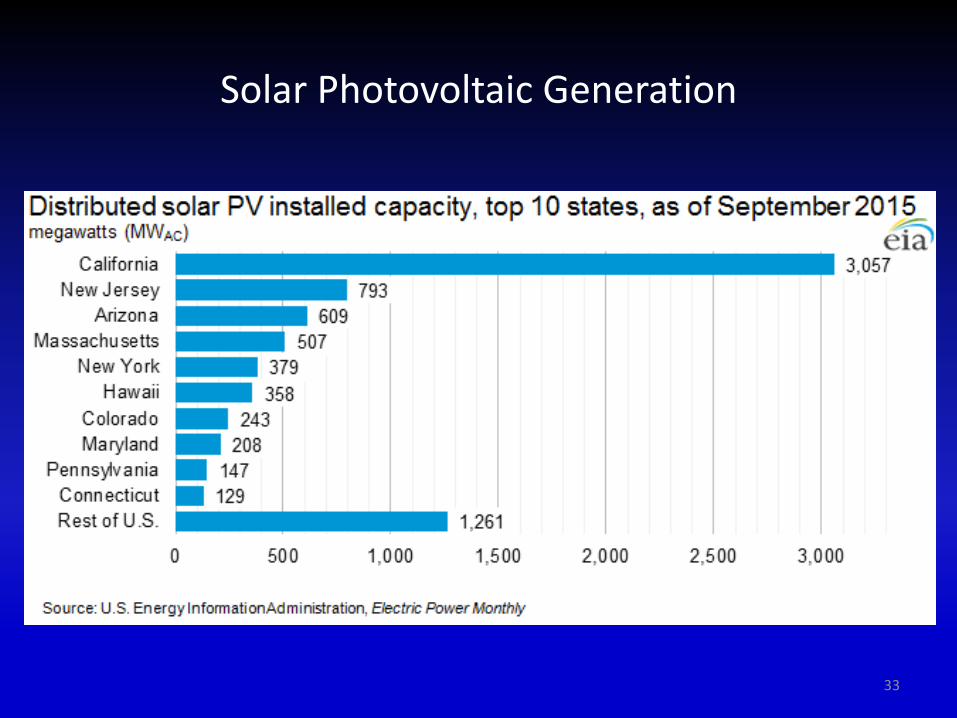
Solar Photovoltaic Generation
33

Advancing Technologies
LED lighting, automated controls, heat pumps
Improving performance, falling costs for renewable resources (wind, solar)
Hydraulic fracturing, directional drilling
34

Advancing Technologies
LED lighting, automated controls, heat pumps
Improving performance, falling costs for renewable resources (wind, solar)
Hydraulic fracturing, directional drilling
High-efficiency combustion turbines
35

High-Efficiency Combustion Turbines
36

Advancing Technologies
LED lighting, automated controls, heat pumps
Improving performance, falling costs for renewable resources (wind, solar)
Hydraulic fracturing, directional drilling
High-efficiency combustion turbines
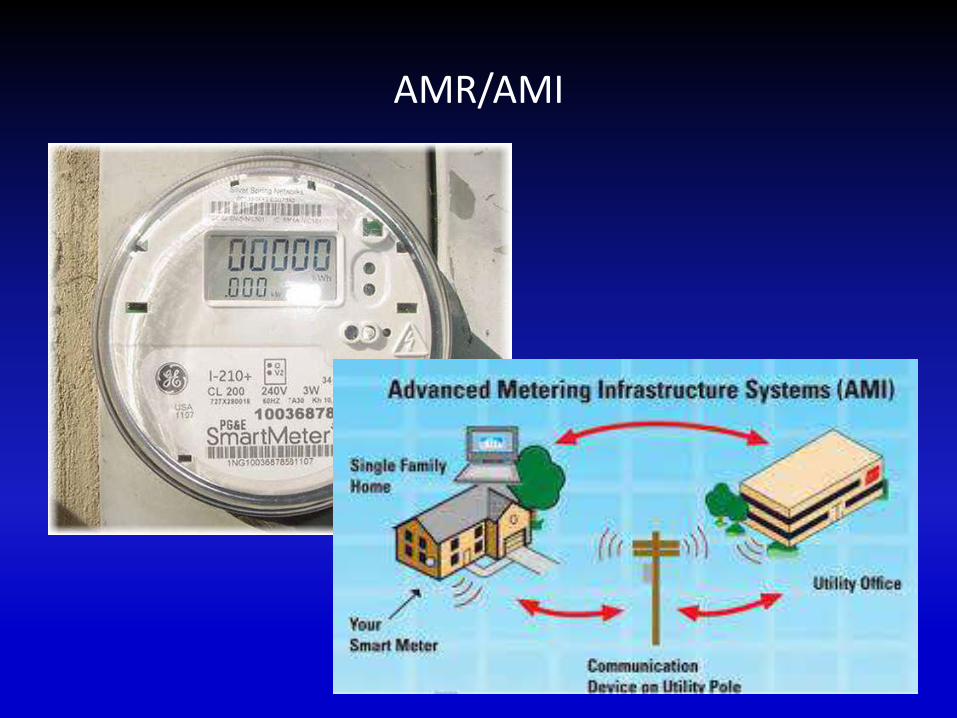
Smart grid, grid edge, AMR/AMI
37

Advancing Technologies
LED lighting, automated controls, heat pumps
Improving performance, falling costs for renewable resources (wind, solar)
Hydraulic fracturing, directional drilling
High-efficiency combustion turbines
Smart grid, grid edge, AMR/AMI
Electric vehicles
39

Electric Vehicles
40

Electric Vehicles
41

Advancing Technologies
LED lighting, automated controls, heat pumps
Improving performance, falling costs for renewable resources (wind, solar)
Hydraulic fracturing, directional drilling
High-efficiency combustion turbines
Smart grid, grid edge, AMR/AMI
Electric vehicles
Battery storage
42

Source: Tesla
TESLA Powerwall Launched April 30, 2015 7 kWh daily cycle (~1/4 of average daily residential load)
2.0 kW continuous output
3.3 kW peak output
5.8 amp nominal
8.6 amp peak
~20% roundtrip losses
34” x 51” x 7”
220 lbs.
~$7,000 installed cost
~$0.15/kWh storage cost
43

Driving Forces for Electric Utility System Transformation
1. Urbanization
2. Stagnating Energy and Electricity Demands
3. Advancing Technologies
4. Public Policies (Laws, Regulations)
44

Public Policy Motivations
45
Public Policies (Laws, Regulations)
Limits on air, water emissions (NOx, SO2, particulates)
State emissions performance standards
Federally-funded R&D
Renewable portfolio standards
Federal and state tax credits (ITC, PTC)
Net energy metering
46

Driving Forces for Electric Utility System Transformation
1. Urbanization
2. Stagnating Energy and Electricity Demands
3. Advancing Technologies
4. Public Policies (Laws, Regulations)
5. Climate Change/Decarbonization
47

Climate Change/Decarbonization
Growing evidence/recognition of climate change
Growing commitment to reduce carbon emissions
Carbon cap and trade, carbon tax programs
Clean Air Act Section 111(b) rule - new
Clean Air Action Section 111(d) rule – existing
E3, other studies of decarbonization strategies, costs
48

Wait, How Much Is All This Costing Ratepayers?
49

Wait, How Much Is All This Costing Ratepayers?
50

Driving Forces for Electric Utility System Transformation
1. Urbanization
2. Stagnating Energy and Electricity Demands
3. Advancing Technologies
4. Public Policies (Laws, Regulations)
5. Climate Change/Decarbonization
6. Mismatch Between Electric Utility Cost Structure and Rate Design
51

Electric Utility Cost Structure Fixed and Variable Costs
52
100%80%
60%
30%
62%
0%20%
40%
70%
38%
0%
20%
40%
60%
80%
100%
120%
Customer Distribution Transmission Generation Total
Fixed and Variable Cost by Function Average Residential Customer
Fixed Variable

Electric Utility Revenues from Customer and Energy Charges
53
-
500
1,000
1,500
2,000
2,500
$-
$20.00
$40.00
$60.00
$80.00
$100.00
$120.00
$140.00
$160.00
$180.00
Jan Feb Mar Apr May Jun Jul Aug Sep Oct Nov Dec
Residential Average Customer
Fixed Variable kWh

Electric Utility Revenues with Net Energy Metering
54
$-
$20.00
$40.00
$60.00
$80.00
$100.00
$120.00
$140.00
$160.00
$180.00
Jan Feb Mar Apr May Jun Jul Aug Sep Oct Nov Dec
Residential Average Customer
Non Adopter Adopter

Could Rooftop PV + Batteries Kill the Grid?
55

56
If an average Seattle home went “off grid” and
generated an amount of rooftop solar power equal to their annual consumption, over 500 Powerwalls would be needed to store the seasonal imbalances between generation and load at the home. (8,536 kWh * 0.34 / 0.8) /(7 kWh) = 518

Solar Generating Potential Varies by Location
57
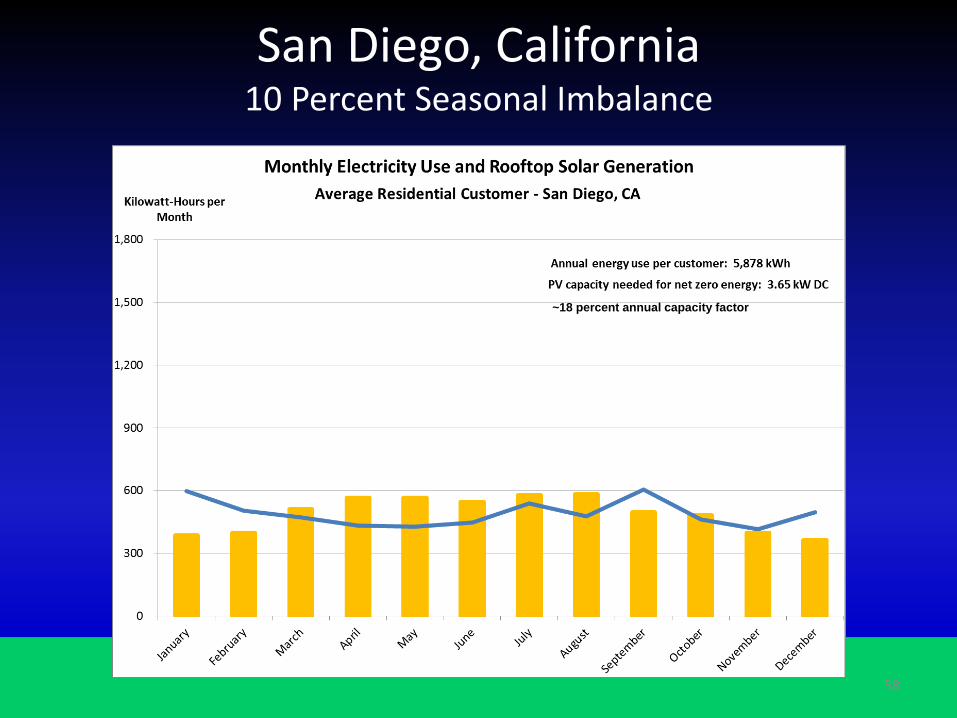
San Diego, California 10 Percent Seasonal Imbalance
58
~18 percent annual capacity factor
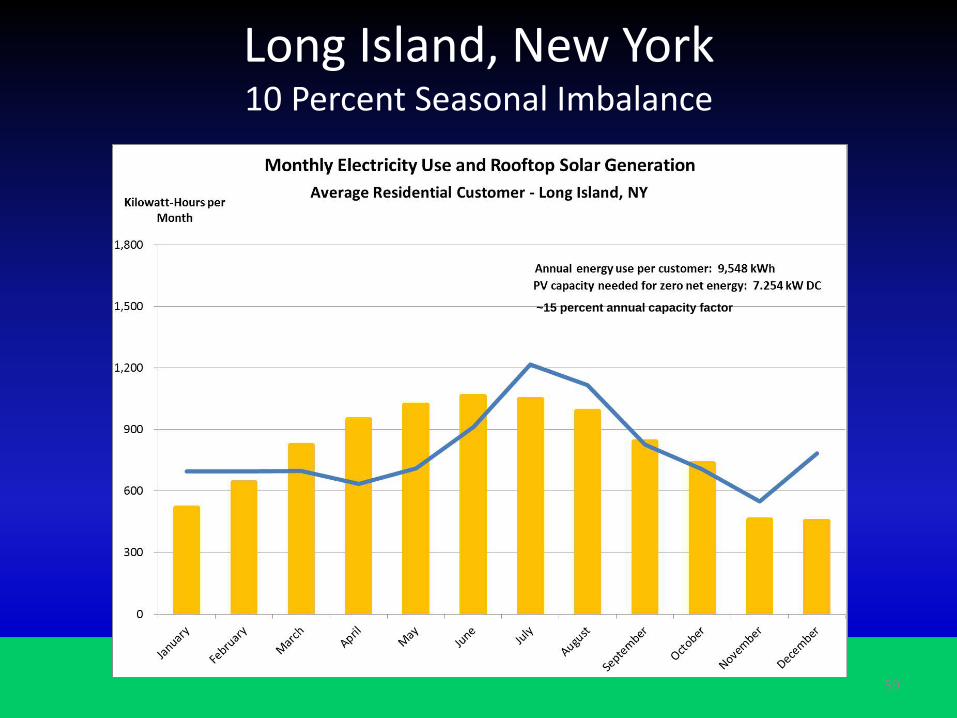
Long Island, New York 10 Percent Seasonal Imbalance
59
~15 percent annual capacity factor

Seattle, Washington 34 Percent Seasonal Imbalance
60
~12 percent annual capacity factor
Where Does Energy Storage Fit?
While battery technology can help with diurnal shaping, energy storage volume is limited
Other forms of storage with longer cycles, greater energy storage volume are also needed
Consumers will still need to rely on the utility system for energy storage
Single-family homes not most cost-effective place for storage – network effects create opportunity for utilities or others
61

Traditional Electric Utility System
Load Growth: strong and sustained; driver for economic development
Generation: large, often CO2-emitting; remote from major load centers
Technologies: electromechanical, limited intelligence, manual, not well-integrated
Utility Cost Structure: majority of costs for generation, transmission, distribution were fixed
Utility Average Cost: declining; increasing volume reduces rates
62

Traditional Electric Utility System
Competing Electric Providers: none
Customer Behavior: passive consumption; little awareness of what utilities do to provide reliable, low-cost service
Retail Electric Service: universal, one-size-fits-all
Residential Rate Design: majority of costs recovered through energy changes (customer charges low)
Utility-Customer Interaction: monthly bills, call center, outages, rate changes
63
Emerging Electric Utility System
Load Growth: flat/declining; no longer a major driver for economic development; however, EVs and other forms of electrification can help achieve environmental goals
Generation: increasingly renewable but intermittent; undifferentiated energy has low value; distributed generation and storage being located at or near loads
Technologies: digital, smart, automated, integrated
Utility Cost Structure: majority of costs for generation, transmission, distribution still fixed; stranded cost risks
Utility Average Cost: flat/increasing; increasing volume no longer reduces rates
64

Emerging Electric Utility System
Competing Electric Providers: solar installers and leasing companies; energy efficiency; demand response
Customer Behavior: more active; engaging technologies and third parties; making choices to protect environment
Retail Electric Service: still universal, but one-size-fits-all service no longer sufficient; customers still need the grid
Residential Rate Design: recovering majority of fixed costs through volumetric energy charges no longer viable
Utility-Customer Interaction: increasing use of meter data; growing pushback if rate changes are perceived to ‘protect monopoly by blocking competition’
65

How Are We Feeling?
66

67

68

Don’t Worry!
69

70

Topics
Presentation Electric Utility Industry Transformation
Conversation Implications for IT Services at NWPPA Member Utilities
71

Implications for IT Services at NWPPA Member Utilities
General thought and observations
72
Implications for IT Services at NWPPA Member Utilities
If a utility has not yet determined its response to industry transformation, how can its IT efforts help prepare for it?
73

Implications for IT Services at NWPPA Member Utilities
What about rural utilities?
• Will industry transformation happen in rural areas?
• Will it look different?
• If it does, how can IT respond?
74

Implications for IT Services at NWPPA Member Utilities
Electric utility industry transformation is blurring functional lines within the organization (G/T/D/C&F). How will this affect IT?
• Roles
• Priorities
75

Implications for IT Services at NWPPA Member Utilities
Will it realistically be possible to meet all IT needs?
If not, what are the top priorities and why?
Ideas about triage?
Funding?
76