IT in Infection Prevention
41
This presentation was presented at Apollo International Forum on Infection Control (AIFIC’ 2013), Chennai The presentation is solely meant for Academic purpose
-
Upload
apollo-hospitals -
Category
Health & Medicine
-
view
224 -
download
0
Transcript of IT in Infection Prevention

This presentation was presented at Apollo International Forum on Infection Control (AIFIC’ 2013), Chennai
The presentation is solely meant for Academic purpose

INFORMATION TECHNOLOGY
IN INFECTION CONTROL

© 2010. All rights reserved.
A New world. New Occurrences. New Interventions.

© 2010. All rights reserved.
Infections: Heeding the call
At any time, over 1.4 million people are suffering from HAI worldwide (WHO figures, 2006).
One third of healthcare acquired infections are preventable1
One in 10 patients in an acute healthcare setting have HAI’s. (15-50% in ICUs*).
ALOS of a patient who acquired infection in the hospital is 2.5 times more than those who have not
Patients with Hospital acquired infections cost 6 time more to treat than those who have not
1 - http://www.cdc.gov/ncidod/eid/vol4no3/weinstein.htm

© 2010. All rights reserved.
32 percent of all healthcare-associated infection are urinary tract infections
22 percent are surgical site infections
15 percent are pneumonia
14 percent are bloodstream infections
Infections: Heeding the call
© 2010. All rights reserved.
Prevalence of HAI
Developed countries
Developing countries
Almost twice as high as in developed countries

© 2010. All rights reserved.
13 Million people die across the
globe every year due to
environment-related causes.
© 2010. All rights reserved.
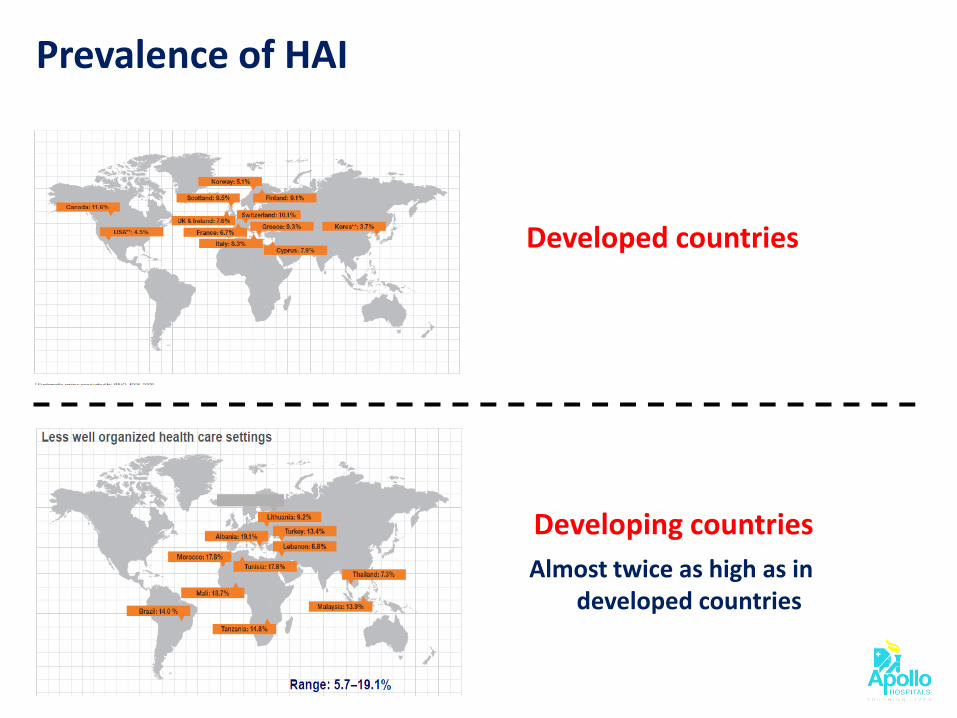
In US, HAI is one of the top 10 causes of death.
INDIA?

© 2010. All rights reserved.
Infections- The Outcomes
Delayed patient discharge/ blocked beds
Increased ALOS Patient mortality and morbidity Increased treatment cost Increased infection control cost Subject to litigation
Socio economic costs

© 2010. All rights reserved.
Overuse of antibiotics leads to development of resistant strains.
On date more than 70% of bacteria have developed resistance.
Such is the speed of mutation that a drug needs to be in prescription for just 12 months for resistant strains to develop.
Infections- The Urgency of the Call

© 2010. All rights reserved.
It takes 6 years to develop a new antibiotic.
The only hope is………
PREVENTION & CONTROL OF INFECTIONS

© 2010. All rights reserved.
A call for the nation
Nation wide surveillance
Robust infection prevention & control training/ certification programs
Sharing best practices across

© 2010. All rights reserved.
Program Leadership & Coordination Focus of the Program Education of the staff Integration of the program with Quality Improvement & Patient Safety Unlocking the value of Clinical Information Technology
Identifying the big Challenges

© 2010. All rights reserved.
Program Leadership & Coordination
Infection Prevention & Control Committee
Infection Control Team based on size
and complexity of the organization Program based on current scientific
guidelines like WHO, CDC Adequate resources provided by the
leaders

© 2010. All rights reserved.
Focus of the Program
Infection Control Plan which includes all the departments
Systems to track & investigate outbreaks of infectious diseases Risk reduction goals & measurable
objectives are established Isolation Procedures Barrier Techniques & Hand Hygiene Surveillance
Respiratory tract infections Urinary tract infections Intravascular invasive device related infections Surgical site infections Highly virulent infections Emerging or re-emerging infections with the community

© 2010. All rights reserved.
Infection Prevention at Apollo
Focused Program, Committee, Team, Manual (SOP’s)
Regular Newsletter
Hand wash facilities at a minimum distance to encourage hand washing
Alcohol rub dispensers at every bed side Well identified processes to prevent infections and
surveillance of these processes done regularly (Kitchen/ Laundry/ Ward/ICU)
Clean and Dirty Utility in each patient care area,
Negative pressure room for communicable disease patients
Continuous training and daily rounds by Infection
Control Team
Infection Control during renovation
Waste management
Infection control tracers
© 2010. All rights reserved.
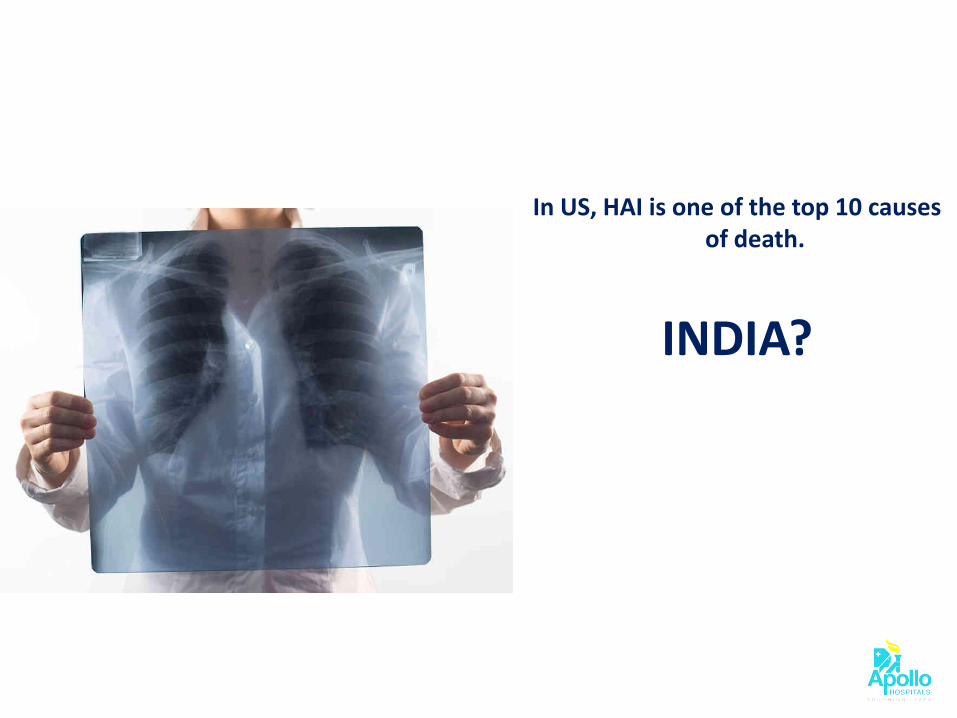
Education about the Program
Periodic staff education in response to significant trends in infection data
Staff Vaccinations
Education to patient, families and visitors

© 2010. All rights reserved.
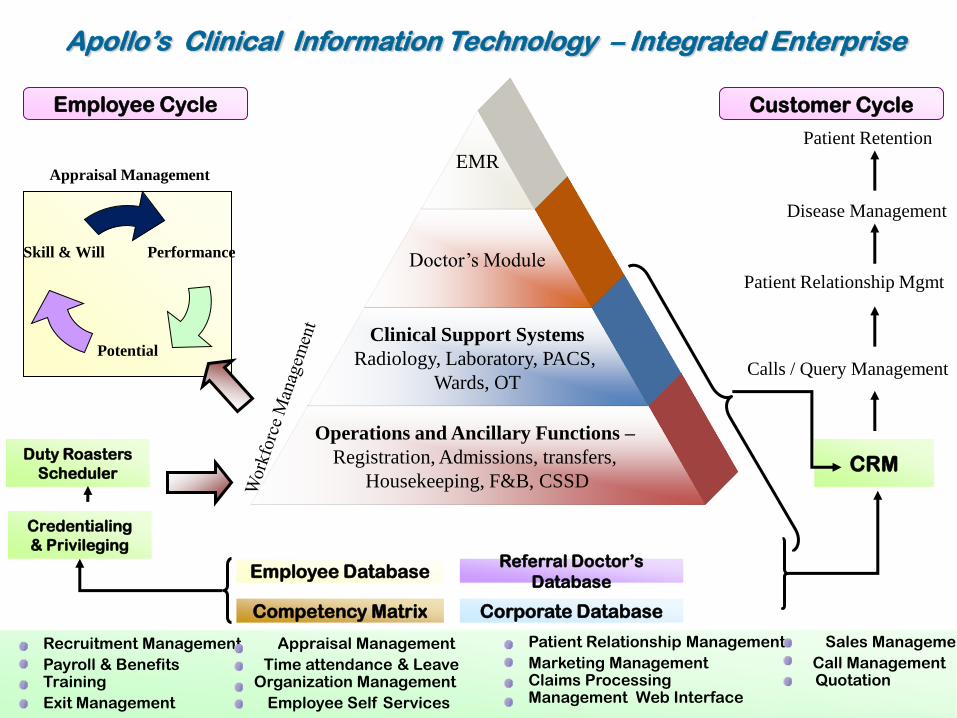
Performance
Potential
Skill & Will
Appraisal Management
Competency Matrix Corporate Database
Employee Database Referral Doctor’s
Database
Operations and Ancillary Functions –
Registration, Admissions, transfers,
Housekeeping, F&B, CSSD
Clinical Support Systems
Radiology, Laboratory, PACS,
Wards, OT
Doctor’s Module
EMR
CRM
Patient Relationship Mgmt
Disease Management
Patient Retention
Calls / Query Management
Credentialing
& Privileging
Customer Cycle Employee Cycle
Patient Relationship Management Sales Management
Marketing Management Call Management Claims Processing Quotation Management Web Interface
Recruitment Management Appraisal Management
Payroll & Benefits Time attendance & Leave Training Organization Management
Exit Management Employee Self Services
Duty Roasters
Scheduler
Apollo’s Clinical Information Technology – Integrated Enterprise

Monitoring and Tracking of
Infections in the Hospital
Audit & Surveillance Activities for
Infection prevention
Monitoring and Analyzing the
Usage of Restricted
Antibiotics/Drugs
Hospital Hygiene Monitoring
Formulation Of Policies and guidelines
Outbreak Management
MedMantra’s Infection Control Solution
© 2010. All rights reserved.
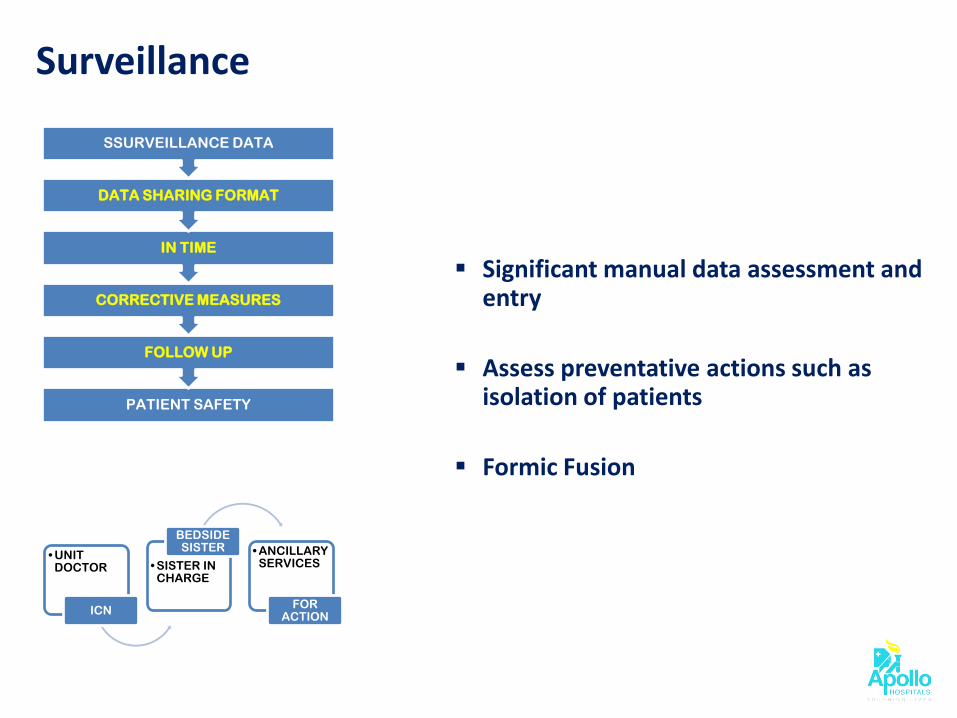
Surveillance
Significant manual data assessment and entry
Assess preventative actions such as isolation of patients
Formic Fusion
PATIENT SAFETY
FOLLOW UP
CORRECTIVE MEASURES
IN TIME
DATA SHARING FORMAT
SSURVEILLANCE DATA
• UNIT DOCTOR
ICN
• SISTER IN CHARGE
BEDSIDE SISTER • ANCILLARY
SERVICES
FOR ACTION
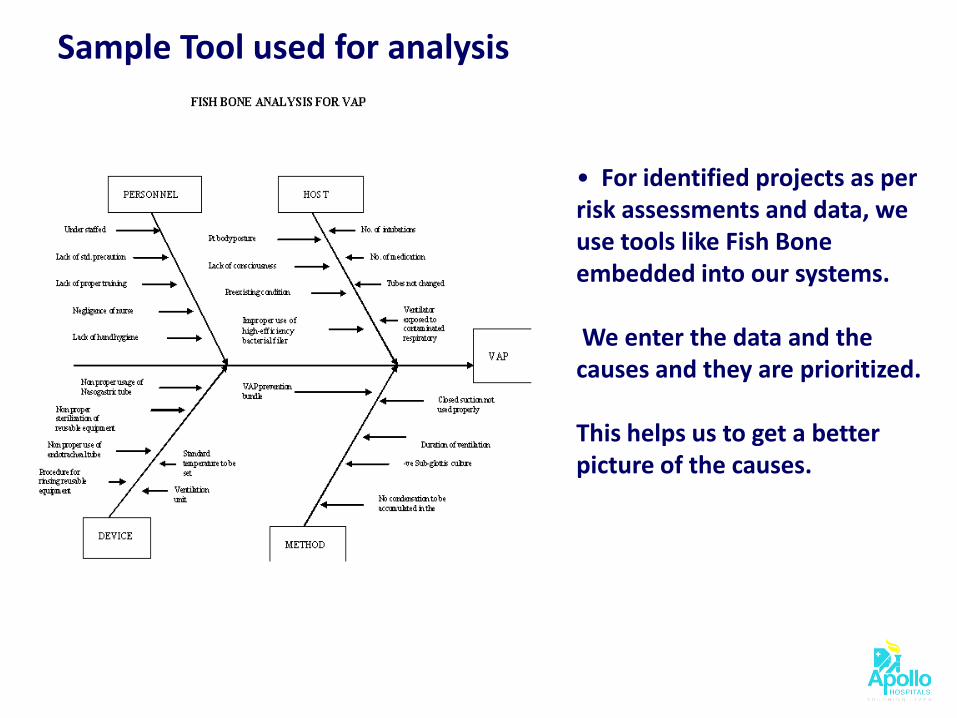
Sample Tool used for analysis
• For identified projects as per risk assessments and data, we use tools like Fish Bone embedded into our systems. We enter the data and the causes and they are prioritized. This helps us to get a better picture of the causes.

© 2010. All rights reserved.
Sample Dashboard for data collection – Ward/ ICU level
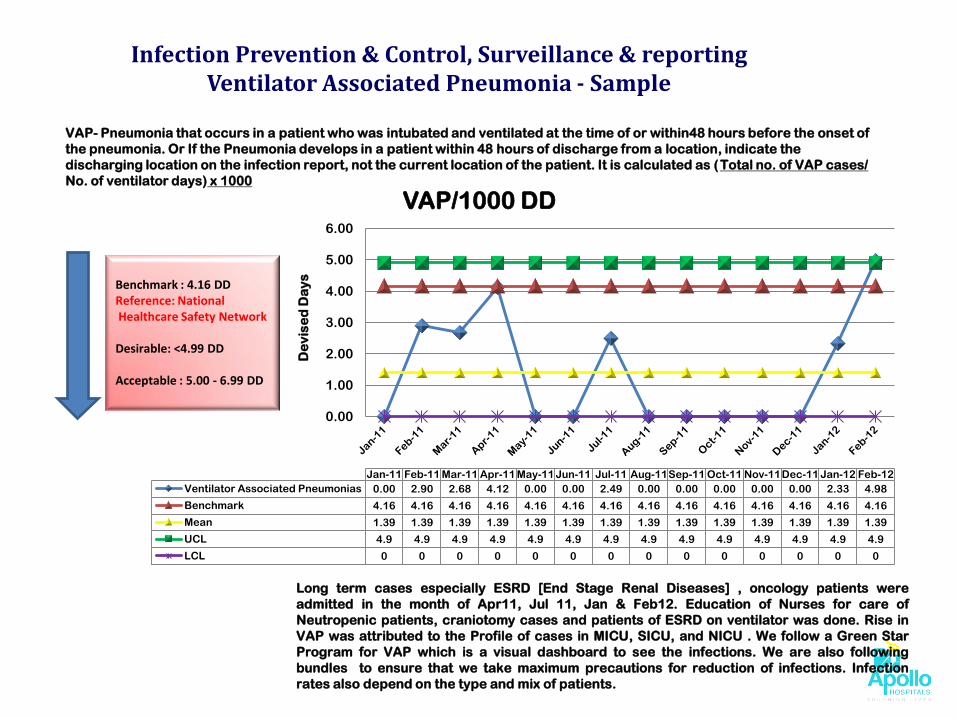
Infection Prevention & Control, Surveillance & reporting Ventilator Associated Pneumonia - Sample
VAP- Pneumonia that occurs in a patient who was intubated and ventilated at the time of or within48 hours before the onset of
the pneumonia. Or If the Pneumonia develops in a patient within 48 hours of discharge from a location, indicate the
discharging location on the infection report, not the current location of the patient. It is calculated as (Total no. of VAP cases/
No. of ventilator days) x 1000
Long term cases especially ESRD [End Stage Renal Diseases] , oncology patients were
admitted in the month of Apr11, Jul 11, Jan & Feb12. Education of Nurses for care of
Neutropenic patients, craniotomy cases and patients of ESRD on ventilator was done. Rise in
VAP was attributed to the Profile of cases in MICU, SICU, and NICU . We follow a Green Star
Program for VAP which is a visual dashboard to see the infections. We are also following
bundles to ensure that we take maximum precautions for reduction of infections. Infection
rates also depend on the type and mix of patients.
0.00
1.00
2.00
3.00
4.00
5.00
6.00
De
vis
ed
Da
ys
Jan-11 Feb-11 Mar-11 Apr-11 May-11 Jun-11 Jul-11 Aug-11 Sep-11 Oct-11 Nov-11 Dec-11 Jan-12 Feb-12
Ventilator Associated Pneumonias 0.00 2.90 2.68 4.12 0.00 0.00 2.49 0.00 0.00 0.00 0.00 0.00 2.33 4.98
Benchmark 4.16 4.16 4.16 4.16 4.16 4.16 4.16 4.16 4.16 4.16 4.16 4.16 4.16 4.16
Mean 1.39 1.39 1.39 1.39 1.39 1.39 1.39 1.39 1.39 1.39 1.39 1.39 1.39 1.39
UCL 4.9 4.9 4.9 4.9 4.9 4.9 4.9 4.9 4.9 4.9 4.9 4.9 4.9 4.9
LCL 0 0 0 0 0 0 0 0 0 0 0 0 0 0
VAP/1000 DD
Benchmark : 4.16 DD Reference: National Healthcare Safety Network Desirable: <4.99 DD Acceptable : 5.00 - 6.99 DD
© 2010. All rights reserved.
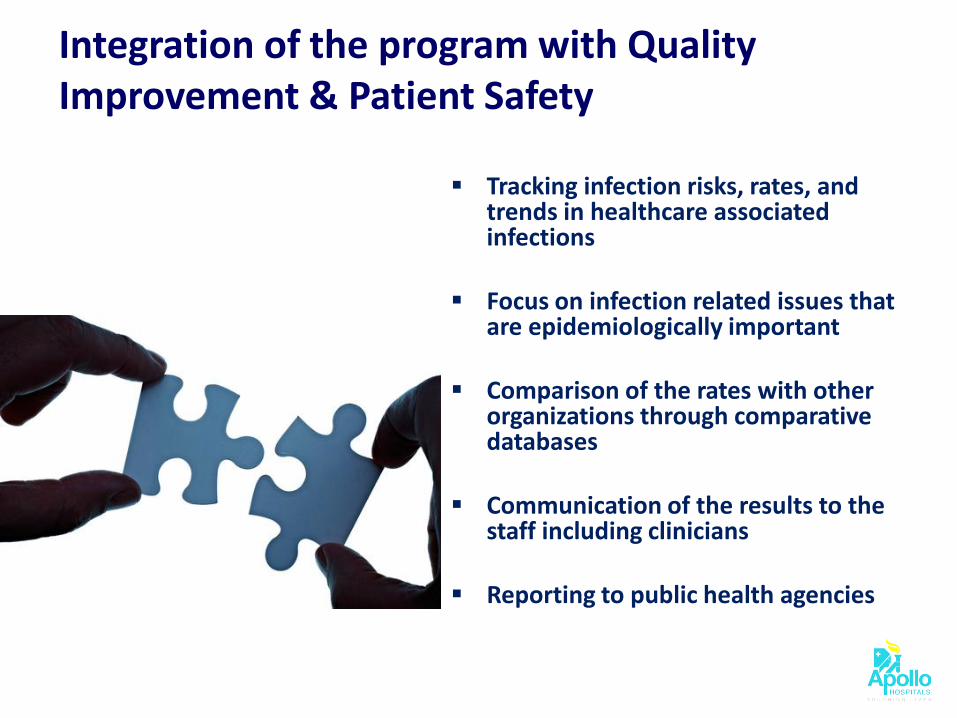
Integration of the program with Quality Improvement & Patient Safety
Tracking infection risks, rates, and trends in healthcare associated infections
Focus on infection related issues that
are epidemiologically important Comparison of the rates with other
organizations through comparative databases
Communication of the results to the
staff including clinicians
Reporting to public health agencies

© 2010. All rights reserved.
Improved Clinical Outcomes
Follow VAP, Central Line Bundle CAUTI
and Sepsis Bundle in the hospital which has shown good results
Hand washing stressed upon and continuous data monitoring
Reduction in duration of hospital stay (The average length of stay For Acute Stroke reduced from 11 days to 4.5 days)
Stroke ALOS
2009
2012
11 days
4.5 days
Stroke ALOS reduced by 4.2%

© 2010. All rights reserved. Communication to Clinicians – Report Cards

© 2010. All rights reserved.
Hand Washing Compliance (%)
2009 2010
20
40
60
80
77 81
Increased in 2012 by 5.9%
VAP Rate (%)
2011
1.0
1.5
2.0
2.5
1.83
2.21
Increased in 2012 by 21%
2012
2011
1.0
1.5
2.0
1.5 1.47
2012
Mortality (%)
Decreased in 2012 by 2%
2011 2012
100
86 91
SAMPLE ANALYTICAL REPORTS PROVIDED BY IT

Operational workflows @ Work
© 2010. All rights reserved.
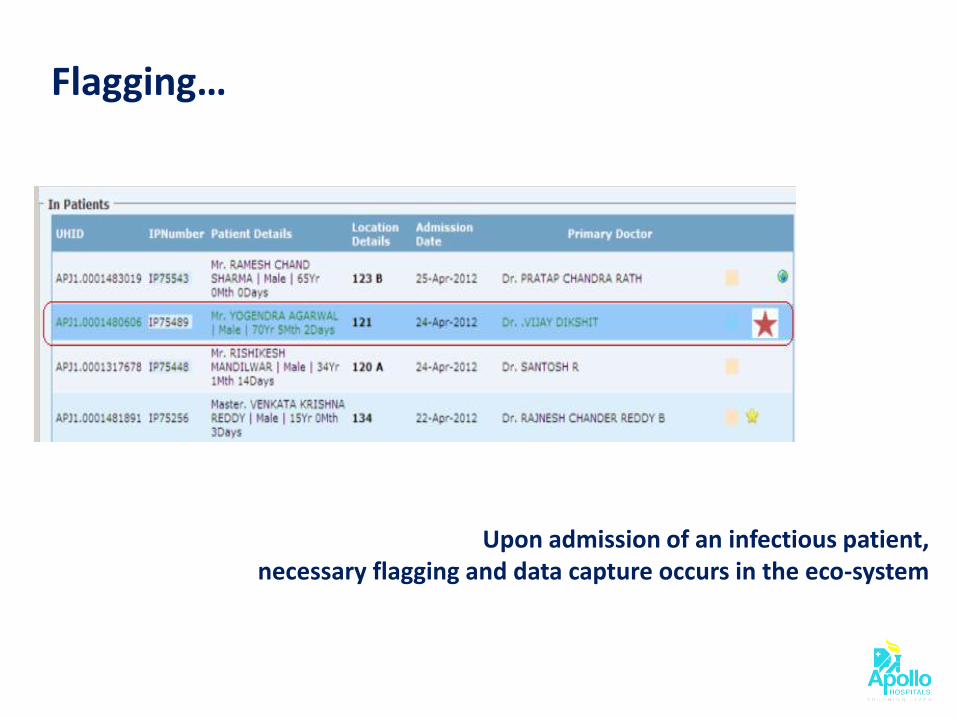
Upon admission of an infectious patient, necessary flagging and data capture occurs in the eco-system
Flagging…

© 2010. All rights reserved.
In case a patient acquires infection during the stay, the same gets registered
Registering HAI occurrences

© 2010. All rights reserved.
VENTILATOR ASSOCIATED PNEUMONIA
- Plum Infiltrate on X-ray Chest - Purulent Tracheal secretion - Early Onset VAP - Late Onset of VAP - Temp. of >38.5 or < 36.5 F - TLC > 1100 or < 4000 - Reduction in PaO2 / FIO2 over the last 48 hours
CENTRAL LINE ASSOCIATED BLOOD STREAM INFECTION
Fever Central Line pus formation Positive culture of Peripheral And Central Blood culture Count less than 1100 or more than 4000 Redness
CATHETER ASSOCIATED URINARY TRACT INFECTION
Fever Gross turbid Urine Positive Culture Isolates TLC increase
SURGICAL SITE INFECTION
Purulent drainage Positive Culture Isolates Pain / tenderness Swelling Redness / Heat
OTHER HAI
Bed sores Cellulitis IV Extra Vasation Peg Site Open case of TB MDRO

© 2010. All rights reserved.
Granularity of capture

© 2010. All rights reserved.
Dashboard…

© 2010. All rights reserved.
Alerts
Interactions
Warnings
Dosages
Drug Database @ Work
HIPaR Drug Knowledge
base
HIPaR Knowledgebase Administration
Console
MedMantra
Cloud
Request API (I/P) Response API (O/P)
Drug Interactions Functional
Layer
API/Web Service Layer
Apollo Health City, Hyderabad
HIPaR Patient SafetyShield™ Cloud System
Patients Profiles DB
Hospital Staff
Doctor
Patient
Person
Pharmacist
Users
API/Web Service
Layer
DB Interface
Layer
Network
Jubilee Hills
Apollo Central Region – AP – 1,279 IP Beds
DRDO Hyderguda Karimnagar Kakinada

© 2010. All rights reserved.
Transactions When Deployed Across The Group
Coverage : Apollo Group - IP Date Range : As Per Med-Mantra Deployment Schedule Scope : Final Phase – 26 HIPaR Patient Safety Services
IP Beds 10,000
Assumed Occupancy 80%
Assumed Daily IP Prescriptions Per Bed 2
Total Daily Prescriptions Count 16K
Average Drugs Per Prescription 5*
Patient Safety Validations Generated Per Prescription by Med Mantra
165
HIPaR Patient Safety Validation Transactions Per Day 2.64M

© 2010. All rights reserved.
Proposed IT framework
Standard Operating Procedures - Protocols
Information Aggregation
and Integration
Infection Information Collection
HIS
/M
ed
Ma
ntr
a
Patient Profiles and
Medical History
Various Cluster Diseases Occurrences Info
Data Sources
Re
po
rtin
g a
nd
D
isse
min
ati
on
Data Validation
Protocol Qualification
Possible Occurrences
Detection
Online
Periodic
SMS
Doctors’ Diagnosis –
IP/OP
Microbiology Reports
Molecular Biology Reports
Prevalent Infections
Drugs used/ Requisitioned
Infection Occurren
ce Inferenc
e
HIS
/M
ed
Ma
ntr
a
Care Guidelines Operational Workflows
Clinical Knowledgebase
Drug Knowledgebase
© 2010. All rights reserved.
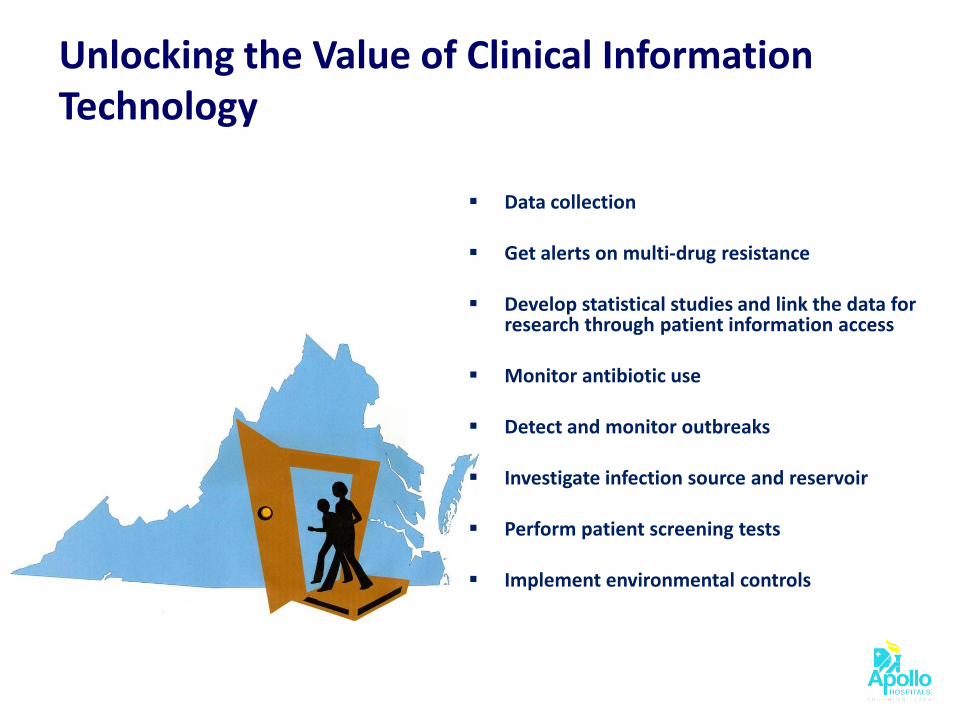
Unlocking the Value of Clinical Information Technology
Data collection
Get alerts on multi-drug resistance Develop statistical studies and link the data for
research through patient information access Monitor antibiotic use Detect and monitor outbreaks Investigate infection source and reservoir
Perform patient screening tests
Implement environmental controls
© 2010. All rights reserved.
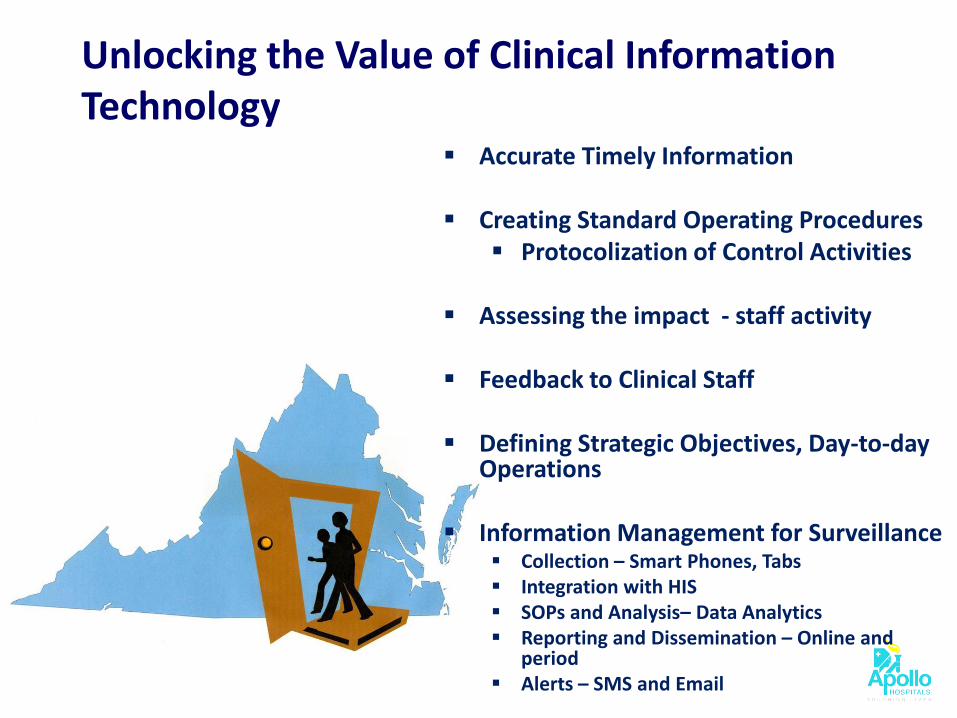
Accurate Timely Information Creating Standard Operating Procedures
Protocolization of Control Activities
Assessing the impact - staff activity Feedback to Clinical Staff Defining Strategic Objectives, Day-to-day
Operations Information Management for Surveillance
Collection – Smart Phones, Tabs Integration with HIS SOPs and Analysis– Data Analytics Reporting and Dissemination – Online and
period Alerts – SMS and Email
Unlocking the Value of Clinical Information Technology
© 2010. All rights reserved.
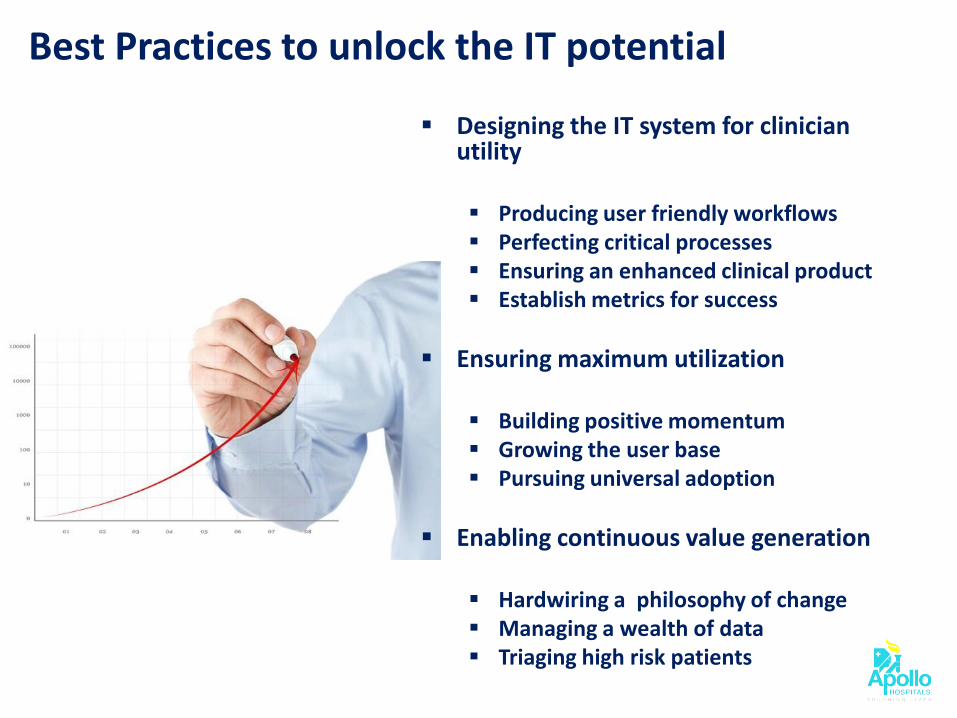
Best Practices to unlock the IT potential
Designing the IT system for clinician utility
Producing user friendly workflows Perfecting critical processes Ensuring an enhanced clinical product Establish metrics for success
Ensuring maximum utilization
Building positive momentum Growing the user base Pursuing universal adoption
Enabling continuous value generation
Hardwiring a philosophy of change Managing a wealth of data Triaging high risk patients

Prevent.. Intervene.. Control and…
Stay Disinfected…