ISTANBUL TECHNICAL UNIVERSI TY GRADUATE SCHOOL OF … · istanbul technical universi engineering...
103
ISTANBUL TECHNICAL UNIVERSITY GRADUATE SCHOOL OF SCIENCE ENGINEERING AND TECHNOLOGY M.Sc. THESIS JUNE 2012 INVESTIGATION OF HIGHWAY DRAINAGE BLANKETS, UTILIZING BOTH BENTONITE-AMENDED ZEOLITE AND BENTONITE-AMENDED SAND Shahin SHAKIBAEI Department of Civil Engineering Transportation Engineering Programme
Transcript of ISTANBUL TECHNICAL UNIVERSI TY GRADUATE SCHOOL OF … · istanbul technical universi engineering...

ISTANBUL TECHNICAL UNIVERSITY GRADUATE SCHOOL OF SCIENCE
ENGINEERING AND TECHNOLOGY
M.Sc. THESIS
JUNE 2012
INVESTIGATION OF HIGHWAY DRAINAGE BLANKETS, UTILIZING
BOTH BENTONITE-AMENDED ZEOLITE AND BENTONITE-AMENDED
SAND
Shahin SHAKIBAEI
Department of Civil Engineering
Transportation Engineering Programme
Anabilim Dalı : Herhangi Mühendislik, Bilim
Programı : Herhangi Program


JUNE 2012
ISTANBUL TECHNICAL UNIVERSITY GRADUATE SCHOOL OF SCIENCE
ENGINEERING AND TECHNOLOGY
INVESTIGATION OF HIGHWAY DRAINAGE BLANKETS, UTILIZING
BOTH BENTONITE-AMENDED ZEOLITE AND BENTONITE-AMENDED
SAND
M.Sc. THESIS
Shahin SHAKIBAEI
(501091462)
Department of Civil Engineering
Transportation Engineering Programme
Anabilim Dalı : Herhangi Mühendislik, Bilim
Programı : Herhangi Program
Thesis Advisor: Prof. Dr. Abdullah Hilmi LAV


HAZİRAN 2012
İSTANBUL TEKNİK ÜNİVERSİTESİ FEN BİLİMLERİ ENSTİTÜSÜ
BENTONİT-ZEOLİT VE BENTONİT-KUM KARIŞIMLARINI
KULLANARAK, OTOYOLLARIN DRENAJ ŞİLTELERİNİN İNCELENMESİ
YÜKSEK LİSANS TEZİ
Shahin SHAKIBAEI
(501091462)
İnşaat Mühendisliği Anabilim Dalı
Ulaştırma Mühendisliği Programı
Anabilim Dalı : Herhangi Mühendislik, Bilim
Programı : Herhangi Program
Tez Danışmanı: Prof. Dr. Abdullah Hilmi LAV


v
Thesis Advisor : Prof. Dr. Abdullah Hilmi LAV
Istanbul Technical University
Co-advisor : Prof.Dr. Zekai ŞEN
Istanbul Technical University
Jury Members : Prof. Dr. Fahri ESENLİ Istanbul Technical University
Prof. Dr. Hulusi ÖZKUL
Istanbul Technical University
Prof. Dr. Reha ARTAN
Istanbul Technical University
Shahin SHAKIBAEI, a M.Sc. student of ITU Graduate School of Science
Engineering and Technology student ID 501091462, successfully defended the
thesis entitled “INVESTIGATION OF HIGHWAY DRAINAGE BLANKETS,
UTILIZING BOTH BENTONITE-AMENDED ZEOLITE AND BENTONITE-
AMENDED SAND”, which he prepared after fulfilling the requirements specified in
the associated legislations, before the jury whose signatures are below.
Date of Submission : 03 May 2012
Date of Defense : 04 June 2012

vi

vii
To my family,

viii

ix
FOREWORD
I would like to thank first and foremost my supervisor Prof. Dr. Abdullah Hilmi
LAV and co-advisor Prof. Dr. Zekai ŞEN, for their valuable guidance throughout my
period of thesis. I am grateful to Prof. Dr. Abdullah Hilmi LAV for his technical and
mental support from the beginning of my graduate school life.
I would like to acknowledge scientific and financial supports provided by Prof. Dr.
Fahri ESENLİ, whose aids as a part of a BAP project of Istanbul Technical
University were precious.
My thanks are also for Assoc. Prof. Dr. M. Ayşen LAV for her kind discussions and
valuable recommendations on laboratory testing program.
My special thanks are for Dr. Adem Faik İYİNAM and Assoc. Prof. Dr. Kemal
SELCUK who supported me from the first moment of my arrival at Istanbul
Technical University. Many thanks are due for Dr. Nevzat ERSELCAN for his
valuable comments and suggestions. He is the one always near me whenever I need
someone to speak and whenever I need someone to help me.
Assistants of soil mechanics laboratory are acknowledged for their helps, while
conducting the tests. I also want to thank my research colleague, Furkan KARTAL,
for his contribution in conducting the tests.
As a foreigner student in Turkey, my dear friends; Çağın TANRIVERDİ, Javad
JANGI GOLEZANI, Mahsa SAFAEI, Sareh NAJI and Cankat TANRIVERDİ
always supported me mentally and with their presence it became easier for me to
manage the life in Istanbul.
I would like to acknowledge to my family: My mother and father as well as my
brother. They have always supported, helped and encouraged me throughout my life.
I have never forgotten their contribution.
April 2012
Shahin SHAKIBAEI

x

xi
TABLE OF CONTENTS
Page
FOREWORD ............................................................................................................. ix TABLE OF CONTENTS .......................................................................................... xi ABBREVIATIONS ................................................................................................. xiii
LIST OF TABLES ................................................................................................... xv LIST OF FIGURES ............................................................................................... xvii
SUMMARY ............................................................................................................. xix ÖZET ........................................................................................................................ xxi 1. INTRODUCTION .................................................................................................. 1
1.1 Motivation for Study .......................................................................................... 1 1.2 Background and Objectives ............................................................................... 3
1.3 Outline of Report ................................................................................................ 4
2. LITERATURE REVIEW ...................................................................................... 5 2.1 Application of Zeolite and Bentonite in Technical and Engineering Fields ...... 5 2.2 Effects of Poor Drainage on Roads .................................................................... 6 2.3 General Approach to the Materials Used in the Study ..................................... 12
2.3.1 Bentonite ................................................................................................... 12 2.3.2 Zeolite ....................................................................................................... 14
2.4 Various Characteristics of Bentonite-Amended Sand ...................................... 16
2.4.1 Compaction ............................................................................................... 16
2.4.2 Hydraulic conductivity .............................................................................. 18 2.4.3 Swelling characteristics of bentonite-sand mixtures ................................. 20 2.4.4 Mechanical properties ............................................................................... 23
2.5 Various Characteristics of Bentonite-Amended Zeolite .................................. 24
2.5.1 Compaction ............................................................................................... 24 2.5.2 Hydraulic conductivity .............................................................................. 27
3. LABORATORY TESTING PROGRAM .......................................................... 29 3.1 Introduction ...................................................................................................... 29
3.1.1 Bentonite ................................................................................................... 29
3.1.2 Zeolite ....................................................................................................... 31 3.1.3 Sand ........................................................................................................... 32
3.2 Tests on Bentonite ............................................................................................ 32
3.2.1 Specific gravity ......................................................................................... 32 3.3 Tests on Zeolite ................................................................................................ 33
3.3.1 Sieve analysis ............................................................................................ 33 3.3.2 Specific gravity ......................................................................................... 35
3.4 Tests on Sand ................................................................................................... 36
3.4.1 Sieve analysis ............................................................................................ 36 3.5 Tests on Bentonite-Sand and Bentonite-Zeolite ............................................... 36
3.5.1 Compaction tests ....................................................................................... 36 3.5.1.1 Standard proctor compaction test ....................................................... 36

xii
3.5.1.2 Vibratory hammer test ........................................................................ 39
3.5.2 Hydraulic conductivity .............................................................................. 40
4. EVALUATION OF TEST RESULTS ................................................................ 43 4.1 Standard Proctor Compaction Tests ................................................................. 43
4.1.1 Bentonite-amended sand ........................................................................... 43 4.1.2 Bentonite-amended zeolite ........................................................................ 47
4.2 Vibratory Hammer............................................................................................ 64
4.3 Hydraulic Conductivity .................................................................................... 67
4.3.1 Bentonite-amended sand ........................................................................... 67
4.3.2 Bentonite-amended Zeolite ....................................................................... 68
5. CONCLUSIONS AND RECOMMENDATIONS ............................................. 71 REFERENCES ......................................................................................................... 73 CURRICULUM VITAE .......................................................................................... 77

xiii
ABBREVIATIONS
BAS : Bentonite-Amended Sand
BAZ : Bentonite-Amended Zeolite
B/BAS : Bentonite/Bentonite-Amended Sand
B/BAZ : Bentonite/Bentonite-Amended Zeolite
B/S : Bentonite/Sand
CEC : Cation Exchange Capacity
ITU : Istanbul Technical University
CD : Consolidated Drained
NPP : Nuclear Power Plant

xiv

xv
LIST OF TABLES
Page
Table 2.1 : Experimental conditions and results of swelling pressure tests (Komine
and Ogata, 1999). ................................................................................... 23
Table 2.2 : Results of swelling pressure tests (Yanıkömeroğlu, 1990) .................... 23
Table 2.3 : Hydraulic conductivity values of 20% BAZ with varying initial seating
pressures (Kaya, 2004). .......................................................................... 27
Table 3.1 : Mineralogical compositions of studied samples, bentonites by XRD ... 30
Table 3.2 : Mineralogical compositions of studied samples, zeolites by XRD ...... 32
Table 3.3 : Sieve analysis of zeolite Gördes (Z1) ................................................... 33
Table 3.4 : Sieve analysis of zeolite Gördes (Z2) ................................................... 33
Table 3.5 : Sieve analysis of zeolite Bigadiç (Z3) .................................................. 33
Table 3.6 : Sieve analysis of zeolite Gördes after compaction (Z1) ....................... 33
Table 3.7 : Sieve analysis of zeolite Gördes after compaction (Z2) ....................... 34
Table 3.8 : Sieve analysis of zeolite Bigadiç after compaction (Z3) ...................... 34
Table 4.1 : Maximum dry density and optimum water of BAS .............................. 46
Table 4.2 : Dry density and water content of Z1B1 ................................................ 63
Table 4.3 : Dry density and water content of Z1B2 ................................................ 63
Table 4.4 : Dry density and water content of Z2B1 ................................................ 63
Table 4.5 : Dry density and water content of Z2B2 ................................................ 63
Table 4.6 : Dry density and water content of Z3B1 ................................................ 63
Table 4.7 : Dry density and water content of Z3B2 ................................................ 64
Table 4.8 : Relation of bentonite amount with hydraulic conductivity ................... 67
Table 4.9 : Relation of bentonite amount with hydraulic conductivity (Z1B1) ...... 68
Table 4.10: Relation of bentonite amount with hydraulic conductivity (Z2B1) ...... 69
Table 4.11: Relation of bentonite amount with hydraulic conductivity (Z3B1) ...... 69
Table 4.12: Relation of bentonite amount with hydraulic conductivity (Z1B2) ...... 69
Table 4.13: Relation of bentonite amount with hydraulic conductivity (Z2B2) ...... 69
Table 4.14: Relation of bentonite amount with hydraulic conductivity (Z3B2) ...... 69

xvi

xvii
LIST OF FIGURES
Page
Figure 1.1 : Interaction of water and pavement. ....................................................... 4
Figure 2.1 : Some measures to prevent the penetration of contaminants to the
groundwater and environment (a) in nucleat power plants (b) in
sanitary landfills. .................................................................................... 7
Figure 2.2 : Road under water near Punawale village-India. .................................... 8
Figure 2.3 : Cuts in road due to water. ...................................................................... 8
Figure 2.4 : Stripping of bitumen. ............................................................................. 9 Figure 2.5 : Cuts in road due to water. ...................................................................... 9 Figure 2.6 : Expulsion of water from road. ............................................................. 10
Figure 2.7 : Formation of waves and corrugations . ............................................... 10
Figure 2.8 : Formation of potholes due to poor drainage........................................ 11
Figure 2.9 : Expulsion of water due to capillary action … ..................................... 11
Figure 2.10 : Formation of potholes due to settlement of sub-grade … .................. 12
Figure 2.11 : Crystal structure of montmorillonite bentonite indicating Na cations
and interlayer water molecules (Fuenkajorn and Daemon, 1996). ....... 13
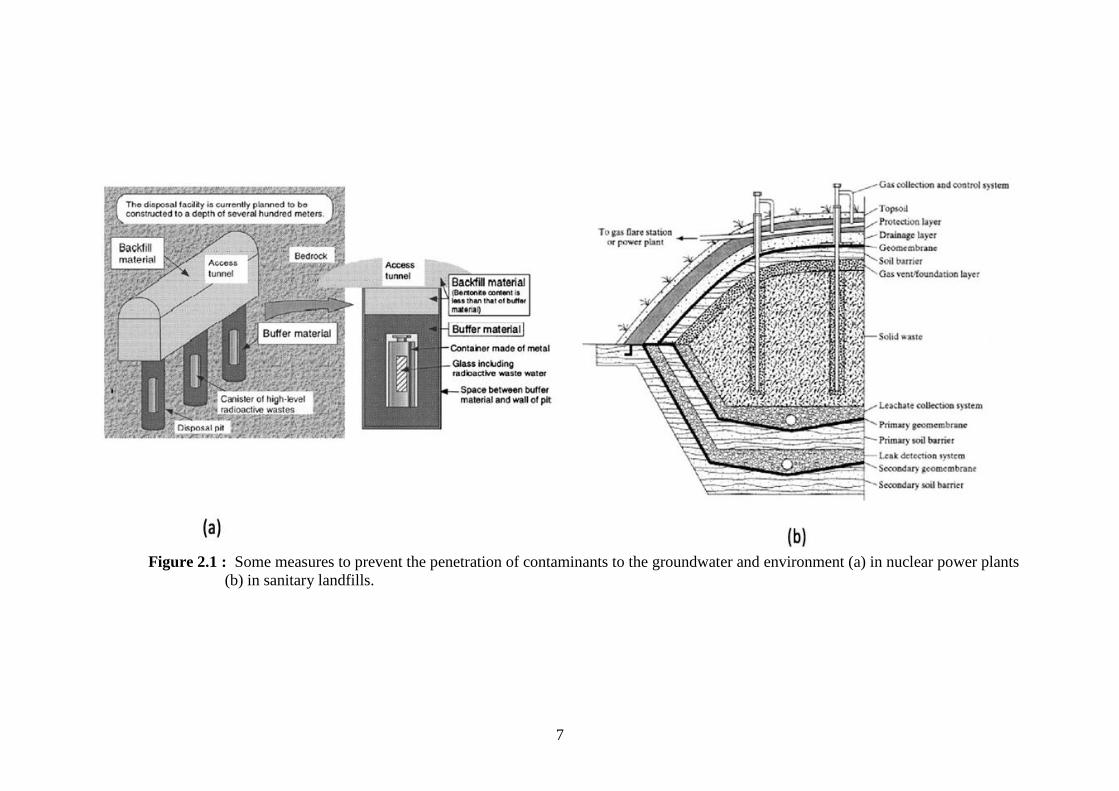
Figure 2.12 : Bentonite in Turkey . ........................................................................... 14
Figure 2.13 : The microporous molecular structure of a zeolite . ............................. 15
Figure 2.14 : Compaction mechanism of soils . ........................................................ 16
Figure 2.15 : Self sealing of buffer material and applied stress due to swelling of
buffer or backfill material after submergence of groundwater (Komine,
2004). .................................................................................................... 21
Figure 2.16 : Image of process of swelling pressure test with swelling deformation
restricted (Komine, 2004). .................................................................... 22
Figure 2.17 : Compaction characteristics of natural zeolite and BAZ (Kaya,2004). 25
Figure 2.18 : Results of compaction test on different B/Z ratios (Kayabali, 1997). . 26
Figure 2.19 : Comparison of optimum moisture content changes with bentonite
content in BAZ. .................................................................................... 27
Figure 2.20 : Hydraulic conductivity for various B/Z at optimum water content
(Kayabali, 1997). .................................................................................. 28
Figure 3.1 : Comparison of zeolite 1 Gördes before and after compaction . .......... 34
Figure 3.2 : Comparison of zeolite 2 Gördes before and after compaction . .......... 35
Figure 3.3 : Comparison of zeolite 3 Bigadiç before and after compaction . ......... 35
Figure 3.4 : Sieve analysis of sand. ......................................................................... 36
Figure 3.5 : Spraying method used while compacting. ........................................... 37
Figure 3.6 : Adding water and mixing by hand. ..................................................... 38
Figure 3.7 : A homogeneous mixture to be compacted. ......................................... 38
Figure 3.8 : Compacted bentonite-sand mixture that is trimmed and extruded from
4 inch compaction mold. ...................................................................... 39
Figure 3.9 : Vibratory hammer equipment.............................................................. 39
Figure 3.10 : Falling head compaction permeameter. ............................................... 40

xviii
Figure 4.1 : Results of standard proctor compaction test sand+B2 (B/BAS=6%) ... 44
Figure 4.2 : Results of standard proctor compaction test sand+B2 (B/BAS=8%) ... 44
Figure 4.3 : Result of standard proctor compaction test sand+B2 (B/BAS=10%) .. 45
Figure 4.4 : Result of standard proctor compaction test sand+B2 (B/BAS=12%) .. 45
Figure 4.5 : Result of standard proctor compaction test sand+B2 (B/BAS=18%) .. 46
Figure 4.6 : Relation of bentonite amount in the mixture with maximum dry unit
weight ................................................................................................... 46
Figure 4.7 : Results of standard proctor compaction test Z1B1 (B/BAZ=6%).. ...... 48
Figure 4.8 : Results of standard proctor compaction test Z1B1 (B/BAZ=8%).. ...... 48
Figure 4.9 : Results of standard proctor compaction test Z1B1 (B/BAZ=10%).. .... 49
Figure 4.10: Results of standard proctor compaction test Z1B1 (B/BAZ=12%).. .... 49
Figure 4.11: Results of standard proctor compaction test Z1B1 (B/BAZ=18%).. .... 50
Figure 4.12: Results of standard proctor compaction test Z1B2 (B/BAZ=6%).. ...... 50
Figure 4.13: Results of standard proctor compaction test Z1B2 (B/BAZ=8%).. ...... 51
Figure 4.14: Results of standard proctor compaction test Z1B2 (B/BAZ=10%).. .... 51
Figure 4.15: Results of standard proctor compaction test Z1B2 (B/BAZ=12%).. .... 52
Figure 4.16: Results of standard proctor compaction test Z1B2 (B/BAZ=18%).. .... 52
Figure 4.17: Results of standard proctor compaction test Z2B1 (B/BAZ=6%).. ...... 53
Figure 4.18: Results of standard proctor compaction test Z2B1 (B/BAZ=8%).. ...... 53
Figure 4.19: Results of standard proctor compaction test Z2B1 (B/BAZ=10%).. .... 54
Figure 4.20: Results of standard proctor compaction test Z2B1 (B/BAZ=12%).. .... 54
Figure 4.21: Results of standard proctor compaction test Z2B1 (B/BAZ=18%).. .... 55
Figure 4.22: Results of standard proctor compaction test Z2B2 (B/BAZ=6%).. ...... 55
Figure 4.23: Results of standard proctor compaction test Z2B2 (B/BAZ=8%).. ...... 56
Figure 4.24: Results of standard proctor compaction test Z2B2 (B/BAZ=10%).. .... 56
Figure 4.25: Results of standard proctor compaction test Z2B2 (B/BAZ=12%).. .... 57
Figure 4.26: Results of standard proctor compaction test Z2B2 (B/BAZ=18%).. .... 57
Figure 4.27: Results of standard proctor compaction test Z3B1 (B/BAZ=6%).. ...... 58
Figure 4.28: Results of standard proctor compaction test Z3B1 (B/BAZ=8%).. ...... 58
Figure 4.29: Results of standard proctor compaction test Z3B1 (B/BAZ=10%).. .... 59
Figure 4.30: Results of standard proctor compaction test Z3B1 (B/BAZ=12%).. .... 59
Figure 4.31: Results of standard proctor compaction test Z3B1 (B/BAZ=18%).. .... 60
Figure 4.32: Results of standard proctor compaction test Z3B2 (B/BAZ=6%).. ...... 60
Figure 4.33: Results of standard proctor compaction test Z3B2 (B/BAZ=8%).. ...... 61
Figure 4.34: Results of standard proctor compaction test Z3B2 (B/BAZ=10%).. .... 61
Figure 4.35: Results of standard proctor compaction test Z3B2 (B/BAZ=12%).. .... 62
Figure 4.36: Results of standard proctor compaction test Z3B2 (B/BAZ=18%).. .... 62
Figure 4.37: Vibratory hammer compaction test on sand+B2 (B/BAS=6%).. ......... 64
Figure 4.38: Vibratory hammer compaction test on sand+B2 (B/BAS=8%).. ......... 65
Figure 4.39: Vibratory hammer compaction test on sand+B2 (B/BAS=10%).. ....... 65
Figure 4.40: Vibratory hammer compaction test on sand+B2 (B/BAS=12%).. ....... 66
Figure 4.41: Vibratory hammer compaction test on sand+B2 (B/BAS=18%).. ....... 66
Figure 4.42: Relation of bentonite amount with hydraulic conductivity.. ................ 68
Figure 4.43: Relation of bentonite amount with hydraulic conductivity (Z3B2).. ... 70

xix
INVESTIGATION OF HIGHWAY DRAINAGE BLANKETS, UTILIZING
BOTH BENTONITE-AMENDED ZEOLITE AND BENTONITE-AMENDED
SAND
SUMMARY
The design and development of drainage blankets for highways, especially in the
areas with high ground water table is a matter of paramount importance. In the road-
building environment, water is typically added to most road-building materials
during construction. Hydration, evaporation and migration of this water occur during
and after construction to permit the materials to act as designed. After construction of
the road, water may be a trouble due to the fact that an increase in moisture content
decreases the strength of the pavement. One of the main reasons of pavement
damages, especially in the areas with high ground water table is the upward
movement of the groundwater towards pavement by capillary action. In most cases,
geotextiles have been used to prevent the penetration of groundwater to the pavement
and have been placed between sub-grade and sub-base layers. In this study, two
novel mixtures entitled “bentonite-amended zeolite (BAZ)” and “bentonite-amended
sand (BAS)” have been scrutinized to be replaced by geotextiles and performance of
the mixtures has been investigated, with regard to their hydrological and mechanical
properties. These mixtures have been widely used in landfill liners in order to
dispose the wastes. In sanitary landfills, a minimum hydraulic conductivity
requirement defined by regulatory agencies should be satisfied (i.e. 1 x 10⁻⁸
m/s in
Turkey, 1 x 10⁻⁹
m/s in USA). But, since these mixtures have not been implemented
in drainage systems, there is no definite limit for their hydraulic conductivity in this
field. To be able to assess the performance of these materials, a variety of laboratory
tests such as compaction and falling head permeability tests were conducted to select
an optimum mixture. Finally, an optimum bentonite-zeolite mixture possessing 6-
10% bentonite and bentonite-sand mixture possessing 18% bentonite was
recommended to be used as a drainage blanket to obviate the movement of
groundwater to the pavement, caused by capillary action.

xx

xxi
BENTONİT-ZEOLİT VE BENTONİT-KUM KARIŞIMLARINI
KULLANARAK, OTOYOLLARIN DRENAJ ŞİLTELERİNİN
İNCELENMESİ
ÖZET
Teknoloji ve iletişimin giderek önem kazandığı günümüzde, ulaşım sorunları da aynı
hızla artmaktadır. Ülkelerin sahip oldukları ulaşım ağları ve kapasiteleri, gelişmişlik
düzeylerini göstermektedir. Gelişmiş ülkeler oldukça çeşitli ulaşım imkanlarına
sahipken, gelişmekte olan ülkelerde durum daha farklıdır. Özellikle karayolunun
daha fazla kullanıldığı gelişmekte olan ülkelerde, trafik kazaları ülkelerin önemli
sorunlarından biridir. Karayollarında tüm dünya ülkeleri için ortak sorunlardan biri
de yol yapımında güçlük yaratan su sorunu sebebiyle yol kalitesinin bozulmasından
kaynaklanan trafik kazalarıdır.
Otoyollar için kullanılan drenaj şiltelerinin tasarımı ve gelişmesi, özellikle yeraltı su
seviyesinin yüksek olduğu bölgelerde çok büyük önem taşımaktadır. Su, yol yapımı
konusunda vazgeçilmez malzemelerden biridir ve yapım süresince yol yapım
malzemelerine eklenir. Yapım süresince ve sonrasında, hidrasyon, buharlaşma ve
suyun hareketi meydana gelir ve malzemelerin, istendiği gibi davranmalarını sağlar.
Nem oranının artması ile üstyapıda zarar meydana gelebileceğinden, yolun yapım
aşamasından sonra, su çeşitli sorunlar oluşturabilir. Özellikle yeraltı su seviyesinin
yüksek olduğu bölgelerde üstyapıda meydana gelen hasarların en önemlilerinden
biri, yeraltı suyunun kapilarite hareketi ile yeraltından üstyapıya doğru hareket
etmesidir. Yeraltı suyunun üstyapıya nüfuz etmesini önlemek için, genellikle
geotekstil malzemesi kullanılır ve zemin ile alt temel katmanları arasına
yerleştirilmektedir. Fakat geotekstil malzemesi pahalı olduğu için veya yurtdışından
getirildiği için, bu malzemeye alternatif aranması uygun görülmüştür.
Bu çalışmada, geotekstil malzemesinin yerini alabilecek olan iki yeni karışım
“bentonit ile iyileştirilmiş zeolit (BAZ)” ve “bentonit ile iyileştirilmiş kum (BAS)”
detaylı olarak incelenmektedir ve bu karışımların hidrolojik ve mekanik özellikleri
dikkate alınarak, performansları araştırılmaktadır. Bu karışımlar, genel olarak
çöplerin depolandığı sahalarda kullanılmaktadır. Çöplerden sızan atık suların
yeraltına ulaşması, yeraltı suyunu kirletmektedir. Bu nedenle, bu karışımlar
sözkonusu sızıntıyı önlemek amacıyla, çöp sahalarında geçirimsiz bir şilte olarak
kullanılmaktadırlar. Düzenleyici kuruluşlar tarafından, çöp sahalarının daha hijyenik
olması için, şiltenin su geçiriminin minimuma indirilmesi gerekliliği sağlanmalıdır
(Örneğin Türkiye için 1 x 10⁻⁸
m/s, Amerika için 1 x 10⁻⁹
m/s). Fakat şimdiye kadar
bu karışımlar drenaj sistemlerinde kullanılmadığı için geçirimsizliklerinin kesin bir
limiti bulunmamaktadır. Bu malzemelerin karışımlarının performanslarını
arttırbilmek ve optimum karışımı elde edebilmek amacıyla, kompaksiyon ve düşen
seviyeli permabilite gibi çeşitli laboratuvar deneyleri yürütülmüştür.

xxii
Sonuç olarak; kapilarite hareketine yol açan yeraltı suyunun üstyapıya ulaşmasını
engellemek amacıyla, % 6-10 bentonit karışımına sahip olan bentonit-zeolit karışımı
ve %18 bentonit barındıran bentonit-kum karışımı önerilmektedir.
Daha once yapılmış olan çalışmalarda; bentonit-zeolit ve bentonit-kum karışımları,
optimum su muhtevasının ve maksimum kuru birim hacim ağırlığının değişiklik
gösterdikleri görülmüştür. Bu sebepten ötürü, tez kapsamında Türkiye‟den üç farklı
zeolit ve iki farklı bentonit kullanılmıştır. Zeolitlerin ikisi Gördes bölgesinden, diğeri
de Bigadiç bölgesinden alınmıştır (Z1= Gördes ve Z2= Gördes ve Z3= Bigadiç).
Bentonitlerden ilki, Edirne‟nin Lalapaşa ilçesinden (B1), diğeri ise Tokat‟ın
Reşadiye ilçesinden (B2) alınmıştır. Bu malzemelerin kullanılması ile elde edilen altı
farklı karışım incelenmiştir (Z1B1, Z1B2, Z2-B1, Z2B2, Z3B1, Z3B2). Bunların
dışında, kum malzemesi de sadece Reşadiye‟den gelen B2 ile karıştırılmıştır.
Çöp depolama alanlarında serilen şilte olarak, zeolit-bentonit karışımının
kullanılmasının asıl nedeni; zeolit malzemesinin yüksek katyon değişim kapasitesi
olması ve bentonitin de su geçiriminin çok az olmasıdır. Böylece bu iki malzeme
karıştırıldığında, öncelikle atık suyun yeraltına geçmesi önlenmekte, ayrıca atık
suyun, zeolitin etkisi altında toprağa ve yeraltı suyuna verebileceği kirlilik
minimuma indirilebilmektedir.
Bu çalışma kapsamında otoyolların drenaj sistemi incelendiğinden, katyon
değişiminden çok, suyun geçirimsizliği daha fazla önem taşımaktadır. Bu sebepten
ötürü, bu karışımlara ek olarak kum da kullanılmıştır. Bu çalışmanın asıl amacı,
yeraltı suyunun üstyapıya ulaşıp mukavemetini azaltmasını, fiziksel deformasyona
uğramasını önelemek için, en uygun malzeme karışımlarını elde etmektir. Son
yıllarda giderek artan trafik kazalarının azalması açısından da, otoyollardaki
üstyapının kalitesinin iyi olması ve dolayısıyla drenaj gibi bu kaliteyi etkileyen
faktörlerin iyi bir şekilde tasarlanması çok önemlidir.
Bentonit malzemesi, zeolit ve kuma göre pahalı olduğu için, koşulları sağlayacak
şekilde bentonit miktarının optimum miktarda zeolit ve kum ile karıştırılması uygun
görülmüştür. Yapılan diğer çalışmalarda, bu karışımların %5 ile %25 arasında
değiştiği gözlenmiştir. Bu sebeple de, yukarıda bahsedilen karışımların tamamı için,
bentonitin karışıma oranı %6, %8, %10, %12 ve %18 olarak kullanılmıştır (B/BAS
ve B/BAZ).
Laboratuvar deneyleri sırasında, zeolit malzemelerinin biri, kullanılması gerekenden
az olduğu için, kullanılan malzemenin tekrar kullanılabilip kullanılamayacağı test
edilmiştir. Bunun için ilk olarak, daha önce deneylerde kullanılmamış olan zeolitler
üzerinde elek testi yapılmıştır. Daha sonra ise standart proktor testin kabında,
üzerinde kompaksiyon deneyleri yapılmış olan zeolitte elek testi yapılmıştır. Bu
deneyler sonucunda, elek analizi diyagramlarının karşılaştırılması ile zeolit tane
çaplarında önemli bir fark gözlenmemiştir ve bu, aynı malzemenin tekrar
kullanılabileceği anlamına gelmektedir.
Bu araştırmanın asıl odak noktası otoyolların drenaj sistemleri olduğundan dolayı,
karışımların mukavemet parametreleri ikinci planda yer almaktadır. Bu şilte, alt
temel ve zeminin katmanlarının arasında olduğu için yük taşıma kapasitesi
sözkonusu değildir. Yapılan diğer çalışmalarda, bu karışımların mukavemet
açısından yeterli oldukları tespit edilmiştir.
Bu çalışmada; birinci bölümde, giriş, amaç, kapsam ve yöntem konularından
bahsedilerek, otoyollarda kullanılan drenaj sistemlerinin ulaştırma alanındaki

xxiii
önemine işaret edilmektedir. İkinci bölümde, literatür taraması yapılarak daha önce
yapılmış çalışmalardan bahsedilmekte, konu ile ilgili kavramsal çerçeve
çizilmektedir. Üçüncü bölümde, laboratuvar çalışmalarına yer verilmektedir.
Deneylerin nasıl yapıldıkları ayrıntılı biçimde anlatılmaktadır. Dördüncü bölümde,
yapılan testlerin sonuçları değerlendirilmektedir. Beşinci bölümde ise sonuç ve
öneriler yer almaktadır.
Yol inşaat süresinde, bu tip drenaj şiltesinin yapım maliyesi bütün masrafların 4-
7%‟ni kapsıyor. Böylece uzun zamanda, bu şiltenin özellikle de yeraltı su seviyesinin
yüksek olduğu yerlerde kullanılması mantıklı olabilir.

xxiv

1
1. INTRODUCTION
In this section, motivation for study, background and objectives, and outline of report
are given.
1.1 Motivation for Study
Nowadays, the roads and highway network in a country may depict the level of
economical improvement of that country. They are also one of the most important
infrastructures of the country. Each year, millions of dollars are being spent to the
maintenance and reparation of the roads. Among the remarkable reasons of roads‟
damages, poor drainage plays an important role. Drainage is an important feature in
determining the ability of given pavement to withstand the effects of traffic and
environment. While planning and executing the work, the contractor shall take all
adequate precautions against drainage system to keep the road free from water.
Otherwise, bad drainage causes the premature failure of the pavement.
During the rains, part of the rain water flows on surface and part of it percolates
through the soil mass as gravitational water until it reaches to the ground water.
Some water is retained in the pores of the soil mass and on the surface of soil
particles which cannot be drained by normal gravitational methods and this water is
termed as held water. It is required that the surface water from the carriageway and
shoulder should effectively be drained off without allowing it to percolate to
subgrade. Dearth of proper drainage system may cause the failure of the roads due to
many reasons like increase in moisture content, decrease in strength, mud pumping,
formation of waves and corrugations, stripping of bitumen, cutting of edges of
pavement, frost action, etc.
Generally, there are two types of drainage systems:
Surface drainage
Subsurface drainage

2
The surface water is collected and disposed off. The water is first collected in the
longitudinal drains, generally in the side drains and then it is disposed off at the
nearest stream, valley or water course. Cross drainage structure like culverts and
small bridges may be necessary for the disposal of the surface water from the road
side drains.
Changes in the moisture content of sub grade are caused by fluctuations in ground
water table, seepage flow, percolation of rain water, movement of capillary water and
even water vapor. In sub-surface drainage of highways, it is attempted to keep the
variation of moisture in sub-grade soil to a minimum. However, only gravitational
water is drained by usual drainage system.
Turkey connects Asia to Europe as its geographical situation is concerned. This
makes Turkey one of the most strategic corridors in the region and even in the world
for the transportation of goods. The prerequisite factor for this goal is to have the
appropriate infrastructures such as road networks with high quality. On the other
hand, due to the shortage of energy resources such as oil and natural gas in the
country, even a small measure in proper erection and maintenance of the roads, may
result in mammoth financial saves.
With regard to the geographical position of the Turkey, most of the cities encounter a
remarkable rate of precipitation. Consequently, surface drainage systems are
resolutely essential for dewatering. Besides, a fraction of this precipitation penetrates
into the ground and joins the ground water. The latter form of the water may
subsequently rise and move to the pavement by capillary action. Ironically, this type
of water penetration may be more perilous and detrimental to pavements due to their
latent devastative characteristics. For instance, one of the main reasons for pavement
damages in Istanbul is the upward movement of ground water to the pavement by
capillary actions, considering the fact that the ground water table in Istanbul is very
high.
To recapitulate, we can enunciate that poor drainage and excess water present no less
than six adverse effects on performance of pavements (Abhijit, 2011):
Reduction of shear strength of unbound materials
Differential swelling on expansive sub-grade soils
Movement of unbound fines in flexible pavement base and sub-base layers

3
Pumping of fines and durability cracking in rigid pavements
Frost-heave and thaw weakening
Stripping of asphalt in flexible pavements
All of the above-mentioned concerns and the necessity of dealing with performance
of the pavements in Turkey have led us to assess the performance of a novel drainage
blanket in a laboratory environment in relation to the obviation of ground water
penetration to the pavements.
1.2 Background and Objectives
Figure 1.1 illustrates the general movement of water in roads and the interaction of
water and soil. Surface water can be easily disposed by implementing surface
drainage systems. Seepage from higher ground and capillary moisture from verges
can be managed by side galleries or ditches. However, prevention of movement of
capillary moisture from water table towards pavement, especially in some areas such
as Istanbul, where the ground water table is very close to the pavement, is not that
easy.
A number of measures have been made to overcome this problem. Conventional
graded sand, geocomposites and geotextiles are the most common remedies for this
aim. This study aims at presenting some novel tactics not only to prevent the
penetration of ground water into the pavement, but also to obviate the combination of
sub-grade with sub-base layers, which causes some crucial problems in pavements.
In Turkey, for these purposes in recent decades, geocomposites and geotextiles have
been widely used, whereas the costs of their implementation are high, due to the fact
that in most cases the materials have been imported from developed countries.
Conventional graded sand has been also used but the quality of the system is open to
discuss. Knowing the abundance of zeolite and bentonite ores in Turkey, their vast
applications as landfill liners and some of their superb features such as high cation
exchange capacity (CEC) and low permeability were the master keys of this study.
Consequently, bentonite-amended zeolite (BAZ) and bentonite-amended sand (BAS)
were selected to evaluate their characteristics. Different ratios of B/BAZ and B/BAS
have been investigated and compared together in order to reach an optimum mixture
with the favorable features and lower costs.
4
Figure 1.1 : Interaction of water and pavement.
A research program, designed to determine experimentally the suitability of a BAZ
and BAS materials for use as a drainage blanket in highways was undertaken at
Istanbul Technical University (ITU). The approach fundamentally consisted of
compaction and permeability tests. Bentonite‟s low permeability together with the
high cation exchange capacity of zeolite play the main role in formation of an
impervious layer. Anyway, the high cation exchange capacity of zeolite is not that
important in drainage blankets, but since the bentonite is more expensive in
comparison with sand and zeolite, finding an optimum amount of bentonite in the
mixtures should be deemed carefully.
1.3 Outline of Report
In Chapter 1 an introduction to the report is presented. A project overview and
literature review comprise Chapter 2. Chapter 3 encompasses a laboratory testing
program, material definition and common trend in conducting the tests. Chapter 4 is
allocated to evaluation of test results. Conclusions and recommendations of the
results of all tested materials can be found in Chapter 5.

5
2. LITERATURE REVIEW
2.1 Application of Zeolite and Bentonite in Technical and Engineering Fields
Environmental issues are playing a vital role in global concerns. Most conventional
energy resources such as oil and natural gas are not renewable and even they are not
homogeneously distributed in the world. This can persuade many countries to use
nuclear energy. The nuclear waste produced by nuclear power plants (NPP) may be
very perilous and detrimental to environment and groundwater. On the other hand,
landfills of wastes can be very hazardous to the environment due to the probability of
percolation of contaminated leachate to the groundwater. These are only a few
reasons why global organizations concern about environment. A plethora of
measures and policies have been made and implemented to minimize the damages.
For instance, the use of liner systems is common in preventing transport of
contaminants to the surrounding pollution-prone environment. In general, these
measures include the application of low permeability natural clays and sand-
bentonite mixtures or synthetic materials (Van Ree et al., 1992). In nuclear power
plants, some stricter measures should be taken due to the higher rate of nuclear
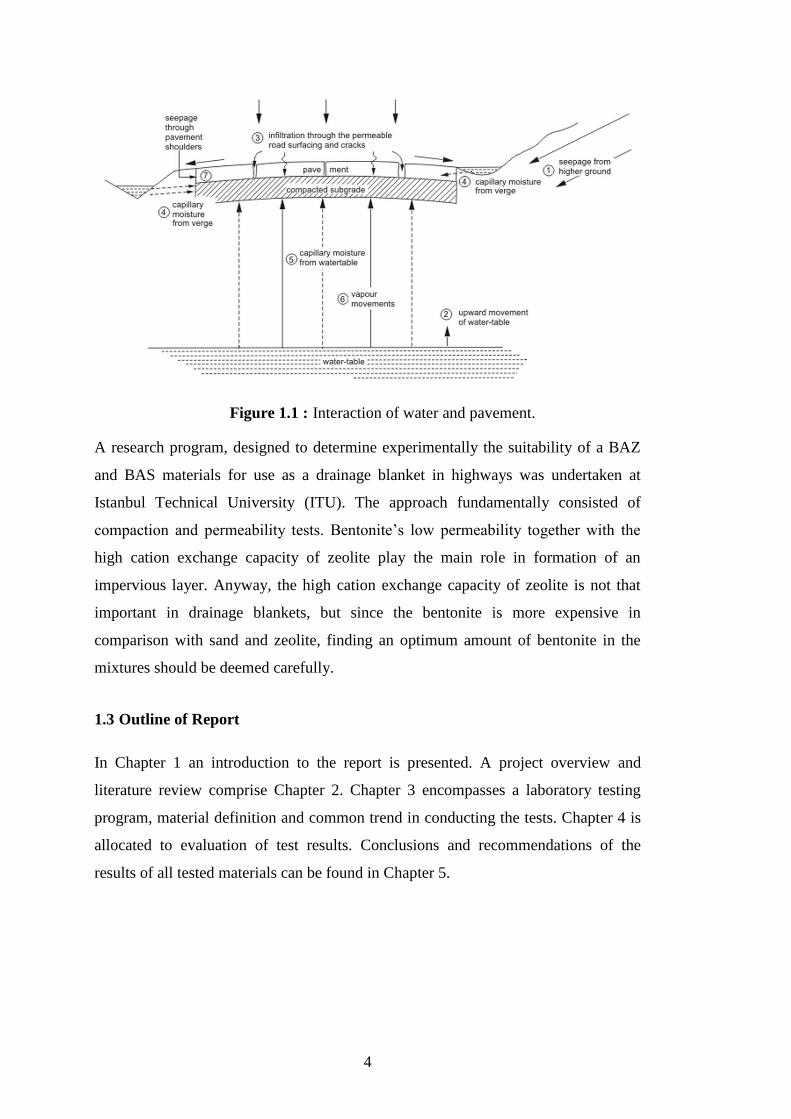
wastes‟ dangers. Figure 2.1 shows some practical solutions that have been
implemented to neutralize the ominous effects of contaminants.
Beforehand, utility of bentonite-amended sand and geotextiles were very rampant in
formation of liners. In mid 1990s, some studies investigated the replacement of
bentonite-amended sand by bentonite-amended zeolite. Due to the higher capacity of
zeolites‟ cation exchange, the layer thickness of bentonite-amended zeolite applied
for landfill liners was found to be far less than bentonite-amended sand and this
would result in a remarkable save in formation costs and duration.
Considering the impermeability of BAZ together with its high cation exchange
capacity could be an ideal spark to its application in blanket drainage systems.
Zeolite is known for its high CEC and bentonite is famous for its low permeability.
However, the matter of high cation exchange capacity is not that important in

6
drainage blankets‟ application. Therefore, BAS could be another proper mixture,
despite its relatively lower CEC. With these ideas in mind, the first step of
investigating the characteristics of mentioned mixtures was commenced.
2.2 Effects of Poor Drainage on Roads
An appropriate understanding of the dynamics of water flow in roads is important for
many reasons. Road engineers, geotechnical engineers and environmental scientists
are three groups of professionals that have a natural interest for moisture related
questions. It is well known that the rate of road deterioration increases if the water
content of the granular material increases. The adverse effects of excess water on
pavement may be categorized in six groups:
Reduction of shear strength of unbound materials
Differential swelling on expansive subgrade soils
Movement of unbound fines in flexible pavement base and sub-base layers
Pumping of fines and durability cracking in rigid pavements
Frost-heave and thaw weakening
Stripping of asphalt in flexible pavements
In a recently performed accelerated load test, Erlingsson (2009) used a Heavy
Vehicle Simulator (HVS) to show that the rate of rutting increased in all layers of a
flexible construction when the groundwater table was raised. On the positive side,
ensuring proper (optimal) water content greatly improves packing of the road during
construction, and may also increase its resilience when trafficked, even though this
effect is often neglected. In conclusion, initially maintaining adequate water contents
in granular road materials is beneficial but if the water content increases with time,
negative effects will most likely emerge. It is generally desired to keep the road as
close to or less than optimum water content as possible over time. As stated by many
experts: „Water and road construction do not make for a harmonious couple!‟ From
this, it can be seen that there is a very serious effect of poor drainage on the condition
of roads.
Figure 2.2 to 2.10 show some examples of pavement deterioration caused by bad
drainage.
7
Figure 2.1 : Some measures to prevent the penetration of contaminants to the groundwater and environment (a) in nuclear power plants
(b) in sanitary landfills.

8
Figure 2.2 : Road under water near Punawale village – India.
Figure 2.3 : Cuts in road due to water.

9
Figure 2.4 : Stripping of bitumen.
Figure 2.5 : Cuts in road due to water.

10
Figure 2.6 : Expulsion of water from road.
Figure 2.7 : Formation of waves and corrugations.

11
Figure 2.8 : Formation of potholes due to poor drainage.
Figure 2.9 : Expulsion of water due to capillary action.

12
Figure 2.10 : Formation of potholes due settlement of sub-grade.
Every year, governments have to spend millions of dollars in reparation of pavement,
which are damaged in relation with poor drainage. To be able to cope with the
problems related to the drainage, it is very prudent for constructors to design and
establish proper and adequate drainage systems both for surface and sub-surface
water. Of course, dewatering the surface water may be simpler than that of sub
surface water with regard to the fact that damages related to the sub-surface moisture
may occur abruptly and without prior clue. Groundwater escalation or upward
movement of groundwater by capillary action can be the main reasons of serious
pavement problems. To cope with this problem, this study plans to evaluate the
ability of BAZ and BAS drainage blankets to avoid water‟s upward penetration to the
pavement.
2.3 General Approach to the Materials Used in the Study
2.3.1 Bentonite
The term “bentonite”, is used to describe a clay material whose major mineralogical
component is formed by the smectite group and whose physical properties are

13
characterized by the smectite minerals (Grim, 1968). The absorbent clay was given
the name bentonite in 1898, after the Cretaceous Benton Shale near Rock River,
Wyoming. Other modern discoveries include montmorillonite discovered in 1847 in
Montmorillon in the Vienne prefecture of France, in Poitou-Charentes, South of the
Loire Valley. Although the major constituent of bentonite is montmorillonite, minor
amount of feldspar, quartz, mica and gypsum may also be present in bentonite. There
are different types of bentonite, each named after the respective dominant element,
such as potassium (K), sodium (Na), calcium (Ca), and aluminium (Al). Experts
debate a number of nomenclatorial problems with the classification of bentonite
clays. Bentonite usually forms from weathering of volcanic ash, most often in the
presence of water. However, the term bentonite, as well as a similar clay called
tonstein, has been used for clay beds of uncertain origin. Montmorillonite is
composed of two basic types of sheets such as octahedral and tetrahedral sheets. The
octahedral sheet is sandwiched between two tetrahedral sheets leading the formation
of 2:1 layer. Consequently, montmorillonite is called as 2:1 layer silicate. Layers
may be separated from one another by various interlayer cations such as Ca and Na.
Crystal structure of montmorillonite can be seen in figure 2.11.
Figure 2.11 : Crystal structure of montmorillonite bentonite indicating Na cations
and interlayer water molecules (Fuenkajorn and Daemen, 1996).
Na bentonite is well known for some of its unique features such as a large surface
area, ion exchange capacity, high water absorption and expansion. The range for
specific gravity of Na bentonite is 2.5 to 2.8. The rate of water absorption of Na
bentonite is at least five times of its weight and in the case of full saturation with
14
water it can reach a size nearly 12-15 times of its original dry size. Hydraulic
conductivity values of Na bentonite ranges from 1x10⁻⁹ to 1x10-11 m/s (Fuenkajorn
and Daemen, 1996).
Densely compacted bentonite can have a swelling pressure up to 20 MPa when
permeated by water (IAEA, 1990).
Considering all above-mentioned characteristics of Na bentonite, it has been widely
used as landfill liners.
It is worth saying that Turkey is one of the biggest owners of bentonite in the world.
Figure 2.12 : Bentonite in Turkey.
2.3.2 Zeolite
Zeolites are microporous, aluminosilicate minerals commonly used as commercial
adsorbents. The term zeolite was originally coined in 1756 by Swedish mineralogist
Axel Fredrik Cronstedt, who observed that upon rapidly heating the material stilbite,
it produced large amounts of steam from water that had been adsorbed by the
material. Based on this, he called the material zeolite, from the Greek ζέω (zéo ̱ ),
meaning "to boil" and λίθος (líthos), meaning "stone".
Approximately, 194 unique frameworks for zeolites have been identified and over 40
naturally occurring zeolite frameworks are known. Figure 2.13 illustrates the
microporous structure of the Zeolites.
Zeolites have a porous structure that can accommodate a wide variety of cations,
such as Na+, K+, Ca2+, Mg2+ and others. These positive ions are rather loosely held

15
and can readily be exchanged for others in a contact solution. Some of the more
common mineral zeolites are analcime, chabazite, clinoptilolite, heulandite, natrolite,
phillipsite, and stilbite.
Figure 2.13 : The microporous molecular structure of a zeolite.
Natural zeolites form where volcanic rocks and ash layers react with alkaline
groundwater. Zeolites also crystallize in post-depositional environments over periods
ranging from thousands to millions of years in shallow marine basins. Naturally
occurring zeolites are rarely pure and are contaminated to varying degrees by other
minerals, metals, quartz, or other zeolites. For this reason, naturally occurring
zeolites are excluded from many important commercial applications where
uniformity and purity are essential.
Zeolites are used in a variety of fields such as:
Commercial and domestic
Petrochemical industry
Nuclear industry
Heating and refrigeration
Detergents
Construction
Gemstones
Vacuum pumping
Medical
Use as nutritional supplements
Agriculture
16
Animal husbandry
Domestic pet care
Aquarium keeping
Cat litter
2.4 Various Characteristics of Bentonite-Amended Sand
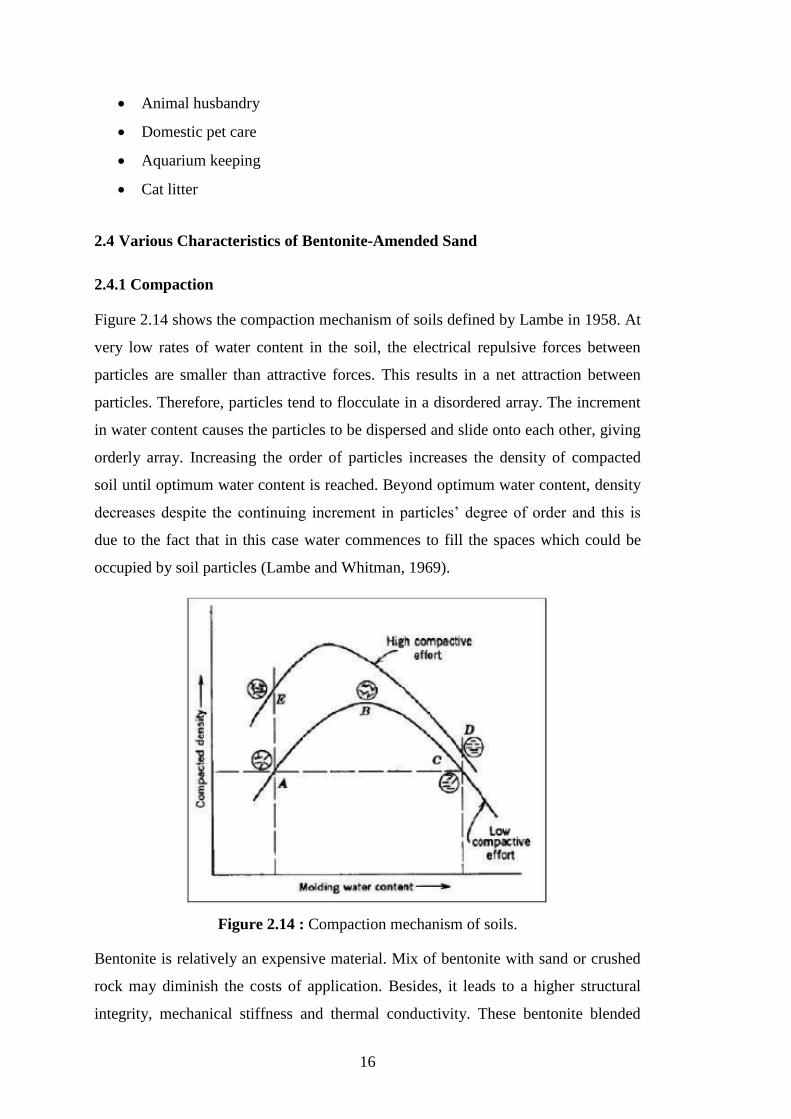
2.4.1 Compaction
Figure 2.14 shows the compaction mechanism of soils defined by Lambe in 1958. At
very low rates of water content in the soil, the electrical repulsive forces between
particles are smaller than attractive forces. This results in a net attraction between
particles. Therefore, particles tend to flocculate in a disordered array. The increment
in water content causes the particles to be dispersed and slide onto each other, giving
orderly array. Increasing the order of particles increases the density of compacted
soil until optimum water content is reached. Beyond optimum water content, density
decreases despite the continuing increment in particles‟ degree of order and this is
due to the fact that in this case water commences to fill the spaces which could be
occupied by soil particles (Lambe and Whitman, 1969).
Figure 2.14 : Compaction mechanism of soils.
Bentonite is relatively an expensive material. Mix of bentonite with sand or crushed
rock may diminish the costs of application. Besides, it leads to a higher structural
integrity, mechanical stiffness and thermal conductivity. These bentonite blended

17
mixtures with proper ratio of bentonite can be used as an excellent engineered barrier
that is stable and have low hydraulic conductivities (Tien et al., 2004). In such a
mixture, bentonite which is found within the voids of sand particles, hydrates and
swells in the presence of water. This swelling bentonite can fill up the voids within
the mixture and by applying stress on the sand particles they act as a minor structural
component in bentonite-sand mixtures (Kenney et al., 1992). It is a well-established
fact that the higher maximum dry density of mixture, the lower total porosity and the
lower bentonite content needed to fill the voids within the bentonite-soil mixture.
In addition, degree of saturation between 70% and 90% is responsible for the
maximum dry density values, with regard to the test results of modified proctor
compaction test. The maximum dry density ranges between 1.7 to 2 Mg/m3
and
optimum water content between 10% and 16%. Compaction test results also
indicated that the increase of the bentonite content caused an increase in maximum
dry density values (Chapius, 2002).
Kenney et al. (1992) have performed standard compaction tests on 4%, 8%, 12%
16%, and 22% bentonite–sand mixtures. Their study took into consideration the use
of the freshwater, so all the compaction tests were performed with freshwater.
Maximum dry density values were found to be in the range of 1.70-1.85 Mg/m3
corresponding to 12%-15% optimum water content values for different
bentonite/sand (B/S) mixtures. They found that increase of bentonite content caused
increased values of maximum dry density and beyond an optimum B/S ratio, which
in this case equals to 20%, maximum dry density decreased.
According to Kenney et al. (1992), the reason for this may be that as the bentonite is
added, sand particles are increasingly supported by bentonite. When the B/S ratio is
small, the sand is the primary load-bearing constituent of the mixture. The structural
component role of sand is shared with bentonite as B/S is increased.
Komine and Ogata (1999) have performed standard compaction tests on 5%, 10%,
20%, 30%, and 50% of bentonite–sand mixtures. Similar results have been observed
in this study. Maximum dry density values were found to be in the range of 1.61-1.72
Mg/m3 corresponding to 14.6%-19.4% optimum water content values for different
B/S mixtures. As the bentonite content is increased, the achievable maximum dry
density is increased up to an optimum value of 30%. However, beyond 30% B/S

18
ratio, the maximum dry density decreases regardless of the increase in the bentonite
content.
Tashiro et al. (1998) have performed standard compaction tests on 10%, 20% and
30% bentonite-sand mixtures to determine the relationship between dry density and
permeability. Maximum dry densities of the 10%, 20% and 30% bentonite-sand
mixtures were found to be in the range of 1.67-1.91 g/cm3, 1.76-1.92 g/cm
3 and 1.79-
1.98 g/cm3, respectively. It is also clear in this study that the addition of bentonite
increases the maximum dry density up to B/S contents of 30%.
2.4.2 Hydraulic conductivity
One of the most important parameters in the design of drainage blankets is the
hydraulic conductivity of the materials. Their hydraulic properties should be
investigated through laboratory tests and hydraulic conductivity values should be
assessed quantitatively. Since the mixture has not been used as a drainage blanket,
there is no definite value for its hydraulic conductivity. However, as landfill liners
the hydraulic conductivity of the mixture should not exceed 1x10⁻⁹
m/s (USEPA,
1993; Swedish EPA, 2000). However, since the waste disposal facilities for
radioactive wastes are critical structures and their design requires much more
attention, it is advisable to design isolation materials such that they should have
much lower hydraulic conductivities. According to Westsik et al. (1981) and
Radhakrishna et al. (1989); compacted bentonite-sand mixtures providing hydraulic
conductivities lower than 1x10-11
m/s have been proposed for the isolation of
radioactive waste materials.
Mixing and compaction characteristics have a great importance in determination of
hydraulic conductivities. A complete mixing of bentonite and sand material is
important for reducing the variations in hydraulic conductivity. Also, bentonite-sand
mixtures should be compacted at wet side of about 2% above of optimum water
content for reducing the hydraulic conductivity values (Haug and Wong, 1992).
Mitchell et al. (1965) performed hydraulic conductivity tests on compacted clays
and found that specimens compacted at wet side of optimum may have hydraulic
conductivity values two or three orders of magnitude less than specimens compacted
at dry side of optimum. Similar results have been found by others (Acar and Oliveri,
1989; Benson and Daniel, 1990; Met et al., 2005). In a proctor test, compaction wet

19
of optimum means that the degree of saturation has been reached to a degree of about
90%. It indicates that some air is trapped in the compacted specimen and cannot be
released since compacted specimen becomes impervious. This leads to the formation
of interlocking of particles (Chapuis, 2002). According to him, the hydraulic
conductivity of saturated mix is a decreasing function of bentonite content. When the
B/S ratio is equal to zero, i.e. all the mixture is composed of sand, then the hydraulic
conductivity is that of sand alone. When B/S ratio is greater than 15%, the hydraulic
conductivity is close to that of bentonite alone. However, when B/S ratio is less than
5%, bentonite is washed away by seepage forces and an internal erosion problem is
expected to occur.
Kenney et al. (1992) investigated the influence of B/S ratio and compaction water
content. Mixtures prepared with B/S values of 4%, 8%, 12%, 16%, and 22 % were
compacted with water content values of 7%, 12%, 17% and 22% respectively.
Hydraulic conductivity values were found to be in the range of 2.1x10⁻¹⁰
to 6.8x10⁻¹¹
m/s. It was found in this study that hydraulic conductivity of mixtures at a particular
value of B/S was influenced by compaction water contents, especially when the
water contents were less than the optimum water contents. This may be due to the
reason that when mixtures were compacted at water contents less than the optimum
value, bentonite particles were aggregated into clusters that limited a uniform
distribution of bentonite. When these mixtures were compacted at water content
above the optimum value, bentonite aggregates were blended more readily with the
sand material. Therefore, they give smaller values of hydraulic conductivities.
Chapuis (1990) performed hydraulic conductivity tests on various mixtures
possessing bentonite/sand values in the range of 2% to 33.3% and determined the
hydraulic conductivity values of these mixtures to be in the range of 2.0x10⁻⁷
to
4.9x10⁻¹¹
m/s. It was concluded in this study that as the B/S ratio increases the
hydraulic conductivity value decreases.
Komine (2004) performed hydraulic conductivity tests on compacted bentonite-sand
mixtures possessing 5%-50% bentonite content. Experimental results showed that
hydraulic conductivity values were in the range of 2.66x10⁻¹⁰
to 4.85x10⁻¹²
m/s for 5-
20% bentonite content and they were in the range of 6.87x10⁻¹²
to 1.21x10⁻¹²
m/s for
30-50%. This study showed that when the bentonite content increased the hydraulic
conductivity decreased.

20
Kaoser et al. (2006) have measured the hydraulic conductivities of 5% and 10%
bentonite-sand mixtures. According to this study; the hydraulic conductivity of
bentonite-sand mixtures decreased with increased bentonite content. In addition,
hydraulic conductivities of bentonite-sand mixtures were lower for specimens
compacted at the wet side of the optimum water content as compared to specimens
compacted at the dry of optimum moisture content.
Tashiro et al. (1998) have performed hydraulic conductivity measurements on 10%,
20% and 30% compacted bentonite-sand mixtures. Hydraulic conductivity values of
these mixtures were determined to be in the range of 1.2x10⁻¹²
m/s to 3.8x10⁻¹⁰
m/s
for 10% bentonite content; in the range of 9.2x10⁻¹³
m/s to 1.2x10⁻¹¹
m/s for 20%
bentonite content; and in the range of 8.2x10⁻¹³
m/s to 4.2x10⁻¹²
m/s for 30%
bentonite content.
Kaya et al. (2006) have measured the hydraulic conductivity of 30% bentonite-sand
mixture with one-dimensional consolidation permeameter. For this particular
bentonite-sand mixture, the hydraulic conductivity has been measured as 4.81x10⁻¹¹
m/s.
2.4.3 Swelling characteristics of bentonite-sand mixtures
Compacted bentonite-sand mixtures are currently considered to be a suitable barrier
for the isolation of waste from the surrounding media. In several designs developed
by nuclear waste agencies in Europe, Japan and North America waste containers are
placed in a deep gallery or vertical shaft. The annular space between the metallic
container and the host rock is then filled with swelling clay. Most of the designs
assume that the groundwater will finally saturate the clay barrier. Therefore, the
designed barrier will isolate the waste by absorbing nuclear radionuclide and prevent
water inflow. Bentonite-sand mixtures are receiving greater attention as buffer and
backfill material for repository design of high level nuclear wastes. The swelling
characteristic of bentonite-sand mixtures is believed to fill up the annular space
between waste and host rock and to make an impermeable zone around waste
containers. This role is called “self-sealing”. Figure 2.15 shows the image of self-
sealing (Komine, 2004).
An important effect of the swelling capacity of bentonite is its ability to expand and
completely fill up openings and to create a tight contact with host rock in the
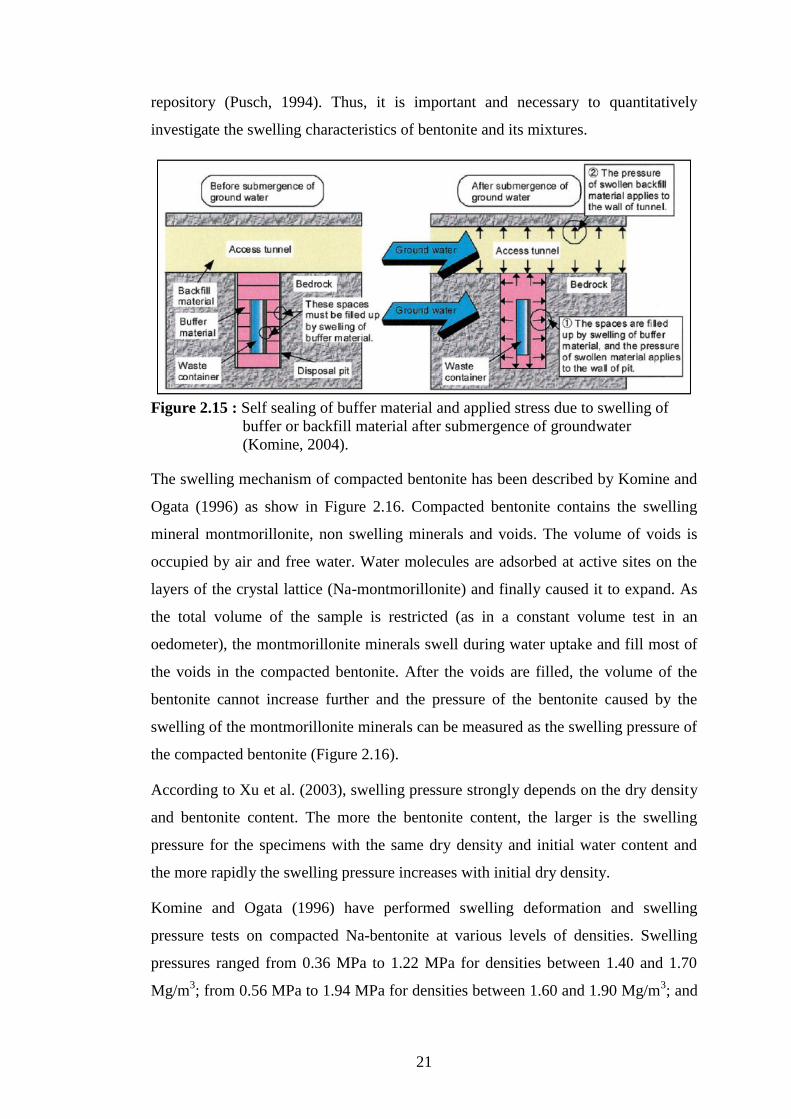
21
repository (Pusch, 1994). Thus, it is important and necessary to quantitatively
investigate the swelling characteristics of bentonite and its mixtures.
Figure 2.15 : Self sealing of buffer material and applied stress due to swelling of
buffer or backfill material after submergence of groundwater
(Komine, 2004).
The swelling mechanism of compacted bentonite has been described by Komine and
Ogata (1996) as show in Figure 2.16. Compacted bentonite contains the swelling
mineral montmorillonite, non swelling minerals and voids. The volume of voids is
occupied by air and free water. Water molecules are adsorbed at active sites on the
layers of the crystal lattice (Na-montmorillonite) and finally caused it to expand. As
the total volume of the sample is restricted (as in a constant volume test in an
oedometer), the montmorillonite minerals swell during water uptake and fill most of
the voids in the compacted bentonite. After the voids are filled, the volume of the
bentonite cannot increase further and the pressure of the bentonite caused by the
swelling of the montmorillonite minerals can be measured as the swelling pressure of
the compacted bentonite (Figure 2.16).
According to Xu et al. (2003), swelling pressure strongly depends on the dry density
and bentonite content. The more the bentonite content, the larger is the swelling
pressure for the specimens with the same dry density and initial water content and
the more rapidly the swelling pressure increases with initial dry density.
Komine and Ogata (1996) have performed swelling deformation and swelling
pressure tests on compacted Na-bentonite at various levels of densities. Swelling
pressures ranged from 0.36 MPa to 1.22 MPa for densities between 1.40 and 1.70
Mg/m3; from 0.56 MPa to 1.94 MPa for densities between 1.60 and 1.90 Mg/m
3; and

22
from 0.98 MPa to 2.29 MPa for densities between 1.80 and 2.00 Mg/m3. They have
measured the swelling pressures of 5%, 10%, 20%, 30%, and 50% compacted
bentonite-sand mixtures. They have also measured the vertical swelling pressures of
the bentonite-sand mixtures absorbing distilled water on the condition that the
volume of the specimen was constant. Swelling pressures have been found for 5%
mixtures to be between 21.3 and 36.4 kPa; for 10% mixtures to be between 31.3 and
42.9 kPa; for 20% mixtures to be between 55.6 and 111.6 kPa, for 30% mixtures as
between 99.7 and 179.7 kPa; and for 50% mixtures as between 166.5 and 280.4 kPa.
The test results are summarized in Table 2.1.
Figure 2.16 : Image of process of swelling pressure test with swelling deformation
restricted (Komine, 2004).
Nilsson (1985) has found the swelling pressures of 10% bentonite-sand mixtures in
the range of 0.02 to 0.15 MPa and of 15% bentonite–sand mixtures in the range of
0.015 to 0.13 MPa. Yanıkömeroglu (1990) performed swelling pressure tests on
25%, 30% and 40% compacted bentonite-sand mixtures. A conventional oedometer
was used for the determination of swelling pressures. Swelling pressures were
determined by applying incremental loads to prevent vertical deformation in
accordance with Method C outlined in the ASTM D4546 Standard. Swelling

23
pressures increased with increased bentonite content. The results of this study are
summarized in Table 2.2.
Table 2.1 : Experimental conditions and results of swelling pressure tests (Komine
and Ogata, 1999).
Bentonite content
(%)
Initial dry
density
(Mg/m3)
Initial water
content (%)
Maximum
swelling
pressure (kPa)
Water content
after
experiment
(%)
5 1.43-1.47
1.63-1.67
18.9-19.4
19.3-19.6
21.3-31.5
24.4-36.4
30.4-32
24.1-24.8
10
1.48-1.50
1.66-1.69
1.58-1.66
1.71-1.75
17.2-17.6
17.3-17.8
17.4-17.6
17.3-17.7
31.3-36.1
31.6-38.5
36.6-41.6
40.7-42.9
30.7-31.0
26.7-27.5
28.3-30.6
25.9-27.8
15 1.60-1.61
1.75-1.79
16.7-17.4
16.7-17.3
34.0-35.6
93.4-111.6
34-35.6
27.8-29.2
20 1.60-1.63
1.76-1.77
14.3-15.1
14.3-14.8
99.7-145.2
141.9-179.7
32.9-41.7
28.7-36.6
25 1.58-1.62
1.71-1.74
17.6
18
166.5-204.7
253.9-280.4
47.6-53
37.8-43.4
Table 2.2 : Results of swelling pressure tests (Yanıkömeroglu, 1990).
Bentonite (%) Sand (%) ωi (%) γdry(ton/m3) Swell pressure
(kPa)
25 75 39 1.4 17.75
30 70 35.5 1.5 18.14
30
30
40
70
70
60
30.5
30.5
11.0
1.6
1.6
1.7
17.65
30.69
545.27
2.4.4 Mechanical properties
Compacted bentonite-sand mixtures that may be utilized as seal materials in
underground waste repositories should act as structural components to support the
walls of shafts and tunnels. Loads due to water columns, drilling mud, gas or backfill
may exert pressure on the seal materials. These axial loads may cause shear stresses
in the seal material and lead to the formation of cracks, and therefore, cause an
increase in hydraulic conductivity of isolation material. In an extreme case, this
isolation material may dislodge form its place (Akgün and Daemen 1999). Therefore,
it is vitally important to assess the mechanical properties of compacted bentonite-
sand mixtures.

24
Bentonite is a highly cohesive material and has smaller values of internal friction
angle like 6°-9° (Di Maio and Fenelli, 1994). Gleason et al. (1997) have performed
consolidated drained (CD) direct shear tests on Na and Ca bentonite to determine
their shear strength characteristics. Cohesion and internal friction angle were
determined as 5.8 kPa and 21°, respectively, for Ca-bentonite and as 6.0 kPa and 12°
for Na-bentonite. Akgün et al. (2006) have performed direct shear test on 20%
compacted bentonite-sand mixture to determine the shear strength parameters of that
particular mixture. Cohesion and internal friction angle were measured as 90 kPa and
16.3°, respectively.
The Young‟s modulus of bentonite should be considered lower than that of
bentonite-sand mixture. Highly compacted and relatively dry bentonite posses a
Young‟s modulus up to 300 MPa. These values decrease with the uptake of water
(Meyer and Howard, 1983). Radhakrishna and Chan (1982) studied the strength and
deformation characteristics of 50% bentonite-crushed granite or sand material. The
Young‟s modulus of 50% bentonite-crushed granite or sand mixtures, which are in
compacted state, were found to be in the range of 21.6 to 154 MPa.
Meyer and Howard (1983) reported the Poisson‟s ratio as 0.15 for highly compacted
and relatively dry bentonite. According to Dunn et al. (1980) the Poisson‟s ratio
should be about 0.375 for soft clays. Daemen and Ran (1996) have stated that
saturated bentonites are extremely plastic and the Poisson‟s ratio should be taken as
larger values such as 0.4 or even 0.45.
2.5 Various Characteristics of Bentonie-Amended Zeolite
2.5.1 Compaction
The basic concepts are the same with part 2.4.1 of this study.
Kaya and Durukan (2004) reported that with increasing bentonite content in
bentonite-zeolite mixture, optimum water content increases, while the dry unit
weight decreases. Figure 2.17 shows the result of their research. However, increases
in bentonite content do not result in high variations, neither in dry unit weights nor
optimum moisture contents. For example, when the bentonite content is 3%, the dry
unit weight of the compacted mixture is 1.29 Mg m-3
and the optimum moisture

25
content is 33%; and when the bentonite content is 20%, then the dry unit weight is
1.23 Mg m- 3
and the optimum moisture content is 37%.
Figure 2.17 : Compaction characteristics of natural zeolite and BAZ (Kaya, 2004).
Kayabali (1997) conducted compaction tests on bentonite-zeolite with different ratios
of bentonite. The chosen B/Z ratios were 0.05, 0.1, 0.15, 0.2, 0.26, 0.33, and 0.4. The
results of Kayabali‟s tests are shown in Figure 2.18.
It can be observed that as the B/Z ratio increases, the maximum dry density
increases, whereas the optimum water content decreases.
Figure 2.19 shows the opposite aspects of a same mixture, observed by Kayabali
(1997) and Kaya and Durukan (2004).

26
Figure 2.18 : Results of compaction test on different B/Z ratios (Kayabali, 1997).

27
Figure 2.19 : Comparison of optimum moisture content changes with bentonite
content in BAZ.
2.5.2 Hydraulic conductivity
Table 2.3 depicts the observations of Kaya and Durukan (2004) on hydraulic
conductivity of 20% bentonite-zeolite.
Table 2.3 : Hydraulic conductivity values of 20% BAZ with varying initial seating
pressures (Kaya, 2004).
Pressure (kPa) 6.9 24.5 49 98 196
Kinitial (m/s) 1.4E-8 2.3E-8 2.9E-8 1.3E-8 1.1E-8
Kfinal (m/s) 4.3E-9 5.3E-9 5.6E-9 4.7E-9 7.3E-9
Kinitial/Kfinal 3.2 4.2 5.2 2.8 1.5
Figure 2.20 illustrates the results of hydraulic conductivity test conducted by
Kayabali (1997).

28
Figure 2.20 : Hydraulic conductivity for various B/Z at optimum water content
(Kayabali, 1997)

29
3. LABORATORY TESTING PROGRAM
3.1 Introduction
In order to develop an ideal drainage blanket to be used in highways, compacted
bentonite-amended zeolite and bentonite-amended sand mixtures are planned to be
investigated through several laboratory tests. It is also aimed to assess the
hydrological and mechanical properties of such mixtures. Laboratory testing program
includes sieve analysis, specific gravity tests, standard compaction tests including
standard proctor and vibrating hammer, hydraulic conductivity tests. Inasmuch as we
want to form a drainage blanket, which is a layer between sub-grade and sub-base
layers, the mentioned system is not exposed to heavy loads and the load bearing
capacity of this layer may be negligible. As a matter of this fact, strength tests are not
planned to be included. By referring to the studies of some other scientists and with
regard to the results of their unconfined compression strength tests and direct simple
shear tests; one can conclude that there will be no resistive problem.
Additionally, while performing tests, there was a shortage of zeolite. To cope with
this problem, the material had to be reused. On the other hand, the reliability of this
matter was not clear. To solve this problem, sieve analysis was conducted on zeolite
before compaction and after being compacted in standard proctor test‟s mold and the
aggregation diagrams of both cases were extracted and compared with each other to
evaluate the susceptibility of zeolite to crushing.
3.1.1 Bentonite
Bentonite is a rock name as a geological and petrographical term and physical-
chemically it has great ability to absorb water and swell. Bentonites are composed of
smectite-group clay minerals, generally type of montmorillonite and generally
formed from altered volcanic ashes and their origin is related to the sedimentation of
volcanic ashes in lakes, lagoons and shallow sea areas and also transformation from
glassy matter of pyroclastics during burial diagenesis. Their names depend on the
dominant elements, such as Na, Ca, and K and there are mainly two types of
30
bentonite: Na- bentonite (swelling type) and Ca-bentonite (non-swelling type).
Turkey has rich in bentonite deposits; most of them are Ca-bentonite in character
(Edirne, Kırklareli, Istanbul, Çanakkale, Balıkesir, Bursa, Bilecik, Eskişehir, İzmir,
Manisa, Konya, Ordu, Giresun) and Na- and Na/Ca-bentonite (drilling bentonite)
was reported from Çankırı, Ankara and Tokat regions.
The bentonite samples of this study are obtained from Lalapaşa (Edirne) (sample: B-
1), and Reşadiye (Tokat) (sample: B-2) regions. Material characterization was
conducted by binocular and optical microscope and X-ray diffraction (XRD)
methods.
The bentonite samples, B-1 and B-2, used in this study are from Lalapaşa region
(Edirne, NW Turkey) known as Ca-type and from Reşadiye region (Tokat, Middle
Turkey) known as Na- and/or Na/Ca-type (Yeniyol, 1987; Türkmenoğlu et al., 1987;
Akbulut, 1995; 1996; Çoban, 1997; İpekoğlu et al., 1997; Erdoğan, 2006; Kadir,
2007; Arslan et al., 2010; Çelik-Karakaya, 2011), respectively. The sample, B-1 is
from bentonite levels in rhyodacitic-rhyolithic tuffaceous rocks related with a
limestone unit in lateral and vertical section of Eocene-Oligocene age (Esenli, 2011).
It is white and whitish beige in color. The bentonite sample, B-2, is related with the
bentonite occurrence within the Upper Cretaceous pyroclastic rocks characterized by
andesitic-rhyodacitic, mainly dacitic tuffs (Akbulut, 1996). Yellowish green,
greenish grey and beige bentonite levels intercalated with tuffs and clayey limestone
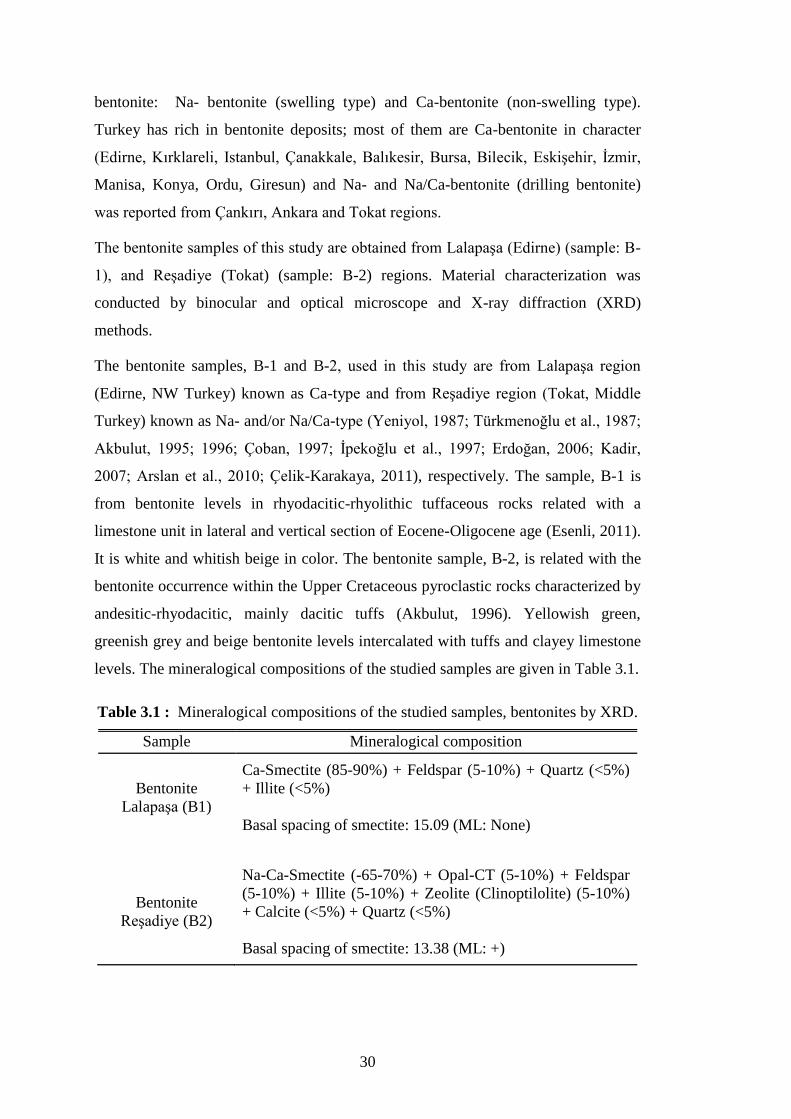
levels. The mineralogical compositions of the studied samples are given in Table 3.1.
Table 3.1 : Mineralogical compositions of the studied samples, bentonites by XRD.
Sample Mineralogical composition
Bentonite
Lalapaşa (B1)
Ca-Smectite (85-90%) + Feldspar (5-10%) + Quartz (<5%)
+ Illite (<5%)
Basal spacing of smectite: 15.09 (ML: None)
Bentonite
Reşadiye (B2)
Na-Ca-Smectite (-65-70%) + Opal-CT (5-10%) + Feldspar
(5-10%) + Illite (5-10%) + Zeolite (Clinoptilolite) (5-10%)
+ Calcite (<5%) + Quartz (<5%)
Basal spacing of smectite: 13.38 (ML: +)

31
3.1.2 Zeolite
The pyroclastic rocks have extensive zeolite reserves in nature due to their high
volcanic glass contents and porosity. Clinoptilolite is the most common natural
zeolite mineral and its low costs make clinoptilolite-rich tuffs commercially
attractive. Ion-exchange property is caused by open tectosilicate frameworks of
zeolites. Clinoptilolite, [(Ca, Na, K)6 (Al6 Si30 O72).24H2O], exhibit better
properties than the other zeolite and clay minerals. The removal of heavy metals,
ammonium and radio nuclei from aquatic environments, municipal and nuclear waste
waters is a good example for the ion-exchange property of zeolites (Barrer &
Townsend, 1976; Blanchard et al., 1984; Mumpton, 1988). The zeolite samples od
this study were collected from the Miocene aged pyroclastic units in Bigadiç
(Balıkesir) (sample: Z-3) and Gördes (Manisa) (samples: Z-1 and Z-2) regions.
These have high contents (>85%) of clinoptilolite and less amounts of some other
minerals.
The zeolite samples used in this study were collected from Bigadiç and Gördes
regions. In Bigadiç region, Neogene aged volcanic-sedimentary sequence has a
thickness of about 1000m (Gündoğdu, 1982). From the bottom to the top,
stratigraphically, there are volcanics, limestone, tuffs (lower tuff unit / rhyolithic
crystal tuffs / Değirmenli tuff unit), a lacustrine unit with borate, including claystone,
clayey limestone, limestone and sandstone (lower unit with borate), tuffs (upper tuff
unit / glassy tuffs / Emirler tuff unit) and upper borate unit (claystone, clayey
limestone, limestone, tuff and borate) (Gündoğdu, 1982). Upper tuff unit contains
high amounts of zeolite-clinoptilolite. The unit is coarse-grained at the bottom and
fine-grained at the top. Quartz, K-feldspar, plagioclase, biotite and rarely lithic and
pumice fragments are the other elements of the rock. Glassy matrix has widely
altered to the zeolites (clinoptilolites), which have morphologically monocline
prismatic plate shape. Miocene units disconformably overlies on the basement rocks
in the Gördes region. The fluviatile units which consist of mainly conglomerates and
sandstones are conformably overlain by lacustrine units including sandstone, clayey-
sandy limestone, limestone, mudstones, shales and two vitric tuff horizons; 80 and
70m in thickness. Vitric tuffs of rhyolitic and rhyodacitic composition are beige,
white and greenish in colors. The phenocrysts (2-8 %) are quartz, alkali feldspar,
plagioclase and biotite. Volcanic glassy material of the rock has transformed to

32
zeolite minerals. . The mineralogical compositions of the studied samples are given
in Table 3.2.
Table 3.2 : Mineralogical compositions of the studied samples, Zeolites by XRD.
Sample Mineralogical composition
Zeolite Gördes
RTA (Z1)
Zeolite Gördes
ENL (Z2)
Zeolite Bigadiç
BGD (Z3)
Clinoptilolite (70-75%) + Opal-CT/A (10-15%) + Feldspar
(5-10%) + Quartz (<5%) + Smectite (<5%) + Mica-Illite
(<5%)
Clinoptilolite (75-80%) + Feldspar (5-10%) + Smectite (5-
10%) + Opal-CT/A (<5%) + Mica-Illite (<5%) + Quartz
(<2%)
Clinoptilolite (75-80%) + Quartz (10-15%) + Smectite
(<5%) + Mica-Illite (<5%) + Feldspar (<5%)
3.1.3 Sand
Sand material has been widely used as a base material in various studies. It is the
most preferred material since it is locally available almost anywhere. Actually, the
cost of bentonite has the primary importance in designing of bentonite-sand mixtures
and bentonite-zeolite mixtures, since the cost of bentonite is high.
The aim is to reduce the cost of these mixtures. Therefore, sand can be a good
alternative to other soil mixes and cheap solution when they are used in the design of
bentonite-sand and bentonite-zeolite mixtures. Keeping all these in mind, it was
decided to use clean, uniform fine to medium sand.
3.2 Tests on Bentonite
3.2.1 Specific gravity
Specific gravity of bentonites was determined according to ASTM D854-02. Specific
gravity of Lalapasa bentonite (B1) and Resadiye bentonite (B2) was determined as
2.52 and 2.75, respectively.
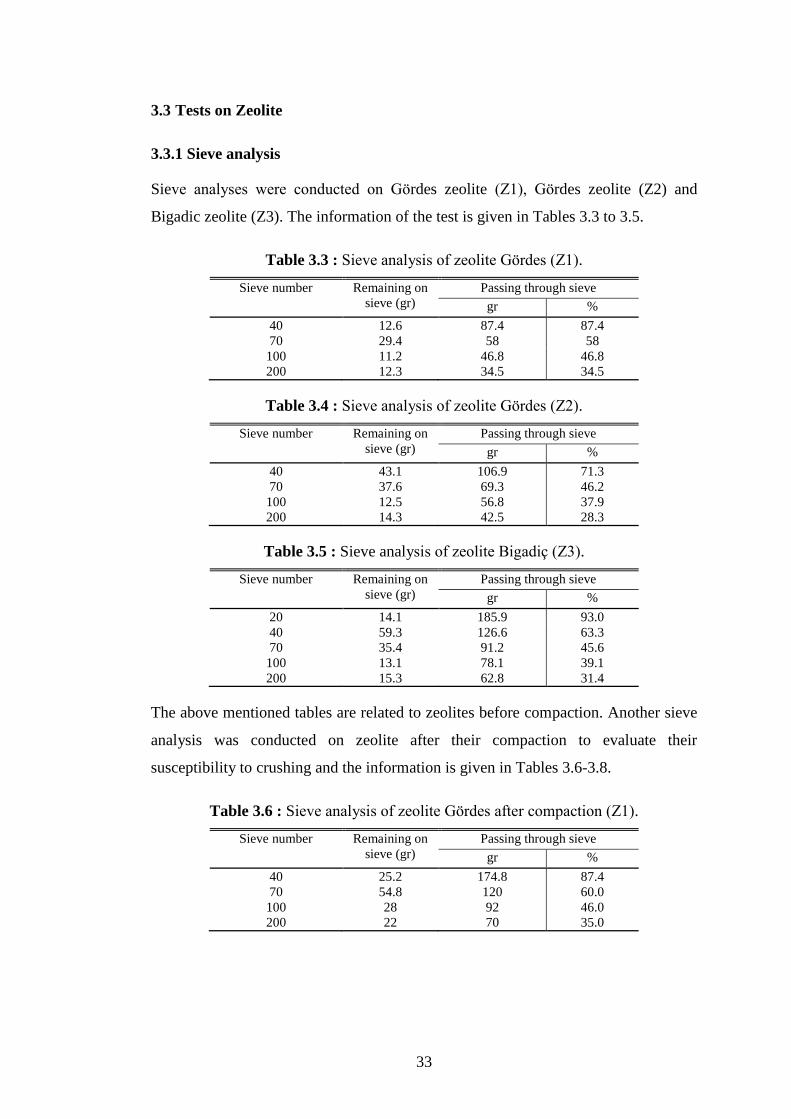
33
3.3 Tests on Zeolite
3.3.1 Sieve analysis
Sieve analyses were conducted on Gördes zeolite (Z1), Gördes zeolite (Z2) and
Bigadic zeolite (Z3). The information of the test is given in Tables 3.3 to 3.5.
Table 3.3 : Sieve analysis of zeolite Gördes (Z1).
Sieve number Remaining on
sieve (gr)
Passing through sieve
gr %
40 12.6 87.4 87.4
70 29.4 58 58
100
200
11.2
12.3
46.8
34.5
46.8
34.5
Table 3.4 : Sieve analysis of zeolite Gördes (Z2).
Sieve number Remaining on
sieve (gr)
Passing through sieve
gr %
40 43.1 106.9 71.3
70 37.6 69.3 46.2
100
200
12.5
14.3
56.8
42.5
37.9
28.3
Table 3.5 : Sieve analysis of zeolite Bigadiç (Z3).
Sieve number Remaining on
sieve (gr)
Passing through sieve
gr %
20 14.1 185.9 93.0
40 59.3 126.6 63.3
70 35.4 91.2 45.6
100
200
13.1
15.3
78.1
62.8
39.1
31.4
The above mentioned tables are related to zeolites before compaction. Another sieve
analysis was conducted on zeolite after their compaction to evaluate their
susceptibility to crushing and the information is given in Tables 3.6-3.8.
Table 3.6 : Sieve analysis of zeolite Gördes after compaction (Z1).
Sieve number Remaining on
sieve (gr)
Passing through sieve
gr %
40 25.2 174.8 87.4
70 54.8 120 60.0
100
200
28
22
92
70
46.0
35.0

34
Table 3.7 : Sieve analysis of zeolite Gördes after compaction (Z2).
Sieve number Remaining on
sieve (gr)
Passing through sieve
Gr %
40 63.1 176.9 73.7
70 56.9 120 50.0
100
200
24
16.8
96
79.2
40
33.1
Table 3.8 : Sieve analysis of zeolite Bigadiç after compaction (Z3).
Sieve number Remaining on
sieve (gr)
Passing through sieve
Gr %
20 4.9 245.1 98.1
40 80.6 164.5 65.8
70 56.5 108 43.2
100
200
20.7
18.6
87.3
68.7
34.9
27.5
Comparisons of sieve analyses are shown in Figures 3.1 to 3.3. As it is observable
from figures, there is no harsh difference in granular sizes of materials and
consequently, one can come to the conclusion that reusing the zeolites can be done
without remarkable and serious effects on tests.
Figure 3.1 : Comparison of zeolite 1 Gördes before and after compaction.

35
Figure 3.2 : Comparison of zeolite 2 Gördes before and after compaction.
Figure 3.3 : Comparison of zeolite 3 Bigadiç before and after compaction
3.3.2 Specific gravity
Specific gravity of zeolites was determined according to ASTM D854-02. Specific
gravity of Zeolite Gördes 1, Zeolite Gördes 2 and Zeolite Bigadiç (Z3) was
determined as 2.33, 2.37 and 2.30, respectively.

36
3.4 Tests on Sand
3.4.1 Sieve analysis
The sand material is free of any organic matter and suitable for use in this study. The
particle size distribution of sand has been determined through sieve analysis in
accordance with ASTM D422-63 (2002). The result is given in Figure 3.4.
Figure 3.4 : Sieve analysis of sand.
3.5 Tests on Bentonite-Sand and Bentonite-Zeolite
3.5.1 Compaction tests
3.5.1.1 Standard proctor compaction tests
Bentonite-amended zeolite and bentonite-amended sand mixtures, which have
B/BAZ or B/BAS ratio of 6%, 8%, 10%, 12% and 18% were compacted at various
molding water contents in 4 inch diameter mold with standard Proctor compaction
apparatus according to ASTM D698-00. It was aimed to determine the relationship
between water content and dry density of bentonite-sand and bentonite-zeolite
mixtures.
Studies were made by hand mixing. In concordance with Kenney et al. (1992), it was
agreed that mixing by hand gave the most consistent results since hand mixing forms
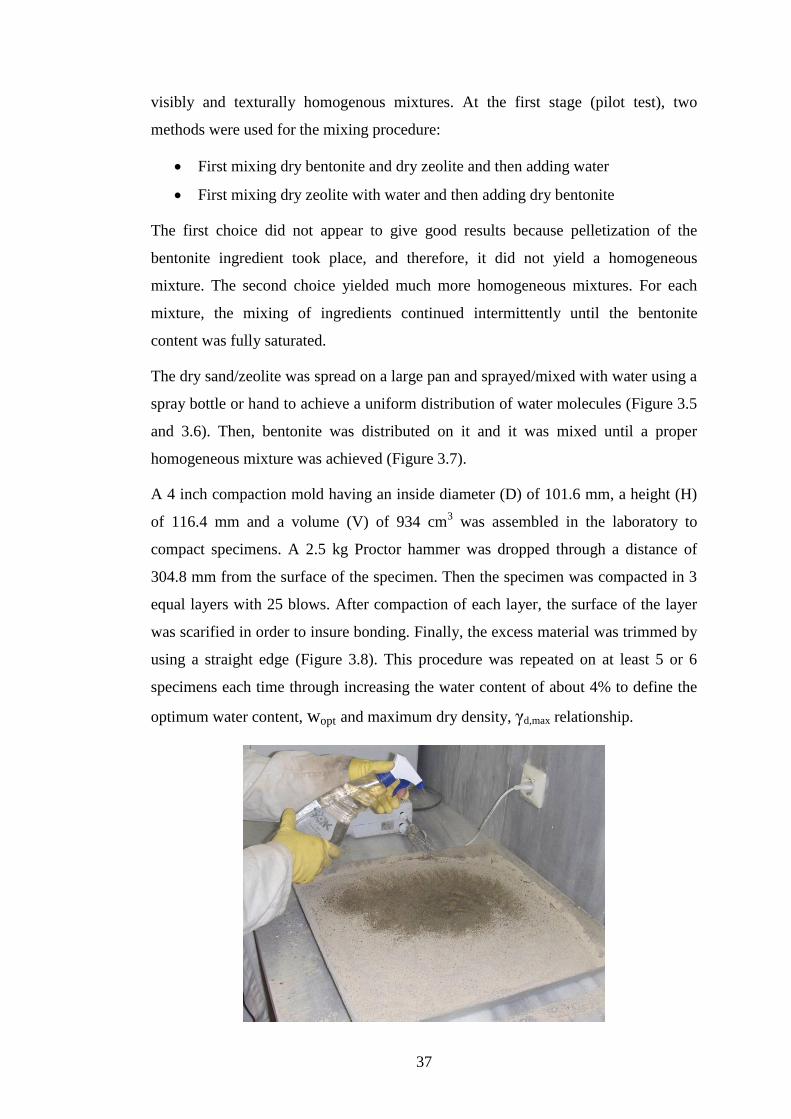
37
visibly and texturally homogenous mixtures. At the first stage (pilot test), two
methods were used for the mixing procedure:
First mixing dry bentonite and dry zeolite and then adding water
First mixing dry zeolite with water and then adding dry bentonite
The first choice did not appear to give good results because pelletization of the
bentonite ingredient took place, and therefore, it did not yield a homogeneous
mixture. The second choice yielded much more homogeneous mixtures. For each
mixture, the mixing of ingredients continued intermittently until the bentonite
content was fully saturated.
The dry sand/zeolite was spread on a large pan and sprayed/mixed with water using a
spray bottle or hand to achieve a uniform distribution of water molecules (Figure 3.5
and 3.6). Then, bentonite was distributed on it and it was mixed until a proper
homogeneous mixture was achieved (Figure 3.7).
A 4 inch compaction mold having an inside diameter (D) of 101.6 mm, a height (H)
of 116.4 mm and a volume (V) of 934 cm3 was assembled in the laboratory to
compact specimens. A 2.5 kg Proctor hammer was dropped through a distance of
304.8 mm from the surface of the specimen. Then the specimen was compacted in 3
equal layers with 25 blows. After compaction of each layer, the surface of the layer
was scarified in order to insure bonding. Finally, the excess material was trimmed by
using a straight edge (Figure 3.8). This procedure was repeated on at least 5 or 6
specimens each time through increasing the water content of about 4% to define the
optimum water content, wopt and maximum dry density, γd,max relationship.

38
Figure 3.5 : Spraying method used while compacting.
Figure 3.6 : Adding water and mixing by hand.
Figure 3.7 : A homogeneous mixture to be compacted.

39
Figure 3.8 : Compacted bentonite-sand mixture that is trimmed and extruded
from 4 inch compaction mold.
3.5.1.2 Vibratory hammer test
Kayabali (1997) and Kaya et al (2004) performed compaction tests on bentonite-
amended zeolite but there was a harsh difference in their conclusion. In Kayabali‟s
test, maximum dry density increases while bentonite amount in the mixture increases
and optimum water content decreases by adding more bentonite. An opposite finding
was observed in Kaya‟s test. The maximum dry density decreases while adding more
bentonite. This is not a predictable difference and we wanted to ponder over this
matter. It was obtained that Kayabali has conducted the compaction tests using
vibrating hammer and Kaya has utilized standard proctor method. Vibratory hammer
was also used in our program on the same mixtures to find out the subtle effects of
both methods on mixtures.
Figure 3.9 : Vibratory hammer equipment.

40
3.5.2 Hydraulic conductivity
According to Darcy‟s law, the coefficient of permeability (k) for flow through a
porous medium can be presented in the following form:
k=q/(iA)
(3.1)
where, q is the flow rate though an area A under the hydraulic gradient i. The value
of k is dependent on the properties of a porous medium and then on the flowing
liquid (Olson and Daniel, 1981; Mitchell, 1993).
Three different types of apparatus are used for the determination of hydraulic
conductivities of soils. These laboratory equipments are, namely, the rigid wall , the
flexible wall and consolidometer permeameters. It was decided to use rigid wall
permeameter in this study, since this tests is more applicable for lowpermeability
(fine grained) soils (ASTM 5856-95, 2002). Schematic drawing of falling head rigid
wall permeameter setup is given is Figure 3.10. It consists of four rigid wall
compaction permeameters, de-airing tank, four burettes, a distilled water tank and a
vacuum pump.
Figure 3.10 : Falling head compaction permeameter.
Bentonite-sand and bentonite-zeolite mixtures with B/(BAS or BAZ) of 6%, 8%
10%, 12% and 18% were prepared in the laboratory for the determination of their
hydraulic conductivities according to ASTM 5856-95 (2002). Bentonite-sand and

41
bentonite-zeolite mixtures were compacted at 1% above their optimum water
contents since as mentioned before compacting specimens on wet side of the
optimum water contents gives lower hydraulic conductivities. Compacted bentonite-
sand and bentonite-zeolite mixtures were placed in 4 inch rigid wall compaction
mold permeameter and falling head hydraulic conductivity tests were performed.
Distilled and de-aired water was used as the permeant. Each test took place for a
period of about 1 to 2 weeks, which is the required time for samples to reach fully
saturation condition. Full saturation was confirmed by water coming out of outlet
portal of the rigid wall compaction permeameter (Met et al., 2005; Akgün et al.,
2006).
In this method, heads h1 at time t1 and h2 at time t2 are measured in a burette of area,
when the fluid flows through a soil specimen of length, L and area, A. The
permeability (k) is then determined using Eq. (2).
(3.2)

42

43
4. EVALUATION OF TEST RESULTS
4.1 Standard Proctor Compaction Tests
4.1.1 Bentonite-amended sand
Bentonite-amended sand mixtures (sand with Bentonite Resadiye,B2), which have
B/BAS ratios of 6%, 8%, 10%, 12%, and 18% bentonite content were compacted at
various molding water contents in 4 inch diameter mold with standard Proctor
compaction apparatus according to ASTM D698-00.
To study the compaction characteristic of compacted bentonite-sand mixtures and to
assess their optimum moisture contents and maximum dry densities, standard Proctor
compaction curves of all mixtures were plotted. They are given in Figures 4.1
through 4.5.
According to laboratory test results, maximum dry densities for mixtures 6% -18%
range between 1.76 Mg/m3 and 1.80 Mg/m
3 corresponding to optimum moisture
content values of 14.20% and 16.90%, respectively. Maximum dry density and
optimum water content values are summarized in Table 4.1.
To study the effect of bentonite content on the compaction characteristics of
bentonite-sand mixtures, a plot of maximum dry density vs. bentonite content was
made. This plot is given in Figure 4.6. It is clear from this graph that as the bentonite
content increases achievable maximum dry density increases. However in some
studies maximum dry density increases up to a peak point by adding more bentonite
but after the peak point, maximum dry density values decreases regardless of an
increase in bentonite content (Kenney et al, 1992). This may be due to the fact that as
bentonite is added, sand particles are increasingly supported by the bentonite. This
suggests that the sand is the primary load bearing constituent of the mixture when
bentonite percentage is small. As the bentonite content increases, this load bearing
role is shared with bentonite. Swelling bentonite within the voids of mixture can act
like a structural component to share the load together with sands. However, higher
bentonite content may cause a decrease in maximum dry densities of compacted

44
bentonite-sand mixture. Higher percentage of bentonite in the mixture can generate
high swelling pressures compared to lower percentage of bentonite content. This
increment of swelling pressure may cause sand particle to lose their contact with
each other. Thus, their load bearing framework is disturbed leading to a decrease in
maximum dry density.
Figure 4.1 : Results of standard proctor compaction test on sand+B2 (B/BAS=6%).
Figure 4.2 : Results of standard proctor compaction test on sand+B2 (B/BAS=8%).

45
Figure 4.3 : Results of standard proctor compaction test on sand+B2 (B/BAS=10%).
Figure 4.4 : Results of standard proctor compaction test on sand+B2 (B/BAS=12%).

46
Figure 4.5 : Results of standard proctor compaction test on sand+B2 (B/BAS=18%).
Table 4.1 : Maximum dry density and optimum water of BAS.
B/BAS (%) Max dry
unit weight
Optimum
water
content (%)
6 1.76 14.2
8 1.77 15
10
12
18
1.79
1.79
1.80
16
16.7
16.9
Figure 4.6 : Relation of bentonite amount in the mixture with maximum dry unit
weight.
47
4.1.2 Bentonite-amended zeolite
Bentonite-amended zeolite mixtures, which have B/BAZ ratios of 6%, 8%, 10%,
12%, and 18% bentonite content were compacted at various molding water contents
in 4 inch diameter mold with standard Proctor compaction apparatus according to
ASTM D698-00, for all combinations of zeolites with bentonites.
To study the compaction characteristic of compacted bentonite-zeolite mixtures and
to assess their optimum moisture contents and maximum dry densities, standard
Proctor compaction curves of all mixtures were plotted. They are given in Figures
4.7-4.11 for Z1B1, 4.12 to 4.16 for Z1B2, 4.17 to 21 for Z2B1, 4.22 to4.26 for Z2B2,
4.27 to 4.31 for Z3B1 and 4.32 to 4.36 for Z3B2.
According to the laboratory test results, maximum dry densities for mixtures 6% -
18% range between 1.20 Mg/m3 and 1.24 Mg/m
3 for Z1B1 mixture, corresponding to
optimum moisture content values of 36% and 39%, respectively. For Z1B2,
maximum dry densities range between 1.22 Mg/m3 and 1.24 Mg/m
3 with optimum
water content of 35% to36.5%. Maximum dry densities for mixtures 6% -18% range
between 1.26 Mg/m3 and 1.29 Mg/m
3 for Z2B1 mixture, corresponding to optimum
moisture content values of 33% and 36%, respectively. Maximum dry densities for
mixtures 6% -18% range between 1.23 Mg/m3 and 1.29 Mg/m
3 for Z2B2 mixture,
corresponding to optimum moisture content values of 32.5% and 35.5%,
respectively. Maximum dry density for mixtures 6% -18% is 1.37Mg/m3 for Z3B1
mixture. Maximum dry densities for mixtures 6% -18% range between 1.34 Mg/m3
and 1.36 Mg/m3 for Z3B2 mixture, corresponding to optimum moisture content
values of 26% and 28.4%, respectively. Maximum dry density and optimum water
content values are summarized in Tables 4.2 - 4.7.
It is observed that there are not remarkable changes in maximum dry density values
by adding more bentonite in the same mixtures. Information of mixture Z1B1 is
given below:
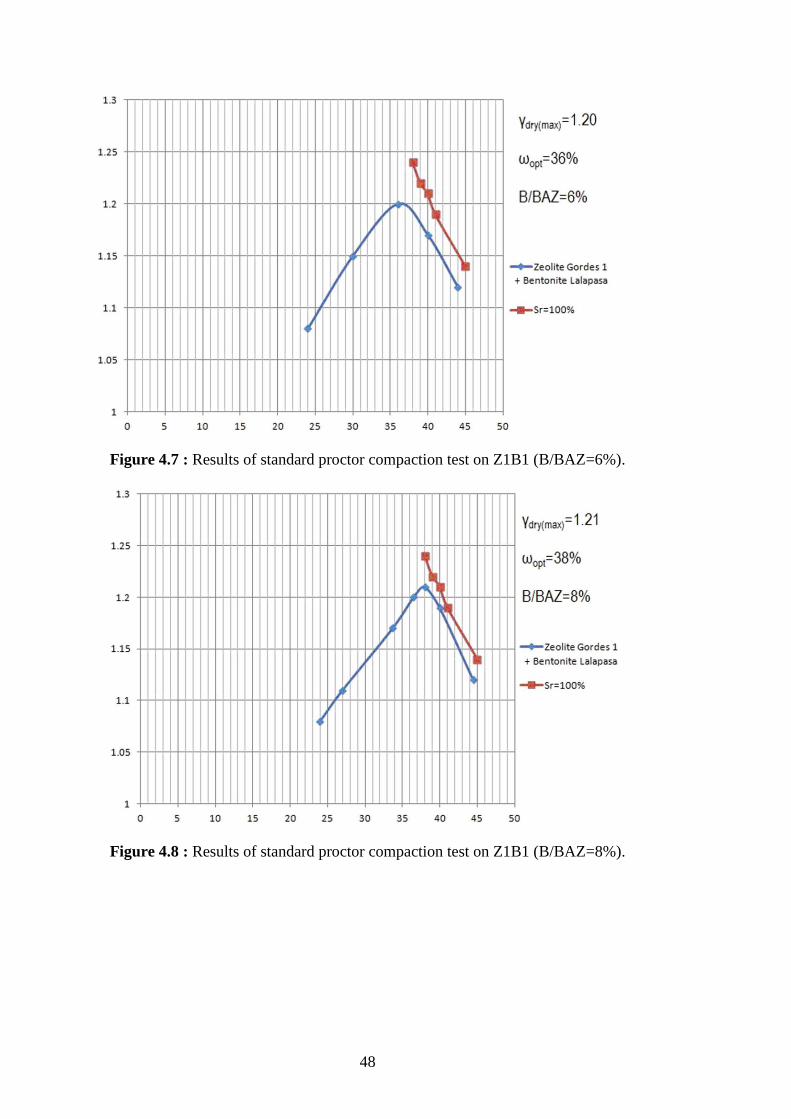
48
Figure 4.7 : Results of standard proctor compaction test on Z1B1 (B/BAZ=6%).
Figure 4.8 : Results of standard proctor compaction test on Z1B1 (B/BAZ=8%).

49
Figure 4.9 : Results of standard proctor compaction test on Z1B1 (B/BAZ=10%).
Figure 4.10 : Results of standard proctor compaction test on Z1B1 (B/BAZ=12%).

50
Figure 4.11 : Results of standard proctor compaction test on Z1B1 (B/BAZ=18%).
Information of Z1B2 mixture is given below:
Figure 4.12 : Results of standard proctor compaction test on Z1B2 (B/BAZ=6%).
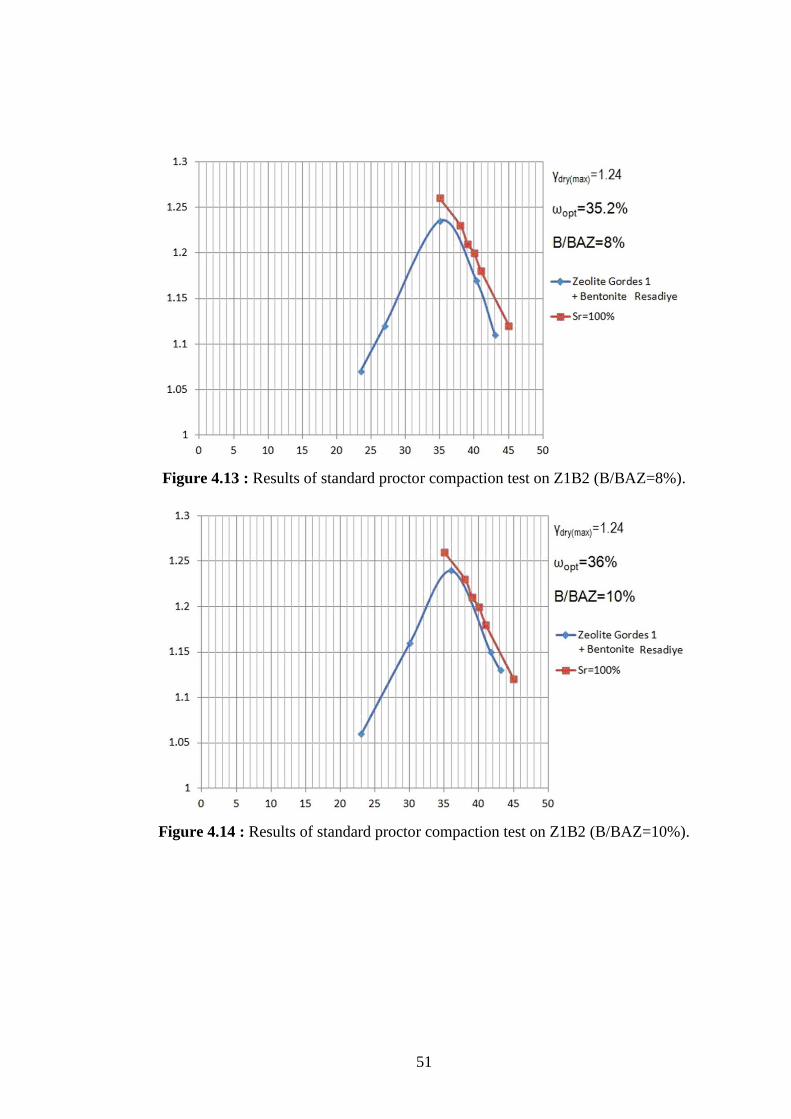
51
Figure 4.13 : Results of standard proctor compaction test on Z1B2 (B/BAZ=8%).
Figure 4.14 : Results of standard proctor compaction test on Z1B2 (B/BAZ=10%).

52
Figure 4.15 : Results of standard proctor compaction test on Z1B2 (B/BAZ=12%).
Figure 4.16 : Results of standard proctor compaction test on Z1B2 (B/BAZ=18%).

53
Information of Z2B1 is given below:
Figure 4.17 : Results of standard proctor compaction test on Z2B1 (B/BAZ=6%).
Figure 4.18 : Results of standard proctor compaction test on Z2B1 (B/BAZ=8%).

54
Figure 4.19 : Results of standard proctor compaction test on Z2B1 (B/BAZ=10%).
Figure 4.20 : Results of standard proctor compaction test on Z2B1 (B/BAZ=12%).

55
Figure 4.21 : Results of standard proctor compaction test on Z2B1 (B/BAZ=18%).
Information of Z2B2 is given below:
Figure 4.22 : Results of standard proctor compaction test on Z2B2 (B/BAZ=6%).
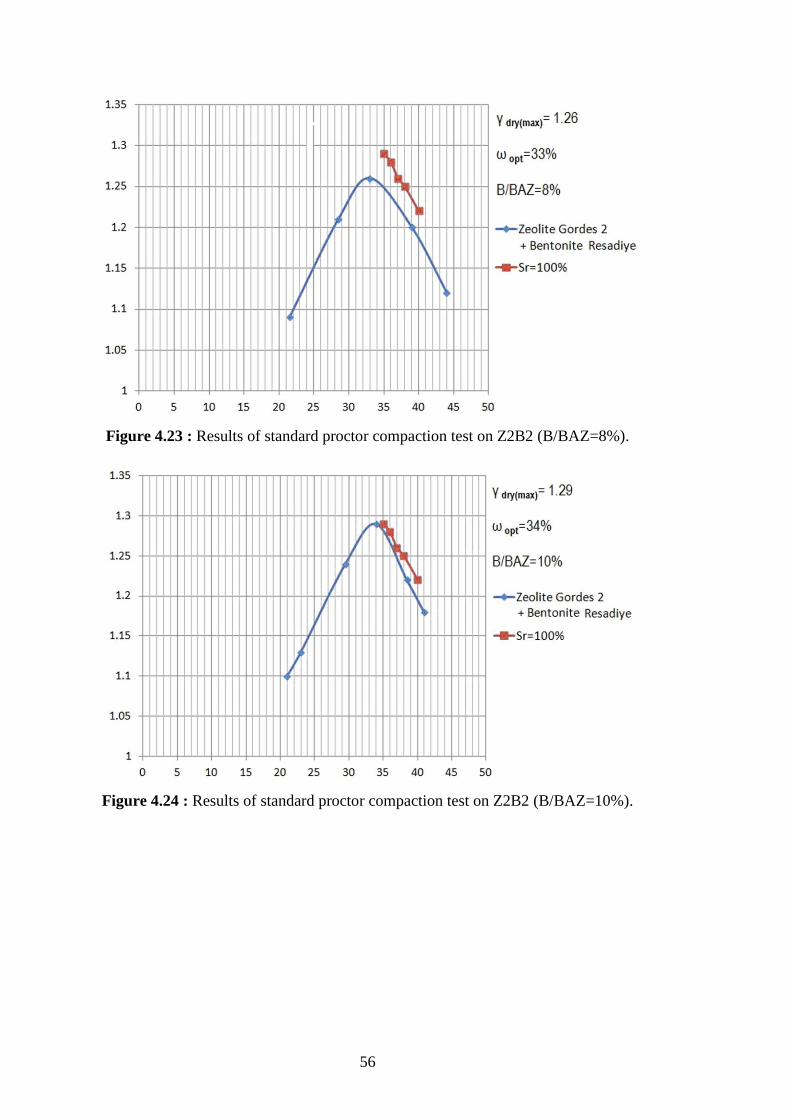
56
Figure 4.23 : Results of standard proctor compaction test on Z2B2 (B/BAZ=8%).
Figure 4.24 : Results of standard proctor compaction test on Z2B2 (B/BAZ=10%).

57
Figure 4.25 : Results of standard proctor compaction test on Z2B2 (B/BAZ=12%).
Figure 4.26 : Results of standard proctor compaction test on Z2B2 (B/BAZ=18%).

58
Information of Z3B1 is given below:
Figure 4.27 : Results of standard proctor compaction test on Z3B1 (B/BAZ=6%).
Figure 4.28 : Results of standard proctor compaction test on Z3B1 (B/BAZ=8%).

59
Figure 4.29 : Results of standard proctor compaction test on Z3B1 (B/BAZ=10%).
Figure 4.30 : Results of standard proctor compaction test on Z3B1 (B/BAZ=12%).

60
Figure 4.31 : Results of standard proctor compaction test on Z3B1 (B/BAZ=18%).
Information of Z3B2 is given below:
Figure 4.32 : Results of standard proctor compaction test on Z3B2 (B/BAZ=6%).

61
Figure 4.33 : Results of standard proctor compaction test on Z3B2 (B/BAZ=8%).
Figure 4.34 : Results of standard proctor compaction test on Z3B2 (B/BAZ=10%).

62
Figure 4.35 : Results of standard proctor compaction test on Z3B2 (B/BAZ=12%).
Figure 4.36 : Results of standard proctor compaction test on Z3B2 (B/BAZ=18%).

63
Table 4.2 : Dry density and water content of Z1B1.
B/BAZ (%)
(Z1B1)
Max dry unit
weight
Optimum
water content
(%)
6 1.20 36
8 1.21 38
10
12
18
1.22
1.24
1.20
38
34
39
Table 4.3 : Dry density and water content of Z1B2.
B/BAZ (%)
(Z1B2)
Max dry unit
weight
Optimum
water content
(%)
6 1.24 35
8 1.24 35.2
10
12
18
1.24
1.24
1.22
36
36
36.5
Table 4.4 : Dry density and water content of Z2B1.
B/BAZ (%)
(Z2B1)
Max dry unit
weight
Optimum
water content
(%)
6 1.26 33
8 1.27 35
10
12
18
1.29
1.28
1.26
35
35.7
36
Table 4.5 : Dry density and water content of Z2B2.
B/BAZ (%)
(Z2B2)
Max dry unit
weight
Optimum
water content
(%)
6 1.23 32.5
8 1.26 33
10
12
18
1.29
1.27
1.26
34
34.9
35.5
Table 4.6 : Dry density and water content of Z3B1.
B/BAZ (%)
(Z3B1)
Max dry unit
weight
Optimum
water content
(%)
6 1.37 27.5
8 1.37 28
10
12
18
1.37
1.37
1.37
28.5
28.8
29
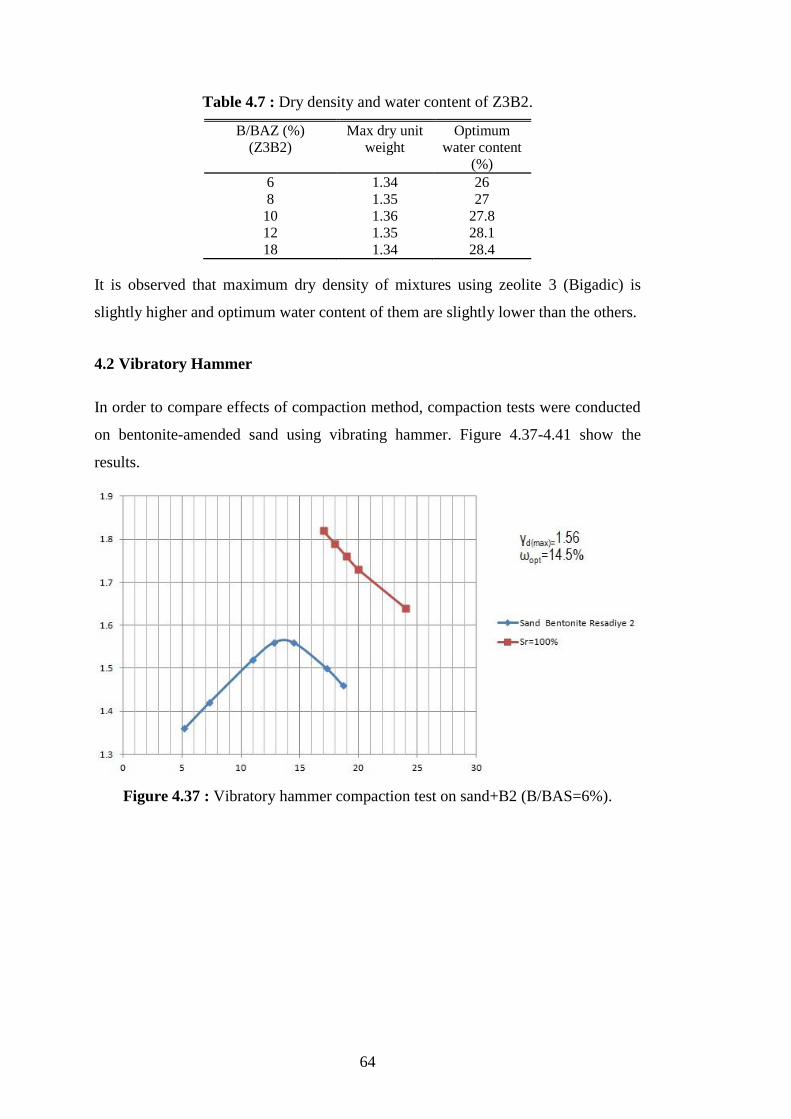
64
Table 4.7 : Dry density and water content of Z3B2.
B/BAZ (%)
(Z3B2)
Max dry unit
weight
Optimum
water content
(%)
6 1.34 26
8 1.35 27
10
12
18
1.36
1.35
1.34
27.8
28.1
28.4
It is observed that maximum dry density of mixtures using zeolite 3 (Bigadic) is
slightly higher and optimum water content of them are slightly lower than the others.
4.2 Vibratory Hammer
In order to compare effects of compaction method, compaction tests were conducted
on bentonite-amended sand using vibrating hammer. Figure 4.37-4.41 show the
results.
Figure 4.37 : Vibratory hammer compaction test on sand+B2 (B/BAS=6%).

65
Figure 4.38 : Vibratory hammer compaction test on sand+B2 (B/BAS=8%).
Figure 4.39 : Vibratory hammer compaction test on sand+B2 (B/BAS=10%).

66
Figure 4.40 : Vibratory hammer compaction test on sand+B2 (B/BAS=12%).
Figure 4.41 : Vibratory hammer compaction test on sand+B2 (B/BAS=18%).
It is clearly observed that the efficiency of standard proctor test is better than
vibratory hammer method. For the same mixtures, the curves resulted from standard
proctor test are much closer to fully saturated situation than those of vibrating
hammer.

67
4.3 Hydraulic Conductivity
4.3.1 Bentonite-amended sand
Bentonite-sand mixtures (sand with bentonite2, Resadiye) possessing 6%, 8% 10%,
12% and 18% bentonite contents were prepared in the laboratory for the
determination of their hydraulic conductivity properties according to ASTM 5856-95
(2002). Bentonite-sand mixtures were compacted at slightly above of their optimum
water contents since compacting specimens on wet side of the optimum water
contents gives lower hydraulic conductivities.
Hydraulic conductivity values of 6%, 8% 10%, 12% and 18% bentonite-sand
mixtures were found to be in the range of 1.48x10⁻¹⁰
to 7.2x10⁻⁹
m/s.
Laboratory results of hydraulic conductivity values are given in Table 4.8. It is
obvious that an increment of bentonite content in the compacted mixtures lowers the
hydraulic conductivity values. This has been verified by many studies. For example ,
Kenney et al. (1992), Chapuis (1990), Komine (2004), Kaoser et al. (2006), Tashiro
et al. (1998) and Kaya et al. (2006) performed falling head hydraulic conductivity
tests on different bentonite-sand mixtures.
They all have concluded that the addition of more bentonite decreases the hydraulic
conductivity. Since bentonite alone has characteristics of impervious material and
has extremely lower hydraulic conductivity values in the order of 10-10
and 10-12
m/s,
it is expected to have lower hydraulic conductivities as its percentage in the mixture
increases. This trend is clearly seen in Figure 4.42, indicating a decreasing trend in
hydraulic conductivity values as bentonite content increases.
Table 4.8 : Relation of bentonite amount with hydraulic conductivity.
B/BAS (%) Hydraulic
conductivity
(m/s)
6 7.2E-9
8 5.9E-9
10
12
18
4.3E-9
2.0E-9
1.48E-10

68
Figure 4.42 : Relation of bentonite amount with hydraulic conductivity.
4.3.2 Bentonite-amended zeolite
Bentonite-zeolite mixtures (Z1B1, Z1B2, Z2B1, Z2B2, Z3B1, Z3B2) possessing 6%,
8% 10%, 12% and 18% bentonite contents were prepared in the laboratory for the
determination of their hydraulic conductivity properties according to ASTM 5856-95
(2002). Bentonite-zeolite mixtures were compacted at slightly above of their
optimum water contents since compacting specimens on wet side of the optimum
water contents gives lower hydraulic conductivities.
Laboratory results of hydraulic conductivity values are given in Tables 4.9 - 4.14. It
is obvious that an increment of bentonite content in the compacted mixtures lowers
the hydraulic conductivity values.
Table 4.9 : Relation of bentonite amount with hydraulic conductivity (Z1B1).
B/BAZ (%) Hydraulic
conductivity
(m/s)
6 8.5E-10
8 6.2E-10
10
12
18
4.1E-10
3.15E-10
1.16E-10

69
Table 4.10 : Relation of bentonite amount with hydraulic conductivity (Z2B1).
B/BAZ (%) Hydraulic
conductivity
(m/s)
6 8.54E-10
8 6.3E-10
10
12
18
4.1E-10
4.0E-10
1.26E-10
Table 4.11 : Relation of bentonite amount with hydraulic conductivity (Z3B1).
B/BAZ (%) Hydraulic
conductivity
(m/s)
6 6.43E-10
8 4.11E-10
10
12
18
3.23E-10
2.89E-10
1.07E-10
Table 4.12 : Relation of bentonite amount with hydraulic conductivity (Z1B2).
B/BAZ (%) Hydraulic
conductivity
(m/s)
6 8.14E-10
8 5.96E-10
10
12
18
3.87E-10
3.10E-10
1.11E-10
Table 4.13 : Relation of bentonite amount with hydraulic conductivity (Z2B2).
B/BAZ (%) Hydraulic
conductivity
(m/s)
6 7.78E-10
8 6.23E-10
10
12
18
3.83E-10
3.62E-10
1.18E-10
Table 4.14 : Relation of bentonite amount with hydraulic conductivity (Z3B2).
B/BAZ (%) Hydraulic
conductivity
(m/s)
6 4.57E-10
8 3.94E-10
10
12
18
3.11E-10
2.57E-10
1.0E-10

70
It is clear that combination of zeolite Bigadic (Z3) and bentonite Resadiye (B2)
results in the lowest permeable mixture. This trend is clearly seen in Figure 4.43,
indicating a decreasing trend in hydraulic conductivity values as bentonite content
increase for Z3B2 mixture.
Figure 4.43 : Relation of bentonite amount with hydraulic conductivity (Z3B2).

71
5. CONCLUSIONS AND RECOMMENDATIONS
Bentonite-amended sand and also bentonite-amended zeolite mixtures have been
selected as drainage blankets to be used in highways. To develop an optimum
bentonite-sand and bentonite-zeolite mixtures, which satisfy the minimum hydraulic
conductivity requirement and is mechanically stable and cost effective, an intensive
laboratory testing program was carried out.
For laboratory testing, bentonite-sand and bentonite-zeolite mixtures possessing 6%,
8%, 10%, 12% and 18% were prepared in laboratory to assess their engineering
parameters. Engineering geological tests such as specific gravity tests, grain size
distribution, standard compaction tests and falling head hydraulic conductivity tests
were performed on mixtures to determine their hydrological and mechanical
properties. According to the evaluation of testing program, it is possible to make the
following conclusions:
Specific gravity test results revealed that since the specific gravity of
bentonite is greater than that of sand alone, specific gravity values of
bentonite-sand mixtures increases as the bentonite content increases. This
phenomenon is also verified by Komine and Ogata (1999).
According to compaction test results, maximum dry density of bentonite-
amended sand mixture increases by adding more bentonite. Anyway, for
bentonite-amended zeolite different behaviors are observed. In some cases
the density is exposed to continual increment, in others a continual decrease
is observed and for some, an initial increment and a further decrease is
observable.
According to the results of hydraulic conductivity tests, this value satisfies the
minimum requirements to be used as drainage blankets.
Due to the fact that high cation exchange capacity is not essential for drainage
blankets, sand can be used instead of zeolite. Turkey owns remarkable zeolite
ores and it may be an economic choice to use them.

72
Bentonite is a relatively expensive material. Due to its higher costs, finding
an optimum amount of bentonite in mixtures with satisfying the needs is a
matter of tact.
With regard to test results bentonite-amended sand mixtures with bentonite
ratio of 18% and bentonite-amended zeolite mixtures with bentonite amount
of 6-10% are found to be the best choices to be used as drainage blankets.

73
REFERENCES
Abhijit, P. (2011). Effects of bad drainage on roads. Civil and Environmental
Research, Vol 1, No.1, 2011.
Acar, Y. and Olivieri, I. (1989). Pore fluid effects on the fabric and hydraulic
conductivity of laboratory-compacted clay. Transp. Res. Record 1219,
Transportation Research Board, Washington, D.C., p. 144-159.
Akbulut, A. (1995). Yazicik bentonite (Niksar-Tokat/Türkiye): Preliminary data.
Geological Bulettin of Turkey, 38 (1), 53-61 (in Turkish).
Akbulut, A.. (1996). Bentonite. MTA yayini, No.32, Ankara, 78s.
Akgün, H., Koçkar, M.K., Aktürk, Ö. (2006). Evaluation of a compacted
bentonite/sand seal for underground waste respitory isolation.
Environmental Geology, 50, p. 331-337.
Akgün, H., Daemen, J.J.K., (1999). Design implications of analytical and
laboratory studies of permanent abandonment plugs. Canadian
Geotechnical Journal, 36, p. 21-38.
Arslan, M., Abdioğlu, E., Kadir, S. (2010). Mineralogy and origin of bentonite in
upper cretaceous pyroclastic units of the Tirebolu area, Giresun,
Northeast Turkey. Clays and Clay Minerals, 58 (1), 120-141.
ASTM D422-63. (2002). Standard test methods for particle size analysis of soils.
Annual book of ASTM Standards, Section 4, Vol. 04.08, Soil and
Rock, Building Stones, ASTM, Philadelphia.
ASTM D4546-03 Standard test methods for one-dimensional swell or settlement
potential of cohesive soils. Annual book of ASTM standards, Section
4, Vol.04.04, Soil and Rock; Building Stones, ASTM, Philadelphia.
ASTM D698-00 Standard test methods for laboratory compaction characteristics of
soil using standard effort (12,400 ft-lbf/ft3(600kNm/m3)). Annual
book of ASTM standards, Section 4, Vol 04.04, Soil and Rock;
Building Stones, ASTM, Philadelphia.
ASTM D854-02 Standard test methods for specific gravity of soils. Annual book of
ASTM standards, Section 4, Vol 04.04, Soil and Rock; Building
Stones, ASTM, Philadelphia.
ASTM D5856-95 Standard test methods for measurement of hydraulic conductivity
of porous material using a rigid-wall compaction mold permeameter.
Annual book of ASTM standards, Section 4, Vol 04.04, Soil and
Rock; Building Stones, ASTM, Philadelphia.
Benson. C., Daniel, D. (1990). Influence of clods on hydraulic conductivity of
compacted clay. Journal of Geotechnical Engineering, ASCE, 116 (8),
p.1231-1248.

74
Chapuis, R. P., (1990). Sand-bentonite liners: Predicting permeability from
laboratory tests. Canadian Geotechnical Journal, 27, p 47-57.
Chapuis, R. P., (2002). The 2000 R.M. Hardy Lecture: Full scale hydraulic
performance of soil-bentonite and compacted clay liners. Canadian
Geotechnical Journal, 39(2), p. 417-439.
Çelik-Karakaya, M., Karakaya, N., Küpeli, Ş. (2011). Mineralogical and
geochemical properties of the Na- and Ca-Bentonites of Ordu (NE
Turkey). Clays and Clay Minerals, 59, 75-94.
Çoban, F. (2000). Ayvacık (Çanakkale) bentonitinin jeolojisi, mineralojisi ve
oluşumu, Osmangazi Üniversitesi Mih. Mim. Fakültesi Dergisi, 10/1,
22-37.
Daemon, J. J. K, Ran, C., (1996). Bentonite as a waste isolation pilot plant shaft
sealing material. Sandia National Laboratories, Albuqurque,
Contractor Report SAND96-1968.
Di Maio, C., & Fenelli, G. B. (1994). Residual shear strength of kaoline and
bentonite: the influence of constituent pore fluid, Geotechnique, 44(4),
p.17-226.
Dunn, I. S., Anderson, L. R., Kiefer, F. W., (1980). Fundamentals of geotechnical
analysis. New York: Wiley.
Erdoğan, M. (2006): Türkiye döküm bentoniti potansiyeline genel bir bakış: Güncel
durum, öngörüler ve sorunlar. Kibited, 1/1, 1-5.
Fuenkajorn, K., Daemen, J. J. K. (eds, 1996), Sealing of boreholes and
underground excavations in rock. Chapman and Hall, London.
Gleason, M., Daniel, D. E., Eykholt, G. R., (1997). Calcium and sodium bentonite
for hydraulic contaminant application, Journal of Geotechnical and
Geoenvironmental Engineering, ASCE 123 (5), p. 438-445.
Grim, R. E., (1968). Clay Mineralogy. Mc Graw Hill, New York, 596.
Gündoğdu, M. N., (1982). Neojen yaşlı Bigadiç sedimanter baseninin jeolojik,
mineralojic ve jeokimyasal incelenmesi. Doktora Tezi, Hacettepe
Üniversitesi, Yayınlanmamış, 386s.
Haug, M. D. and Wong, L. C. (1992). Impact of molding water content on
hydraulic conductivity of compacted sand-bentonite. Canadian
Geotechnical Journal, 29, p.253-262.
IAEA, 1990, Sealing of underground repositories for radioactive wastes. In: Gray M,
Gera F, Wiley JR, Dlouhy Z, Squires D (eds), International Atomic
Energy Agency, Vienna, Unipup, Lanham, MD, Tech Reps Series No.
319.
İpekoğlu, B., Kurşun, Y., Barut, A. (1997). Türkiye bentonit potansiyeline genel
bir bakış. 2. Endüstriyel Hammeddeler Sempozyumu Bildiriler Kitabı,
İzmir, 51-61.
Kadir, S. (2007). Mineralogy, geochemistry and genesis of smectite in pliocene
volcaniclastic rocks of the Doğanbey Formation, Beyşehir basin,
Konya, Turkey. Clays and Clay Minerals, 55, 402-422.

75
Kaya, A., Durukan, S., Ören, A. H., Yukselen, Y., (2006). Bentonite-zeolite
karışımlarının mühendislik özelliklerinin belirlenmesi, IMO Teknik
Dergi, p. 3879-3892.
Kaya, A., Durukan, S. (2004). Utilization of bentonite-embedded zeolite as clay
liner, Applied Clay Science 25 (2004) 83-91.
Kayabali, K. (1997). Engineering aspects of a novel landfill liner material:
Bentonite-amended natural zeolite, Engineering Geology, 46.
Kenney, T. C., Veen, W. A., Swallow, M. A. and Sungalia, M. A. (1992).
Hydraulic conductivity of compacted bentonite-sand mixture.
Canadian Geotechnical Journal, 29, p. 364-374.
Komine, H. (2004). Simplified evaluation for swelling characteristics of bentonites.
Engineering Geology, 71, p. 265-279.
Komine, H., Ogata, N., (1996). Prediction of swelling characteristics of compacted
bentonite, Canadian Geotechnical Journal, 33, p.11-12.
Komine, H., Ogata, N., (1999). Experimental study on swelling characteristics of
sand-bentonite mixture for nuclear waste disposal, Soils and
Foundations 39 (2), p.83-97.
Lambe, T. W., Whiteman, R. V., (1969). Soil Mechanics, J. Willey, New York.
Met, M., Akgün, H., Türkmenoğlu, A. G., (2005). Environmental Engineering and
geotechnical investigations related to the potential use of Ankara clay
as a compacted landfill liner material, Turkey. Environmental
Geology, 47, p. 225-236.
Meyer, D., Howard, J. J., (1983). Evaluation of clays and clay minerals for
application to repository sealing, ONWI-486, Office of Nuclear Waste
Isolation, Battelle Memorial Institute.
Mitchell, J. K., Hooper, D. R., Campanella, R. G., (1965). Permeability of
compacted clay. Journal of the Soil Mechanics and Foundations
Division, ASCE, 91(SM4): p. 41-65.
Nilsson, J., (1985). Field compaction of bentonite-based backfilling, Engineering
Geology. Vol. 21, No.34, p. 367-376.
Olson, R. E., Daniel, D. E., (1981). Measurement of the hydraulic conductivity of
fine grained soils. Permeability and Groundwater Contaminant
Transport, ASTM STP 746, p. 18-64.
Pusch, R., (1994), Waste disposal in rock, Developments in Geotechnical
Engineering 76, Elsevier, Amsterdam, 490 pp.
Radhakrishna, H. S., Chan, H. T., (1982), Laboratory study of physical properties
of clay buffers for a nuclear fuel waste vault. Proceedings of an
international conference on radioactive waste management (ed. M. A.
Feraday), p. 84-90. Toronto: Canadian Nuclear Society.
Radhakrishna, H. S., Chan, H. T., (1989), Thermal and physical properties of
candidate buffer-backfill materials for nuclear fuel waste disposal
vault. Canadian Geotechnical Journal, 26, p. 629-639.

76
Tashiro, S., Fujiwara, A., Senoo, M., (1998), Study on the permeability of
engineered barriers for the enhancement of a radioactive waste
erpository system, Nuclear Technology, Vol.121, No. 1, p. 14-23.
Tien, Y. M., Wu, P. L., Chuang, W. S., and Wu, L. H., (2004), Micromechanical
model for compaction characteristics of bentonite-sand
mixtures,Applied Clay Science 26, p. 489-498.
Türkmenoğlu, A., Aker, S., Göğüş, G., Turan, C., (1987), Ankara-çankırı bölgesi
bentonitinin mineralojic-petrografisi ve oluşumu. 3. Ulusal Kil
Sempozyumu kitabı, (ED: A.Türkmenoğlu ve O. Akıman), Ankara,
101-112.
Usepa (1993) Criteria for municipal solid waste landfills (MSWLF Criteria), 40CFR,
Part 258, Cincinnati, Ohio.
Westsik, J. H. Jr., Bray, L. A. Hodges, F. N. and Wheelwright, E. J., (1981),
Permeability, swelling, and radionuclide-retardation properties of
candidate backfill materials, Symposium on Scientific Basis for
Nuclear Waste Management.
Xu, Y. F., Matsouoka, H., Sun, D. A., (2003), Swelling characteristics of
fractaltectured bentonite and its mixtures. Applied Clay Science,
22(4): p.197-209.
Yanıkömeroğlu, K., (1985), Effect of lateral confinement on swell behavior, M.Sc.
Thesis in Civil Eng., Middle East Technical University, p. 41.63,
Ankara.
Yeniyol, M., (1987), Enez (Edirne) bentonitinin jeolojisi, mineralojisi ve oluşumu. 3.
Ulusal Kil Sempozyumu Bildiri Kitabı (ED: A. Türkmenoğlu ve
O.Akıman), Ankara, 123-137.

77
CURRICULUM VITAE
Name Surname: Shahin Shakibaei
Place and Date of Birth: Tabriz / Iran – 03.22.1988
E-Mail: [email protected]
M.Sc. : Istanbul Technical University
List of Publications and Patents:
Shakibaei, S., Alpkokin, P. Gunduz, U., (2011), Oil-rich countries and sustainable
mobility, challenges in Tabriz. Procedia, Social and Behavioral Sciences, Vol 20,
2011, Pages 171-176.
Tanriverdi, Cagin., Kartal, S., Shakibaei, S., (2012), An estimation of utility of solar
enerjy in developing countries, case study: Turkey. 1 ICAUD, Albania.
Shakibaei, S., Tanriverdi, C., Tezcan, O., (2012), A stated preference (SP) study on
individuals‟ transportation decisions, focused on Marmaray project in Istanbul. 15th
EWGT, Paris, France.
PUBLICATIONS/PRESENTATIONS ON THE THESIS
Shakibaei, S., Kartal, F., Ekinci, B., Esenli, F., Lav, M. A., (2012), Susceptibility
of zeolite to crushing as a main component of landfill liners. ACE 2012, Ankara,
Turkey.