Issues the assessmentof nutritional status using...
11
Issues in the assessment of nutritional status using anthropometry* J. Gorstein,' K. Sullivan,2 R. Yip,3 M. de Onis,4 F. Trowbridge,3 P. Fajans,1 & G. Clugston4 Four issues in the use and interpretation of anthropometry are discussed at the level of the population and of the individual. The first issue is the index or indices of choice: weight-for-height versus height- for-age versus weight-for-age. The selection of an index or indices depends upon many factors, and no one index is completely adequate in all situations. Proposed criteria are provided to assess the severity of low anthropometry within populations. The second issue is the scale of the index: z-scores (or stan- dard deviations) versus percentiles versus percent-of-median. z-Scores have several properties that make them superior to the other two scales. A third issue deals with limitations in the current growth reference; one of these is the disjunction between the growth curves at 2 years of age, resulting from the use of two different populations in the reference. It is important that this disjunction be recognized by researchers so that the anthropometric findings are interpreted correctly for this age range. Lastly, some issues to do with the collection of single versus multiple anthropometric measurements on chil- dren are discussed. Introduction Anthropometry is widely used as a tool to estimate the nutritional status of populations and to monitor the growth and health of individuals. The three most frequently used anthropometric indices are weight- for-height, height-for-age, and weight-for-age. In this article we address four issues related to the use of the CDC/WHO Intemational Growth Reference (1-3) in anthropometric assessment that are important to the presentation and interpretation of anthropometric information. Specifically, the following issues are considered: the relation between the anthropometric indicators; the scale of the indicators (z-score versus percentile versus percent-of-median); limitations in the current growth reference; and single versus mul- tiple measurements. The implications of each of these issues and how they influence the interpretation * This paper was presented, in part, at the Society for Epidemi- ologic Research Twenty-fourth Annual Meeting, Buffalo, New York, USA, 11-14 June 1991. 1 Department of International Health, University of Michigan, Ann Arbor, Michigan, USA. 2 Division of Epidemiology, Emory University School of Public Health, and the Program against Micronutrient Malnutrition, Atlanta, GA, USA. 3 Division of Nutrition, Centers for Disease Control, Atlanta, GA, USA. 4 Nutrition Unit, World Health Organization, 1211 Geneva 27, Switzerland. Requests for reprints should be sent to Dr de Onis at this address. Reprint No. 5478 of anthropometry at both the level of the population and of the individual are emphasized. Relation between the indices The relative merit of each of the anthropometric indices used in assessing nutritional status has been discussed previously (4, 5) but will be reviewed brief- ly with emphasis on certain aspects. The two prefer- red anthropometric indices for nutritional status are weight-for-height and height-for-age, since these dis- criminate between different physiological and bio- logical processes (4). In some situations the concem should be with low weight-for-height (i.e., wasting or thinness), a condition that reflects a failure to gain weight or a loss of weight. One advantage of weight- for-height is that is can be calculated without know- ing age, which makes it useful in populations that do not record dates of birth or for whom such informa- tion is unavailable or unreliable. In other situations where wasting is not a major problem, low height- for-age (i.e., stunting, short stature, or linear growth retardation) may be of primary concem because a high prevalence of low height-for-age is frequently associated with poor overall economic conditions and/or repeated exposure to adverse conditions (6, 7). Weight-for-age is primarily a composite index of both weight-for-height and height-for-age and fails to distinguish tall, thin children from those who are short with adequate weight. The use of weight-for- age for predicting or identifying "wasted" children was found to have a low sensitivity and specificity in three U.S. populations (8). Bulletin of the World Health Organization, 1994, 72 (2): 273-283 © World Health Organization 1994 273
Transcript of Issues the assessmentof nutritional status using...

Issues in the assessment of nutritional statususing anthropometry*J. Gorstein,' K. Sullivan,2 R. Yip,3 M. de Onis,4 F. Trowbridge,3 P. Fajans,1 &G. Clugston4
Four issues in the use and interpretation of anthropometry are discussed at the level of the populationand of the individual. The first issue is the index or indices of choice: weight-for-height versus height-for-age versus weight-for-age. The selection of an index or indices depends upon many factors, and noone index is completely adequate in all situations. Proposed criteria are provided to assess the severityof low anthropometry within populations. The second issue is the scale of the index: z-scores (or stan-dard deviations) versus percentiles versus percent-of-median. z-Scores have several properties thatmake them superior to the other two scales. A third issue deals with limitations in the current growthreference; one of these is the disjunction between the growth curves at 2 years of age, resulting fromthe use of two different populations in the reference. It is important that this disjunction be recognizedby researchers so that the anthropometric findings are interpreted correctly for this age range. Lastly,some issues to do with the collection of single versus multiple anthropometric measurements on chil-dren are discussed.
IntroductionAnthropometry is widely used as a tool to estimatethe nutritional status of populations and to monitorthe growth and health of individuals. The three mostfrequently used anthropometric indices are weight-for-height, height-for-age, and weight-for-age. In thisarticle we address four issues related to the use of theCDC/WHO Intemational Growth Reference (1-3) inanthropometric assessment that are important to thepresentation and interpretation of anthropometricinformation. Specifically, the following issues areconsidered: the relation between the anthropometricindicators; the scale of the indicators (z-score versuspercentile versus percent-of-median); limitations inthe current growth reference; and single versus mul-tiple measurements. The implications of each of theseissues and how they influence the interpretation
* This paper was presented, in part, at the Society for Epidemi-ologic Research Twenty-fourth Annual Meeting, Buffalo, NewYork, USA, 11-14 June 1991.1 Department of International Health, University of Michigan,Ann Arbor, Michigan, USA.2 Division of Epidemiology, Emory University School of PublicHealth, and the Program against Micronutrient Malnutrition,Atlanta, GA, USA.3 Division of Nutrition, Centers for Disease Control, Atlanta, GA,USA.4 Nutrition Unit, World Health Organization, 1211 Geneva 27,Switzerland. Requests for reprints should be sent to Dr de Onisat this address.Reprint No. 5478
of anthropometry at both the level of the populationand of the individual are emphasized.
Relation between the indicesThe relative merit of each of the anthropometricindices used in assessing nutritional status has beendiscussed previously (4, 5) but will be reviewed brief-ly with emphasis on certain aspects. The two prefer-red anthropometric indices for nutritional status areweight-for-height and height-for-age, since these dis-criminate between different physiological and bio-logical processes (4). In some situations the concemshould be with low weight-for-height (i.e., wastingor thinness), a condition that reflects a failure to gainweight or a loss of weight. One advantage of weight-for-height is that is can be calculated without know-ing age, which makes it useful in populations that donot record dates of birth or for whom such informa-tion is unavailable or unreliable. In other situationswhere wasting is not a major problem, low height-for-age (i.e., stunting, short stature, or linear growthretardation) may be of primary concem because ahigh prevalence of low height-for-age is frequentlyassociated with poor overall economic conditionsand/or repeated exposure to adverse conditions (6, 7).Weight-for-age is primarily a composite index ofboth weight-for-height and height-for-age and failsto distinguish tall, thin children from those who areshort with adequate weight. The use of weight-for-age for predicting or identifying "wasted" childrenwas found to have a low sensitivity and specificity inthree U.S. populations (8).
Bulletin of the World Health Organization, 1994, 72 (2): 273-283 © World Health Organization 1994 273

J. Gorstein et al.
Considerations at the population level
The anthropometric assessment of a populationshould assist in identifying groups at risk of poorfunctional outcomes (morbidity and mortality), andwho therefore are in need of further evaluation orintervention. If the prevalence of wasting is high,such as in famines, efforts should be directedtowards providing adequate foods and the preventionand treatment of infectious diseases, including diar-rhoea and measles (9, 10). If the prevalence of stunt-ing is high but the prevalence of wasting is low orclose to normal, as is commonly the case in non-emergency conditions, the appropriate prevention ortreatment strategy needs to be tailored to the causesof stunting within the population. A high prevalenceof stunting is generally associated with low socio-economic status; therefore, efforts aimed at increasingfood availability, dietary quality, hygiene, adequatesupplies of potable water, and prevention and treat-ment of infectious diseases should improve the situa-tion within the population over time. The specificcauses of stunting and their relative importance maydiffer from region to region (11). Because low birthweight has been associated with short stature andlow weight-for-height into early childhood (12), ac-tivities to alleviate factors that lead to low birthweight, such as inadequate nutrition and the lack ofcomprehensive antenatal care, should also have animpact on reducing the prevalence of short statureand low weight-for-height in the current populationand potentially in future generations by decreasingthe prevalence of small matemal size (4, 5, 13).
Using data compiled by WHO (29), an ecologi-cal correlation analysis of 22 African countries hasbeen performed. In these data, the prevalence of lowanthropometry (<-2 standard deviations (SD) forweight-for-age, height-for-age, and weight-for-height)was known by 1-year age intervals for children agedless than 5 years. The prevalence of underweight waspositively correlated with that of stunting and wast-ing (for all age groups, r = 0.61 and 0.64, respective-ly, unpublished data). Very little correlation existedbetween wasting and stunting (r = 0.1). Anotherstudy using ecological correlations found similarresults between wasting and stunting in Africa, but alow correlation within Latin American countries andstronger correlations for Eastem Mediterranean andAsian countries (14). However, as with any ecologi-cal analyses, these results need to be interpretedcautiously because of the potential for fallacies (15).
In populations where the prevalence of under-weight among children is high but the prevalencesof stunting and wasting are unknown, the nature ofthe nutritional problem is unclear and should be in-terpreted within the context of the situation and take
into account other health indicators. For example,Table 1 provides examples of countries where popu-lations have similar prevalences of underweight butdissimilar prevalences of stunting and wasting. In-tervention activities directed towards these differentpopulations would probably be different because, forexample, in COte d'Ivoire and Ethiopia the activitiesshould first be directed towards resolving the causesof wasting, while in Burundi and Morocco the appro-priate intervention should focus on resolving the fac-tors associated with stunting.
Table 1: Comparison of the prevalence of low anthro-pometry from different populationsa
Year of Age range % prevalence of:Country survey (months) Underweight Stunting Wasting
C6te 1986 12-23.9 19.8 19.8 16.5d'lvoireMorocco 1987 12-23.9 20.1 31.8 6.4Ethiopia 1982 24-35.9 40.2 47.7 12.1Burundi 1987 24-35.9 44.9 60.4 3.5a Low anthropometry defined as <-2 standard deviations of themedian of the reference population.
Once an anthropometric study has been complet-ed, the prevalence of low anthropometry should becompared with other populations to assess the sever-ity. Based on the anthropometric assessments per-formed in many countries around the world, pro-posed criteria for assessing the severity of theseindicators are shown in Table 2.
Considerations at the individual level
As mentioned above, weight-for-age fails to distin-guish between short children of adequate bodyweight and tall, thin children. This arises because theweight-for-age index ignores the child's height, andat a given age, taller children tend to be heavier thantheir shorter counterparts. This is illustrated in Table3, which depicts growth data for seven 18-month-oldmales. Children are considered to be of low anthro-
Table 2: Proposed epidemiological criteria for assess-ing severity of undernutrition in populationsa. b
% prevalence:
Indicator Low Medium High Very high
Underweight <10 10.0-19.9 20.0-29.9 >30.0Stunting <20 20.0-29.9 30.0-39.9 .40.0Wasting <5 5.0-9.9 10.0-14.9 .15.0a Undernutrition defined as <-2 standard deviations of themedian of the reference population.b Age <60 months.
WHO Bulletin OMS. Vol 72 1994274

Assessment of nutritional status using anthropometry
pometry if they are <-2 SD of the median of thereference population. The very tall child in example1 in Table 3 would appear to be relatively normalbased on the weight-for-age z-score, but "wasted" ifa weight-for-height z-score is used. This child, whois already "thin", would need to lose 1.7 kg (16% ofhis body weight) in order to be classified as under-weight, whereupon his weight-for-height z-scorewould be -3.7 (see example 2 in Table 3). Examples3 and 4 in Table 3 depict a similar situation for amoderately tall child, and examples 5-7 for a shortchild. When a child is underweight, further assess-ment is necessary to determine whether this is due towasting, stunting, or a combination, because the treat-ment, if necessary, should differ. Nevertheless, in manysituations, weight-for-age may be useful for followinga child over time to identify a downward trend, sincethis often detects acute changes associated with was-ting. It would not be possible to identify whether aslow decline in weight-for-age is due to linear growthretardation, because of gradual inability to maintaintheir weight-for-height status, or both.
The ecological associations between the differ-ent indices at the population level have been dis-cussed previously, but what we really need to knowis the association between the anthropometric indica-tors at the individual level. From additional analysesof survey data from Palestinian refugees (16) andfrom Haiti (17), it was found that there was a strong-er association between wasting and underweight thanbetween stunting and underweight, and relatively lit-tle association between wasting and stunting (unpub-lished data). There is a need to investigate furtherthese associations in other populations.
Children of all ages who have low weight-for-height or who have experienced growth faltering (interms of weight-for-height) are likely to respond pos-itively towards intervention or treatment of thecause(s) of their condition. With height-for-age, inmany populations appropriate treatment of children
under 2 years of age generally results in improvedstature, but for older children treatment will mostprobably have little effect on the child's height-for-age status (5).
The usefulness of the different indicators isdepicted in Table 4. This can depend upon whetherthe information is collected for purposes of diagnos-ing an individual's nutritional problems or for diag-nosing those of a population. At the individual level,weight-for-height would be the index of choice ifone of the main goals of the health providers is toidentify and treat wasted children. Height-for-age isthe index of choice when one of the main goals is toidentify and treat stunted children.
At the population level, weight-for-height andheight-for-age may be useful for identifying sub-groups with a high prevalence of wasting (weight-for-height) or stunting (height-for-age) for directingresources to resolve the problems. In some situationsthe main purpose of calculating height-for-age maybe for use at the population level in order to identifysubgroups with a high prevalence of stunting or forevaluating the effectiveness of interventions directedtowards the population, such as improved waterquality and quantity.
In many populations weight-for-age is the onlyindicator used, primarily because of the simplicity ofcollecting only one measurement. This indicator isclearly inadequate if age is not accurately known,and rounding of age may introduce a substantialsystematic bias (18). In populations where accurateage information is known, weight-for-age must beinterpreted cautiously because of the inability of thisindicator on its own to distinguish between stuntingand wasting.
Other issues not presented in Table 4, but whichneed to be considered with regard to whetherweights and/or heights should be collected includethe following: availability of accurate measuringequipment; training of health care workers to collect
Table 3: Examples of differences in anthropometric status between various 18-month-oldmales of different weights and heights
Weight Height AnthropometryaExample (kg) (cm) WHZ HAZ WAZ Description
1 10.7 88.5 -2.0 2.0 -0.7 Very tall2 9.1 88.5 -3.7 2.0 -2.03 10.2 85.4 -2.0 1.0 -1.1 Moderately tall4 9.1 85.4 -3.2 1.0 -2.05 9.1 79.4 -2.0 -1.0 -2.0 Moderately short6 9.1 76.4 -1.3 -2.0 -2.0 Very short7 8.5 76.4 -2.0 -2.0 -2.5
a WHZ = weight-for-height z-score; HAZ = height-for-age z-score; WAZ = weight-for-age z-score.
WHO Bulletin OMS. Vol 72 1994 275

J. Gorstein et al.
anthropometric
Weight- Height- Weight-for- for- for-
heighta age8 agea
Usefulness in populations where 1 4 4age is unknown or inaccurate
Usefulness in identifying wasted 1 4 3childrenb
Sensitivity to weight change over 1 4 2a short time period
Usefulness in identifying stunted 4 1 2childrenb
a 1 = excellent; 2 = good; 3 = moderate; 4 = poor.b Depends to some extent on the prevalence of wasting andstunting in the population.
information accurately and to interpret the results ofthe measurements correctly; and the amount of timeit takes to perform the measurements. Also, if one ofthe measurements is not collected, the costs of notidentifying undemourished children or of incorrectlyidentifying adequately nourished children as under-nourished need to be considered.
Scale of choiceThe anthropometric indices can be described in termsof z-scores, percentiles, and percent-of-median. Thesemeasures are used to compare a child or a group ofchildren with a reference population to determine"relative" status. The use of a single reference popu-lation provides information on relative status andshould not be regarded as a "standard" or indicatorof "desired" growth (4).
z-ScoresWhen the current Intemational Growth ReferenceCurves were being developed, the curves were nor-malized. For example, with height-for-age, concep-tually, at each age, there is a normal distribution ofheights. This normalization is useful from a statisti-cal point of view because precise individual valuescan be calculated and the distribution of anthropo-metric values from a population can be described interms of means and standard deviations. Because theobserved z-scores from a population are likely to benormally distributed, analytical procedures that assu-me normality, such as t-tests and regression methods,can be used. Recently, Mora has proposed a methodbased on the normality assumption for estimating theprevalence of low anthropometry that identifies theproportion of children who fall outside of the ref-erence population distribution (19).
The proportion of children in a study populationwho fall above or below a cut-off point can easily be
calculated and compared with the reference popula-tion. For example, in the reference population, theproportion of children <-2 SD is 2.3%, and this can
then be compared with the prevalence of low anthro-pometry in the study population.
Percentiles
The calculation of percentiles is also based on thenormalized curves. Percentiles from the referencepopulation have a uniform distribution and may beuseful since they are easy to interpret, but unlikez-scores they are usually not normally distributed(and therefore should not be described in terms ofmeans and standard deviations) and are less useful indescribing the extremes of the distribution.
Percent-of-median
Indices expressed as the percent-of-median can be auseful measure if the distribution around the medianvalue is unknown or if the reference population dis-tribution has not been normalized. In the growthreference populations used prior to the CDC/WHOgrowth reference, the curves were generally not nor-malized and the use of percent-of-median was thereforea convenient way of describing the distribution ofchildren around the median. The percent-of-medianis simpler to calculate than a z-score or percentile.Unfortunately, because the calculation of the per-cent-of-median ignores the distribution of the refer-ence population around the median, the interpreta-tion of a fixed percent-of-median value varies acrossage and height groups. In addition, the interpretationof an arbitrary cut-off value for low anthropometryexpressed as a percent-of-median differs accordingto the index.
Considerations at the population level
In some instances there may be a need to rank popu-lations according to the prevalence of low anthropo-metry in order to prioritize intervention activities. Ifage-specific or age-standardized prevalences are
employed, the use of the different anthropometricscales should have little effect on the ranking. How-ever, if age-specific or standardized information isnot used, the scale of measurement could affect theranking owing to the changing relation of the percent-of-median with the normalized scales (z-score andpercentile) across the age and height groups.
Considerations at the individual level
In many situations, a single weight and heightmeasurement is used to classify children as either"malnourished" or of "normal" nutritional status.
WHO Bulletin OMS. Vol 72 1994
Table 4: Summary of information onindices
276

Assessment of nutritional status using anthropometry
Fig. 1. Comparison of selected z-score and percent-of-median curves, for males, for weight-for-height.
12z-Scores/- 1 /-2
-3/ //
10- %-of-median -----
80/ / /
9 - 70 *607/
8 -1
7-~~~ I
6~~~ *.
55 60 65 70 75 80 85 90 95 100Stature (cm)
(The use of single versus multiple longitudinal mea-surements to identify children who may be at greaterhealth risk is discussed in more detail below). Theuse of z-scores versus percent-of-median can make adifference in the classification of individual children.For example, Fig. 1 compares three z-score levels(-1, -2, and -3 SD) with four percent-of-medianlevels (90, 80, 70, and 60 percent-of-median) forweight-for-height. In Fig. 1, 80 percent-of-mediancorresponds to approximately -1.8 SD at 49 cm,crosses the -2 SD curve at 65 cm, and at 84 cm cor-responds to -2.8 SD. Therefore, in the classificationof wasting, the use of -2 SD versus 80 percent-of-median cut-off points would identify different pro-portions of children at different heights, with the 80percent-of-median cut-off identifying more childrenabove 65 cm and fewer children below 65 cm.
Fig. 2 depicts similar relations with height-for-age, although the relation between z-scores and per-cent-of-medians is somewhat more stable. Afterapproximately 9 years of age the difference betweenz-scores and percent of median begins to vary again(data not shown).
The relation between weight-for-age z-scoresand percent-of-median curves is depicted in Fig. 3.Among children aged less than 10 months, the rela-tion between the two scales is variable and relatively
consistent for the 10-36-month age group. Above 9years of age there is variability between the z-scoreand percent-of-median values, similar to that whichoccurs with height-for-age (data not shown).
As shown in Fig.t 1-3, the relation betweenz-scores and percent-of-median values differs accord-ing to age and height. The interpretation of thez-scores is more straightforward, in that in the refer-ence population there is a fixed percentage of chil-dren who fall below any z-score cut-off value.Because the percent-of-median ignores the distribu-tion around the median, there is no fixed proportionof the reference population that would be expected tofall below a cut-off point for all ages and heights.The z-score and percent-of-median curve would beapproximately the same only if the coefficient ofvariation were to remain constant throughout child-hood. Because the coefficient of variation changes,especially in the first 2 years of life, the z-score andpercent-of-median curves cannot provide the sameinformation. Software can be used to computez-scores, percentiles, and percent-of-median for eachof the three indices with more detail than is possibleusing published tables (20, 21). A summary of theuse of the different scales is shown in Table 5. Ingeneral, the z-score has properties that make it super-ior to the other two scales.
Fig. 2. Comparison of selected z-score and percent-of-median curves, for males, for height-for-age.
an,. ,,
85
80
75
O.-70a)
' 65CO)
60
55
50
0 2 4 6 81012141618202224262830323436Age (months)
WHO Bulletin OMS. Vol 72 1994
z-Scores-1-2--3%/o-of-median - ---
9080 /D /
:70,60
f! ~~FELS
7/A,'1,I, 1, 1, 1 ,.1 ,, , I
Ar% ,., .. ... .. ._L
I
X,.,
le.
11.
.0.0, .
.1.1
10
I .01
NCHS11111111111
277

J. Gorstein et al.
Fig. 3. Comparison of selected z-score and percent-of-median curves, for males, for weight-for-age.
12
11
10
X'- 7
Z6
0Age (months)
Limitations of the current referenceThe CDC/WHO reference curves are now widelyused throughout the world and provide a useful ref-erence against which a population's status may beevaluated. The reference has been described in detailelsewhere, and hence we highlight only its limita-tions here (2, 23). The rationale for the use of a ref-erence has also been described previously (4, 24).
Table 5: Summary of the use of anthropometric scales
Percent-z-Scores Percentiles of-median
Uses normalized curves Yes Yes NoInterpretation of extreme Yes Yes Novalues consistent acrossage and height groupsa
Interpretation of cut-off value Yes Yes Noconsistent across indicesb
Ability to identify children Good Poor Goodwith extreme values
Values from a study population Yes No Yescare distributed normally
a The physiological meaning or consequences of extreme val-ues may differ across age and height groups.b For example, 80 percent of median is about -4 SD for height-for-age, but about -2 SD for weight-for-age.c May be skewed to upper values in weight-for-height andweight-for-age curves.
The reference curves were derived from two dif-ferent populations. For children under 36 months ofage, data collected by the FELS Research Institutewere used, while for children aged 2-18 years datafrom a combination of U.S. representative cross-sec-tional health surveys performed by the National Cen-ter for Health Statistics (NCHS) were used. Thereare important differences between the two data setsand these are depicted in Table 6. Because the refer-ence is derived from two distinct cohorts, the growthcurves for each of the three indices are generallydivided into two age categories: birth to 36 monthsand 2-18 years of age. Computer software packagesthat compute anthropometric values (such as Anthro,Epi Info, and EpiNut) generally use the FELS curvesup to the second birthday (23.99 months of age) andthen the NCHS curves for children aged .2 years(20-22).
There are critical differences between the FELSand NCHS curves in the age range (for height-for-age and weight-for-age) and height range (forweight-for-height) where the two curves overlap,causing a "disjunction" (2). There are two reasonsfor this. First, stature (linear growth) was measureddifferently in the two populations; recumbent lengthswere collected for FELS data, while standing heightswere measured for the NCHS data. Recumbentlengths are, on the average, greater than standingheights by approximately 0.5 cm. The effect of recum-bent length versus standing height has a relativelysmall impact on anthropometric calculations.
The second and more important reason for thedisjunctions arise because of differences in the refer-ence population characteristics and study design(Table 6). The FELS data were collected fromWhite, middle-class children followed longitudinal-ly, while the NCHS data were derived from cross-sectional surveys representative of all U.S. children,including non-Whites and children from lowerincome households. This disjunction is due to differ-ences between the median values of the two popula-tions as well as differences in the distribution aroundthe median. In general, the FELS children were tallerand thinner than the NCHS children. The disjunctionat the second birthday can be seen in Fig. 2 and 3,
Table 6: Comparison of the data sets used in theCDCIWHO growth reference
Data Represen- Age range Stature Studysource tative?a (years) measurement designFELS No 0.0-2.99 Recumbent LongitudinalNCHS Yes 2.0-17.99 Standing Cross-sectionala Representative of the entire U.S. population.
WHO Bulletin OMS. Vol 72 1994
7 FELS NCHS
2 4 6 81012141618202224262830323436
278

Assessment of nutritional status using anthropometry
and the disjunction at 85 cm, (the average height forchildren on their second birthday) in Fig. 1.
The growth reference curves also have age andheight limitations for the three indices, and these areshown in Table 7. Note that there are no weight lim-itations. The most severe limitations occur withweight-for-height, where the minimum and maxi-mum height limitations make it impossible to calcu-late weight-for-height for many children less thanapproximately 2 months of age (minimum height49 cm) or above approximately 9 years for girls and11 years of age for boys, respectively. The reason forthis is that weight-for-height is not independent ofage in the older children and that there is a greatervariability in the weights and heights of children asthey enter puberty.
Considerations at the population level
It has been suggested that anthropometric data fora population be presented by age groups (4, 5, 25).An important aspect of the presentation of the age-specific data is at the second birthday, where dis-junction occurs. This is particularly critical when acomparison is made between two or more popula-tions or between cross-sectional surveys within ageographical area, where apparent differences inanthropometric status between groups could be dueentirely to differences in the age distributions of thegroups. Since such differences between populationsare often used for targeting programme resources, itis critical to identify correctly the groups at the great-est physiological risk.
In evaluating the age-specific prevalence of lowanthropometry surveys from around the world, theimprovement generally observed in height-for-age,weight-for-height, and weight-for-age in compari-sons of children aged <2 years with those aged.2 years can be attributed, to a great extent, to thedisjunction of the growth reference curves. It shouldbe emphasized that important biological, sociologi-cal, and behavioural changes occur around a child'ssecond birthday, and an improvement in anthropo-
Table 7: Age and height limitations for the CDC/WHOInternational growth reference curvesa
Age limitation Height limitation(years) (cm)
Mini- Maxi- Mini- Maxi-Index Sex mum mum mum mum
Weight-for-height Males Birth 11.49 49 145Females Birth 9.99 49 137
Weight-for-age Both Birth 17.99 None NoneWeight-for-age Both Birth 17.99 None Nonea There are no weight limitations.
metric status may reflect a true change in health sta-tus. Nevertheless, within a population we cannotclearly discriminate between what portion of thischange is attributable to the disjunction in the refer-ence population or is the result of physiologicalchange.
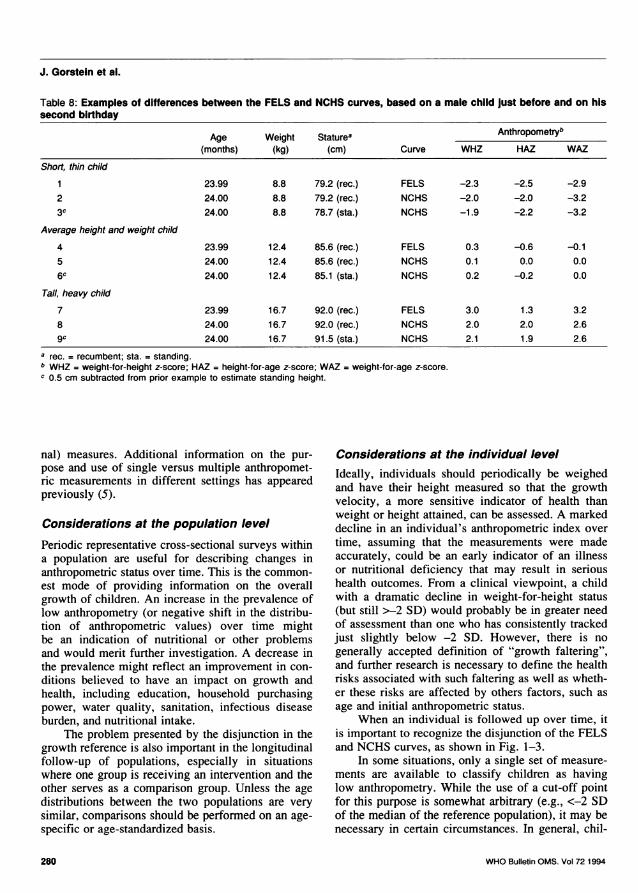
Considerations at the individual levelThe impact of the disjunction in the growth curveshas a similar effect on monitoring the growth ofindividuals as that of populations. The data in Table 8illustrate the effects of the FELS and NCHS curves onindividual growth assessment. In Table 8, example 1displays data for a short, thin male child just beforehis second birthday; in example 2, the same child'sstatus is assessed on his second birthday. Note thechanges in the child's z-score values with a changein age of less than one day, with the height-for-agez-score and the weight-for-height z-score improving,and the weight-for-age z-score getting worse.
Example 3 shows the results of correcting therecumbent height by subtracting 0.5 cm to estimatethe standing height. While this has no effect on theweight-for-age z-score, it slightly reduces the differ-ence in the height-for-age z-scores between examples1 and 3 but slightly increases the difference betweenthe weight-for-height z-scores. Examples 4-6 in Table8 deal with a child of average height and weight,while examples 7-9 are for a tall, heavy child. Ingeneral, the disjunction of the growth referencecurves tends to have a more pronounced effect onindividuals at the extremes of the distributions and alesser effect on those near the median, primarilybecause of the differences in the widths of the distri-butions for the FELS and NCHS populations. Inaddition, the correction of recumbent lengths tostanding heights by subtracting 0.5 cm makes littledifference at the level of the individual.
When an individual child's growth is trackedover time, an effect similar to that observed at thepopulation level is noted. When children reach 2years of age, dramatic changes may occur in theirheight-for-age, weight-for-height, and weight-for-ageindices, due primarily to the disjunction of the tworeference curves.
Single versus multiplemeasurementsMany different study designs have been employed toassess the nutritional status of populations and indi-viduals. In this section we discuss the implications ofusing a single cross-sectional measurement to classi-fy populations or children with low anthropometriclevels compared with the use of multiple (longitudi-
WHO Bulletin OMS. Vol 72 1994 279
J. Gorstein et al.
Table 8: Examples of differences between the FELS and NCHS curves, based on a male child just before and on hissecond birthday
Age Weight Staturea Anthropometryb(months) (kg) (cm) Curve WHZ HAZ WAZ
Short, thin child
1 23.99 8.8 79.2 (rec.) FELS -2.3 -2.5 -2.92 24.00 8.8 79.2 (rec.) NCHS -2.0 -2.0 -3.23c 24.00 8.8 78.7 (sta.) NCHS -1.9 -2.2 -3.2
Average height and weight child
4 23.99 12.4 85.6 (rec.) FELS 0.3 -0.6 -0.15 24.00 12.4 85.6 (rec.) NCHS 0.1 0.0 0.06c 24.00 12.4 85.1 (sta.) NCHS 0.2 -0.2 0.0
Tall, heavy child
7 23.99 16.7 92.0 (rec.) FELS 3.0 1.3 3.28 24.00 16.7 92.0 (rec.) NCHS 2.0 2.0 2.6gc 24.00 16.7 91.5 (sta.) NCHS 2.1 1.9 2.6
a rec. = recumbent; sta. = standing.b WHZ = weight-for-height z-score; HAZ = height-for-age z-score; WAZ = weight-for-age z-score.c 0.5 cm subtracted from prior example to estimate standing height.
nal) measures. Additional information on the pur-pose and use of single versus multiple anthropomet-ric measurements in different settings has appearedpreviously (5).
Considerations at the population level
Periodic representative cross-sectional surveys withina population are useful for describing changes inanthropometric status over time. This is the common-est mode of providing information on the overallgrowth of children. An increase in the prevalence oflow anthropometry (or negative shift in the distribu-tion of anthropometric values) over time mightbe an indication of nutritional or other problemsand would merit further investigation. A decrease inthe prevalence might reflect an improvement in con-ditions believed to have an impact on growth andhealth, including education, household purchasingpower, water quality, sanitation, infectious diseaseburden, and nutritional intake.
The problem presented by the disjunction in thegrowth reference is also important in the longitudinalfollow-up of populations, especially in situationswhere one group is receiving an intervention and theother serves as a comparison group. Unless the agedistributions between the two populations are verysimilar, comparisons should be performed on an age-specific or age-standardized basis.
Considerations at the individual levelIdeally, individuals should periodically be weighedand have their height measured so that the growthvelocity, a more sensitive indicator of health thanweight or height attained, can be assessed. A markeddecline in an individual's anthropometric index overtime, assuming that the measurements were madeaccurately, could be an early indicator of an illnessor nutritional deficiency that may result in serioushealth outcomes. From a clinical viewpoint, a childwith a dramatic decline in weight-for-height status(but still >-2 SD) would probably be in greater needof assessment than one who has consistently trackedjust slightly below -2 SD. However, there is nogenerally accepted definition of "growth faltering",and further research is necessary to define the healthrisks associated with such faltering as well as wheth-er these risks are affected by others factors, such asage and initial anthropometric status.
When an individual is followed up over time, itis important to recognize the disjunction of the FELSand NCHS curves, as shown in Fig. 1-3.
In some situations, only a single set of measure-ments are available to classify children as havinglow anthropometry. While the use of a cut-off pointfor this purpose is somewhat arbitrary (e.g., <-2 SDof the median of the reference population), it may benecessary in certain circumstances. In general, chil-
WHO Bulletin OMS. Vol 72 1994280

Assessment of nutritional status using anthropometry
dren with low anthropometry have, on the average, ahigher risk of adverse outcomes, with some studiesdemonstrating a threshold effect with the risk ofmortality increasing (26).
Conclusions and recommendationsThe tracking of an individual child's weight-for-height z-scores on growth curves is a sensitive indi-cator of short-term nutritional status. Children withgrowth faltering can be assessed further to determineits cause, such as whether it is due to infectious dis-eases or inadequate nutrient intake. At the populationlevel the weight-for-height status is useful for assess-ing short-term nutritional problems.
If the age is accurately known, an individualchild's height-for-age z-score should be tracked toassess linear growth. In developing countries, treat-ment for stunting may not be readily apparent. If thechild has also a low weight-for-height or his/herweight-for-height is faltering, the child should beassessed as described above. If the child has normalweight-for-height but low height-for-age, the mostappropriate treatment at the individual level is notobvious. If one of the causes of stunting in a popula-tion is found to be due, in part, to micronutrient defi-ciencies, inadequate protein intake, intensity of para-site infection (27), or other cause, this informationcould be used to prevent further stunting of individu-al children, and even to reverse the process to someextent. At the population level, a high prevalence ofstunting should result in the initiation of activitiesdirected towards factors associated with stuntingwithin the population, although unless there is animprovement in the socioeconomic status of thepopulation, there may be little impact on the overallprevalence of stunting.
The use of weight-for-age alone for trackingindividual children has been an important tool forgrowth monitoring, but should be used only in popu-lations where accurate age information is available.(Once a child's date of birth is estimated and usedconsistently, growth charts for weight-for-age andheight-for-age may be useful for tracking a child'santhropometric status but not for comparison with acut-off value.) Without a height measurement it isdifficult to determine whether growth faltering is aresult of inadequate weight gain (or loss of weight),an inadequate growth in height, or both (5). How-ever, severe faltering over a short period is mostprobably due to inadequate weight gain or weightloss. It would be difficult to attribute a mild growthfaltering over a longer time period to either inad-equate weight gain or inadequate height gain. At thepopulation level, a high prevalence of underweight inthe absence of height data does not fully describe the
type of nutritional problem(s) the population may beexperiencing, whether wasting or stunting. In areaswhere weight-for-age has been the traditional indexused for growth monitoring, and where it may not bepractical to collect the lengths or heights of all chil-dren, a two-step evaluation may be useful. In this sit-uation, children are monitored using weight-for-agegrowth charts; those found to be faltering in growthor below a selected cut-off value would have theirlength or height measured to assess their weight-for-height and height-for-age. The specific weight-for-age cut-off depends upon the following: the index ofprimary interest (weight-for-height versus height-for-age or both); the prevalence of low weight-for-heightor low height-for-age in the population; and thedesired levels of sensitivity and specificity.
Many anthropometric classification schemesattach a label for those with low anthropometry, suchas "mild", "moderate", or "severe" malnutrition;"wasted" or "stunted". Such labels may be mislead-ing. Not all children who fall below a cut-off aremalnourished, and not all children who are above thecut-off are well nourished (28). The use of a cut-offshould be thought of as a screening device to identi-fy children who are more likely to be undernour-ished. Further evaluation is necessary to distinguishchildren who have low anthropometry but arehealthy from those who are undernourished due tolack of proper nutrition and/or organic conditions.
When the anthropometric status of a populationis described, the results should always be given byage group (if the age information is accurate) (5, 25).For purposes of comparing the prevalence of lowanthropometry data between different geographicalareas, it is sometimes preferable to have a summarymeasure. One way to address this issue would be tostandardize the age-specific information using a stan-dard age distribution, which would permit reasonablecomparisons to be made between populations.
If age is not known, the presentation of weight-for-height data should be provided by dividing thepopulation into at least two height groups: <85 cmand >85 cm (85 cm is the average height for childrenaged 24 months). In addition, if age is unknown, theFELS curves are used for children <85 cm and theNCHS data for those >85 cm.
Anthropometry has been an extremely usefultool for determining the nutritional status of bothindividuals and populations. This article has sum-marized some of the important issues to consider indetermining which index or indices to use (weight-for-height versus height-for-age versus weight-for-age), which scale to use (z-scores versus percenitilesversus percent-of-median), and some of the limita-tions of the growth curves that affect the interpreta-tion of anthropometry.
WHO Bulletin OMS. Vol 72 1994 281
J. Gorstein et al.
AcknowledgementsWe thank Dr M. Dibley, Dr S. Burger, and Ms S. Pak fortheir helpful comments.
Resume
Questions soulev6es par l'utilisation del'anthropom6trie pour 6valuer l'6tatnutritionnelL'utilisation et l'interpr6tation des methodes anthro-pometriques soulevent quatre questions au niveaude la population et de l'individu. La premiere portesur le choix du ou des indices: poids/taille, taille/age ou poids/age. Ce choix d6pend de nombreuxfacteurs et aucun indice ne convient parfaitementa toutes les situations. Les deux indicateursanthropometriques pref6r6s pour 6valuer l'etatnutritionnel sont le rapport poids/taille et le rapporttaille/age, car ils permettent de distinguer deuxprocessus physiologiques et biologiques diff6-rents. Le rapport poids/age est essentiellement unindice composite r6sultant de la combinaison desdeux pr6c6dents, et il ne permet pas de distinguerles enfants grands et maigres de ceux qui sontpetits, mais dont le poids est normal. Des criteressont propos6s pour evaluer la gravite descarences mesurees par les indices anthropom6-triques au sein d'une population.
La seconde question concerne le choix de1'6chelle utilis6e pour l'indice: valeurs Z (ou 6carts-types), centiles ou pourcentages par rapport a lam6diane. La premiere est superieure aux deuxautres pour plusieurs raisons: elle repose sur descourbes normalisees; les valeurs extremes sontinterpretees de la meme faqon, quel que soit legroupe d'age ou de taille; I'interpr6tation desvaleurs seuils (par exemple <-2 ET) est 6gale-ment la meme pour tous les indices; cette 6chelleest utile pour identifier les enfants pr6sentant desvaleurs extremes; dans la plupart des populations6tudi6es, les valeurs pr6sentent une distributionnormale, ce qui permet d'utiliser des m6thodesstatistiques fondees sur cette hypothese.
La troisieme question concerne les limites dusysteme actuel de r6f6rence pour la croissance.La principale de ces limites est due au d6calageentre les courbes de croissance a I'age de deuxans, du fait de l'utilisation de deux populations der6f6rence diff6rentes. 11 est important de recon-naitre 1'existence de ce d6calage pour pouvoirinterpr6ter correctement les indices anthropom6-triques des enfants appartenant a ce grouped'age. D'autres limites s'appliquent 6galement a
I'age et a la taille pour le calcul du rapport poids/taille.
Enfin, I'article passe en revue certaines ques-tions concernant les avantages compares desdonn6es anthropom6triques transversales (mesu-re unique) et longitudinales (mesures multiples).Pour rendre compte des caracteristiques anthro-pom6triques d'une population, il convient de pre-senter les resultats par groupe d'age lorsque lesdonn6es relatives a l'age sont fiables. Si tel n'estpas le cas, la population doit etre divis6e en aumoins deux groupes en fonction de la taille(<85 cm et .85 cm), pour la pr6sentation du rap-port poids/taille, 85 cm 6tant la taille moyenne desenfants ag6s de 24 mois dans la population der6f6rence.
References1. Dibley MJ et al. Development of normalized curves
for the international growth reference: historical andtechnical considerations. American journal of clinicalnutrition, 1987, 46: 736-748.
2. Dibley MJ et al. Interpretation of z-score anthropo-metric indicators derived from the internationalgrowth reference. American journal of clinical nutri-tion, 1987, 46: 749-762.
3. National Center for Health Statistics. In: Hamill,PVV et al., eds. Growth curves for children birth-18 years United States. Washington, DC, NationalCenter for Health Statistics (Vital and health statis-tics. Series 11: No. 165 (DHEW publication (PHS)#78-1650)), 1977.
4. WHO Working Group. Use and interpretation ofanthropometric indicators of nutritional status. Bul-letin of the World Health Organization, 1986, 64:929-941.
5. Beaton G et al. Appropriate uses of anthropometricindices in children. Geneva, United Nations, 1990(ACC/SCN Nutrition Policy Discussion Paper No. 7).
6. Keller W. The epidemiology of stunting. In: Water-low JC, ed. Linear growth retardation in less devel-oped countries. New York, Raven Press, 1988:17-34.
7. Martorell R et al. Poverty and stature in children.In: Waterlow JC, ed. Linear growth retardation inless developed countries. New York, Raven Press,1988: 57-70.
8. Sullivan KM et al. Weight-for-age as a screeningtool for finding children who are low weight-for-height. In: Abstracts of the 116th Annual Meeting ofthe American Public Health Association, Chicago,IL, 13-17 November 1988. Washington, DC, Ameri-can Public Health Association, 1989: 88.
9. Toole MJ, Waldman RJ. Prevention of excess mor-tality in refugee and displaced populations in devel-oping countries. Journal of the American MedicalAssociation, 1990, 263: 3296-3302.
10. de Ville de Goyet C et al. The management of nutri-tional emergencies in large populations. Geneva,
282 WHO Bulletin OMS. Vol 72 1994

Assessment of nutritional status using anthropometry
World Health Organization, 1978.11. Leon ME et al. Identifying the malnourished within
Peru: regional variation in the performance of anutrition indicator. International journal of epidemiol-ogy, 1990, 19: 214-216.
12. Binkin NJ et al. Birth weight and childhood growth.Pediatrics, 1988, 82: 828-834.
13. Kramer M. Prevalence of low birth weight in theworld. Bulletin of the World Health Organization,1987, 65: 663-737.
14. Victora CG. The association between wasting andstunting: an international perspective. Journal ofnutrition, 1992, 122: 1105-1110.
15. Kelsey JL et al. Methods in observational epidemi-ology. New York, Oxford University Press, 1986:204-208.
16. Yip R et al. The value of long-term population moni-toring: the example of Palestine refugees. In:Abstracts of the 118th Annual Meeting of the Ameri-can Public Health Association, Atlanta, GA, 30 Sep-tember-4 October 1990. Washington, DC, AmericanPublic Health Association, 1991.
17. Centers for Disease Control. Nutritional assess-ment of children in drought-affected areas - Haiti,1990. Morbidity and mortality weekly report, 1991,40: 222-225.
18. Gorstein J. Assessment of nutritional status: effectsof different methods to determine age on the clas-sification of undernutrition. Bulletin of the WorldHealth Organization, 1989, 67: 143-150.
19. Mora JO. A new method for estimating a standard-ized prevalence of child malnutrition from anthropo-metric indicators. Bulletin of the World HealthOrganization, 1989, 67: 133-142.
20. Sullivan K et al. Pediatric anthropometry. The epi-demiology monitor, 1991, 12: 3-6.
21. Sullivan KM et al. Use and availability of anthro-pometry software. Food and nutrition bulletin, 1990,12: 116-119.
22. Fichtner RR et al. Report of the technical meetingon software for nutritional surveillance. Food andnutrition bulletin, 1989, 11: 57-61.
23. Yip R et al. International growth reference for childgrowth: current research and future plans. In: KimWha Young et al., eds. Proceedings of the 14thInternational Congress of Nutrition, Seoul, 20-25August 1989, vol 11. Seoul, Ewha Women's Universi-ty, 1989: 150-151.
24. Sullivan K et al. Growth references. Lancet, 1991,337: 1420-1421.
25. Waterlow JC et al. The presentation and use ofheight and weight data for comparing the nutritionalstatus of groups of children under the age of 10years. Bulletin of the World Health Organization,1977, 55: 489-498.
26. Chen LC et al. Anthropometric assessment of ener-gy-protein malnutrition and subsequent risk of mor-tality among preschool aged children. Americanjournal of clinical nutrition, 1980, 46: 749-762.
27. de Lima e Costa MFF et al. Anthropometric meas-ures in relation to schistosomiasis mansoni andsocioeconomic variables. International journal of epi-demiology, 1988, 17: 880-886.
28. Trowbridge FL. Clinical and biochemical character-istics associated with anthropometric nutritional cat-egories. American journal of clinical nutrition, 1979,32: 758-766.
29. de Onis M, Monteiro C, Akre J et al. The world-wide magnitude of protein-energy malnutrition: aoverview from the WHO Global Database on ChildNutrition. Bulletin of the World Health Organization,1993, 71: 703-712.
WHO Bulletin OMS. Vol 72 1994 283