ISSUE PANEL REPORT: DIETARY REFERENCE INTAKES AND DIETARY...
62
-
Upload
nguyendang -
Category
Documents
-
view
222 -
download
0
Transcript of ISSUE PANEL REPORT: DIETARY REFERENCE INTAKES AND DIETARY...


ISSUE PANEL REPORT: DIETARY REFERENCE INTAKES AND DIETARY
GUIDELINES IN OLDER AMERICANS ACT NUTRITION PROGRAMS
CONTENTS
PART 1: SUMMARY OF ISSUE PANEL
Prepared by Cogent Research
PART 2: BACKGROUNDER AND WORKING DOCUMENTS
Prepared by the National Policy and Resource Center on Nutrition and Aging
PART 3: DIRECTORY OF ISSUE PANELISTS
The National Policy and Resource Center on Nutrition and Aging at Florida International University is supported, in part, by grant number 90AM2390 from the Administration on Aging, Department of Health and Human Services, Washington, DC 20201. Grantees undertaking projects under government sponsorship are encouraged to express freely their findings and conclusions. Points of view or opinions do not, therefore, reflect official Department of Health and Human Services policy.

PART 1
SUMMARY OF THE ISSUE PANEL
HELD ON FEBRUARY 11TH, 2002

DIETARY REFERENCE INTAKES
AND DIETARY GUIDELINES
IN OLDER AMERICANS ACT NUTRITION PROGRAMS
PART 1: SUMMARY OF THE ISSUE PANEL HELD ON FEBRUARY 11TH , 2002
Conducted for:
National Policy and Resource Center on Nutrition and Aging
Florida International University
Miami, FL
Conducted by:
Cogent Research
6/12/2002

i
PANEL ON DIETARY REFERENCE INTAKES AND DIETARY GUIDELINES
IN OLDER AMERICANS ACT NUTRITION PROGRAMS
YVONNE BRONNER, ScD, RD, Director, Public Health Program, Morgan State University, Baltimore, MD
DOUGLAS BUCK, PhD, FACN, State Nutritionist, Connecticut Department of Social and Elderly Services, Hartford, CT
JOSEPH CARLIN, MS, RD, FADA, Regional Nutritionist, Administration on Aging, Boston, MA
NOEL CHAVEZ, PhD, RD, Associate Professor, School of Public Health, University of Illinois, Chicago, IL
JENNIFER DRZIK, MS, RD, LD, State Nutritionist, Maryland Department of Aging, Baltimore, MD
JOHANNA DWYER, DSc, RD, Assistant Administrator, Human Nutrition, USDA, Agricultural Research Service, Washington, DC
EDWARD FRONGILLO, Jr., PhD, Associate Professor, Cornell University, Ithaca, NY
NANCY GASTON, MA, RD, Senior Nutritionist, USDA, Center for Nutrition Policy and Promotion, Alexandria, VA
JULIE HODGES, PhD, RD, FADA, Director, Health Care Services, Zartic Foods, Inc., Rome, GA
BERTHA HURD, BS, Nutritionist, Department of Aging, City of Los Angeles, CA
YVONNE JACKSON, PhD, RD, Director, Office of American Indian, Alaskan Native and Native Hawaiian Programs, Administration on Aging, Washington, DC
GORDON JENSEN, MD, PhD, Director, Vanderbilt Center for Human Nutrition, Nashville, TN
FLORISTENE JOHNSON, MS, RD, Senior Aging Program Specialist, Administration on Aging, Dallas, TX
MARY ANN JOHNSON, PhD, Professor, University of Georgia, Athens, GA
LINDA LAVINE, RD, LD/N, Corporate Dietitian, GA Food Service, Inc., St. Petersburg, FL
JEAN LLOYD, MS, RD, Nutritionist, Administration on Aging, Washington, DC
BRIAN LUTZ, Acting Director, Office for Community-Based Services, Administration on Aging, Washington, DC
KATHRYN McMURRY, MS, Nutrition and Food Science Advisor, Office of Disease Prevention and Health Promotion, US Department of Health and Human Services, Washington, DC

ii
LINDA MEYERS, PhD, Deputy Director, Food and Nutrition Board, Institute of Medicine, Washington, DC
LINDA NETTERVILLE, MA, RD, Nutrition Program Manager, Johnson County Area Agency on Aging, Olathe, KS
DEBRA NICHOLS, MD, MPH, Public Health Advisor, Office of Disease Prevention and Health Promotion, US Department of Health and Human Services, Washington, DC
JO ANN PEGUES, MPA, RD, Regional Nutritionist, Administration on Aging, Denver, CO
MARTHA PEPPONES, MS, RD, Nutrition Director, Senior Services of Snohomish County, Mukilteo, WA
ROBERT RUSSELL, MD, Director and Senior Scientist, Jean Mayer USDA Human Nutrition Research Center on Aging, Tufts University, Boston, MA
JOE SHARKEY, MPH, RD, Nutritionist and Doctoral Candidate, University of North Carolina, Chapel Hill, NC
SUE ZEVAN, RD, State Nutritionist, Aging and Adult Administration, Department of Economic Security, Phoenix, AZ
National Policy and Resource Center on Nutrition and Aging at Florida International University, Miami, FL
LESTER ROSENZWEIG, MS, RD, Associate Director
PEGGY SCHAFER, RD, Graduate Assistant
HEIDI SILVER, PhD, RD, CNSD, Associate Director of Research
DIAN WEDDLE, PhD, RD, FADA, Associate Professor and Co-Director
NANCY WELLMAN, PhD, RD, FADA, Professor and Director

iii
TABLE OF CONTENTS
LIST OF ISSUE PANELISTS Page i
INTRODUCTION Page 1
DISCUSSION TOPICS
1. Why must Older Americans Act Nutrition Program meals meet the most current Recommended Dietary Allowances and Adequate Intakes (as components of the Dietary Reference Intakes), and the 2000 Dietary Guidelines for Americans? Page 3
2. Must each Older Americans Act Nutrition Program meal individually meet these requirements? Page 4
3. Assuming that all Older Americans Act Nutrition Program meals are culturally appropriate, what nutrients should be targeted? Page 7
4. How can Older Americans Act Nutrition Program meals be evaluated for meeting the Recommended Dietary Allowances, Adequate Intakes, and 2000 Dietary Guidelines? Page 8
5. How can Older Americans Act Nutrition Program meals be adjusted to meet special dietary needs? Page 9
6. How can nutrition services, including nutrition screening, education, and counseling, incorporate the Dietary Reference Intakes, 2000 Dietary Guidelines, and targeted nutrients recommendations? Page 10
7. What nutrition-related issues need attention at future Issue Panels and/or in outcomes research? Page 12
SUMMARY OF TOPICS AND RECOMMENDATIONS Page 13

1
INTRODUCTION
This report summarizes discussion and recommendations of the Issue Panel on Dietary Reference Intakes and Dietary Guidelines in Older Americans Act Nutrition Program (Nutrition Program). The National Policy and Resource Center on Nutrition and Aging (Center) convened the Issue Panel on February 11, 2002 in Baltimore, Maryland. Cogent Research staff assisted in the design of the meeting and served as facilitators. Panelists included nutrition and aging researchers; individuals involved in policy development; federal, state, and local program administrators; and food industry representatives.
Congress re-authorized the Older Americans Act (OAA) in 2000 for five years. The OAA requires that Nutrition Programs meet the Dietary Guidelines for Americans published by the Secretaries of Health and Human Services and Agriculture, and the Recommended Dietary Allowances (RDAs) established by the Food and Nutrition Board, Institute of Medicine, National Academy of Sciences (NAS), but does not specify using the most recent versions. However, the National Nutrition Monitoring and Related Research Act of 1990 (Public Law 101-445) requires that the Secretaries of Health and Human Services and Agriculture contract with a scientific body, such as the NAS, to publish reports on nutrient requirements and status of the United States on a two to five year basis, as well as develop Dietary Guidelines every five years. The law requires that all federal food, nutrition, and health programs promote these requirements. Thus, the Dietary Reference Intakes (DRIs) and Dietary Guidelines (DGs) serve as the cornerstone for federal nutrition policy.
It is understood that any new standards supercede previous ones. Specifying a date/version for these standards in the OAA is not necessary. New versions include new information. For example, the DRIs (which include RDAs) have gender-specific reference values for two “Life Stage Groups” – ages 51 to 70 and >70 years – whereas the 1989 RDAs only had gender-specific reference values for a single age category, 51+ years.
Likewise, the 2000 DGs differ from past versions. Several Guidelines were reworded, and their order of importance was changed to reflect emerging science and public health issues. For example, the Guideline on fat now emphasizes the need to reduce consumption of saturated fat and also recognizes the role of trans fatty acids in hypercholesterolemia. In addition, new Guidelines, such as the one on food safety, were added in recognition of new concerns. Unlike the DRIs, the DGs are not quantitative. They provide general direction on how to include nutrient components in dietary intake to promote health, eg, “make low-fat choices.”
There may be some confusion among nutritionists and administrators within the aging network regarding which nutrient standards (and which new values, if there are differences in age groups and/or gender) should be used in Nutrition Program implementation. Some Nutrition Programs have begun using the DRIs and 2000 DGs when planning menus and also when designing, implementing, and assessing other nutrition services, but many have not.
2
Thus, the purpose of the Issue Panel was to discuss the rationale for and the use of the DRIs and 2000 DGs when providing OAA nutrition services, including nutrition education, nutrition counseling, and congregate and home-delivered meals. Panelists had focused discussions on six topics regarding nutrition recommendations for the Administration on Aging (AoA). This report includes a summary of the discussion and the recommendations. Discussion built toward consensus whenever possible. However, given limited time, there were some issues that panelists were not able to resolve. In those cases, this summary presents the various perspectives of the panelists.
Discussion Topics:
1. Why must Older Americans Act Nutrition Program meals meet the most current Recommended Dietary Allowances and Adequate Intakes (as components of the Dietary Reference Intakes), and the 2000 Dietary Guidelines for Americans?
2. Must each Older Americans Act Nutrition Program meal individually meet these requirements?
3. Assuming that all Older Americans Act Nutrition Program meals are culturally appropriate, what nutrients should be targeted?
4. How can Older Americans Act Nutrition Program meals be evaluated for meeting the Recommended Dietary Allowances, Adequate Intakes, and 2000 Dietary Guidelines?
5. How can Older Americans Act Nutrition Program meals be adjusted to meet special dietary needs?
6. How can nutrition services, including nutrition screening, education, and counseling, incorporate the Dietary Reference Intakes, 2000 Dietary Guidelines, and targeted nutrients recommendations?
7. What nutrition-related issues need attention at future Issue Panels and/or in outcomes research?
The Issue Panel format generated much excitement among panelists regarding using a similar model to address nutrition and aging issues in the future. At the end of the meeting, panelists devoted time to discussion topic #7, ie, developing a list of other topics they would like to see addressed in future issue panels. The list is presented on the last page of this summary.
This summary is Part 1 of a two-part report. Part 2 is the background information, data, references, tables, and panel directory prepared as a backgrounder by the National Policy and Resource Center on Nutrition and Aging.

3
DISCUSSION TOPICS
TOPIC #1. Why must Older Americans Act Nutrition Program meals meet the most current Recommended Dietary Allowances and Adequate Intakes (as components of the Dietary Reference Intakes), and the 2000 Dietary Guidelines for Americans?
Panelists agreed nearly unanimously that meals must meet the most current RDAs and Adequate Intakes (AIs), and the 2000 DGs, given the wording of the OAA and other fundamental reasons for this action.
a. The DRIs and 2000 DGs offer the best scientific evidence as to the nutrient levels most appropriate for older adults.
There are many critical differences between the DRIs and the 1989 RDAs that make the DRIs better for guidance. Unlike the 1989 RDAs, which only had gender-specific reference values for a single age category (51+ years), the DRIs have gender-specific reference values for individuals aged 51 to 70 and those over 70 years. Additionally, the DRIs make distinction among four levels of dietary values. While the DRIs include RDAs, they also provide EARs (the estimated average requirement, the level that meets the nutrient needs of half the population) for group assessment and AIs (adequate intakes when scientific evidence is inadequate to establish an EAR). Further, the DRIs have ULs (tolerable upper intake levels), indicating the highest average daily nutrient intake level that poses no risk of adverse health effects.
The emphasis on certain topics in the 2000 DGs also differs from earlier versions. These topics reflect emerging science and are consistent with public health messages from other federal agencies. In addition to changes in the Guideline on fat and addition of the Guideline on food safety (see Introduction), the 1995 fruits, vegetables, and grains guideline was separated into two guidelines in 2000 because of differences in nutrient content of these food groups and because barriers to the consumption of fruits and vegetables are different than those for grains.
b. The DRIs and 2000 DGs provide a sound structure for nutrition program standards.
This structure can serve as the backbone for programs across the country, which aids in ensuring quality control. Such standards not only provide guidance for program staff, but also provide reassurance to the participants served by these programs. This type of structure also provides standards that the food industry can use to develop food items for the Nutrition Programs. Additionally, using the DRIs and 2000 DGs can serve as a framework for individual and group assessment, and planning and evaluating nutrition education, counseling, and other nutrition services.

4
c. Using the DRIs and 2000 DGs creates a program baseline.
This baseline can be used to assure that the requirements of the OAA are met, as well as for evaluating demonstration projects and performing outcomes research.
d. Implementing the DRIs and 2000 DGs provides support for positive public opinions of the OAA nutrition programs.
Utilizing the most recent scientific evidence helps demonstrate that the OAA Nutrition Programs are forward-thinking and evidence-based. Moreover, it demonstrates that the Nutrition Programs have evolved in order to continue to meet the nutrition needs of older adults in America. Additionally, implementing the DRIs and 2000 DGs would be consistent with the policies of other Federal Nutrition Assistance Programs.
Panelists noted that there are still some related issues that remain unresolved and barriers to implementation to address:
- The forthcoming “Interpretation and Uses of Dietary Reference Intakes” report of the NAS should be used to guide the process of implementing the DRIs in the Older Americans Act Nutrition Program;
- Effective implementation will require strategies, including written guidance and training to assist state, area, and local providers in understanding how to use the DRIs and 2000 DGs;
- The possibility exists for increased food-related costs at the local program level; and
- There may be practical difficulties for providing the recommended intake of all nutrients in a normal diet.
RECOMMENDATION:
Older Americans Act Nutrition Program meals should meet the current RDAs and AIs, and the 2000 Dietary Guidelines for Americans, as these reflect the most recent scientific evidence and provide the best-known guidance for meeting the nutrition needs of most older adults in America.

5
TOPIC #2. Must each Older Americans Act Nutrition Program meal individually meet these requirements?
The OAA states that “meals provide to each participating older individual (I) a minimum of 33 1/3 percent of the daily recommended dietary allowances… if the project provides one meal per day, (II) a minimum of 66 2/3 percent of the allowances if the project provides two meals per day, and (III) 100 percent of the allowances if the project provides three meals per day … ”
While panelists generally agreed that there might be circumstances when it is not always necessary for a single meal to meet the 1/3 requirement for every nutrient for which an RDA or AI has been established, they determined that the wording of the OAA took that into account. Thus, they discussed the idea of averaging nutrients over a longer period of time, such as a full day, a few days, or even a week. This strategy would mean that participants would get, for example, an average of 1/3 of targeted nutrients per meal over a week, but any individual meal may provide more or less than 1/3.
However, averaging was rejected overall as panelists also discussed a number of reasons this might not be the best strategy, especially when considering averaging nutrients over a period of time longer than one day:
- The Nutrition Program meal that is served has functions beyond the provision of food. It can provide a good example of healthy food choices and balanced eating for Nutrition Program participants, as well as demonstrate to federal policy makers the best that the OAA nutrition programs offer. Thus, meals represent a nutrition education opportunity as well as an opportunity for providing food and nutrients. If a particular meal was not to meet the requirements, it may no longer serve as a positive model, and Nutrition Programs would not serve their nutrition education aims as effectively;
- The availability of water-soluble nutrients, such as vitamin C, in foods may be reduced over long cooking or transporting times. Thus, participants may not be consuming the level of these nutrients that is planned; and
- The needs of congregate meal participants and home-delivered meal participants may not be equally met with such flexibility. It is more likely that individuals who receive home-delivered meals five days per week would have better nutrient intakes over time. Attendance at congregate meal sites is more varied as 60% of congregate participants receive meals five days per week, but 40% do not. Thus, the congregate population may not receive the aggregated nutrient level over time. It is possible that congregate meal participants might come only on days when meals contain less than the requirements. To guard against this possibility, a minimum standard, such as 15-20%, could be set for key nutrients in each meal – as is the basis on food labels for considering food items good or excellent sources of nutrients.

6
That said, panelists generally agreed that there might be circumstances when a particular meal might not meet the 1/3 RDA/AI or 2000 DG standards. In particular, panelists agreed that Nutrition Programs offering more than 1 meal per day could spread the nutrients out over those meals within a given day. For example, a program offering two meals per day can offer two meals that – together – provide 2/3 of the RDA/AI, whereas each meal – individually – may not provide 1/3. Panelists added that many Nutrition Programs do not realize that the OAA already allows for such flexibility. It was agreed that averaging meals in this way could be considered for the following reasons:
- This flexible strategy allows local providers to have a wider variety of food items as meal components to choose, eg, corn may not have as many targeted nutrients as broccoli but when nutrients are averaged, it could be used more frequently than offering broccoli repeatedly;
- The greater variety, and/or possibly tastier options, would help satisfy client preferences and support the creative ideas of program staff;
- This could be a more cost-effective method of using food items;
- The RDAs and AIs were intended to provide an average of daily intakes over time;
- Meals could include nutrients for which human requirements have not been well defined; and
- Other federal nutrition assistance programs average nutrients over a week.
RECOMMENDATION:
Older Americans Act Nutrition Programs should strive to ensure that each meal is reasonably well-balanced nutritionally and reflects the 2000 Dietary Guidelines since the meals provide a positive nutrition education model for participants. To best serve the nutrition and educational needs of participants, Nutrition Programs that serve 1 meal per day should ensure that each meal offers at least 33 1/3% of the RDAs/AIs. Nutrition Programs that offer two meals per day, for example, should ensure that the sum of the two meals offers at least 66 2/3% of the RDAs/AIs (but each meal itself does not have to be 33 1/3%) and those serving three meals per day should ensure that the sum of these three meals offers 100% of the RDAs/AIs.

7
TOPIC #3. Assuming that all Older Americans Act Nutrition Program meals are culturally appropriate, what nutrients should be targeted?
Since the inception of the Nutrition Programs, the aging network has emphasized “lead” nutrients, such as vitamins A and C, for which daily consumption offers benefits in preventing disease and promoting health beyond just eating a balanced diet. Panelists nearly unanimously agreed that there are multiple benefits to emphasizing specific nutrients. However, much discussion ensued regarding which nutrients should be targeted in meals. It was felt that although significant scientific evidence exists, it was still unclear how to interpret that evidence and determine its impact on practical applications. It was unanimously agreed that the topic of targeting specific nutrients should be the focus of a future Issue Panel and that the forthcoming DRI reports of the Food and Nutrition Board of the Institute of Medicine on macronutrients and on water and electrolytes will help guide future discussion.
Panelists agreed on several principles that should direct the selection of targeted nutrients:
a. Targeted nutrients should be those that are deficient in the dietary intake of older adults and thus impact public health issues that are relevant for older Americans. Panelists would like to see that recommendations for targeted nutrients are tied into broader public health efforts and national guidance.
b. Targeted nutrients should serve as markers for other nutrients. The targeted nutrients should allow meals to provide nutrients that are often found in foods along with other important or “key” nutrients. Thus, Nutrition Programs could safely assume that a meal provides the totality of needed nutrients, even if menu planning focused only on certain specific nutrients.
c. Targeted nutrients should be those that can be evaluated by Nutrition Program staff routinely with computer-assisted menu analysis. It is not intended that program staff have an added burden of evaluating difficult-to-track nutrients.
With much discussion, panelists agreed that fiber, calcium, and possibly protein should be targeted in Nutrition Programs. It was also agreed that due to age-related problems with absorbing vitamin B12 and absorbing or metabolizing vitamin D, these vitamins should come primarily from fortified foods or supplements. However, the OAA does not pay for vitamin or mineral supplements. Other nutrients that were debated included fat, vitamins E, B6, folate, and magnesium.
There was also debate about whether or not Nutrition Programs should continue to target vitamins A and C. Panelists agreed that any emphasis on vitamin A should be modified to a focus on vegetable-derived vitamin A food sources (eg, those rich in carotenoids), rather than animal-derived sources of vitamin A – which may have adverse effects at higher intake levels.

8
Panelists also agreed that emphasis on targeted nutrients may be extended to emphasis on specific foods – as indicated by the 2000 Dietary Guidelines. It was agreed that emphasizing increased fruit and vegetable intake offers a variety of health benefits.
RECOMMENDATION:
In addition to providing meals that meet the 2000 Dietary Guidelines and 1/3 of the RDAs/AIs, Older Americans Act Nutrition Programs should emphasize foods that are high in fiber, calcium, and protein. To the extent possible, programs should continue to target vitamins A and C, with vitamin A provided from vegetable-derived (carotenoid) sources. However, targeting specific nutrients such as those mentioned in this recommendation should not be misinterpreted as permission to ignore other nutrients. More specific recommendations regarding targeting nutrients should be addressed at a future Issue Panel.
TOPIC #4. How can Older Americans Act Nutrition Program meals be evaluated for meeting the Recommended Dietary Allowances, Adequate Intakes, and 2000 Dietary Guidelines?
The local flexibility allowed in the Nutrition Programs may mean that there are gaps in provision of specific nutrients or in meeting the RDA/AI and/or 2000 DG requirements. Panelists agreed that there are several ways that meeting the RDAs/AIs and 2000 DGs requirements can be evaluated and monitored. While other menu planning methods are possible, many panelists wanted to see programs use computer-assisted menu analysis. However, they recognized that there are logistical problems associated with this choice, such as the lack of computer and software resources currently available to local programs. While some saw a need for evaluation based on food items, such as a meal pattern, most thought that meal patterns were only a first step in designing menus and that computer-assisted analysis is needed. It was noted that meal patterns alone do not guarantee that meals will meet OAA standards, and thus do not assure adequate intake. Computer-assisted analysis is a means of assuring that all nutrients addressed by the DRIs and 2000 DGs are included in Nutrition Program meals. Panelists also recognized that the lack of a Registered Dietitian (or individual with comparable expertise) in many state, area, and local Nutrition Programs means that the individual most qualified for menu planning, evaluation, and monitoring is not available. Discussion continued at length on these issues with the following concerns:
a. Regarding computer-assisted analysis, panelists discussed the possibility that Nutrition Programs would analyze meals randomly from each week, at a minimum, in an established cycle to compare them to requirements. However, Nutrition Programs should establish procedures to assure that requirements are met consistently.
b. Regarding approved meal patterns, if a standard meal pattern is developed that delineates specific food servings using the Food Guide Pyramid that combined would meet 1/3 the RDAs/AIs, and the 2000 Dietary Guidelines, it would at least have to include additional

9
servings of fruits, vegetables, and whole grains such as the example meal pattern provided in Part 2 of this report (Tab 4). In addition, any meal pattern needs evaluation using computer analysis before being used to assure that it meets requirements.
c. State, Tribe, AAA, and local Nutrition Programs could develop manuals that contain specific menus, standardized recipes, and analysis data that meet the OAA standards.
d. Panelists emphasized the need to have Registered Dietitians (or individuals with comparable expertise) available to evaluate meals, menus, recipes, food safety compliance, food service quality, and customer needs and satisfaction in order to meet the OAA intent.
RECOMMENDATION:
Older Americans Act Nutrition Programs should plan and evaluate meals for meeting the 2000 Dietary Guidelines and 1/3 RDA/AI standards by computer-assisted analysis. Furthermore, Registered Dietitians (or individuals with comparable expertise) should be available at the state, area, and local provider level to assure nutrient adequacy of meals. If a meal pattern is used, it should be based on the food servings delineated in the Food Guide Pyramid that combined would meet 1/3 the RDAs/AIs and the 2000 Dietary Guidelines, be tested for meeting standards, and include increased servings of fruits, vegetables, and whole grains.
TOPIC #5. How can Older Americans Act Nutrition Program meals be adjusted to meet special dietary needs?
Panelists generally agreed that all meals should be culturally appropriate and meet the needs of the local population. It was also agreed that local providers should offer choices that meet the preferences of local populations. Additionally, some “reasonable” accommodations should be made for Nutrition Program participants who have specific dietary needs that relate to health conditions. Panelists agreed that “reasonable” accommodations can be difficult to define across many Nutrition Programs. They acknowledged that accommodations may vary depending on available resources and the specific populations that Nutrition Programs serve. Panelists noted that resources need to be devoted to purchasing a greater variety of foods and also to hiring appropriate staff who can prepare and serve different foods.
Examples of simple substitutions that may be easily addressed by Nutrition Programs include:
- Low-salt food items for participants with hypertension or risk factors for hypertension;

10
- Low simple carbohydrate desserts for participants with diabetes or risk factors for diabetes.
However, panelists acknowledged that greater resources would likely be needed for greater levels of customization. Panelists would like to see more regionally focused and culturally-based meals. Additionally, if Registered Dietitians (or individuals with comparable expertise) were available to design menus for individuals, the meals served could better meet specific food and/or nutrient needs. It was noted that complicated circumstances need professional nutrition intervention to develop individualized nutrition care plans and counseling via Medical Nutrition Therapy. Moreover, Nutrition Programs could regularly conduct needs assessments of the populations they serve. In some cases, they may find that atypical meal needs are widespread and should be the basis for designing the usual meal that is provided. Panelists would also like to see specific diet accommodations made for texture modified meals/menu items for older adults who have difficulty chewing and swallowing.
RECOMMENDATION:
Assuming culturally appropriate meals, Older Americans Act Nutrition Programs should accommodate specific dietary needs to the extent possible. To better serve defined groups and individuals who require customization or therapeutic diets, Nutrition Programs would benefit from the availability of Registered Dietitians (or individuals with comparable expertise) -- who could also conduct needs assessments of the populations their programs serve.
TOPIC #6. How can nutrition services, including nutrition screening, education, and counseling, incorporate the Dietary Reference Intakes, the 2000 Dietary Guidelines, and targeted nutrients recommendations?
Panelists unanimously supported the importance of including nutrition screening, education, and counseling in OAA Nutrition Programs, reiterating that nutrition services affect participants in many more ways than simply serving them meals. Panelists recognized the importance of having nutrition services that complement the meals, as they affect the overall health, functional independence, and quality of life of older adult participants. Thus, panelists agreed that other nutrition services should utilize the same standards, ie, the DRIs and 2000 Dietary Guidelines, as the meal services.
Panelists further agreed that it might be possible to develop effective nutrition screening, education, and counseling tools that would be appropriate for the majority of Nutrition Programs. However, they emphasized the importance of Nutrition Programs developing customized materials to best serve the needs of their participants. They would rather see that Nutrition Programs be provided with effective, evidence-based materials that may avoid unnecessary duplicative efforts and serve as best practice models.

11
It was agreed that effective nutrition screening, education, and counseling materials would be:
- Customized to the type of education and interventions shown to work in older adult populations;
- Customized to the specific nutrition needs of older adults;
- Customized to the visual needs of older adults, with features such as a large font size;
- Customized to the appropriate literacy level of the older adult population being served;
- Customized to the needs of specific cultural groups, including language needs and culturally-appropriate interpretations of health and dietary behaviors;
- Developed in conjunction with substantial input and decision-making from targeted groups, especially low-income and minority groups; and
- Evaluated and proven effective at changing dietary and health behavior in older adults.
Related strategies explored by panelists, included:
- Creation of an advisory board to review existing and future materials;
- Creation of an older adult Food Guide Pyramid; and
- Dissemination of older adult-friendly materials through a website.
RECOMMENDATION:
As the Older Americans Act Nutrition Programs aim to improve the overall health, functionality, and quality of life of older adults, they should emphasize nutrition screening, education and counseling. New or existing nutrition screening, education, and counseling tools and services should reflect the standards established by the Dietary Reference Intakes and the 2000 Dietary Guidelines.
12
TOPIC #7. What nutrition-related issues need attention at future Issue Panels and/or in outcomes research?
Panelists raised important issues that could not be fully addressed within the scope and timeframe of this Issue Panel. They agreed that future issue panels are necessary to address these topics. The first four topics (below) received the most widespread support from panelists.
a. Nutrients to be targeted in Older Americans Act Nutrition Programs: Although it was agreed that there is scientific evidence for differences in the requirements and intakes of older adults for specific nutrients, it was recognized that the interpretation of the evidence is unclear as is what impact the evidence should have in nutrition services.
b. Outcomes-based research and demonstration projects: Panelists emphasized that outcomes-based research is important for two reasons. First, it documents the effectiveness of the services that Nutrition Programs provide. Second, by demonstrating the value of effective Nutrition Program services, it can raise awareness and funding support for these services. Specifically, panelists would like to see projects that demonstrate that incremental funding spent on nutrition services reduces health care costs not only by improving health, functionality, and quality of life but also by delaying or preventing institutionalizations. Panelists would like to explore a prioritization of research topics and ways to ensure that results are communicated effectively to the public and policy makers.
c. Creating a balance between national uniformity and local autonomy: On the one hand, providing guidance for Nutrition Programs that would necessitate greater uniformity in services may provide a higher overall quality of services as well as reduce inefficiencies resulting from each Nutrition Program “reinventing the wheel.” On the other hand, continuing to give programs significant autonomy provides more opportunities for creative solutions to problems, and allows customization of services for varying population needs. Panelists were eager to discuss strategies for finding the right balance and greater opportunities for sharing best practices across programs.
d. Resource development: Panelists expressed a variety of opinions about why the Nutrition Programs have not received as much attention and support, including financial support, as have other nutrition programs, like WIC. Panelists would like to explore those reasons and strategies for addressing this gap. They would like to explore political strategies at the national level, such as leveraging support from strengths and knowledge across national aging network organizations, as well as strategies at the provider level, such as methods of combining funding streams to maximize results.
Other topics suggested for future Issue Panels were:
- Implementing the forthcoming Dietary Reference Intakes Applications in Dietary Planning report of the NAS;
- Health disparities and minority issues;
- Weight management, including underweight, overweight, and obesity;

13
- Food service, including technology, food preparation and delivery, and food costs;
- Food safety issues;
- Title VI programs and services;
- Food security and hunger;
- Nutrition and physical activity, in relation to functionality;
- Nutrition care planning including screening and assessment, therapeutic interventions and supplement use;
- Effective nutrition education programs;
- Programmatic issues: unmet needs, waiting lists, screening criteria, customer assessment, resources and Registered Dietitian (or ICE) involvement; and
- Assessments of what Nutrition Program participants are actually eating versus what is served.
SUMMARY OF TOPICS AND RECOMMENDATIONS
TOPIC #1. Why must Older Americans Act Nutrition Program meals meet the most current Recommended Dietary Allowances and Adequate Intakes (as components of the Dietary Reference Intakes), and the 2000 Dietary Guidelines for Americans?
RECOMMENDATION:
Older Americans Act Nutrition Program meals should meet the current RDAs and AIs, and the 2000 Dietary Guidelines for Americans, as these reflect the most recent scientific evidence and provide the best-known guidance for meeting the nutrition needs of most older adults in America.
TOPIC #2. Must each Older Americans Act Nutrition Program meal individually meet these requirements?
RECOMMENDATION:
Older Americans Act Nutrition Programs should strive to ensure that each meal is reasonably well-balanced nutritionally and reflects the 2000 Dietary Guidelines since the meals provide a positive nutrition education model for participants. To best serve the nutrition and educational needs of participants, Nutrition Programs that serve 1 meal per day should ensure that each meal offers at least 33 1/3% of the RDAs/AIs. Nutrition Programs that offer two meals per day, for example, should ensure that the sum of the two meals offers at least 66 2/3% of the RDAs/AIs (but each meal itself does not have to be 33 1/3%) and those serving three meals per day should ensure that the sum of these three meals offers 100% of the RDAs/AIs.

14
TOPIC #3. Assuming that all Older Americans Act Nutrition Program meals are culturally appropriate, what nutrients should be targeted?
RECOMMENDATION:
In addition to providing meals that meet the 2000 Dietary Guidelines and 1/3 of the RDAs/AIs, Older Americans Act Nutrition Programs should emphasize foods that are high in fiber, calcium, and protein. To the extent possible, programs should continue to target vitamins A and C, with vitamin A provided from vegetable-derived (carotenoid) sources. However, targeting specific nutrients such as those mentioned in this recommendation should not be misinterpreted as permission to ignore other nutrients. More specific recommendations regarding targeting nutrients should be addressed at a future Issue Panel.
TOPIC #4. How can Older Americans Act Nutrition Program meals be evaluated for meeting the Recommended Dietary Allowances, Adequate Intakes, and 2000 Dietary Guidelines?
RECOMMENDATION:
Older Americans Act Nutrition Programs should plan and evaluate meals for meeting the 2000 Dietary Guidelines and 1/3 RDA/AI standards by computer-assisted analysis. Furthermore, Registered Dietitians (or individuals with comparable expertise) should be available at the state, area, and local provider level to assure nutrient adequacy of meals. If a meal pattern is used, it should be based on the food servings delineated in the Food Guide Pyramid that combined would meet 1/3 the RDAs/AIs and the 2000 Dietary Guidelines, be tested for meeting standards, and include increased servings of fruits, vegetables, and whole grains.
TOPIC #5. How can Older Americans Act Nutrition Program meals be adjusted to meet special dietary needs?
RECOMMENDATION:
Assuming culturally appropriate meals, Older Americans Act Nutrition Programs should accommodate specific dietary needs to the extent possible. To better serve defined groups and individuals who require customization or therapeutic diets, Nutrition Programs would benefit from the availability of Registered Dietitians (or individuals with comparable expertise) - who could also conduct needs assessments of the populations their programs serve.

15
TOPIC #6. How can nutrition services, including nutrition screening, education, and counseling, incorporate the Dietary Reference Intakes, the 2000 Dietary Guidelines, and targeted nutrients recommendations?
RECOMMENDATION:
As the Older Americans Act Nutrition Programs aim to improve the overall health, functionality, and quality of life of older adults, they should emphasize nutrition screening, education and counseling. New or existing nutrition screening, education, and counseling tools and services should reflect the standards established by the Dietary Reference Intakes and the 2000 Dietary Guidelines.
TOPIC #7. What nutrition-related issues need attention at future Issue Panels and/or in outcomes research?
ISSUES FOR FURTHER ATTENTION:
a. Nutrients to be targeted in Older Americans Act Nutrition Programs b. Outcomes-based research and demonstration projects c. Creating a balance between national uniformity and local autonomy d. Resource development
Other recommended issues:
- Implementing the forthcoming Dietary Reference Intakes Applications in Dietary Planning report of the NAS;
- Health disparities and minority issues; - Weight management, including underweight, overweight, and obesity; - Food service, including technology, food preparation and delivery, and food costs; - Food safety issues; - Title VI programs and services; - Food security and hunger; - Nutrition and physical activity, in relation to functionality; - Nutrition care planning including screening and assessment, therapeutic interventions and
supplement use; - Effective nutrition education programs; - Programmatic issues: unmet needs, waiting lists, screening criteria, customer assessment,
resources and Registered Dietitian (or ICE) involvement; and - Assessments of what Nutrition Program participants are actually eating versus what is
served.

PART 2
BACKGROUNDER FOR THE ISSUE PANEL
HELD ON FEBRUARY 11TH, 2002
Heidi J. Silver, PhD, RD, CNSD
Nancy S. Wellman, PhD, RD, FADA
Lester Y. Rosenzweig, MS, RD
National Policy and Resource Center on Nutrition and Aging
Florida International University
Miami, FL
ACKNOWLEDGEMENTS We wish to thank the following Center staff and graduate assistants for their assistance in preparing the Backgrounder: Su-Nui Escobar, Patricia Flipse, Barbara Friedberg, Stacey Reppas MS, RD, Lauren Rhee MS, Gabrielle Rojas, Peggy Schafer RD, and Amy Sindler RD.

16
TABLE OF CONTENTS
OVERVIEW
Introduction Page 1 Goal and Objectives Page 1 Backgrounder Information Page 2
DISCUSSION TOPICS
1. Why must Older Americans Act Nutrition Program meals meet the most current Recommended Dietary Allowances and Adequate Intakes (as components of the Dietary Reference Intakes), and the 2000 Dietary Guidelines for Americans? Page 5
2. Must each Older Americans Act Nutrition Program meal individually meet these requirements? Page 5
3. Assuming that all Older Americans Act Nutrition Program meals are culturally appropriate, what nutrients should be targeted? Page 6
4. How can Older Americans Act Nutrition Program meals be evaluated for meeting the Recommended Dietary Allowances, Adequate Intakes, and 2000 Dietary Guidelines? Page 8
5. How can Older Americans Act Nutrition Program meals be adjusted to meet special dietary needs? Page 9
6. How can nutrition services, including nutrition screening, education, and counseling, incorporate the Dietary Reference Intakes, 2000 Dietary Guidelines, and targeted nutrients recommendations? Page 10
7. What nutrition-related issues need attention at future Issue Panels and/or in outcomes research? Page 11
REFERENCES Page 12
ADDITIONAL REFERENCES AND RESOURCES Page 14
WORKING DOCUMENTS Page 15

17
ISSUE PANEL: DIETARY REFERENCE INTAKES AND DIETARY GUIDELINES
IN OLDER AMERICANS ACT (OAA) NUTRITION PROGRAMS
PART 2: BACKGROUNDER
OVERVIEW
INTRODUCTION
The Older Americans Act Nutrition Program administered by the federal Administration on Aging (AoA) provides congregate and home-delivered meals, nutrition screening, nutrition education, and nutrition counseling services. The Program serves about 250 million congregate and home-delivered meals to approximately 3 million older adults annually. Almost half the Older Americans Act $1.1 billion budget administered by AoA goes to the Nutrition Program.
Programs are required by federal law to “… provide meals that (i) comply with the Dietary Guidelines for Americans, … and (ii) provide to each participating older individual (I) a minimum of 33 1/3 percent of the daily recommended dietary allowances… if the project provides one meal per day, (II) a minimum of 66 2/3 percent of the allowances if the project provides two meals per day, and (III) 100 percent of the allowances if the project provides three meals per day… .” (Public Law 106-501, Sec.339 Nutrition (2)(A)).
Congress passed the latest 5-year reauthorization of the Older Americans Act (OAA) in 2000. The Act, like its predecessors, does not specify using the most recent versions of the Dietary Reference Intakes (DRIs) that were published sequentially by nutrient groups by the Institute of Medicine (IOM), in 1997, 1998, 2000, 2001, and the 2000 Dietary Guidelines for Americans, (DGs) (1-5). It is generally assumed among nutrition professionals that these new documents should be used, as they supercede previous ones and usually include new information. For example, unlike the 1989 edition of the Recommended Dietary Allowances (RDAs) (6), the DRIs include reference values for men and women aged 51 to 70 and over 70 years. Yet many Programs are still using the 1989 RDAs and older versions of the Dietary Guidelines. Some have begun using the DRIs and DGs not only when planning menus, but also when designing, implementing, and assessing nutrition services.
GOAL AND OBJECTIVES
Goal: The Issue Panel focused on whether the DRIs and 2000 DGs should be used in Older Americans Act Nutrition Programs. The Panel developed recommendations regarding the application of the DRIs and 2000 DGs in the provision of nutrition services, including nutrition education, nutrition counseling, and congregate and home-delivered meals.
These recommendations are being presented for consideration by the US Administration on Aging to assist in development of guidance and technical assistance related to implementation of the DRIs and 2000 DGs in the Older Americans Act

18
Nutrition Programs. Such guidance and assistance could be adopted by State Units on Aging (SUAs) for implementation by the State Unit, Area Agencies on Aging (AAAs), and local service providers.
Objectives: The purpose of the Issue Panel was to
1. Determine whether meals should meet the most current Recommended Dietary Allowances and Adequate Intakes as components of the Dietary Reference Intakes (DRIs) and 2000 Dietary Guidelines (DGs) in Older Americans Act Nutrition Programs;
2. Determine whether each meal must individually meet these requirements;
3. Determine which nutrients should be targeted when planning (culturally appropriate) meals;
4. Identify how meals can be evaluated for meeting the RDAs, AIs, and 2000 DGs;
5. Determine how meals can be adjusted to meet special dietary needs;
6. Describe the role of other nutrition services, including nutrition screening, education and counseling, in relation to the DRIs and 2000 DGs; and
7. Identify priority nutrition-related topics that future should be addressed at future Issue Panels or in outcomes research.
BACKGROUNDER INFORMATION
The National Policy and Research Center on Nutrition and Aging compiled background information, data, references, charts and tables as a Backgrounder for the Issue Panel. The information is presented by Issue Panel discussion topics #1-7 with the tables and charts following the 7 topics. Each topic section begins with excerpts from the Older Americans Act, followed by findings from the 1998 SUA Policies and Procedures Data Collection housed at the Center, excerpts from related scientific and practical evidence, working documents (the tables described below), additional background information, and references.
Table 1 “Dietary Reference Intakes for Older Adults” presents the DRI values for men and women aged 51 to 70 and over 70 years. They include the Recommended Dietary Allowance (RDA) or Adequate Intake (AI) for nutrients with no established RDA, and the Tolerable Upper Intake Level (UL). The RDA is the average daily dietary intake level that is sufficient to meet the nutrient requirement for nearly all (97-98%) healthy individuals of a specified age range and gender. The AI is the daily dietary intake level of healthy people assumed to be adequate when there is insufficient evidence to set an RDA. It is based on observed mean nutrient intakes and experimental data. The UL is the highest daily dietary intake that is likely to pose no risk of adverse health effects to almost all of individuals of a specific age range.
Table 2 “Nutrient Availability of an Older Americans Nutrition Program Meal Relative to the Dietary Reference Intakes and Recommended Dietary Allowances” compares the nutrient availability of Older Americans Nutrition Program meals to the DRI values (RDA/AI). The data on the nutrient content of Nutrition Program meals

19
comes from Serving Elders at Risk, the Older Americans Act Nutrition Programs: National Evaluation of the Elderly Nutrition Program 1993-1995, Volume I: Title III Evaluation Findings Executive Summary (7).
Table 3 “Comparison of National Studies for Mean Nutrient Intakes of Older Adults” compares data from NHANES III, CSFII 1994-96, and Serving Elders at Risk, the Older Americans Act Nutrition Programs: National Evaluation of the Elderly Nutrition Program 1993-1995, Volume I: Title III Evaluation Findings Executive Summary (7). The NHANES III and CSFII 1994-96 data come from Wakimoto P, Block G. Dietary intake, dietary patterns, and changes with age: an epidemiological perspective. J Gerontol Series A. 2001;56A (Special Issue II):65-80 (8).
Table 4.1 “Nutrient Composition of the 1972 Meal Pattern” presents a meal pattern from the Guide to Effective Project Operations, The Nutrition Program for the Elderly (the Oregon Guide 1973). It was assumed that if a variety of foods were provided daily in the amounts indicated and proper food preparation and handling was practiced, the meal would provide at least 1/3 of the 1968 RDAs. The pattern became the quick checklist for determining the nutritional adequacy of a meal. This meal pattern has been in use with little or no modification for the past 30 years. Some states have since added requirements to ensure that meals provide foods high in specific nutrients such as Vitamin A and C. Some have gone further to address other nutrients as well.
Table 4.2 “Nutrient Composition of a Meal Pattern to Meet ~33.3% RDA/AI Using the Recommended Number of Servings for … Women, Some Older Adults (about 1600 calories)” is a meal pattern developed by the Center to meet the most current Dietary Guidelines for Americans (2000) recommendations for energy. The number of servings for each food group (excluding dessert items) is based on the serving sizes in the Food Guide Pyramid for individuals requiring about 1600 Calories daily (eg, sedentary women and some older adults). The number of servings reflects an appropriate distribution of foods for the day, particularly for lunch or supper. The nutrient values shown for each food group are based on USDA’s Food Guide: Background and Development, Table 5 “Nutrient profiles for food groups and subgroup composites.” As a preliminary step to determining the number of servings to recommend for each food group in the Food Guide Pyramid, USDA established a nutrient profile for each group. These profiles represent the quantities of nutrients and other components that one would expect to obtain on average from a serving of food in each group. The table provides the most current RDA for selected nutrients to compare with the total nutrient content provided by this meal pattern. The total does not take into account a dessert item that, if carefully chosen, can positively influence the total nutrient value of the meal.
Table 4.3 “Nutrient Composition of a Meal Pattern to Meet ~33.3% RDA/AI and the 1989 RDA for Energy (1900 (F) and 2300 (M) calories)” is a meal pattern developed by the Center to meet the most current RDA recommendations for energy (1989 RDA energy (calorie) requirements for men and women over 50). The number of servings for each food group (excluding dessert items) is based on the higher energy requirement for men. The nutrient content of each food group is based on USDA’s Food Guide: Background and Development nutrient profiles as described for Table 4.2. To increase the caloric level of the meal pattern to 767 kcal for men as 1/3 RDA, the number of servings was adjusted upward for the bread, vegetable, and meat food groups. The

20
table also provides the most current RDA for selected nutrients to compare with the total nutrient content provided by this meal pattern. The total does not take into account the dessert item that, if carefully chosen, can positively influence the total nutrient value of the meal.
Chart 1 “Dietary Guidelines for Americans 1980-2000” compares the changes that have occurred in the Dietary Guidelines from 1980 to 2000. This chart is from the USDA Center for Nutrition Policy and Promotion.

21
DISCUSSION QUESTION #1
Why must older Americans Act Nutrition Program meals meet the most current Recommended Dietary Allowances and Adequate Intakes (as components of the Dietary Reference Intakes), and the 2000 Dietary Guidelines for Americans?
OAA requirements
1. SEC. 339 (2)(A)(i) State … shall ensure that project provides meals that comply with the Dietary Guidelines for Americans.
2. SEC. 339 (2)(A)(ii) State … shall ensure that project provides meals that provide … a minimum of 33 1/3% of the daily RDA … if one meal per day … 66 2/3% RDA if … 2 meals per day, and 100% RDA for 3 meals per day.
3. SEC. 614 (a)(8)… eligible tribal organization… provide assistance… with appropriate entities nutrition services will be delivered to older individuals who are Indians… substantially in compliance with the provisions of part C of title III…
State Documents
- 1998 SUA Policies and Procedures Collection (9)
o 40 (91%) have guidelines that meals must comply with 33% of the RDA.
o 35 (79%) have guidelines for compliance with Dietary Guidelines.
o 34 (77%) have guidelines for meal patterns.
Related Scientific and Practice Evidence
- “considerable guidance would be needed to assist … from former RDAs to using the new DRIs … (10).
- USDA (National School Lunch Program, Child and Adult Care Food Programs) requires adherence to a meal pattern (11).
Working Documents
- Table 1. Dietary Reference Intakes for Older Adults.
DISCUSSION QUESTION #2
Must each Older Americans Act Nutrition Program meal individually meet these requirements?
OAA requirements
- SEC. 339 (2)(A)(i) State … shall ensure that project provides meals that comply with the Dietary Guidelines for Americans.

22
- SEC. 339 (2)(A)(ii) State … shall ensure that project provides meals that provide … a minimum of 33 1/3% of the daily RDA … if one meal per day … 66 2/3% RDA if … 2 meals per day, and 100% RDA for 3 meals per day.
Related Scientific and Practice Evidence
DRIs:
o IOM: “A forthcoming report from this Subcommittee will address applications of DRIs in dietary planning.” (10, p. xi)
o DRIs, including RDAs, are all defined as “the average daily nutrient intake level(s)… “ (10, p. 3)
o Historical precedent: 1989 RDAs footnote "The allowances, expressed as average daily intakes over time, are intended to provide for individual variations among most normal persons as they live in the US under usual environmental stresses. Diets should be based on a variety of common foods in order to provide other nutrients for which human requirements have been less well defined."(6)
DGs:
o “Aim, Build, Choose— for Good Health. By following all of the guidelines … , you can promote your health and reduce your risk for chronic diseases such as heart disease, certain types of cancer, diabetes, stroke, and osteoporosis. … It is important for everyone to follow the 10 Dietary Guidelines… . If you are at higher risk for a chronic disease, it is especially important.” (5, p. 3)
Working Documents
Table 2. Nutrient Availability of an Older Americans Nutrition Program Meal Relative to Dietary Reference Intakes and Recommended Dietary Allowances.
DISCUSSION QUESTION #3
Assuming that all Older Americans Act Nutrition Program meals are culturally appropriate, what nutrients should be targeted?
OAA requirements
- SEC. 339 (2)(A)(iii) ensure that the project… provide(s) meals that to the maximum extent practical, are adjusted to meet any special dietary needs of program participants.
- SEC. 339 (2)(B) … provides flexibility to local nutrition providers in designing meals that are appealing to program participants.
23
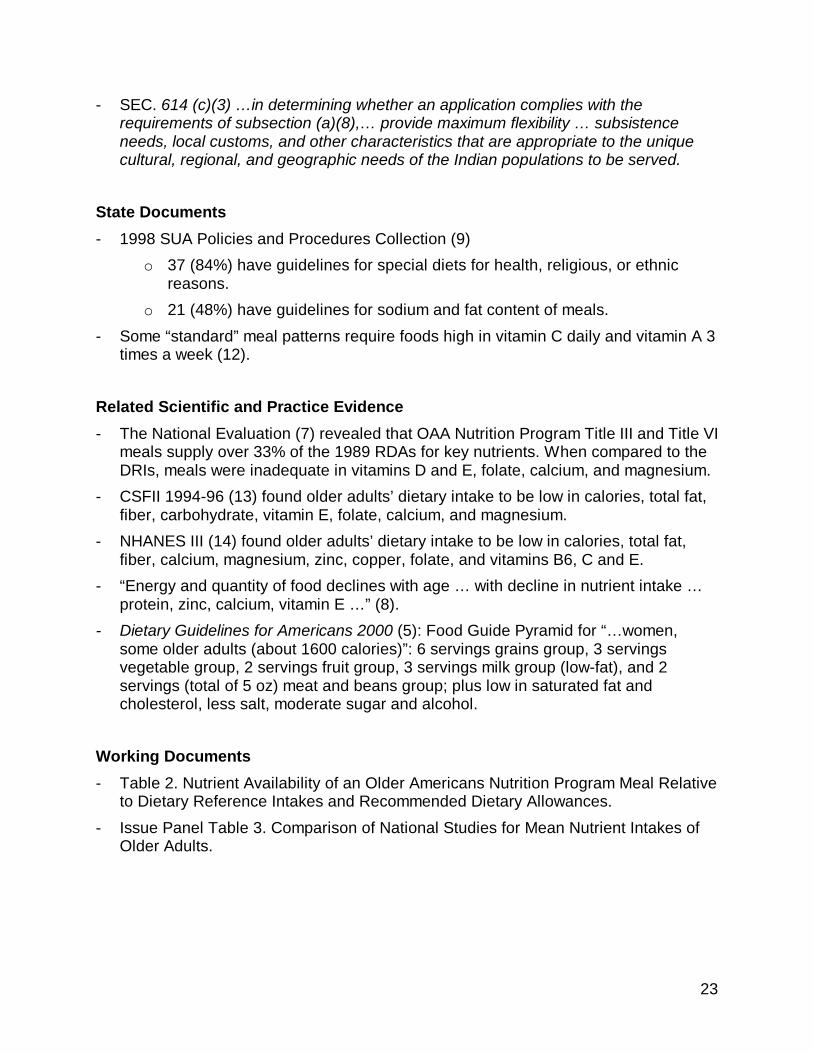
- SEC. 614 (c)(3) … in determining whether an application complies with the requirements of subsection (a)(8),… provide maximum flexibility … subsistence needs, local customs, and other characteristics that are appropriate to the unique cultural, regional, and geographic needs of the Indian populations to be served.
State Documents
- 1998 SUA Policies and Procedures Collection (9)
o 37 (84%) have guidelines for special diets for health, religious, or ethnic reasons.
o 21 (48%) have guidelines for sodium and fat content of meals.
- Some “standard” meal patterns require foods high in vitamin C daily and vitamin A 3 times a week (12).
Related Scientific and Practice Evidence
- The National Evaluation (7) revealed that OAA Nutrition Program Title III and Title VI meals supply over 33% of the 1989 RDAs for key nutrients. When compared to the DRIs, meals were inadequate in vitamins D and E, folate, calcium, and magnesium.
- CSFII 1994-96 (13) found older adults’ dietary intake to be low in calories, total fat, fiber, carbohydrate, vitamin E, folate, calcium, and magnesium.
- NHANES III (14) found older adults’ dietary intake to be low in calories, total fat, fiber, calcium, magnesium, zinc, copper, folate, and vitamins B6, C and E.
- “Energy and quantity of food declines with age … with decline in nutrient intake … protein, zinc, calcium, vitamin E … ” (8).
- Dietary Guidelines for Americans 2000 (5): Food Guide Pyramid for “… women, some older adults (about 1600 calories)”: 6 servings grains group, 3 servings vegetable group, 2 servings fruit group, 3 servings milk group (low-fat), and 2 servings (total of 5 oz) meat and beans group; plus low in saturated fat and cholesterol, less salt, moderate sugar and alcohol.
Working Documents
- Table 2. Nutrient Availability of an Older Americans Nutrition Program Meal Relative to Dietary Reference Intakes and Recommended Dietary Allowances.
- Issue Panel Table 3. Comparison of National Studies for Mean Nutrient Intakes of Older Adults.

24
DISCUSSION QUESTION #4
How can Older Americans Act Nutrition Program meals be evaluated for meeting the Recommended Dietary Allowances, Adequate Intakes, and 2000 Dietary Guidelines?
OAA requirements
- SEC. 339 (1) State … shall solicit the advise of a dietitian or individual with comparable expertise in the planning of nutrition services.
- SEC. 339 (2)(G) State … ensure that the project … ensures that meal providers carry out such project with the advice of dietitians …
- SEC. 614 (a)(8)… eligible tribal organization… provide assistance… with appropriate entities nutrition services will be delivered to older individuals who are Indians… substantially in compliance with the provisions of part C of title III…
State Documents
- 1998 SUA Policies and Procedures Collection (9)
o 35 (77%) have guidelines for dietitians at any level.
o 34 (77%) have guidelines for meal patterns.
o 23 (52%) have guidelines for use of computer assisted menu analysis.
o 20 (45%) have guidelines for the services of a registered and/or licensed dietitian or individual with comparable nutrition expertise at the AAA or local nutrition service provider level.
o 16 (36%) have guidelines for the use of standardized recipes.
o 10 (23%) have no mention of utilizing the services of a dietitian at any level.
Related Scientific and Practice Evidence
- IOM (15) recognized and recommended use of registered dietitians (RDs):
o “the single identifiable group with standardized education, clinical training, continuing education, and national credentialing requirements … ”
o “… accreditation and licensing groups should reevaluate existing reimbursement systems and regulations for nutrition services along the continuum of care to determine the adequacy of care delineated by such standards.”
- 1995 State Units on Aging Nutritionists Meeting: Roles and responsibilities of the dietitian should include: "needs assessment, advocating for older adults, developing and implementing policy including nutrition screening, budgeting, contracting, grant writing, establishing program priorities, technical assistance and training, menu planning, conducting surveys and outcomes research to evaluate program effectiveness, developing linkages … "

25
- National Evaluation (7) found 85% of state agencies, 73% of area agencies, 60% of local nutrition projects, had access to staff with nutrition credentials. However, 31%, 39%, and 59%, respectively, had no RD, per se. Of those that had RDs, duties included management, administration, technical assistance, training, development of materials, standards, and protocols, monitoring and assessing services, and providing services.
- “high standards of menu planning can be met in different … settings of OAA Nutrition Programs (16)
- “greater satisfaction … with the nutrition program suggests that the use of the microcomputer was a positive element … (17).
Working Documents
- Issue Panel Table 4.1. Nutrient Composition of the 1972 Meal Pattern.
- Issue Panel Table 4.2. Nutrient Composition of a Meal Pattern to meet ~33.3% RDA/AI Using the Recommended Number of Servings for “… Women, Some Older Adults (About 1600 Calories).”
- Issue Panel Table 4.3. Nutrient Composition of a Meal Pattern to meet ~33.3% RDA/AI and the 1989 RDA for Energy (1900 (F) and 2300 (M) Calories).
DISCUSSION QUESTION #5
How can Older Americans Act Nutrition Program meals be adjusted to meet special dietary needs?
OAA requirements
- SEC. 339 (2)(A)(iii): State … shall ensure that the project to the maximum extent practicable is adjusted to meet any special dietary needs of program participants.
- SEC. 339 (1) State … shall solicit the advise of a dietitian or individual with comparable expertise in the planning of nutrition services.
- SEC. 339 (2)(G) State … ensure that the project … ensures that meal providers carry out such project with the advice of dietitians …
- SEC. 614 (a)(8)… eligible tribal organization… provide assistance… with appropriate entities nutrition services will be delivered to older individuals who are Indians… substantially in compliance with the provisions of part C of title III…
State Documents
- 1998 SUA Policies and Procedures Collection (9)
o 37 (84%) have guidelines for special diets for health, religious, or ethnic reasons.

26
Related Scientific and Practice Evidence
- Healthy People 2010 (18) goals and objectives: to reduce health disparities.
- IOM (15): “Eighty-seven percent of older Americans have either diabetes, hypertension, dyslipidemia, or a combination of these chronic diseases. These conditions all have adverse outcomes that can be ameliorated or reduced with appropriate nutrition interventions.”
DISCUSSION QUESTION #6
How can nutrition services, including nutrition screening, education, and counseling, incorporate the Dietary Reference Intakes, 2000 Dietary Guidelines, and targeted nutrients recommendations?
OAA requirements
- SEC 102 (12) (b, c, d) Routine health screening… nutrition counseling and education services… health promotion programs.
- SEC. 331 (3) … State plans … establishment and operation of nutrition projects which may include nutrition education services and other appropriate nutrition services for older individuals.
- SEC. 339 (2) (J) State … shall ensure that projects provide for nutrition screening and, where appropriate, for nutrition education and counseling.
- SEC. 614 (a)(8)… eligible tribal organization… provide assistance… with appropriate entities nutrition services will be delivered to older individuals who are Indians… substantially in compliance with the provisions of part C of title III…
State Documents
- 1998 SUA Policies and Procedures Collection (9)
o 41 (93%) have guidelines for nutrition education.
o 19 (43%) have guidelines for health promotion and disease prevention activities.
Related Scientific and Practice Evidence
- Healthy People 2010 (18) goals and objectives: to prevent chronic disease, promote functional independence, improve quality of life, and overall health.
- IOM (15): “87% of older Americans have either diabetes, hypertension, dyslipidemia, or a combination of these chronic diseases. These conditions all have adverse outcomes that can be ameliorated or reduced with appropriate nutrition interventions.”

27
DISCUSSION QUESTION #7
What nutrition-related issues need attention at future Issue Panels and/or in outcomes research?
OAA requirements (re: outcomes research)
- SEC 206 (a) The Secretary shall measure and evaluate the impact of all programs.
- SEC 206 (d) The Secretary shall annually publish summaries and analyses of the results of evaluative research … including health and nutrition education demonstration projects.
- SEC 401 (2) … to design, test, and promote the use of innovative ideas and best practices in programs and services for older individuals.
State Policies and Procedures
- 1998 SUA Policies and Procedures Collection (9)
o 17 (39%) have guidelines on data sources to use for needs assessment.
o 13 (30%) have guidelines for outcomes of monitoring and assessment.
o 12 (27%) have guidelines on how to collect required data.
Related Scientific and Practice Evidence
- Measuring Outcomes: “should be conducted to evaluate program services, benefits, and cost-effectiveness, which can be used to lobby for increased federal funding and improve services to better meet older adults’ nutrition needs” (19).
- IOM (15): “ Federal agencies … should pursue a research agenda in the area of nutrition in the older person.”
- “The need for evidence-based practice arose for several reasons, such as … variations in service delivery require description and investigation, pressure on health care resources … demand for greater value for dollars spent … while preserving or improving the quality of care being delivered and allowing for … preferences. Evidence-based … is defined as the conscientious, explicit, and judicious use of current best data in making decisions about care … “ (20).
POSSIBLE TOPICS for FUTURE ISSUE PANELS and/or OUTCOMES RESEARCH:
- Nutrients to be targeted in Older Americans Act Nutrition Programs;
- Outcomes-based research and demonstration projects;
- Creating a balance between national uniformity and local autonomy;
- Resource development;

28
- Implementing the forthcoming Dietary Reference Intakes Applications in Dietary Planning report of the NAS;
- Health disparities and minority issues;
- Weight management, including underweight, overweight, and obesity;
- Food service, including technology, food preparation and delivery, and food costs;
- Food safety issues;
- Title VI programs and services;
- Food security and hunger;
- Nutrition and physical activity, in relation to functionality;
- Nutrition care planning including screening and assessment, therapeutic interventions and supplement use;
- Effective nutrition education programs;
- Programmatic issues: unmet needs, waiting lists, screening criteria, customer assessment, resources and Registered Dietitian (or ICE) involvement; and
- Assessments of what Nutrition Program participants are actually eating versus what is served.
REFERENCES
1. Institute of Medicine, Food and Nutrition Board. Dietary Reference Intakes for Calcium, Phosphorus, Magnesium, Vitamin D, and Fluoride. Washington, DC: National Academy Press; 1997. Available at: http://www.nap.edu/books/0309063507/html.
2. Institute of Medicine, Food and Nutrition Board. Dietary Reference Intakes for Thiamin, Riboflavin, Niacin, Vitamin B6, Folate, Vitamin B12, Pantothenic Acid, Biotin, and Choline. Washington, DC: National Academy Press; 1998. Available at: http://www.nap.edu/books/0309065542/html.
3. Institute of Medicine, Food and Nutrition Board. Dietary Reference Intakes for Vitamin C, Vitamin E, Selenium, and Carotenoids. Washington, DC: National Academy Press; 2000. Available at: http://www.nap.edu/books/0309069351/html
4. Institute of Medicine, Food and Nutrition Board. Dietary Reference Intakes for Vitamin A, Vitamin K, Arsenic, Boron, Chromium, Copper, Iodine, Iron, Manganese, Molybdenum, Nickel, Silicon, Vanadium, and Zinc. Washington, DC: National Academy Press; 2001. Available at: http://www.nap.edu/books/0309072794/html.
5. Dietary Guidelines for Americans 2000, 5th ed. Washington, DC: US Depts. of Agriculture and Health and Human Services; 2000. Available at: http://www.health.gov/dietaryguidelines.

29
6. National Academy of Sciences, Food and Nutrition Board. Recommended Dietary Allowances. Washington, DC: National Academy Press; 1989.
7. Mathematica Policy Research, Inc. Serving Elders at Risk, The Older Americans Act Nutrition Programs: National Evaluation of the Elderly Nutrition Program 1993-1995, Volume I: Title III Evaluation Findings. Washington, DC: US Department of Health and Human Services; 1996. Available at: http://www.aoa.gov/aoa/pages/nutreval.html.
8. Wakimoto P, Block G. Dietary intake, dietary patterns, and changes with age: an epidemiological perspective. J Gerontol 2001;56A Special Issue II:65-80.
9. Wellman NS, Silver HJ, Alfonso M, Smith J, et al. 1998 State Policies and Procedures Data Collection. Miami, FL: National Policy and Resource Center on Nutrition and Aging.
10. Institute of Medicine, Food and Nutrition Board. Dietary Reference Intakes: Applications in Dietary Assessment. Washington, DC: National Academy Press; 2001. Available at: http://www.nap.edu/books/0309071836/html.
11. Wellman NS. A White Paper on Lessons to be Learned from Other Federal Assistance Programs. December 1999. Available at: http://www.fiu.edu/~nutreldr/Center_Initiatives/nutrition_2030/WP_Lessons.pdf
12. Administration on Aging. 1971 White House Conference on Aging. Background and Issues. Technical Committee on Nutrition. Washington, DC: 1971;p 14-16.
13. US Department of Agriculture, Food Survey Research Group. (1998) Continuing Survey of Food Intakes by Individuals 1994-1996. Available at: http://www.barc.usda.gov/bhnrc/foodsurvey/Csfii94.html.
14. National Center for Health Statistics. Third National Health and Nutrition Examination Survey (Series 11, #1, SETS Version 1.22a) [CD-ROM]. Washington, DC: US Government Printing Office; 1997. Available at: http://www.cdc.gov/nchs/products.htm.
15. The Role of Nutrition in Maintaining the Health of the Nation’s Elderly: Evaluating Coverage of Nutrition Services for the Medicare Population. Institute of Medicine. Washington, DC: National Academy Press; 2000. Available at: http://www.nap.edu/books/0309068460/html.
16. Rhodes SS, ed. Effective Menu Planning for the Elderly Nutrition Program. Chicago, IL: American Dietetic Association; 1991.
17. Dennison KF, Dennison D, Ward JY. Computerized nutrition program: Effect on nutrient intake of senior citizens. J Am Diet Assoc. 1991;91:1431-1433.
18. US Department of Health and Human Services. Healthy People 2010: Understanding and Improving Health. Washington, DC: US Dept Health Human Services, Government Printing Office; 2000. Available at: http://www.health.gov/healthypeople/document.
19. Splett, PL and Weddle, DO. The Elderly Nutrition Program: Contributing to the Health and Independence of Older Adults, A White Paper on Measuring Outcomes.

30
November 1999. Available at: http://www.fiu.edu/~nutreldr/Center_Initiatives/nutrition_2030/WP_Outcomes2.PDF
20. Kamerow DB. Clinical Evidence: Creation, Assessment, and Implementation. Office of the Forum for Quality and Effectiveness in Health Care, AHCPR. 1997. Available at: http://www.ahrq.gov/clinic/trip1997/trip1.htm#head3/.
ADDITIONAL REFERENCES AND RESOURCES
- Dennison KF, Dennsion D, Ward JY. Computerized nutrition program: effect on Nutrient intake of senior citizens. J Am Diet Assoc. 1991;91:1431-1433.
- Gloth FM, Gundberg CM, Hollis BW, Haddad JG, Tobin JD. Vitamin D deficiency in homebound elderly persons. JAMA. 1995;274:1683-1686.
- Institute of Medicine, Food and Nutrition Board. Dietary Reference Intakes: Proposed Definition of Dietary Fiber. Washington, DC: National Academy Press; 2001. Available at: http://www.nap.edu/books/0309075645/html
- Lewis CJ, Crane NT, Wilson DB, Yetley EA. Estimated folate intakes: data updated to reflect food fortification, increased bioavailability, and dietary supplement use. Am J Clin Nutr. 1999;70:198-207.
- New York State Department of Health, Child and Adult Care Food Program. Adult meal pattern. Albany, NY. 2001.
- Nutrition Screening Initiative. A Physician’s Guide to Nutrition in Chronic Disease Management for Older Adults. Washington, DC: Nutrition Screening Initiative; 2002. Available at: http://www.aafp.org/nsi/manual/index.html.
- Tufts University. Tufts Modified Food Guide Pyramid for Mature (70+) Adults. 1999. Available at: http://nutrition.tufts.edu/publications/pyramid.shtml.
- US Department of Agriculture, Human Nutrition Information Service. USDA Food Guide: Background and Development. Table 5. Nutrient profiles for food groups and subgroup composites. Misc Pub No. 1514; Hyattsville, MD. 1993.
- US Department of Agriculture, Center for Nutrition Policy and Promotion. Food Guide Pyramid. 1996. Available at: http://www.usda.gov/cnpp/pyramid2.htm.
- Wardlaw GM, Kessel M. Perspectives in Nutrition (5th ed). Table 2.9 Definitions for comparative and absolute nutrient claims on food labels. Boston, MA: McGraw Hill; 2002. Pg 60.
- Weddle DO, Fanelli-Kuczmarski M. Position of the American Dietetic Association: nutrition, aging, and the continuum of care. J Am Diet Assoc. 2000;100:580-595. Available at: http://www.eatright.com/adap0500.html.
- Womack P, Breeding C. Position of the American Dietetic Association: liberalized diets for older adults in long-term care. J Am Diet Assoc. 1998;98:201-204. Available at: http://www.eatright.com/adap0298a.html.

31
WORKING DOCUMENTS
Table 1: Dietary Reference Intakes for Older Adults.
Table 2: Nutrient Availability of an Older Americans Nutrition Program Meal Relative to the DRIs and 1989 RDAs.
Table 3: Comparison of National Studies for Mean Nutrient Intakes of Older Adults.
Table 4.1: Nutrient Composition of the 1972 Meal Pattern.
Table 4.2: Nutrient Composition of a Meal Pattern to meet ~33.3% RDA/AI Using the Recommended Number of Servings for “… Women, Some Older Adults (About 1600 Calories).”
Table 4.3: Nutrient Composition of a Meal Pattern to meet ~33.3% RDA/AI and the 1989 RDA for Energy (1900 (F) and 2300 (M) Calories).
Chart 1: Dietary Guidelines for Americans, 1980 to 2000

Table 1: Dietary Reference Intakes for Older Adults
Vitamin A Vitamin C Vitamin D Vitamin E Vitamin K Thiamin Riboflavin Niacin Vitamin B6 Folate(ug)b,c (mg) (ug)d,e (mg)f,g,h (ug) (mg) (mg) (mg)h,i (mg) (ug)h,j
RDA or AI*Age 51-70 Male 900 90 10* 15 120* 1.2 1.3 16 1.7 400 Female 700 75 10* 15 90* 1.1 1.1 14 1.5 400Age 70+ Male 900 90 15* 15 120* 1.2 1.3 16 1.7 400 Female 700 75 15* 15 90* 1.1 1.1 14 1.5 400Tolerable Upper Intake Levelsa Age 51-70 Male 3000 2000 50 1000 ND ND ND 35 100 1000 Female 3000 2000 50 1000 ND ND ND 35 100 1000Age 70+ Male 3000 2000 50 1000 ND ND ND 35 100 1000 Female 3000 2000 50 1000 ND ND ND 35 100 1000
Vitamin B12 Pantothenic Biotin Choline Boron Calcium Chromium Copper Fluoride Iodine(ug)k Acid (mg) (ug) (mg)l (mg) (mg) (ug) (ug) (mg) (ug)
RDA or AI*Age 51-70 Male 2.4 5* 30* 550* ND 1200* 30* 900 4* 150 Female 2.4 5* 30* 425* ND 1200* 20* 900 3* 150Age 70+ Male 2.4 5* 30* 550* ND 1200* 30* 900 4* 150 Female 2.4 5* 30* 425* ND 1200* 20* 900 3* 150Tolerable Upper Intake Levelsa
Age 51-70 Male ND ND ND 3500 20 2500 ND 10000 10 1100 Female ND ND ND 3500 20 2500 ND 10000 10 1100Age 70+ Male ND ND ND 3500 20 2500 ND 10000 10 1100 Female ND ND ND 3500 20 2500 ND 10000 10 1100
*Recommended Dietary Allowances (RDAs) are in bold type and Adequate Intakes (AIs) are in ordinary type followed by an asterisk (*), see Footnotes, pg 3.ND - Indicates values not determined.
The values for this table were excerpted from the Institute of Medicine, Dietary Reference Intakes: Applications in Dietary Assessmen t , 2000.
Vitamins and Elements
Compiled by the National Policy and Resource Center on Nutrition and Aging, Florida International University, Revised 12/18/01 Page 32
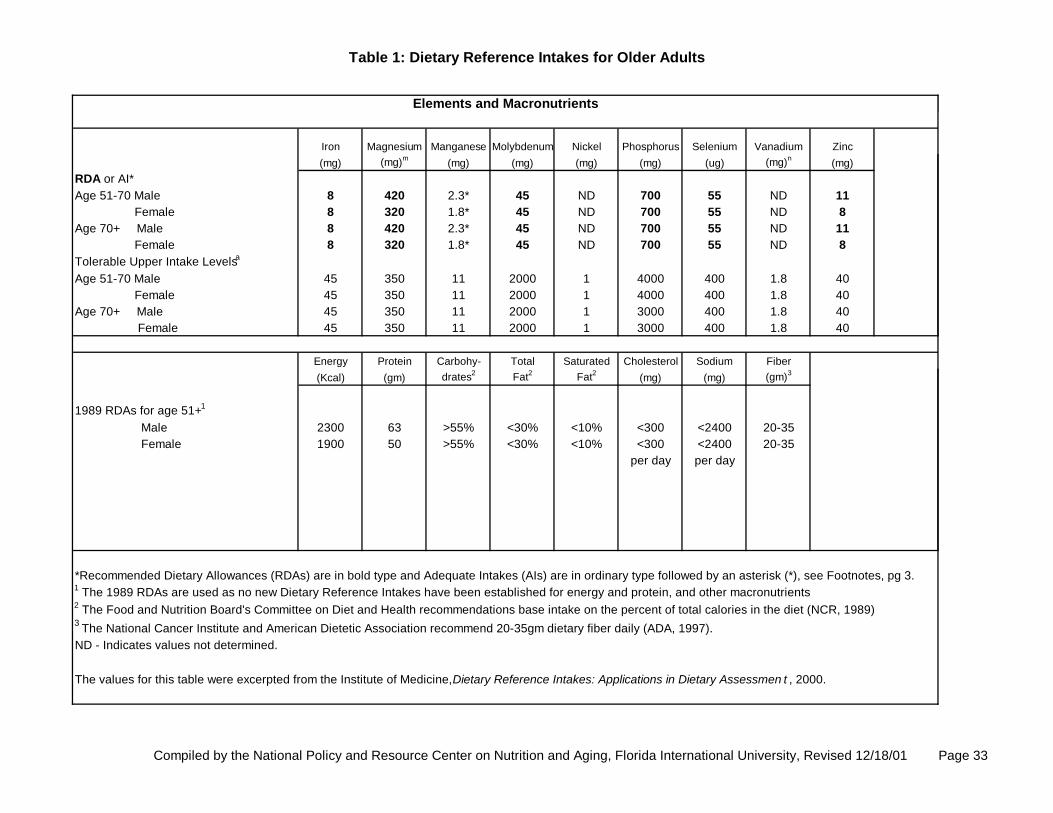
Table 1: Dietary Reference Intakes for Older Adults
Iron Magnesium Manganese Molybdenum Nickel Phosphorus Selenium Vanadium Zinc(mg) (mg)m (mg) (mg) (mg) (mg) (ug) (mg)n (mg)
RDA or AI*Age 51-70 Male 8 420 2.3* 45 ND 700 55 ND 11 Female 8 320 1.8* 45 ND 700 55 ND 8Age 70+ Male 8 420 2.3* 45 ND 700 55 ND 11 Female 8 320 1.8* 45 ND 700 55 ND 8Tolerable Upper Intake Levelsa
Age 51-70 Male 45 350 11 2000 1 4000 400 1.8 40 Female 45 350 11 2000 1 4000 400 1.8 40Age 70+ Male 45 350 11 2000 1 3000 400 1.8 40 Female 45 350 11 2000 1 3000 400 1.8 40
Energy Protein Carbohy- Total Saturated Cholesterol Sodium Fiber(Kcal) (gm) drates2 Fat2 Fat2 (mg) (mg) (gm)3
1989 RDAs for age 51+1
Male 2300 63 >55% <30% <10% <300 <2400 20-35 Female 1900 50 >55% <30% <10% <300 <2400 20-35
per day per day
*Recommended Dietary Allowances (RDAs) are in bold type and Adequate Intakes (AIs) are in ordinary type followed by an asterisk (*), see Footnotes, pg 3.1 The 1989 RDAs are used as no new Dietary Reference Intakes have been established for energy and protein, and other macronutrients2 The Food and Nutrition Board's Committee on Diet and Health recommendations base intake on the percent of total calories in the diet (NCR, 1989)3 The National Cancer Institute and American Dietetic Association recommend 20-35gm dietary fiber daily (ADA, 1997).ND - Indicates values not determined.
The values for this table were excerpted from the Institute of Medicine, Dietary Reference Intakes: Applications in Dietary Assessmen t , 2000.
Elements and Macronutrients
Compiled by the National Policy and Resource Center on Nutrition and Aging, Florida International University, Revised 12/18/01 Page 33

Compiled by the National Policy and Resource Center on Nutrition and Aging, Florida International University, Revised 12/18/01 Page 34
Table 1: Dietary Reference Intakes for Older Adults NOTE: This table (taken from the DRI reports, see www.nap.edu) presents the Recommended Dietary Allowances (RDAs) in bold type and Adequate Intakes (AIs) in ordinary type followed by an asterisk (*). RDAs and AIs may both be used as goals for individual intake. RDAs are set to meet the needs of almost all (97 to 98 percent) individuals in a group. The AI for life stage and gender groups (other than healthy, breastfed infants) is believed to cover needs of all individuals in the group, but lack of data or uncertainty in the data prevent being able to specify with confidence the percentage of individuals covered by this intake. Footnotes a UL = The maximum level of daily nutrient intake that is likely to pose no risk of adverse effects. Unless otherwise specified, the UL represents total intake from food, water, and supplements. Due to lack of suitable data, ULs could not be established for Vitamin K, thiamin, riboflavin, vitamin B12, pantothenic acid, biotin, or carotenoids. In the absence of ULs, extra caution may be warranted in consuming levels above recommended intakes. b As retinal activity equivalents (RAEs). 1 RAE = 1 ug retinal, 12 ug B-carotene, or 24 ug B-cryptoxanthin. To calculate RAEs from the REs of provitamin A carotenoids in foods, divide the REs by 2. For preformed vitamin A in foods or supplements and for provitamin A carotenoids in supplements, 1 RE = 1 RAE. c ULs - As preformed vitamin A only. d cholecalciferol. 1 ug cholecalciferol = 40 IU vitamin D. e In the absence of adequate exposure to sunlight. f as alpha-tocopherol. Alpha-Tocopherol includes RRR-alpha-tocopherol, the only form of alpha-tocopherol that occurs naturally in foods, and the 2R-steroisomeric forms of alpha-tocopherol (RRR-, RSR-, RRS-, and RSS-alpha-tocopherol) that occur in fortified foods and supplements. It does not include the 2S-stereoisomeric forms of alpha-tocopherol (SRR-, SSR-, SRS-, SSS-alpha-tocopherol), also found in fortified foods and supplements. g ULs - as alpha-tocopherol; applies to any form of supplemental alpha-tocopherol. h The ULs for vitamin E, niacin, and folate apply to synthetic forms obtained from supplements, fortified foods, or a combination of the two. i As niacin equivalents (NE). 1 mg of niacin = 60 mg of tryptophan: 0-6 months = preformed niacin (not NE). j As dietary folate equivalents (DFE). 1 DFE = 1 ug food folate = 0.6 ug of folic acid from fortified food or as a supplement consumed with food = 0.5 ug of a supplement taken on an empty stomach. k Because 10 to 30 percent of older people may malabsorb food-bound B12, it is advisable for those older than 50 years to meet their RDA mainly by consuming foods fortified with B12 or a supplement containing B12. l Although AIs have been set for choline, there are few data to assess whether a dietary supply of choline is needed at all stages of the life cycle, and it may be that the choline requirement can be met by endogenous synthesis at some of these stages. m The ULs for magnesium represent intake from a pharmacological agent only and do not include intake from food and water. n Although vanadium in food has not been shown to cause adverse effects in humans, there is no justification for adding vanadium to food and vanadium supplements should be used with caution. The UL is based on adverse effects in laboratory animals and this data could be used to set a UL for adults but not children and adolescents.

Table 2: Nutrient Availability of an Older Americans Nutrition Program Meal Relativeto the Dietary Reference Intakes and Recommended Dietary Allowances
Vitamin A Vitamin C Vitamin D Vitamin E Vitamin K Thiamin Riboflavin Niacin Vitamin B6 Folate(ug)b,c (mg) (ug)d,e (mg)f,g,h (ug) (mg) (mg) (mg)h,i (mg) (ug)h,j
OAA Standards: 1/3 DRI: RDA or AI1
Age 51-70 or 70+2 300 30 5* 5 40* 0.4 0.43 5.3 0.6 133
OAA Standards: 1/3 1989 RDAAge 51+2 333 20 1.6 3.3 26.6 0.4 0.46 5.0 0.6 66
OAA Nutrition Program Evaluation3 Average Title III Meal Content4
Congregate Meal Male 730 42 3.6 4.1 ND 0.7 0.89 8.8 0.8 105 Female 730 42 3.6 4.1 ND 0.7 0.89 8.7 0.8 105Home Delivered Meal Male 942 36 3.6 4.0 ND 0.7 0.92 10.1 0.9 104 Female 942 36 3.6 4.0 ND 0.7 0.92 10.1 0.9 104
Average Title VI Meal Content4
Congregate Meal Male 637 48 2.6 4.1 ND 0.7 0.81 8.9 0.7 106 Female 637 48 2.6 4.1 ND 0.7 0.80 8.9 0.7 106Home Delivered Meal Male 734 38 3.0 3.4 ND 0.7 0.82 9.4 0.8 94 Female 734 38 3.0 3.4 ND 0.7 0.82 9.4 0.8 94
1 Recommended Dietary Allowances (RDAs) are in bold type and Adequate Intakes (AIs) are in ordinary type followed by an asterisk (*). See Footnotes, page 5.2 Unisex values equal the highest values for age 51+ (1989 RDAs) and ages 51-70 or 70+ ( DRIs).3 National Evaluation of the Elderly Nutrition Program 1993-1995, Mathematica Policy Research, Inc., 1996.4 Compared to the 1989 RDAs (Mathematica Policy Research, Inc., 1996).ND - Indicates values not determined.
The DRI values for this table were excerpted from the Institute of Medicine, Dietary Reference Intakes: Applications in Dietary Assessment, 2000.
Vitamins and Elements
Compiled by the National Policy and Resource Center on Nutrition and Aging, Florida International University, Revised 12/18/01 Page 35

Table 2: Nutrient Availability of an Older Americans Nutrition Program Meal Relativeto the Dietary Reference Intakes and Recommended Dietary Allowances
Vitamin B12 Pantothenic Biotin Choline Boron Calcium Chromium Copper Fluoride Iodine(ug)k Acid (mg) (ug) (mg)l (mg) (mg) (ug) (ug) (mg) (ug)
OAA Standards: 1/3 DRI: RDA or AI1
Age 51-70 or 70+2 0.8 1.7* 10* 183* ND 400* 10* 300 1.3* 50
OAA Standards: 1/3 1989 RDAAge 51+2 0.7 ND ND ND ND 267 ND ND 26.7 50
OAA Nutrition Program Evaluation3
Average Title III Meal Content4
Congregate Meal Male 2.2 ND ND ND ND 450 ND ND ND ND Female 2.2 ND ND ND ND 450 ND ND ND NDHome Delivered Meal Male 1.8 ND ND ND ND 462 ND ND ND ND Female 1.8 ND ND ND ND 462 ND ND ND ND
Average Title VI Meal Content4
Congregate Meal Male 2.0 ND ND ND ND 398 ND ND ND ND Female 2.0 ND ND ND ND 398 ND ND ND NDHome Delivered Meal Male 1.7 ND ND ND ND 375 ND ND ND ND Female 1.7 ND ND ND ND 375 ND ND ND ND
1 Recommended Dietary Allowances (RDAs) are in bold type and Adequate Intakes (AIs) are in ordinary type followed by an asterisk (*). See Footnotes, page 5.2 Unisex values equal the highest values for age 51+ (1989 RDAs) and ages 51-70 or 70+ ( DRIs).3 National Evaluation of the Elderly Nutrition Program 1993-1995, Mathematica Policy Research, Inc., 1996.4 Compared to the 1989 RDAs (Mathematica Policy Research, Inc., 1996).ND - Indicates values not determined.
The DRI values for this table were excerpted from the Institute of Medicine, Dietary Reference Intakes: Applications in Dietary Assessment, 2000.
Vitamins and Elements
Compiled by the National Policy and Resource Center on Nutrition and Aging, Florida International University, Revised 12/18/01 Page 36

Table 2: Nutrient Availability of an Older Americans Nutrition Program Meal Relativeto the Dietary Reference Intakes and Recommended Dietary Allowances
Iron Magnesium Manganese Molybdenum Nickel Phosphorus Selenium Vanadium Zinc(mg) (mg)m (mg) (mg) (mg) (mg) (ug) (mg)n (mg)
OAA Standards: 1/3 DRI: RDA or AI1
Age 51-70 or 70+2 2.7 140 0.8* 15 ND 233 18 ND 3.7
OAA Standards: 1/3 1989 RDAAge 51+2 3.3 117 ND ND ND 267 23 ND 5.0
OAA Nutrition Program Evaluation3
Average Title III Meal Content4
Congregate Meal Male 5.5 130 ND ND ND 605 ND ND 5.0 Female 5.5 130 ND ND ND 605 ND ND 4.9Home Delivered Meal Male 5.3 134 ND ND ND 622 ND ND 4.9 Female 5.3 134 ND ND ND 622 ND ND 5.0
Average Title VI Meal Content4
Congregate Meal Male 5.5 115 ND ND ND 578 ND ND 5.0 Female 5.5 129 ND ND ND 578 ND ND 5.0Home Delivered Meal Male 4.6 115 ND ND ND 562 ND ND 4.2 Female 4.6 115 ND ND ND 562 ND ND 4.2
1 Recommended Dietary Allowances (RDAs) are in bold type and Adequate Intakes (AIs) are in ordinary type followed by an asterisk (*). See Footnotes, page 5.2 Unisex values equal the highest values for age 51+ (1989 RDAs) and ages 51-70 or 70+ ( DRIs).3 National Evaluation of the Elderly Nutrition Program 1993-1995, Mathematica Policy Research, Inc., 1996.4 Compared to the 1989 RDAs (Mathematica Policy Research, Inc., 1996).ND - Indicates values not determined.
The DRI values for this table were excerpted from the Institute of Medicine, Dietary Reference Intakes: Applications in Dietary Assessment, 2000.
Vitamins and Elements
Compiled by the National Policy and Resource Center on Nutrition and Aging, Florida International University, Revised 12/18/01 Page 37

Table 2: Nutrient Availability of an Older Americans Nutrition Program Meal Relative to the Dietary Reference Intakes and Recommended Dietary Allowances
Energy Protein Carbohy- Total Saturated Cholesterol Sodium Fiber(Kcal)5 (gm)5 drates6 Fat6 Fat6 (mg) (mg) (gm)7
OAA Standards: Dietary Guidelines for Americans >55% <30% <10% <300 <2400
per day per dayNational Cancer Institute8 20-35
OAA Standards: 1/3 1989 RDAAge 51+ 2 767 21
OAA Nutrition Program Evaluation3
Average Title III Meal Content4
Congregate Meal 828 37 49% 35% 12% 87 1162 ND
Home Delivered Meal 849 41 49% 34% 12% 71 951 ND
Average Title VI Meal Content4
Congregate Meal 840 36 49% 35% 13% 86 1390 ND
Home Delivered Meal 768 37 47% 35% 11% 62 1229 ND
1 Recommended Dietary Allowances (RDAs) are in bold type and Adequate Intakes (AIs) are in ordinary type followed by an asterisk (*). See Footnotes, page 5.2 Unisex values equal the highest values for age 51+ (1989 RDAs) and ages 51-70 or 70+ ( DRIs).3 National Evaluation of the Elderly Nutrition Program 1993-1995, Mathematica Policy Research, Inc., 1996.4 Compared to the 1989 RDAs (Mathematica Policy Research, Inc., 1996).5 The 1989 RDAs are used as no new Dietary Reference Intakes have been established for energy and protein, and other macronutrients.6 The Food and Nutrition Board's Committee on Diet and Health recommendations base intake on the percent of total calories in the diet (NCR, 1989).7 The National Cancer Institute and American Dietetic Association recommend 20-35gm dietary fiber daily (ADA, 1997).8 This is not an OAA Standard. However, the information is provided for comparison purposes.ND - Indicates values not determined.
The DRI values for this table were excerpted from the Institute of Medicine, Dietary Reference Intakes: Applications in Dietary Assessment, 2000.
Macronutrients
Compiled by the National Policy and Resource Center on Nutrition and Aging, Florida International University, Revised 12/18/01 Page 38

Compiled by the National Policy and Resource Center on Nutrition and Aging, Florida International University, Revised 12/18/01 Page 39
Table 2: Nutrient Availability of an Older Americans Nutrition Program Meal Relative to the Dietary Reference Intakes and Recommended Dietary Allowances
NOTE: This table (taken from the DRI reports, see www.nap.edu) presents the Recommended Dietary Allowances (RDAs) in bold type and Adequate Intakes (AIs) in ordinary type followed by an asterisk (*). RDAs and AIs may both be used as goals for individual intake. RDAs are set to meet the needs of almost all (97 to 98 percent) individuals in a group. The AI for life stage and gender groups (other than healthy, breastfed infants) is believed to cover needs of all individuals in the group, but lack of data or uncertainty in the data prevent being able to specify with confidence the percentage of individuals covered by this intake. Footnotes a UL = The maximum level of daily nutrient intake that is likely to pose no risk of adverse effects. Unless otherwise specified, the UL represents total intake from food, water, and supplements. Due to lack of suitable data, ULs could not be established for Vitamin K, thiamin, riboflavin, vitamin B12, pantothenic acid, biotin, or carotenoids. In the absence of ULs, extra caution may be warranted in consuming levels above recommended intakes. b As retinal activity equivalents (RAEs). 1 RAE = 1 ug retinal, 12 ug B-carotene, or 24 ug B-cryptoxanthin. To calculate RAEs from the REs of provitamin A carotenoids in foods, divide the REs by 2. For preformed vitamin A in foods or supplements and for provitamin A carotenoids in supplements, 1 RE = 1 RAE. c ULs - As preformed vitamin A only. d cholecalciferol. 1 ug cholecalciferol = 40 IU vitamin D. e In the absence of adequate exposure to sunlight. f as alpha-tocopherol. Alpha-Tocopherol includes RRR-alpha-tocopherol, the only form of alpha-tocopherol that occurs naturally in foods, and the 2R-steroisomeric forms of alpha-tocopherol (RRR-, RSR-, RRS-, and RSS-alpha-tocopherol) that occur in fortified foods and supplements. It does not include the 2S-stereoisomeric forms of alpha-tocopherol (SRR-, SSR-, SRS-, SSS-alpha-tocopherol), also found in fortified foods and supplements. g ULs - as alpha-tocopherol; applies to any form of supplemental alpha -tocopherol. h The ULs for vitamin E, niacin, and folate apply to synthetic forms obtained from supplements, fortified foods, or a combination of the two. i As niacin equivalents (NE). 1 mg of niacin = 60 mg of tryptophan: 0-6 months = preformed niacin (not NE). j As dietary folate equivalents (DFE). 1 DFE = 1 ug food folate = 0.6 ug of folic acid from fortified food or as a supplement consumed with food = 0.5 ug of a supplement taken on an empty stomach. k Because 10 to 30 percent of older people may malabsorb food -bound B12, it is advisable for those older than 50 years to meet their RDA mainly by consuming foods fortified with B12 or a supplement containing B12. l Although AIs have been set for choline, there are few data to assess whether a dietary supply of choline is needed at all stages of the life cycle, and it may be that the choline requirement can be met by endogenous synthesis at some of these stages. m The ULs for magnesium represent intake from a pharmacological agent only and do not include intake from food and water. n Although vanadium in food has not been shown to cause adverse effects in humans, there is no justification for adding vanadium to food and vanadium supplements should be used with caution. The UL is based on adverse effects in laboratory animals and this data could be used to set a UL for adults but not children and adolescents.

Issue Panel Table 3.Comparison of National Studies for Mean Nutrient Intakes of Older Adults
Macronutrientsmen women men women men women men women
RDA/AI 2300 1900 63 50 76.67 63.3 27.5 27.5NHANES III (1989-94)ab
White Aged 60 - 69 2118* 1602* 85 64 81 60* 17.8* 15.2* Aged 70 - 79 1924* 1431* 75 57 74* 53* 17.7* 14.7* Aged 80 + 1802* 1335* 69 52 69* 47* 17.1* 12.8*Black Aged 60 - 69 1882* 1402* 78 56 73* 53* 13.9* 12.6* Aged 70 - 79 1532* 1457* 63 62 59* 58* 12.9* 13.2* Aged 80 + n/a 1272* n/a 50 n/a 42* n/a 11.8*Mexican-Amer Aged 60 - 69 1963* 1297* 78 56 73* 46* 20.9* 13.7* Aged 70 - 79 1660* 1290* 73 50 59* 45* 18.0* 13.0* Aged 80 + n/a n/a n/a n/a n/a n/a n/a n/aCSFII (1994-96)ab
Aged 60 - 69 2039* 1436* 82.8 59.4 76.8 52.4* 18.0* 13.6* Aged 70 - 79 1839* 1393* 72.3 56.7 63.5* 49.8* 17.7* 14.0* Aged 80 + 1699* 1332* 68.2 55.4 63.4* 47.7* 15.6* 13.9*Nat'l Eval ENP (1993-95)ac Cong HDM Cong HDMParticipants (Cong=1040,HDM=818) 1655* 1485* 69 63.1Non-Participants (Cong=841, HDM=841) 1503* 1417* 63.2 59.7* Mean Intake Less than Recommended Valuea NHANES III: 6830 adults > 50y; CSFII: 4700 men, 4370 women > 60y; Natl Eval: > 60yb Data excerpted from: Wakimoto P, Block G. Dietary Intake, Dietary Patterns, and Changes With Age: An Epidemiological Perspective. J Gerontol. 2001;56A Special Issue II: 65-90c Data excerpted from: Serving Elders At Risk. National Evaluation of the Elderly Nutrition Program, 1993-1995.
Fat(g)
Fiber(g)
Energy(kcals)
Protein(g)
Prepared by National Policy and Resource Center on Nutrition and Aging, Spring 2002. Page 40

Issue Panel Table 3. Continued
Vitaminsmen women men women men women men women
RDA/AI 900 700 1.2 1.1 1.3 1.1 1.7 1.5NHANES IIIWhite Aged 60 - 69 1351 1269 1.83 1.46 2.26 1.77 2.09 1.67 Aged 70 - 79 1368 1303 1.72 1.31 2.11 1.61 1.96 1.62 Aged 80 + 1227 1195 1.67 1.30 1.99 1.60 1.93 1.57Black Aged 60 - 69 959 1147 1.52 1.18 1.74 1.28 1.52* 1.29* Aged 70 - 79 1193 1297 1.43 1.24 1.73 1.43 1.65* 1.38* Aged 80 + n/a n/a n/a 1.31 n/a 1.52 n/a 1.43*Mexican-Amer Aged 60 - 69 1171 784 1.55 1.10 1.90 1.40 1.68* 1.30* Aged 70 - 79 1382 1316 1.51 1.11 1.67 n/a 1.67* n/a Aged 80 + n/a n/a n/a n/a n/a n/a n/a n/aCSFII 94-96 Aged 60 - 69 1261 985 1.73 1.26 2.06 1.48 2.04 1.46* Aged 70 - 79 1339 1031 1.63 1.24 2.03 1.52 1.94 1.5 Aged 80 + 1059 1149 1.49 1.20 1.76 1.52 1.73 1.5National Evaluation Cong HDM Cong HDM Cong HDM Cong HDM Participants 1356 1276 1.55 1.42 1.82 1.78 1.75 1.6 Non-Participants 1078 1058 1.44 1.39 1.59 1.55 1.59* 1.5** Indicates Mean Intakes Lower than Recommended Values
(mg) (mg)Vitamin A
(RE)Riboflavin Vitamin B6
(mg)Thiamin
Prepared by National Policy and Resource Center on Nutrition and Aging, Spring 2002. Page 41

Issue Panel Table 3. Continued
Vitaminsmen women men women men women men women
RDA/AI 2.4 2.4 400 400 90 75 15 15NHANES IIIWhite Aged 60 - 69 6.25 4.08 335 285 106 112 10.08* 8.74* Aged 70 - 79 5.36 3.50 310 274 102 97 8.91* 7.81* Aged 80 + 6.12 3.29 310 256 98 106 9.45* 7.66*Black Aged 60 - 69 5.18 3.82 259 240 87* 105 6.88* 6.03* Aged 70 - 79 4.89 4.10 257 234 96 100 9.28* 6.47* Aged 80 + n/a n/a n/a n/a n/a 94 n/a 5.40*Mexican-Amer Aged 60 - 69 6.12 3.44 327 207 111 84 7.61* 5.97* Aged 70 - 79 n/a n/a 244 212 127 86 6.85* 6.2* Aged 80 + n/a n/a n/a n/a n/a n/a n/a n/aCSFII Aged 60 - 69 6.2 4.1 287 213 104 89 9.03* 6.60* Aged 70 - 79 6.4 4.1 287 225 98 93 8.71* 6.51* Aged 80 + 4.4 4.8 244 224 93 89 7.10* 5.97*National Evaluation Cong HDM Cong HDM Cong HDM Cong HDM Participants 4.06 4.27 266.6 249 99 88.8 8.19* 6.6* Non-Participants 3.7 3.6 245 233 84.18* 83.4 6.6* 6.5** Indicates Mean Intakes Lower than Recommended Values
Vitamin B12 Folate Vitamin C Vitamin E( mg) (ug) (mg) (mg a-TE)
Prepared by National Policy and Resource Center on Nutrition and Aging, Spring 2002. Page 42

Issue Panel Table 3. Continued
Mineralsmen women men women men women men women men women
RDA/AI 8 8 11 8 1200 1200 420 320 2400 2400NHANES IIIWhite Aged 60 - 69 16.84 13.23 13.38 9.88 895* 743* 333* 265* 3429 2634 Aged 70 - 79 16.10 12.90 12.24 8.79 832* 651* 308* 247* 3192 2379* Aged 80 + 16.65 11.80 10.89* 7.83* 742* 633* 282* 221* 2912 2274*Black Aged 60 - 69 13.24 10.64 10.45* 7.87* 609* 477* 246* 208* 2879 2221* Aged 70 - 79 13.49 11.55 10.73* 8.07 608* 549* 222* 219* 2604 2200* Aged 80 + n/a n/a n/a 7.97* n/a 484* n/a 205* n/a 2008*Mexican-Amer Aged 60 - 69 14.65 10.56 10.64* 8.38 837* 606* 299* 216* 3138 2076* Aged 70 - 79 14.31 11.26 9.99* 7.90* 673* n/a 274* 201* 3098 2013* Aged 80 + n/a n/a n/a n/a n/a n/a n/a n/a n/a n/aCSFII Aged 60 - 69 16.94 11.97 12.22 8.37 769* 578* n/a n/a 3533 2503 Aged 70 - 79 16.47 12.04 11.04 8.13 768* 593* n/a n/a 3106 2385* Aged 80 + 14.52 12.20 10.07* 8.22 693* 583* n/a n/a 2915 2342*National Evaluation Cong HDM Cong HDM Cong HDM Cong HDM Participants 13.1 12.4 10.1* 9.16 740.8* 728.8* 274.9* 249* Non-Participants 12.53 11.9 8.8* 8.5 599.2* 582.4* 237.5* 223.3** Indicates Mean Intakes Lower than Recommended Values
(mg)Iron
(mg)SodiumMagnesiumCalcium
(mg) (mg)Zinc
(mg)
Prepared by National Policy and Resource Center on Nutrition and Aging, Spring 2002. Page 43

Issue Panel Table 3. Continued
Mineralsmen women
RDA/AI 2400 2400NHANES IIIWhite Aged 60 - 69 3429 2634 Aged 70 - 79 3192 2379* Aged 80 + 2912 2274*Black Aged 60 - 69 2879 2221* Aged 70 - 79 2604 2200* Aged 80 + n/a 2008*Mexican-Amer Aged 60 - 69 3138 2076* Aged 70 - 79 3098 2013* Aged 80 + n/a n/aCSFII Aged 60 - 69 3533 2503 Aged 70 - 79 3106 2385* Aged 80 + 2915 2342** Indicates Mean Intakes Lower than Recommended Values
Sodium(mg)
Prepared by National Policy and Resource Center on Nutrition and Aging, Spring 2002. Page 44
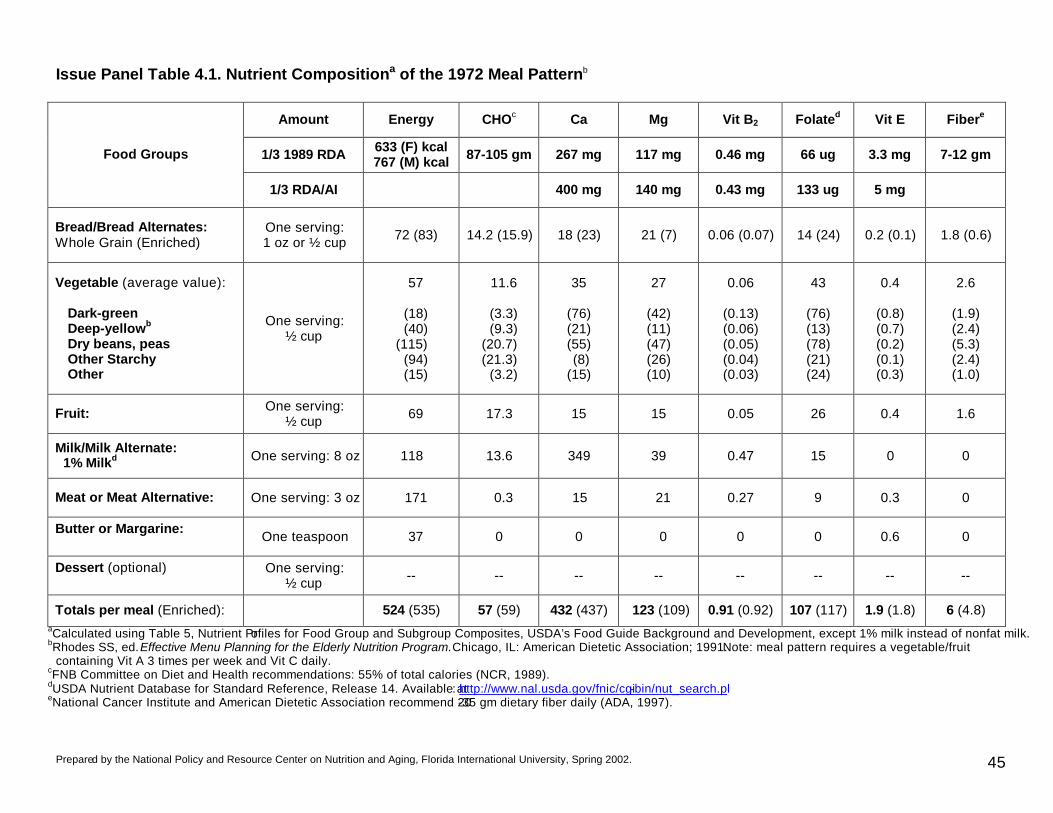
Prepared by the National Policy and Resource Center on Nutrition and Aging, Florida International University, Spring 2002. 45
Issue Panel Table 4.1. Nutrient Compositiona of the 1972 Meal Patternb
Amount Energy CHOc Ca Mg Vit B2 Folated Vit E Fibere
1/3 1989 RDA 633 (F) kcal 767 (M) kcal 87-105 gm 267 mg 117 mg 0.46 mg 66 ug 3.3 mg 7-12 gm Food Groups
1/3 RDA/AI 400 mg 140 mg 0.43 mg 133 ug 5 mg
Bread/Bread Alternates: Whole Grain (Enriched)
One serving: 1 oz or ½ cup 72 (83) 14.2 (15.9) 18 (23) 21 (7) 0.06 (0.07) 14 (24) 0.2 (0.1) 1.8 (0.6)
Vegetable (average value): Dark-green Deep-yellowb Dry beans, peas Other Starchy Other
One serving: ½ cup
57
(18) (40)
(115) (94) (15)
11.6
(3.3) (9.3)
(20.7) (21.3)
(3.2)
35
(76) (21) (55) (8)
(15)
27
(42) (11) (47) (26) (10)
0.06
(0.13) (0.06) (0.05) (0.04) (0.03)
43
(76) (13) (78) (21) (24)
0.4
(0.8) (0.7) (0.2) (0.1) (0.3)
2.6
(1.9) (2.4) (5.3) (2.4) (1.0)
Fruit: One serving: ½ cup 69 17.3 15 15 0.05 26 0.4 1.6
Milk/Milk Alternate: 1% Milkd One serving: 8 oz 118 13.6 349 39 0.47 15 0 0
Meat or Meat Alternative: One serving: 3 oz 171 0.3 15 21 0.27 9 0.3 0
Butter or Margarine: One teaspoon 37 0 0 0 0 0 0.6 0
Dessert (optional)
One serving: ½ cup -- -- -- -- -- -- -- --
Totals per meal (Enriched): 524 (535) 57 (59) 432 (437) 123 (109) 0.91 (0.92) 107 (117) 1.9 (1.8) 6 (4.8) aCalculated using Table 5, Nutrient Profiles for Food Group and Subgroup Composites, USDA’s Food Guide Background and Development, except 1% milk instead of nonfat milk. bRhodes SS, ed. Effective Menu Planning for the Elderly Nutrition Program. Chicago, IL: American Dietetic Association; 1991. Note: meal pattern requires a vegetable/fruit
containing Vit A 3 times per week and Vit C daily. cFNB Committee on Diet and Health recommendations: 55% of total calories (NCR, 1989). dUSDA Nutrient Database for Standard Reference, Release 14. Available at: http://www.nal.usda.gov/fnic/cgi-bin/nut_search.pl eNational Cancer Institute and American Dietetic Association recommend 20-35 gm dietary fiber daily (ADA, 1997).

Prepared by the National Policy and Resource Center on Nutrition and Aging, Florida International University, Spring 2002. 46
Issue Panel Table 4.2. Nutrient Compositiona of a Meal Pattern to Meet ~33.3% RDA/AI Using the Recommended Number of Servings for “… Women, Some Older Adults (About 1600 Calories)”
Amount Energy CHOb Ca Mg Vit B2 Folatec Vit Ed Fibere Food Groups
1/3 RDA/AI 533 kcal 73 gm 400 mg 140 mg 0.43 mg 133 ug 5 mg 7-12 gm
Breads, cereals, rice & pasta:
Two servings: 1 oz or ½ cup each
One whole grain One enriched
72 83
14.2 15.9
18 23
21 7
0.06 0.07
14 24
0.2 0.1
1.8 0.6
Vegetable (average value): One serving: ½ cup 57 11.6 35 27 0.06 43 0.4 2.6
Fruit: One serving: ½ cup 69 17.3 15 15 0.05 26 0.4 1.6
Milk/Milk Alternate: 1% Milkc One serving: 8 oz 118 13.6 349 39 0.47 15 0 0
Meat or Meat Alternative: One serving: 2.5 oz 143 0.25 12.5 17.5 0.23 7.5 0.25 0
Butter or Margarine: One teaspoon 37 0 0 0 0 0 0.6 0
Desserts (optional): Optional -- -- -- -- -- -- -- --
Total per meal: 579 73 453 127 0.94 130 1.95 7 aCalculated using Table 5, Nutrient Profiles for Food Group and Subgroup Composites, USDA’s Food Guide Background and Development, except 1% milk instead of nonfat milk. b FNB Committee on Diet and Health recommendations: 55% of total calories (NCR, 1989). cUSDA Nutrient Database for Standard Reference, Release 14. Available at: http://www.nal.usda.gov/fnic/cgi-bin/nut_search.pl dNutrient value for Vit E does not account for ingredients used in meal preparation, such as cooking oil, butter, margarine, that would help meet the AI requirement. eNational Cancer Institute and American Dietetic Association recommend 20-35 gm dietary fiber daily (ADA, 1997).

Prepared by the National Policy and Resource Center on Nutrition and Aging, Florida International University, Spring 2002. 47
Issue Panel Table 4.3. Nutrient Compositiona of a Meal Pattern to Meet ~33.3% RDA/AI and the 1989 RDA for Energy (1900 (F) and 2300 (M) Calories)
Amount Energy CHOb Ca Mg Vit B2 Folatec Vit Ed Fibere
Food Groups 1/3 RDA/AI 633 (F) kcal
767 (M) kcal 87-105 gm 400 mg 140 mg 0.43 mg 133 ug 5 mg 7-12 gm
Breads, cereals, rice & pasta:
Three servings: 1 oz or ½ cup each
Two whole grains One enriched
114 83
28.4 15.9
36 23
42 7
0.12 0.07
28 24
0.4 0.1
3.6 0.6
Vegetable (average value): Two servings: ½ cup each 113 23.1 70 54 0.12 85 0.8 5.2
Fruit: One serving: ½ cup 69 17.3 15 15 0.05 26 0.4 1.6
Milk/Milk Alternate: 1% Milkc One serving: 8 oz 118 13.6 349 39 0.47 15 0 0
Meat or Meat Alternative: One serving: 3 oz 171 0.3 15 21 0.27 9 0.3 0
Butter or Margarine: One teaspoon 37 0 0 0 0 0 0.6 0
Desserts (optional): Optional -- -- -- -- -- -- -- --
Total per meal: 705 98.6 508 178 1.1 187 2.6 11 aCalculated using Table 5, Nutrient Profiles for Food Group and Subgroup Composites, USDA’s Food Guide Background and Development, except 1% milk instead of nonfat milk. b FNB Committee on Diet and Health recommendations: 55% of total calories (NCR, 1989). cUSDA Nutrient Database for Standard Reference, Release 14. Available at: http://www.nal.usda.gov/fnic/cgi-bin/nut_search.pl dNutrient value for Vit E does not account for ingredients used in meal preparation, such as cooking oil, butter, margarine, that would help meet the AI requirement. eNational Cancer Institute and American Dietetic Association recommend 20-35 gm dietary fiber daily (ADA, 1997).

DIETARY GUIDELINES FOR AMERICANS, 1980 TO 2000
1980 1985 1990 1995 2000
7 Guidelines 7 Guidelines 7 Guidelines 7 Guidelines 10 Guidelines, clustered into 3 groups
Eat a variety of foods Eat a variety of foods Eat a variety of foods Eat a variety of foods
Aim for a healthy weight Maintain ideal weight Maintain desirable weight
Maintain healthy weight Balance the food you eat with physical activity — maintain or improve your weight
Be physically active each day Aim
for
Fitn
ess
Avoid too mu ch fat, saturated fat, and cholesterol
Avoid too much fat, saturated fat, and cholesterol
Choose a diet low in fat, saturated fat and cholesterol
Let the Pyramid guide your food choices
Choose a variety of grains daily, especially whole grains
Eat foods with adequate starch and fiber
Eat foods with adequate starch and fiber
Choose a diet with plenty of vegetables, fruits and grain projects
Choose a diet with plenty of grain products, vegetables, and fruits
Choose a variety of fruits and vegetables daily
Keep food safe to eat
Bui
ld a
Hea
lthy
Bas
e
Choose a diet low in fat, saturated fat and cholesterol
Choose a diet that is low in saturated fat and cholesterol and moderate in total fat
Avoid too much sugar Avoid too much sugar Use sugars only in moderation
Choose a diet moderate in sugars
Choose beverages and foods to moderate your intake of sugars
Avoid too much sodium Avoid too much sodium
Use salt and sodium only in moderation
Choose a diet moderate in salt and sodium
Choose and prepare foods with less salt
If you drink alcohol, do so in moderation
If you drink alcoholic beverages, do so in moderation
If you drink alcoholic beverages, do so in moderation
If you drink alcoholic beverages, do so in moderation
If you drink alcoholic beverages, do so in moderation
Cho
ose
Sens
ibly
Shading indicates how the order in which the guidelines are presented has changed over time.
Center for Nutrition Policy and Promotion, USDA, May 30, 2000

PART 3
DIRECTORY OF ISSUE PANELISTS

Updated 5/24/02 49
Issue Panel on Dietary Reference Intakes and Dietary Guidelines in Older Americans Act Nutrition Programs Directory
Panelist E-mail Phone/Fax Mailing Address
Bronner, Yvonne, DSc, RD Director [email protected] 443-885-4012
Public Health Program Morgan State University 700 East Cold Spring Lane Jenkins Building, Room 343 Baltimore, MD 21251
Buck, Douglas, PhD, FACN State Nutritionist [email protected] 860-424-5299
860-424-5301
Connecticut Department of Social Services / Elderly Services 25 Sigourney Street, 10th Floor Hartford, CT 06106-5033
Carlin, Joseph, MS, RD, FADA Regional Nutritionist [email protected] 617-565-1170
617-565-4511
Administration on Aging John F. Kennedy Federal Building Room 2075 Boston, MA 02203
Chavez, Noel, PhD, RD Associate Professor [email protected] 312-996-0747
312-996-3551
School of Public Health University of Illinois at Chicago 1603 West Taylor Street MC 923 Chicago, IL 60612-7250
Drzik, Jennifer, MS, RD, LD State Nutritionist [email protected] 410-767-1090
410-333-7943
Maryland Department of Aging 301 West Preston St. Suite 1007 Baltimore, MD 21201
Dwyer, Johanna, DSc, RD Assistant Administrator, Human Nutrition
[email protected] 202-690-3437
USDA Agricultural Research Service 1400 Independence Avenue, SW Whitten Building, Room 351A Washington, DC 20250-0300
Frongillo, Edward Jr., PhD Associate Professor [email protected] 607-255-3153
607-255-1033
Cornell University Division of Nutritional Sciences B17 Savage Hall Ithaca, NY 14853-6301

Updated 5/24/02 50
Panelist E-mail Phone/Fax Mailing Address
Gaston, Nancy, MA, RD Senior Nutritionist [email protected] 703-305-2309
703-305-3400
USDA, Center for Nutrition Policy and Promotion 3101 Park Center Drive, Rm 1034 Alexandria, VA 22302
Hodges, Julie, PhD, RD, FADA Director, Health Care Services [email protected]
800-241-0516 Ext. 3446 800-675-2488
Zartic, Inc. 438 Lavender Drive Rome, GA 30165
Hurd, Bertha, BS Nutritionist [email protected] 213-368-4073
213-368-4020
City of Los Angeles Department of Aging 2404 Wilshire Blvd, Suite 400 Los Angeles, CA 90057
Jackson, Yvonne, PhD, RD Director [email protected] 202-619-2713
202-260-1012
Office of American Indian, Alaskan Native and Native Hawaiian Programs Administration on Aging Wilbur Cohen Building, Room 4743 330 Independence Avenue, SW Washington, DC 20201
Jensen, Gordon, MD, PhD Director, Vanderbilt Center for Human Nutrition
[email protected] 615-936-1288
Vanderbilt Center for Human Nutrition 514 Medical Arts Building Nashville, TN 37212-2279
Johnson, Floristene, MS, RD Senior Aging Program Specialist [email protected] 214-767-2971(w)
214-767-1805 (d)
Administration on Aging 1301 Young Street, Room 736 Dallas, TX 75201
Johnson, Mary Ann, PhD Professor of Foods and Nutrition, Faculty of Gerontology
[email protected] 706-542-2292 706-542-5059 Fax
University of Georgia Department of Food and Nutrition 375A Dawson Hall Athens, GA 30602-3622
Lavine, Linda, RD, LD/N Corporate Dietitian
[email protected] 800-852-2211 727-572-8209 727-392-1551 (h)
GA Food Service, Inc. 12200 32nd Court North St. Petersburg, FL 33716-1847

Updated 5/24/02 51
Panelist E-mail Phone/Fax Mailing Address
Lloyd, Jean, MS, RD Nutritionist [email protected] 202-619-2005
202-260-1012
Administration on Aging, USDHHS Wilbur Cohen Building, Room 4744 330 Independence Avenue, SW Washington, DC 20201
Lutz Brian Acting Director
[email protected] 202-690-7525
Administration on Aging, USDHHS Office for Community -Based Services Wilbur Cohen Bldg, Room 4274 330 Independence Ave, SW Washington, DC 20201
McMurry, Kathryn, MS Nutrition and Food Science Advisor [email protected] 202-401-0751
202-205-0463
Office of Disease Prevention and Health Promotion, USDHHS 200 Independence Avenue, SW Room 738-G Washington, DC 20201
Meyers, Linda, PhD Deputy Director [email protected] 202-334-3153
202-334-2316
Food and Nutrition Board Institute of Medicine Foundry 3037D 2101 Constitution Ave, NW Washington, DC 20418
Netterville, Linda, MA, RD Nutrition Program Manager [email protected] 913-477-8119
913-477-8025
Johnson County Area Agency on Aging 11875 S. Sunset, Suite 200 Olathe, KS 66061
Nichols, Debra, MD, MPH Public Health Advisor [email protected] 202-401-0735
202-205-9478
Office of Disease Prevention and Health Promotion, USDHHS 200 Independence Avenue, SW Room 738-G Washington, DC 20201

Updated 5/24/02 52
Panelist E-mail Phone/Fax Mailing Address
Pegues, Jo Ann, MPA, RD Regional Nutritionist [email protected] 303-844-7818
303-844-2943 Fax
Administration on Aging Federal Office Building 1961 Stout Street, Room 1022 Denver, Colorado 80294
Peppones, Martha, MS, RD Nutrition Director [email protected] 425-290-1264
425-353-1212
Senior Services of Snohomish County 8225 44th Avenue W, Suite O Mukilteo, WA 98275
Russell, Robert, MD Director and Senior Scientist
[email protected] 617-556-3335 617-556-3295
Jean Mayer USDA Human Nutrition Research Center on Aging (HNRC) Tufts University 711 Washington Street Boston, MA 02111
Sharkey, Joe, MPH, RD Nutritionist and Doctoral Candidate [email protected] 919-942-2882
University of North Carolina at Chapel Hill Department of Nutrition 810 Old Mill Road Chapel Hill, NC 27514
Zevan, Sue, RD State Nutritionist [email protected] 602-364-0898
602-542-6575 Fax
Aging and Adult Administration Department of Economic Security 1789 West Jefferson 950A Phoenix, AZ 85007

Updated 5/24/02 53
National Policy and Resource Center on Nutrition and Aging
E-mail Phone/Fax Mailing Address Rosenzweig, Lester, MS, RD Associate Director [email protected] 305-348-1563
Schafer, Peggy, RD Graduate Assistant [email protected] 305-348-1517
Silver, Heidi, PhD, RD, CNSD Associate Director of Research [email protected] 305-348-1682
Weddle, Dian, PhD, RD, FADA Associate Professor and Co-Director
[email protected] 305-348-3234
Wellman, Nancy, PhD, RD, FADA Professor and Director [email protected] 305-348-3184
National Policy and Resource Center
on Nutrition & Aging
Florida International University
University Park, OE 200
Miami, FL 33199
Cogent Research
E-mail Phone/Fax Mailing Address
Steel, Gillian Director of Planning and Strategy [email protected] 617-441-9944
617-441-9966 Fax
Cogent Research LLC 2 Tyler Court Cambridge, MA 02140
White, Christy Principle [email protected] 617-441-9944
617-441-9966 Fax
Cogent Research LLC 2 Tyler Court Cambridge, MA 02140