
Issue No. 6 October ecember 2013 Page 1 · Timor‐Leste Food Security Bulletin – Issue No.6...
8
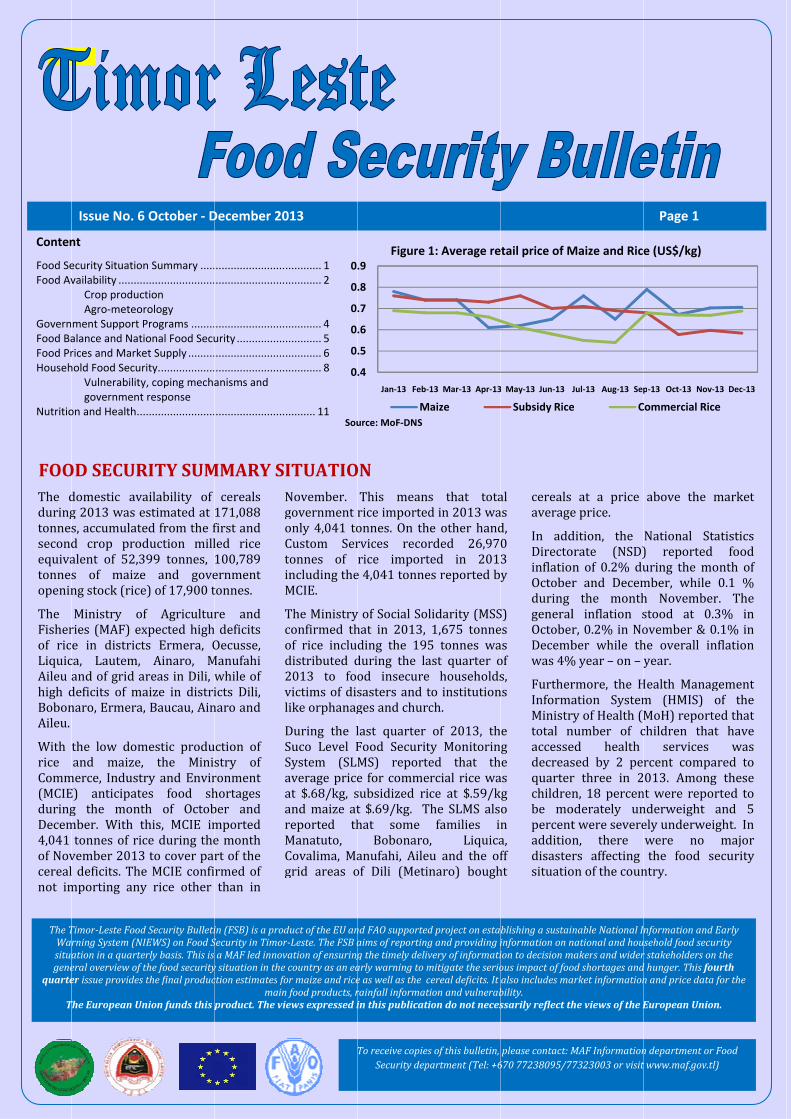
Conten Food Se Food Av Govern Food Ba Food Pr Househ Nutritio FOO The d during tonnes second equiva tonnes openin The Fisher of ric Liquic Aileu high d Bobon Aileu. With rice Comm (MCIE during Decem 4,041 of Nov cereal not im The T Wa situgenquarte T nt ecurity Situatio vailability ........ Crop produc Agro‐meteo ment Support P alance and Nat rices and Marke hold Food Secur Vulnerability government on and Health.. OD SECUR domestic ava g 2013 was e s, accumulate d crop prod alent of 52,3 s of maize ng stock (rice Ministry o ries (MAF) ex e in district ca, Lautem, and of grid a deficits of ma naro, Ermera the low dom and maize, merce, Indust E) anticipate g the mont mber. With t tonnes of ric vember 2013 l deficits. The mporting any Issue No. 6 TimorLeste Food rning System (Nation in a quarte eral overview of er issue provides The European Un Summary ..... ........................ ction rology Programs ........ ional Food Secu et Supply ......... rity................... y, coping mecha t response ........................ RITY SUM ailability of estimated at ed from the f duction mill 399 tonnes, e and gove e) of 17,900 t f Agricultur xpected high ts Ermera, O Ainaro, M areas in Dili, w aize in distri , Baucau, Ain mestic produ the Minis ry and Envir es food sh th of Octob this, MCIE im ce during the 3 to cover par e MCIE confi y rice other 6 October ‐ D d Security Bulleti IEWS) on Food S erly basis. This is the food security s the final produc nion funds this p ....................... ....................... ....................... urity ................ ....................... ....................... anisms and ....................... MMARY SI cereals 171,088 first and led rice 100,789 ernment tonnes. re and h deficits Oecusse, Manufahi while of icts Dili, naro and uction of stry of ronment hortages ber and mported e month rt of the rmed of than in N g o C t i M T c o d 2 v l D S S a a a r M C g December 20 in (FSB) is a prod Security in Timor a MAF led innov y situation in the ction estimates fo main product. The vi ............ 1 ............ 2 ............ 4 ............ 5 ............ 6 ............ 8 .......... 11 Sou ITUATIO November. government only 4,041 to Custom Ser tonnes of including the MCIE. The Ministry confirmed th of rice inclu distributed d 2013 to foo victims of dis like orphanag During the l Suco Level F System (SLM average price at $.68/kg, s and maize at reported th Manatuto, Covalima, Ma grid areas o 0 0 0 0 0 0 013 duct of the EU an rLeste. The FSB a vation of ensuring country as an ea or maize and rice n food products, r ews expressed i urce: MoF‐DNS ON This means rice imported onnes. On th rvices recor rice import e 4,041 tonne y of Social Sol hat in 2013, ding the 195 during the la od insecure sasters and t ges and churc last quarter Food Securit MS) reporte e for comme subsidized ri t $.69/kg. T hat some Bobonaro anufahi, Aile of Dili (Meti .4 .5 .6 .7 .8 .9 Jan‐13 Feb‐ Figure 1 M To receive copies Security dep nd FAO supported aims of reporting g the timely deliv arly warning to m e as well as the c rainfall informat in this publicati s that tota d in 2013 wa e other hand rded 26,97 ted in 201 es reported b lidarity (MSS 1,675 tonne 5 tonnes wa ast quarter o e households to institution ch. of 2013, th ty Monitorin ed that th rcial rice wa ce at $.59/k The SLMS als families in , Liquica u and the of naro) bough 13 Mar‐13 Apr‐13 1: Average re Maize s of this bulletin, partment (Tel: +6 d project on esta g and providing i very of informati mitigate the serio cereal deficits. It ion and vulnerab ion do not neces al as d, 0 3 y S) es as of s, ns e g he as kg o n a, ff ht cereals average In add Directo inflatio October during general October Decemb was 4% Further Informa Ministr total n accesse decreas quarter children be mo percent additio disaster situatio 3 May‐13 Jun‐13 etail price of M Subsidy Rice please contact: M 670 77238095/7 blishing a sustai information on n ion to decision m ous impact of foo also includes ma bility. ssarily reflect th at a price e price. dition, the orate (NSD) n of 0.2% du r and Decem the month l inflation s r, 0.2% in No ber while th % year – on – rmore, the H ation System ry of Health (M number of c ed health sed by 2 pe r three in 2 n, 18 percen oderately un t were severe n, there rs affecting on of the coun Jul‐13 Aug‐13 Sep Maize and Ric e C MAF Information 7323003 or visit nable National I national and hou makers and wider od shortages and arket information he views of the E above the m National Sta ) reported uring the mo mber, while h November stood at 0.3 ovember & 0 he overall in year. Health Manag m (HMIS) o MoH) reporte children that services rcent compa 013. Among nt were repor nderweight ely underwei were no the food se ntry. p‐13 Oct‐13 Nov‐ e (US$/kg) Commercial Ric Page 1 n department or t www.maf.gov.tl nformation and usehold food secu r stakeholders on d hunger. This fou n and price data European Union market atistics food onth of 0.1 % r. The 3% in 0.1% in nflation gement of the ed that t have was ared to g these rted to and 5 ght. In major ecurity 13 Dec‐13 e Food l) Early urity n the urth for the n.
Transcript of Issue No. 6 October ecember 2013 Page 1 · Timor‐Leste Food Security Bulletin – Issue No.6...
Conten
Food SeFood Av
GovernFood BaFood PrHouseh
Nutritio
FOOThe dduringtonnessecondequivatonnesopenin
The Fisherof ricLiquicAileu high dBobonAileu.
With rice Comm(MCIEduringDecem4,041 of Novcerealnot im
The TWasituagene
quarte
T
nt
ecurity Situatiovailability ........
Crop producAgro‐meteo
ment Support Palance and Natrices and Markehold Food Secur
Vulnerabilitygovernment
on and Health ..
OD SECURdomestic avag 2013 was es, accumulated crop prodalent of 52,3s of maizeng stock (rice
Ministry ories (MAF) exe in districtca, Lautem, and of grid adeficits of manaro, Ermera
the low domand maize,
merce, IndustE) anticipateg the montmber. With ttonnes of ricvember 2013l deficits. Themporting any
Issue No. 6
TimorLeste Foodrning System (NIation in a quarteeral overview of er issue provides
The European Un
n Summary .............................ction rology Programs ........ional Food Secuet Supply .........rity. ..................y, coping mechat response ........................
RITY SUMailability of estimated at ed from the fduction mill399 tonnes, e and govee) of 17,900 t
f Agriculturxpected hights Ermera, OAinaro, M
areas in Dili, waize in distri, Baucau, Ain
mestic produ the Minisry and Envires food shth of Octobthis, MCIE imce during the3 to cover pare MCIE confiy rice other
6 October ‐ D
d Security BulletiIEWS) on Food Serly basis. This is the food securitys the final produc
nion funds this p
.......................
.......................
.......................urity ..............................................................anisms and
.......................
MMARY SIcereals 171,088 first and led rice 100,789 ernment tonnes.
re and h deficits Oecusse, Manufahi while of icts Dili, naro and
uction of stry of ronment hortages ber and mported e month rt of the rmed of than in
NgoCtiM
Tcod2vl
DSSaaarMCg
December 20
in (FSB) is a prodSecurity in Timora MAF led innovy situation in the ction estimates fo
mainproduct. The vi
............ 1
............ 2
............ 4
............ 5
............ 6
............ 8
.......... 11 Sou
ITUATIONovember. government only 4,041 toCustom Sertonnes of including theMCIE.
The Ministryconfirmed thof rice includistributed d2013 to foovictims of dislike orphanag
During the lSuco Level FSystem (SLMaverage priceat $.68/kg, sand maize atreported thManatuto, Covalima, Magrid areas o
0
0
0
0
0
0
013
duct of the EU anrLeste. The FSB avation of ensuringcountry as an eaor maize and ricen food products, rews expressed i
urce: MoF‐DNS
ON This meansrice importedonnes. On thrvices recorrice importe 4,041 tonne
y of Social Solhat in 2013, ding the 195during the laod insecuresasters and tges and churc
last quarter Food SecuritMS) reportee for commesubsidized rit $.69/kg. That some
Bobonaroanufahi, Aileof Dili (Meti
.4
.5
.6
.7
.8
.9
Jan‐13 Feb‐
Figure 1
M
To receive copiesSecurity dep
nd FAO supportedaims of reportingg the timely delivarly warning to me as well as the crainfall informatin this publicati
s that totad in 2013 wae other handrded 26,97ted in 201es reported b
lidarity (MSS1,675 tonne5 tonnes waast quarter oe householdsto institutionch.
of 2013, thty Monitorined that thrcial rice wace at $.59/kThe SLMS alsfamilies in, Liquicau and the ofnaro) bough
13 Mar‐13 Apr‐13
1: Average re
Maize
s of this bulletin, partment (Tel: +6
d project on estag and providing ivery of informatimitigate the seriocereal deficits. It tion and vulnerabion do not neces
al as d, 0 3 y
S) es as of s, ns
e g he as kg o n a, ff ht
cereals average
In addDirectoinflatioOctoberduring generalOctoberDecembwas 4%
FurtherInformaMinistrtotal naccessedecreasquarterchildrenbe mopercentadditiodisastersituatio
3 May‐13 Jun‐13
etail price of M
Subsidy Rice
please contact: M670 77238095/7
blishing a sustaiinformation on nion to decision mous impact of fooalso includes mability. ssarily reflect th
at a price e price.
dition, the orate (NSD)n of 0.2% dur and Decemthe month
l inflation sr, 0.2% in Nober while th% year – on –
rmore, the Hation Systemry of Health (Mnumber of ced health sed by 2 per three in 2n, 18 percenoderately unt were severen, there rs affecting on of the coun
Jul‐13 Aug‐13 Sep
Maize and Ric
e C
MAF Information77323003 or visit
nable National Inational and houmakers and widerod shortages andarket information
he views of the E
above the m
National Sta) reported uring the momber, while h Novemberstood at 0.3ovember & 0he overall inyear.
Health Managm (HMIS) oMoH) reportechildren that
services rcent compa013. Amongnt were repornderweight ely underweiwere no the food sentry.
p‐13 Oct‐13 Nov‐
e (US$/kg)
Commercial Ric
Page 1
n department or t www.maf.gov.tl)
nformation and usehold food secur stakeholders ond hunger. This foun and price data f
European Union
market
atistics food
onth of 0.1 % r. The 3% in 0.1% in nflation
gement of the ed that t have
was ared to g these rted to and 5 ght. In major ecurity
13 Dec‐13
e
Food l)
Early urity n the urth for the
n.
Timor‐Leste Food Security Bulletin – Issue No.6 October – December 2013
Page2
FOOD AVAILABILITY
Crop Production
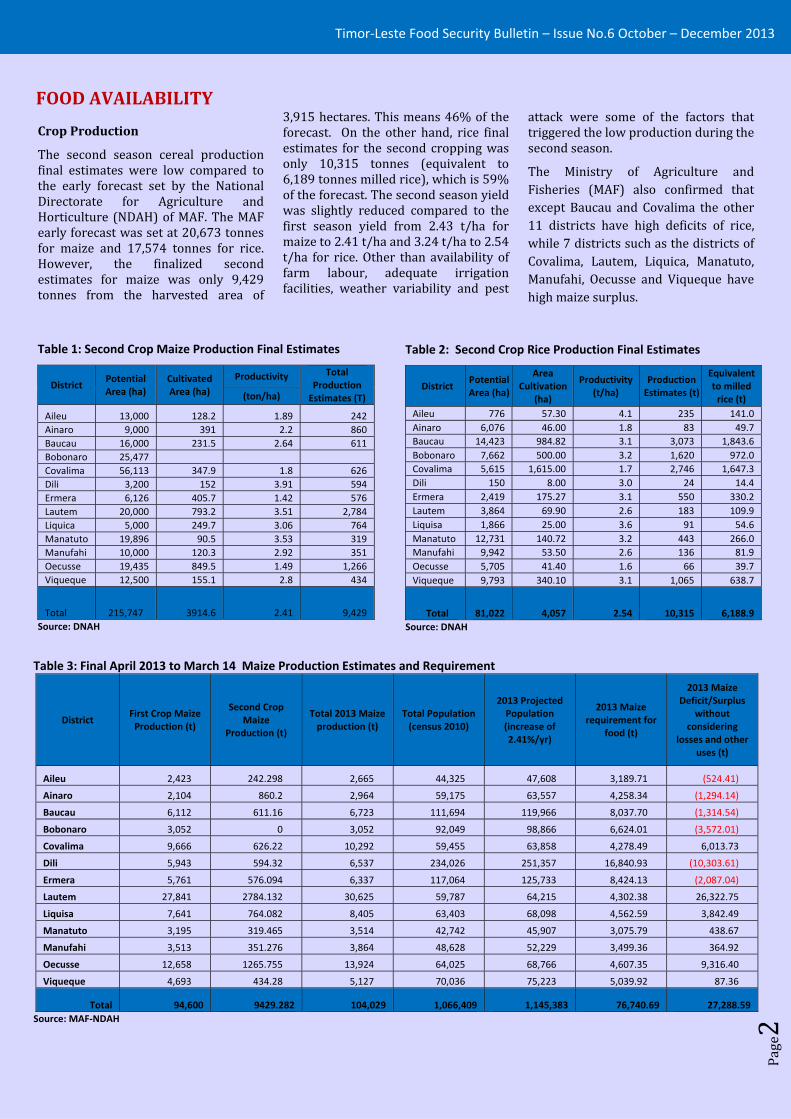
The second season cereal production final estimates were low compared to the early forecast set by the National Directorate for Agriculture and Horticulture (NDAH) of MAF. The MAF early forecast was set at 20,673 tonnes for maize and 17,574 tonnes for rice. However, the finalized second estimates for maize was only 9,429 tonnes from the harvested area of
3,915 hectares. This means 46% of the forecast. On the other hand, rice final estimates for the second cropping was only 10,315 tonnes (equivalent to 6,189 tonnes milled rice), which is 59% of the forecast. The second season yield was slightly reduced compared to the first season yield from 2.43 t/ha for maize to 2.41 t/ha and 3.24 t/ha to 2.54 t/ha for rice. Other than availability of farm labour, adequate irrigation facilities, weather variability and pest
attack were some of the factors that triggered the low production during the second season.
The Ministry of Agriculture and Fisheries (MAF) also confirmed that except Baucau and Covalima the other 11 districts have high deficits of rice, while 7 districts such as the districts of Covalima, Lautem, Liquica, Manatuto, Manufahi, Oecusse and Viqueque have high maize surplus.
Table 1: Second Crop Maize Production Final Estimates
District Potential Area (ha)
Cultivated Area (ha)
Productivity Total Production Estimates (T) (ton/ha)
Aileu 13,000 128.2 1.89 242 Ainaro 9,000 391 2.2 860Baucau 16,000 231.5 2.64 611Bobonaro 25,477 Covalima 56,113 347.9 1.8 626Dili 3,200 152 3.91 594Ermera 6,126 405.7 1.42 576Lautem 20,000 793.2 3.51 2,784Liquica 5,000 249.7 3.06 764Manatuto 19,896 90.5 3.53 319Manufahi 10,000 120.3 2.92 351Oecusse 19,435 849.5 1.49 1,266Viqueque 12,500 155.1 2.8 434
Total 215,747 3914.6 2.41 9,429 Source: DNAH
Table 2: Second Crop Rice Production Final Estimates
District Potential Area (ha)
Area Cultivation
(ha)
Productivity (t/ha)
Production Estimates (t)
Equivalent to milled rice (t)
Aileu 776 57.30 4.1 235 141.0 Ainaro 6,076 46.00 1.8 83 49.7 Baucau 14,423 984.82 3.1 3,073 1,843.6 Bobonaro 7,662 500.00 3.2 1,620 972.0 Covalima 5,615 1,615.00 1.7 2,746 1,647.3 Dili 150 8.00 3.0 24 14.4 Ermera 2,419 175.27 3.1 550 330.2 Lautem 3,864 69.90 2.6 183 109.9 Liquisa 1,866 25.00 3.6 91 54.6 Manatuto 12,731 140.72 3.2 443 266.0 Manufahi 9,942 53.50 2.6 136 81.9 Oecusse 5,705 41.40 1.6 66 39.7 Viqueque 9,793 340.10 3.1 1,065 638.7
Total 81,022 4,057 2.54 10,315 6,188.9 Source: DNAH
Table 3: Final April 2013 to March 14 Maize Production Estimates and Requirement
District First Crop Maize Production (t)
Second Crop Maize
Production (t)
Total 2013 Maize production (t)
Total Population (census 2010)
2013 Projected Population (increase of 2.41%/yr)
2013 Maize requirement for
food (t)
2013 Maize Deficit/Surplus
without considering
losses and other uses (t)
Aileu 2,423 242.298 2,665 44,325 47,608 3,189.71 (524.41)
Ainaro 2,104 860.2 2,964 59,175 63,557 4,258.34 (1,294.14)
Baucau 6,112 611.16 6,723 111,694 119,966 8,037.70 (1,314.54)
Bobonaro 3,052 0 3,052 92,049 98,866 6,624.01 (3,572.01)
Covalima 9,666 626.22 10,292 59,455 63,858 4,278.49 6,013.73
Dili 5,943 594.32 6,537 234,026 251,357 16,840.93 (10,303.61)
Ermera 5,761 576.094 6,337 117,064 125,733 8,424.13 (2,087.04)
Lautem 27,841 2784.132 30,625 59,787 64,215 4,302.38 26,322.75
Liquisa 7,641 764.082 8,405 63,403 68,098 4,562.59 3,842.49
Manatuto 3,195 319.465 3,514 42,742 45,907 3,075.79 438.67
Manufahi 3,513 351.276 3,864 48,628 52,229 3,499.36 364.92
Oecusse 12,658 1265.755 13,924 64,025 68,766 4,607.35 9,316.40
Viqueque 4,693 434.28 5,127 70,036 75,223 5,039.92 87.36
Total 94,600 9429.282 104,029 1,066,409 1,145,383 76,740.69 27,288.59 Source: MAF‐NDAH
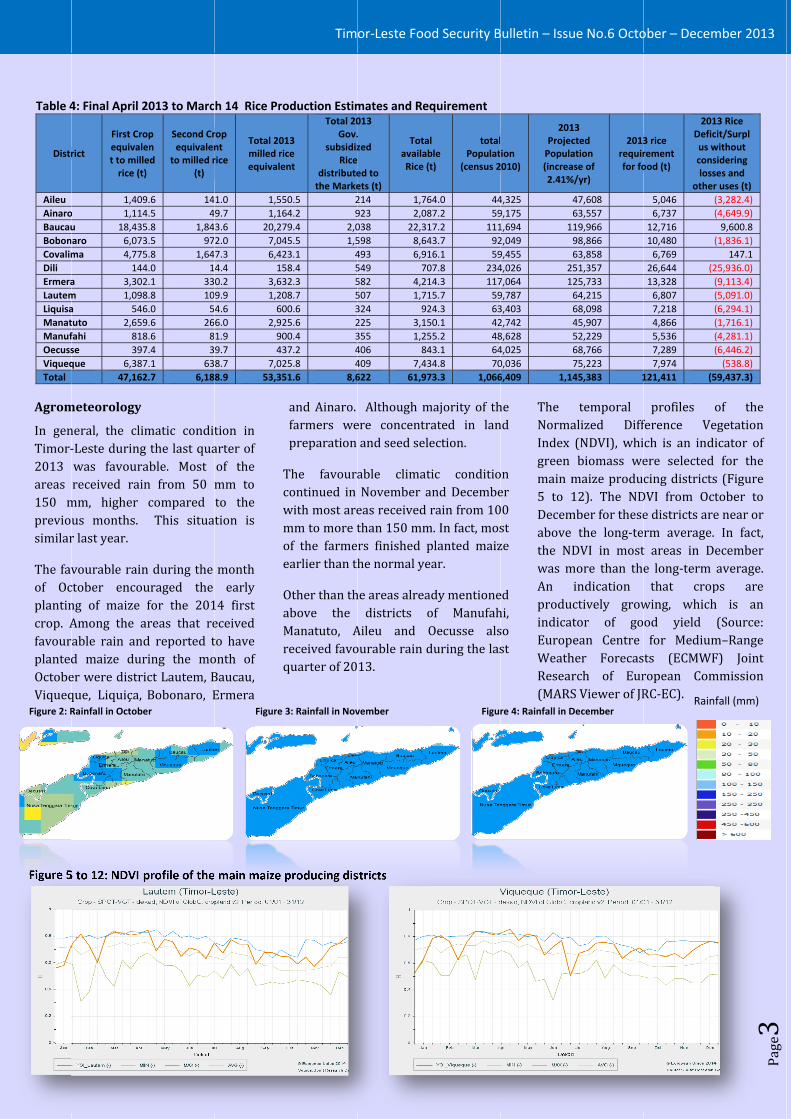
Table 4
Distr
Aileu AinaroBaucauBobonCovalimDili ErmeraLautemLiquisaManatManufOecussViqueqTotal Agrom
In genTimor‐2013 areas 150 mpreviosimilar
The favof Ocplantincrop. AfavourplantedOctobeViqueqFigure 2: R
Figure 5
4: Final April 2
rict
First Croequivalt to millrice (t
1,409o 1,114u 18,435aro 6,073ma 4,775
144a 3,302m 1,098a 546tuto 2,659fahi 818se 397que 6,387
47,162
meteorology
neral, the cli‐Leste duringwas favourareceived raimm, higher us months. r last year.
vourable rainctober encong of maize Among the aable rain and maize durer were distrque, Liquiça, Rainfall in Octob
5 to 12: NDVI
2013 to Marc
op enled t)
Second Crequivalen
to milled r(t)
9.6 144.5 45.8 1,843.5 975.8 1,644.0 12.1 338.8 106.0 59.6 268.6 87.4 37.1 632.7 6,18
imatic conditg the last quaable. Most n from 50 mcompared This situa
n during the uraged the for the 201areas that red reported tring the moict Lautem, BBobonaro, Eer
profile of the
h 14 Rice Pro
rop nt rice
Total 201milled ricequivale
1.0 1,559.7 1,163.6 20,272.0 7,047.3 6,424.4 150.2 3,639.9 1,204.6 606.0 2,921.9 909.7 438.7 7,028.9 53,35
tion in arter of of the mm to to the tion is
month early
14 first eceived to have onth of Baucau, Ermera
Tcwmoe
OaMrq
Figure 3
main maize p
Tim
oduction Estim
13 ce nt
Total 20Gov.
subsidizRice
distributethe Marke
50.5 264.2 979.4 2,045.5 1,523.1 458.4 532.3 508.7 500.6 325.6 200.4 337.2 425.8 451.6 8,6
and Ainaro. farmers wepreparation
The favouracontinued in with most aremm to more tof the farmeearlier than th
Other than thabove the Manatuto, Areceived favoquarter of 20
3: Rainfall in Nov
producing dis
or‐Leste Foo
mates and Re013 . zed ed to ets (t)
TotaavailabRice (
214 1,76923 2,08038 22,31598 8,64493 6,91549 70582 4,21507 1,71324 92225 3,15355 1,25406 84409 7,43622 61,97
Although mere concentrand seed sel
able climatNovember aeas received than 150 mmrs finished phe normal ye
he areas alreadistricts o
Aileu and Oourable rain d13.
vember
stricts
od Security B
quirement
l ble t)
totalPopulat
(census 2
64.0 4487.2 5917.2 11143.7 9216.1 5907.8 23414.3 11715.7 5924.3 6350.1 4255.2 4843.1 6434.8 7073.3 1,066
majority of thrated in lanection.
tic conditioand Decemberain from 10m. In fact, mosplanted maizear.
ady mentioneof ManufahOecusse alsduring the las
Figur
Bulletin – Issu
ion 2010)
201ProjecPopula(increa2.41%
4,325 9,175 1,694 12,049 9,455 4,026 27,064 19,787 3,403 2,742 8,628 4,025 0,036 6,409 1,1
he nd
on er 00 st ze
ed hi, so st
The NormaIndex green main m5 to 1Decemabove the NDwas mAn produindicaEuropWeathResear(MARS
re 4: Rainfall in D
ue No.6 Octo
13 cted ation ase of %/yr)
2013requirfor fo
47,608 63,557 19,966 98,866 63,858 51,357 25,733 64,215 68,098 45,907 52,229 68,766 75,223 45,383 1
temporal alized Diff(NDVI), whibiomass wemaize produ12). The NDmber for thesethe long‐teDVI in mostmore than thindication ctively growtor of goean Centre her Forecasrch of EurS Viewer of JRDecember
ober – Decem
3 rice rement ood (t)
201Deficus wconsloss
other5,046 (6,737 (12,716 10,480 (6,769 26,644 (213,328 (6,807 (7,218 (4,866 (5,536 (7,289 (7,974
121,411 (5
profiles oference Vech is an indiere selected cing districtsDVI from Octe districts arerm average. t areas in De long‐term that crop
wing, whichod yieldfor Medium
sts (ECMWFropean ComRC‐EC). Rain
mber 2013
Page3
13 Rice cit/Surplwithout sidering ses and r uses (t) (3,282.4) (4,649.9) 9,600.8
(1,836.1) 147.1
25,936.0) (9,113.4) (5,091.0) (6,294.1) (1,716.1) (4,281.1) (6,446.2) (538.8)
59,437.3)
of the egetation icator of for the
s (Figure tober to e near or In fact, ecember average. ps are h is an (Source: m–Range F) Joint mmission
fall (mm)
GOVDuringGoverthe Mand Ento abothe optotal oboth nand re$12 forice savailaTibar
The distrib2,003
Source:
Pes
Fe
Figu
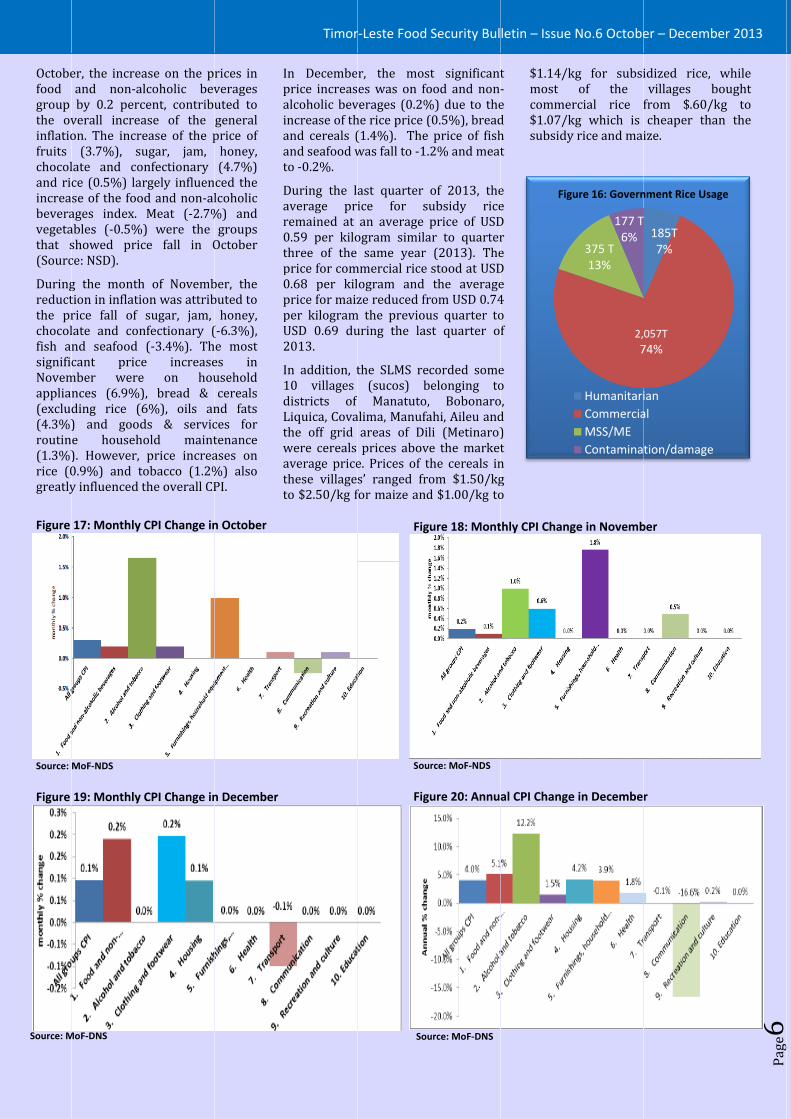
VERNMENg the last qrnment of TMinistry of Cnvironment (out 4,041 topening stock of 8,622 tonnnational and setailers with or 25 kg, thistocks to aboble at the M(Source: MCI
governmenbution slightonnes (Q3
: MAF‐SLMS
0%
sticide
rtiizer
Seeds
ure 13: Access
NT SUPPOquarter of 20Timor‐Leste Commerce, I(MCIE) impornnes, in addof 17,900 toes was distribsub national a whole sale s means a reout 9,116.21MCIE warehIE).
nt subsidytly increase3) to 2,057
50%
s to AgricultuSource
ORT PRO013, the through Industry rted rice dition to onnes. A buted to markets price of maining 1 tonnes house in
y rice ed from tonnes
100%
ral Inputs, by
Tim
OGRAMS during the lathe month distribute smonth of NMCIE clarifidistributing month of Ocfood shortaghigh cereal d
In addition, 185 tonnes response ondistributed and Solidarifamilies, orpveterans, r
y
Self Purchase
Self Produce
NGO Support
Government Support
or‐Leste Foo
ast quarter oof October, subsidy riceNovember anied that themost of the rctober is to ges in areas deficits.
the MCIE alof rice as
n top of theby the Minity (MSS) for phanages, techeligious ins
regional for (Source: DirectoraAssistancMost humanitadistributErmera, Baucau, Lautem areas in D
During thof 2013granted tSocial So
e
t
od Security B
f 2013. ExcepMCIE did noe during thnd Decembee purpose orice during thanticipate thwith reporte
so distributehumanitariae 195 tonneistry of Socifood insecurhnical schooltitutions anwarehouserestockin
MSS‐Nationate for Socice (NDAS
of tharian rice wated in distri
OecussManatut
and off griDili,
he last quart3, MCIE althe Ministry olidarity (MS
Bulletin – Issu
pt ot he er. of he he ed
ed an es al re ls, nd es ng. al al S). he as ct se, to, id
ter lso of SS)
and Mtonnesand hulean se
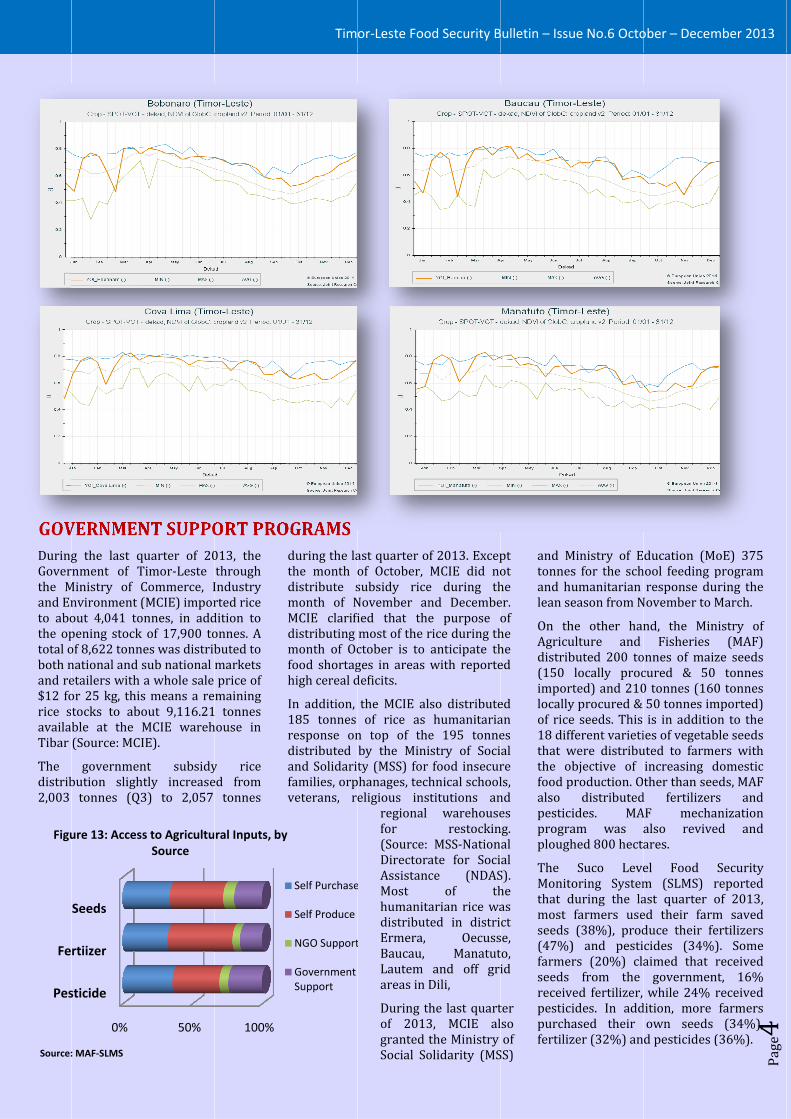
On thAgricudistrib(150 imporlocallyof rice18 diffthat wthe obfood palso pesticiprograplough
The Monitothat dmost seeds (47%)farmerseeds receivpesticipurchafertiliz
ue No.6 Octo
Ministry of Es for the schumanitarian eason from N
he other hanulture and buted 200 tolocally procted) and 210y procured & e seeds. This ferent varietiwere distribubjective of production. Odistributed
ides. MAam was ahed 800 hecta
Suco Leveoring Systemduring the lafarmers use(38%), prod) and pestirs (20%) clafrom the
ved fertilizer, ides. In addased their zer (32%) an
ober – Decem
ducation (Mhool feeding presponse du
November to M
nd, the MinFisheries
onnes of maizcured & 500 tonnes (16050 tonnes imis in additioies of vegetabuted to farmeincreasing dther than seed fertilizerAF mechaalso reviveares.
el Food m (SLMS) rast quarter oed their farmduce their fecides (34%)aimed that governmenwhile 24%
dition, more own seeds d pesticides (
mber 2013
Page4
oE) 375 program uring the March.
nistry of (MAF)
ze seeds tonnes 0 tonnes mported) on to the ble seeds ers with domestic eds, MAF rs and anization ed and
Security reported of 2013, m saved ertilizers ). Some received nt, 16% received farmers (34%),
(36%).
Sourc
FOOThe securibased yearly(Basedrequir67 kg of 1,1Leste compaprodustocksanima
Table
Total aOpeniEstimaEstimaTotal uFood uSeed rFeed uPost hTargetDeficitRequircrops/
FOOStartinNationpublishindexethe Se(CPI).T2013
BoCo
MaMO
Vi
e: MSS
OD BALANgeneral anaity situationon the cal
y maize andd on a per rement per yemaize and e145,383) (So
Standard ared to thuction, exis, other fooal feeds) and p
5: National Fo
availability fromng stocks 1/ ation Productioated productionutilization use 3/ requirement 4/ use 5/ arvest losses 6/ted closing stoct/Surplus red imports/to /food
D PRICESng from Janal Statistic Dhing new es from a neweries 2 ConThe new indhave been
‐
AileuAinaroBaucauobonaroovalima
DiliErmeraLautemLiquisaanatutoanufahiOecussequeque
Figure 1
NCE SHEEalysis of thn of the coulculation of d rice requicapita consear of 106 kgestimated poource: 2008
Living he domesticisting govod uses (seepost harvest
ood Balance S
m domestic sou
n from main sen from second s
/ cks 7/
be covered by
S AND MAanuary 201Directorate (monthly anw food baskensumer Pricedexes from Jn re‐referen
500 1,000
14: Annual Suby D
ET AND Nhe food untry is national irements sumption g for rice, opulation 8 Timor‐Survey), c cereal vernment eds and losses.
Wpnaoa1th2t1tt
Sheet for marRice
urces
eason2/ season
other
ARKET S13 the NDS) is nalytical et called e Index January ced to
DwbHSts
0 1,500 2,0
ubsidy Rice disDistrict
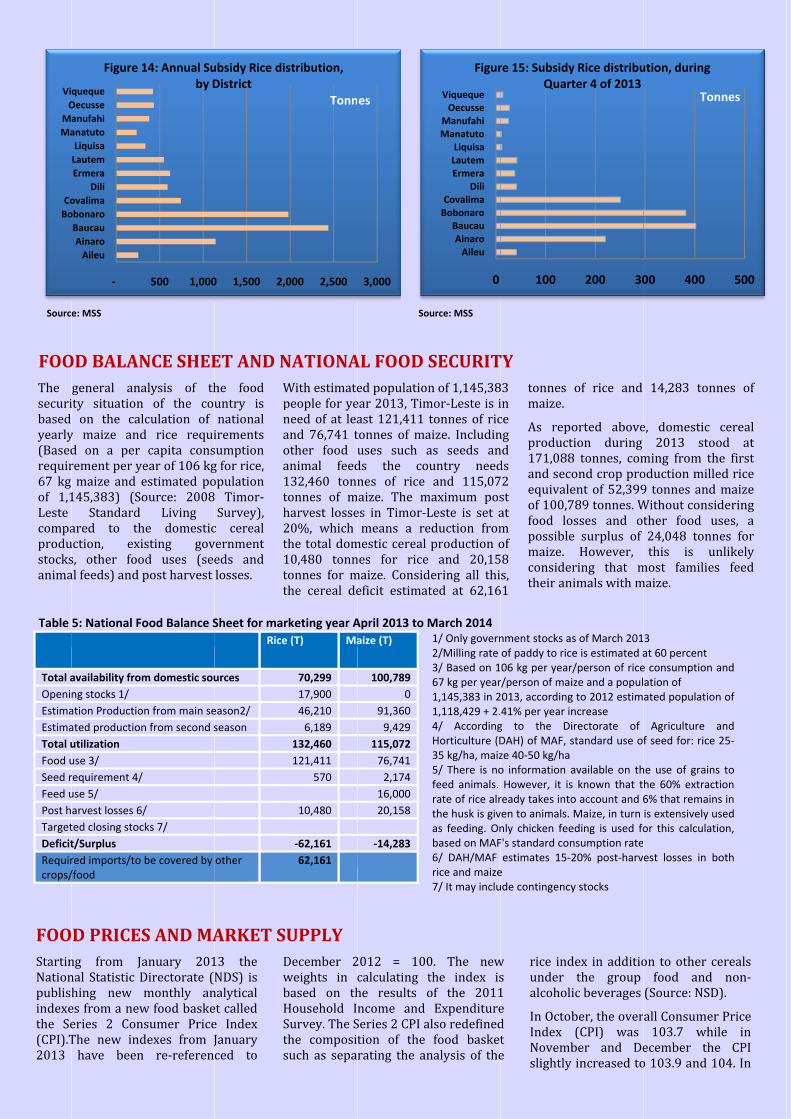
NATIONAWith estimatepeople for yeneed of at leaand 76,741 tother food uanimal feed132,460 tonntonnes of mharvest losse20%, which the total dom10,480 tonntonnes for mthe cereal de
rketing year Ae (T) Ma
70,299 17,900 46,210 6,189
132,460 121,411
570
10,480
‐62,161 62,161
UPPLY December 2weights in cbased on thHousehold ISurvey. The Sthe compositsuch as sepa
000 2,500
stribution,
Tonn
So
AL FOOD Sed populationear 2013, Timast 121,411 tonnes of mauses such ads the cones of rice
maize. The mes in Timor‐Lmeans a re
mestic cereal nes for rice maize. Consideficit estimat
April 2013 to Maize (T)
100,789 0
91,360 9,429
115,072 76,741 2,174
16,000 20,158
‐14,283
2012 = 100calculating the results oncome and Series 2 CPI ation of the rating the an
3,000
es
urce: MSS
SECURITn of 1,145,38mor‐Leste is itonnes of ricaize. Includinas seeds anuntry needand 115,07
maximum posLeste is set aeduction fromproduction oand 20,15
dering all thited at 62,16
March 20141/ Only govern2/Milling rate 3/ Based on 167 kg per year1,145,383 in 21,118,429 + 2.4/ AccordingHorticulture (D35 kg/ha, maiz5/ There is nofeed animals. rate of rice alrthe husk is givas feeding. Onbased on MAF6/ DAH/MAF rice and maize7/ It may inclu
0. The newthe index isof the 2011Expenditure
also redefinedfood basketnalysis of the
0
AileuAinaroBaucau
BobonaroCovalima
DiliErmeraLautemLiquisa
ManatutoManufahiOecusse
Viqueque
Figur
TY 83 in ce ng nd ds 72 st at m of 58 s, 61
tonnes maize.
As repoproduct171,088and secoequivaleof 100,7food lopossiblemaize. considertheir an
nment stocks asof paddy to ric06 kg per yearr/person of mai2013, according41% per year ing to the DiDAH) of MAF, sze 40‐50 kg/ha o information aHowever, it isready takes intoven to animals. nly chicken feeF's standard conestimates 15‐2e ude contingency
w s 1 e d t e
rice indunder alcoholi
In OctobIndex Novembslightly
100
re 15: SubsidyQuart
of rice and
orted abovetion during 8 tonnes, comond crop proent of 52,399789 tonnes. Wosses and ote surplus of However, ring that mimals with m
s of March 201e is estimated ar/person of riceize and a populg to 2012 estimncrease irectorate of standard use of
available on ths known that to account and 6Maize, in turn eding is used fonsumption rate20% post‐harv
y stocks
dex in additiothe group ic beverages
ber, the over(CPI) was ber and Deincreased to
200 30
y Rice distributer 4 of 2013
14,283 ton
e, domestic 2013 sto
ming from thoduction mill9 tonnes andWithout consither food u24,048 tonnthis is u
most familiesmaize.
3 at 60 percent e consumption ation of ated populatio
Agriculture f seed for: rice
he use of grainhe 60% extrac6% that remainis extensively uor this calculat est losses in b
on to other cfood and
(Source: NSD
all Consumer103.7 whi
ecember theo 103.9 and 1
00 400
ution, during
Ton
nnes of
cereal od at he first ed rice d maize idering uses, a nes for unlikely s feed
and
n of
and 25‐
s to tion ns in used tion,
both
cereals non‐
D).
r Price ile in e CPI 104. In
500
nnes
Octobefood group the ovinflatiofruits chocoland riincreabeveravegetathat s(Sourc
Duringreductthe prchocolfish asignifiNovemapplia(exclu(4.3%)routin(1.3%)rice (0greatly Figure
Source:
Figure
Source: M
er, the increaand non‐alby 0.2 percverall increaon. The incre(3.7%), su
late and coce (0.5%) larse of the fooages index. ables (‐0.5%showed pricce: NSD).
g the monthtion in inflatiorice fall of late and connd seafood cant pricember werences (6.9%)ding rice (6) and goode househ). However, 0.9%) and ty influenced t
17: Monthly
MoF‐NDS
19: Monthly
MoF‐DNS
ase on the plcoholic bevcent, contribuase of the ease of the pugar, jam, nfectionary rgely influend and non‐alMeat (‐2.7%) were the ce fall in O
h of Novembon was attribsugar, jam, nfectionary ((‐3.4%). The increasee on hou), bread & 6%), oils ands & servicold maintprice increaobacco (1.2%the overall CP
CPI Change in
CPI Change in
rices in verages uted to general price of honey, (4.7%) ced the lcoholic %) and groups October
ber, the buted to honey,
(‐6.3%), he most es in usehold cereals nd fats ces for tenance ases on %) also PI.
Ipaiaat
Dar0tp0ppU2
I1dLtwatt
n October
n December
Timor
In Decembeprice increasalcoholic bevincrease of thand cereals (and seafood wto ‐0.2%.
During the laverage prremained at 0.59 per kilothree of the price for com0.68 per kilprice for maizper kilogramUSD 0.69 du2013.
In addition, t10 villages districts of Liquica, Covathe off grid were cereals average pricethese villageto $2.50/kg f
r‐Leste Food
r, the moses was on foverages (0.2%he rice price ((1.4%). The was fall to ‐1.
ast quarterice for suan average ogram similasame year
mmercial rice logram and ze reduced frm the previouuring the las
the SLMS re(sucos) bManatuto,
alima, Manufaareas of Dilprices above. Prices of ts’ ranged frofor maize and
Fig
Sou
Fig
Sou
Security Bul
st significantood and non%) due to the(0.5%), breadprice of fish2% and meat
of 2013, theubsidy riceprice of USDar to quarter(2013). Thestood at USDthe averagerom USD 0.74us quarter tost quarter o
corded somebelonging to, Bobonaroahi, Aileu andli (Metinaro)e the marketthe cereals inom $1.50/kgd $1.00/kg to
ure 18: Mont
urce: MoF‐NDS
ure 20: Annu
urce: MoF‐DNS
letin – Issue
t ‐e d h t
e e D r e D e 4 o f
e o o, d ) t n g o
$1.14/kmost commer$1.07/ksubsidy
thly CPI Chang
al CPI Change
Fig
No.6 Octobe
kg for subsiof the rcial rice fkg which is y rice and mai
ge in Novemb
e in Decembe
2,7
375 T 13%
177 T6%
ure 16: Govern
HumanitariCommerciaMSS/MEContamina
er – Decemb
idized rice, villages bfrom $.60/kcheaper thaize.
ber
r
185T7%
057T74%
T
nment Rice Usa
ianal
tion/damage
ber 2013
Page6
while bought kg to an the
age
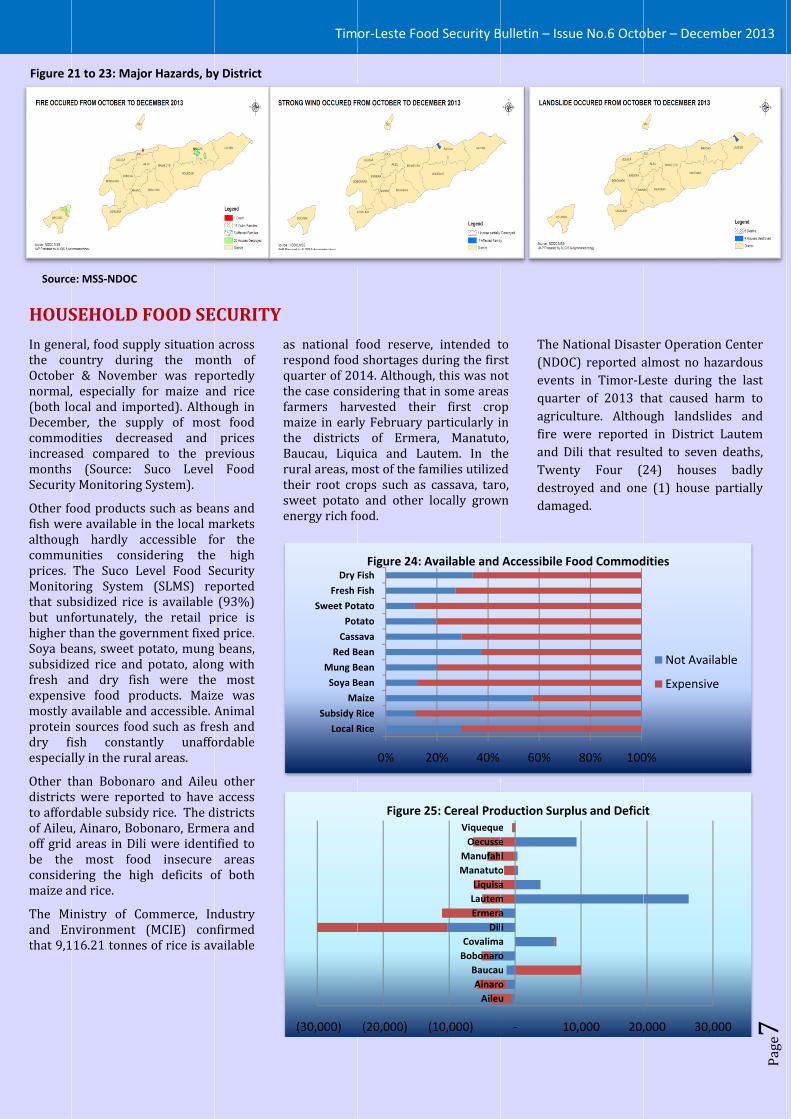
Figure 2
Source
HOUS
In genethe coOctobernormal,(both loDecembcommoincreasemonthsSecurity
Other fofish weralthougcommuprices. Monitorthat subbut unfhigher tSoya besubsidizfresh aexpensimostly protein dry fiespecial
Other tdistrictsto affordof Aileuoff grid be theconsidemaize a
The Miand Enthat 9,1
21 to 23: Majo
e: MSS‐NDOC
SEHOLD F
ral, food supuntry durinr & Novemb, especially focal and impber, the supdities decreed compared (Source: y Monitoring
ood productsre available igh hardly anities consThe Suco Lring Systembsidized ricefortunately, than the goveeans, sweet pzed rice and and dry fishive food proavailable andsources foodish constanlly in the rura
than Bobonas were repordable subsidyu, Ainaro, Bob areas in Dile most fooering the higand rice.
inistry of Convironment 116.21 tonnes
or Hazards, by
FOOD SE
ply situationng the monber was repofor maize anported). Althopply of moseased and d to the prSuco Level System).
s such as beain the local maccessible foidering theevel Food S
m (SLMS) re is available the retail pernment fixedpotato, mung potato, alonh were theoducts. Maizd accessible. Ad such as frently unaffoal areas.
ro and Aileurted to have y rice. The dbonaro, Ermei were identiod insecure gh deficits o
ommerce, In(MCIE) cons of rice is av
y District
ECURITY
across nth of ortedly nd rice ough in st food prices revious Food
ans and markets or the e high ecurity eported (93%)
price is d price. beans,
ng with e most ze was Animal esh and ordable
u other access
districts era and ified to areas
of both
ndustry nfirmed vailable
arqtfmtBrtse
Tim
as national frespond foodquarter of 20the case consfarmers harmaize in earlthe districtsBaucau, Liqurural areas, mtheir root crosweet potatoenergy rich fo
Local R
Subsidy R
Ma
Soya B
Mung B
Red B
Cass
Pot
Sweet Pot
Fresh
Dry
(30,000)
or‐Leste Foo
food reserved shortages d014. Althoughsidering that rvested theily February ps of Ermeruica and Lamost of the faops such as o and other ood.
0% 2
Rice
Rice
aize
Bean
Bean
Bean
sava
tato
tato
Fish
FishFigure 24: A
(20,000) (
Figure 2
od Security B
e, intended turing the firsh, this was noin some areair first croparticularly ira, Manatutoautem. In thmilies utilizecassava, tarolocally grow
20% 40%
Available and
(10,000)
AileuAinaroBaucau
BobonaroCovalima
DilErmeraLautemLiquisa
ManatutoManufahOecusse
Viqueque
25: Cereal Pro
Bulletin – Issu
to st ot as op in o, he ed o, wn
The Na(NDOCeventsquarteagricufire wand DTwentdestrodamag
60%
Accessibile Fo
‐ 10
uouoaiamaoiee
duction Surp
ue No.6 Octo
ational DisasC) reported as in Timor‐Ler of 2013 tulture. Althowere reportedili that resulty Four (2oyed and oneged.
80% 100
ood Commod
0,000 20,
lus and Defici
ober – Decem
ster Operationalmost no haLeste during that caused ugh landslidd in District lted to seven24) housese (1) house
0%
dities
Not Avail
Expensive
,000 30,0
it
mber 2013
Page7
n Center azardous the last harm to des and Lautem
n deaths, s badly partially
able
e
000

NUTR
Nutritiochildrenimprovdata Manage(HMIS) During MIS recof modchildrenchildrenremaineduring 24% ofTimor‐L
A
B
Bob
Cov
E
L
L
Man
Ma
Oe
Viq
Timo
RITION A
onal status n under vement basedcollected fement Infoof the Ministthe last quacorded a reduderate and sen. Howevern that utilized low. The Hthe last quaf the total nuLeste used t
18.0
Figure 26: NuChildren un
0
Aileu
Ainaro
Baucau
bonaro
valima
Dili
Ermera
autem
Liquisa
natuto
nufahi
ecusse
queque
r Leste
Figure 27: Ave
AND HEAL
of health five
d from the mfrom the ormation try of Health rter of 2013,uction of the nevere malnor, the numzed health H‐MIS recordarter of 201umber of chilthe health s
76.0%
0%5.0%
utritional Statunder 5 during Q
20
rage Percentagevery month
LTH
seeking shows
monthly Health System (MoH). , the H‐number urished ber of service ded that 13 only ldren in ervices,
amsohf48sauuh
w
us (underweighQuarter 4 of 20
N
MU
SeU
40
ge of children w in 2013
Tim
among thesmoderately mseverely malof moderate has decreasefrom 21 % (q4) for moder8 % (quarterseverely undaverage of underweightunderweighthigh incidenc(beyond 30%were the di
ht) for 013
ormal Weight
Moderate nderweight
evere nderweight
60
weighted
or‐Leste Foo
se children,malnourishednourished. Tand severelyed during thequarter 1) to rate underwer 1) to 5 % (derweight. Tf 19.6% ft and 6.4%t. The districe of underw%) during theistricts of Oe
t
A
Ai
Ba
Bobo
Cova
Erm
Lau
Liq
Mana
Man
Oec
Viqu
Timor L
od Security B
, 18% wed and 5% weThe percentagy underweige year, passin18 % (quarteight and fro(quarter 4) fThis means afor modera% for seveicts that havweight childree year of 201ecusse (48%
0
Aileu
inaro
aucau
onaro
alima
Dili
mera
utem
quisa
atuto
ufahi
cusse
eque
Leste
Figure 28: Asevere un
severe U
Bulletin – Issu
re re ge ght ng ter om for an ate re ve en 13 %),
CovalBobonwhile distric
In 20was wcame (40%BaucadistricAinarreporchildr
5 10
Average Percenderweigt chi
2013, by
Underweight
ue No.6 Octo
ima (40%)naro (33%) the oppos
cts of Aileu, A
13, an averaweighted. Mofrom the d), Manatuto au (28%) andcts of Manufao (16%) andrted to haveren weighted
15 2
entage of modildren under 5y district
moderat
ober – Decem
), Ermera and Baucau
site is true Ainaro and Di
age of 21.6%ost of these districts of (40%), Ailed Lautem (24ahi (13%), Did Ermera (16e low attenin 2013.
20 25
derate and 5 during
te Underweig
mber 2013
Page8
(34%), u (25%), for the
ili.
children children Covalima u (32%), 4%). The ili (15%), 6%) were dance of
30
ht


