Issue Bias: How Issue Coverage and Media Bias Affect …€¦ · 1 Issue Bias: How Issue Coverage...
42
1 Issue Bias: How Issue Coverage and Media Bias Affect Voter Perceptions of Elections It is virtually a truism in American politics that a focus on some issue areas during election campaigns, like national security or traditional values, redounds to the benefit of Republicans, while emphasis on other areas, like education or social security, benefits Democrats. Political scientists refer to this phenomenon as “issue ownership” (Petrocik 1996, Ansolabehere and Iyengar 1994). To the extent that one or the other party benefits disproportionately from media emphasis on particular issues during election campaigns, it is possible that, whether intended or not, media coverage may disproportionately benefit one or the other party. If so, this would appear to be an important potential form of bias. Baum and Gussin (2004) find that typical individuals use media outlet labels as a heuristic, to assess the validity of information presented by different outlets. Liberals tended to “find” a conservative bias in outlets they believed, ex ante, have a conservative slant, even if the content was actually from an outlet that they believed to have a liberal slant. The opposite was true for conservatives. We extend that research by investigating how issue ownership and the Hostile Media Outlet Phenomenon mediate, separately and in interaction, voter perceptions of media campaign coverage. We look at the effects of story selection on individuals’ perceptions concerning which party benefits more from media issue coverage. To do so, we conducted an experimental content analysis in which we asked subjects to code transcripts and articles, from eight major network and cable news broadcasts and newspapers, about the 2000 presidential campaign. We modified the transcripts and articles to create three distinct sets of treatment stimuli. One set correctly identified the source of the material. The second incorrectly identified the source and, in the third, all identifying elements were removed. We investigate whether individuals with differing political preferences are more or less likely to view certain issues as favorable to one or the other party, as well as the extent to which their propensity to do so is mediated by media outlets’ “brand names,” independent of the true sources of news coverage. We find that, except when they have strong prior beliefs about the ideological orientation of a media outlet, our subjects rely far more on issue ownership as a heuristic than on the hostile media heuristic. However, when they do have strong prior beliefs regarding outlet ideology, the opposite pattern prevails, with subjects relying on the hostile media heuristic to evaluate news content. Matthew A. Baum ([email protected] ) and Phil Gussin ([email protected] ) University of California, Los Angeles Department of Political Science, Box 951472 Los Angeles, CA 90095-1472 This paper was prepared for delivery at the 2005 annual meeting of the American Political Science Association, Washington D.C., 1-4 September
Transcript of Issue Bias: How Issue Coverage and Media Bias Affect …€¦ · 1 Issue Bias: How Issue Coverage...
1
Issue Bias: How Issue Coverage and Media Bias Affect Voter Perceptions of Elections
It is virtually a truism in American politics that a focus on some issue areas during election campaigns, like national security or traditional values, redounds to the benefit of Republicans, while emphasis on other areas, like education or social security, benefits Democrats. Political scientists refer to this phenomenon as “issue ownership” (Petrocik 1996, Ansolabehere and Iyengar 1994). To the extent that one or the other party benefits disproportionately from media emphasis on particular issues during election campaigns, it is possible that, whether intended or not, media coverage may disproportionately benefit one or the other party. If so, this would appear to be an important potential form of bias.
Baum and Gussin (2004) find that typical individuals use media outlet labels as a heuristic, to assess the validity of information presented by different outlets. Liberals tended to “find” a conservative bias in outlets they believed, ex ante, have a conservative slant, even if the content was actually from an outlet that they believed to have a liberal slant. The opposite was true for conservatives. We extend that research by investigating how issue ownership and the Hostile Media Outlet Phenomenon mediate, separately and in interaction, voter perceptions of media campaign coverage. We look at the effects of story selection on individuals’ perceptions concerning which party benefits more from media issue coverage. To do so, we conducted an experimental content analysis in which we asked subjects to code transcripts and articles, from eight major network and cable news broadcasts and newspapers, about the 2000 presidential campaign.
We modified the transcripts and articles to create three distinct sets of treatment stimuli. One set correctly identified the source of the material. The second incorrectly identified the source and, in the third, all identifying elements were removed. We investigate whether individuals with differing political preferences are more or less likely to view certain issues as favorable to one or the other party, as well as the extent to which their propensity to do so is mediated by media outlets’ “brand names,” independent of the true sources of news coverage. We find that, except when they have strong prior beliefs about the ideological orientation of a media outlet, our subjects rely far more on issue ownership as a heuristic than on the hostile media heuristic. However, when they do have strong prior beliefs regarding outlet ideology, the opposite pattern prevails, with subjects relying on the hostile media heuristic to evaluate news content.
Matthew A. Baum ([email protected])
and
Phil Gussin ([email protected])
University of California, Los Angeles
Department of Political Science, Box 951472 Los Angeles, CA 90095-1472
This paper was prepared for delivery at the 2005 annual meeting of the American Political Science Association, Washington D.C., 1-4 September
2
It is virtually a truism in American politics that a focus on some issue areas during
election campaigns, like national security or traditional values, redounds to the benefit of Republicans, while emphasis on other areas, like education or social security, benefits Democrats. Political scientists refer to this phenomenon as “issue ownership” (Petrocik 1996, Ansolabehere and Iyengar 1994). To the extent that one or the other party benefits disproportionately from media emphasis on particular issues during election campaigns, it is possible that, whether intended or not, media coverage may benefit one party more than the other. If so, this would appear to be an important potential source of individual perceptions of bias in the media.
When candidates adopt an issue ownership strategy -- that is, a strategy designed to frame the election around the issues that their party “owns” -- any assignment of electoral benefits unfolds in a three-stage process. The first stage commences before the electoral contest begins, as voters calculate the relative competence of the major political parties in handling specific issues and problems. In the second stage, as the campaign begins, candidates attempt to take advantage of these estimates of competence by emphasizing issues that are electorally advantageous to themselves. In the third stage, after determining which issues are most important, voters decide which candidates are best suited to handle them.
Previous research on issue ownership (Ansolabehere and Iyengar 1994; Holian 2004; Kaufmann 2000; Petrocik 1996; Petrocik 1994; Petrocik, Beniot, and Hansen 2003) has focused primarily on the first and second stages of the process. For example, to understand the first stage, researchers have examined survey responses to questions asking for global assessments of the respective strengths and weaknesses of the major political parties in handling certain issues (Petrocik, Beniot, and Hansen 2003). In assessing the second stage, others (e.g., Holian 2004) have conducted content analyses to determine the extent to which candidates succeeded in shaping the issue agenda.
In this paper, we examine the third stage of the process. We adopt an information processing perspective that conceptualizes voters as cognitive misers who, whenever possible, use heuristics to reduce the effort required to make reasoned choices.1 In the same way that political parties develop reputations for being better able to handle certain issues, evidence suggests that individuals distinguish between different media outlets and, as a result, media outlet “brand names.” As a consequence, the reputations media outlets carry function as heuristics, heavily influencing individuals’ perceptions of news content (Baum and Gussin 2004). This is potentially important because one implication of the issue ownership literature is that media coverage of issues “owned” by a given candidate’s party favors that candidate more than coverage of issues owned by an opponent’s party favors the opposing candidate. The heuristic value of media outlet “brand names” raises the possibility that individuals’ assessments concerning the ideological orientation of specific media outlets may affect their perceptions of which candidate receives more favorable issue coverage, thereby enhancing or negating the effectiveness of an issue ownership strategy. Indeed, it may also affect the extent to which viewers perceive coverage of a given issue as favoring one or the other party.
1 The presumption of credibility or competence regarding the handling of certain issues is one of a handful of heuristic devices that voters typically employ (Sniderman et al. 1991, Popkin 1994).
3
Alternatively, it may be that a party’s reputation for being better able to handle certain issues mitigates or overwhelms the effect of the hostile media outlet phenomenon (HMOP) (Baum and Gussin 2004). Our previous findings suggest that an individual’s ideological orientation, in combination with her assessment of the ideological orientation of specific media outlets, significantly influences perceptions of bias, thereby suggesting that bias is located in the “eye of the beholder” rather than the content of the news. In this respect, the theory of issue ownership is quite different from the HMOP. The issue ownership framework does not hold that the internal characteristics of news consumers mediate perceptions of which party receives favorable coverage of certain issues. Nor does it hold that, for example, coverage of national defense (Social Security) benefits the Republican (Democratic) Party conditional on which frame the media employs. Rather, it simply argues that, regardless of how the media frames a particular issue, the party that owns the issue will benefit from the coverage more than the other party. In other words, the theory of issue ownership suggests that news content drives perceptions of favorability.
A great many studies have found evidence of a hostile media phenomenon (Baum and Gussin 2004; Christen, Kannaovakun, and Gunther 2002; Dalton, Beck, and Huckfeldt 1998; Giner-Sorolla and Chaiken 1994; Gunther and Chin-Yun Chia 2001; Gunther and Christen 2002; Gunther, Christen, and Kannaovakun 2002; Gunther and Schmitt 2004; Morehouse 2001; Morehouse Mendez 2004; Peffley, Glass, and Avery 2001; Perloff 1989; Vallone, Ross, and Lepper 1985). Likewise, study after study – including our own – points to the pervasive influence of issue ownership (Ansolabehere and Iyengar 1994; Holian 2004; Kaufmann 2000; Petrocik 1996; Petrocik 1994; Petrocik, Beniot, and Hansen 2003). More importantly, these well-substantiated theories, in certain instances, make very different predictions. For example, what happens when a conservative (liberal) encounters coverage of a Republican (Democrat) owned issue on a hostile media outlet? The HMOP predicts that she will perceive the coverage as favorable to the Democrats (Republicans). The theory of issue ownership predicts the opposite; that she will perceive the coverage as favorable to the Republicans (Democrats). How do individuals resolve competing signals? The answer to this question has important implications for both theories.
To explore this and other related questions, in this study we report the results of an experiment designed to assess the extent to which voters’ perceptions of the ideological orientation of individual media outlets shape subsequent assessments of the favorability of issue coverage. This approach allows us to estimate the extent to which subjects’ impressions of news coverage conform to expectations set out in the issue ownership literature. Our results suggest, among other things, that the signals pertaining to the relative strengths of the respective parties in specific policy areas permeate the polity more deeply and thoroughly than the signals pertaining to ideological bias of media outlets. Consequently, in most, but not all, instances, the theory of issue ownership better explains how individuals perceive news coverage of issues when they encounter conflicting signals.
The remainder of this paper proceeds as follows. We begin by discussing the theory of issue ownership from an information processing perspective, and developing our theoretical argument. From this discussion, we derive a series of hypotheses. Next, we discuss our data and methodology. We recruited 110 subjects to code coverage of the fall 2000 presidential campaign by eight mainstream TV and print news outlets. We randomly divided the articles and transcripts (henceforth, referred to as “reports”) into three sets. For one set of reports, we removed all identifying features so that the source was unknown to the coder. In a second set, we preserved
4
all original identifying features of the reports. In the third set, we mislabeled the reports, attributing them to a different source.2 This allowed us to investigate the extent to which ex ante beliefs concerning the political orientations of, or patterns of issue coverage by, specific media outlets mediated our coders’ ex post perceptions of issue coverage. After discussing our data and procedures, we present the results of a series of statistical tests of our hypotheses. We conclude by considering the implications of our findings.
THEORY
The theory of issue ownership suggests that, in part, political campaigns consist of
candidates attempting to alter the decision-making calculus of voters by raising the salience of issues that their party “owns” while downplaying or ignoring issues “owned” by the opposing party (Petrocik 1996). The electoral benefit of an issue ownership strategy stems from the fact that, over time, the major political parties have developed reputations for greater effectiveness in certain issue areas. Consequently, mere association with a political party is an indicator of an ability to implement superior policies and programs in a given issue area (Petrocik, Beniot, and Hansen 2003, 601). For example, previous research suggests that Democrats benefit when campaigns focus on social welfare issues while Republicans benefit when campaigns focus on budgetary issues (i.e., taxing, spending) and the size of government (e.g., Petrocik, Beniot, and Hansen 2003).3 The presumption of greater effectiveness in a specific issue area should affect the manner in which individuals perceive the coverage. When coverage focuses on, say, budgetary issues, it should reflect more favorably on the Republican Party. Likewise, when coverage focuses on social welfare issues, the coverage should reflect more favorably on the Democratic Party. This suggests the following hypothesis, which is simply a restatement of the basic issue ownership hypothesis.
H1: All else equal, individuals will tend to perceive coverage of specific issues as
more favorable to the party that “owns” the issue.4 Of course, voters’ capacity to ascribe benefits to one or the other party based upon the
issues emphasized in the media may depend fundamentally on their ability to associate a given
2 We did not inform the subjects that we had mislabeled some of the reports until after the experiment. 3 Electoral campaigns also involve candidates addressing issues that neither party owns (e.g., the state of the economy, foreign relations, the conduct of government officials). Unlike “owned” issues, the effect of these “performance issues” (Petrocik 1996) fluctuates from election to election, depending on which candidate is in a better position to take credit for good times or place blame for bad times. 4 We rely on Petrocik’s categorizations of issue ownership (see, Petrocik, John. 1996. Issue Ownership in Presidential Elections, with a 1980 Case Study. American Journal of Political Science 40 (3):825-50, Petrocik, John R. 1994. A Theory of Issue Ownership and the 1980 Presidential Election. Paper read at Annual Meeting of the American Political Science Association, at New York, Petrocik, John R., William L. Beniot, and Glenn J. Hansen. 2003. Issue Ownership and Presidential Campaigning, 1952-2000. Political Science Quarterly 118 (4):599-626.).
5
issue with a given party. If the information connecting political parties to specific issues is widely distributed and continually reinforced, even individuals who pay only modest attention to politics will understand the connections. Recent evidence suggests that this is precisely the case. Petrocik et al. (2003) finds that the news media tend to portray candidates as emphasizing the issues that journalists perceive the parties as “owning,” even when the candidates are talking about issues “owned” by the opposing party. This suggests it does not take a great deal of cognitive effort or sophistication to understand which party “owns” a particular issue.
Clearly, individuals who pay close attention to politics are more likely to hold such associations. Likewise, individuals for whom a specific issue is extremely important should be more likely connect parties to issues than those who are, relatively speaking, indifferent to the issue. However, politically engaged individuals (i.e. high information and/or high salience) are also much less likely to rely on the heuristic of issue ownership. For example, high information conservatives (liberals) for whom social security (national defense) is an extremely important issue are unlikely to reflexively assume that coverage of social security is favorable to the Democratic (Republican) Party. They are more likely to examine the actual content of the coverage and, more importantly, counter-argue dissonant information. Consequently, while they may be more aware of which party owns which issue, they are less likely to reflexively assume that the party that owns an issue always benefits from coverage. This suggests two corollaries to Hypothesis 1.
H1a: As political awareness increases, the relationship predicted in H1 will
become weaker. H1b: As the salience of an issue increases, the relationship predicted in H1 will
become weaker. Agenda setting theory suggests that voters place more importance on issues that receive
the most coverage in the news media (Hill 1985; Iyengar, Peters, and Kinder 1982; McCombs and Shaw 1972).5 From that perspective, the success of an issue ownership strategy hinges on the ability of a candidate to persuade the news media to cover issues for which her party has an electoral advantage (i.e., those owned by her party) more than those for which the other party holds an advantage (i.e., those owned by the other party). As indicated above, recent evidence (Petrocik et al. 2003) suggests that the media is less compliant in that regard than researchers had previously assumed.
Framing theory, on the other hand, suggests that the volume of coverage devoted to a particular issue is less important than the frame the media adopts (Druckman 2001a; Druckman 2001b; Graber 1987; Rhee 1997). Moreover, as a close reading of the issues that Petrocik considers “owned” by the major political parties suggests, the frame that the media adopts can affect voters assessments of which candidate or party is better suited to handle a particular issue (Holian 2004). For example, on the issue of coverage of abortion or prayer in school, if the news media focus on traditional values, the Republican candidate is arguably most likely to benefit from the coverage. If, on the other hand, the news media adopt a frame that focuses on individual liberty, the Democratic candidate may be more likely to benefit.
5 This is specifically the case in terms of placement and volume.
6
The volume and framing of issue coverage are not the only factors shaping individual perceptions of the relative favorability of issue coverage. As noted, previous research on the “hostile media phenomenon” (henceforth “HMP”) suggests that, all else equal, individuals tend to view the media as biased against their own views or, conversely, supportive of positions contrary to their own (Christen, Kannaovakun, and Gunther 2002; Dalton, Beck, and Huckfeldt 1998; Giner-Sorolla and Chaiken 1994; Gunther and Chin-Yun Chia 2001; Gunther and Christen 2002; Gunther, Christen, and Kannaovakun 2002; Morehouse Mendez 2004; Peffley, Glass, and Avery 2001; Perloff 1989; Vallone, Ross, and Lepper 1985). A potential explanation for the HMP, first posited by Vallone et al. (1985), is that individuals with strong policy preferences are so certain of the superiority of their position that they view balanced or neutral coverage as inappropriate, if not fundamentally deceitful. From this perspective, the tendency to view coverage as hostile towards one’s own views should also extend to issue coverage. In other words, the HMP implies that individuals will tend to see the media as presenting an issue in a way that stands in contrast to their own perspective. Following the same logic, the tendency to perceive hostility should increase as an individual becomes more ideologically extreme or issues becomes more salient.
It may be, however, that the HMP does not apply equally to all kinds of news coverage. In political contests where one actor has a decisive “ownership” advantage over another, the news coverage may reflect that imbalance. The issue ownership literature suggests that the reputations that parties have developed for being better able to handle certain issues has deeply penetrated the polity. As such, there is an inherent imbalance when the media focus attention on owned issues. Journalists’ propensity to represent candidates as focusing on owned issues, even when a candidate is trying to “steal” an issue, only serves to reinforce these reputations (Petrocik et al. 2003). Therefore, it is possible that the “ownership” penetration is so deep that it requires more cognitive energy to dispute claims of ownership than to accept them. In such circumstances, individuals without strong ideological preferences will lack the motivation and means to counter-argue claims of ownership. A hypothesis follows:
H2: All else equal, moderates will be more likely than ideologues to view issue coverage as favorable to the party that owns the issues.
Owning an issue is not a victory unto itself. A party can only “cash in” on the advantage
of ownership when, through persuasion, coercion, skill, or good fortune, the media provides disproportionate coverage of an owned issue. When the media do focus on an owned issue, the victory is, in a sense, two-fold. First, there is the victory that comes from securing media coverage and, second, there are the electoral benefits that flow to the party’s candidate because of the coverage. Whereas coverage of owned issues confers a sense of policy competence on one party over another, successfully shaping the issue agenda confers a different, more starkly political, kind of competence. However, the successful employment of an issue ownership strategy, and the assumption of competence that it imparts on a candidate, may not be equally apparent to all. Ideologues, relative to moderates, are more likely to understand and appreciate when a candidate or party demonstrates competence in both areas. This is particularly important in our study because our coding scheme did not ask coders to indicate which candidate they were more likely to support after exposure to news reports. Instead, we asked them to indicate which party, if any, received more favorable coverage. From an information processing perspective, it is possible that ideologues, like moderates, tend to
7
perceive coverage of owned issues as favorable to the rightful owner but to do so for different reasons.
As we suggested earlier, moderates – who, in addition to being less ideologically extreme, are also, on average, less politically knowledgeable than their more partisan counterparts (Baum 2003, 2005) – will tend to focus on the content of news, interpreting it in conjunction with an intuitive understanding of the reputations that each party has for being “better able to handle” certain issues. However, they are less likely than ideologues to possess the motivation or the means to counter-argue information. In a sense, they are more likely to accept the content at face value.
When faced with a report in which the opposing party attempts to “steal” an owned issue, unlike the centrist who accepts the content at face value, politically engaged individuals (i.e. political sophisticates and those for whom an issue is of high salience) are more likely, all else equal to possess both the motivation and capacity to counter-argue dissonant information (Baum and Gussin 2004; Peffley, Glass, and Avery 2001). Therefore, when confronted with coverage of issues owned by the opposing party, the politically engaged will be less likely to accept the content at face value and, with it, the heuristic cue of issue ownership.
Still, as we have argued throughout, the reputations developed by each party for being superior in certain policy areas is pervasive; a fact that will not escape the attention of the politically engaged. This suggests that they will tend to perceive coverage of owned issues as favorable to the rightful owner while, to the extent possible, attempting to counter-argue claims of ownership. Therefore, relative to moderates, the politically engaged will be more likely to perceive coverage as favorable to their own party, even when the opposing party owns the issue. This expectation stands in stark contrast to the HMP prediction (i.e., that politically engaged individuals will perceive coverage as favorable to the opposing party). This suggests two corollaries to Hypothesis 2.
H2a: All else equal, as individuals move toward one or the other extreme on the
left-to-right ideological continuum, they will be more likely to view issue coverage as favorable to their own political party.
. H2b: All else equal, as the importance that an individual places on a particular issue
increases, they will be more likely to perceive issue coverage as favoring their own political party
Evidence suggests that estimates of source credibility also affect how individuals
interpret information and, thereby, increase or decrease the probability of message acceptance or rejection (e.g., Sears and Whitney, 1973). For instance, experimental (e.g. Lupia and McCubbins 1998, Gunther and Schmidt 2004) and empirical (Baum and Groeling 2004) research has shown that individual responses to new information frequently hinge on evaluations of its source. Additionally, Druckman shows that individuals are significantly less susceptible to framing and priming effects from sources deemed non-credible than from sources seen as credible (Druckman 2001a; Druckman 2001b; Druckman 2001c). These findings suggest that the credibility voters ascribe to specific media outlets may affect their willingness to accept or reject specific issue frames and emphases. If an individual believes, ex ante, that the ideological orientation of a given media outlet is at odds with her own perspective, she is more likely to perceive information from that outlet as promoting an issue frame that redounds to the benefit of
8
an opposing ideological perspective. As we indicated earlier, we conceptualize voters as cognitive misers who use heuristic
cues, or cognitive shortcuts, in order to make reasoned decisions. A prior belief that the ideological orientation of a given media outlet is at odds with ones own ideological views can act as an important judgmental heuristic (Giner-Sorolla and Chaiken 1994; Kahneman, Slovic, and Tversky 1982). Hence, merely observing a media outlet’s brand name may serve as a powerful information shortcut, allowing individuals to conserve a great deal of cognitive energy. Rather than counter-arguing dissonant information, reliance on a relatively simple heuristic – the media outlet label – allows individuals to dismiss it, out-of-hand, with little cognitive effort. Indeed, in an earlier experiment, we show that individuals use media outlet labels when assessing the valence of news coverage (Baum and Gussin 2004). If the HMOP is ubiquitous, individuals’ prior beliefs concerning the ideological orientation of a given media outlet will influence their perceptions regarding the favorability of issue coverage. For example, if a Republican (Democrat) believes, ex ante, that a given media outlet has a conservative (liberal) ideological orientation, they will be more likely to view issue coverage as favorable. Conversely, if the same individual believes that an outlet is liberal, they will be more likely to perceive coverage as unfavorable.
The ideological orientation of a given media outlet is only one of many heuristics that an individual can rely on when assessing the favorability of coverage. Other heuristics may also come into play. Given the apparent pervasive media emphasis on issue ownership during elections (Petrocik et al. 2003), we suspect that the heuristic of issue ownership permeates the political environment more thoroughly and consistently than perceptions of the ideological orientation of specific media outlets.
We base that assumption, in part, on our previous finding (Baum and Gussin 2004) that liberals and conservatives only agree which media outlets are the most conservative (Fox News, Wall Street Journal) and liberal (New York Times).6 Among outlets perceived as less ideologically extreme, there is no such consensus. For example, while liberals rate the CBS Evening News as the third most conservative media outlet, conservatives rate it as the second most liberal outlet (out of eight outlets included in our study). Similarly, liberals rate NBC Nightly News as the third most liberal media outlet and conservatives rate it as the third most conservative outlet. The fact that conservatives and liberals agree on which media outlets are most ideologically extreme suggests that their perceptions may not be entirely driven by internal ideological preferences.
Although the source of the signal is a matter of some dispute (Watts et al. 1999), it does appear that a clear and consistent ideological signal (whether actual, media-created, or both) is capable of reaching individuals on both sides of the political spectrum. In the case of the New York Times, Wall Street Journal, and FOX -- and especially the New York Times and FOX, which our coders, overall, rated as most liberal and conservative, respectively -- that appears to be the case. For the other media outlets (i.e., CBS, NBC, ABC, USA Today, and CNN), the signal is, apparently, not as clear. We suspect, however, that in each case the issue ownership signal is clearer. Therefore, the circumstances under which the HMOP will dominate individual assessments of the favorability of issue coverage will be limited. A final hypothesis follows:
6 They did, however, disagree on the magnitude of ideological orientation.
9
H3: All else equal, individuals’ perceptions regarding the favorability of issue coverage by individual media outlets will vary according to the issue ownership heuristic. However, if they have strong prior beliefs concerning a given media outlets ideological orientation, they may rely less on issue ownership than on the hostile media outlet heuristic.
DATA AND METHODS News Transcripts and Articles
We randomly selected newspaper articles and transcripts from network and cable news broadcasts and newspaper articles originating between September 2 and November 6, 2000 (Election Day). The reports were randomly drawn from eight media outlets: New York Times, Wall Street Journal, USA Today, ABC World News Tonight, CBS Evening News, NBC Nightly News, Special Report with Brit Hume (FOX), and Inside Politics with Judy Woodruff (CNN). Using a detailed search criterion (described in Appendix 1), we identified 399 reports (see Table 1). We randomly subdivided the reports into three groups: unidentified (50%), correctly identified (25%), and misidentified (25%).7
We did not alter the substantive content of any of the reports. However, for the unidentified and misidentified reports, we altered any features or information that might reveal the actual source. For example, in newspaper articles in the “unidentified” group, we replaced any mention of the actual source with the word “IDENTIFIER.”8 For “unidentified” TV news reports, we replaced the name of the network with the word “IDENTIFIER.” Likewise, we changed the name of the anchor to “ANCHOR" and the names of reporters to “REPORTER 1,” “REPORTER 2,” etc. For “misidentified” reports, in turn, we relabeled all identifying features. For instance, if a transcript identified Wolf Blitzer as the anchor, we replaced his name with an anchor from another media outlet (e.g. Brit Hume). Finally, we gave each transcript a heading that included the name of the false source.9
Among the misidentified reports, we sought, based on our own (subjective) prior perceptions regarding the ideological leanings of the various outlets, to reverse their ideological valence to the greatest extent possible.10 We summarize these manipulations in Table 1.11
7 The distribution of reports thus varies across media outlets. For example, of the 56 New York Times reports in our sample, we randomly selected 25 for the unidentified group, 12 for the correctly identified group, and 19 for the misidentified group. Of the 46 FOX reports, the distribution was 23, 12, and 11, respectively. 8 We reformatted all USA Today transcripts -- which appear in the Lexis-Nexis database in a “bullet point” format -- into a format comparable to the other print media outlets. 9 The heading for unidentified reports read “UNIDENTIFIED.” 10 In most cases, we mislabeled sources that partisans on the left often identify as conservative (e.g., FOX) with sources that partisans on the right often identify as liberal (e.g., New York Times). The exception was ABC World News Tonight, which we mislabeled as CNN. We anticipated that our subjects would view CNN as ideologically similar to ABC. This was intended to account for the possibility that simply switching media outlet labels, regardless of valence, could influence any changes in perceived bias we identified. 11 At the conclusion of the experiment, we surveyed our subjects via email to see whether they had been aware that some of the transcripts were incorrectly identified. About half of the subjects
10
[Table 1 here] The Issue Coding Process
The 110 coders were undergraduate students recruited via email and a listing in the university’s schedule of classes. Participants (henceforth “subjects”) received academic credit. We present summary statistics regarding our subjects in Table 2.
[Table 2 here] Before beginning the content coding, the subjects received training in the coding
procedures and filled out an extensive on-line survey.12 (The complete pre-experiment survey can be viewed at http://www.polisci.ucla.edu/faculty/mbaum/survey/index_master.htm). They then received 399 news reports – including all correctly identified, misidentified, and anonymous reports -- from eight media outlets, presented in random order. The random assignment procedure insured that each subject received a differently ordered set of reports.
We instructed the subjects to code each discrete statement, comment, or thought that included a reference to an issue. In most cases, that meant treating individual sentences as the unit of analysis. In some circumstances, however, this required treating more than one sentence as a single unit of analysis. Each “issue code” identified the issue, the source of the issue mention (i.e., journalist/anchor, Gore, Bush, Democratic or Republican Party representative, or other), which party appeared to benefit from the coverage,13 and the importance that the coder placed on the issue. In the case of multiple issue mentions, coders applied the highest rating of any of the issues mentioned in the sentence. Since most of the coders were upper-division political science majors, we assume that many were, to at least some degree, familiar with the issue ownership literature. To prevent our subjects from coding based on any such familiarity, we explicitly instructed them to examine the context of the coverage and not reflexively assume that one party always benefits when a report mentions a particular issue.14 Variable Operationalization
Dependent Variables. To test our Issue Ownership hypotheses, we constructed a variable (Issue Ownership) to measure which party, if any, received more favorable coverage of “owned” issues in a given report. We derived this variable from two additive scales that summed the total of issue codes on all “owned” issues for each of the political parties.15 We then subtracted the
responded to our inquiry. None of them had recognized the manipulation. Apparently, inclusion of the unidentified transcripts successfully focused our subjects’ attention on an incidental manipulation, rather than our key experimental manipulation. 12 We randomized the order of the questions in the survey. 13 If the coverage included the mention of an issue that did not reflect favorably on either party, the comment did not receive a code. However, if the report included mentions of the same issue in a way that benefited both political parties, the coders could identify the coverage as balanced. 14 However, if an issue that the coder believed usually benefited one party more than another was discussed in a way that reflected poorly on the party that usually benefits or positively on the party that does not usually benefit, we gave coders the option of identifying the coverage as “balanced.” 15 The formula for the measure was as follows: [R_RepIssue/(R_RepIssue + D_RepIssue + B_RepIssue)] – [D_DemIssue/(D_DemIssue + R_DemIssue + B_DemIssue)], where, R_RepIssue is the number of favorable mentions of Republican-owned issues ascribed to the Republican Party, D_RepIssue is the number of favorable mentions of Republican-owned issues
11
number of issues coded as favorable to the Democratic Party from that of the Republican Party to generate our measure of Issue Ownership. The measure is positive when coverage of owned issues favors the Republican Party and negative when it favors the Democratic Party.16
We ascribed ownership of an issue based on previous research on issue ownership (Petrocik 1996; Petrocik 1994; Petrocik, Beniot, and Hansen 2003). Following Petrocik (1996) and others, we assume that Democrats’ “own” issue mentions that pertain to civil rights, civil liberties, social welfare spending,17 agriculture, class conflicts, labor, and women’s issues. Republicans, on the other hand, “own” issues relating to civil and social order,18 national defense, and big government.19 Following Petrocik et al. (2003), in turn, we created three categories of “performance” issues: foreign policy, economy, and government functioning (e.g., corruption, policy failures). We also created a category – called Politics – that included references to the electoral contest, devoid of an issue mentions (e.g., references to campaign ads and spending, electoral strategies, specific candidates, etc.). Lastly, we created a residual category for all other mentions. (See Appendix 2 for a comprehensive list of owned issues.)
The process of categorizing issue codes took place in three stages. In the initial stage, an undergraduate coder examined the actual issue entries and categorized them without reference to Petrocik’s categories. As explained earlier, each time coders encountered an issue in a report, we instructed them to provide a brief description of the issue. Unsurprisingly, the entries varied greatly, even when the issue was, for our purposes, identical. For example, in a report that included a discussion of the merits of gun control, coders provided the following entries: guns, 2nd Amendment, firearms, handguns, concealed handguns, gun ownership, and NRA. The goal of the undergraduate coder was to located instances where it was possible to group a common set of entries into a single category. In the second stage, after verifying the accuracy (and consistency) of the student’s categorizations, the authors placed the specific issue into one of the categories described by Petrocik. For example, the issue of “gun control” was included in the
ascribed to the Democratic Party, B_RepIssue is the number of balanced mentions of Republican-owned issues, D_DemIssue is the number of favorable mentions of Democrat-owned issues ascribed to the Democratic Party, R_DemIssue is the number of favorable mentions of Democrat-owned issues ascribed to the Republican Party, and B_DemIssue is the number of balanced mentions of Democrat-owned issues. 16 For example, if a report included five mentions of Democratic-owned issues, of which three reflect favorably on the Democratic Party, we calculated the value as 3/5 or .60. If the same report also included four mentions of Republican issues, of which three reflected favorably on the Republican Party, the value would equal 3/4 or .75. In that case, Issue Ownership would equal .15 (.75-.60), indicating that the Republican Party received coverage that was more favorable. 17 We subdivided this category into general social welfare spending, which distribute benefits of to the general population (e.g., education, environmental policy, healthcare) and specific social welfare spending, which distribute benefits to a particular segment of society (e.g., child care credits, social security, Senior health care services, etc.) 18 We subdivided this category into “law and order” (e.g., crime, capital punishment, issues relating to the judiciary system) and “values order,” that focus on traditional values and lifestyles, religion, sex education in the schools, etc. 19 We subdivide this into two categories: “Big Government,” which refers to government spending that is not tied to a specific welfare policy or regulation of the economy, and “taxes” which refers to any policy mention relating to tax policy.
12
“law and order” category. In the third and final stage, we categorized any remaining ambiguous entries the coders did not code.
For each outlet, we created a dummy variable, coded 1 if it was hostile vis-à-vis a given respondent and 0 otherwise. We then added the 15 resulting dummy variables together to form the summary scale. The outlets were as follows: Fox News Channel, CBS, ABC, NBC, CNN, MSNBC, New York Times, Wall Street Journal, USA Today, The Jim Lehrer News Hour, National Public Radio, Newsweek, Time, U.S. News and World Report, and Political Talk Radio.
Independent Variables. Our key causal variable (“Owned Issue Difference”) is the net balance of issues owned by Republicans and Democrats. Specifically, we tally all issues coded by our subjects that are owned by either party, and then subtract the total number of coded Democratic owned issues from the total for Republican owned issues.
Following Zaller (1992), we estimate political awareness through a scale based upon responses to 21 factual political knowledge questions included in the pre-coding survey.20 We gave respondents one point for each correct response and a half-point for partially correct responses. The resulting scale had a mean of 13.9 and a standard deviation of 4.3. (See Appendix 3 for a list of questions included in the scale.)
To determine the effects of media outlet identification on respondents’ perceptions of bias, we constructed a series of dummy variables. We created three dummies for each outlet: one each for correctly identified, misidentified, and unidentified reports. For those models where we investigate the differing effects of outlet identification on respondents with differing political ideologies, issue salience, or differing levels of political awareness, we interacted the outlet dummies with political awareness, issue salience, or political ideology.
To measure issue salience, we first need to estimate the importance of the issues in all news reports to the subjects. We therefore asked them to rate each issue they encountered on a 5-point scale, where 5 represents “very important.” Our subjects tallied the number of issues in each report. But for technical reasons, they only recorded one summary “personal importance” score. Hence, we created a personal importance indicator by multiplying the total number of issues raised in the report by the summary importance ranking. For instance, if our coder noted that three “very important” issues were addressed in the report, the report would receive a summary importance rating of 3x5=15. The resulting scale runs from 0 to 270, with a mean of 7.6 and a standard deviation of 12.3.
All multivariate regression models also include a series of control variables, intended to account for alternative potential explanations for the predicted relationships. These fall into three general categories: (1) demographics (age, age2, gender, family income, race), (2) political interest/orientation (party identification, interest in news about national politics, caring who wins the 2004 presidential election, approval of President Bush, whether respondent considers herself “opinionated”), and (3) media consumption (frequency of consuming news, believability of news media).21 (We define all control variables in Appendix 3.) Finally, to account for any coder-specific characteristics not captured by the above control variables, we included a dummy variable for each subject. Consequently, our models effectively absorb any coder-specific effects.
20 We employ the terms “political awareness” and “political sophistication” interchangeably. 21 The two media variables are additive scales, based upon respondents’ ratings of a variety of news outlets on two dimensions: (1) how frequently the respondent consumes each of the 8 media outlets whose content our subjects evaluated, and (2) how believable the respondent considers a series of 10 (soft and hard) news media formats.
13
STATISTICAL RESULTS
Hypothesis 1, which states that individuals will tend to perceive coverage of a specific
issue as more favorable to the party that “owns” the issue, simply restates the basic issue ownership hypothesis. Table 3 displays the distribution of issue codes by owned and performance issues for conservatives, liberals, and moderates in unidentified reports. For each ideological grouping, there are four columns. Columns 1 and 2 sum the issues codes for the Democratic and Republican Party, respectively. Column 3 sums the balanced issue codes (i.e., instances when coders felt the issue coverage was equally favorable or unfavorable to both parties). Column 4 subtracts the proportion of issue codes for the Democrats from the proportion of issue codes for the Republicans. A positive (negative) value in Column 4 indicates that coders, on average, perceived coverage as advantageous to the Republican (Democratic) Party). As the values approach zero, the lesser the advantage. Hypothesis 1 predicts that coders will perceive coverage of Democrat (Republican) owned issues as favorable to the Democratic (Republican) Party.
To ensure that the coding of issue coverage was not interacting with media outlet labels, we test Hypothesis 1 by focusing on issue codes from unidentified reports. Coders may have fallen back on prior assumptions about the ideological orientation of the media, in general, when coding unidentified reports. For instance, if an individual believes that media outlets are, on average, more likely to possess a liberal (conservative) than conservative (liberal) bias, she may cognitively affix a liberal (conservative) label on an unidentified report. In other words, absent an actual media outlet label, coders may apply one they believe has the greatest probability of being “correct.” Alternatively, coders may have focused solely on the content of the reports, thereby providing a good estimate of how they view issue coverage absent media outlet labels. If they adopted the former strategy, the effect would weaken support for Hypothesis 1. The results provide strong support for Hypothesis 1.
[Table 3 here] Coders perceived a strong pro-Democratic tilt in the coverage of every Democratic-
owned issue. For example, among all issue codes related to labor issues, 81% were coded as favorable to the Democratic Party compared to only 12% as favorable to the Republican Party, yielding a 69% advantage for the Democrats. On issues of welfare – both general and specific – the Democratic advantage was approximately 15%. Moreover, coders perceived a pro-Republican tilt on almost all Republican-owned issues. The Republican advantage was largest when coverage included issues related to national defense (49%) and weakest when all issues related to the “big government” (6%). The only issue for which Democratic coders perceived an advantage for the “wrong” party (i.e., the party that does not “own” the issue) was coverage of “values” (e.g., entertainment industry, censorship, family values, media violence, etc.). Given the left-leaning make-up of our coders and, perhaps, the close proximity and relative familiarity with the entertainment industry, such a result is not particularly surprising. The only issue for which Republican coders perceived an advantage for the wrong party was “big government,” excluding taxes. Despite these discrepancies, of the thirteen “owned” issues included in Table 3, on average, coders perceived coverage as more favorable to the party that “owns” the issue in 12 out of 13 cases.
This summary table does not, of course, account for alternative explanations. Consequently, we turn to multivariate regression analysis. Table 4 presents seven OLS models
14
intended to test our hypotheses. Beginning with Hypothesis 1, and its two corollaries, Models 1-3 present the results of our investigations into the effects of “issue ownership” on our subjects’ attribution of political benefit derived from issue coverage.
[Table 4 here] For ease of interpretation, we employ Clarify – statistical simulation software (King, Tomz, and Wittenberg 2000) – to derive the expected relative favorability of issue coverage for the parties, as the relative prevalence of either party’s “owned” issues, salience of those issues to our subjects, and political awareness of our subjects varies.
Beginning with our first hypothesis (tested in Model 1), as the overall mix of owned issues varies from two standard deviations above the mean, in favor of Democratic-owned issues, to two standard deviations below the mean, in favor of Republican-owned issues, the net benefit to the parties increases by .71, in favor of the Republicans (from -1.22 to -.51). This represents a statistically significant (p<.01) increase of almost .3 standard deviations on the issue benefit scale. (Note that for all of our comparisons of Democratic and Republican issue favorability, negative values indicate net pro-Democratic issue favorability, while positive values indicate net pro-Republican issue favorability. Turning to the first corollary to H1 (H1a), Model 2 in Table 4 adds an interaction with political awareness. These results appear inconsistent with our prediction. Political awareness shows no meaningful interaction with issue coverage. However, further investigation indicates that this initial analysis overlooks an important dimension, that of issue salience. Political sophisticates are likely to differ from novices far less in issues that they consider unimportant. After all, like their apolitical counterparts, if a given issue is personally unimportant to them, sophisticates presumably ignore it. Under these conditions, differences between novices and sophisticates will be less apparent.
To test this refined hypothesis, we add a further interaction with issue salience. In effect, this divides our subjects into four groups: low awareness, low salience; low awareness, high salience; high awareness, low salience, and high awareness, high salience. In each case, we define “low” (“high”) as two standard deviations below (above) the mean. The results here – which Table 5 transforms into expected values – are quite different, and support our refined hypothesis.
[Table 5 here] The first thing to note is that for three of the four groups, the results move in the “correct”
direction. That is, as predicted by H1a, the greater the mix of issues favors a given party, the greater the extent to which our subjects coded issue coverage as actually benefiting that party. The sole outlier is the low awareness/low knowledge group. Among these respondents, as the issue mix moves in a pro-Republican direction, our subjects coded those issues as increasingly favorable to Democrats. While this seems counter-intuitive, a closer look at the data reveals the explanation for this seeming anomaly. Our subjects falling into this category actually coded Democratic-owned issue coverage as more beneficial to Republicans, by a nearly 2-to-1 margin, than Republican-owned issue coverage. This pattern persists regardless of whether we focus on identified or anonymous transcripts. Consequently, for this, relatively small, sub-population, a movement toward more Democratic-owned issues actually does imply more pro-Republican issue coverage.
The key comparison for this hypothesis is that between the low knowledge/high salience group and the high knowledge/high salience group. For these individuals, the issues under consideration are personally important. Consequently, they are likely to pay significant attention
15
to media reporting. In this instance, consistent with our prediction, the effects of moving from a pro-Democratic to a pro-Republican issue mix is substantially smaller: +1.28 (p<.01) for novices vs. +.89 (p<.05) among political sophisticates. As one would expect, in turn, the effects of variations in issue coverage are more statistically significant for highly salient issues.
These data also support Hypothesis 1b. Given the aforementioned counter-intuitive pattern among the low salience/low knowledge group, it is difficult to draw conclusions from a comparison of this group against the low salience/high knowledge group. Consequently, the key comparison for testing this hypothesis is that between the high knowledge/low salience and the high knowledge/high salience groups. This pattern supports H1b; among highly aware subjects, as salience increases from two standard deviations below, to two standard deviations above, the mean level of salience, the pro-Republican swing associated with a two standard deviation increase in Republican-owned issue coverage declines by .45 (from +.134 to +.89). Hypothesis 2 and its two corollaries directly pit the Hostile Media and Issue Ownership heuristics against one another. Here, following the Issue Ownership heuristic, and contrary to the Hostile Media heuristic, we predict that individual’s perceptions of issue advantage will co-vary with their ideological leanings, with non-ideologues being most willing to attribute partisan advantage to the party that owns a given issue covered in the media. In other words, we anticipate that conservatives will perceive issues as more beneficial to Republicans, while liberals will perceive them as more beneficial to Democrats, while centrists will, to a greater extent than ideologues, perceive the party that owns a given issue as benefiting from coverage of it. Moreover, we anticipate that this relationship will strengthen with the strength of ideology (H2a) and issue salience (H2b). Models 4-6 in Table 4 test all three hypotheses. In order to account for possible non-linearity in the attitudes of liberals and conservatives, we replace our liberal-conservative scale with a series of four dummy variables for strong conservatives, conservatives, liberals, and strong liberals. (The omitted category includes moderates and moderates who lean either pro-liberal or pro-conservative.)
At Table 6, we transform the key coefficients into expected values. Note that, as before, the prediction of the Issue Ownership heuristic is precisely the opposite as that of the Hostile Media heuristic, which would predict that partisans would perceive issue coverage as favoring the opposition party, and that this pattern would strengthen with ideological extremeness.
[Table 6 here] Beginning with H2 and H2a, Table 6 indicates that as subjects move from strong conservative to strong liberal, they increasingly perceive a pro-Democratic tilt in media coverage. Overall, movement from strong conservative to strong liberal is associated with a highly significant (p<.01) decrease of 1.57 (from -.03 to -1.60) on our issue favorability scale, representing a movement of nearly two-thirds of a standard deviation increase in pro-Democratic favorability. Indeed, consistent with H2a, this relationship is linear, with the weakest pro-Democratic tilt perceived among strong Republicans and the strongest pro-Democratic tilt perceived by strong Democrats. Moderately liberal and conservative subjects fall in between. Interestingly, all respondents perceive a net Democratic advantage in issue coverage in 2000. This is consistent with Petrocik et al.’s (2003) finding that the 2000 election was fought largely over Democratic-owned issues. As a second test of H2, we interact our ideology dummies with our indicator of net issue ownership advantage (that is, the total number of Republican-owned issues minus the total number of Democratic owned issues). The results, shown in the Table 7, again support our hypothesis. As the issue coverage mix moves from two standard deviations below the mean in
16
favor of the Democrats to two standard deviations above the mean in favor of the Republicans, moderates, as predicted, move more toward the Republicans in their assessment of the net partisan benefit associated with issue coverage, while partisans move toward their own parties, albeit to smaller degrees.
[Table 7 here] In order to test H2b, we interact our ideology dummies with issue salience. The results, also shown in Table 6, again support our hypothesis. For issues two standard deviations below the mean level of issue salience, strong liberals are nearly identical to strong conservatives in their perceptions of a relatively small pro-Democratic tilt in the tenor of issue coverage (-.47 for strong conservatives vs. -.36 for strong liberals). In contrast, for issues two standard deviations above the mean level of issue salience, strong conservatives and strong liberals diverge dramatically. Whereas strong conservatives perceive a relatively minor pro-Democratic advantage in issue favorability (-.80), strong liberals perceive a far larger Democratic advantage (-2.60). The 1.80 difference between these subjects -- representing nearly ¾ of a standard deviation on the issue favorability scale – is significant at the .01 level. Moreover, the difference between these two differences is itself statistically significant (p<.01). Finally, each of these results supports the Issue Ownership heuristic more than the Hostile Media heuristic. We turn next to Hypothesis 3. In this test, we pit the Hostile Media Outlet (Baum and Gussin 2004) and Issue Ownership heuristics against one another. Following the latter framework, we predict that individuals’ pre-existing assessments of the nature of issue coverage by different media outlets – rather than their prior assumptions regarding outlet ideological leanings – will influence their perceptions, reflected in content coding, of the net partisan favorability of issue coverage by those media outlets. Model 7 in Table 4 presents our test of this hypothesis.
In order to investigate the effects of prior assumptions concerning media outlets, it is first necessary to determine the valence of any such cues for different subjects, both in terms of ideology and issue coverage. This, in turn, may differ between liberals and conservatives. Hence, we must first determine whether and to what extent different groups of respondents perceive media outlets as leaning in a liberal or conservative direction, as well as how, overall, they perceive issue coverage by each outlet. At Table 8, we therefore separately summarize, for liberals and conservatives, the ideological rankings of each coded media outlet on a 5-point media ideology scale (where -2=very conservative, 0=neutral or balanced, and 2=very liberal).
[Table 8 here] The figures in Table 8 demonstrate that liberals and conservatives differ substantially in
their estimates of the political leanings of some media outlets, but by no means all of them. Both liberals and conservatives perceive FOX and the Wall Street Journal as the two most conservative outlets, and, overall, as the most ideologically extreme outlets. In both instances, however, liberals perceive a more substantial pro-conservative tilt than conservatives. Both groups also perceive the New York Times as the most liberal of the eight outlets, though conservatives rate it as nearly five times stronger in its leftward slant than liberals. Both groups also rate ABC and NBC as fairly balanced. In contrast, liberals and conservatives disagree considerably with respect to the ideological orientations of CBS and CNN. Whereas liberals perceive both outlets as moderately conservative, conservatives see both outlets as leaning in a liberal direction. Finally, whereas liberals perceive USA Today as slightly conservative, conservatives perceive the paper as moderately liberal.
We also summarize issue favorability, again separately for liberals and conservatives,
17
based on what we presume to be the most objective subset of our data – the 50% of our transcripts that were unidentified. While overall averages for these transcripts do not necessarily represent unadulterated “truth,” they do represent the closest approximation available in our data. However, ranking outlets by favorability requires taking into consideration both the valence of coverage of each issue area by each network, as well as the quantity of such coverage. Consequently, for Table 9 we construct a weighted net favorability measure. For each issue area, we separately tally the proportion of all issue coverage devoted to the issue and the net favorability score on that issue for each network. Finally, for each network, we take the sum of the weighted value for each issue area, again, focusing only on unidentified transcripts. We repeated this process for liberals and conservatives. The final indicator thus represents the weighted net favorability score for each network, where negative values indicate pro-Democratic issue coverage and positive values indicate pro-Republican issue coverage. Larger numbers, in turn, represent larger issue advantages for one or the other party.
[Table 9 here] A review of Table 9 reveals a somewhat different pattern from Table 8. In contrast to ideological leanings, liberals and conservatives appear in these data largely in agreement that the issues covered in 2000, in the net, benefited Democrats more than Republicans. The sole exception is the New York Times, which conservatives perceived as slightly pro-Republican and liberals as slightly pro-Democrat. Also interesting, across all eight outlets, consistent with the Issue Ownership heuristic, liberals perceive a larger pro-Democratic tilt than their conservative counterparts. By this latter metric, liberals and conservatives are in closest agreement on FOX, while they disagree most regarding ABC and CBS.
With these patterns in mind, it is possible to identify the implications of H3, which follow from the Issue Ownership heuristic, as compared to those of the Hostile Media Outlet heuristic. We summarize these the second and third columns of Table 10, for liberals, and the ninth and tenth columns for conservatives. In each instance, a “+” indicates a predicted pro-Republican change associated with altering the media outlet label, while a “-” indicates a predicted pro-Democratic change. The fourth and 11th columns, in turn, summarize the actual direction of change in issue favorability evaluations, as we move from correctly- to incorrectly-identified reports from each outlet.
[Table 10 here] These data are illustrated graphically in Figures 1 and 2. Both figures plot -- for liberals
(Figure 1) and conservatives (Figure 2) -- the effects of moving from correctly- to incorrectly-identified reports from each outlet. Of course, in the presence of interaction terms, statistically significant substantive effects may emerge even if the interaction terms or base categories are not themselves significant. Hence, evaluating H3 requires assessing the direction, magnitude and significance of the differences in the dependent variable – net issue favorability scores for all issues owned by either party (that is pro-Republican codes minus pro-Democrat codes for issues “owned” by Republicans or Democrats) -- associated with variations in media outlet labels and subjects’ political ideology. Consequently, in Figures 1 and 2, we bold all curves representing statistically significant differences (p<.10 or better), while denoting insignificant curves with dashed lines.
[Figure 1 here] [Figure 2 here]
Figures 1 and 2 largely, though not perfectly, conform to our predictions, which we derive from the logic of the Issue Ownership heuristic. Beginning with FOX and CNN, in both
18
instances, our liberal and conservative subjects consider FOX a more conservative media outlet than CNN (see also Table 9). They also perceive greater net issue favorability for Republicans on FOX, relative to CNN. Consequently, both the Issue Ownership and Hostile Media Outlet heuristics predict that when a FOX transcript is relabeled as CNN, the effect should be a movement in favor of the Democrats. Conversely, when CNN is relabeled as FOX, both heuristics predict that the net effect ought to be a movement in favor of the Republicans. In fact, this is precisely what the data reveal. For FOX and CNN, relabeling transcripts to appear as CNN and FOX, respectively, results in changes of -1.367 (p<.01) and +1.365 (p<.01) on the issue favorability scale for liberals, and changes of -1.033 (p<.10) and +.766 (p<.10 for conservatives. The effects for liberals represent a .56 standard deviation change, while for conservatives, the CNN-to-FOX and FOX-to-CNN effects represent changes of .42 and .31 standard deviations, respectively. In order to distinguish between the Issue Ownership and Hostile Media Outlet heuristic predictions, we need instances where reliance on these heuristics would lead subjects to opposing conclusions. Fortunately, 10 such scenarios are available in our data (5 each for liberals and conservatives). Beginning with the Wall Street Journal, for both ideological groups, our subjects ranked the Wall Street Journal as substantially more conservative than the New York Times. In contrast, both groups ranked the Wall Street Journal as far more favorable to Democrats than Republicans in its issue coverage. Consequently, when we change the outlet label on the Wall Street Journal reports to make them appear as if they appeared in the New York Times, the Hostile Media Outlet heuristic would predict a pro-Democratic shift, while the Issue Ownership heuristic would predict the opposite shift, toward the Republicans.
In fact, for both our liberal and conservative subjects, the data support the latter heuristic, and, hence, Hypothesis 3. When Wall Street Journal reports are relabeled as the New York Times reports, our liberal and conservative subjects shifted their assessments of issue favorability by +1.270 (p<.01) and +.867 (p<.05), respectively. These pro-Republican shifts are equivalent to changes of .52 and .36 standard deviations on the issue favorability scale, respectively.
The story is similar for USA Today, which we also re-labeled as the New York Times. Our liberal and conservative subjects each rated the former newspaper as more conservative than the latter. Consequently, the Hostile Media Outlet heuristic would predict that relabeling USA Today reports as New York Times reports should yield a pro-Democratic shift. Conversely, both groups of subjects rated the latter newspaper as more favorable to Republicans in its issue coverage. Hence, as before, the Issue Ownership heuristic would predict the opposite change, in favor of the Republican Party.
Once again, the data clearly support the latter heuristic, and hence Hypothesis 3. When USA Today reports are relabeled as New York Times reports, our liberal and conservative subjects shifted their assessments of issue favorability by +.656 (p<.01) and +.458 (p<.05), respectively. These pro-Republican shifts are equivalent to changes of .27 and .19 standard deviations on the issue favorability scale, respectively.
The other three instances where the Hostile Media Outlet and Issue Ownership heuristics yield different predictions are ABC, CBS, and the New York Times. Beginning with the first, our liberal subjects rated ABC as slightly more liberal than CNN, while our conservative subjects rated the former outlet as slightly more conservative than the latter. Consequently, among liberals and conservatives, when we relabel ABC reports as CNN reports, the Hostile Media Outlet heuristic should yield a small shift in favor of the Republican and Democratic Parties, respectively. The Issue Ownership heuristic yields the identical prediction for conservatives, but
19
the opposite prediction for liberals: in both instances a relatively small movement in favor of the Democrats.
In this instance, the results conform to both heuristics for conservatives, but only with the Issue Ownership heuristic for liberals. When we relabel ABC reports as CNN reports, our liberal and conservative subjects shifted their assessments of issue favorability in a pro-Democratic direction, by -.313 and -.060, respectively. Not surprisingly, given the relatively small differentials predicted by both heuristics, these relative small differences are statistically insignificant.
The second outlet where the predictions of the two heuristics diverge is CBS, which we relabeled as FOX. Our liberal coders rated FOX as the third most conservative outlet, while our conservative coders rated it as the second most liberal. In both instances, however, our coders rated CBS as considerably less conservative than FOX. Consequently, the Hostile Media Outlet heuristic would predict a pro-Republican shift in perceived issue favorability when we relabel CBS reports as FOX reports. The opposing predictions follow from the Issue Ownership heuristic. Both our liberal and conservative subjects rated unidentified CBS transcripts as substantially more conservative in their issue coverage than FOX.
The results for CBS are mixed. Among liberals, the results clearly support the Issue Ownership heuristic, rather than the Hostile Media Outlet heuristic. Replacing the CBS label with a FOX label produced a pro-Democratic shift of -.406 (p<.01) in perceived issue coverage. In contrast, the results among conservatives are ambiguous, but more supportive of the Hostile Media Outlet heuristic than the Issue Ownership heuristic. However, in this instance, the corresponding change is a small and statistically insignificant +.16 shift in favor of the Republicans.
The final outlet for which our predictions diverge is the New York Times, which we relabeled as the Wall Street Journal. As noted, both liberal and conservative subjects ranked the Wall Street Journal as more conservative than the New York Times, yet more favorable to Democrats than Republicans in its issue coverage. Consequently, when we replace the Wall Street Journal label with that of the New York Times, the Hostile Media Outlet heuristic predicts a pro-Democratic shift, while the Issue Ownership heuristic predicts a pro-Republican shift.
Here, we find the only instance of unambiguous support for the Hostile Media Outlet heuristic. For both liberals and conservative, reversing outlet labels yielded pro-Republican shifts of +.859 (p<.01) and +.306 (insig.), respectively. Interestingly, however, when one combines this latter result with those from FOX, where both heuristics yielded identical predictions, we find additional support for Hypothesis 3. Recall that H3 predicted that the Issue Ownership heuristic would prevail in subjects’ assessments of media outlets’ issue coverage except in instances where individuals held strong prior beliefs regarding media outlet ideologies. FOX and the New York Times, in turn, stand out in this regard as, overall, the most liberal and conservative outlets in our study, respectively, according to our subjects. For FOX, while we cannot distinguish the two heuristics, it is worth reiterating that the results for both liberal and conservative coders are consistent with the Hostile Media Outlet heuristic and that, in this instance, as with the New York Times, this pattern is also consistent with H3.
The final media outlet is NBC, which we relabeled as FOX. Both groups of subjects rated NBC as more liberal than FOX, though the differential was substantially smaller among conservatives. Similarly, both groups rated NBC’s issue coverage as more favorable to Democrats than that of FOX. Consequently, both heuristics predict that switching outlet labels from NBC to FOX should yield a pro-Republican shift in perceived issue favorability. In this
20
instance, however, the data support neither heuristic, as the aforementioned shift is associated with statistically significant pro-Democratic shifts of -.773 (p<.01) and -.744 (p<.05), for liberals and conservatives, respectively.
All tolled, Table 10 presents a total of 16 scenarios, or 2 per media outlet (one each for conservatives and liberals). The vast majority of these scenarios (13, or 81%) are consistent with Hypothesis 3. Of these, 10 scenarios (or 63%) are statistically significant. As anticipated, in turn, nine of the 10 statistically significant scenarios are consistent with the Issue Ownership heuristic. Overall, 11 scenarios (or 69%) are consistent with Issue Ownership, while seven (or 44%) are consistent with the Hostile Media Outlet heuristic. Of these latter seven, five are consistent with H3. Four of those five instances, in turn (liberal and conservative ratings of FOX and the New York Times), represent the most starkly ideological outlet labels in our dataset (according to our subjects). Consequently, in these instances, H3 predicts a pattern consistent with the Hostile Media Outlet heuristic, as we observe. Finally, one scenario (or .063%) is consistent with H3 but statistically insignificant, while only two scenarios are unambiguously inconsistent with H3 and with the Issue Ownership heuristic.
Taken together these results are strongly supportive of H3; in nearly instances, varying report labels had the predicted effects. Indeed, in nearly every instance where switching labels ought to have led subjects to alter their perceptions regarding issue coverage by a given media outlet, such an effect emerged.
Possible Endogenous Perceptions of Issue Ownership
Before concluding, we briefly consider two potential alternative explanations for the relative weakness of the HMOP heuristic. First, it is possible that our experimental design could have confused subjects by presenting improbable combinations of issue coverage and media outlet labels. Coders with strong prior beliefs concerning the type of content prevalent in different media outlets may have relied on the issue ownership essentially as a fallback heuristic. There is no way to fully refute this possibility. However, given that we based all of our predictions concerning the directions of changes caused by varying outlet labels on coding of unidentified reports, it seems highly improbable. In those cases, if there was dissonance, it was in the mind of the coder, not the content of the reports.
As we indicated previously, we explicitly instructed the coders to examine the context of the issue coverage, rather than reflexively assuming that one party always benefits when a report mentions a particular issue. We provided those instructions out of concern that our coders, comprised primarily of upper-division undergraduate political science majors, would evaluate the favorability of issue coverage based on their familiarity with the issue ownership literature. If the students disregarded our instructions, however, then it is possible that the apparent dominance of the issue ownership heuristic is a spurious finding, driven primarily by student’s knowledge of the issue ownership literature. While we shared this concern, we note that politically-engaged individuals -- those most likely to be familiar with reputations of issue ownership – were most likely to view issue coverage as favorable to their own party, rather than the party that nominally “owned” a given issue.
Second, it is also possible that some of our coders were unfamiliar with the issue ownership literature and the reputations that the political parties have developed for being superior in specific policy areas. These coders could have intuitively learned about issue ownership through their repeated exposure to news reports, as participants in our experiment. However, there is no meaningful difference between learning about issue ownership through participation in an
21
experiment and learning through repeated exposure to claims of issue ownership in the media. After all, we did not alter the substantive content of the reports. If the students were able to recognize issue ownership cues by reading the reports, those cues must have been present in the coverage. Nevertheless, given that half of our transcripts were anonymous, and half of the remaining transcripts were misidentified, it is difficult to imagine that our students were able to accurately associate media outlets with particular orientations of issue coverage based solely on their reading of the transcripts included in our experiment.
CONCLUSION Many voters depend, at least in part, on the Issue Ownership heuristic in their efforts to make sense of electoral politics as presented in the mass media. Indeed, the robustness of our results suggests that claims of issue ownership are deeply embedded in the political environment. Candidates and journalists are aware of them and shape their appeals and reporting accordingly. Indeed, previous research (Petrocik et al. 2003) has shown that journalists rely on issue ownership even when candidates do not. Moreover, voters, often maligned for their limited understanding of politics, are able to associate parties with their “owned” issues with a striking degree of consistency. Comparing the predictions of the Hostile Media Outlet heuristic with those of the Issue Ownership heuristic revealed substantially greater voter reliance on the latter. As Baum and Gussin (2004) show, individuals’ assessments of media outlet labels clearly matter; but in many instance, their perceptions of issue coverage by those outlets matters more. Our findings also show that individual perceptions interact with actual coverage to shape assessments of favorability. As individuals become more politically engaged, they employ a variety of cognitive strategies that allow them to counter-argue claims of issue ownership when they accrue to the electoral benefit of an opposing party. Nevertheless, we also found that in some instances and among some groups -- when prior beliefs concerning a media outlet’s ideological orientation are strong and consistent -- the Hostile Media Outlet heuristic can mitigate and, indeed, even override the Issue Ownership heuristic. Our findings hold potentially important implications for electoral politics. The increased fragmentation of the news environment, the expansion of niche news programs that appeal to relatively narrow segments of the ideological spectrum, along with candidates’ increasing – and perhaps resulting -- reliance on narrowcasting their appeals to particular ideological niches of the public, all suggest that the environment in which mass politics are conducted is undergoing substantial change. In the emerging political environment, the potency of media outlet brand names, their ability to penetrate the political environment, and consequently their influence on the political learning process, may be on the rise. We found that associations of parties with competence in specific issue areas, and differing media outlet coverage of those issue areas, frequently trumped ex ante assumptions concerning media ideological hostility. As noted, the exceptions were outlets for which our subjects held strong prior beliefs concerning the outlets’ ideological orientation. As more media outlets adopt a narrowcasting strategy, the number of instances where voters are likely to hold strong prior beliefs concerning outlet ideological orientation is likely to increase. One likely consequence is a relative increase in voter reliance on the Hostile Media Outlet heuristic, relative to the Issue Ownership heuristic, as voters struggle to make sense of the political world. Given that the former heuristic allows voters to dismiss, without expending significant cognitive energy, information presented by an outlet perceived as ideologically unfriendly, such a trend would most likely result in elections consisting more of
22
candidates preaching to the converted, and less of strategies aimed at producing new converts. Such a trend may well be troubling to democratic theorists who believe a genuine competition of ideas is a prerequisite for a well-functioning democracy.
APPENDIX 1. Issue Coding Rules and Calculations and Report Search Criteria
Issue Coding Rules and Calculations
We instructed subjects to code every instance in which a sentence or comment included some mention of a political issue that favored either presidential candidate or their respective parties. If the issue(s) mentioned in the sentence were equally favorable (or unfavorable) to both political parties, we instructed the coders to identify the sentence as balanced. For each “issue code,” the coders also indicated the importance of the issue to them personally, ranging from very important (5) to very unimportant (1). In the case of multiple issue mentions, coders entered the value of the most important issue in the set.
For our dependent variable, we set the value of each sentence at one favorable mention of an issue. For example, if a sentence included a single mention of issue X favorable to party Y, we calculated that as one favorable mention of issue X for party P. If a sentence included multiple mentions of issues favorable to party P but, according to the coder, one issue was clearly more important than the others, the coder only recorded the most important issue. If the coder felt that the issues were equally important, they included them all in the issue code.
In the case of multiple issue mentions, we weighted the value of each favorable issue such that they equaled one. For example, if a sentence included mentions of issues W, X, Y, and Z in a way that reflected favorably on party P, we counted the sentence as one favorable issue mention for Party P and divided its value evenly among all the issues mentioned. Therefore, policy W, X, Y, and Z each constitute.25 favorable issue mentions for party P.
If the report included two sentences that mentioned issues W, X, Y, and Z in a way that reflected favorably on party P, we counted the sentence as two favorable issue mention for Party P and divided its value evenly among all the issues mentioned (i.e., issues W, X, Y, and Z =.5).
Search Criteria for Locating Articles and Transcripts
We identified the print and broadcast reports using a similar set of search parameters. For all sources in the Lexis-Nexis database, we searched for reports that included “Bush” or “Gore” in the headline, lead paragraphs, or terms.22 We obtained Wall Street Journal transcripts from the ProQuest database. In those cases, we searched for articles with “Bush” or “Gore” in the “citation or abstract,” while also specifying the article type as “News.”
When a search turned up multiple reports on the same day, we selected one at random. For print media outlets, we selected articles that were on or closest to the front page. If, however, one article was clearly far more focused on the campaign than the other, we selected that article. When a search turned up two or more front-page articles with comparable campaign
22 The search terms for the New York Times were as follows: Bush (HLT) OR Gore (HLT) AND NOT "information bank abstracts." In the second stage, we used the “search within results” function to isolate articles that included the words “Section A; Page 1.” We were able to locate front-page articles in USA Today in a one stage process using the following terms: Bush (HLT) or Gore (HLT) AND Pg. 1A (FULL TEXT).
23
coverage, we selected one randomly. If a search turned up multiple network news broadcasts on the same day, we used two
methods to determine which transcript to include in our sample. If the summary description of one broadcast included the phrase "Campaign 2000" – or some variation thereof –we included it. If none – or all – of the transcripts included the phrase "Campaign 2000," we selected one randomly.
In order to ensure comparability between network and cable news transcripts in our sample set – as cable transcripts tended to be longer -- we located individual news reports within a given broadcast that met our search criteria. We then chose randomly between the first and second report that covered the presidential campaign. The resulting network and cable news broadcasts in our data set were similar not only in structure, but also in size, averaging 509 and 600 words, respectively.
For the print media, articles in USA Today are typically much shorter than those in the New York Times and Wall Street Journal. In order to reduce the likelihood that participants would use those differences as cues, we only included the first six to eight paragraphs in our sample. Consequently, the average word count for articles in USA Today, New York Times, and Wall Street Journal included in our sample is 349, 380, and 448, respectively.
APPENDIX 2. Ownership of Issues, by Party
Civil liberties: rights of accused, freedom of speech, etc. Democrats Law and Order: crime, gun control and ownership (2nd Amendment), capital punishment, frivolous lawsuits, tort reform, Supreme Court nominations.
Republicans
Social (Values) Order: censorship, character, lifestyles, traditional values, unconventional groups or movements, same-sex marriages, gay rights, prayer in school, religion, entertainment industry, family values, marketing practices, media violence, sex education, etc.
Republicans
Foreign relations: reference to relations with other countries, including military treaties and aid.
Performance
Defense spending and policy: reference to the defense budget, weapons systems, or military policy, including missile defense, national security, terrorism, etc.
Republicans
Civil Rights: reference to ethnic or racial matters or groups including affirmative action, diversity, minority rights or voting, racial profiling, etc.
Democrats
Social welfare/spending (benefits distributed to general population): reference to government social welfare activity that is not group specific Energy policy (including oil, gas, conservation, shortages, prices), education (including vouchers, school reform, environmental policy, health care, welfare.
Democrats
Social welfare/spending: (benefits distributed to specific populations): child care, prescription drug plan, family leave, Medicare, Senior health care and services, social security, etc.
Democrats
Farmers and agriculture: references to activity on behalf of farmers, agriculture, or rural groups.
Democrats
Social class and group relationships: references to the needs of interests of Democrats
24
groups in relation to other groups, e.g., middle class vs. rich, big vs. small business, old vs. young, etc., including affirmative action. Women: any reference to women, women's rights, sex equality, abortion rights, gender gap, women’s health care issues.
Democrats
Organized labor: any reference to unions or labor, including worker’s rights, working families, minimum wage, etc.
Democrats
Big government I: reference to government taxing and spending (not tied to a specific welfare policy) or regulation of the economy (excluding mentions of taxes), including budget, surplus, deficit, fiscal policy, size of government, etc.
Republican
Big government II: reference to taxations Republican Economy: any reference to the economy or its condition including jobs, poverty, prosperity, cost of living, stock market, etc.
Performance
Government functioning: any reference to government corruption or failures, not classified elsewhere by substantive topic including campaign finance reform, special interests, anti-trust legislation.
Performance
Politics: references to strictly non-issue related campaign coverage including swing states, strategy, campaign ads and spending, references to specific candidates (e.g., Bush’s DUI, Gore’s credibility), celebrity endorsements, fundraising, votes and voters, debates, personal attacks, platforms, polls, Nader, etc.
No party
All other mentions including big business, civility, communication policy, insurance, internet, technology, trust, the common man, etc.
No party
Source: Petrocik (1996)
APPENDIX 3. Variable Question Wording and Coding
Political Awareness: scale derived from 21 factual knowledge questions. Respondents were given
one point for each correct response, resulting in a scale with a mean of 14.3 and a standard deviation of 4.3. The questions were as follows: Who has the final responsibility to decide if a law is Constitutional or not?; Whose responsibility is it to nominate judges to the Federal Courts?; Which party currently controls the House of Representatives and the Senate?; How much of a majority is required for the U.S. Senate and House to override a presidential veto?; When the Federal Reserve raises interest rates, is this intended to tend to reduce or increase the rate of growth in the economy?; What are the first ten amendments to the Constitution called?; Who is the: Speaker of the U.S. House of Representatives, majority leader of the U.S. Senate, President of the Russian Federation, Prime Minister of Israel, Prime Minister of Great Britain, Vice President of the United States, Chairman of the Federal Reserve Board, Attorney General of the United States, Chief Justice of the U.S. Supreme Court, President of France, and Governor of California?; How many members of the Bush family have been president of the United States?; Who is Michael K. Powell?; Who is L. Paul Bremer III?
Party identification: “Thinking in terms of your political affiliation, which category do you think best describes you?” Coded: 1=Strong Republican, 2=Republican, 3=Independent, Lean Republican, 4=Independent, 5=Independent, Lean Democrat, 6=Democrat, 7=Strong Democrat.
25
Follow National Political News: “How closely do you follow news about political figures and events in Washington D.C.?” Coded 1=Not at all closely, 2=Not very closely, 3=Somewhat closely, 4=Very closely.
Care who wins election: “Generally speaking, would you say that you personally care very much who wins the presidential election this fall [2004], or that you don't care very much who wins?” Coded: 1=I care very much who wins, 2=I care who wins, 3=I don't care much who wins, 4=I don't care at all who wins, 5=I Don't Know. (Note: there were no “don’t know” responses among our respondents.)
Approve President Bush: “Do you APPROVE or DISAPPROVE of the way George W. Bush is HANDLING HIS JOB AS PRESIDENT?” Coded: 1=Strongly Approve, 2=Approve, 3= Somewhat Approve, 4=Neither Approve or Disapprove, 5=Somewhat Disapprove, 6= Disapprove, 7=Strongly Disapprove, 8=Don't Know. (There were no “don’t know” responses.)
Opinionated: Some people have opinions about almost everything; other people have opinions about just some things; and still other people have very few opinions. What about you? Would you say you have opinions about almost everything, about many things, about some things, or about very few things? Coded: 4=Almost everything, 3=Many things, 2=Some things, 1 =Very few things.
Hard news exposure scale: “How often do you (read/watch)” The newspaper? National network television newscasts? News on a cable network (e.g. CNN, MSNBC, FOX). Coded: 4=Regularly, 3 =Sometimes, 2 =Hardly Ever, 1 =Never.
Media believability scale: How believable is the information you get from….Local television news? National network television news? Cable news? Newspapers? (print only)? the Internet (excluding newspaper websites)? Radio? Magazines? Late night comedy? Tabloid/Entertainment News TV Shows (e.g., "Entertainment Tonight", "Access Hollywood", and "Inside Edition")? Coded: 4=Extremely, 3 =Somewhat, 2 =Not Very, 1=Not At All.
REFERENCES
Ansolabehere, Stephen, and Shanto Iyengar. 1994. Riding the Wave and Claiming Ownership Over Issues: The Joint Effect of Advertising and News Coverage in Campaigns. Public Opinion Quarterly 58 (3).
Baum, Matthew, and Phil Gussin. 2004. In the Eye of the Beholder: An Experimental Investigation into the Foundations of the Hostile Media Phenomenon. Paper read at American Political Science Association, 2-5 September, at Chicago, IL.
Chaiken, Shelly, Akiva Liberman, and Alice Eagly. 1989. Heuristic and Systematic Information Processing Within and Beyond the Persuasion Context. In Unintended thought, edited by J. S. Uleman and J. A. Bargh. New York: Guilford Press.
Christen, Cindy, Prathana Kannaovakun, and Albert Gunther. 2002. Hostile Media Perceptions: Partisan Assessments of Press and Public during the 1997 United Parcel Service Strike. Political Communication 19 (4):423-436.
Dalton, Russell J., Paul Allen Beck, and Robert Huckfeldt. 1998. Partisan Cues and the Media: Information Flows in the 1992 Presidential Election. American Political Science Review 92 (1):111-126.
Druckman, James. 2001a. Evaluating framing effects. Journal of Economic Pyschology 22:91-101.
26
Druckman, James. 2001b. On the Limits of Framing Effects: Who Can Frame? The Journal of Politics 63 (4):1041-1066.
Druckman, James. 2001c. Using Credible Advice to Overcome Framing Effects. Journal of Law, Economics, & Organization 17:62-82.
Giner-Sorolla, Roger, and Shelly Chaiken. 1994. The Causes of Hostile Media Judgments. Journal of Experimental Social Pyschology 30:165-180.
Graber, Doris A. 1987. Framing election news broadcasts: News context and its impact on the 1984 presidential election. Social Science Quarterly 68:552-568.
Gunther, Albert, and Stella Chin-Yun Chia. 2001. Predicting Pluralistic Ignorance: The Hostile Media Effect and its Consequences. Journalism and Mass Communication 78 (4):689-701.
Gunther, Albert, and Cindy Christen. 2002. Projection or Persuasive Press? Contrary Effects of Personal Opinion and Perceived News Coverage on Estimates of Public Opinion. Journal of Communication:177-194.
Gunther, Albert, Cindy Christen, and Prathana Kannaovakun. 2002. Hostile Media Perceptions: Partisan Assessments of Press and Public during the 1997 United Parcel Service Strike. Political Communication 19:423-436.
Gunther, Albert, and Kathleen Schmitt. 2004. Mapping Boundaries of the Hostile Media Effect. Journal of Communication 54 (1):55-70.
Hill, David. 1985. Viewer Characteristics and Agenda Setting by Television News. Public Opinion Quarterly 49 (3):340-350.
Holian, David B. 2004. HE’S STEALING MY ISSUES! Clinton’s Crime Rhetoric and the Dynamics of Issue Ownership. Political Behavior 26 (2):95-124.
Iyengar, Shanto, Mark D. Peters, and Donald R. Kinder. 1982. Experimental Demonstrations of the "Not-So-Minimal" Consequences of Television News Programs. American Political Science Review 76 (4):848-858.
Kahneman, Daniel, Paul Slovic, and Amos Tversky. 1982. Judgment under uncertainty : heuristics and biases. Cambridge ; New York: Cambridge University Press.
Kaufmann, Karen M. 2000. Issue Ownership and Voter Choice in the 1998 Senate Elections. Paper read at Annual Meeting of the Midwest Political Science Association, at Chicago.
Lupia, Arthur, and Mathew D. McCubbins. 1998. The democratic dilemma : can citizens learn what they need to know?, Political economy of institutions and decisions. Cambridge, U.K. ; New York: Cambridge University Press.
McCombs, Maxwell E., and Donald L. Shaw. 1972. The Agenda-Setting Function of Mass Media. Public Opinion Quarterly 36 (2):176-187.
Morehouse, Jeanette. 2001. Even Paranoid People Have Enemies: The Hostile Media Effect in the 1992 Presidential Election. Paper read at Annual Meeting of the Southern Political Science Association, November 7-0, at Atlanta, Georgia.
Morehouse Mendez, Jeanette. 2004. Killing the Messenger: An Experimental Analysis of the Hostile Media Effect. Paper read at Southern Political Science Association, at New Orleans, LA.
Peffley, Mark, Jason Glass, and James Avery. 2001. Public Perceptions of Bias in the News Media: Taking A Closer Look at the Hostile Media Phenomenon. Paper read at Annual Meeting of the Midwest Political Science Association, at Chicago, Illinois.
Perloff, Richard. 1989. Ego-involvement and the third person effect of televised news coverage. Communication Research 16:236-262.
27
Petrocik, John. 1996. Issue Ownership in Presidential Elections, with a 1980 Case Study. American Journal of Political Science 40 (3):825-50.
Petrocik, John R. 1994. A Theory of Issue Ownership and the 1980 Presidential Election. Paper read at Annual Meeting of the American Political Science Association, at New York.
Petrocik, John R., William L. Beniot, and Glenn J. Hansen. 2003. Issue Ownership and Presidential Campaigning, 1952-2000. Political Science Quarterly 118 (4):599-626.
Rhee, J.W. 1997. Strategy and issue frames in election campaign coverage: A social cognitive account of framing effects. Journal of Communication 47:26-48.
Sears, David O., and R.E. Whitney. 1973. Political Persuasion. Morrison, N.J.: General Learning Press.
Vallone, R., L. Ross, and M.R. Lepper. 1985. The hostile media phenomenon: Biased perception and perceptions of media bias in coverage of the "Beirut Massacre." Journal of Personality and Social Psychology 49:577-585.
Watts, Mark, David Domke, Dhavan Shah, and David Fan. 1999. Elite Cues and Media Bias in Presidential Campaigns: Explaining Public Perceptions of a Liberal Press. Communication Research 26 (2):144-175.
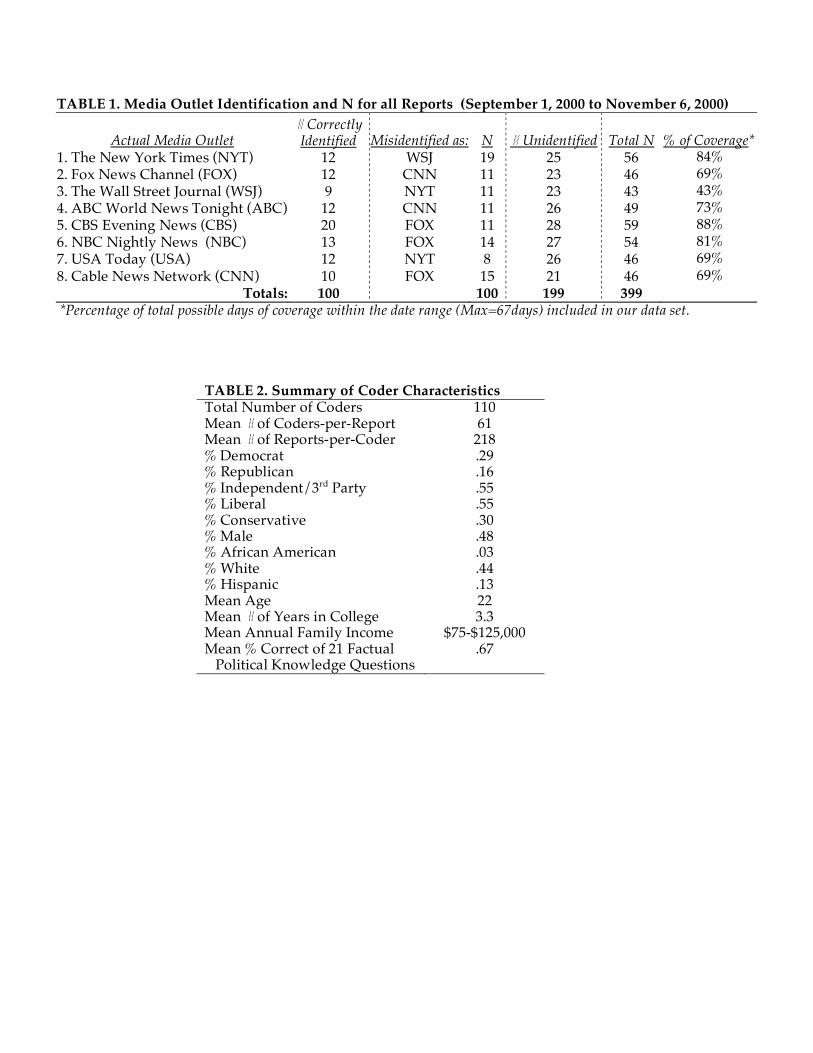
TABLE 1. Media Outlet Identification and N for all Reports (September 1, 2000 to November 6, 2000)
Actual Media Outlet # Correctly Identified Misidentified as: N # Unidentified Total N % of Coverage*
1. The New York Times (NYT) 12 WSJ 19 25 56 84% 2. Fox News Channel (FOX) 12 CNN 11 23 46 69% 3. The Wall Street Journal (WSJ) 9 NYT 11 23 43 43% 4. ABC World News Tonight (ABC) 12 CNN 11 26 49 73% 5. CBS Evening News (CBS) 20 FOX 11 28 59 88% 6. NBC Nightly News (NBC) 13 FOX 14 27 54 81% 7. USA Today (USA) 12 NYT 8 26 46 69% 8. Cable News Network (CNN) 10 FOX 15 21 46 69%
Totals: 100 100 199 399 *Percentage of total possible days of coverage within the date range (Max=67days) included in our data set.
TABLE 2. Summary of Coder Characteristics Total Number of Coders 110 Mean # of Coders-per-Report 61 Mean # of Reports-per-Coder 218 % Democrat .29 % Republican .16 % Independent/3rd Party .55 % Liberal .55 % Conservative .30 % Male .48 % African American .03 % White .44 % Hispanic .13 Mean Age 22 Mean # of Years in College 3.3 Mean Annual Family Income $75-$125,000 Mean % Correct of 21 Factual Political Knowledge Questions
.67
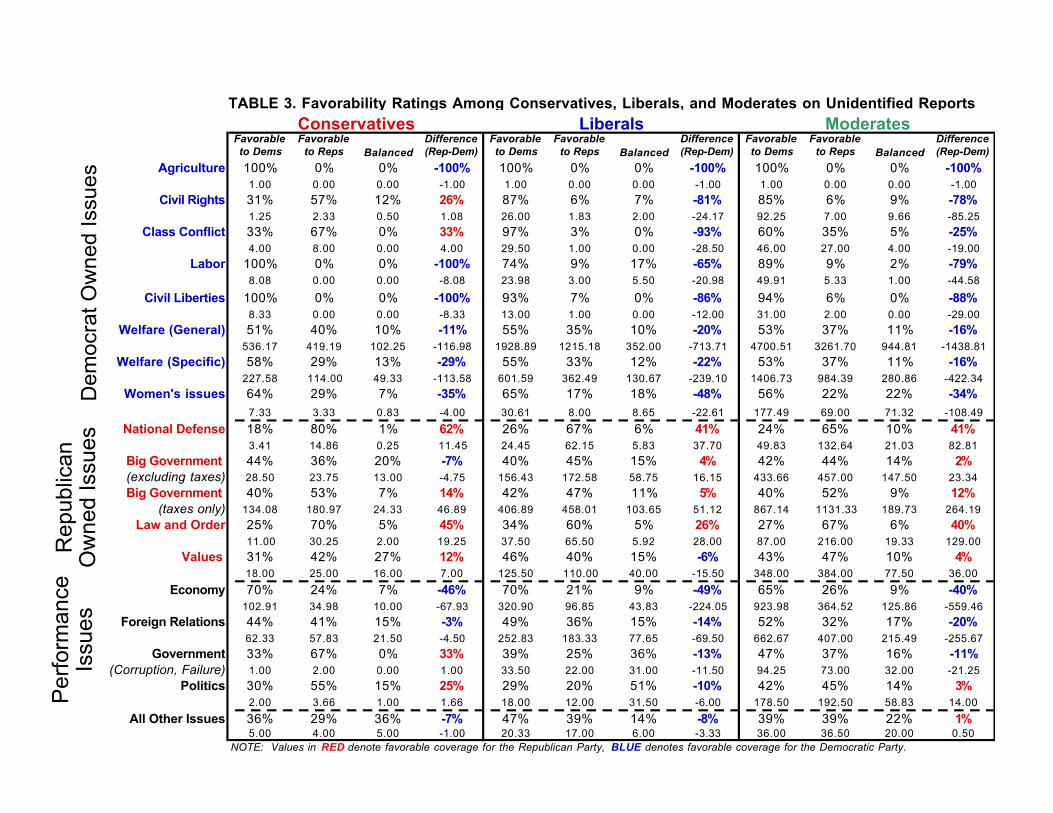
Favorable
to Dems
Favorable
to Reps Balanced
Difference
(Rep-Dem)
Favorable
to Dems
Favorable
to Reps Balanced
Difference
(Rep-Dem)
Favorable
to Dems
Favorable
to Reps Balanced
Difference
(Rep-Dem)
Agriculture 100% 0% 0% -100% 100% 0% 0% -100% 100% 0% 0% -100%
1.00 0.00 0.00 -1.00 1.00 0.00 0.00 -1.00 1.00 0.00 0.00 -1.00
Civil Rights 31% 57% 12% 26% 87% 6% 7% -81% 85% 6% 9% -78%
1.25 2.33 0.50 1.08 26.00 1.83 2.00 -24.17 92.25 7.00 9.66 -85.25
Class Conflict 33% 67% 0% 33% 97% 3% 0% -93% 60% 35% 5% -25%
4.00 8.00 0.00 4.00 29.50 1.00 0.00 -28.50 46.00 27.00 4.00 -19.00
Labor 100% 0% 0% -100% 74% 9% 17% -65% 89% 9% 2% -79%
8.08 0.00 0.00 -8.08 23.98 3.00 5.50 -20.98 49.91 5.33 1.00 -44.58
Civil Liberties 100% 0% 0% -100% 93% 7% 0% -86% 94% 6% 0% -88%
8.33 0.00 0.00 -8.33 13.00 1.00 0.00 -12.00 31.00 2.00 0.00 -29.00
Welfare (General) 51% 40% 10% -11% 55% 35% 10% -20% 53% 37% 11% -16%
536.17 419.19 102.25 -116.98 1928.89 1215.18 352.00 -713.71 4700.51 3261.70 944.81 -1438.81
Welfare (Specific) 58% 29% 13% -29% 55% 33% 12% -22% 53% 37% 11% -16%
227.58 114.00 49.33 -113.58 601.59 362.49 130.67 -239.10 1406.73 984.39 280.86 -422.34
Women's issues 64% 29% 7% -35% 65% 17% 18% -48% 56% 22% 22% -34%
7.33 3.33 0.83 -4.00 30.61 8.00 8.65 -22.61 177.49 69.00 71.32 -108.49
National Defense 18% 80% 1% 62% 26% 67% 6% 41% 24% 65% 10% 41%
3.41 14.86 0.25 11.45 24.45 62.15 5.83 37.70 49.83 132.64 21.03 82.81
Big Government 44% 36% 20% -7% 40% 45% 15% 4% 42% 44% 14% 2%
(excluding taxes) 28.50 23.75 13.00 -4.75 156.43 172.58 58.75 16.15 433.66 457.00 147.50 23.34
Big Government 40% 53% 7% 14% 42% 47% 11% 5% 40% 52% 9% 12%
(taxes only) 134.08 180.97 24.33 46.89 406.89 458.01 103.65 51.12 867.14 1131.33 189.73 264.19
Law and Order 25% 70% 5% 45% 34% 60% 5% 26% 27% 67% 6% 40%
11.00 30.25 2.00 19.25 37.50 65.50 5.92 28.00 87.00 216.00 19.33 129.00
Values 31% 42% 27% 12% 46% 40% 15% -6% 43% 47% 10% 4%
18.00 25.00 16.00 7.00 125.50 110.00 40.00 -15.50 348.00 384.00 77.50 36.00
Economy 70% 24% 7% -46% 70% 21% 9% -49% 65% 26% 9% -40%
102.91 34.98 10.00 -67.93 320.90 96.85 43.83 -224.05 923.98 364.52 125.86 -559.46
Foreign Relations 44% 41% 15% -3% 49% 36% 15% -14% 52% 32% 17% -20%
62.33 57.83 21.50 -4.50 252.83 183.33 77.65 -69.50 662.67 407.00 215.49 -255.67
Government 33% 67% 0% 33% 39% 25% 36% -13% 47% 37% 16% -11%
(Corruption, Failure) 1.00 2.00 0.00 1.00 33.50 22.00 31.00 -11.50 94.25 73.00 32.00 -21.25
Politics 30% 55% 15% 25% 29% 20% 51% -10% 42% 45% 14% 3%
2.00 3.66 1.00 1.66 18.00 12.00 31.50 -6.00 178.50 192.50 58.83 14.00
All Other Issues 36% 29% 36% -7% 47% 39% 14% -8% 39% 39% 22% 1%5.00 4.00 5.00 -1.00 20.33 17.00 6.00 -3.33 36.00 36.50 20.00 0.50
NOTE: Values in RED denote favorable coverage for the Republican Party, BLUE denotes favorable coverage for the Democratic Party.
Conservatives Liberals Moderates
TABLE 3. Favorability Ratings Among Conservatives, Liberals, and Moderates on Unidentified ReportsD
em
ocra
t O
wned Issues
Republic
an
Ow
ned Issues
Performance
Issues
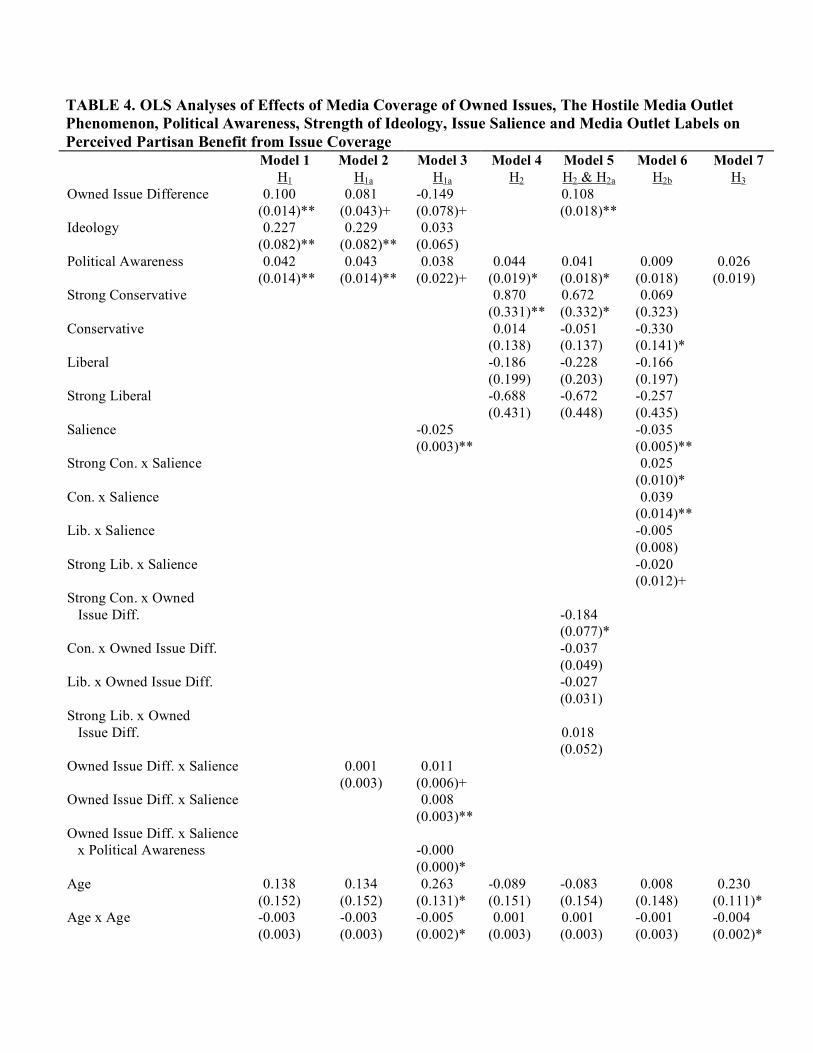
TABLE 4. OLS Analyses of Effects of Media Coverage of Owned Issues, The Hostile Media Outlet Phenomenon, Political Awareness, Strength of Ideology, Issue Salience and Media Outlet Labels on Perceived Partisan Benefit from Issue Coverage
Model 1 Model 2 Model 3 Model 4 Model 5 Model 6 Model 7 H1 H1a H1a H2 H2 & H2a H2b H3 Owned Issue Difference 0.100 0.081 -0.149 0.108 (0.014)** (0.043)+ (0.078)+ (0.018)** Ideology 0.227 0.229 0.033 (0.082)** (0.082)** (0.065) Political Awareness 0.042 0.043 0.038 0.044 0.041 0.009 0.026 (0.014)** (0.014)** (0.022)+ (0.019)* (0.018)* (0.018) (0.019) Strong Conservative 0.870 0.672 0.069 (0.331)** (0.332)* (0.323) Conservative 0.014 -0.051 -0.330 (0.138) (0.137) (0.141)* Liberal -0.186 -0.228 -0.166 (0.199) (0.203) (0.197) Strong Liberal -0.688 -0.672 -0.257 (0.431) (0.448) (0.435) Salience -0.025 -0.035 (0.003)** (0.005)** Strong Con. x Salience 0.025 (0.010)* Con. x Salience 0.039 (0.014)** Lib. x Salience -0.005 (0.008) Strong Lib. x Salience -0.020 (0.012)+ Strong Con. x Owned Issue Diff.
-0.184
(0.077)* Con. x Owned Issue Diff. -0.037 (0.049) Lib. x Owned Issue Diff. -0.027 (0.031) Strong Lib. x Owned Issue Diff.
0.018
(0.052) Owned Issue Diff. x Salience 0.001 0.011 (0.003) (0.006)+ Owned Issue Diff. x Salience 0.008 (0.003)** Owned Issue Diff. x Salience x Political Awareness
-0.000
(0.000)* Age 0.138 0.134 0.263 -0.089 -0.083 0.008 0.230 (0.152) (0.152) (0.131)* (0.151) (0.154) (0.148) (0.111)* Age x Age -0.003 -0.003 -0.005 0.001 0.001 -0.001 -0.004 (0.003) (0.003) (0.002)* (0.003) (0.003) (0.003) (0.002)*
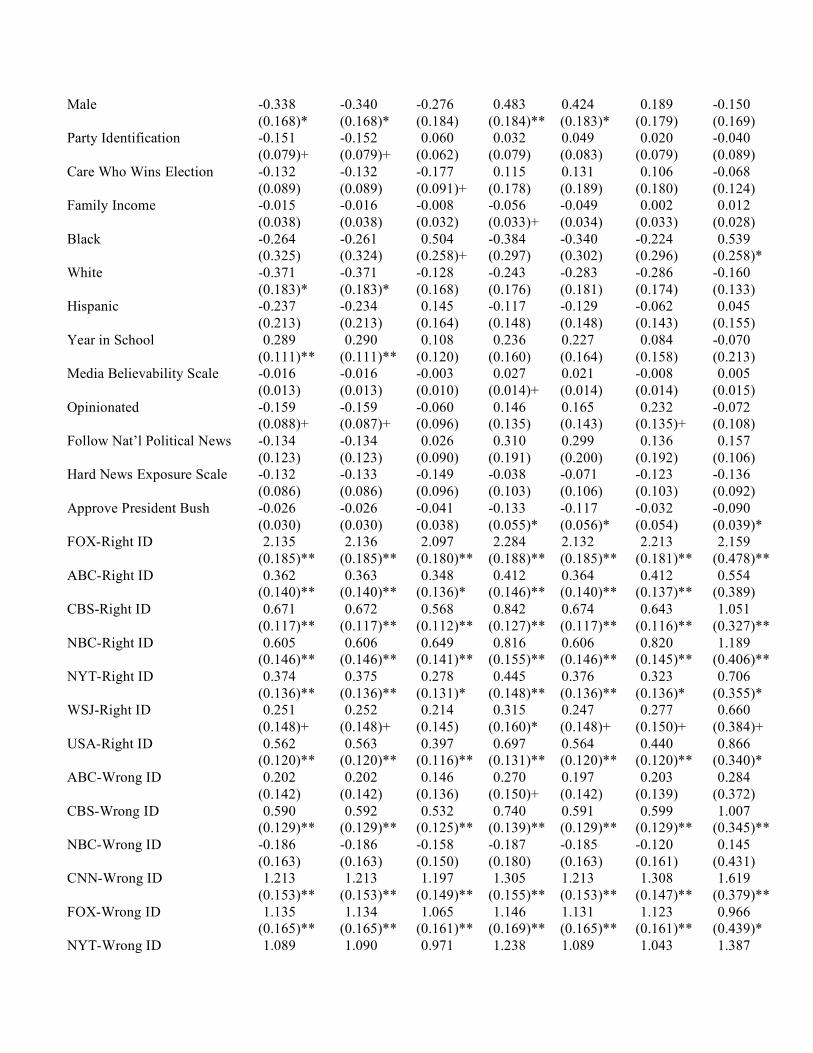
Male -0.338 -0.340 -0.276 0.483 0.424 0.189 -0.150 (0.168)* (0.168)* (0.184) (0.184)** (0.183)* (0.179) (0.169) Party Identification -0.151 -0.152 0.060 0.032 0.049 0.020 -0.040 (0.079)+ (0.079)+ (0.062) (0.079) (0.083) (0.079) (0.089) Care Who Wins Election -0.132 -0.132 -0.177 0.115 0.131 0.106 -0.068 (0.089) (0.089) (0.091)+ (0.178) (0.189) (0.180) (0.124) Family Income -0.015 -0.016 -0.008 -0.056 -0.049 0.002 0.012 (0.038) (0.038) (0.032) (0.033)+ (0.034) (0.033) (0.028) Black -0.264 -0.261 0.504 -0.384 -0.340 -0.224 0.539 (0.325) (0.324) (0.258)+ (0.297) (0.302) (0.296) (0.258)* White -0.371 -0.371 -0.128 -0.243 -0.283 -0.286 -0.160 (0.183)* (0.183)* (0.168) (0.176) (0.181) (0.174) (0.133) Hispanic -0.237 -0.234 0.145 -0.117 -0.129 -0.062 0.045 (0.213) (0.213) (0.164) (0.148) (0.148) (0.143) (0.155) Year in School 0.289 0.290 0.108 0.236 0.227 0.084 -0.070 (0.111)** (0.111)** (0.120) (0.160) (0.164) (0.158) (0.213) Media Believability Scale -0.016 -0.016 -0.003 0.027 0.021 -0.008 0.005 (0.013) (0.013) (0.010) (0.014)+ (0.014) (0.014) (0.015) Opinionated -0.159 -0.159 -0.060 0.146 0.165 0.232 -0.072 (0.088)+ (0.087)+ (0.096) (0.135) (0.143) (0.135)+ (0.108) Follow Nat’l Political News -0.134 -0.134 0.026 0.310 0.299 0.136 0.157 (0.123) (0.123) (0.090) (0.191) (0.200) (0.192) (0.106) Hard News Exposure Scale -0.132 -0.133 -0.149 -0.038 -0.071 -0.123 -0.136 (0.086) (0.086) (0.096) (0.103) (0.106) (0.103) (0.092) Approve President Bush -0.026 -0.026 -0.041 -0.133 -0.117 -0.032 -0.090 (0.030) (0.030) (0.038) (0.055)* (0.056)* (0.054) (0.039)* FOX-Right ID 2.135 2.136 2.097 2.284 2.132 2.213 2.159 (0.185)** (0.185)** (0.180)** (0.188)** (0.185)** (0.181)** (0.478)** ABC-Right ID 0.362 0.363 0.348 0.412 0.364 0.412 0.554 (0.140)** (0.140)** (0.136)* (0.146)** (0.140)** (0.137)** (0.389) CBS-Right ID 0.671 0.672 0.568 0.842 0.674 0.643 1.051 (0.117)** (0.117)** (0.112)** (0.127)** (0.117)** (0.116)** (0.327)** NBC-Right ID 0.605 0.606 0.649 0.816 0.606 0.820 1.189 (0.146)** (0.146)** (0.141)** (0.155)** (0.146)** (0.145)** (0.406)** NYT-Right ID 0.374 0.375 0.278 0.445 0.376 0.323 0.706 (0.136)** (0.136)** (0.131)* (0.148)** (0.136)** (0.136)* (0.355)* WSJ-Right ID 0.251 0.252 0.214 0.315 0.247 0.277 0.660 (0.148)+ (0.148)+ (0.145) (0.160)* (0.148)+ (0.150)+ (0.384)+ USA-Right ID 0.562 0.563 0.397 0.697 0.564 0.440 0.866 (0.120)** (0.120)** (0.116)** (0.131)** (0.120)** (0.120)** (0.340)* ABC-Wrong ID 0.202 0.202 0.146 0.270 0.197 0.203 0.284 (0.142) (0.142) (0.136) (0.150)+ (0.142) (0.139) (0.372) CBS-Wrong ID 0.590 0.592 0.532 0.740 0.591 0.599 1.007 (0.129)** (0.129)** (0.125)** (0.139)** (0.129)** (0.129)** (0.345)** NBC-Wrong ID -0.186 -0.186 -0.158 -0.187 -0.185 -0.120 0.145 (0.163) (0.163) (0.150) (0.180) (0.163) (0.161) (0.431) CNN-Wrong ID 1.213 1.213 1.197 1.305 1.213 1.308 1.619 (0.153)** (0.153)** (0.149)** (0.155)** (0.153)** (0.147)** (0.379)** FOX-Wrong ID 1.135 1.134 1.065 1.146 1.131 1.123 0.966 (0.165)** (0.165)** (0.161)** (0.169)** (0.165)** (0.161)** (0.439)* NYT-Wrong ID 1.089 1.090 0.971 1.238 1.089 1.043 1.387
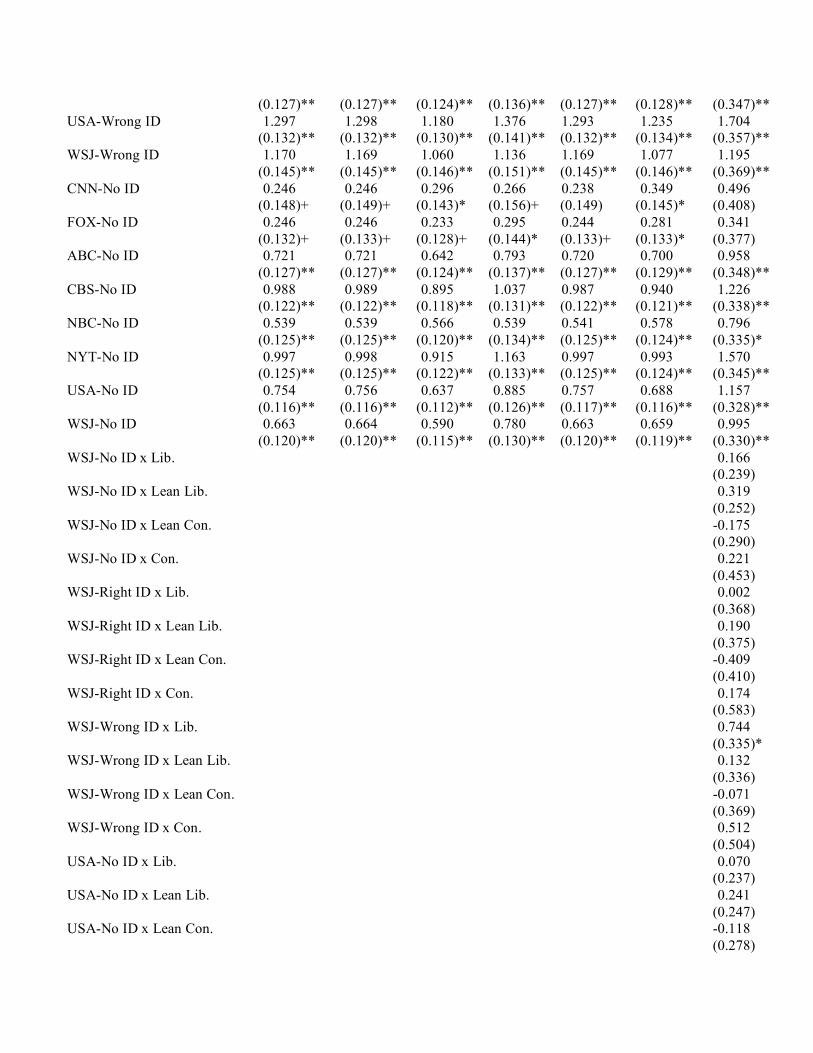
(0.127)** (0.127)** (0.124)** (0.136)** (0.127)** (0.128)** (0.347)** USA-Wrong ID 1.297 1.298 1.180 1.376 1.293 1.235 1.704 (0.132)** (0.132)** (0.130)** (0.141)** (0.132)** (0.134)** (0.357)** WSJ-Wrong ID 1.170 1.169 1.060 1.136 1.169 1.077 1.195 (0.145)** (0.145)** (0.146)** (0.151)** (0.145)** (0.146)** (0.369)** CNN-No ID 0.246 0.246 0.296 0.266 0.238 0.349 0.496 (0.148)+ (0.149)+ (0.143)* (0.156)+ (0.149) (0.145)* (0.408) FOX-No ID 0.246 0.246 0.233 0.295 0.244 0.281 0.341 (0.132)+ (0.133)+ (0.128)+ (0.144)* (0.133)+ (0.133)* (0.377) ABC-No ID 0.721 0.721 0.642 0.793 0.720 0.700 0.958 (0.127)** (0.127)** (0.124)** (0.137)** (0.127)** (0.129)** (0.348)** CBS-No ID 0.988 0.989 0.895 1.037 0.987 0.940 1.226 (0.122)** (0.122)** (0.118)** (0.131)** (0.122)** (0.121)** (0.338)** NBC-No ID 0.539 0.539 0.566 0.539 0.541 0.578 0.796 (0.125)** (0.125)** (0.120)** (0.134)** (0.125)** (0.124)** (0.335)* NYT-No ID 0.997 0.998 0.915 1.163 0.997 0.993 1.570 (0.125)** (0.125)** (0.122)** (0.133)** (0.125)** (0.124)** (0.345)** USA-No ID 0.754 0.756 0.637 0.885 0.757 0.688 1.157 (0.116)** (0.116)** (0.112)** (0.126)** (0.117)** (0.116)** (0.328)** WSJ-No ID 0.663 0.664 0.590 0.780 0.663 0.659 0.995 (0.120)** (0.120)** (0.115)** (0.130)** (0.120)** (0.119)** (0.330)** WSJ-No ID x Lib. 0.166 (0.239) WSJ-No ID x Lean Lib. 0.319 (0.252) WSJ-No ID x Lean Con. -0.175 (0.290) WSJ-No ID x Con. 0.221 (0.453) WSJ-Right ID x Lib. 0.002 (0.368) WSJ-Right ID x Lean Lib. 0.190 (0.375) WSJ-Right ID x Lean Con. -0.409 (0.410) WSJ-Right ID x Con. 0.174 (0.583) WSJ-Wrong ID x Lib. 0.744 (0.335)* WSJ-Wrong ID x Lean Lib. 0.132 (0.336) WSJ-Wrong ID x Lean Con. -0.071 (0.369) WSJ-Wrong ID x Con. 0.512 (0.504) USA-No ID x Lib. 0.070 (0.237) USA-No ID x Lean Lib. 0.241 (0.247) USA-No ID x Lean Con. -0.118 (0.278)
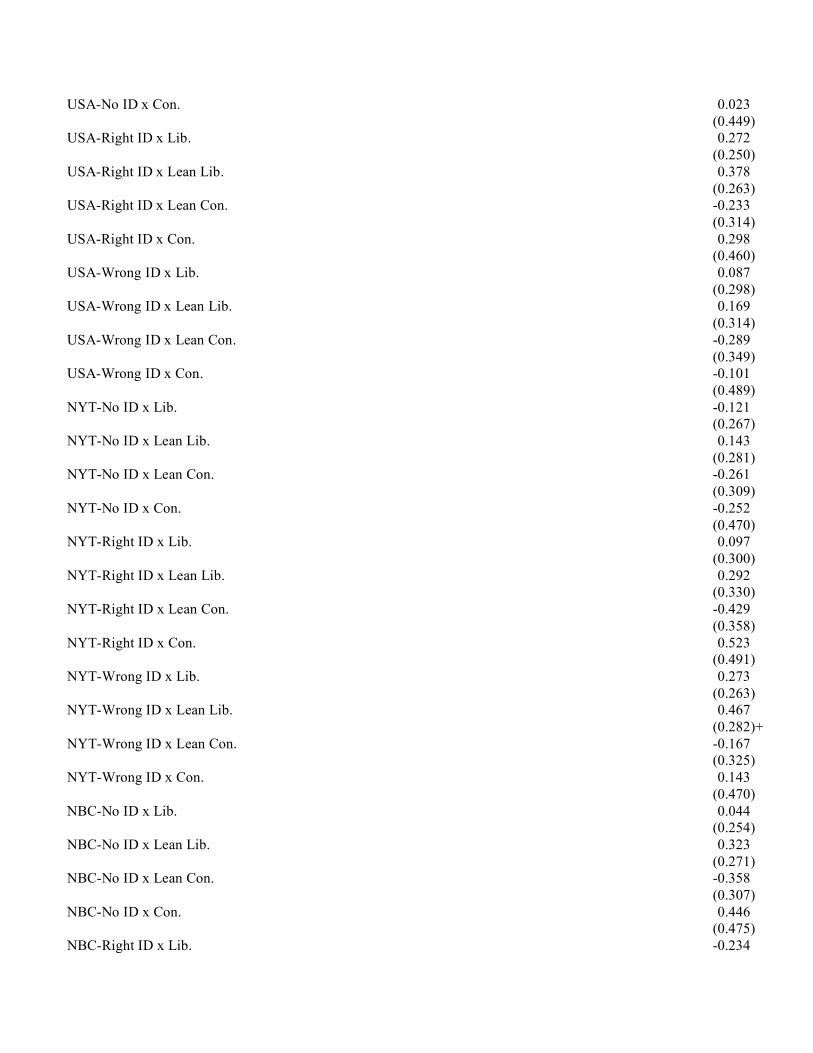
USA-No ID x Con. 0.023 (0.449) USA-Right ID x Lib. 0.272 (0.250) USA-Right ID x Lean Lib. 0.378 (0.263) USA-Right ID x Lean Con. -0.233 (0.314) USA-Right ID x Con. 0.298 (0.460) USA-Wrong ID x Lib. 0.087 (0.298) USA-Wrong ID x Lean Lib. 0.169 (0.314) USA-Wrong ID x Lean Con. -0.289 (0.349) USA-Wrong ID x Con. -0.101 (0.489) NYT-No ID x Lib. -0.121 (0.267) NYT-No ID x Lean Lib. 0.143 (0.281) NYT-No ID x Lean Con. -0.261 (0.309) NYT-No ID x Con. -0.252 (0.470) NYT-Right ID x Lib. 0.097 (0.300) NYT-Right ID x Lean Lib. 0.292 (0.330) NYT-Right ID x Lean Con. -0.429 (0.358) NYT-Right ID x Con. 0.523 (0.491) NYT-Wrong ID x Lib. 0.273 (0.263) NYT-Wrong ID x Lean Lib. 0.467 (0.282)+ NYT-Wrong ID x Lean Con. -0.167 (0.325) NYT-Wrong ID x Con. 0.143 (0.470) NBC-No ID x Lib. 0.044 (0.254) NBC-No ID x Lean Lib. 0.323 (0.271) NBC-No ID x Lean Con. -0.358 (0.307) NBC-No ID x Con. 0.446 (0.475) NBC-Right ID x Lib. -0.234
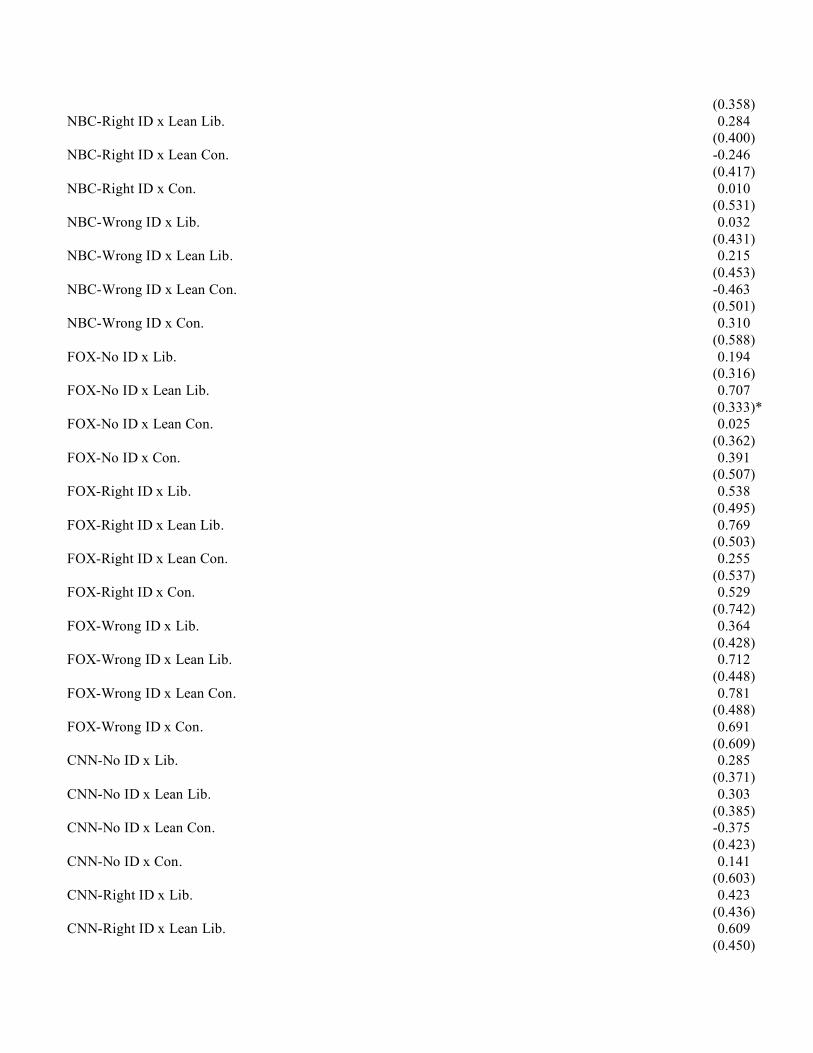
(0.358) NBC-Right ID x Lean Lib. 0.284 (0.400) NBC-Right ID x Lean Con. -0.246 (0.417) NBC-Right ID x Con. 0.010 (0.531) NBC-Wrong ID x Lib. 0.032 (0.431) NBC-Wrong ID x Lean Lib. 0.215 (0.453) NBC-Wrong ID x Lean Con. -0.463 (0.501) NBC-Wrong ID x Con. 0.310 (0.588) FOX-No ID x Lib. 0.194 (0.316) FOX-No ID x Lean Lib. 0.707 (0.333)* FOX-No ID x Lean Con. 0.025 (0.362) FOX-No ID x Con. 0.391 (0.507) FOX-Right ID x Lib. 0.538 (0.495) FOX-Right ID x Lean Lib. 0.769 (0.503) FOX-Right ID x Lean Con. 0.255 (0.537) FOX-Right ID x Con. 0.529 (0.742) FOX-Wrong ID x Lib. 0.364 (0.428) FOX-Wrong ID x Lean Lib. 0.712 (0.448) FOX-Wrong ID x Lean Con. 0.781 (0.488) FOX-Wrong ID x Con. 0.691 (0.609) CNN-No ID x Lib. 0.285 (0.371) CNN-No ID x Lean Lib. 0.303 (0.385) CNN-No ID x Lean Con. -0.375 (0.423) CNN-No ID x Con. 0.141 (0.603) CNN-Right ID x Lib. 0.423 (0.436) CNN-Right ID x Lean Lib. 0.609 (0.450)
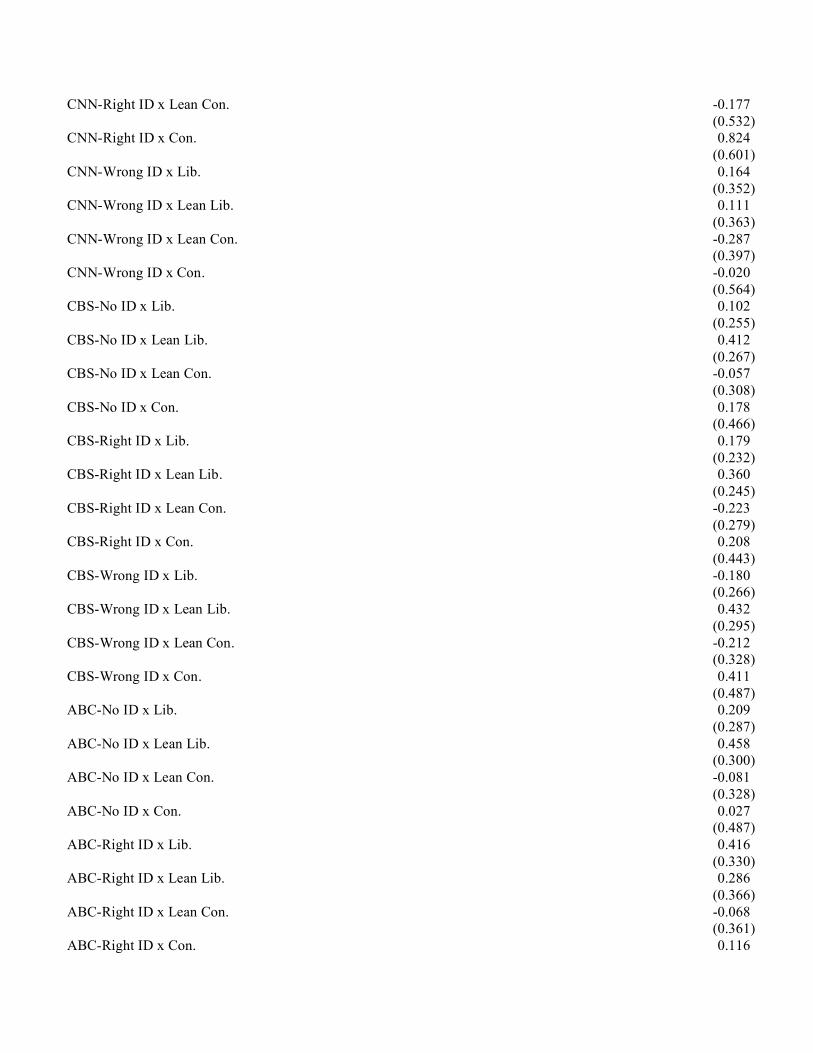
CNN-Right ID x Lean Con. -0.177 (0.532) CNN-Right ID x Con. 0.824 (0.601) CNN-Wrong ID x Lib. 0.164 (0.352) CNN-Wrong ID x Lean Lib. 0.111 (0.363) CNN-Wrong ID x Lean Con. -0.287 (0.397) CNN-Wrong ID x Con. -0.020 (0.564) CBS-No ID x Lib. 0.102 (0.255) CBS-No ID x Lean Lib. 0.412 (0.267) CBS-No ID x Lean Con. -0.057 (0.308) CBS-No ID x Con. 0.178 (0.466) CBS-Right ID x Lib. 0.179 (0.232) CBS-Right ID x Lean Lib. 0.360 (0.245) CBS-Right ID x Lean Con. -0.223 (0.279) CBS-Right ID x Con. 0.208 (0.443) CBS-Wrong ID x Lib. -0.180 (0.266) CBS-Wrong ID x Lean Lib. 0.432 (0.295) CBS-Wrong ID x Lean Con. -0.212 (0.328) CBS-Wrong ID x Con. 0.411 (0.487) ABC-No ID x Lib. 0.209 (0.287) ABC-No ID x Lean Lib. 0.458 (0.300) ABC-No ID x Lean Con. -0.081 (0.328) ABC-No ID x Con. 0.027 (0.487) ABC-Right ID x Lib. 0.416 (0.330) ABC-Right ID x Lean Lib. 0.286 (0.366) ABC-Right ID x Lean Con. -0.068 (0.361) ABC-Right ID x Con. 0.116
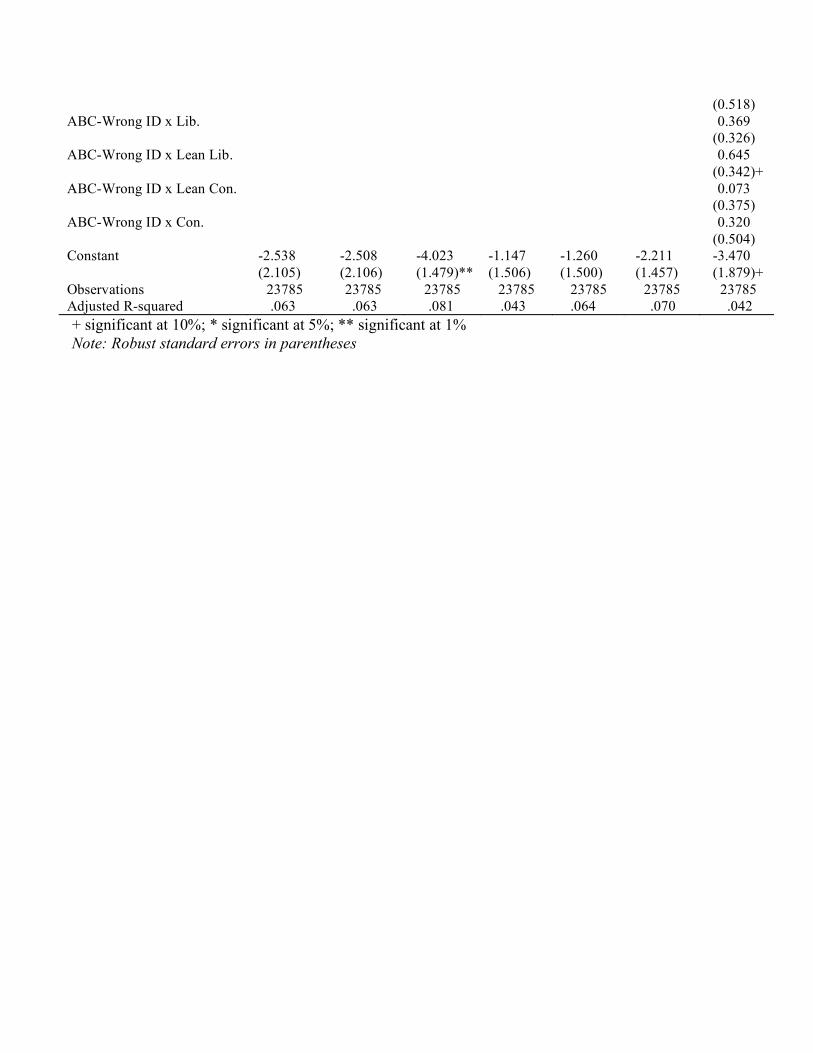
(0.518) ABC-Wrong ID x Lib. 0.369 (0.326) ABC-Wrong ID x Lean Lib. 0.645 (0.342)+ ABC-Wrong ID x Lean Con. 0.073 (0.375) ABC-Wrong ID x Con. 0.320 (0.504) Constant -2.538 -2.508 -4.023 -1.147 -1.260 -2.211 -3.470 (2.105) (2.106) (1.479)** (1.506) (1.500) (1.457) (1.879)+ Observations 23785 23785 23785 23785 23785 23785 23785 Adjusted R-squared .063 .063 .081 .043 .064 .070 .042 + significant at 10%; * significant at 5%; ** significant at 1% Note: Robust standard errors in parentheses
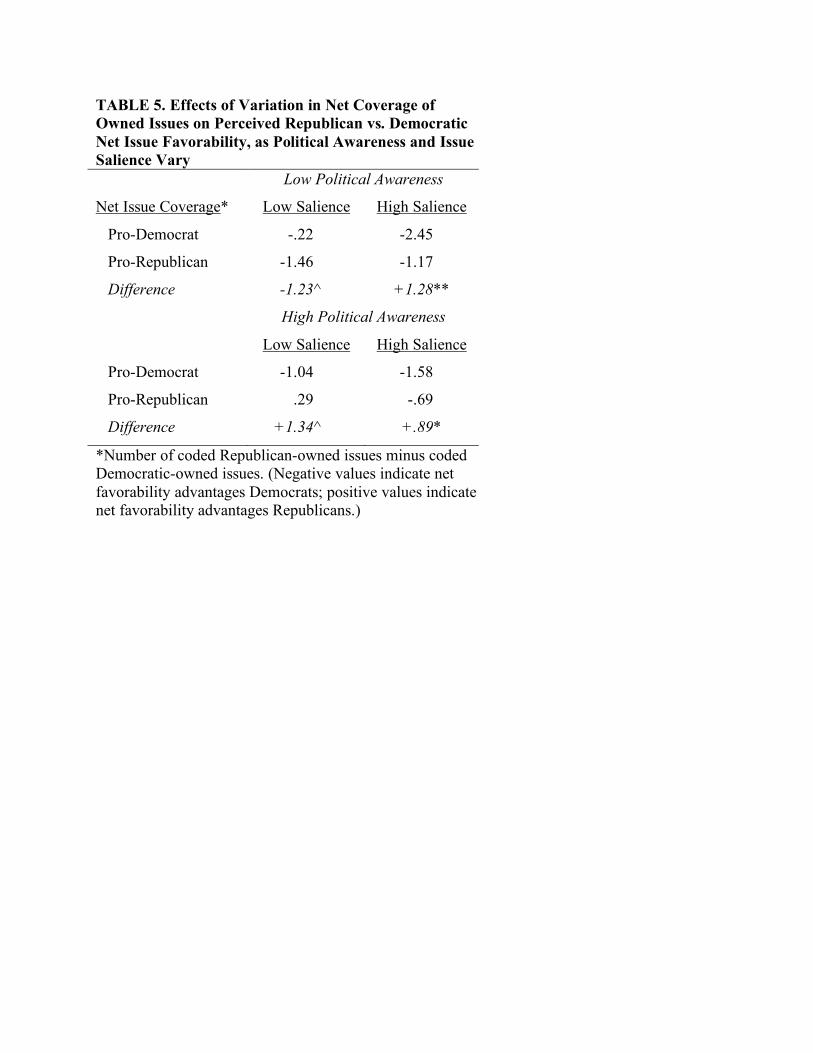
TABLE 5. Effects of Variation in Net Coverage of Owned Issues on Perceived Republican vs. Democratic Net Issue Favorability, as Political Awareness and Issue Salience Vary Low Political Awareness
Net Issue Coverage* Low Salience High Salience
Pro-Democrat -.22 -2.45
Pro-Republican -1.46 -1.17
Difference -1.23^ +1.28**
High Political Awareness
Low Salience High Salience
Pro-Democrat -1.04 -1.58
Pro-Republican .29 -.69
Difference +1.34^ +.89*
*Number of coded Republican-owned issues minus coded Democratic-owned issues. (Negative values indicate net favorability advantages Democrats; positive values indicate net favorability advantages Republicans.)
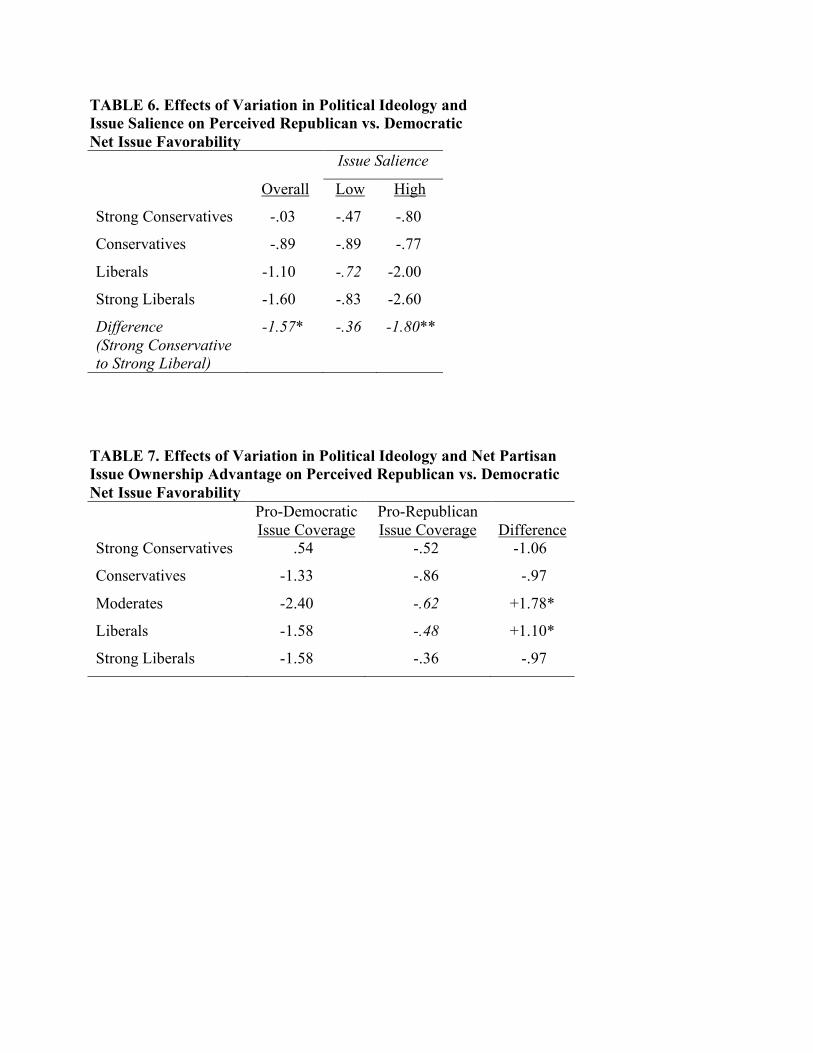
TABLE 6. Effects of Variation in Political Ideology and Issue Salience on Perceived Republican vs. Democratic Net Issue Favorability Issue Salience
Overall Low High
Strong Conservatives -.03 -.47 -.80
Conservatives -.89 -.89 -.77
Liberals -1.10 -.72 -2.00
Strong Liberals -1.60 -.83 -2.60
Difference (Strong Conservative to Strong Liberal)
-1.57* -.36 -1.80**
TABLE 7. Effects of Variation in Political Ideology and Net Partisan Issue Ownership Advantage on Perceived Republican vs. Democratic Net Issue Favorability
Pro-Democratic Issue Coverage
Pro-Republican Issue Coverage
Difference
Strong Conservatives .54 -.52 -1.06
Conservatives -1.33 -.86 -.97
Moderates -2.40 -.62 +1.78*
Liberals -1.58 -.48 +1.10*
Strong Liberals -1.58 -.36 -.97
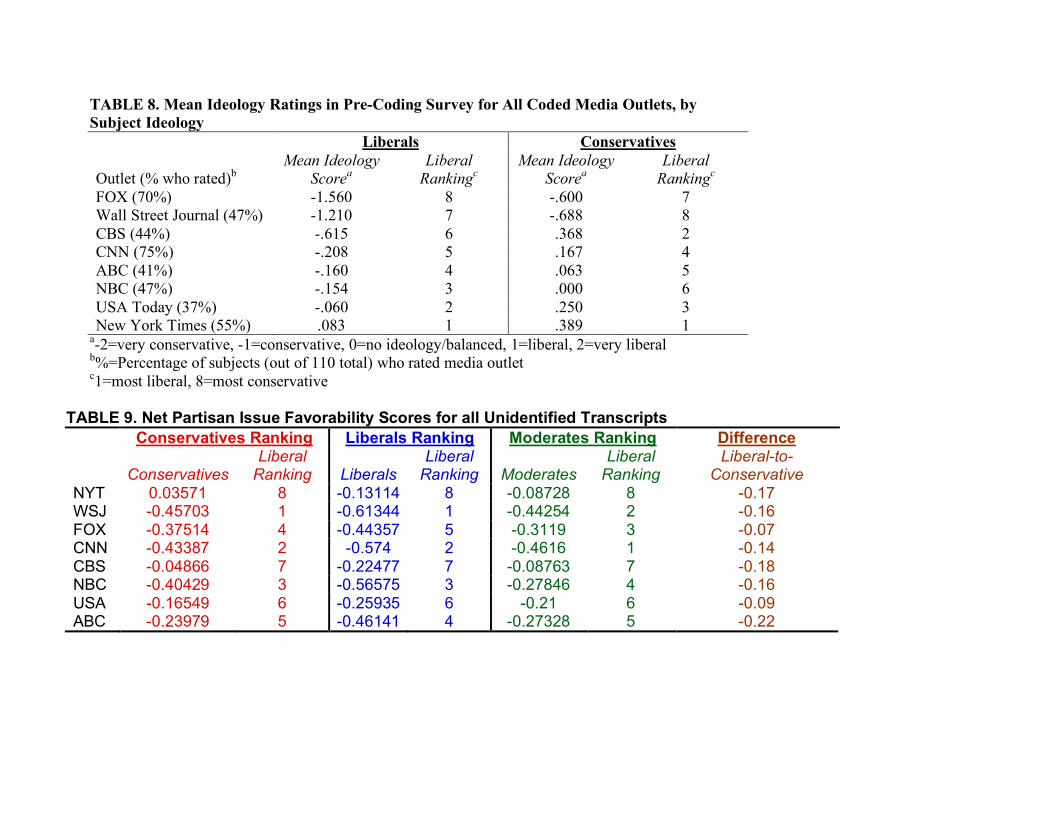
TABLE 8. Mean Ideology Ratings in Pre-Coding Survey for All Coded Media Outlets, by Subject Ideology Liberals Conservatives Outlet (% who rated)b
Mean Ideology Scorea
Liberal Rankingc
Mean Ideology Scorea
Liberal Rankingc
FOX (70%) -1.560 8 -.600 7 Wall Street Journal (47%) -1.210 7 -.688 8 CBS (44%) -.615 6 .368 2 CNN (75%) -.208 5 .167 4 ABC (41%) -.160 4 .063 5 NBC (47%) -.154 3 .000 6 USA Today (37%) -.060 2 .250 3 New York Times (55%) .083 1 .389 1
a-2=very conservative, -1=conservative, 0=no ideology/balanced, 1=liberal, 2=very liberal b%=Percentage of subjects (out of 110 total) who rated media outlet c1=most liberal, 8=most conservative
TABLE 9. Net Partisan Issue Favorability Scores for all Unidentified Transcripts Conservatives Ranking Liberals Ranking Moderates Ranking Difference
Conservatives Liberal
Ranking Liberals Liberal
Ranking Moderates Liberal
Ranking Liberal-to-
Conservative NYT 0.03571 8 -0.13114 8 -0.08728 8 -0.17 WSJ -0.45703 1 -0.61344 1 -0.44254 2 -0.16 FOX -0.37514 4 -0.44357 5 -0.3119 3 -0.07 CNN -0.43387 2 -0.574 2 -0.4616 1 -0.14 CBS -0.04866 7 -0.22477 7 -0.08763 7 -0.18 NBC -0.40429 3 -0.56575 3 -0.27846 4 -0.16 USA -0.16549 6 -0.25935 6 -0.21 6 -0.09 ABC -0.23979 5 -0.46141 4 -0.27328 5 -0.22
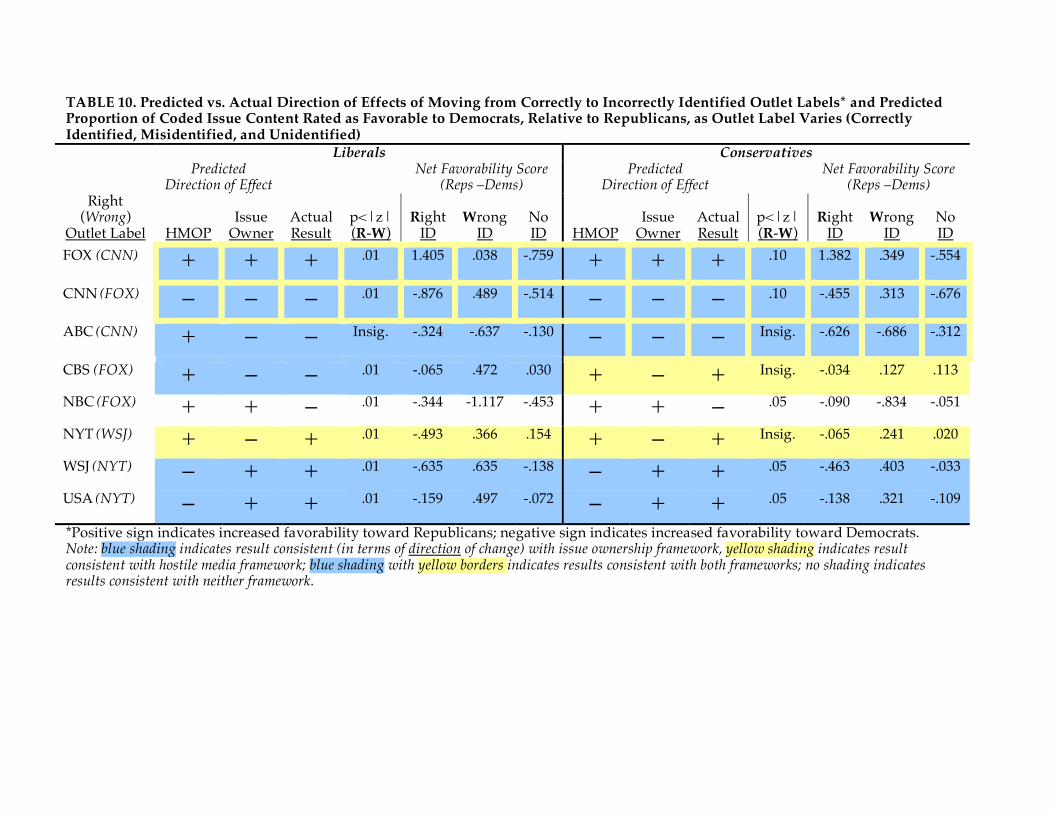
TABLE 10. Predicted vs. Actual Direction of Effects of Moving from Correctly to Incorrectly Identified Outlet Labels* and Predicted Proportion of Coded Issue Content Rated as Favorable to Democrats, Relative to Republicans, as Outlet Label Varies (Correctly Identified, Misidentified, and Unidentified) Liberals Conservatives
Predicted Direction of Effect
Net Favorability Score (Reps –Dems)
Predicted Direction of Effect
Net Favorability Score (Reps –Dems)
Right (Wrong)
Outlet Label
HMOP
Issue
Owner
Actual Result
p<|z| (R-W)
Right
ID
Wrong
ID
No ID
HMOP
Issue
Owner
Actual Result
p<|z| (R-W)
Right
ID
Wrong
ID
No ID
FOX (CNN) + + + .01 1.405 .038 -.759 + + + .10 1.382 .349 -.554
CNN (FOX) – – – .01 -.876 .489 -.514 – – – .10 -.455 .313 -.676
ABC (CNN) + – – Insig. -.324 -.637 -.130 – – – Insig. -.626 -.686 -.312
CBS (FOX) + – – .01 -.065 .472 .030 + – + Insig. -.034 .127 .113
NBC (FOX) + + – .01 -.344 -1.117 -.453 + + – .05 -.090 -.834 -.051
NYT (WSJ) + – + .01 -.493 .366 .154 + – + Insig. -.065 .241 .020
WSJ (NYT) – + + .01 -.635 .635 -.138 – + + .05 -.463 .403 -.033
USA (NYT) – + + .01 -.159 .497 -.072 – + + .05 -.138 .321 -.109
*Positive sign indicates increased favorability toward Republicans; negative sign indicates increased favorability toward Democrats. Note: blue shading indicates result consistent (in terms of direction of change) with issue ownership framework, yellow shading indicates result consistent with hostile media framework; blue shading with yellow borders indicates results consistent with both frameworks; no shading indicates results consistent with neither framework.
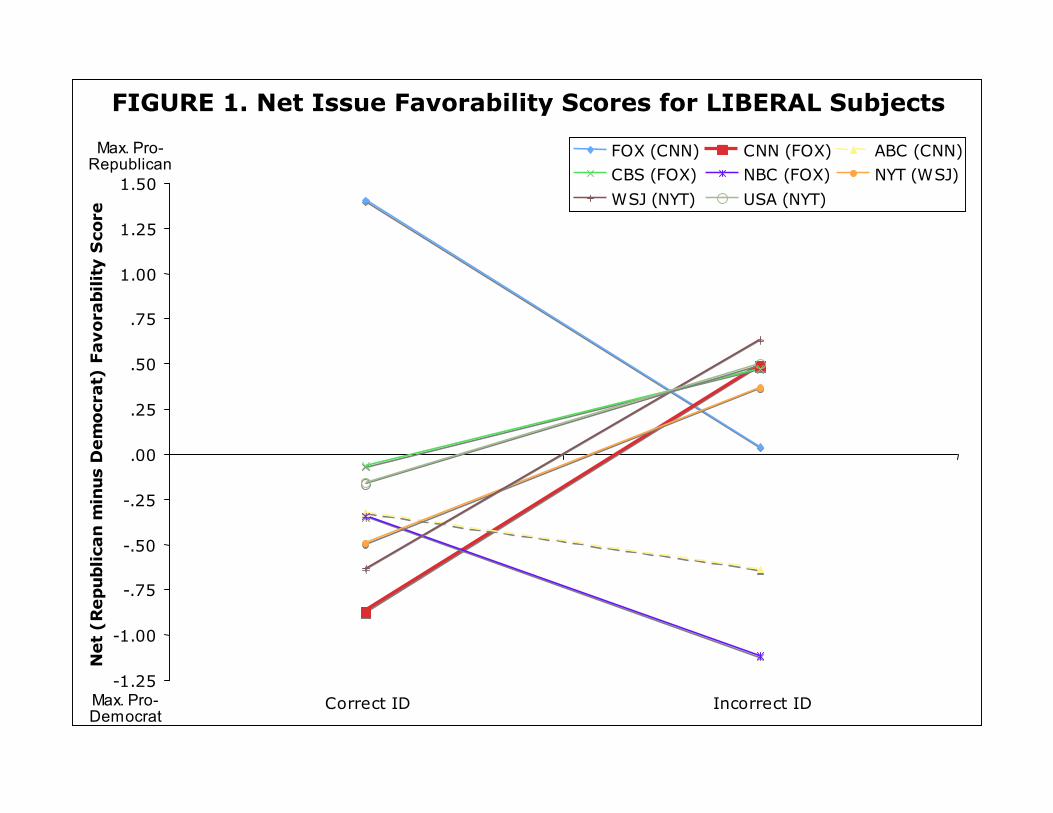
FIGURE 1. Net Issue Favorability Scores for LIBERAL Subjects
-1.25
-1.00
-.75
-.50
-.25
.00
.25
.50
.75
1.00
1.25
1.50
Correct ID Incorrect ID
Net
(Republica
n m
inus
Dem
ocr
at)
Favora
bilit
y S
core
FOX (CNN) CNN (FOX) ABC (CNN)CBS (FOX) NBC (FOX) NYT (WSJ)
WSJ (NYT) USA (NYT)
Max. Pro-Republican
Max. Pro-Democrat
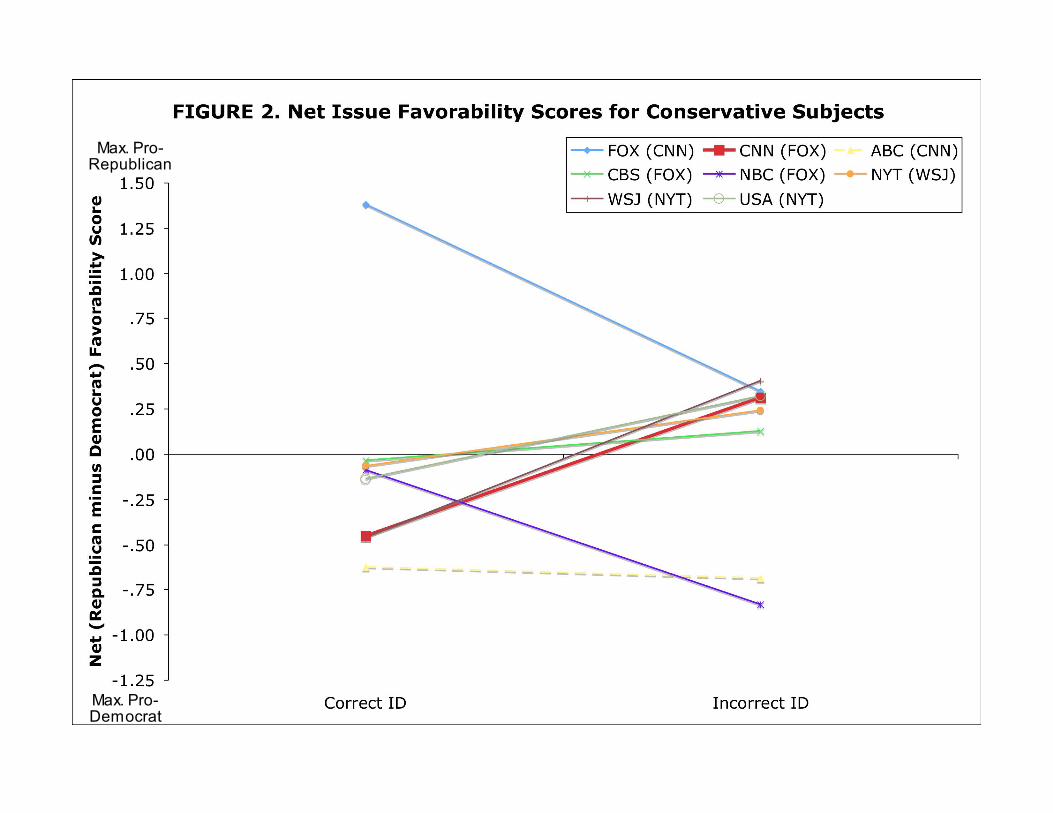
Max. Pro-Republican
Max. Pro-Democrat