ISSUE 1 Environmental Analysis and more - shimadzu.com · environmental analysis, and utilize a...
38
Shimadzu ISSUE 1 Environmental Analysis and more... 07 ISSN 2188-0484 SJ19_0071
Transcript of ISSUE 1 Environmental Analysis and more - shimadzu.com · environmental analysis, and utilize a...
Shimadzu
ISSUE 1
Environmental Analysis and more...
07
ISSN 2188-0484SJ19_0071

We are proud to announce the release of Shimadzu Journal Vol. 7, Issue 1, our first publication in 2019 and which is focused on Environmental Analysis. In recent years, we have experienced an increasing number of environmental issues, threatening both humans and non-humans as well as the earth itself. Shimadzu has provided assistance to people working on a variety of research night and day to ensure a healthy and clean ecosystem. For this issue, we showcase the environmental research of two scientists. One researcher is Dr. Alan Jamieson from Newcastle University. He discusses his main research, which is focused on the exploration of the deepest parts of the ocean, that is to say, the ‘hadal zone’, which has a depth of more than 6,000 meters, and his use of Shimadzu technologies to test samples of hadal animals. In addition to his interview, you can read his technical report about Microplastics and synthetic particles ingested by deep-sea amphipods.Another collaborator is Dr. William Lipps, Chief Science Officer, Eurofins Eaton Analytical. He discusses five new methods that his team has developed or is in the process of developing in cooperation with Shimadzu to enable quick data acquisition with more accuracy.
This issue also contains articles covering the following: polyfluorinated alkyl substances (PFAS) analysis in environmental water using ultra-fast LC-MS/MS following EPA method 537.1, and analysis of short chain chlorinated paraffins (SCCPs) with GC/GC-MS. Lastly, the issue includes regular features, such as Shimadzu Selection, Latest Topics, and New Products, many of which we hope will be of great interest to you.
At Shimadzu, we will continue striving to initiate change in order to provide the best solutions for our customers and to carve out a promising future guided by our new slogan: “Inspire Change – Best for Our Customers”. We hope that this journal serves as a bridge between us in the development of a fruitful, long-lasting relationship. Your generous feedback is always appreciated.
Yours Sincerely,
Shuzo Maruyama
General Manager, Analytical & Measurement Instruments Division
Dear Reader,
metersIn addMicropAnothAnalytthe proacquis
This isssubstafollow(SCCPsShimawill be
At Shimthe beguidedhope tfruitfuYour g
Ge
Director’s note

Environmental Analysis
CONTENTS
Insight from Customer
Interview with Dr. Alan Jamieson 04We interviewed Dr. Alan Jamieson from Newcastle University. His research is focused on the development and applica-tion of the environmental field, especially on measurement of the impact of microplastic in the ocean.
Environmental Analysis
Microplastics and synthetic particles ingested by deep-sea amphipods in six of the deepest marine ecosystems on Earth
06
Whilst there is now an established recognition of microplastic pollution in the oceans, the ocean depth at which such contamination is ingested by organisms has still not been established. Here we detect the presence of ingested microplastics in the hindguts of Lysianassoidea amphipod populations, in six deep ocean trenches. This study reports the deepest record of microplastic ingestion, indicating that anthropogenic debris is bioavailable to organisms at some of the deepest locations in the Earth’s oceans.
Environmental Analysis
Determination of short chain chlorinated paraffins (SCCPs) using comprehensive two-dimensional gas chromatography coupled with mass spectrometry
21
Chlorinated paraffins (CPs) are known as a group of synthetic chlorinated n-alkanes. They are widely used in industries related to metalworking fluids, sealants, rubbers, textiles etc. Although CP production is rising in China anually, the contribution of SCCPs among CP products is unclear. Therefore, it is necessary to clarify the SCCP concentration levels in Chinese commercial CP products. In this study, an analytical method using GCxGC coupled with mass spectrometry (GCxGC-MS) on the quantification of SCCPs was developed.
Topics 2
SSI’s Partnerships in the Medical Cannabis Industry 35Shimadzu Scientific Instruments (SSI) announced a collaborative relationship with 2 labs to support Cannabis Testing : Hocking College and EVIO Labs Florida. Since the cannabis market is expected to have significant growth in the future, it gives lab members the opportunity to train themselves with high-tech instruments widely used in the medical cannabis industry.
Topics 1
Shimadzu Europa's 50th anniversary celebration 34Shimadzu celebrated the 50th anniversary of Shimadzu Europa on September 11, 2018. Over 300 guests from all over Europe attended the event in the fully booked Mercator Hall in Duisburg, Germany. The event included music, show acts, dinner, speeches, greeting notes and a 'Walk of History'.
Environmental Analysis
How new collaborations improve environmental results 14We are collaborating with consensus standards organizations and using Shimadzu instrumentation to create new methods that will improve environmental monitoring. In the United States, environmental methods must be approved by the United States Environmental Protection Agency (USEPA) prior to use for compliance monitoring. In the United States, environmental methods must be approved by the United States Environmental Protection Agency (USEPA) prior to use for compliance monitoring.
Environmental Analysis
Ultra-fast LC-MS/MS Analysis of PFAS in Environmental Samples 23There is increasing concern about the persistence and effects of Per- and Polyfluorinated Alkyl Substances (PFAS) in the environment. This white paper summarizes the state-of-the-art analytical methods for monitoring PFAS and demonstrates the use, speed and performance of Shimadzu Ultra-fast Mass Spectrometry (UFMS™) for PFAS analysis in environmental waters.
Topics 3
DAICENTER-SHIMADZU Analytic Workshop in India 36DAICENTER (DBT-AIST International CENter for Translational and Environmental Research) and Shimadzu Analytical (India) Pvt. Ltd.(SAIP) had a joint workshop on advanced analytical technologies for research students. The purpose of the workshop is to introduce the fundamental concepts of using Analytical Instruments. Receiving favorable reviews from participants, more such workshops will be held in the future.
New Products
New Nexera UHPLC series, Shim-pack Velox LC Columns 37
Shimadzu Selection 32Shimadzu selected 14 articles for this issue. They derive from application notes and technical reports related to environmental analysis, and utilize a variety of Instruments we produce. Cutting-edge researches are also included.

Insight from Customer
4
Doctor Jamieson, thank you very much for spending some time for this interview. At first, could you outline the research and let us know what discovery and achievement have been made so far?
Interview with Dr. Alan Jamieson
We interviewed Dr. Alan Jamieson from Newcastle University. His research is focused on the development and application of the environmental field, especially on measurement of the impact of microplastic in the ocean.
My main research focus is the exploration of the deepest parts of the ocean, namely the ‘hadal zone’ which means anywhere deeper than 6000 metres. There are usually large ultra-deep trenches that until recently we knew very little about. Our main goals are to study the ecology, habitats and connectivity between different trench communities and we have been really successful in having studied nine of these deep trenches, including the deepest place on Earth. In the process we have amassed a large sample archive, particularly samples of the crustacea amphipoda (hoppers). A couple of years ago we thought it would be interesting to investigate anthropogenic impacts at the greatest ocean depths. We did a study showing extraordinary high levels of persistent organic pollutants (PCBs and PBDEs) in the deepest samples. This was shocking and gain a huge international interest in the media. During that time many people were asking if these hadal animals showed any signs of having ingested plastic, which is of course a very concerning and hot topic at the moment. Having worked with Shimadzu we established that a saddening high level of these animals from 6 of the deepest trenches in world had indeed ingested plastics and through collaboration with Shimadzu in Milton Keynes, UK, we were able to identify the materials as well.
How are Shimadzu instruments helping you in your research?
The main driver of the plastic as full ocean depth study was firstly to simple demonstrate the reach of mankinds activities and shake the
Could you tell us why you chose Shimadzu as your partner when you established this new lab?
We came in this rather naively as it wasn’t something we normally did. We were trying to use an FTIR facility within the Chemistry department to examine what materials these tiny fibers were but it became clear early on it was not the right machine for the job. The University is a long standing customer and user of Shimadzu technology and our technicians put me on to Dan Parnaby, our Shimadzu sales representative, to talk about how they could help. Dan was extremely helpful and put me in touch with Bob Keighley at the Milton Keynes facility and after long conversations about we were trying to do and what Bob wanted to do in terms of demonstrating Shimadzu capability we teamed up for this project. Also Sky News were very keen on using this research as part of their Ocean Rescue campaign and so we invited their film crew to the Shimadzu facility on the day to film us doing the research live.
perception that the deep sea is somehow exempt from what we do on land or near the surface. The idea of ‘out of sight, out of mind’ simply doesn’t work. Anything that goes into the ocean will eventually sink, when it sinks it enters the deep sea and has nowhere else to go and therefore only ever accumulate more. The second goal is assess the level in which this might affecting animals and ecosystem that we still don’t really understand. Perhaps the more concerning aspect of all this is that we have lost the window to study these ecosystems in a pristine condition, clearly they are already contaminated and it only now were are regularly studying them.

Insight from Customer
5
How are our instruments helping you?
We used the Fourier-Transform Infrared Spectrophotometer (FTIR; IR Tracer-100) connected to an automatic infrared microscope (AIM-9000) at the Shimadzu UK Ltd Laboratory Facility in Milton Keynes. Individual fibres were manually removed and transferred to the surface of FTIR reflective slides or transferred to a Specac DC3 Diamond Cell and compressed for transmission measurements. The transmission measurements provided the most reliable results. The fibre was observed using the wide field camera to identify possible locations for further investigation and the measurements were made in transmittance or reflectance mode (50 scans over approx. 20 s) using the Wide-Band MCT (mercury cadmium telluride) detector. For each fibre, three points were scanned and the results were compared to those in the Shimadzu materials library for matches or closest similarity. Some of the fibres which showed unusual structure were scanned in several places to reveal more about their chemical composition. What really impressed me was the speed in which we could work and how quickly we could get results.
What are Shimadzu’s strengths compared to other vendors (not limited to the instruments)?
Shimadzu were very keen to assist in this project and worked together for a mutually beneficial result.
Finally, could you share any requests that you have with respect to analytical and measuring instrument vendors?
It would be great to keep scientist informed of developments and applications of this type of technology, perhaps specific to a particular type of technology, e.g. an FTIR microscopy update.
It was significant to know what you think of us and our collaboration. We will strive to meet your request more than ever. Thank you very much.
Here are his recent publications:
Jamieson, A.J., Brooks, L.S.R., Reid, W.D.K., Piertney, S.B., Narayanaswamy, B.E., Linley, T.D. (In press) Microplastic and synthetic fibers ingested by deep-sea amphipods in six of the deepest marine environments on Earth. Royal Society Open ScienceRitchie, H., Jamieson A.J., Piertney, S.B. (2018) Heat-shock protein adaptation in abyssal and hadal amphipods. Deep-Sea Research II. 155 61-69.Reid, W.D.K, Cuomo, N.J. and Jamieson, A.J., (2018). Geographic and bathymetric comparisons of trace metal concentrations (Cd, Cu, Fe, Mn, and Zn) in deep-sea Lysianas-soid amphipods from abyssal and hadal depths across the Pacific Ocean. Deep Sea Research Part I, 138, 11-21.Ritchie, H., Jamieson A.J., Piertney, S.B. (2017) Genome size variation in deep-sea amphipods. Royal Society Open Science. 4, 170862Jamieson, A.J., Malkocs, T., Piertney, S.B., Fujii, T., Zhang, Z. (2017) Bioaccumulation of persistent organic pollutants in the deepest ocean fauna. Nature Ecology and Evolution. 1, 0051

6
Environmental Analysis
Microplastics and synthetic particles ingested by deep-sea amphipods in six of the deepest marine ecosystems on Earth
1Marine Sciences- School of Natural and Environmental Sciences, Newcastle University, Newcastle upon Tyne, Tyne and Wear, NE1 7RU, UK 2Institute of Biological and Environmental Sciences, University of Aberdeen, Zoology Building, Tillydrone Avenue, Aberdeen, AB24 2TZ, UK.3Scottish Association for Marine Science, Scottish Marine Institute, Oban, Argyll, PA37 1QA, UK*Corresponding Author: Jamieson, A.J. email: [email protected]
Affiliations:
Whilst there is now an established recognition of microplastic pollution in the oceans, and the detrimental effects this may have on marine animals, the ocean depth at which such contamination is ingested by organisms has still not been established. Here we detect the presence of ingested microplastics in the hindguts of Lysianassoidea amphipod populations, in six deep ocean trenches from around the Pacific Rim (Japan, Izu-Bonin, Mariana, Kermadec, New Hebrides and the Peru-Chile trenches), at depths ranging from 7000 m to 10,890 m. This illustrates that microplastic contaminants occur in the very deepest reaches of the oceans. Over 72% of individuals examined (65 of 90) contained at least one microparticle. The number of microparticles ingested per individual across all trenches ranged from 1 to 8. The mean and standard error of microparticles varied per trench, from 0.9 ± 0.4 (New Hebrides Trench) to 3.3 ± 0.7 (Mariana Trench). A subsample of microfibres and fragments analysed using FTIR were found to be a collection of plastic and synthetic materials (Nylon, polyethylene, polyamide, polyvinyl alcohol, polyvinylchloride, often with inorganic filler material), semi synthetic (rayon and lyocell) and natural fibre (ramie). Notwithstanding, this study reports the deepest record of microplastic ingestion, indicating that anthropogenic debris is bioavailable to organisms at some of the deepest locations in the Earth’s oceans.
Abstract
microplastic; hadal; trench; microfibre; marine; pollution; Hirondellea; EurythenesKeywords:
There is now an established appreciation of microplastic pollution in our oceans and the detrimental effects this has on marine organisms [1-3]. An estimated 322 million tonnes of plastic are produced annually [4], with more than 5 trillion plastic pieces weighing over 250,000 tons currently floating on the surface[5]. In 2010 alone, 4.8-12.7 million tonnes were released into the ocean and this is set to increase by an order of a magnitude by 2025[6]. As such, plastics represent arguably the clearest indicator of mankind’s detrimental impact on the oceans[7] and an obvious signature of the Anthropocene. A research priority is now to characterise the extent of microplastic and semi-synthetic fibre pollution in the oceans and the consequences this has on marine life. The investigation of microplastic ingestion by marine organisms has largely focused on shallow water habitats given the ease of sampling these locations yet we know very little about their ingestion in the deep sea[7-9]. This begs the questions of how pervasive and ubiquitous microplastic pollution is within the deep sea, and does it extend to full ocean depth?The majority of plastic present in the oceans can be observed floating on the surface[9]. The degradation and fragmentation of plastics will ultimately result in sinking to the underlying deep-sea habitats, where opportunities for dispersal become ever more limited[7,9,11]. Marine plastic litter has now been observed in numerous locations in the deep sea[12-16]. The deepest recorded plastic item was plastic bag at 10,898 m in the Marina Trench[16] while in the Ryukyu Trench off Japan at depths greater than 7000m, discarded items were found with increasing frequency towards the trench axes[17]. This reflects the ‘depocentre’ function otherwise positively associated with surface derived food supply[18].
Introduction
A.J. Jamieson1, L.S.R. Brooks1, W.D.K. Reid1, S.B. Piertney2, B.E. Narayanaswamy3 and T. D. Linley1
Microplastics, defined as being between 0.1 µm and 5mm[19], are of particular concern in marine environments because they may be similar or smaller in size to prey or particles selected for ingestion by marine organisms. Some microplastics are produced for industrial processes[20, 21] while others have originated from the break-up of larger items through UV light and physical abrasion[21,
22]. The size of microplastics makes them bioavailable, which facilitates entry into the food chain at various trophic levels and bioaccumulation[23-25]. Microplastic ingestion has been observed in a wide range of taxa including: plankton[26], bivalves[27, 28], crustaceans[29, 30], echinoderms[8, 9], fishes[31-35], elasmobranchs[36] and cetaceans[1, 37]. The extent of the adverse effects on marine biota are not fully understood despite being known to negatively affect ~700 marine species, predominantly through ingestion, decreased nutrition from intestinal blockage or decreased mobility[3]. There is also the potential for plastics to act as a vector for pollutants including persistent organic pollutants (e.g. polychlorinated biphenyls) [38, 39]. The downstream impacts at an ecosystems level on the physical and toxicological impacts of microplastic ingestion still remains unclear[39-41]. The major pathways for plastics to the oceans are diverse and range from river and estuary transport[42] to atmospheric fallout[43]. The result is microplastics are observed globally in coastal[27, 44], open ocean[45], pelagic[46], benthic[47] and deep-sea habitats[13, 48, 49]. There are only a few records of microplastics in deep-sea sediments[7, 13, 49] with the deepest point being 5768m on the upper margins of the Kuril-Kamchatka Trench[13]. Currently, the deepest recorded occurrence of microplastic ingestion by deep-sea organisms is 2200 m depth in the North Atlantic[9] with no

Environmental Analysis
7
information about whether microplastics are being ingested by abyssal or hadal organisms. This means that we still do not know whether microplastics are ingested by the organisms that live at some of the deepest points in the ocean.Given the range of transport pathways, the quantities produced and released each year, plus the estimates of the volume currently floating in the ocean, particularly in the large gyres, it is intuitive that the ultimate sink for this debris, in whatever size, is the deep sea[7]. Plastics reaching the massive expanse of the deep sea are ultimately contaminating an ecosystem we know far less about than the area from where it originates. This is especially the case in the hadal zone (6000 to 11,000 m depth[43]), which is the biozone comprised largely of deep subduction zones, topographically isolated in large elongate trenches or depressions. The organisms living in these habitats are dependent on organic matter supplied from the surface[50], which in turn brings any adverse components, such as plastic and pollutants with it. For example, Jamieson et al.[51] have reported extraordinary bioaccumulation of persistent organic pollutants (POPs) in hadal fauna from deep subduction trenches in the Pacific Ocean. The deep sea is not only the ultimate sink for any material that
descends from the surface but it also inhabited by organisms well adapted to a low food environment. Many deep-sea organisms, including amphipods, exhibit high trophic plasticity and have evolved diverse morphological and physiological adaptations to ensure feeding success at rare opportunities, therefore in the presence of relatively new foreign bodies, the likelihood of ingestion is high[52]. The objective of this study was to examine the extent of microplastic and microfiber pollution across some of the deepest points of the ocean. Specifically, this study investigated the presence of ingested microplastic fibres and fragments in the hind gut of Lysianassoid amphipods across multiple hadal trenches around the Pacific Rim. These included the Peru-Chile Trench in the Southeast Pacific, the New Hebrides and Kermadec trenches in the Southwest Pacific and the Japan, Izu-Bonin and Mariana trenches in the Northwest Pacific (Fig. 1). The latter contains the deepest point on Earth, Challenger Deep at 10,890 m. The presence of microplastics at some or all these sites would demonstrate the reach of anthropogenic activity into evermore poorly understood and remote parts of the planet.
Fig. 1 Locations of the six trenches around the Pacific rim where amphipods were sampled for microplastic ingestion. The sites include the Japan, Izu-Bonin and Mariana Trenches in the NW Pacific; The New Hebrides and Kermadec Trenches in the SW Pacific; and the Peru-Chile Trench in the SE Pacific.
8
Environmental Analysis
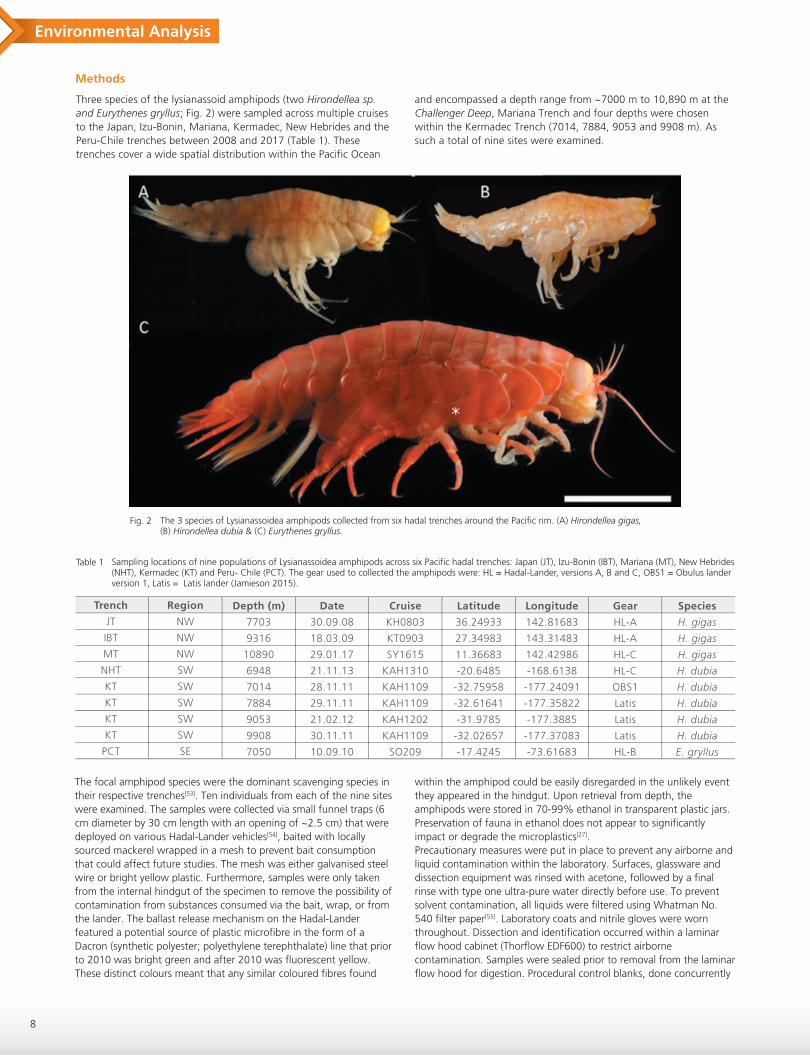
Fig. 2 The 3 species of Lysianassoidea amphipods collected from six hadal trenches around the Pacific rim. (A) Hirondellea gigas, (B) Hirondellea dubia & (C) Eurythenes gryllus.
Table 1 Sampling locations of nine populations of Lysianassoidea amphipods across six Pacific hadal trenches: Japan (JT), Izu-Bonin (IBT), Mariana (MT), New Hebrides (NHT), Kermadec (KT) and Peru- Chile (PCT). The gear used to collected the amphipods were: HL = Hadal-Lander, versions A, B and C, OBS1 = Obulus lander version 1, Latis = Latis lander (Jamieson 2015).
Three species of the lysianassoid amphipods (two Hirondellea sp. and Eurythenes gryllus; Fig. 2) were sampled across multiple cruises to the Japan, Izu-Bonin, Mariana, Kermadec, New Hebrides and the Peru-Chile trenches between 2008 and 2017 (Table 1). These trenches cover a wide spatial distribution within the Pacific Ocean
Methods
and encompassed a depth range from ~7000 m to 10,890 m at the Challenger Deep, Mariana Trench and four depths were chosen within the Kermadec Trench (7014, 7884, 9053 and 9908 m). As such a total of nine sites were examined.
Trench
JT
IBT
MT
NHT
KT
KT
KT
KT
PCT
Region
NW
NW
NW
SW
SW
SW
SW
SW
SE
Depth (m)
7703
9316
10890
6948
7014
7884
9053
9908
7050
Date
30.09.08
18.03.09
29.01.17
21.11.13
28.11.11
29.11.11
21.02.12
30.11.11
10.09.10
Cruise
KH0803
KT0903
SY1615
KAH1310
KAH1109
KAH1109
KAH1202
KAH1109
SO209
Latitude
36.24933
27.34983
11.36683
-20.6485
-32.75958
-32.61641
-31.9785
-32.02657
-17.4245
Longitude
142.81683
143.31483
142.42986
-168.6138
-177.24091
-177.35822
-177.3885
-177.37083
-73.61683
Gear
HL-A
HL-A
HL-C
HL-C
OBS1
Latis
Latis
Latis
HL-B
Species
H. gigas
H. gigas
H. gigas
H. dubia
H. dubia
H. dubia
H. dubia
H. dubia
E. gryllus
The focal amphipod species were the dominant scavenging species in their respective trenches[53]. Ten individuals from each of the nine sites were examined. The samples were collected via small funnel traps (6 cm diameter by 30 cm length with an opening of ~2.5 cm) that were deployed on various Hadal-Lander vehicles[54], baited with locally sourced mackerel wrapped in a mesh to prevent bait consumption that could affect future studies. The mesh was either galvanised steel wire or bright yellow plastic. Furthermore, samples were only taken from the internal hindgut of the specimen to remove the possibility of contamination from substances consumed via the bait, wrap, or from the lander. The ballast release mechanism on the Hadal-Lander featured a potential source of plastic microfibre in the form of a Dacron (synthetic polyester; polyethylene terephthalate) line that prior to 2010 was bright green and after 2010 was fluorescent yellow. These distinct colours meant that any similar coloured fibres found
within the amphipod could be easily disregarded in the unlikely event they appeared in the hindgut. Upon retrieval from depth, the amphipods were stored in 70-99% ethanol in transparent plastic jars. Preservation of fauna in ethanol does not appear to significantly impact or degrade the microplastics[27].Precautionary measures were put in place to prevent any airborne and liquid contamination within the laboratory. Surfaces, glassware and dissection equipment was rinsed with acetone, followed by a final rinse with type one ultra-pure water directly before use. To prevent solvent contamination, all liquids were filtered using Whatman No. 540 filter paper[55]. Laboratory coats and nitrile gloves were worn throughout. Dissection and identification occurred within a laminar flow hood cabinet (Thorflow EDF600) to restrict airborne contamination. Samples were sealed prior to removal from the laminar flow hood for digestion. Procedural control blanks, done concurrently

Environmental Analysis
9
Fig. 3 A selection of microfibre examples found within amphipod hindgut samples from 10,890m in the Mariana Trench.
with samples, showed no contamination although the fibrous filter membrane showed partly loose, clear fibres on some samples, hence clear fibres were excluded from results. We did not find any white fibres that may have been contamination from the white laboratory coat worn during sample preparation.
Fibre and fragment identification
Under laminar flow amphipods were individually dissected to remove the hindgut; defined as the body cavity posterior to Coxa 4. The hindgut weight was recorded before samples were digested, following[54], with 10% potassium hydroxide (KOH) incubated over a 48h period at 40°C within a grade C fume vent. The volume of KOH used was at least three times greater than individual gut weight[35]. KOH has been shown to be a suitable solution to dissolve the guts of marine fauna, leaving the majority of microplastics unaffected[56].After digestion samples were left to cool before being filtered through Whatman No. 541 filter paper. Filters were then transferred onto a petri dish for stereomicroscopic analysis (Nikon ocular 40x, Intralux 4000-1). The observed microparticles (those particles which had not been digested) abundance was recorded and categorised by colour and shape (e.g. Fig. 3) [57, 58]. The samples were then wrapped in muffled tin foil and transferred to a photolab where representative digital images were taken (Cannon EOS 1300D DSLR) to provide visual information on colour and differences in shape across the nine sites.
A subsample of fibres (n=15) spanning all trenches were analysed by Fourier-Transform Infra-red Spectrophotometer (FTIR; IR Tracer-100, Shimadzu, Japan) connected to an automatic infrared microscope (AIM-9000, Shimadzu, Japan) at the Shimadzu UK Ltd Laboratory Facility in Milton Keynes. Individual fibres were manually removed and transferred to the surface of FTIR reflective slides (Kevley Technologies, Ohio) (which provide a suitable background for reflectance) or transferred to a Specac DC3 Diamond Cell and compressed for transmission measurements (with background scans being taken through the diamond adjacent to the sample). The fibres presented in the results were analysed by transmission as this provided the most reliable results. The fibre was observed using the wide field camera to identify possible locations for further investigation and the measurements were made in transmittance or reflectance mode (50 scans over approx. 20 s) using the Wide-Band MCT (mercury cadmium telluride) detector. For each fibre, three points were scanned and the results were compared to those in the Shimadzu materials library for matches or closest similarity. Some of the fibres which showed unusual structure were scanned in several places to reveal more about their chemical composition.
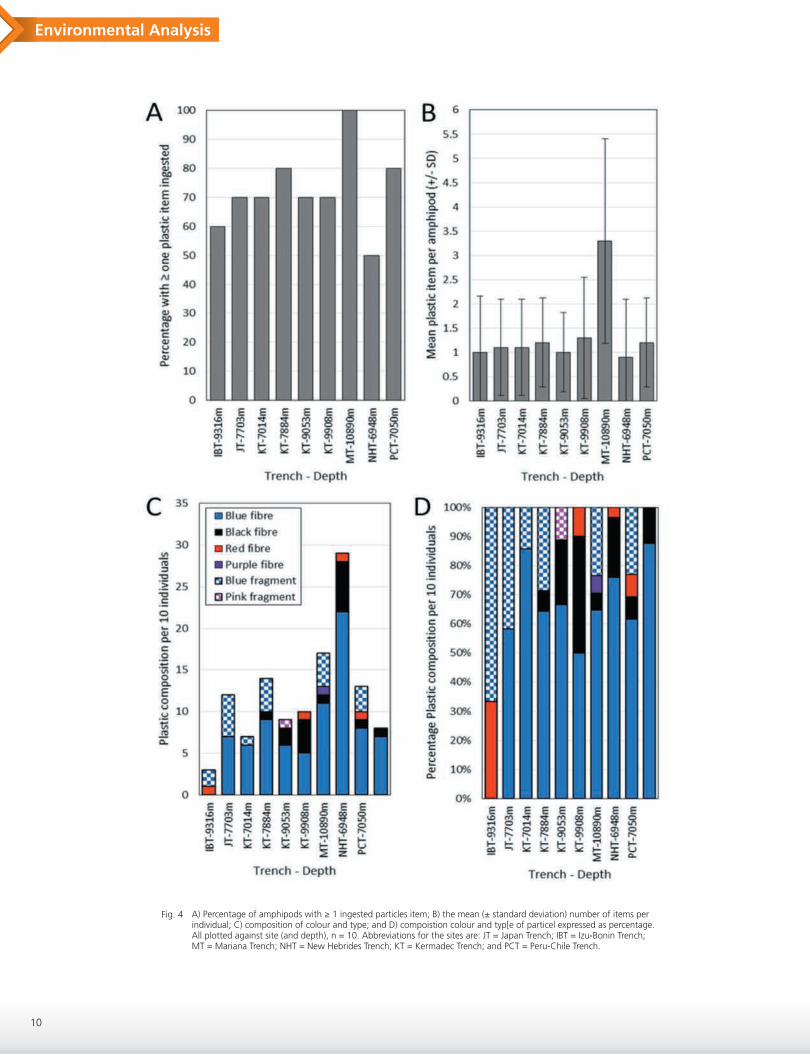
Microparticles of man-made synthetic or semi-synthetic fibres and fragments were found in the hindgut of amphipods at all nine sites (Fig. 4a). The percentage frequency of ingestion varied between 50-100% of amphipods from a given site; the lowest being the New Hebrides Trench (50%) and the highest the Mariana Trench (100%). Of the 90 individual amphipods examined, 65 individuals (~72%) contained at least one microfiber or fragment. The mean and standard error (SE) of the number of items ingested per individual of all amphipods sampled in all trenches was 1.34 ± 1.1 (range: 1 to 8 items per individual). The New Hebrides Trench amphipods contained the lowest mean number of microparticles (0.9 ± 0.4) and the Marina Trench had the highest (3.3 ± 0.7) (Fig. 4b). There was no relationship between the number of microparticles and depth in the Kermadec Trench amphipods (Kruskal Wallis χ2 = 0.23, df = 3, p = 0.97).A total of 122 ingested microparticles were identified and were categorised into fibres and fragments (Fig. 4c). Fibres were found within every trench and appeared in 84% of amphipods whereas the occurrence of fragments was lower and appeared in only 16% of amphipods. No fragments were found in the New Hebrides Trench amphipods. Using a crude colour-based categorisation the most prevalent items ingested were blue fibres (66%) with all amphipods sampled from the Marina Trench containing at least one of these. The next most prevalent items ingested were blue fragments (16%) followed by black fibres (13%), red fibres (4%), pink fragments (<1%) and purple fibres (<1%). However, the FTIR analysis revealed that these fibre and fragment groupings did not correspond to a single material type but rather a variety of materials (Table 2). Six of the 15 items analysed using FTIR were semi-synthetic cellulosic fibres, rayon and lyocell, the natural fibre ramie that are used in products such as textiles. The rest included synthetic polymers such as Nylon, polyethylene (PE), polyamide (PA), or unidentified polyvinyls closely resembling polyvinyl alcohol (PVAL) or polyvinylchloride (PVC) and with most including an inorganic filler material. One fibre found in the Peru-Chile Trench at 7050m was clearly a polyethylene coated strand of polyester. None of the 15 subsamples were found to be naturally occurring.
Results
10
Environmental Analysis
Fig. 4 A) Percentage of amphipods with ≥ 1 ingested particles item; B) the mean (± standard deviation) number of items per individual; C) composition of colour and type; and D) compoistion colour and typ[e of particel expressed as percentage. All plotted against site (and depth), n = 10. Abbreviations for the sites are: JT = Japan Trench; IBT = Izu-Bonin Trench; MT = Mariana Trench; NHT = New Hebrides Trench; KT = Kermadec Trench; and PCT = Peru-Chile Trench.

Environmental Analysis
11
Table 2 Results of the FTIR analysis on fiber material across six Pacific hadal trenches: Japan (JT), Izu-Bonin (IBT), Mariana (MT), New Hebrides (NHT), Kermadec (KT) and Peru- Chile (PCT).
Trench
JT
IBT
IBT
MT
MT
MT
NHT
NHT
KT
KT
KT
KT
KT
PCT
PCT
Depth(m)
7703
9316
9316
10890
10890
10890
6948
6948
7014
9908
7884
9908
9053
7050
7050
Material
Lyocell
Polyester reinforced cotton; Rayon
Polyethylene
Low density polyethylene film with inorganic filler
Ramie
Ramie
Unidentified polyvinyl
Polyamide with inorganic filler
Lyocell
Unidentified plastic
Unidentified plastic, but very close to PVAL or PVC with inorganic filler
Ramie
Nylon 12
Polyester core with Polyethylene coating
Polyethylene with inorganic filler
Description
Blue fibre
Twisted blue fibre
Degraded fibre, red
Dark/black fibre
Blue fibre
Blue fibre
Dark/blue fibre
Dark/black fibre
Black fibre
Black fibre
Dark/blue fragment
Blue fibre
Black/dark fibre
Black fibre
Black fibre
The salient finding of this study is that man-made microfibers and fragments, including microplastics, were found in the hindguts of amphipods from six of the deepest parts of the Earth's oceans, including within the deepest area of the Mariana Trench, at Challenger Deep. Plastic has been present at hadal depths for the last couple of decades[16] but, as far as we are aware, this is the first record of microplastics being ingested by hadal organisms. Therefore, microplastics are bioavailable in the hadal zone and ingested by one of the most important and dominant scavenging fauna in the deep sea at a similar frequency (72%) to crustaceans in coastal water habitats[29, 30]. Previous studies have found microplastics ingested by deep-sea invertebrates down to 2200 m in the North Atlantic[9], 611 m in the equatorial mid-Atlantic[8] and 1062 m in southwest Indian Ocean[8]. The species ingesting microplastics include: the echinoderms Ophiomusium lymani, Hymenaster pellucidus (North Atlantic) [9] and an unknown species of holothurian (southwest Indian Ocean) [8]; a crustacean (unknown hermit crab) from the southwest Indian Ocean[8]; and a mollusc (Colus jeffreysianus) from the North Atlantic [9]. As with the amphipods in this study, these species are all deposit feeders or are predatory[8, 9]. It is not clear whether these trophic guilds are more susceptible to microplastic ingestion in the deep sea than filter feeders[8] or whether there are toxicological implications as microplastics breakdown[38]. This can only be tested with a wider range of species from different trophic guilds with accompanying microplastic concentrations from sediments and water column. The six trenches are bathymetrically and geographically isolated by large distances. The distance between the Japan Trench, in the northern hemisphere, and the Kermadec Trench, in the southern hemisphere, is approximately 8640 km, and between the Peru-Chile Trench in the Southeast Pacific and the trenches in the northwest Pacific is over 15,000 km. The distances highlight the geographical extent in the distribution of microplastics and synthetic particles that are ingested at full ocean depths. It is difficult to ascertain why the amphipods have different numbers of microparticles in their hindguts among these six trenches. The mechanisms transporting microplastics and synthetic fibres to the deep sea are likely to be similar at all the locations. These include sinking of large plastics (>5 mm) from the surface waters and subsequent fragmentation at depth[7, 13, 16, 49]; direct sinking of microplastic that are not adhered to other particles; sinking of microplastics in association with marine snow[19, 49]; and the downward transport of large and microplastics in
Discussion
the stomachs of vertically migrating pelagic organisms and marine carrion[32, 46]. The temporal mismatch among sampling the trenches is a confounding factor when explaining why there are differences in observed numbers of microparticles in the amphipod stomachs. The differences may be related to the duration of time that plastics have accumulated in the area rather than whether areas accumulate more plastic in the surface or deep water and if there are regional differences in the mechanisms that transport plastics to the deep sea. However, given our sampling occurred from 2008 onwards, it indicates that microplastics were ingested by amphipods for at least the past decade, providing an important baseline to monitor subsequent change.
The crude colour-based categorisation is consistent with findings in surface waters where fibres dominate and account for a high proportion of microplastics[59]. The source and mechanism by which these microplastics are released into the marine environment is varied and includes airborne transport, terrestrial sources, e.g. synthetic fibres from washing clothes which enters the marine environment through sewage[60-63], direct release of fibres through maritime activities, e.g. fishing[22] and fragmentation of larger plastic debris. Blue fibres were the most prevalent microparticles ingested in the Pacific hadal amphipods which is consistent with other studies[45,
59]. Furthermore, in Pacific subsurface water black, red and purple fibres[59] are also prevalent; all of these colours were found ingested in Pacific hadal amphipods in this study. However, it is clear from the FTIR analysis and previous works that the colour-based categorisation is not an adequate method to identify whether a microparticle is indeed of plastic origin[64]. The range of plastic found in the hindguts of the amphipods included PE, PA, and polyvinyls resembling PVAL or PVC but we also found other synthetic polymers that are not plastics (e.g. ramie, lyocell). PE, PA and polyester have all been identified in the guts of other deep-sea organisms albeit at much shallower depths[8, 9].The presence of microplastics in the hindgut of amphipods indicates the possibility of trophic transfer to higher trophic levels within the hadal environment. Trophic transfer of microplastics are known from other marine organisms including from Mytilus edulis to Carcinus maenas[23] and between mesozooplankton to higher level macrozooplankton[24]. These studies were conducted under experimental conditions using high concentrations of microplastics but their results indicate the possibility of microplastics transferring
12
Environmental Analysis
among individuals[23, 24]. Amphipods are known prey for larger hadal taxa such as decapods[65], other predatory amphipods[66] and fish such as liparids and ophidiids[67-69]. Once the microplastics enter the hadal food chain there is a strong possibility that they will be locked into a perpetual cycle of trophic transfer. This is because amphipods scavenge on marine carrion which includes those fish and decapods from surface waters as well as those living at a similar depths that potentially are also their predators[69,70]. At depths >8000m, amphipods consume a combination of surface derived marine detritus and carrion, and other species of amphipod[52], which again suggests the likelihood of inevitable trophic cycling of microplastics at these depths. The extent to which deep-sea amphipods can disperse microplastics across the seafloor is currently unclear. This is because their digestion and defecation rates are currently unknown.
The results of this study demonstrate that man-made fibres including microplastics are ingested by Lysianassoid amphipods at the deepest location of all the Earth’s oceans. Microplastic ingestion occurred in all trenches, indicating they are bioavailable within hadal environments. We hypothesise that the physical impacts known in shallower ecosystems as a result of microplastic ingestion[4], are likely to occur within hadal populations. Plastics are being ingested, culminating and bioavailable in an ecosystem inhabited by species we poorly understand, cannot observe experimentally and have failed to obtain baseline data for prior to contamination. This study reports the deepest record of microplastic ingestion, indicating it is highly likely there are no marine ecosystems left that are not impacted by plastic pollution.
Conclusion
We thank the captain, crew and company of the research expeditions who assisted in the collection of the amphipods between 2008 and 2017, namely the Japanese Hakuho-Maru, Tansei Maru, and Shinyo-Maru, the German Sonne and the RV Kaharoa in New Zealand. The lab work was supported by The School of Marine Science and Technology at Newcastle University, where we thank David Whitaker and Peter McParlin for their assistance. We are extremely grateful to Bob Keighley and Dan Parnaby at Shimadzu UK Limited for facilitating the FTIR analysis and access to their material database. We also thank Heather Stewart from the British Geological Survey for supplying the distances between trenches.
Acknowledgements:
1 Lusher, A. L., Hernandez-Milian, G., O'Brien, J., Berrow, S., O'Connor, I., Officer, R. 2015 Microplastic and macroplastic ingestion by a deep diving, oceanic cetacean: The True's beaked whale Mesoplodon mirus. Environ. Pollut. 199, 185-191. 2 GESAMP 2015 “Sources, fate and effects of microplastics in the marine environment: a global assessment” (Kershaw, P. J., ed.). (IMO/FAO/UNESCO-IOC/UNIDO/WMO/IAEA/UN/UNEP/UNDP Joint Group of Experts on the Scientific Aspects of Marine Environmental Protection). Rep. Stud. GESAMP No. 90.3 GESAMP 2016 “Sources, fate and effects of microplastics in the marine environment: part two of a global assessment” (Kershaw, P.J., and Rochman, C.M., eds). (IMO/FAO/UNESCO-IOC/UNIDO/WMO/IAEA/UN/UNEP/UNDP Joint Group of Experts on the Scientific Aspects of Marine Environmental Protection). Rep. Stud. GESAMP No. 93. 4 Plastics – the Facts 2017: An analysis of European plastics production, demand and waste data. (https://www.plasticseurope.org/en/resources/publications/274-plastics-facts-2017)5 Eriksen, M., Lebreton, L. C. M., Carson, H. S., Thiel, M., Moore, C. J., Borerro, J. C., Galgani, F., Ryan, P. G., Reisser, J. 2014 Plastic Pollution in the World's Oceans: More than 5 Trillion Plastic Pieces Weighing over 250,000 Tons Afloat at Sea. PLoS One. 9, 15. (10.1371/journal.pone.0111913)6 Jambeck, J. R., Geyer, R., Wilcox, C., Siegler, T. R., Perryman, M., Andrady, A., Narayan, R., Law, K. L. 2015 Plastic waste inputs from land into the ocean.
References
Science. 347, 768-771. 7 Woodall, L. C., Sanchez-Vidal, A., Canals, M., Paterson, G. L. J., Coppock, R., Sleight, V., Calafat, A., Rogers, A. D., Narayanaswamy, B. E., Thompson, R. C. 2014 The deep sea is a major sink for microplastic debris. R. Soc. Open Sci. 1, 8. (10.1098/rsos.140317)8 Taylor, M. L., Gwinnett, C., Robinson, L. F., Woodall, L. C. 2016 Plastic microfibre ingestion by deep-sea organisms. Sci. Rep. 6, 33997. (10.1038/srep33997)9 Courtene-Jones, W., Quinn, B., Gary, S. F., Mogg, A. O. M., Narayanaswamy, B. E. 2017 Microplastic pollution identified in deep-sea water and ingested by benthic invertebrates in the Rockall Trough, North Atlantic Ocean. Environ. Pollut. 231, 271-280. (10.1016/j.envpol.2017.08.026)10 Cózar, A., Echevarría, F., González-Gordillo, J. I., Irigoien, X., Úbeda, B., Hernández-León, S., Palma, Á. T., Navarro, S., García-de-Lomas, J., Ruiz, A. 2014 Plastic debris in the open ocean. Proc. Natl. Acad. Sci. U. S. A. 111, 10239-10244. 11 Barnes, D. K. A., Galgani, F., Thompson, R. C., Barlaz, M. 2009 Accumulation and fragmentation of plastic debris in global environments. Philos. Trans. R. Soc. B-Biol. Sci. 364, 1985-1998. 12 Tekman, M. B., Krumpen, T., Bergmann, M. 2017 Marine litter on deep Arctic seafloor continues to increase and spreads to the North at the HAUSGARTEN observatory. Deep-Sea Res. Part I-Oceanogr. Res. Pap. 120, 88-99. 13 Fischer, V., Elsner, N. O., Brenke, N., Schwabe, E., Brandt, A. 2015 Plastic pollution of the Kuril–Kamchatka Trench area (NW pacific). Deep-Sea Res. Part II-Top. Stud. Oceanogr. 111, 399-405. 14 Galgani, F., Leaute, J. P., Moguedet, P., Souplet, A., Verin, Y., Carpentier, A., Goraguer, H., Latrouite, D., Andral, B., Cadiou, Y., et al. 2000 Litter on the Sea Floor Along European Coasts. Marine Pollution Bulletin. 40, 516-527. (https://doi.org/10.1016/S0025-326X(99)00234-9)15 Schlining, K., von Thun, S., Kuhnz, L., Schlining, B., Lundsten, L., Jacobsen Stout, N., Chaney, L., Connor, J. 2013 Debris in the deep: Using a 22-year video annotation database to survey marine litter in Monterey Canyon, central California, USA. Deep Sea Research Part I: Oceanographic Research Papers. 79, 96-105. (https://doi.org/10.1016/j.dsr.2013.05.006)16 Chiba, S., Saito, H., Fletcher, R., Yogi, T., Kayo, M., Miyagi, S., Ogido, M., Fujikura, K. 2018 Human footprint in the abyss: 30 year records of deep-sea plastic debris. Marine Policy. (https://doi.org/10.1016/j.marpol.2018.03.022)17 Shimanaga, M., Yanagi, K. 2016 The Ryukyu Trench may function as a "depocenter" for anthropogenic marine litter. J. Oceanogr. 72, 895-903. (10.1007/s10872-016-0388-7)18 Danovaro, R., Della Croce, N., Dell'Anno, A., Pusceddu, A. 2003 A depocenter of organic matter at 7800 m depth in the SE Pacific Ocean. Deep-Sea Res. Part I-Oceanogr. Res. Pap. 50, 1411-1420. (10.1016/j.dsr.2003.07.001)19 Galloway, T. S., Cole, M., Lewis, C. 2017 Interactions of microplastic debris throughout the marine ecosystem. Nature Ecology & Evolution. 1, 8. (10.1038/s41559-017-0116)20 Fendall, L. S., Sewell, M. A. 2009 Contributing to marine pollution by washing your face: microplastics in facial cleansers. Mar. Pollut. Bull. 58, 1225-1228. 21 Moore, C. J. 2008 Synthetic polymers in the marine environment: a rapidly increasing, long-term threat. Environ. Res. 108, 131-139. 22 Welden, N. A., Cowie, P. R. 2017 Degradation of common polymer ropes in a sublittoral marine environment. Mar. Pollut. Bull. 118, 248-253. (10.1016/j.marpolbul.2017.02.072)23 Farrell, P., Nelson, K. 2013 Trophic level transfer of microplastic: Mytilus edulis (L.) to Carcinus maenas (L.). Environ. Pollut. 177, 1-3. (10.1016/j.envpol.2013.01.046)24 Setälä, O., Fleming-Lehtinen, V., Lehtiniemi, M. 2014 Ingestion and transfer of microplastics in the planktonic food web. Environ. Pollut. 185, 77-83. 25 Tosetto, L., Williamson, J. E., Brown, C. 2017 Trophic transfer of microplastics does not affect fish personality. Anim. Behav. 123, 159-167. 26 Cole, M., Lindeque, P., Fileman, E., Halsband, C., Goodhead, R., Moger, J., Galloway, T. S. 2013 Microplastic ingestion by zooplankton. Environ. Sci. Technol. 47, 6646-6655. 27 Courtene-Jones, W., Quinn, B., Murphy, F., Gary, S. F., Narayanaswamy, B. E. 2017 Optimisation of enzymatic digestion and validation of specimen preservation methods for the analysis of ingested microplastics. Anal. Methods. 9, 1437-1445. (10.1039/C6AY02343F)28 De Witte, B., Devriese, L., Bekaert, K., Hoffman, S., Vandermeersch, G., Cooreman, K., Robbens, J. 2014 Quality assessment of the blue mussel (Mytilus edulis): Comparison between commercial and wild types. Marine Pollution Bulletin. 85, 146-155. (https://doi.org/10.1016/j.marpolbul.2014.06.006)29 Devriese, L. I., van der Meulen, M. D., Maes, T., Bekaert, K., Paul-Pont, I.,

Environmental Analysis
13
Frère, L., Robbens, J., Vethaak, A. D. 2015 Microplastic contamination in brown shrimp (Crangon crangon, Linnaeus 1758) from coastal waters of the Southern North Sea and Channel area. Mar. Pollut. Bull. 98, 179-187. (https://doi.org/10.1016/j.marpolbul.2015.06.051)30 Murray, F., Cowie, P. R. 2011 Plastic contamination in the decapod crustacean Nephrops norvegicus (Linnaeus, 1758). Mar. Pollut. Bull. 62, 1207-1217. 31 Pellini, G., Gomiero, A., Fortibuoni, T., Ferrà, C., Grati, F., Tassetti, A. N., Polidori, P., Fabi, G., Scarcella, G. 2018 Characterization of microplastic litter in the gastrointestinal tract of Solea solea from the Adriatic Sea. Environmental Pollution. 234, 943-952. (https://doi.org/10.1016/j.envpol.2017.12.038)32 Lusher, A. L., O'Donnell, C., Officer, R., O'Connor, I. 2016 Microplastic interactions with North Atlantic mesopelagic fish. ICES J. Mar. Sci. 73, 1214-1225. (10.1093/icesjms/fsv241)33 Ory, N., Chagnon, C., Felix, F., Fernandez, C., Ferreira, J. L., Gallardo, C., Ordonez, O. G., Henostroza, A., Laaz, E., Mizraji, R., et al. 2018 Low prevalence of microplastic contamination in planktivorous fish species from the southeast Pacific Ocean. Marine Pollution Bulletin. 127, 211-216. (10.1016/j.marpolbul.2017.12.016)34 Bellas, J., Martinez-Armental, J., Martinez-Camara, A., Besada, V., Martinez-Gomez, C. 2016 Ingestion of microplastics by demersal fish from the Spanish Atlantic and Mediterranean coasts. Marine Pollution Bulletin. 109, 55-60. (10.1016/j.marpolbul.2016.06.026)35 Foekema, E. M., De Gruijter, C., Mergia, M. T., van Franeker, J. A., Murk, A. J., Koelmans, A. A. 2013 Plastic in north sea fish. Environ. Sci. Technol. 47, 8818-8824. 36 Alomar, C., Deudero, S. 2017 Evidence of microplastic ingestion in the shark Galeus melastomus Rafinesque, 1810 in the continental shelf off the western Mediterranean Sea. Environ. Pollut. 223, 223-229. 37 Besseling, E., Foekema, E. M., Van Franeker, J. A., Leopold, M. F., Kühn, S., Rebolledo, E. L. B., Heße, E., Mielke, L., Ijzer, J., Kamminga, P. 2015 Microplastic in a macro filter feeder: humpback whale Megaptera novaeangliae. Mar. Pollut. Bull. 95, 248-252. 38 Engler, R. E. 2012 The Complex Interaction between Marine Debris and Toxic Chemicals in the Ocean. Environmental Science & Technology. 46, 12302-12315. (10.1021/es3027105)39 Koelmans, A. A. 2015 Modeling the Role of Microplastics in Bioaccumulation of Organic Chemicals to Marine Aquatic Organisms. A Critical Review. In Marine Anthropogenic Litter. (ed.^eds. M. Bergmann, L. Gutow, M. Klages), pp. 309-324. Cham: Springer International Publishing.40 Clark, J. R., Cole, M., Lindeque, P. K., Fileman, E., Blackford, J., Lewis, C., Lenton, T. M., Galloway, T. S. 2016 Marine microplastic debris: a targeted plan for understanding and quantifying interactions with marine life. Front. Ecol. Environ. 14, 317-324. 41 Bakir, A., O'Connor, I. A., Rowland, S. J., Hendriks, A. J., Thompson, R. C. 2016 Relative importance of microplastics as a pathway for the transfer of hydrophobic organic chemicals to marine life. Environmental Pollution. 219, 56-65. (https://doi.org/10.1016/j.envpol.2016.09.046)42 Rech, S., Macaya-Caquilpán, V., Pantoja, J. F., Rivadeneira, M. M., Jofre Madariaga, D., Thiel, M. 2014 Rivers as a source of marine litter – A study from the SE Pacific. Mar. Pollut. Bull. 82, 66-75. (https://doi.org/10.1016/j.marpolbul.2014.03.019)43 Dris, R., Gasperi, J., Saad, M., Mirande, C., Tassin, B. 2016 Synthetic fibers in atmospheric fallout: A source of microplastics in the environment? Mar. Pollut. Bull. 104, 290-293. (https://doi.org/10.1016/j.marpolbul.2016.01.006)44 Tsang, Y. Y., Mak, C. W., Liebich, C., Lam, S. W., Sze, E. T., Chan, K. M. 2017 Microplastic pollution in the marine waters and sediments of Hong Kong. Mar. Pollut. Bull. 115, 20-28. 45 La Daana, K. K., Officer, R., Lyashevska, O., Thompson, R. C., O'Connor, I. 2017 Microplastic abundance, distribution and composition along a latitudinal gradient in the Atlantic Ocean. Mar. Pollut. Bull. 115, 307-314. 46 Choy, C. A., Drazen, J. C. 2013 Plastic for dinner? Observations of frequent debris ingestion by pelagic predatory fishes from the central North Pacific. Mar. Ecol.-Prog. Ser. 485, 155-163. (10.3354/meps10342)47 Thompson, R. C., Olsen, Y., Mitchell, R. P., Davis, A., Rowland, S. J., John, A. W. G., McGonigle, D., Russell, A. E. 2004 Lost at sea: where is all the plastic? Science. 304, 838-838. 48 Cordova, M. R., A'an, J. W. 2016 Microplastic in the deep-sea sediment of Southwestern Sumatran Waters. Marine Research in Indonesia. 41, 27-35. (10.14203/mri.v41i1.99)49 Van Cauwenberghe, L., Vanreusel, A., Mees, J., Janssen, C. R. 2013 Microplastic pollution in deep-sea sediments. Environ. Pollut. 182, 495-499. (10.1016/j.envpol.2013.08.013)50 Ichino, M. C., Clark, M. R., Drazen, J. C., Jamieson, A., Jones, D. O. B., Martin, A. P., Rowden, A. A., Shank, T. M., Yancey, P. H., Ruhl, H. A. 2015 The distribution of benthic biomass in hadal trenches: A modelling approach to
investigate the effect of vertical and lateral organic matter transport to the seafloor. Deep-Sea Res. Part I-Oceanogr. Res. Pap. 100, 21-33. (https://doi.org/10.1016/j.dsr.2015.01.010)51 Jamieson, A. J., Malkocs, T., Piertney, S. B., Fujii, T., Zhang, Z. 2017 Bioaccumulation of persistent organic pollutants in the deepest ocean fauna. Nat. Ecol. Evol. 1, 0051. (10.1038/s41559-016-0051)52 Blankenship, L. E., Levin, L. A. 2007 Extreme food webs: Foraging strategies and diets of scavenging amphipods from the ocean’s deepest 5 kilometers. Limnol. Oceanogr. 52, 1685-1697. (10.4319/lo.2007.52.4.1685)53 Lacey, N. C., Rowden, A. A., Clark, M. R., Kilgallen, N. M., Linley, T., Mayor, D. J., Jamieson, A. J. 2016 Community structure and diversity of scavenging amphipods from bathyal to hadal depths in three South Pacific Trenches. Deep-Sea Res. Part I-Oceanogr. Res. Pap. 111, 121-137. (https://doi.org/10.1016/j.dsr.2016.02.014)54 Jamieson, A. J. 2015 The Hadal Zone: Life in deepest oceans. Cambridge: Cambridge University Press.55 Karami, A., Golieskardi, A., Choo, C. K., Romano, N., Ho, Y. B., Salamatinia, B. 2017 A high-performance protocol for extraction of microplastics in fish. Sci. Total Environ. 578, 485-494. 56 Kühn, S., van Werven, B., van Oyen, A., Meijboom, A., Bravo Rebolledo, E. L., van Franeker, J. A. 2017 The use of potassium hydroxide (KOH) solution as a suitable approach to isolate plastics ingested by marine organisms. Marine Pollution Bulletin. 115, 86-90. (https://doi.org/10.1016/j.marpolbul.2016.11.034)57 Nadal, M. A., Alomar, C., Deudero, S. 2016 High levels of microplastic ingestion by the semipelagic fish bogue Boops boops (L.) around the Balearic Islands. Environ. Pollut. 214, 517-523. 58 Peters, C. A., Bratton, S. P. 2016 Urbanization is a major influence on microplastic ingestion by sunfish in the Brazos River Basin, Central Texas, USA. Environ. Pollut. 210, 380-387. 59 Desforges, J.-P. W., Galbraith, M., Dangerfield, N., Ross, P. S. 2014 Widespread distribution of microplastics in subsurface seawater in the NE Pacific Ocean. Mar. Pollut. Bull. 79, 94-99. (10.1016/j.marpolbul.2013.12.035)60 Hartline, N. L., Bruce, N. J., Karba, S. N., Ruff, E. O., Sonar, S. U., Holden, P. A. 2016 Microfiber masses recovered from conventional machine washing of new or aged garments. Environ. Sci. Technol. 50, 11532-11538. 61 Pirc, U., Vidmar, M., Mozer, A., Krzan, A. 2016 Emissions of microplastic fibers from microfiber fleece during domestic washing. Environ. Sci. Pollut. Res. 23, 22206-22211. (10.1007/s11356-016-7703-0)62 Browne, M. A., Crump, P., Niven, S. J., Teuten, E., Tonkin, A., Galloway, T., Thompson, R. 2011 Accumulation of microplastic on shorelines worldwide: sources and sinks. Environ. Sci. Technol. 45, 9175-9179. (10.1021/es201811s)63 Gusmão, F., Di Domenico, M., Amaral, A. C. Z., Martínez, A., Gonzalez, B. C., Worsaae, K., do Sul, J. A. I., da Cunha Lana, P. 2016 In situ ingestion of microfibres by meiofauna from sandy beaches. Environ. Pollut. 216, 584-590. 64 Gago, J., Galgani, F., Maes, T., Thompson, R. C. 2016 Microplastics in Seawater: Recommendations from the Marine Strategy Framework Directive Implementation Process. Frontiers in Marine Science. 3, (10.3389/fmars.2016.00219)65 Jamieson, A. J., Fujii, T., Solan, M., Matsumoto, A. K., Bagley, P. M., Priede, I. G. 2009 First findings of decapod crustacea in the hadal zone. Deep-Sea Res. Part I-Oceanogr. Res. Pap. 56, 641-647. (https://doi.org/10.1016/j.dsr.2008.11.003)66 Jamieson, A. J., Lörz, A.-N., Fujii, T., Priede, I. G. 2011 In situ observations of trophic behaviour and locomotion of Princaxelia amphipods (Crustacea: Pardaliscidae) at hadal depths in four West Pacific Trenches. J. Mar. Biol. Assoc. U.K. 92, 143-150. (10.1017/S0025315411000452)67 Fujii, T., Jamieson, A. J., Solan, M., Bagley, P. M., Priede, I. G. 2010 A Large Aggregation of Liparids at 7703 meters and a Reappraisal of the Abundance and Diversity of Hadal Fish. BioScience. 60, 506-515. (10.1525/bio.2010.60.7.6)68 Jamieson, A. J., Fujii, T., Solan, M., Matsumoto, A. K., Bagley, P. M., Priede, I. G. 2009 Liparid and macrourid fishes of the hadal zone: in situ observations of activity and feeding behaviour. Proc. R. Soc. B-Biol. Sci. 276, 1037-1045. (10.1098/rspb.2008.1670)69 Linley, T. D., Stewart, A. L., McMillan, P. J., Clark, M. R., Gerringer, M. E., Drazen, J. C., Fujii, T., Jamieson, A. J. 2017 Bait attending fishes of the abyssal zone and hadal boundary: Community structure, functional groups and species distribution in the Kermadec, New Hebrides and Mariana trenches. Deep-Sea Res. Part I-Oceanogr. Res. Pap. 121, 38-53. (https://doi.org/10.1016/j.dsr.2016.12.009)70 Gerringer, M. E., Popp, B. N., Linley, T. D., Jamieson, A. J., Drazen, J. C. 2017 Comparative feeding ecology of abyssal and hadal fishes through stomach content and amino acid isotope analysis. Deep-Sea Res. Part I-Oceanogr. Res. Pap. 121, 110-120. (10.1016/j.dsr.2017.01.003)

Environmental Analysis
14
How new collaborations improve environmental results
William Lipps, Chief Science Officer, Eurofins Eaton Analytical
We are collaborating with consensus standards organizations and using Shimadzu instrumentation to create new methods that will improve environmental monitoring by enabling users to get data faster, and more accurately. In the United States, environmental methods must be approved by the United States Environmental Protection Agency (USEPA) prior to use for compliance monitoring. The USEPA has several pathways for the generation of new methods:
Private companies, such as Shimadzu, have only options 1 and 2 above available to them. Option 2, the ATP process, is only applicable to existing regulated parameters. This procedure compares data from an existing method to a new, or modified, method to determine if the results are essentially the same. If so, the EPA issues a letter and may later approve the method through the regulatory process. Option 3, using a VCSB such as ASTM International or Standard Methods for the Examination of Water and Wastewater, is the only way a private company, such as Shimadzu, can get a new method, for new unregulated parameters or using a new technique, approved by EPA. Important to note, just because an ASTM standard or Standard Methods method is developed does not mean EPA will approve it. However, EPA only approves methods, not techniques, for water testing; if you want a new technique approved, you must first have a method. In addition, we believe that once a new consensus method is developed it has improved environmental monitoring globally, regardless of whether the USEPA eventually approves it.In this article, we discuss several new methods we have developed or are developing in collaboration with Shimadzu and validating through consensus organizations.
1) EPA writes their own method2) A company writes a new method through the Alternative Test Procedure (ATP) Process3) Use a voluntary consensus standard body (VCSB) method
This method was written by this author and is already published and approved by the USEPA for wastewater reporting, however, it did not contain ASTM required multiple-laboratory validation data. Shimadzu undertook the necessary steps to ensure the method was validated and not removed from the books by ASTM. In addition, we collaborated with Standard Methods since this ASTM Standard is essentially the same as Standard Method 5310B. There are essentially two objectives one can take when carrying out an inter-laboratory study: (1) to compare the performances of participating laboratories; and (2) quantitatively evaluate the reproducibility of the analytical process.2 When conducting these studies at ASTM and Standard Methods the intent is always to determine the reproducibility of the method (number 2) and not evaluate performance between labs. Reproducibility is a measure of how well a method performs with different operators, different reagents, different instruments, at different locations. Since TOC by combustion – IR is already in use globally, we did not require laboratories initially qualify. Instead, we sent samples to every laboratory that volunteered. The entire ASTM D19 on water and the Standard Methods part 5000 members were sent invitations to participate. Of these, we only received about 10 responses, for a total of eight labs that finally participated. These labs included four municipalities, two commercial testing labs, and two instrument vendors. The laboratories used combustion-IR TOC analyzers, such
ASTM D7573 Standard Test Method for Total Carbon and Organic Carbon in Water by High Temperature Catalytic Combustion and Infrared Detection1
as the Shimadzu TOC-L pictured in Fig. 1.There were a total of seven matrices tested, four of which were prepared as Youden pairs3 making a total of twelve samples to be analyzed at each laboratory. In addition, each of these unknowns was prepared as blind duplicates for a total of 24 vials sent as unknown to each laboratory. (See table 1). The matrices varied in total dissolved solids (TDS) from reagent water to seawater. In addition, the Total Organic Carbon (TOC) source material was varied by matrix. Humic acids were added to the surface water and seawater. Primary standards4 ammonium, p-toluene sulfonate, glycine p-toluene sulfonate and nicotinic acid p-toluene sulfonate were added to groundwater, synthetic surface water, and synthetic wastewater, respectively. These primary standards were used in a previous total nitrogen study (see ASTM D80835 below) and repeated in this study so that users could prepare known matrices if they so chose. Humic acids were obtained from the International Humic Substances Society6.
Table 1 Matrices used for TOC ILS
Fig. 1 TOC-L
A finished tap water was spiked with KHP along with a high and low concentration in reagent water. These high and low concentrations were included to evaluate the performance of the method at the calibration extremities without any potential matrix effects. The results of the Youden pair samples, statistically evaluated in accordance with ASTM D27777, are shown in Table 2. Unfortunately, matrices 6 & 7 concentrations were too low for use as Youden pairs, or were accidentally spiked at similar concentrations. These matrices were processed according to ASTM E6918 with the non Youden pairs shown in Table 3.

Environmental Analysis
15
ASTM D8083-16 Standard Test Method for Total Nitrogen, and Total Kjeldahl Nitrogen (TKN) by Calculation, in Water by High Temperature Catalytic Combustion and Chemiluminescence Detection9 was written by this author and is already published but not yet approved by the USEPA for wastewater reporting. Shimadzu undertook the necessary steps to create the method in an effort to provide EPA with at least one method in the event EPA decides to propose Total Nitrogen as a new parameter at 40 CFR Part 136.3 Table 1b10. We have written much about this method, available in the Shimadzu Scientific Instruments white paper, Introducing a new ASTM Method for the Determination of Total Nitrogen, and TKN by Calculation in Water Samples11.
In addition, to provide EPA with another alternative method, as Part coordinator and an editor of Standard Methods, the author collaborated with Standard Methods for the Examination of Water and Wastewater Part 4000 Inorganic Anions to create a new method, Standard methods 4500-N E. This inter-laboratory validated method is currently written but not yet published because, at the time of this writing, it is still in the balloting stage. Both of these new methods measure total nitrogen using TOC analyzers configured with a total nitrogen module, such as the TOC-L with TNM shown in Fig. 2.
Total Nitrogen Methods at both ASTM and Standard Methods
In the United States, laboratories are required to use 40 CFR Part 136 EPA approved methods for compliance under the Clean Water Act (CWA). Certain industry categories are required to monitor for pesticides and PCBs. EPA Method 608.312, specifies a gas chromatograph with a halogen specific detector (usually an electron capture detector) for pesticides. Method 625.113, Base/Neutrals by gas chromatography mass spectrometry (GCMS), is also allowed; however, only in full scan or Selected Ion Monitoring (SIM) mode, which is not sensitive enough to reach the low detection limits required for compliance with most NPDES14 permits. We are developing a new method, using the Shimadzu GCMS-TQ8040 (Fig. 3), to measure the Method 608 pesticides and PCBs, taking advantage of the increased sensitivity of triple quadrupole mass spectrometry (MS/MS). This new method, still under development, is ASTM Work Item WK54549 New Test Method for Determination of Pesticides, PCBs, and Polychlorinated Biphenyl Congeners in Aqueous Solution by Tandem GCMSMS15. The method is summarized in Shimadzu Application News No. GCMS-1601 Determination of Organochlorine Pesticides and Polychlorinated Biphenyls Using GC/MS/MS Operated in the MRM Mode15.
In this application note, the Shimadzu Scientific Instruments (SSI) Solution Center compared the performance of two instruments - single quad and triple quad GCMS - for semi-volatiles analysis. Many people had voiced concern with the triple quadrupole instrument not meeting the same performance as a single quadrupole; however, SSI demonstrated equal, if not better, performance with the triple quad GCMS-TQ8040 than the single quad GCMS-QP2020 in semi-volatiles analysis. One of the concerns is the DFTPP mass tuning requirement of most full scan EPA GCMS methods. DFTPP was originally proposed in 1975 as a reference compound to verify the performance of a GCMS system prior to running any laboratory samples. Since 1975, other compounds, such as DDT/Endrin and pentachlorophenol, have been added to the DFTPP standard mix to demonstrate passing DDT/Endrin breakdown and tailing. Fig. 3 shows passing DFTPP spectra on both instruments.
Pesticides and PCBs by GCMSMS
Fig. 2 TOC-L with TNM
Overall, the precision and bias of the method was as expected. The low concentration of 0.5 mg/L in reagent water shows a high bias. Generally, single and multiple laboratory percent relative standard deviation (RSD) increases as concentration decreases.
Table 2 Youden Pair Data for TOC as NPOC
Table 4 Standard Methods Inter-laboratory Precision for Total NitrogenTable 3 Statistical Summary for non-Youden pair data as NPOC
Matrix
Number of useable values
True concentration (mg/L)
Mean Recovery (mg/L)
% Recovery
Overall Standard Deviation, St
Overall Relative Standard Deviation (%)
Single Operator Standard Deviation So
Single Operator Relative Standard Deviation (%)
5
14
5.39
5.67
105
0.777
13.71
0.549
9.68
6
12
N/A
1.61
N/A
0.265
16.48
0.243
15.47
7
12
N/A
1.68
N/A
0.350
20.99
0.329
19.75
8
14
21.0
21.9
104
2.53
11.54
1.156
5.27
9
12
N/A
3.63
N/A
0.374
10.28
0.317
8.71
12
12
0.501
0.808
161
0.162
20.02
0.150
18.59
Matrix
Groundwater
Wastewater Influent
Wastewater Effluent
Surface water (saline)
Surface water (fresh)
Average result (mg/L N)
2.18
4.03
4.97
0.400
0.910
% RSD
6.0
6.5
6.2
11.3
8.6
To validate Standard Methods 4500-N E, five different sources of water were obtained and distributed to six analysts across four labs. The five sources were: wastewater effluent, wastewater influent, fresh surface water, saline surface water and ground water. The nitrogen concentration of the samples was distributed across the linear curve of the proposed TN method. Four of the laboratories analyzed a known reference material at 13.5 mg/L total nitrogen. The average bias was -3.0%. Inter-laboratory precision for each matrix is shown in Table 4.
Fig. 3 DFTPP spectra on the GCMS-QP2020 and the GCMS-TQ8040
Matrix
Number of useable values
True Concentration (mg/L)
Mean Recovery (mg/L)
Percent Recovery
Overall Standard Deviation
Overall Relative Standard Deviation (%)
Single Operator Standard Deviation
Single Operator Relative Standard Deviation (%)
1
6
3.88
0.34
8.78
0.372
9.59
2
6
3.31
0.56
16.2
3
6
8.29
1.19
14.2
0.59
7.12
4
6
9.63
1.36
14.0
10
7
50.1
49.8
99.4
4.28
8.60
1.32
2.65
12
7
40.1
40.2
100
3.18
7.90

Environmental Analysis
16
GCMS methods for environmental monitoring were introduced into the US by the USEPA in 1976 as a proposal to rapidly screen for organic priority pollutants17. In screening for semi-volatile compounds, the GC methods require a preliminary extraction into an organic solvent. Later methods, such as EPA method 525.2, replaced liquid-liquid extraction (LLE) with Solid Phase Extraction (SPE). SPE lowered solvent use, but still burdens laboratories with preliminary extractions. Table 6 lists USEPA liquid chromatography with tandem mass spectrometry (LC-MS/MS) methods that require SPE extraction.
Shimadzu has published numerous application notes showing the benefits of LC-MS/MS and its ability to analyze low concentrations of various pollutants without preliminary SPE. These pollutants include microcystins, pharmaceutical and personal care products (PPCP), per and polyfluorinated alkyl substances (PFAS), and pesticides and herbicides.
SSI is collaborating with ASTM to develop and validate LC-MS/MS methods that eliminate, or minimize extraction in favor of direct injection. In particular, we are leading the industry in new methods for the analysis of PFAS, including ASTM D7979 Standard Test Method for Determination of Per- and Polyfluoroalkyl Substances in Water, Sludge, Influent, Effluent and Wastewater by Liquid Chromatography Tandem Mass Spectrometry (LC/MS/MS)18 , and D7968 Standard Test Method for Determination of Polyfluorinated Compounds in Soil by Liquid Chromatography Tandem Mass Spectrometry (LC/MS/MS)19.
PFAS are a group of chemicals of growing concern because of their worldwide occurrence in groundwater supplies. Both ASTM methods are external standard calibrations. Instead of SPE, ASTM D7979 collects small volumes of sample and adds methanol directly into the sample vial eliminating loss of sample to the container walls. The small sample volume saves on shipping costs. Results are equal to, or better than, solid phase extraction and are available in a fraction of the time (Fig. 6). Fig. 7 is a schematic of the extraction process of ASTM D7979.
New technology simplifies analytical methods
Fig. 5 Estimating aroclor identity and concentration by GC/MS/MS
Fig. 4 MDL comparison of semi-volatiles between the GCMS-QP2020 and the GCMS-TQ8040 in full scan mode
In this new ASTM method for pesticides and PCBs, laboratories are able to extract their samples just as they would for method 625.1 and analyze for 625.1 either using a GCMS-TQ8040 in single quadrupole mode, or using a single quadrupole instrument such as the GCMS-QP2020. This new ASTM method will save laboratories time and effort by eliminating an entire extraction, solvent exchange, and analytical run on the GC-ECD. Instead, laboratories will be able to extract Method 625 as they normally would, and run semi-volatiles and pesticides and PCBs with that single extraction.
In developing the method, we had no difficulty with single component compounds, however, multiple component analytes, such as aroclors (PCBs) were a challenge. SSI Solution Center personnel developed an algorithm to qualitatively identify the best estimate for the aroclors' identity and calculate their concentration. This approach is summarized in the flow chart in Fig. 5
Determination of Selected Perfluorinated Alkyl Acids in Drinking Water by Solid Phase Extraction and Liquid Chromatography/Tandem Mass Spectrometry (LC/MS/MS)
Determination of Selected Organic Chemicals in Drinking Water by Direct Aqueous Injection-Liquid Chromatography/Tandem Mass Spectrometry (DAI-LC/MS/MS)
Determination of Hormones in Drinking Water by Solid Phase Extraction (SPE) and Liquid Chromatography Electrospray Ionization Tandem Mass Spectrometry (LC-ESI-MS/MS)
Determination of Selected Organic Chemicals in Drinking Water by Solid Phase Extraction and Liquid Chromatography/Tandem Mass Spectrometry (LC/MS/MS)
Determination of Microcystins and Nodularin in Drinking Water by Solid Phase Extraction and Liquid Chromatography/Tandem Mass Spectrometry (LC/MS/MS)
Determination of Cylindrospermopsin and Anatoxin-a in Drinking Water by Liquid Chromatography Electrospray Ionization Tandem Mass Spectrometry (LC/ESI-MS/MS)
Using the approach in Fig. 4, preliminary single laboratory data extracted and correctly identified Aroclor-1232 at the concentrations and recovery shown in Table 5.
Data acquisition with wide window
Integrate whole peaks as one peak
Build calibrations with one compound for each
chlorobiphenyl(mono to nona)
Calculate reference concentration ratios of all Aroclors® using standard solutions(These ratios can be used permanently)
Calculate concertation of each chlorobiphenyl (mono to nona)
Calculate concentration ratio of each chlorobiphenyl (mono to nona)
Identify Aroclors® referring to concentration ratio from standards
Summation of all chlorobiphenyls is concentration of Aroclors®
Table 5 Recovery of Aroclor -1232 in select matrices and concentrations
Aroclor-1232Effluent Water
Spiked 0.01 µg/L
128.1
139.3
PCB Set 1
PCB Set 2
Spiked 0.1 µg/L
105.0
112.7
Spiked 0.01 µg/L
102.4
101.8
Spiked 0.1 µg/L
107.6
115.3
River Water
Table 6 EPA LC-MS/MS Methods
EPA method Title
537
538
539
540
544
545
Extract Evaporate Analyze a batch by EPA 537
Analyze a batch by ASTMD7979
Analyze a batch by ASTMD7979
Fig. 6 Comparison of analysis time between SPE methods and ASTM D7979 for PFAS

Environmental Analysis
17
SSI provided a secondary validation of ASTM D797920. During the course of our method ruggedness study, we discovered a few details that needed clarification. First, as shown in Fig. 8, the 50:50 methanol
Fig. 7 Schematic of the ASTM D7979 extraction
Fig. 8 Recovery of PFAS in different methanol concentrations
water ratios cannot be changed. If the ratio is lowered, loss of analyte occurs. If the ratio is higher, the sample is diluted.
10%
30%
50%
0.00%20.00%40.00%60.00%80.00%100.00%120.00%140.00%160.00%180.00%200.00%
0.0 100.0 200.0 300.0 400.0
PFBAPFPeAPFHxAPFBSPFHpAPFOAPFHxSPFNAPFDAPFOSPFUnAPFDoAPFTriAPFTreA
0.00%
20.00%
40.00%
60.00%
80.00%
100.00%
120.00%
140.00%
0.0 100.0 200.0 300.0 400.0
PFBAPFPeAPFHxAPFBSPFHpAPFOAPFHxSPFNAPFDAPFOSPFUnAPFDoAPFTriAPFTreA
0.00%
20.00%
40.00%
60.00%
80.00%
100.00%
120.00%
140.00%
0.0 100.0 200.0 300.0 400.0
PFBAPFPeAPFHxAPFBSPFHpAPFOAPFHxSPFNAPFDAPFOSPFUnAPFDoAPFTriAPFTreA

Environmental Analysis
18
In addition, we noticed that as standards sat in the vials, loss of analyte occurred. We determined that the loss was not evaporation or precipitation, but that the higher molecular weight compounds tend to either float up, or cling to the sides of the vial. Fig. 9 shows two chromatograms that demonstrate simply mixing the standard vial returns the standards to their original response.
EPA and the International Standards Organization (ISO) have each recently completed an updated method, EPA 537.1 and ISO 21675, both requiring SPE prior to LC-MS/MS. Table 7 compares these three PFAS methods.
Fig. 9 Chromatograms of Standards before and after mixing
Before Vortex Same Vial After Vortex
Fig. 10 MRL data for EPA Method 537 and ASTM D7979
Table 7 Comparison of three PFAS methods
EPA 537.1 is an internal standard calibration method, ISO 21675 is an isotope dilution calibration method, and ASTM D7979 is an external standard calibration method. We were able to use the data from our D7979 study to compare results to the EPA and ISO methods. Fig. 10 compares the Minimum Reportable Level (MRL) of EPA Method 537, and ASTM D7979 using data collected at SSI on the LCMS-8050 and
LCMS-8045, respectively. There is no MRL data published in the ISO method. EPA method 537 extracts 250 milliliters of sample by SPE and concentrates it to 1 ml for a concentration factor of 250. ASTM D7979 mixes 5 ml of sample, and standards with 5 ml of methanol, essentially diluting the sample by a factor of 2. The similarity of MRL demonstrates the high sensitivity of the LCMS-8050.
Environmental Analysis
19
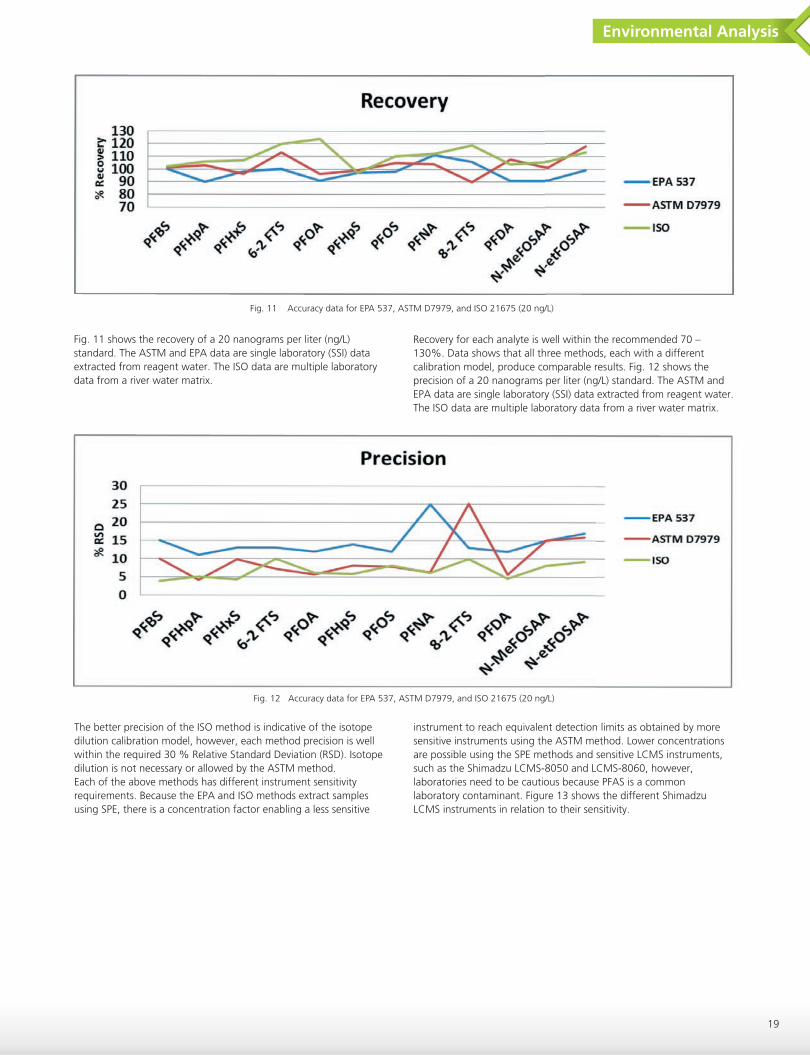
Fig. 11 shows the recovery of a 20 nanograms per liter (ng/L) standard. The ASTM and EPA data are single laboratory (SSI) data extracted from reagent water. The ISO data are multiple laboratory data from a river water matrix.
Recovery for each analyte is well within the recommended 70 – 130%. Data shows that all three methods, each with a different calibration model, produce comparable results. Fig. 12 shows the precision of a 20 nanograms per liter (ng/L) standard. The ASTM and EPA data are single laboratory (SSI) data extracted from reagent water. The ISO data are multiple laboratory data from a river water matrix.
Fig. 11 Accuracy data for EPA 537, ASTM D7979, and ISO 21675 (20 ng/L)
Fig. 12 Accuracy data for EPA 537, ASTM D7979, and ISO 21675 (20 ng/L)
The better precision of the ISO method is indicative of the isotope dilution calibration model, however, each method precision is well within the required 30 % Relative Standard Deviation (RSD). Isotope dilution is not necessary or allowed by the ASTM method. Each of the above methods has different instrument sensitivity requirements. Because the EPA and ISO methods extract samples using SPE, there is a concentration factor enabling a less sensitive
instrument to reach equivalent detection limits as obtained by more sensitive instruments using the ASTM method. Lower concentrations are possible using the SPE methods and sensitive LCMS instruments, such as the Shimadzu LCMS-8050 and LCMS-8060, however, laboratories need to be cautious because PFAS is a common laboratory contaminant. Figure 13 shows the different Shimadzu LCMS instruments in relation to their sensitivity.

Environmental Analysis
20
This article discussed five new methods we have developed or are developing in collaboration with Shimadzu and validating through consensus organizations. The first method, a TOC by combustion-IR, has been recently inter-laboratory validated and published as ASTM D7573-18a. The second method, ASTM D8083-16, validated and published, and the third method, Standard Methods 4500-N E, validated and in balloting, are new methods for total nitrogen. The fourth method, ASTM WK54549 for pesticides and PCBs, is currently being developed. The last method, ASTM D7979, has been published, but only as a single laboratory study. (The USEPA has validated this method as SW846 Method 8327. SSI was one of the labs chosen by EPA to participate in the inter-laboratory trial.) Though TOC has been in use for years, no previous EPA approved method contained inter-laboratory data to demonstrate the between laboratory
Conclusion
Fig. 13 Shimadzu LCMS instruments
1 ASTM D7573-18, Standard Test Method for Total Carbon and Organic Carbon in Water by High Temperature Catalytic Combustion and Infrared Detection, ASTM International, West Conshohocken, PA, 2018, www.astm.org
2 Wenimont, G.T. Use of Statistics to Develop and Evaluate Analytical Methods, AOAC International, 1985 p 87
3 Youden, W.J, Statistical Techniques for Collaborative Tests, Statistical manual of the Association of Official Analytical Chemists, 1979
4 https://www.hach.com/nitrogen-primary-standard-set-of-3/product?id=7640202618, accessed January 14, 2019
5 ASTM D8083-16, Standard Test Method for Total Nitrogen, and Total Kjeldahl Nitrogen (TKN) by Calculation, in Water by High Temperature Catalytic Combustion and Chemiluminescence Detection, ASTM International, West Conshohocken, PA, 2016, www.astm.org
6 https://humic-substances.org/, accessed January 14, 20197 ASTM D2777-13, Standard Practice for Determination of Precision and Bias of Applicable Test Methods of Committee D19 on Water, ASTM International, West Conshohocken, PA, 2013, www.astm.org
8 ASTM E691-18, Standard Practice for Conducting an Interlaboratory Study to Determine the Precision of a Test Method, ASTM International, West Conshohocken, PA, 2018, www.astm.org
9 ASTM D8083-16, Standard Test Method for Total Nitrogen, and Total Kjeldahl Nitrogen (TKN) by Calculation, in Water by High Temperature Catalytic Combustion and Chemiluminescence Detection, ASTM International, West Conshohocken, PA, 2016, www.astm.org
performance of the method on real, and complex, matrices. Total Nitrogen by combustion - chemiluminescence, a technique used worldwide, has not existed in the US as a written method, preventing the USEPA’s ability to approve it. Similarly, although many laboratories use GC-MS/MS for trace pesticide analysis, without a method the technique cannot be approved for CWA reporting. SSI provided a secondary confirmation, and a significant portion of the method ruggedness testing, of the ASTM D7979 PFAS method. In addition, we compared results of ASTM D7979 to the EPA method and draft ISO method. This collaboration between Shimadzu and VCSBs is paving the way for implementation of new technology. Each of these new methods improve laboratory throughput, decrease reagent use and laboratory waste, and collect data with greater accuracy and precision.
10 https://www.ecfr.gov/cgi-bin/text-idx?SID=3ebd40b83e9881cdfa64e43f746b652f&mc=true&node=se40.25.136_13&rgn=div8, accessed January 14, 2019
11 https://www.ssi.shimadzu.com/sites/ssi.shimadzu.com/files/Products/literature/toc/Shimadzu_NewTestMethodTotalNitrogenWater_ASTMD8083-16.pdf, accessed January 14, 2019
12 https://nepis.epa.gov/Exe/ZyPDF.cgi/P100LVIY.PDF?Dockey=P100LVIY.PDF, accessed January 15, 2019
13https://www.epa.gov/sites/production/files/2017-08/documents/method_625-1_2016.pdf, accessed January 15, 2019
14 https://www.epa.gov/npdes, accessed January 16, 201915 https://www.astm.org/DATABASE.CART/WORKITEMS/WK54549.htm, accessed January 15, 2019
16 https://solutions.shimadzu.co.jp/an/n/en/gcms/sio216021.pdf?_ga= 2.75241810.1151795517.1553560797-1147340759.155298451417 Kieth, Larry H., and Telliard, William A.; Priority Pollutants I – a perspective view; ES&T, Volume 13, Number 4, April 1979, pp416-423
18 ASTM D7979-17, Standard Test Method for Determination of Per- and Polyfluoroalkyl Substances in Water, Sludge, Influent, Effluent and Wastewater by Liquid Chromatography Tandem Mass Spectrometry (LC/MS/MS), ASTM International, West Conshohocken, PA, 2017, www.astm.org
19 ASTM D7968-17a, Standard Test Method for Determination of Polyfluorinated Compounds in Soil by Liquid Chromatography Tandem Mass Spectrometry (LC/MS/MS), ASTM International, West Conshohocken, PA, 2017, www.astm.org
20 http://www.chromatographyonline.com/improved-analysis-polyfluorinated-alkyl-substances-environmental-samples-using-optimized-astm-method, accessed January 21, 2019

Environmental Analysis
21
Yun Zou1, Naoki Hamada1, Yuki Hashi2, Liang Dong3, Wenlong Yang3, Pengjun Xu3, Shan Niu3
Determination of short chain chlorinated paraffins (SCCPs) using comprehensive two-dimensional gas chromatography coupled with mass spectrometry
1Shimadzu China MS Center, Shimadzu (China) Co. LTD., Beijing, China, 1000202Shimadzu China R&D Division, Shimadzu (China) Co. LTD., Shanghai, China, 2000523National Research Center for Environmental Analysis and Measurement, Beijing, China, 100029
Chlorinated paraffins (CPs) are known as a group of synthetic chlorinated n-alkanes. They are widely used in industries related to metalworking fluids, sealants, rubbers, textiles and so on[1]. According to the carbon chain length, CPs are divided into short chain chlorinated paraffins (SCCPs; C10-C13), medium chain chlorinated paraffins (MCCPs; C14-C17), and long chain chlorinated paraffins (LCCPs; C18-C30)[1]. SCCPs received more attention because of their persistence, bioaccumulation, potential for long-range environmental transport and toxicity[1]. Stockholm Convention has listed SCCPs in Annex A of persistent organic pollutants (POPs)[2].CP production is rising in China year by year[3]. The contribution of SCCPs among CP products is unclear[4]. It is necessary to clarify the SCCP concentration levels in Chinese commercial CP products.For the instrumental analysis of SCCPs, one-dimensional gas chromatography is commonly used for separation, and mass spectrometry in selected ion monitoring (SIM) mode is widely used as the detector[3]. However, one-dimensional gas chromatography coupled with mass spectrometry has the disadvantage on SCCPs and MCCPs separation since some of the congeners those share the similar quantitative or qualitative ions have the overlapped retention times[5]. Comprehensive two-dimensional gas chromatography (abbreviated to GCxGC hereinafter) is a promising tool for better analyzing SCCPs.In this study, an analytical method using GCxGC coupled with mass spectrometry (GCxGC-MS) on the quantification of SCCPs was developed. The SCCP concentrations in Chinese commercial CP products were measured. Moreover, the SCCPs congeners’ relative contributions of above samples were also described.
Introduction
The SCCP measurement was performed on comprehensive two-dimensional gas chromatography couples with triple quadrupole mass spectrometry (GCxGCMS-TQ8040; Shimadzu, Kyoto, Japan). GCxGC thermal modulator (Zoex Corp., Houston, TX, USA) was fitted to GC instrument. The capillary column set was the combination of one non-polar column and one moderately polar column. The first column was a 15 m InertCap 5MS/Sil fused silica capillary column (0.25 mm i.d., 0.1 µm thickness of 5% phenyl and 95% polysilphenylene-siloxane film; GL Sciences Inc., Tokyo, Japan). The second column was a 2.5 m BPX-50 fused silica capillary column (0.1 mm i.d., 0.1 µm thickness of 50% phenyl polysilphenylene-siloxane film; SGE Analytical Science, Melbourne, Australia).Negative chemical ionization (NCI) was used as ionization source for SCCP measurement. It has an advantage of enhancing the sensitivity of dominant fragment ions since little ion fragmentation could occur in NCI source[6]. Methane was the reagent gas. In SIM mode, a pair of ions including one quantitative ion and one qualitative ion were selected for 24 SCCP congeners as well as the ISTD. Two-dimensional data processing was conducted using ChromSquare Ver. 2.2 (Shimadzu, Kyoto, Japan).Three SCCP mixtures (C10-C13 containing different chlorine contents of 51.5%, 55.5%, and 63%; 100 ng/µL solutions in cyclohexane; 100% pure) were purchased from Dr. Ehrenstorfer (Augsburg, Germany). The
Materials and methods
13C labeled 1,5,5,6,6,10-hexachlorodecane used as an internal standard (ISTD) was purchased from Cambridge Isotope Laboratories (Andover, USA). The commercial CP products were bought from three industries. In factory A CP products are classified according to chlorination degree. Samples noted as CP-42, CP-52, and CP-70 indicate the approximate chlorine content of 42%, 52%, and 70% by weight. On the samples CP-B and CP-C collected from factory B and C, respectively, neither chlorination degree nor carbon chain length is labeled. CP products were dissolved into cyclohexane and diluted into certain concentrations. After that CP solutions were mixed with ISTD before measurements.
Two-dimensional gas chromatogram of the mixture of SCCP standards with ISTD under the optimal analytical condition was shown in Fig 1. 4 Events were divided according to carbon chain lengths in order to clearly integrate peak volume of every congener. In each carbon chain length group, the congener with less chlorine substitution eluted earlier in both 1st column and 2nd column. 24 congeners could be separated clearly in the two-dimensional gas chromatogram.A quantification method using the calibration between total response factor (RF) and chlorine (Cl) content was developed by Reth et al. (2005) and widely used in SCCPs quantification[7]. The calculations of both RF and Cl content are based on the integrated peak volumes of quantitative ions of 24 congeners. RF-Cl content calibration curves of thirteen chlorine content levels of SCCPs standards were established. Unlike the previous researches, there were two linear correlations obtained in different Cl content ranges (Fig. 2). The first calibration ranged between Cl content of 0.585 and 0.636. Total response factor was well calibrated with Cl content (R2 = 0.9544) with the equation of RF = 212.92 x (Cl content) - 122.14. The second calibration was obtained in the range of 0.635-0.651 of Cl content. The calibration equation was RF = 1395.1 x (Cl content) – 872.59 with R2 of 0.9736. These two calibration curves were used in the quantification of SCCPs in CP products.
Results and discussion
Fig. 1 2D chromatogram of SCCP standards and ISTD.
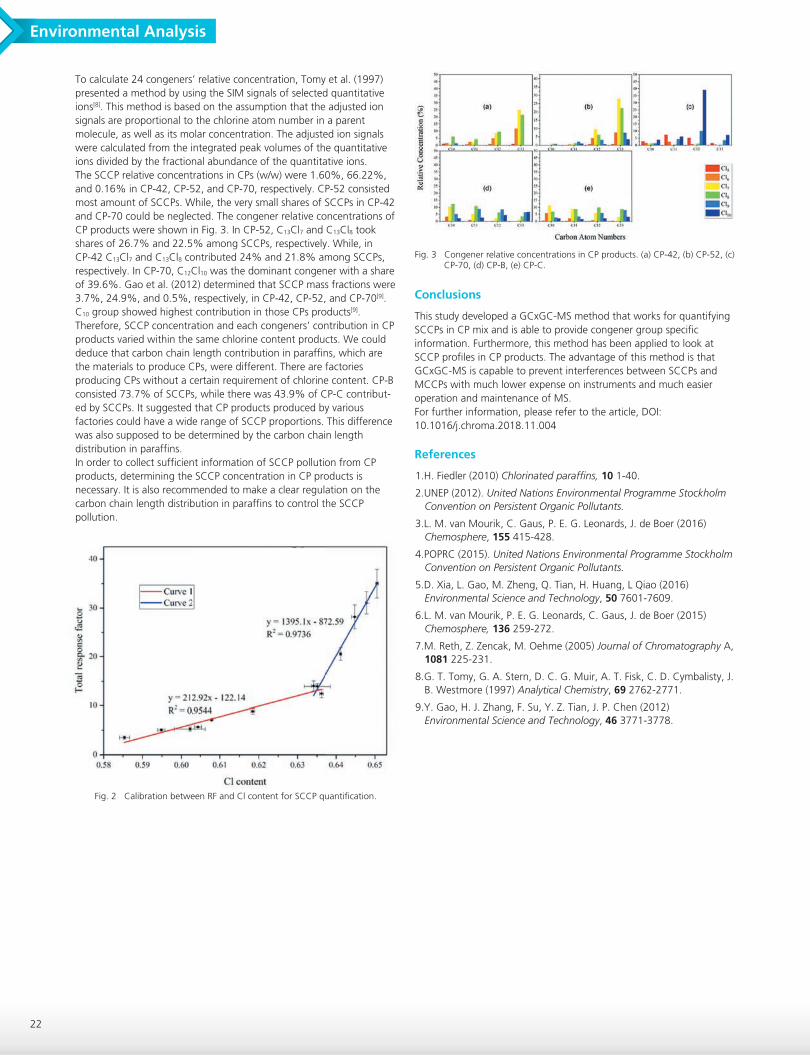
Environmental Analysis
22
To calculate 24 congeners’ relative concentration, Tomy et al. (1997) presented a method by using the SIM signals of selected quantitative ions[8]. This method is based on the assumption that the adjusted ion signals are proportional to the chlorine atom number in a parent molecule, as well as its molar concentration. The adjusted ion signals were calculated from the integrated peak volumes of the quantitative ions divided by the fractional abundance of the quantitative ions.The SCCP relative concentrations in CPs (w/w) were 1.60%, 66.22%, and 0.16% in CP-42, CP-52, and CP-70, respectively. CP-52 consisted most amount of SCCPs. While, the very small shares of SCCPs in CP-42 and CP-70 could be neglected. The congener relative concentrations of CP products were shown in Fig. 3. In CP-52, C13Cl7 and C13Cl8 took shares of 26.7% and 22.5% among SCCPs, respectively. While, in CP-42 C13Cl7 and C13Cl8 contributed 24% and 21.8% among SCCPs, respectively. In CP-70, C12Cl10 was the dominant congener with a share of 39.6%. Gao et al. (2012) determined that SCCP mass fractions were 3.7%, 24.9%, and 0.5%, respectively, in CP-42, CP-52, and CP-70[9]. C10 group showed highest contribution in those CPs products[9]. Therefore, SCCP concentration and each congeners’ contribution in CP products varied within the same chlorine content products. We could deduce that carbon chain length contribution in paraffins, which are the materials to produce CPs, were different. There are factories producing CPs without a certain requirement of chlorine content. CP-B consisted 73.7% of SCCPs, while there was 43.9% of CP-C contribut-ed by SCCPs. It suggested that CP products produced by various factories could have a wide range of SCCP proportions. This difference was also supposed to be determined by the carbon chain length distribution in paraffins.In order to collect sufficient information of SCCP pollution from CP products, determining the SCCP concentration in CP products is necessary. It is also recommended to make a clear regulation on the carbon chain length distribution in paraffins to control the SCCP pollution.
This study developed a GCxGC-MS method that works for quantifying SCCPs in CP mix and is able to provide congener group specific information. Furthermore, this method has been applied to look at SCCP profiles in CP products. The advantage of this method is that GCxGC-MS is capable to prevent interferences between SCCPs and MCCPs with much lower expense on instruments and much easier operation and maintenance of MS.For further information, please refer to the article, DOI: 10.1016/j.chroma.2018.11.004
Conclusions
1.H. Fiedler (2010) Chlorinated paraffins, 10 1-40.
2.UNEP (2012). United Nations Environmental Programme Stockholm Convention on Persistent Organic Pollutants.
3.L. M. van Mourik, C. Gaus, P. E. G. Leonards, J. de Boer (2016) Chemosphere, 155 415-428.
4.POPRC (2015). United Nations Environmental Programme Stockholm Convention on Persistent Organic Pollutants.
5.D. Xia, L. Gao, M. Zheng, Q. Tian, H. Huang, L Qiao (2016) Environmental Science and Technology, 50 7601-7609.
6.L. M. van Mourik, P. E. G. Leonards, C. Gaus, J. de Boer (2015) Chemosphere, 136 259-272.
7.M. Reth, Z. Zencak, M. Oehme (2005) Journal of Chromatography A, 1081 225-231.
8.G. T. Tomy, G. A. Stern, D. C. G. Muir, A. T. Fisk, C. D. Cymbalisty, J. B. Westmore (1997) Analytical Chemistry, 69 2762-2771.
9.Y. Gao, H. J. Zhang, F. Su, Y. Z. Tian, J. P. Chen (2012) Environmental Science and Technology, 46 3771-3778.
References
Fig. 2 Calibration between RF and Cl content for SCCP quantification.
Fig. 3 Congener relative concentrations in CP products. (a) CP-42, (b) CP-52, (c) CP-70, (d) CP-B, (e) CP-C.

Environmental Analysis
23
Per- and Polyfluorinated Alkyl Substances, PFAS, Perfluorinated compounds, PFCs, Environmental, Surface Water, Non-Potable Water, Groundwater, Wastewater, PFOA, PFOS, Persistent Organic Pollutants, POPs
Keywords:
Introduction
Per- and Polyfluorinated Alkyl Substances (PFAS) are a group of anthropogenic chemicals that are highly stable and resistant to degradation. These chemicals are manufactured and used in many consumer and industrial products (e.g. food packaging materials, fire-fighting foams and textiles) due to their heat-resistant and oil- and water-repellent properties. As these PFAS compounds are persistent, toxic and potentially harmful to humans[1], [2], [3], the leaching and presence of PFAS in our environment have raised serious concerns globally.Exposure to PFAS through drinking water and various environmental sources has been studied and determined[4], [5], [6], [7]. In May 2016, the United States Environmental Protection Agency (US EPA) issued a health advisory of 70 parts per trillion (ppt) for combined PFOA and PFOS in drinking water[8]. Several states in the US (e.g. California, Minnesota, New Jersey, Colorado, Massachusetts, Vermont and Michigan) have followed the advisory and established similar or even stricter guideline levels for PFAS, which can go to 13-14 ppt[9], [10] [11]. Recent research has suggested that occurrence of PFAS compounds in tap water is markedly different by region[12] and around the world[13]. Growing evidence highlights the obvious need to continuously monitor the water sources as well as drinking water to keep PFAS exposure under control.
▪Increasing Need to Monitor PFAS
Liquid chromatography coupled to triple-quadrupole mass spectrometry (LC-MS/MS) is widely used for the determination of PFAS in water matrices because of its high sensitivity and specificity. Given the social importance of PFAS monitoring, standardized analytical methods for LC-MS/MS need to be developed and validated to ensure that all results are consistent and reliable, particularly if the data were to be used for enforcing regulation.In September 2009, US EPA published EPA Method 537 Version 1.1 [14] for the determination of fourteen PFAS compounds in drinking water. This method was later employed for the monitoring of the selected PFAS during the Unregulated Contaminant Monitoring Rule 3 (UCMR3). However, for environmental waters (e.g. non-potable water, surface water, wastewater and groundwater) and soil matrices, there
▪Validated Methods for Analyzing PFAS
Ultra-fast LC-MS/MS Analysis of PFAS in Environmental Samples
There is increasing concern about the persistence and effects of Per- and Polyfluorinated Alkyl Substances (PFAS) in the environment. This white paper summarizes the state-of-the-art analytical methods for monitoring PFAS and demonstrates the use, speed and performance of Shimadzu Ultra-fast Mass Spectrometry (UFMS™) for PFAS analysis in environmental waters. The described method consists of a simple methanol dilution, followed by a direct injection to LC-MS/MS. The Triple Quadrupole MS, LCMS-8060, was used in this study to effectively separate and quantify 49 PFAS, with all compounds eluting within 13 minutes. The stability of PFAS and the effect of solvents, vials and vortex on the recovery were studied. Method detection limit of 0.6 – 5.4 ng/L, recovery of 84 – 113% and calibration range of 5 – 200 ng/L were achieved for 94% of the PFAS compounds studied, including all the compounds listed in ASTM D7979. With high scan speed and short dwell time, the Shimadzu LCMS-8060 demonstrates to be fast, sensitive, and robust for PFAS analysis in environmental waters.
Brahm Prakash1, Cindy Lee2, Gerard Byrne1, Tairo Ogura1
1Shimadzu Scientific Instruments, USA.2Marketing Innovation Centre, Singapore.
are no standard EPA methods available. US EPA is currently developing EPA Method 8327[15] for the analysis of PFAS in environmental waters using LC-MS/MS. In the interim, laboratories are using in-house developed methods (e.g. modified EPA Method 537) or methods that have been developed by non-governmental standardization bodies, such as ASTM International and ISO.ASTM International has developed ASTM D7979-17[16] and ASTM D7968-17a[17] for PFAS analysis in environmental waters and soil, respectively. The main difference between these ASTM methods lies in the sample preparation steps. After the extraction of samples, the procedures and LC-MS/MS methods are essentially the same. Shimadzu is one of the members of the ASTM D19.06 Task Group’s independent, second laboratory validation of ASTM D7979. This white paper describes the work related to the validation. Table 1 summarizes the various LC-MS/MS methods for PFAS testing in various environmental water and soil matrices.
Table 1 Comparison between the various EPA and ASTM Methods for PFAS testing in water matrices.
Method EPA 537[14] ASTM D7979[16] ASTM D7968[17] EPA 8327[15]
21 Targets 9 Surrogates
Sludge, Influent, Effluent and
Wastewater (<0.2% solids)
Dilute 5 mL with 5 mL Methanol → Filter → Direct
Injection
30 µL
External Calibration (Isotope Dilution or Internal Standard
allowed)
21 Targets 9 Surrogates
Soil
Extract 2 g with 10 mL 50% Methanol → Filter → Direct
Injection
30 µL
External Calibration (Isotope Dilution or Internal Standard
allowed)
24 PFAS compounds (details to be announced)
Groundwater, Surface water and
Wastewater. Sample collection procedure
to be prescribed
Direct Injection Method
To be announced
To be announced
14 Targets 3 Surrogates
3 ISTDs
Drinking Water
250 mL → SPE → 1 mL
10 µL
Internal Standard
PFAS Compounds
Sample Matrices
Sample Preparation
Injection Volume
Quantitation

Environmental Analysis
24
Experimental
Table 2 lists all 49 PFAS compounds (30 targets and 19 isotopically-labeled surrogates) used in this study. The list covers the PFAS compounds named in ASTM D7979 method and includes additional compounds listed for consideration in the appendix of the method. All PFAS standards were purchased from Wellington Laboratories (Guelph, Ontario).
Stock standard solution at a concentration of 200 ng/L for all 49 compounds was prepared from the commercially available stock solutions. The stock standard solution was further diluted using a 50:50 (vol:vol) methanol/water with 0.1% acetic acid to obtain the other eight calibration solutions; their final concentrations were at 150,
▪List of PFAS Compounds and Preparation of Calibration Standards
Due to the impact of PFAS on human health and the environment, EPA launched the 2010/2015 PFOA Stewardship Program[18] in early 2006 to reduce and ultimately eliminate PFOA, PFOS and long-chain PFAS from products and emissions. The eight participating companies with global operations have either stopped the production and import of these selected PFAS and then switched to alternatives or entirely move away from the PFAS industry.
GenX process and technology has emerged as a substitute to PFOA and PFOS; companies are able to make high-performance fluoropolymers (GenX chemicals), such as hexafluoropropylene oxide (HFPO) dimer acid and its ammonium salts. With the recent recommendation for a global ban on PFOA and its related chemicals by the UN global scientific committee[19], manufacturers and industries all over the world may turn to these GenX compounds as substitutes.
These alternatives have raised several health and environmental concerns as they possess similar properties as PFOA and PFOS[20]. To accelerate occurrence assessment, the EPA updated the drinking water method to EPA 537.1 Version 1.0 in November 2018[21] to include GenX (HFPO-dimer acid) and three other compounds (i.e. 11Dl-PF3OUdS, 9Cl-PF3ONS and ADONA,[21]) in addition to the target list.
With the release of EPA’s Health Advisory for PFAS in 2017, the availability of validated methods and increase of public awareness, PFAS monitoring and testing is becoming routine. Together with this trend of using similar compounds as alternatives, the list of PFAS that are of concern may continue to grow.
▪Growing List of PFAS Compounds
To incorporate the growing list of PFAS compounds and to enhance the specificity and sensitivity of the LC-MS/MS analysis, Multiple Reaction Monitoring (MRM) is commonly utilized. Shimadzu’s Ultra-fast Mass Spectrometry (UFMS™) systems, featuring an ultra-fast acquisition rate of 555 MRM/sec and which can operate without any compromise in sensitivity, prove to be ideal for the fast and sensitive analysis of many PFAS compounds in a single run.
Shimadzu’s collision cell, UFsweeper™, is one of the key features that contributes to the high acquisition rate. The redesign of the collision cell allows for an ultra-fast ion sweeping where ions are efficiently accelerated out of the collision cell without losing momentum. With these features in Shimadzu UFMS™, short dwell time1 and pause time2 are achieved and data can be acquired at a high speed with no loss in sensitivity. With more time for data collection, the UFMS™ technology addresses the need of large-compound-panel testing in PFAS analysis and ensures potential extendibility of the LC-MS/MS method for PFAS.
In this white paper, the state-of-the-art analytical methods for monitoring PFAS are described, with emphasis on the work related to the validation of ASTM D7979. A robust method consisting of simple sample preparation with direct injection to LC-MS/MS (Shimadzu LCMS-8060) is demonstrated, showcasing the setup, performance and compatibility of LCMS-8060 for the separation and analysis of 49 PFAS in environmental samples.
▪Flexibility of Analytical Instruments
1 Dwell time is the time allocated for acquiring the data of an ion of a particular m/z in a mass spectrometer.2 LC-MS/MS measurement conditions must be switched to perform simultaneous measurements of multiple compounds. The time needed for this is termed as pause time. As data cannot be acquired during the pause time, it should be as short as possible.
100, 80, 60, 40, 20, 10 and 5 ng/L. These standards were not filtered. Calibration was performed using a 9-point curve, ranging from 5 – 200 ng/L. Due to the high method detection limit (MDL) obtained for FHEA, FOEA and FDEA, the calibration range for these compounds was adjusted to 100 – 4000 ng/L and calibration standards were prepared as described above.
The stock solutions were prepared and stored in PFAS-free polypropylene (PP) containers. Prior to the analysis, the solutions were shaken thoroughly then transferred to a 2 mL amber glass LC vial, and analyzed within 24 hours to achieve optimum results. In the event that samples or standards are allowed to sit in the LC vials, some PFAS compounds may settle, precipitate or adsorb on the surface. To ensure a homogenous solution and optimum results, it is necessary to vortex the solution prior to injection.

Environmental Analysis
25
A surrogate spiking solution containing each isotopically-labelled PFAS was added to all samples, including method blanks, duplicates, laboratory control samples, matrix spikes and reporting limit checks. The stock surrogate spiking solution was prepared at 20 µg/L in 95:5% (vol/vol) acetonitrile (ACN):water. Water samples (5 mL) were collected in 15 mL PP/HDPE centrifuge vials. Also, the blank (containing 5 mL of reagent water) and laboratory control sample (containing the lowest calibration concentration for each PFAS) were prepared for the study.
The samples (5 mL) were diluted 1:1 with methanol and spiked with 40 µL of the surrogate spiking solution and vortexed for 2 minutes, resulting in a surrogate concentration of 80 ng/L in the diluted solution. The samples were filtered and acetic acid (10 µL) was added to the filtrate to adjust the pH. The aliquots were transferred to the LC vials for injection and analysis by LC-MS/MS.
▪Preparation of Samples
The analytical and instrument conditions are listed in Table 3. Each PFAS standard was injected and analyzed separately to ensure positive identification and maximum resolution. Upon collating the individual retention time and optimized MRM parameters, the PFAS standard mixture (containing all PFAS compounds) was prepared and used for subsequent analysis. All compound parameters, including precursor ion, product ion and collision energies, were optimized bypassing the analytical column using LabSolutions software. At least two MRM transitions were used.Shimadzu UFMS™, possessing an ultra-fast acquisition rate of 555 MRM/sec and a high polarity switching speed of 5 msec, is capable of MRM transitions with a fast-enough cycle time to obtain high sensitivity with at least ten data points over a peak. The target compounds were identified by comparing the MRM transitions of the sample to that of the standards. The target analytes were quantitated using the quantifier MRM transitions (Table 4) of the target compounds. Concentrations were calculated using LabSolutions software to generate a linear regression. The point of origin was excluded, and a fit weighting of 1/x was used to give more emphasis to the lower concentrations.
▪LCMS Analytical and Instrument Conditions
Table 2 List of 49 PFAS (target compounds and isotopically-labeled surrogates) included in this paper

Environmental Analysis
26
Table 3 LCMS system and instrument conditions.
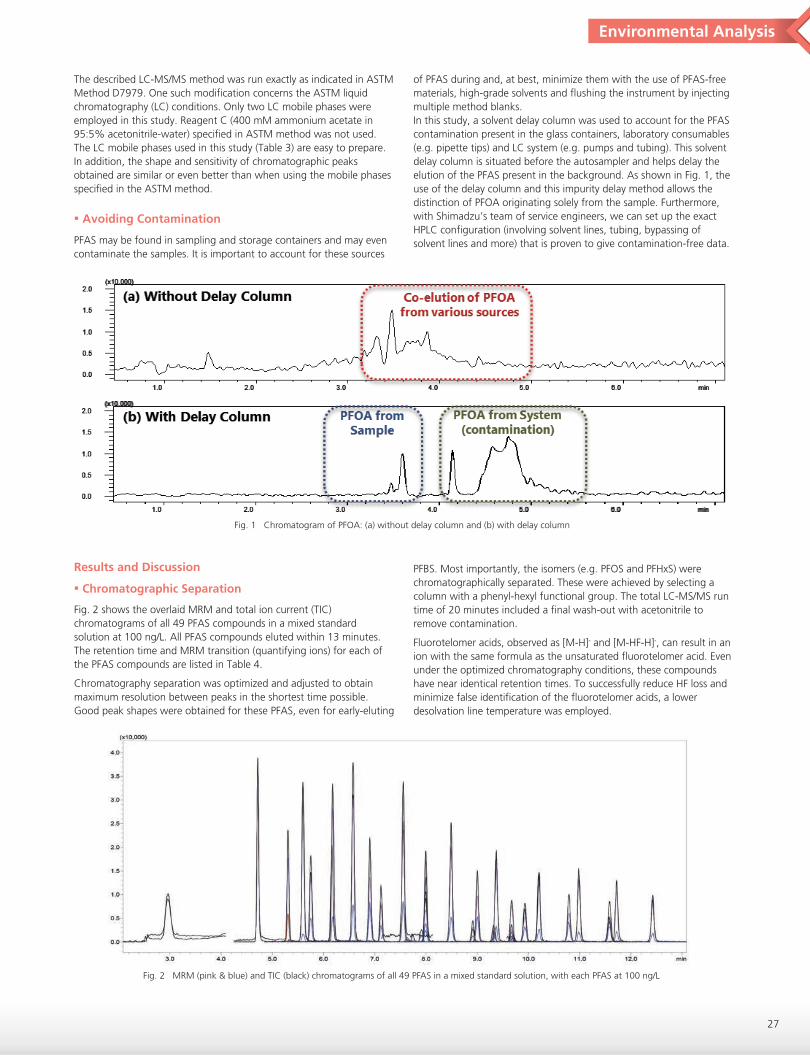
Environmental Analysis
27
PFAS may be found in sampling and storage containers and may even contaminate the samples. It is important to account for these sources
▪Avoiding Contamination
The described LC-MS/MS method was run exactly as indicated in ASTM Method D7979. One such modification concerns the ASTM liquid chromatography (LC) conditions. Only two LC mobile phases were employed in this study. Reagent C (400 mM ammonium acetate in 95:5% acetonitrile-water) specified in ASTM method was not used. The LC mobile phases used in this study (Table 3) are easy to prepare. In addition, the shape and sensitivity of chromatographic peaks obtained are similar or even better than when using the mobile phases specified in the ASTM method.
Fig. 1 Chromatogram of PFOA: (a) without delay column and (b) with delay column
Fig. 2 MRM (pink & blue) and TIC (black) chromatograms of all 49 PFAS in a mixed standard solution, with each PFAS at 100 ng/L
of PFAS during and, at best, minimize them with the use of PFAS-free materials, high-grade solvents and flushing the instrument by injecting multiple method blanks.In this study, a solvent delay column was used to account for the PFAS contamination present in the glass containers, laboratory consumables (e.g. pipette tips) and LC system (e.g. pumps and tubing). This solvent delay column is situated before the autosampler and helps delay the elution of the PFAS present in the background. As shown in Fig. 1, the use of the delay column and this impurity delay method allows the distinction of PFOA originating solely from the sample. Furthermore, with Shimadzu’s team of service engineers, we can set up the exact HPLC configuration (involving solvent lines, tubing, bypassing of solvent lines and more) that is proven to give contamination-free data.
Results and Discussion
Fig. 2 shows the overlaid MRM and total ion current (TIC) chromatograms of all 49 PFAS compounds in a mixed standard solution at 100 ng/L. All PFAS compounds eluted within 13 minutes. The retention time and MRM transition (quantifying ions) for each of the PFAS compounds are listed in Table 4.
Chromatography separation was optimized and adjusted to obtain maximum resolution between peaks in the shortest time possible. Good peak shapes were obtained for these PFAS, even for early-eluting
▪Chromatographic Separation
PFBS. Most importantly, the isomers (e.g. PFOS and PFHxS) were chromatographically separated. These were achieved by selecting a column with a phenyl-hexyl functional group. The total LC-MS/MS run time of 20 minutes included a final wash-out with acetonitrile to remove contamination.
Fluorotelomer acids, observed as [M-H]- and [M-HF-H]-, can result in an ion with the same formula as the unsaturated fluorotelomer acid. Even under the optimized chromatography conditions, these compounds have near identical retention times. To successfully reduce HF loss and minimize false identification of the fluorotelomer acids, a lower desolvation line temperature was employed.

Environmental Analysis
28
Table 4 MRM Transition (quantifying ions), retention time, method detection limit (MDL), calibration range, accuracy and precision results for PFAS.

Environmental Analysis
29
The shelf life of the prepared PFAS standards was evaluated using the following solvents: 10%, 30%, 50%, 70% and 90% methanol, in both glass and polypropylene vials. The plots of relative intensity of PFAS against shelf life (time/hours) shown in Fig. 3 demonstrate that the 50% methanol in water used in the ASTM methods sufficiently dissolves the PFAS compounds and keeps them in solution. The lower concentrations of methanol (10% and 30% methanol) show significant loss of PFAS due to the insolubility of PFAS in the solvent used. The recovery results for 90% methanol are similar to that of 70% methanol.Furthermore, the materials of the LC vial, amber glass and polypropyl-ene, were investigated to determine the potential adsorption of PFAS on the vial surface Similar recovery and quantitation were observed regardless of the material of the LC vials. Rather than the material of the LC vial, the effect of vortex on the recovery of PFAS is considerable (Fig. 4). To demonstrate the importance of utilizing the vortex mixer, a PFAS standard solution was allowed to sit for 24 hours. An end mid-level calibration check (50 ng/L) was prepared and the recovery of the PFAS compounds from the vial, before and after mixing, was determined. Fig. 4 shows the chromatogram of the PFAS compounds before and after vortex. The recovery of the long-chain PFAS is noticeably lower before vortex. The use of vortex ensures that the solution is homogenous and consistent results are obtained.The PFAS concentration in the vial may change after the vial cap is pierced as the organic solvent (i.e. methanol:water solution) and/or PFAS compound can be lost through the puncture. If calibration standards are to be used multiple times, it is recommended to use amber glass vial with sealed replaceable caps. This sealing of vials immediately after injection may alleviate the loss of PFAS.
▪PFAS Stability Study – Effects of Solvents, LC Vial Materials and Vortex
Calibration was performed for all PFAS compounds using a nine-point calibration curve, ranging from 5 ng/L – 200 ng/L with some exceptions. FHEA, FOEA and FDEA, the fluorotelomer acids, were calibrated in the range of 100 – 4000 ng/L. The linearity of the curves was evaluated using 1/x weighting, ignoring the origin. The calibration range are shown in Table 4 and all calibration curves had a regression coefficient (R2) higher than 0.99. The calibration curves and regression coefficient (R2) of some selected PFAS compounds are illustrated in Fig. 5.A MDL study was conducted by spiking the water samples (5 mL). FHEA, FOEA and FDEA were spiked at a concentration of 100 ng/L; the rest of the PFAS compounds were spiked at 20 ng/L. The MDL, %recovery and % RSD were determined and are shown in Table 4. The MDLs using the LCMS-8060 are in the range of 0.6 – 5.4 ng/L for the 44 PFAS compounds (excluding fluorinated telomer acids). Similarly, the % recovery and % RSD for these 44 PFAS were within the acceptable limits (70-130%).
▪Calibration Range and Method Detection Limit (MDL)
This white paper summarized and illustrated the use, performance and compatibility of Shimadzu UFMS™ for the analysis of PFAS in environmental samples. With reference to ASTM D7979, 49 PFAS compounds were separated and quantified with a simple direct injection method and rapid LC-MS/MS analysis (LCMS-8060). Direct injection without SPE allows for maximum throughput and minimal background, loss and contamination cause by sample preparation. The high-speed and high-sensitivity characteristics of the LCMS-8060 achieve a method detection limit of 0.6 – 5.4 ng/L and recovery of 84 – 113% for all PFAS compounds, excluding FTAs. These results fall within the quality control requirements and limits. Together with a high scanning speed and a short dwell time, the Shimadzu LCMS-8060 achieves rapid, reliable and highly sensitive quantitation of PFAS in environmental waters.
▪Summary and Conclusion
Fig. 3 Plots of PFAS recovery against shelf life (time/hour) for the various solvents in glass and polypropylene LC vials

Environmental Analysis
30
Fig. 4 Recovery of PFAS before (left) and after (right) mixing the standard PFAS solution vial
Fig. 5 Representative calibration curves (PFOA, PFBS, PFNA and FOSA) at 10 µL injection using LCMS-8060

Environmental Analysis
31
[1] Agency for Toxic Substances and Disease Registry , "Per- and Polyfluoroalkyl Substances (PFAS) and Your Health," 31 October 2018. [Online]. Available: https://www.atsdr.cdc.gov/pfas/. [Accessed 11 December 2018].
[2] C. Lau, K. Anitole, C. Hodes, D. Lai, A. Pfahles-Hutchens and J. Seed, "Perfluoroalkyl Acids: A Review of Monitoring and Toxicologi-cal Findings," Toxicological Sciences, vol. 99, no. 2, pp. 366-394, 1 October 2007.
[3] Environmental Protection Agency, "Lifetime Health Advisories and Health Effects Support Documents for Perfluorooctanoic Acid and Perfluorooctane Sulfonate," Federal Register , vol. 81, no. 101, pp. 33250-33251, 2016.
[4] United States Environmental Protection Agency (US EPA), "PFOA, PFOS and Other PFASs: Basic Information about PFAS," 20 August 2018. [Online]. Available: https://www.epa.gov/pfas/basic-informa-tion-pfas#exposed. [Accessed 5 December 2018].
[5] Sara Sahlin, Swedish Environmental Protection Agency, "PFAS in the Baltic Sea Region: Inventory of Awareness, Actions and Strategies Related to Highly Fluorinated Substances PFAS, including PFOS," 2017.
[6] W. H. O. (WHO), Keeping our water clean: the case of water contamination in the Veneto Region, Italy, Copenhagen, Denmark: World Health Organization (WHO) Regaional Office for Europe, 2016.
[7] K. M. Rappazzo, E. Coffman and E. P. Hines, "Exposure to Perfluorinated Alkyl Substances and Health Outcomes in Children: A Systematic Review of the Epidemiologic Literature," International Journal of Environmental Research and Public Health, vol. 14, no. 7, p. 691, 2017.
[8] United States Environmental Protection Agency, "Supporting Documents for Drinking Water Health Advisories for PFOA and PFOS," November 2016. [Online]. Available: https://www.epa.gov-/ground-water-and-drinking-water/support-ing-documents-drinking-water-health-advisories-pfoa-and-pfos. [Accessed 4 December 2018].
[9] United States Environmental Protection Agency (US EPA), "U.S. State Resources about PFAS," [Online]. Available: https://ww-w.epa.gov/pfas/us-state-resources-about-pfas. [Accessed 4 December 2018].
[10]C. Alder, "Analysis of State-by-State Differences in PFAS Regula-tion," Northeastern University Social Science Environmental Health Research Institute, 2 October 2018. [Online]. Available: https://p-fasproject.com/2018/10/02/analy-sis-of-state-by-state-differences-in-pfas-regulation/. [Accessed 11 December 2018].
[11]California Water Boards, State Water Resources Control Board, "Perfluorooctanoic acid (PFOA) and Perfluorooctanesulfonic acid (PFOS)," 13 July 2018. [Online]. Available: https://www.water-boards.ca.gov/drinking_water/certlic/drink-ingwater/PFOA_PFOS.html. [Accessed 13 December 2018].
[12]X. C. Hu, D. Q. Andrews, A. B. Lindstrom, T. A. Bruton, L. A. Schaider, P. Grandjean, R. Lohmann, C. C. Carignan, A. Blum, S. A. Balan, C. P. Higgins and E. M. Sunderland, "Detection of Poly- and Perfluoroalkyl Substances (PFASs) in U.S. Drinking Water Linked to Industrial Sites, Military Fire Training Areas and Wastewater Treatment Plants," Environmental Science & Technology Letters, vol. 3, no. 10, pp. 344-350, 2016.
[13]H. A. Kabore, S. Vo Duy, G. Munoz, M. Ladji, M. Desrosiers, J. Liu, T. K. Sory and S. Sauve, "Worldwide drinking water occurrence and levels of newly-identified perfluoroalkyl and polyfluoroalkyl substances," Science of The Total Environment, Vols. 616-617, pp. 1089-1100, 2018.
[14]U.S. Environmental Protection Agency, "US EPA Method 537: Determination of Selected Perfluorinated Alkyl Acids in Drinking Water by Solid Phase Extraction and Liquid Chromatography / Tandem Mass Spectrometry (LC/MS/MS)," Washington D.C., 2009.
[15]United States Environmental Protection Agency, "US EPA - PFAS Research and Development," 14 August 2018. [Online]. Available: https://www.epa.gov/sites/production/files/2018-08/docu-ments/r4_combined_presentations_.pdf. [Accessed 5 December 2018].
[16]ASTM International, "ASTM D7979-17: Standard Test Method for Determination of Perfluorinated Compounds in Water, Sludge, Influent, Effluent and Wastewater by Liquid Chromatography Tandem Mass Spectrometry (LC/MS/MS)," West Conshohocken, 2017.
[17]ASTM International, "ASTM D7968-17a: Standard Test Method for Determination of Perfluorinated Compounds in Soil by LIquid Chromatography Tandem Mass Spectrometry (LC/MS/MS)," West Conshohocken, 2017.
[18]United States Environmental Protection Agency (US EPA), "Assess-ing and Managing Chemicals under TSCA, Fact Sheet: 2010/2015 PFOA Stewardship Program," [Online]. Available: https://ww-w.epa.gov/assessing-and-managing-chemicals-under-ts-ca/fact-sheet-20102015-pfoa-stewardship-program. [Accessed 23 December 2018].
[19]Secretariat of the Basel, Rotterdam and Stockholm Conventions (UNEP), "Two More Toxic Chemicals Recommended to be Eliminated as UN Scientific Committee Paves Way for Ban on Widely-Used PFOA [Press Release]," 18 September 2018. [Online]. Available: http://www.brsmeas.org/Implementation/MediaRe-sources/PressRe-leases/POPRC14PressReleases/tabid/7685/language/en-US/Default.aspx. [Accessed 3 December 2018].
[20]S. A. Meiburg, "Emerging Contaminants and Environmental Health," North Carolina Medical Journal, vol. 79, no. 5, pp. 315-316, 2018.
[21]U.S. Environmental Protection Agency, "US EPA Method 537.1: Determination of Selected Per- and Polyfluorinated Alkyl Substances in Drinking Water by Solid Phase Extraction and Liquid Chromatog-raphy / Tandem Mass Spectrometry (LC/MS/MS)," Washington D.C., 2018.
References

32
Selection 1 Drinking Water
Analysis of PFAS Specified in EPA Method 537 and Beyond using Shimadzu UFMS™
This application news demonstrates the use, performance and compatibility of Shimadzu Ultra-fast Mass Spectrometry (UFMS™) for EPA Method 537 with an expanded compound panel of seven additional PFAS.
Selection 2 Air Pollutants
Analysis of Volatile Organic Compounds in the Environment Using the Restore Function of TD-GC/MSMeasuring the concentration of volatile organic compounds (VOCs) in the air serves as a means of determining air pollution and is used to monitor pollution in a wide variety of environments, such as within manufacturing plants, urban areas, and indoor environments. This report describes the results from studying the appropriate sample line temperature for each section in terms of optimizing analytical conditions for simultaneously measuring VOCs with a wide range of low and high boiling points.
Selection 3 Herbicide in Beverages
Direct Analysis of Glyphosate, Glufosinate and AMPA in Beverages Using a Triple Quadrupole LC/MS/MS
This article introduces a method for a high-sensitivity measurement of glyphosate, glufosinate and AMPA that does not require complex pretreatment or timeconsuming derivatization.
Selection 5 Tap Water
Analysis of Perchlorate in Tap Water Using a Triple Quadrupole LC/MS/MS
Perchlorate is a chemical compound that may occur naturally. It can be found in minerals and is also known to be generated from photochemical reactions in the atmosphere. Perchlorate is difficult to remove from tap water sources by regular purification processes and no method has been specified in Japan as of yet. This article introduces a high-sensitivity analysis of perchlorate in tap water using the LCMS-8050.
Selection 6 Recycled Plastics
Quantitative Analysis of Recycled Plastics Using FTIR
The main four components of recycled plastics are polyethylene (PE), polypropylene (PP), polystyrene (PS), and polyethylene terephthalate (PET), which are all commodity resins. Quality standards are defined for recycled plastics and to determine thecomposition of components, generally a sample is dissolved in a solvent and then analyzed using a nuclear magnetic resonance (NMR) spectrometer.This article introduces a screening analysis method using a Fourier transform infrared spectrophotometer (FTIR).
Shimadzu selected 14 articles for this issue. They derive from application notes and technical reports related to environmental analysis, and utilize a variety of Instruments we produce. Cutting-edge researches are also included.
Shimadzu Selection
Selection 4 UHPLC/SFC Switching System
Improving Separation and Method Development Efficiency Using the Nexera UC/s UHPLC/SFC Switching SystemPharmaceuticals, foods, environmental testing, and many other fields require a wide variety of separation methods, such as for separating chiral compounds and structural isomers. By combining both UHPLC and SFC, the Nexera UC/s UHPLC/SFC switching system enables both UHPLC and SFC analysis using a single system. By using two separation methods, UHPLC and SFC, for screening during the method development process, the system can result in configuring superior analytical conditions more quickly.

33
Selection 8 Film Thicknesses
Quantitative Analysis of Film Thicknesses of Multi-Layer Plating Used on CardsA three-layer plating of gold (Au), nickel (Ni), and copper (Cu) is often applied to the contact areas of electronic devices and IC chips. The amount of plating material deposited (film thickness) can be measured non-destructively by using X-rayfluorescence (XRF) spectrometry. This article introduces a simple quantitative analysis of Au, Ni, and Cu film of a three-layer plating by employing the thin-film fundamental parameter (FP) method
Selection 9 TOC Analysis
TN and NOx Measurement for a Denitration SystemA denitration system decomposes NOx into nitrogen and water to reduce atmosphere pollution by adding dry ammonia, aqueous ammonia or urea solution as a reducing agent to the flue gas. This article introduces example measurements of urea solution using a system comprising Shimadzu's TOC-L and optional TNM-L total nitrogen unit.
Selection 10 Caffein and Acetic Acid
Quantitative Measurement of Caffeine and Acetic Acid – Advantages of Low Stray Light and High Photometric Repeatability –The recent demands for the quantitative measurement by UV-Visible spectroscopy are the quantitation of a component with low concentration and the quantitation of a solution with high concentration without diluting it. In this report, the quantitation limit and the linearity of a calibration curve for caffeine aqueous solutions and acetic acid aqueous solutions obtained by using the UV-1900 are demonstrated.
Selection 14 Tap Water
Analysis of Formaldehyde by the Derivatization- High Performance Liquid Chromatography Method, in Compliance with Water Quality StandardsThis article introduces an example of the analysis of formaldehyde in compliance with the derivatizationhigh performance liquid chromatography method (hereinafter the official method), using a Shimadzu Prominence-i high performance liquid chromatograph.
Selection 7 Light Elements
X-Ray Fluorescence Analysis of Light Elements in Liquid Samples – EDX-8100 and Helium Purge Unit –Shimadzu’s EDX-8100 is an energy dispersive X-ray fluorescence spectrometer with high sensitivity for light elements and can be configured with an optional helium purge unit. The helium purge unit enables high-sensitivity analysis of light elements in samples that cannot be depressurized to a vacuum state such as solutions and samples that generate gas.
Selection 11 Metal Nanoparticle
Measurement of Time-dependent Change of Metal Nanoparticles– Application of Ultrafast Scanning Speed of UV-1900 –This time, absorption spectra of gold nanoparticles and silver nanoparticles used as antibacterial coating were measured with the newly developed UV-1900 UV-VIS spectrophotometer. It is effective for the investigation of the light reduction phenomenon which is shown in this report and needs the spectrum measurement in the long wavelength range in a short time.
Selection 12 Tap Water
Analysis of Bromate in Tap Water Using a Triple Quadrupole LC/MS/MS (2)
Bromate in tap water is generated by advanced water treatment processes such as ozone disinfection in the process of water purification.In this article, we introduce the results of our examination of LC/MS/MS analysis utilizing a mixed-mode column (multi-mode column) as a new LC separation mode.
Selection 13 Phthalate Esters
Comparison of Screening Method (Py-GC/MS) and Quantitative Method(Solvent Extraction–GC/MS) for Phthalate Esters AnalysisFrom 2019, four phthalate esters (diisobutyl phthalate (DIBP), n-dibutyl phthalate (DBP), benzyl butyl phthalate (BBP) and di (2-ethylhexyl) phthalate (DEHP)) will be added to restricted substances in the amended RoHS Directive. In this technical report, the quantitative results between the solvent extraction-GC/MS method and the Screening System for Phthalate Esters “Py-Screener” (Py-GC/MS method) were compared.

Shimadzu Europa’s 50th anniversary celebration
Topics
Shimadzu celebrated the 50th anniversary of Shimadzu Europa on September 11, 2018. More than 300 people from all over Europe participated in the event at Mercator Hall in Duisburg, Germany. The anniversary event included music, show acts, dinner, speeches, greeting notes, and a “Walk of History” in which 50 years of company history in Europe was covered. The supervisory board and executive board from Japan attended the party and had a great time with the executives of Shimadzu subsidiaries and distributors from all over Europe.In the musical section, members of the Duisburg Philharmonic Orchestra performed, and the show act included a combination of entertainment and science.
As for the “Walk of History”, past advertisements, catalogs and pictures from exhibitions were collected to introduced the firm’s history. Those items bridged the gap that exists between past and present to describe the development of Shimadzu Europa from technological, economic, political, and social aspects.Akira Nakamoto, Chairman of the Board of Shimadzu Corporation, insisted on the importance of the European market in his welcoming speech.In addition to Mr. Nakamoto, Teruhisa Ueda, the President and CEO of Shimadzu Corporation, presented his complimentary remarks to theemployees and represented Shimadzu Europa as a strong and creative voice in the international organization where over 11,000 people areemployed globally.
In the first 25 years, SEG worked to expand its business and network to East Germany, Russia, and Yugoslavia. The first turning point occurred in 1987: a move from Dusseldorf to Duisburg, Germany with 38 employees, where the European headquarters were located.Our own R&D and production facilities laid the foundation for evolution, allowing us to respond faster and flexibly to market needs. The total floor space of 6,300 m2 for offices and production space provided possibilities for future expansion. In 1992, another 6,000 m2 were added for expansion of analytical and medical operations. Then, the ShimCAT Center for Application and Training was established, achieving application tasks on-site. Since the 1990s, political and social changes on the continent brought SEG the opportunity to develop new markets in Eastern Europe. It started to enlarge its base in Europe with additional technical offices. In the following years, many branch offices and subsidiaries were founded. Now, Shimadzu has an enormous covering the entire continent. The European Innovation Center (EUIC) is also integral to Shimadzu Europa’s walk of history. The EUIC’s unique approach, which is a combination of the academic and scientific knowledge of universities and Shimadzu’s technological expertise, makes it possible to provide more customer-focused service and to create new solutions for tomorrow. The latest milestone in the organizational development was the acquisition of ALSACHIM, a French-based company specializing in stable isotope-labelled compounds, metabolites and pharmaceutical-concerned substances and analytical purposes. With that acquisition, Shimadzu can venture into the clinical market and provide a total solution comprising both hardware and software. Shimadzu Europa will continue to grow and to provide the best solutions that meet our customers’ needs, both today and well into the future.
34
Shimadzu Europa - Walk of History -Everything started with five people in 1968. Shimadzu Europa’s 50-year growth has resulted in a massive European network with offices and trade partners in 81 cities from 47 countries, employing over 700 people in Europe.
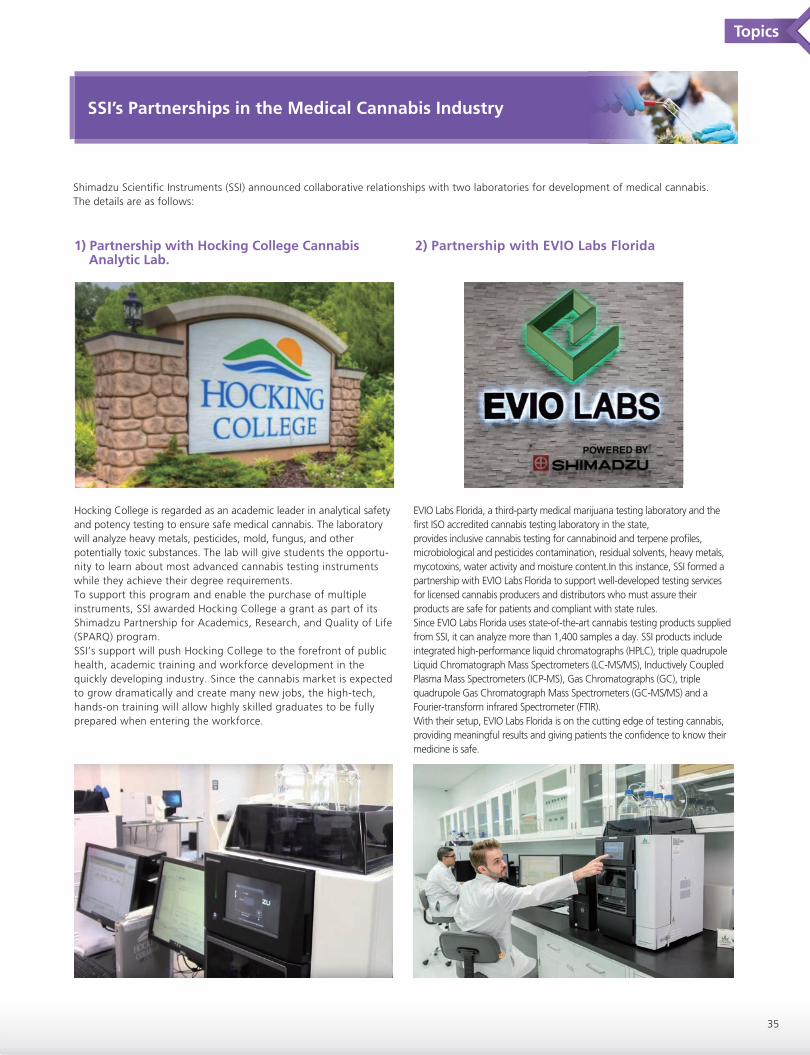
SSI’s Partnerships in the Medical Cannabis Industry
Topics
35
Shimadzu Scientific Instruments (SSI) announced collaborative relationships with two laboratories for development of medical cannabis. The details are as follows:
EVIO Labs Florida, a third-party medical marijuana testing laboratory and the first ISO accredited cannabis testing laboratory in the state,provides inclusive cannabis testing for cannabinoid and terpene profiles, microbiological and pesticides contamination, residual solvents, heavy metals, mycotoxins, water activity and moisture content.In this instance, SSI formed a partnership with EVIO Labs Florida to support well-developed testing services for licensed cannabis producers and distributors who must assure their products are safe for patients and compliant with state rules.Since EVIO Labs Florida uses state-of-the-art cannabis testing products supplied from SSI, it can analyze more than 1,400 samples a day. SSI products include integrated high-performance liquid chromatographs (HPLC), triple quadrupole Liquid Chromatograph Mass Spectrometers (LC-MS/MS), Inductively Coupled Plasma Mass Spectrometers (ICP-MS), Gas Chromatographs (GC), triple quadrupole Gas Chromatograph Mass Spectrometers (GC-MS/MS) and a Fourier-transform infrared Spectrometer (FTIR).With their setup, EVIO Labs Florida is on the cutting edge of testing cannabis, providing meaningful results and giving patients the confidence to know their medicine is safe.
1) Partnership with Hocking College Cannabis Analytic Lab.
2) Partnership with EVIO Labs Florida
Hocking College is regarded as an academic leader in analytical safety and potency testing to ensure safe medical cannabis. The laboratory will analyze heavy metals, pesticides, mold, fungus, and other potentially toxic substances. The lab will give students the opportu-nity to learn about most advanced cannabis testing instruments while they achieve their degree requirements.To support this program and enable the purchase of multiple instruments, SSI awarded Hocking College a grant as part of its Shimadzu Partnership for Academics, Research, and Quality of Life (SPARQ) program.SSI’s support will push Hocking College to the forefront of public health, academic training and workforce development in the quickly developing industry. Since the cannabis market is expected to grow dramatically and create many new jobs, the high-tech, hands-on training will allow highly skilled graduates to be fully prepared when entering the workforce.

DAICENTER-SHIMADZU Analytic Workshop in India
Topics
DAICENTER (DBT-AIST International CENter for Translational & Environmental Research) and Shimadzu Analytical (India) Pvt. Ltd. (SAIP) hosted a one-week collaborative workshop, consisting of detailed explanations and on-site training courses about innovative and leading-edge analytical technologies. DAICENTER is devoted to providing young scientists from India with research training and networking opportunities under a general memorandum of understanding (MOU).
The purpose of the workshop was to introduce the fundamental concepts of utilizing analytical devices. Research students in Ph.D. or Post-Doctoral Biological Sciences programs working in Institutes or Universities in India mainly partook in the workshop.
The workshop was conducted with great success and received favorable reviews from the participants. In the future, Shimadzu hopes to organize more workshops like the one in India in order to enhance our brand awareness and create new possibilities with tomorrow’s leading scientists.
Arrival, Reception & Introduction to analytical instruments, Molecular Spectroscopy, UV, FTIR
Atomic Spectroscopy, Atomic Absorption Spectroscopy, ICP and ICP-MS
Range of Chromatography techniques and Gas Chromatography
GC-MS, LC-MS
HPLC
36
Day 1
Day 2
Day 3
Day 4
Day 5

37
New Productssstsctsctuctucuc stsstsctsctsctctucucucuuuduccuuudududuodododrodroProProProPrw Pw Pw Pw w eweweweweNe duduodroPrw Pw duododrodProProPrw Pw weweweweweNeNeNNNeNNNeeNeNNeeNeNNNNNNNNNN
Click here>>- Auto Diagnosis and Recovery- Complete auto operation from start-up to shutdown- Simple management of operating status - Automated analysis of thousands of samples - Compact and creative design
Features
With the new Nexera series, Shimadzu has incorporated AI capabilities and the Internet of Things (IoT) for automated detection, issue resolution and simple lab management. This state-of-art product is the culmination of Shimadzu’s 40 years of experience in LC technology and will be the industry’s standard bearer in terms of intelligence, efficiency, and design.
New Nexera UHPLC series
EXPERIENCE NEW BENCHMARKS - A New Benchmark of Intelligence- A New Benchmark of Efficiency- A New Benchmark of Design
Click here>>
- Enhanced separation and detection- Increased laboratory production and reduced analysis costs- Shorter overall analysis times- Excellent reproducibility, maintaining analysis and data integrity
Features
The Shim-pack Velox columns with core shell technology are designed to resolve the most challenging separations with faster performance, increased resolution, and superior ruggedness. Whether developing a high-separation analysis method, transferring an existing method for throughput improvement, or improving complex separation analyses, Shim-pack Velox columns suit your needs.
Shim-pack Velox LC Columns
Maximize LC Separation Performance with Core Shell Technology

www.shimadzu.com/an/
For Research Use Only. Not for use in diagnostic procedures.The content of this publication shall not be reproduced, altered or sold for any commercial purpose without the written approval of Shimadzu. The information contained herein is provided to you "as is" without warranty of any kind including without limitation warranties as to its accuracy or completeness. Shimadzu does not assume any responsibility or liability for any damage, whether direct or indirect, relating to the use of this publication. This publication is based upon the information available to Shimadzu on or before the date of publication, and subject to change without notice.
© Shimadzu Corporation, 2019
Printed in Japan, April, 2019