Issaquah City Council Briefing - Climate Solutions · 1/29/2013 · Issaquah City Council Briefing...
16
Issaquah City Council Briefing Energy & Climate Plan Update January 29, 2013
Transcript of Issaquah City Council Briefing - Climate Solutions · 1/29/2013 · Issaquah City Council Briefing...

Issaquah City Council Briefing Energy & Climate Plan Update
January 29, 2013

Presentation
1. Background and Goals
2. Energy Map and Carbon Wedge Analysis
3. Primary Strategies
4. Next Steps

Policy Background and Goals
Reduce greenhouse gas (GHG) emissions 80 percent below 2007 levels by 2050 (Comprehensive Plan Policy L8.1)
‒ Consistent with King County Comprehensive Plan
Carbon Emissions Studies (Comprehensive Plan Policy L8.3)
Central Issaquah Plan
Strategy development for Energy, Waste and other resources
Sustainability Action Plan

Approach
Energy use analysis
Energy source to end-use maps
Carbon sequestration review
Carbon wedge analysis
Strategy development
Near term action plan

Key Data Sources
Sector Measure Source(s)
Transportation Vehicle miles traveled Puget Sound Regional Council, Origination-Destination data
Commercial Electricity and natural gas consumption
Puget Sound Energy
Industrial Electricity and natural gas consumption
Puget Sound Energy
Residential Electricity and natural gas consumption
Puget Sound Energy
Urban Forests Acres of forest tree canopy coverage
City 2011 Tree Canopy Study, AMEC
Waste Garbage, recycling and compost disposal
City Solid Waste data

Energy & Emissions (2007)
25.4%
22.5% 23.3%
22.5%
5.9%
0.4%
Issaquah Energy Profile ~5,640 BBTUs
Hydro Coal Petroleum Natural gas Renewable Nuclear
32.7%
29.2%
33.1%
5.0%
Issaquah GHG Emissions Profile ~281,000 MT CO2e
commercial buildings residential buildings transportation industrial


Forest and Waste Analysis
Urban Forests – 151,000 MT CO2e sequestration. Significant, but a baseline condition
– Avoid net loss, stewardship to improve properly functioning conditions
Waste Diversion – 17,569 MT reductions through recycling and composting as
compared to all-landfill approach
– 977 MT reduction annually (with sector inventory approach)
– Additional focus on waste prevention and sustainable purchasing
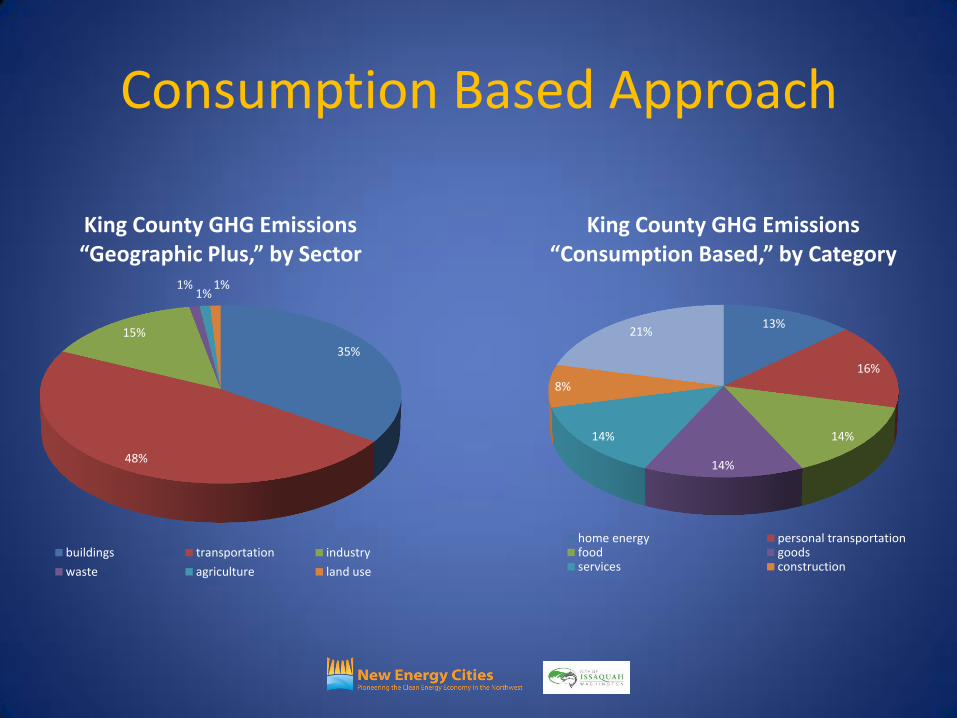
Consumption Based Approach
13%
16%
14%
14%
14%
8%
21%
King County GHG Emissions “Consumption Based,” by Category
home energy personal transportationfood goodsservices construction
35%
48%
15%
1% 1%
1%
King County GHG Emissions “Geographic Plus,” by Sector
buildings transportation industry
waste agriculture land use


General Findings
Existing laws are important, but they alone will not stabilize emissions
State, regional, and local levers of change are all essential to meet the 2050 goal
City will need to implement new actions on its own, but must also band together on others that require broader action
Achieving 80 percent reduction by 2050 is possible,
but requires bolder, more organized action

Primary Strategic Opportunities
Support Existing Laws - Ensure success of WA Energy Code – demonstrate potential and feasibility of
significant advancements
- Maintain or strengthen WA Renewable Portfolio Standard (I-937)
- Demonstrate potential and feasibility of trip and VMT reduction
Develop New Programs/Program Actions - Increase built environment energy efficiency above and beyond Code
- Reduce carbon intensity of building and transportation energy
- Reduce petroleum use in transportation with increased commitments to smart growth, clean vehicles, transit, and active transportation modes
Regional Collaboration - Foster regional approaches to energy and climate implementation
- Replace coal & natural gas in fuel mix with renewable energy

Next Steps Detailed action planning
‒ Near-term implementation horizon
‒ Policy and program
‒ Prioritizing strategies and tactics
‒ Creating process for implementing
Regional climate collaboration ‒ County-wide planning policies – goals, measurement
‒ Work with King County and peer cities to align regional strategies
Sustainability Plan ‒ Embed energy strategies in overall planning efforts
‒ Community Engagement

Thank you!