IsPOD DISTRICT REPORT - ONSLOW 10OCT01
17
ONSLOW COUNTY The North Carolina Alliance for Athletics, Health, Physical Education, Recreation, and Dance (NCAAHPERD), launched In-school Prevention of Obesity and Disease (IsPOD) in 2007. The initiative began with a grant from the NC Health and Wellness Trust Fund and was expanded with grants from the Blue Cross Blue Shield of North Carolina Foundation. The expansion to a state-wide program is supported by a $3.6 million grant from the Kate B. Reynolds Charitable Trust. NCAAHPERD is engaged with a large network of health and physical education groups seeking greater opportunities for a healthier and more creative North Carolina. IsPOD Data Results Spring 2010
-
Upload
north-carolina-alliance-for-athletics-health-physical-education-recreation-and-dance-ncaahperd -
Category
Documents
-
view
215 -
download
0
description
IsPOD Data Results Spring 2010 2010 NC IsPOD Evaluation All rights reserved.
Transcript of IsPOD DISTRICT REPORT - ONSLOW 10OCT01

2010 NC IsPOD Evaluation All rights reserved.
ONSLOW COUNTY
The North Carolina Alliance for Athletics, Health, Physical Education, Recreation,
and Dance (NCAAHPERD), launched In-school Prevention of Obesity and Disease (IsPOD) in 2007. The initiative began with a grant from the NC Health and Wellness Trust Fund and was expanded with grants from the Blue Cross
Blue Shield of North Carolina Foundation. The expansion to a state-wide program
is supported by a $3.6 million grant from the Kate B. Reynolds Charitable Trust. NCAAHPERD is engaged with a large network of health and physical education
groups seeking greater opportunities for a healthier and more creative North Carolina.
IsPOD DataResults
Spring 2010

2010 NC IsPOD Evaluation
Conducted by NCAAHPERD/NC DPH All rights reserved.
Onslow County
SPARK Training
Staff from Onslow County began receiving SPARK training in the 2008-2009
school year with the KBR Grant. Onslow County has 28 K-8 public schools. Of
these 28 schools, 25 schools (or 89%) have received SPARK training. At these
schools, a total of 38 PE teachers and 1 coordinators have been trained in
SPARK. Table 1 shows the Onslow County K-8 schools that have received
SPARK training and the number of staff trained. FitnessGram Response Rates
are also given for each of the K-8 schools.

2010 NC IsPOD Evaluation Conducte4d by NCAAHPERD/NC DPH
All rights reserved.
2
Table 1
Onslow County K-8 Schools
Schools with SPARK Training and FitnessGram Response Rates
ID School Name
DEMOGRAPHICS SPARK FITNESSGRAM
2009-2010 ADM
% Needy
SPARK Trained?
# Staff Trained
Using FG?
FG Response Rates
Grades 1-2
Grades 3-5
Grades 6-8
304 Bell Fork Elementary 509 59% YES 1 YES 0% 42% NA
308 Blue Creek Elementary 551 61% YES 2 YES 0% 94% NA
310 Carolina Forest Elementary 622 32% YES 2 YES 0% 96% NA
312 Clyde Erwin Elementary 429 64% YES 1 NO 0% 0% NA
314 Dixon Elementary 685 49% YES 2 NO 0% 0% NA
318 Dixon Middle 528 43% YES 1 NO NA NA 0%
321 Hunters Creek Elementary 536 61% YES 2 YES 0% 94% NA
322 Hunters Creek Middle 803 39% YES 1 NO NA NA 0%
323 Jacksonville Commons Elem 709 49% YES 3 YES 0% 79% NA
325 Jacksonville Commons Mid 662 49% NO 0 NO NA NA 0%
329 Meadow View Elementary 699 52% YES 1 NO 0% 0% NA
330 Morton Elementary 557 50% YES 1 YES 0% 32% NA
331 New Bridge Middle 489 53% YES 1 NO NA NA 0%
332 Northwoods Elementary 467 65% YES 3 YES 0% 96% NA
335 Queens Creek Elementary 623 53% YES 1 YES 0% 95% NA
336 Northwoods Park Middle 677 40% NO 0 NO NA NA 0%
337 Richlands Primary 677 40% YES 1 NO 0% NA NA
338 Parkwood Elementary 645 28% YES 1 YES 0% 95% NA
339 Richlands Elementary 669 54% NO 0 NO NA 0% NA
341 Sand Ridge Elementary 591 56% YES 1 YES 0% 97% NA
342 Silverdale Elementary 446 54% YES 1 YES 0% 96% NA
343 Southwest Elementary 741 57% YES 1 NO 0% 0% NA
345 Southwest Middle 519 51% YES 1 NO NA NA 0%
346 Summersill Elementary 528 45% YES 2 NO 0% 0% NA
347 Stateside Elementary 558 NA YES 1 YES 0% 95% NA
350 Swansboro Elementary 473 36% YES 3 YES 37% 96% NA
351 Swansboro Middle 846 39% YES 2 NO NA NA 0%
356 Trexler Middle 793 38% YES 2 NO NA NA 0%

2010 NC IsPOD Evaluation Conducted by NCAAHPERD/NC DPH
All rights reserved.
3
Onslow County
FitnessGram Response Rates
In spring 2010, 13 of the Onslow County K-8 schools, or 46%, conducted
FitnessGram assessments and submitted their data. Table 2 shows the
FitnessGram Response Rates by grade for all Onslow County K-8 schools
combined.

2010 NC IsPOD Evaluation Conducte4d by NCAAHPERD/NC DPH
All rights reserved.
4
Table 2
FitnessGram Response Rates
For 13 K-8 Schools in Onslow County
Grade 2009-2010
Average Daily Membership
FitnessGram Response Rate
Number of FG Student Ids
Percent of ADM
1st 2052 0 0%
2nd 1929 54 3%
3rd 2027 1148 57%
4th 1917 978 51%
5th 1925 1005 52%
6th 1846 0 0%
7th 1774 0 0%
8th 1697 0 0%
2010 NC IsPOD Evaluation Conducted by NCAAHPERD/NC DPH
All rights reserved.
5
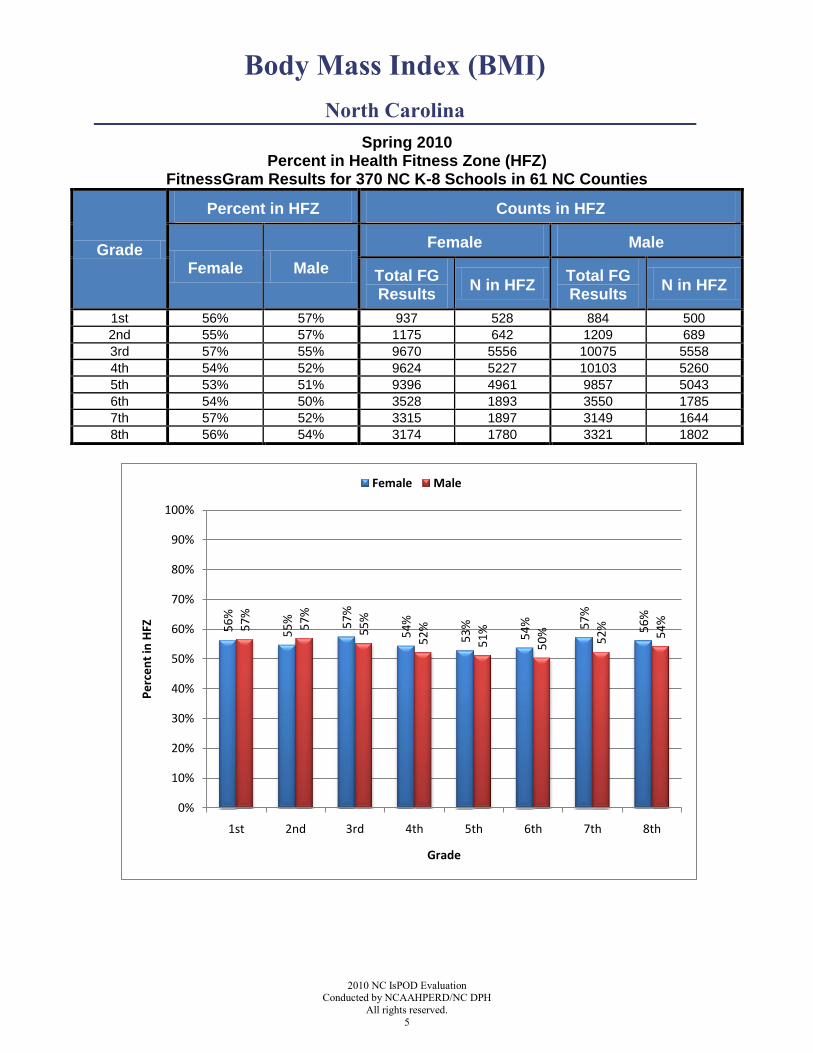
Body Mass Index (BMI)
North Carolina
Spring 2010 Percent in Health Fitness Zone (HFZ)
FitnessGram Results for 370 NC K-8 Schools in 61 NC Counties
Grade
Percent in HFZ Counts in HFZ
Female Male
Female Male
Total FG Results
N in HFZ Total FG Results
N in HFZ
1st 56% 57% 937 528 884 500
2nd 55% 57% 1175 642 1209 689
3rd 57% 55% 9670 5556 10075 5558
4th 54% 52% 9624 5227 10103 5260
5th 53% 51% 9396 4961 9857 5043
6th 54% 50% 3528 1893 3550 1785
7th 57% 52% 3315 1897 3149 1644
8th 56% 54% 3174 1780 3321 1802
56%
55% 57%
54%
53%
54% 57%
56%
57%
57%
55%
52%
51%
50%
52%
54%
0%
10%
20%
30%
40%
50%
60%
70%
80%
90%
100%
1st 2nd 3rd 4th 5th 6th 7th 8th
Pe
rce
nt
in H
FZ
Grade
Female Male

2010 NC IsPOD Evaluation Conducte4d by NCAAHPERD/NC DPH
All rights reserved.
6
Body Mass Index (BMI)
Onslow County
Spring 2010 Percent in Healthy Fitness Zone (HFZ)
FitnessGram Results for 13 K-8 Schools in Onslow County
Grade
Percent in HFZ Counts in HFZ
Female Male
Female Male
Total FG Results
N in HFZ Total FG Results
N in HFZ
1st NA NA 0 0 0 0
2nd 58% 72% 24 14 29 21
3rd 64% 67% 218 140 216 144
4th 59% 58% 161 95 186 107
5th 59% 56% 219 129 213 120
6th NA NA 0 0 0 0
7th NA NA 0 0 0 0
8th NA NA 0 0 0 0
58% 64%
59%
59%
72%
67%
58%
56%
0%
10%
20%
30%
40%
50%
60%
70%
80%
90%
100%
2nd 3rd 4th 5th
Pe
rce
nt
in H
FZ
Grade
Female Male
2010 NC IsPOD Evaluation Conducted by NCAAHPERD/NC DPH
All rights reserved.
7
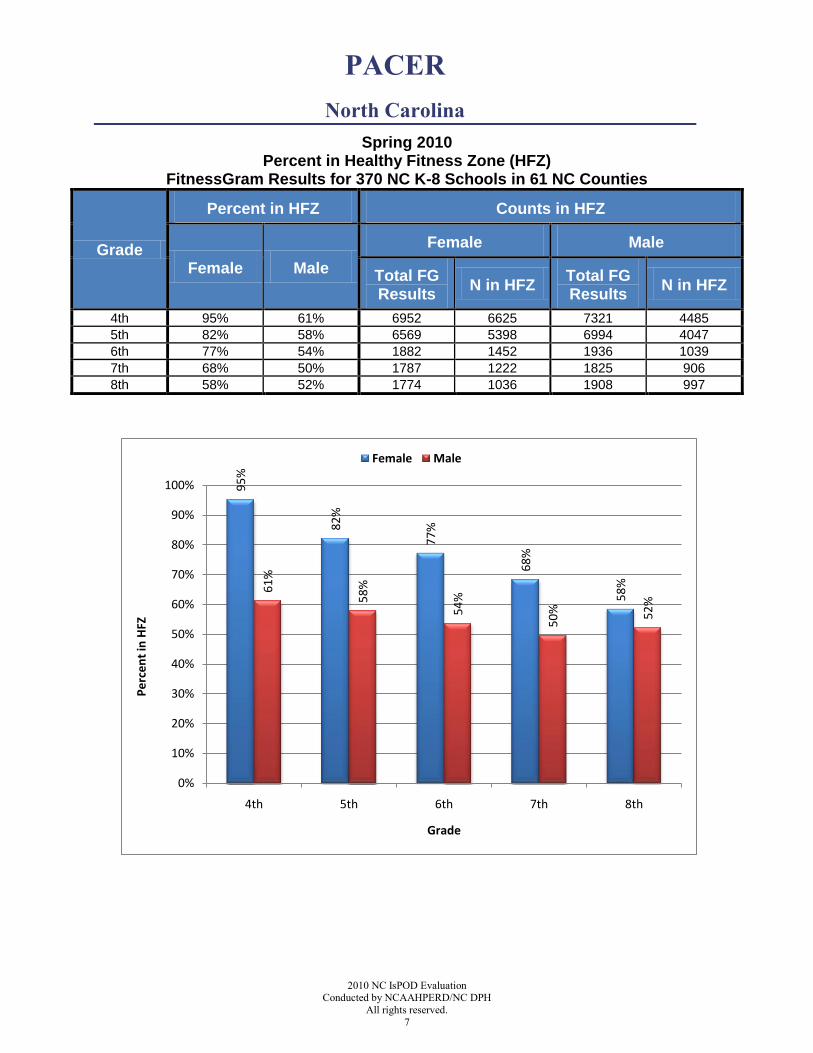
PACER
North Carolina
Spring 2010 Percent in Healthy Fitness Zone (HFZ)
FitnessGram Results for 370 NC K-8 Schools in 61 NC Counties
Grade
Percent in HFZ Counts in HFZ
Female Male
Female Male
Total FG Results
N in HFZ Total FG Results
N in HFZ
4th 95% 61% 6952 6625 7321 4485
5th 82% 58% 6569 5398 6994 4047
6th 77% 54% 1882 1452 1936 1039
7th 68% 50% 1787 1222 1825 906
8th 58% 52% 1774 1036 1908 997
95%
82%
77%
68%
58%61%
58%
54%
50% 52%
0%
10%
20%
30%
40%
50%
60%
70%
80%
90%
100%
4th 5th 6th 7th 8th
Pe
rce
nt
in H
FZ
Grade
Female Male

2010 NC IsPOD Evaluation Conducte4d by NCAAHPERD/NC DPH
All rights reserved.
8
PACER
Onslow County
Spring 2010 Percent in Healthy Fitness Zone (HFZ)
FitnessGram Results for 13 K-8 Schools in Onslow County
Grade
Percent in HFZ Counts in HFZ
Female Male
Female Male
Total FG Results
N in HFZ Total FG Results
N in HFZ
4th 94% 50% 16 15 24 12
5th 94% 52% 54 51 64 33
6th NA NA 0 0 0 0
7th NA NA 0 0 0 0
8th NA NA 0 0 0 0
94%
94%
50%
52%
0%
10%
20%
30%
40%
50%
60%
70%
80%
90%
100%
4th 5th
Pe
rce
nt
in H
FZ
Grade
Female Male

2010 NC IsPOD Evaluation Conducted by NCAAHPERD/NC DPH
All rights reserved.
9
CURL-UP
North Carolina
Spring 2010 Percent in Healthy Fitness Zone (HFZ)
FitnessGram Results for 370 NC K-8 Schools in 61 NC Counties
Grade
Percent in HFZ Counts in HFZ
Female Male
Female Male
Total FG Results
N in HFZ Total FG Results
N in HFZ
1st 83% 84% 917 759 879 742
2nd 78% 79% 1260 989 1300 1032
3rd 82% 82% 11285 9254 11683 9544
4th 80% 81% 11221 8954 11729 9512
5th 78% 80% 10865 8483 11370 9152
6th 86% 87% 3857 3316 3895 3373
7th 86% 87% 3477 2978 3427 2990
8th 84% 88% 3402 2869 3448 3029
83%
78% 82%
80%
78%
86%
86%
84%
84%
79% 82%
81%
80% 87%
87%
88%
0%
10%
20%
30%
40%
50%
60%
70%
80%
90%
100%
1st 2nd 3rd 4th 5th 6th 7th 8th
Pe
rce
nt
in H
FZ
Grade
Female Male

2010 NC IsPOD Evaluation Conducte4d by NCAAHPERD/NC DPH
All rights reserved.
10
CURL-UP
Onslow County
Spring 2010 Percent in Healthy Fitness Zone (HFZ)
FitnessGram Results for 13 K-8 Schools in Onslow County
Grade
Percent in HFZ Counts in HFZ
Female Male
Female Male
Total FG Results
N in HFZ Total FG Results
N in HFZ
1st NA NA 0 0 0 0
2nd 72% 55% 25 18 29 16
3rd 84% 83% 509 426 513 426
4th 79% 79% 398 316 439 349
5th 80% 84% 422 338 479 401
6th NA NA 0 0 0 0
7th NA NA 0 0 0 0
8th NA NA 0 0 0 0
72%
84%
79%
80%
55%
83%
79% 84%
0%
10%
20%
30%
40%
50%
60%
70%
80%
90%
100%
2nd 3rd 4th 5th
Pe
rce
nt
in H
FZ
Grade
Female Male
2010 NC IsPOD Evaluation Conducted by NCAAHPERD/NC DPH
All rights reserved.
11
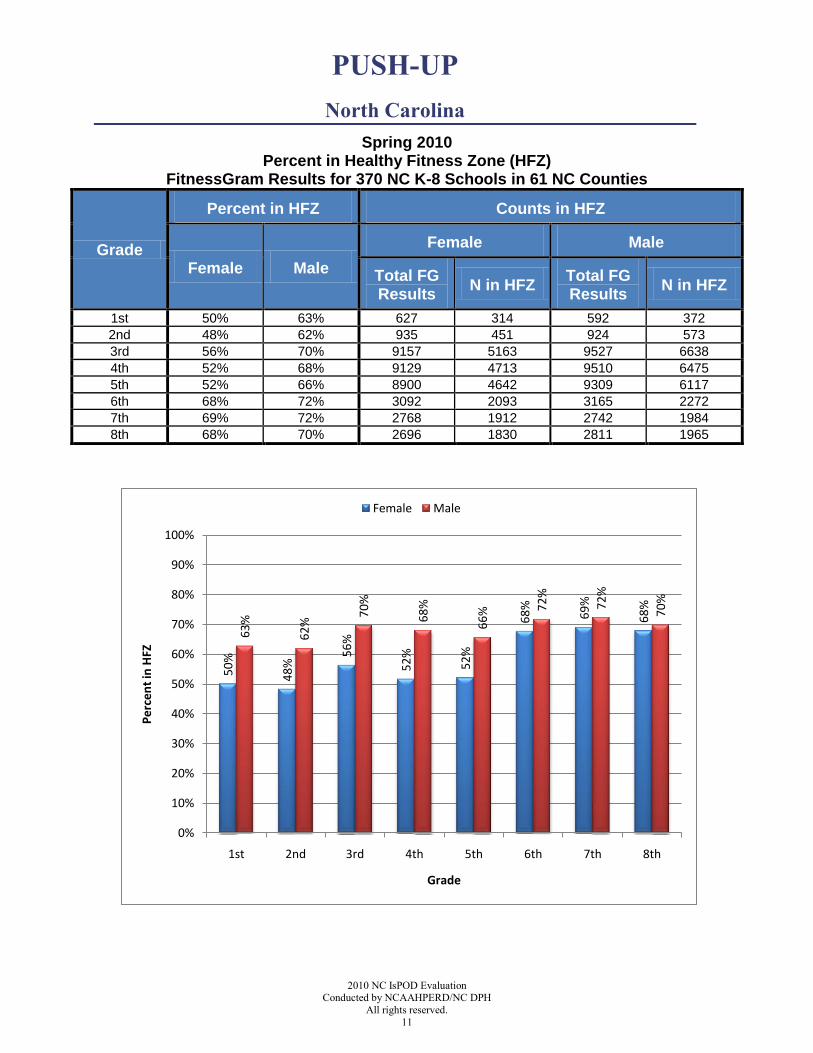
PUSH-UP
North Carolina
Spring 2010 Percent in Healthy Fitness Zone (HFZ)
FitnessGram Results for 370 NC K-8 Schools in 61 NC Counties
Grade
Percent in HFZ Counts in HFZ
Female Male
Female Male
Total FG Results
N in HFZ Total FG Results
N in HFZ
1st 50% 63% 627 314 592 372
2nd 48% 62% 935 451 924 573
3rd 56% 70% 9157 5163 9527 6638
4th 52% 68% 9129 4713 9510 6475
5th 52% 66% 8900 4642 9309 6117
6th 68% 72% 3092 2093 3165 2272
7th 69% 72% 2768 1912 2742 1984
8th 68% 70% 2696 1830 2811 1965
50%
48%
56%
52%
52%
68%
69%
68%
63%
62%
70%
68%
66% 72%
72%
70%
0%
10%
20%
30%
40%
50%
60%
70%
80%
90%
100%
1st 2nd 3rd 4th 5th 6th 7th 8th
Pe
rce
nt
in H
FZ
Grade
Female Male

2010 NC IsPOD Evaluation Conducte4d by NCAAHPERD/NC DPH
All rights reserved.
12
PUSH-UP
Onslow County
Spring 2010 Percent in Healthy Fitness Zone (HFZ)
FitnessGram Results for 13 K-8 Schools in Onslow County
Grade
Percent in HFZ Counts in HFZ
Female Male
Female Male
Total FG Results
N in HFZ Total FG Results
N in HFZ
1st NA NA 0 0 0 0
2nd 21% 52% 24 5 29 15
3rd 46% 61% 178 81 187 115
4th 43% 62% 130 56 156 97
5th 50% 63% 157 78 167 105
6th NA NA 0 0 0 0
7th NA NA 0 0 0 0
8th NA NA 0 0 0 0
21%
46%
43% 50%
52%
61%
62%
63%
0%
10%
20%
30%
40%
50%
60%
70%
80%
90%
100%
2nd 3rd 4th 5th
Pe
rce
nt
in H
FZ
Grade
Female Male

2010 NC IsPOD Evaluation Conducted by NCAAHPERD/NC DPH
All rights reserved.
13
SIT AND REACH
North Carolina
Spring 2010 Percent in Healthy Fitness Zone (HFZ)
FitnessGram Results for 370 NC K-8 Schools in 61 NC Counties
Grade
Percent in HFZ Counts in HFZ
Female Male
Female Male
Total FG Results
N in HFZ Total FG Results
N in HFZ
1st 66% 64% 702 460 664 423
2nd 68% 66% 922 629 935 618
3rd 70% 69% 6371 4486 6681 4581
4th 69% 65% 6229 4292 6596 4319
5th 62% 62% 6219 3839 6558 4060
6th 58% 58% 2371 1376 2445 1413
7th 66% 65% 2197 1447 2134 1382
8th 66% 67% 2131 1411 2247 1510
66% 68%
70%
69%
62%
58%
66%
66%
64% 66% 69%
65%
62%
58%
65% 67%
0%
10%
20%
30%
40%
50%
60%
70%
80%
90%
100%
1st 2nd 3rd 4th 5th 6th 7th 8th
Pe
rce
nt
in H
FZ
Grade
Female Male

2010 NC IsPOD Evaluation Conducte4d by NCAAHPERD/NC DPH
All rights reserved.
14
SIT AND REACH
Onslow County
Spring 2010 Percent in Healthy Fitness Zone (HFZ)
FitnessGram Results for 13 K-8 Schools in Onslow County
Grade
Percent in HFZ Counts in HFZ
Female Male
Female Male
Total FG Results
N in HFZ Total FG Results
N in HFZ
1st NA NA 0 0 0 0
2nd 80% 72% 25 20 29 21
3rd 64% 59% 442 282 440 261
4th 59% 55% 396 233 439 242
5th 51% 49% 434 220 480 234
6th NA NA 0 0 0 0
7th NA NA 0 0 0 0
8th NA NA 0 0 0 0
80%
64%
59%
51%
72%
59%
55%
49%
0%
10%
20%
30%
40%
50%
60%
70%
80%
90%
100%
2nd 3rd 4th 5th
Pe
rce
nt
in H
FZ
Grade
Female Male

2010 NC IsPOD Evaluation Conducted by NCAAHPERD/NC DPH
All rights reserved.
15
TRUNK LIFT
North Carolina
Spring 2010 Percent in Healthy Fitness Zone (HFZ)
FitnessGram Results for 370 NC K-8 Schools in 61 NC Counties
Grade
Percent in HFZ Counts in HFZ
Female Male
Female Male
Total FG Results
N in HFZ Total FG Results
N in HFZ
1st 91% 88% 744 680 746 659
2nd 91% 92% 1063 963 1056 971
3rd 93% 91% 10281 9572 10608 9648
4th 84% 80% 10205 8587 10688 8573
5th 81% 77% 9821 7973 10336 8001
6th 83% 79% 3438 2859 3361 2646
7th 82% 77% 3231 2656 3086 2364
8th 84% 79% 3136 2631 3161 2492
91%
91% 93%
84%
81%
83%
82%
84%88% 92%
91%
80%
77%
79%
77%
79%
0%
10%
20%
30%
40%
50%
60%
70%
80%
90%
100%
1st 2nd 3rd 4th 5th 6th 7th 8th
Pe
rce
nt
in H
FZ
Grade
Female Male

2010 NC IsPOD Evaluation Conducte4d by NCAAHPERD/NC DPH
All rights reserved.
16
TRUNK LIFT
Onslow County
Spring 2010 Percent in Healthy Fitness Zone (HFZ)
FitnessGram Results for 13 K-8 School in Onslow County
Grade
Percent in HFZ Counts in HFZ
Female Male
Female Male
Total FG Results
N in HFZ Total FG Results
N in HFZ
1st NA NA 0 0 0 0
2nd 88% 86% 24 21 29 25
3rd 94% 87% 155 145 151 131
4th 88% 77% 138 122 163 126
5th 79% 70% 154 122 181 126
6th NA NA 0 0 0 0
7th NA NA 0 0 0 0
8th NA NA 0 0 0 0
88% 94%
88%
79%
86%
87%
77%
70%
0%
10%
20%
30%
40%
50%
60%
70%
80%
90%
100%
2nd 3rd 4th 5th
Pe
rce
nt
in H
FZ
Grade
Female Male