Isotope hydrology and residence times of the … · Chemical Geology 157 !1999 . 303 Ð 317 Isotope...
15
Ž . Chemical Geology 157 1999 303–317 Isotope hydrology and residence times of the unimpounded Meramec River Basin, Missouri G.C. Frederickson, R.E. Criss ) Department of Earth and Planetary Sciences, Washington UniÕersity, St. Louis, MO 63130, USA Received 4 August 1998; revised 15 December 1998; accepted 15 December 1998 Abstract Strong isotopic forcing of hydrologic systems in eastern Missouri, caused by the large seasonal variations in the d 18 O values of meteoric precipitation, can be used to determine numerous characteristics of hydrologic systems including the residence time of the water. The normal annual average d 18 O value of meteoric precipitation in this region is about y6.9‰, but during the period June 1997–May 1998, which incorporates an El Nino event, the average d 18 O of precipitation was ˜ y9.4‰. Monthly averages are highly variable, ranging from y2.8‰ in August 1996 to y15.1‰ in January 1998, and define a cycloid-like annual pattern. This meteoric forcing gives rise to similar patterns of isotopic variation in springs and rivers, but with greatly reduced amplitudes. Thus the d 18 O variations for the precipitation have an amplitude exceeding 10‰, yet the annual amplitudes of the variations in the unimpounded Meramec and Big Rivers are only about 3‰, and the amplitudes of several karst springs, including the ‘first magnitude’ Maramec Spring, are even smaller at about 1‰. Most of the isotopic variation in streamflow can be explained by a simple exponential weighting of the preexisting rainfall events, such that the most recent precipitation more greatly influences the flow than earlier precipitation events, according to our formulation: d P e yt i rt Ý i i 18 d O s flow yt rt i P e Ý i where d and P are the d 18 O value and amount for a given rain event, t is the time interval between the storm and the i i i stream or spring sample, and t is the residence time. For the Meramec and Big Rivers, t takes on a value of close to 100 days, whereas it is 1–2 years for several springs. Smaller contributions with t on the order of 1–10 days are superimposed, representing the latest storm events. This method has a significant advantage over the standard mixing arguments for overland flow and baseflow contributions to hydrologic systems, in that it not only demonstrates the dominant contributions of ‘pre-event’ water in the systems, but it implicitly accounts for the variability of baseflow and also provides the approximate time scale for subsurface mixing. q 1999 Elsevier Science B.V. All rights reserved. Keywords: Stable isotopes; Rivers and streams; Springs; Precipitation; Residence time; Ozark mountains ) Corresponding author. Tel.: q1-314-935-7441; fax: q1-314-935-7361; e-mail: [email protected] 0009-2541r99r$ - see front matter q 1999 Elsevier Science B.V. All rights reserved. Ž . PII: S0009-2541 99 00008-X
Transcript of Isotope hydrology and residence times of the … · Chemical Geology 157 !1999 . 303 Ð 317 Isotope...

! .Chemical Geology 157 1999 303–317
Isotope hydrology and residence times of the unimpoundedMeramec River Basin, Missouri
G.C. Frederickson, R.E. Criss )
Department of Earth and Planetary Sciences, Washington UniÕersity, St. Louis, MO 63130, USA
Received 4 August 1998; revised 15 December 1998; accepted 15 December 1998
Abstract
Strong isotopic forcing of hydrologic systems in eastern Missouri, caused by the large seasonal variations in the d18Ovalues of meteoric precipitation, can be used to determine numerous characteristics of hydrologic systems including the
residence time of the water. The normal annual average d18O value of meteoric precipitation in this region is abouty6.9‰,but during the period June 1997–May 1998, which incorporates an El Nino event, the average d18O of precipitation was˜y9.4‰. Monthly averages are highly variable, ranging from y2.8‰ in August 1996 to y15.1‰ in January 1998, and
define a cycloid-like annual pattern. This meteoric forcing gives rise to similar patterns of isotopic variation in springs and
rivers, but with greatly reduced amplitudes. Thus the d18O variations for the precipitation have an amplitude exceeding
10‰, yet the annual amplitudes of the variations in the unimpounded Meramec and Big Rivers are only about 3‰, and the
amplitudes of several karst springs, including the ‘first magnitude’ Maramec Spring, are even smaller at about 1‰. Most of
the isotopic variation in streamflow can be explained by a simple exponential weighting of the preexisting rainfall events,
such that the most recent precipitation more greatly influences the flow than earlier precipitation events, according to our
formulation:
d P eyt irt" i i18d O sflow yt rtiP e" i
where d and P are the d18O value and amount for a given rain event, t is the time interval between the storm and thei i i
stream or spring sample, and t is the residence time. For the Meramec and Big Rivers, t takes on a value of close to 100days, whereas it is 1–2 years for several springs. Smaller contributions with t on the order of 1–10 days are superimposed,representing the latest storm events. This method has a significant advantage over the standard mixing arguments for
overland flow and baseflow contributions to hydrologic systems, in that it not only demonstrates the dominant contributions
of ‘pre-event’ water in the systems, but it implicitly accounts for the variability of baseflow and also provides the
approximate time scale for subsurface mixing. q 1999 Elsevier Science B.V. All rights reserved.
Keywords: Stable isotopes; Rivers and streams; Springs; Precipitation; Residence time; Ozark mountains
)Corresponding author. Tel.: q1-314-935-7441; fax: q1-314-935-7361; e-mail: [email protected]
0009-2541r99r$ - see front matter q 1999 Elsevier Science B.V. All rights reserved.! .PII: S0009-2541 99 00008-X

( )G.C. Frederickson, R.E. CrissrChemical Geology 157 1999 303–317304
1. Introduction
Most hydrologists and engineers have long held
that flood waters following storms are composed! .mostly of the rainwater e.g., Fetter, 1988 . Overland
flow, generated when the rainfall intensity surpasses! .the infiltration capacity of the basin Horton, 1933 ,
causes the river level to rise, promoting bank storage
that is argued to inhibit the flow of groundwater to
the stream channel. During recession, this stored
water is released and augments streamflow.
In contrast, geochemical studies indicate that
groundwater is a major component of river water,!even during peak flows Pinder and Jones, 1969;
.Fritz et al., 1974 . The increase in head caused by
rainwater infiltration forces more baseflow into the! .river channel Sklash and Farvolden, 1979 . Specific! .conductance Pilgram et al., 1979 has also been
used to determine that there is a large groundwater
component to flood waters. Chemical studies of
springs in Missouri found a significant groundwater!component to peak flow Dreiss, 1989; Vandike,
.1992 . In addition to groundwater and overland flow,
some workers have argued that river water contains a
significant soil water component even in times of!low flow Pionke and DeWalle, 1994; DeWalle and
.Pionke, 1994; Rose, 1996 .
Of particular interest here is the use of oxygen
and hydrogen isotopes to study river systems. Nu-!merous isotopic studies Mook et al., 1974; Fritz et
al., 1976; Sklash et al., 1976; Sklash and Farvolden,
1979; Hooper and Shoemaker, 1986; Pearce et al.,.1986 have found that storm runoff includes a large
fraction of groundwater. These studies have deter-
mined that 50–100% of river and spring waters
typically consist of baseflow, but estimates for this
fraction seem to depend not only on time, but on the
geochemical method employed, even in a single
hydrologic basin. Most of these studies use simple
mass balance arguments to separate flood water into! .fractions of ‘new’ water overland flow and ‘old’
! .water baseflow . This usually involves comparing
the d18O value of a spring or river with that of the!most recent rainfall e.g., Sklash et al., 1976; Hooper
.and Shoemaker, 1986 . The isotopic ratio of the
groundwater component is either assumed to be con-
stant, or the value for baseflow immediately prior to
a rain event is assumed to be identical to the ground-
water. The appropriate baseflow value is often esti-
mated by sampling the river or spring following an
extended dry period, when the river or spring dis-! .charge is at a minimum. Rose 1996 , though, deter-
mined that baseflow was isotopically more variable
than the local groundwater, was derived from a
shallow reservoir, and only had a minor component
of new rain water.
The mean residence times of water in spring and
river reservoirs have been determined using a tech-! .nique by Pearce et al. 1986 based on a model by
! .Maloszewski et al. 1983 . In this model the precipi-
tation input into the catchment is approximated by a
sine function with a period of one year. By applying
a convolution integral, a sinusoidal output function is
derived having a smaller amplitude, explaining the
lesser amounts of isotopic variation in rivers and
springs than in precipitation. The continuous func-
tion used for the input, though, is not a good approx-
imation for natural, sporadic rainfall patterns.
This paper presents the results of a 3-year stable
isotopic study of the rivers and springs of the Mer-
amec basin in east-central Missouri. We establish
that the seasonal variations in18O in the meteoric
precipitation of this region are very large, and use
our long-term database to determine the link between
meteoric forcing and derivative streamflow, in sev-
eral basin subsystems having different scales. Our
data show that the isotopic values of baseflow are
variables that critically depend on the residence times
established by a new streamflow model.
2. Hydrology of the Meramec Basin
2.1. Regional geology and geomorphology
The 10,300-km2 Meramec River Basin is located
in east central Missouri on the northeastern flank of! .the Ozark Dome Fig. 1 . The basin includes the
main branch of the Meramec River and two large
tributaries, the Bourbeuse River in the north and the
Big River in the southeast. Along its tortuous, 354
km length the Meramec River undergoes a vertical
fall of 312 m, ultimately to join the Mississippi River
just south of St. Louis. The rivers of the basin flow
through deeply entrenched river valleys with steep

( )G.C. Frederickson, R.E. CrissrChemical Geology 157 1999 303–317 305
Fig. 1. Map of the Meramec River basin showing the rivers and the sampling locations. The Meramec and Big Rivers were sampled near! . ! .Eureka, MO points A and B . The two sampling sites are located just upstream of the confluence of the two rivers at mile 37.1 59.7 km
! . ! .on the Meramec River. Rockwoods Spring R is located to the north of Eureka at Rockwoods Reservation. Maramec Spring M is located! . ! .at Maramec Springs Park in the Upper Meramec basin. Precipitation was sampled in Ladue L and at Washington University W , both
located within the St. Louis metropolitan area.
canyon walls, except for the Bourbeuse River located
among broad rolling hills.
The Meramec River originates in heavily-tim-
bered regions of the Ozarks that are mostly underlain
by lower Paleozoic dolostones, sandstones, and lime-
stones surrounding a small core of Precambrian gran-
ites. Cambrian and Lower Ordovician dolostones and
sandstones are exposed in the southern and western
parts of the basin, and Middle Ordovician, Upper
Ordovician, and Mississippian dolostones, lime-
stones, and sandstones are exposed in the northeast
part of the basin closest to St. Louis, MO. Excep-
tionally, rocks of the Bourbeuse River subbasin in-
clude a high proportion of Pennsylvanian clays,
shales, and limestones.
The Paleozoic carbonate rocks of the basin have
developed numerous karst features, especially caves
and springs. Abundant modern sinkholes are not very
common, though there are many filled sinks and
other paleokarst features which often can become! .reactivated Bretz, 1953 . These filled sinks contain
valuable deposits of hematite, diaspore, and other! .minerals Grawe, 1945 .
The rivers of the Meramec basin have a mainly
dendritic surface drainage pattern, an uncommon
feature of karst systems where subsurface flow dom-
inates the hydrology. The direction of river flow in
the basin is highly asymmetric due to the presence of
the Ozark Dome to the south. Almost all of the rivers
and streams in the basin flow northward, but the

( )G.C. Frederickson, R.E. CrissrChemical Geology 157 1999 303–317306
Bourbeuse River and the main branch of the Mer-
amec River flow to the northeast. Even though the
rivers are deeply entrenched in steep-sided valleys,
they have well developed meanders, as is common
for Ozark river systems.
2.2. Precipitation
The Meramec River basin receives an average of! .about 100"5 cm 40"2 in. of rainfall per year.
This precipitation is evenly spread out over the
course of the year, with each month typically receiv-
ing significant rainfall of approximately 7.6"2.5! .cm 3"1 in. . Precipitation samples for isotopic
analysis were collected at two sites in the St. Louis
metropolitan area, one on the campus of Washington
University and the other at Ladue, located near a
high hilltop about 10 km west of Washington Uni-! .versity Fig. 1 . Samples from the Washington Uni-
versity rain gauge were first collected in September
1996, and sampling of the Ladue rain gauge has been
practically continuous since June 1995. During the
time period when the Ladue rain gauge was in
operation it received on average 15% more rainfall
per month than the official National Weather Service
station located in St. Louis. The Washington Univer-
sity rain gauge received only slightly less rainfall
than the Ladue gauge, and overall the monthly totals
for both rain gauges were similar. The most rainfall! .received at the Ladue rain gauge, 24.4 cm 9.62 in. ,
!was received in April, 1996 but only 1.17 cm 0.46.in. of rainfall was recorded in July, 1997. St. Louis
receives little snowfall, and the snow tends to melt
quickly after it accumulates. In the winter of 1997!the Ladue rain gauge collected 4.3 cm 1.7 in.;
.rainfall equivalent of snow, and in the winter of! .1998 it received less than 2.5 cm 1 in. of rainfall
equivalent snowfall.
2.3. RiÕer hydrology
A unique feature of the Meramec River basin is
that no significant engineering works such as im-
poundments or channelization modifications have
been made on the rivers despite two Army Corps of
Engineer projects that proposed the construction of! .several large dams Jackson, 1984; Ruddy, 1992 . As
a result, the rivers of the basin still respond to
rainfall events in a practically natural, unmodified
fashion. Land use patterns vary across the basin with
the main stem of the Meramec river having heavily
timbered land, with the Big River basin being heav-
ily impacted by lead mining, with a large proportion
of agricultural land in the Bourbeuse River subbasin,
and with a great increase in urbanization toward the
mouth of the Meramec River.
One important consequence of the free-flowing,
unmodified nature of the Meramec River channel is
that the variations in flow rates are much larger than
for controlled rivers in zones of moderate rainfall.
Thus, while the average Meramec River flow is 91.83 ! .m rs 3244 cfs , discharge at the Eureka gauging
3 ! .station has varied from 4955 m rs 175,000 cfs
during the destructive flood of August 1915 to the3 ! .low of 5.55 m rs 196 cfs set in August 1936,
representing nearly a factor of 1000 difference for!the same month see United States Geological Sur-
.vey, 1986 .
Samples of the Meramec and Big Rivers were! .collected near Eureka, MO Fig. 1 . The Meramec
River was sampled 2 km upstream of the confluence
with the Big River starting in February, 1995. The
Big River was sampled 0.6 km upstream of the
confluence with the Meramec River starting in Au-
gust, 1995.
2.4. Spring hydrology
The Meramec basin contains over 90 significant! .springs Vineyard and Feder, 1974 , including
!Maramec Spring near St. James, Fig. 1; Maramec.Spring Quadrangle, T37N, R6W, Sec. 1 , one of
only 75 ‘first magnitude’ springs in the United States! .Meinzer, 1927; Ferguson et al., 1947 . Maramec
Spring issues from a cliff of the Lower Ordovician
Gasconade Formation composed of a thickly bedded
crystalline dolostone, and has an average flow of3 ! .4.08 m rs 144 cfs .
!Also sampled was Rockwoods Spring Eureka.Quadrangle; T44N, R3E, Sec. 14 , a moderate-sized
spring located at Rockwoods Reservation to the north! .of Eureka, Fig. 1 . Rockwoods Spring issues from
an outcrop of the Upper Ordovician Plattin Forma-
tion, the stratigraphically lowest limestone unit in
east central Missouri. Our discharge estimates for
Rockwoods Spring range from approximately 0.015

( )G.C. Frederickson, R.E. CrissrChemical Geology 157 1999 303–317 307
3 ! .to 0.3 m rs 0.5–10 cfs . This spring was sampled
at weekly to monthly intervals starting in March,
1996.
3. Methods
Precipitation samples were collected from rain
gauges located in Ladue and at Washington Univer-! .sity Fig. 1 . Precipitation was usually collected im-
mediately following storm events in order to prevent
evaporation. All precipitation for each half month
time period was mixed together, and analyzed as a
semi-monthly composite. In selected cases individual
storm events were also analyzed, but unless other-
wise stated, all precipitation data graphed or dis-
cussed in this report refer to the semi-monthly com-
posites.
Spring and river samples as well as the precipita-
tion samples were collected in small borosilicate
glass bottles with polyseal caps that prevent evapora-
tion. Most spring samples were collected from as
close to the spring mouth as possible by placing the
bottle directly in the water. Meramec River and Big
River samples were usually collected by lowering a
plastic bucket from the center of a bridgespan, with
an aliquot transferred to a glass bottle.
The oxygen isotopes of the water samples were
measured using the standard CO equilibration2
! .method Epstein and Mayeda, 1953 , using an auto-
matic line interfaced with an isotope ratio mass
spectrometer. Hydrogen isotope ratios were mea-!sured using the zinc reduction method Coleman et
.al., 1982 . The results are reported in the usual
d-notation relative to Standard Mean Ocean Waterw x ! .SMOW Craig, 1961 . Precision in our laboratory
is "0.1‰ for oxygen and "2‰ for hydrogen. Data
for more than 1000 samples used in this study are! .tabulated by Frederickson 1998 .
4. Variation of stable isotopes in Missouri
4.1. Oxygen isotopes in precipitation
The weighted average d18O value for precipita-
tion collected at Ladue during the 3-year study pe-! .riod is y7.7‰ see Table 1 , but the isotopic values
for rainfall can vary greatly over the course of a
year, even on short timescales. For example, a 6.4-cm! .2.5 in. rainstorm on November 27, 1996 had a
d18O value of y13.2‰, but 2 days later a 0.8-cm! .0.3 in. rainfall had a value of y6.8‰. Theseextreme variations in d18O values facilitate isotopic
! .hydrograph separation Sklash and Farvolden, 1979 ,
and make the St. Louis area an ideal place to study
hydrologic systems.
The hydrologic systems under consideration may
be usefully related to semi-monthly precipitation
composites, which eliminates the need to separately
analyze very small rain events, and provides some
smoothing of short term variations while retaining
the seasonal isotopic pattern of the precipitation. Fig.
2 is a graph of d18O values for half-month rain
composites collected at the Ladue and Washington
University rain gauges. During this time isotopic
Table 1
Average d18O values in the Meramec basina cDate Precipitation Meramec Rockwoods Maramec Wells
b c cRiver Spring Spring
! .June 1995–May 1996 y6.9 y6.2 y5.7 y6.8! .June 1996–May 1997 y7.4 y6.6 y7.1 y7.4 y6.6 y6.9! .June 1997–May 1998 y9.4 y7.1 y8.5 y7.7 y6.9 y6.9! .Average y7.7 y6.7 y7.4 y7.5 y6.8 y6.9
aVolumetrically weighted average precipitation at Ladue.b ! .Simple average, followed by discharge weighted average estimated in parentheses.cSimple averages.
( )G.C. Frederickson, R.E. CrissrChemical Geology 157 1999 303–317308
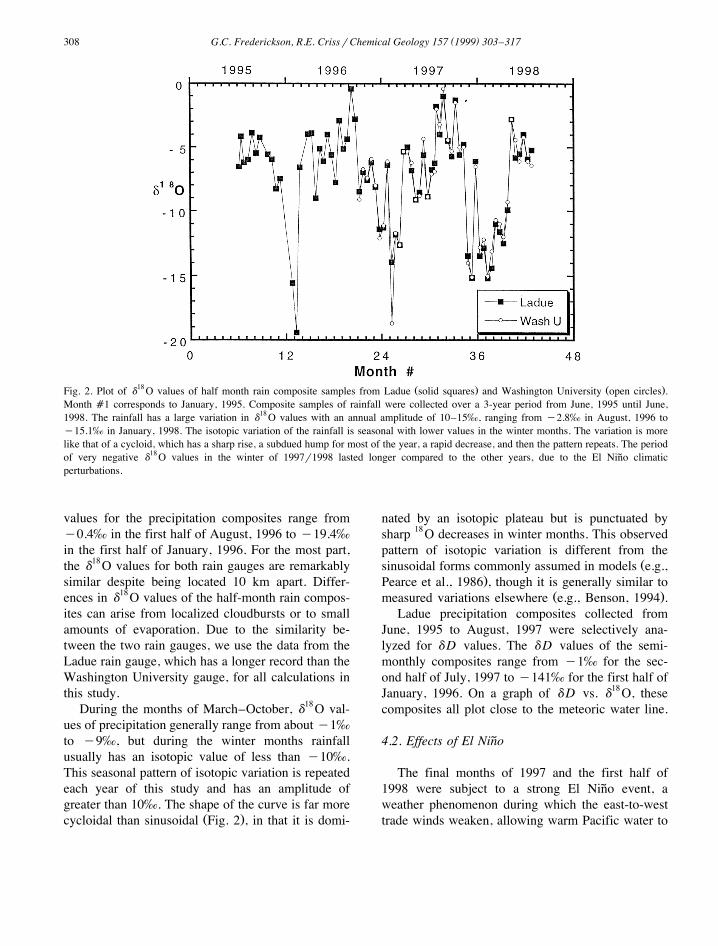
18 ! . ! .Fig. 2. Plot of d O values of half month rain composite samples from Ladue solid squares and Washington University open circles .
Month a1 corresponds to January, 1995. Composite samples of rainfall were collected over a 3-year period from June, 1995 until June,
1998. The rainfall has a large variation in d18O values with an annual amplitude of 10–15‰, ranging from y2.8‰ in August, 1996 to
y15.1‰ in January, 1998. The isotopic variation of the rainfall is seasonal with lower values in the winter months. The variation is more
like that of a cycloid, which has a sharp rise, a subdued hump for most of the year, a rapid decrease, and then the pattern repeats. The period
of very negative d18O values in the winter of 1997r1998 lasted longer compared to the other years, due to the El Nino climatic˜perturbations.
values for the precipitation composites range from
y0.4‰ in the first half of August, 1996 toy19.4‰in the first half of January, 1996. For the most part,
the d18O values for both rain gauges are remarkablysimilar despite being located 10 km apart. Differ-
ences in d18O values of the half-month rain compos-ites can arise from localized cloudbursts or to small
amounts of evaporation. Due to the similarity be-
tween the two rain gauges, we use the data from the
Ladue rain gauge, which has a longer record than the
Washington University gauge, for all calculations in
this study.
During the months of March–October, d18O val-
ues of precipitation generally range from abouty1‰to y9‰, but during the winter months rainfall
usually has an isotopic value of less than y10‰.This seasonal pattern of isotopic variation is repeated
each year of this study and has an amplitude of
greater than 10‰. The shape of the curve is far more! .cycloidal than sinusoidal Fig. 2 , in that it is domi-
nated by an isotopic plateau but is punctuated by
sharp18O decreases in winter months. This observed
pattern of isotopic variation is different from the!sinusoidal forms commonly assumed in models e.g.,
.Pearce et al., 1986 , though it is generally similar to! .measured variations elsewhere e.g., Benson, 1994 .
Ladue precipitation composites collected from
June, 1995 to August, 1997 were selectively ana-
lyzed for dD values. The dD values of the semi-
monthly composites range from y1‰ for the sec-
ond half of July, 1997 toy141‰ for the first half of
January, 1996. On a graph of dD vs. d18O, thesecomposites all plot close to the meteoric water line.
4.2. Effects of El Nino˜
The final months of 1997 and the first half of
1998 were subject to a strong El Nino event, a˜weather phenomenon during which the east-to-west
trade winds weaken, allowing warm Pacific water to

( )G.C. Frederickson, R.E. CrissrChemical Geology 157 1999 303–317 309
pile up along the west coast of South America.
Warm, humid air rises up generating thunderstorms
and shifting the positions of the jet streams. In North
America the jet stream normally is located over the
center of the United States, but during an El Nino˜winter the jet stream splits into two branches, one
located over the United States–Canada border and
the other over the southern United States.
El Nino had a large impact on the stable isotope˜ratios of Missouri precipitation. From mid October,
1997 to mid March, 1998 almost all of the precipita-
tion had d18O values of less than y10‰. Thisaccounted for over half of the rain that fell in the St.
Louis area from June 1997 to May 1998. For com-
parison, during the previous year only approximately
20% of rainfall in the St. Louis area had d18O valuesless thany10‰. The average d18O value of precipi-tation in the Meramec basin is about y6.9‰ based
on deep groundwater samples from wells. From June
1995 to May 1996 precipitation had a volumetri-
cally-weighted average d18O value of y6.9‰, andfrom June 1996 to May 1997 the value was y7.4‰! .Table 1 . During the next year, specifically from
June 1997 to May 1998, the weighted average d18Ovalue of the precipitation was y9.4‰, demonstrat-ing the large difference between normal rainfall and
precipitation during the El Nino year. A similar˜pattern is seen in the river and spring samples,
though the amount of the decrease in average d18Ovalues is less extreme for the rivers and springs.
The large amount of depleted rainfall during the
winter of 1997r1998 greatly affected the river and! .spring isotopic values Fig. 3 . As will be seen
below, the d18O values for the Meramec River dur-
ing 1995, 1996, and 1997 trace out similar annual
curves. At the beginning of 1998, though, there was
a major deviation, when the river d18O values
dropped sharply and remained low for several months
before recovering to similar values as previous years.
4.3. Oxygen isotopes in riÕers of the Meramec basin
The Big and Meramec Rivers exhibit far less18 !d O variation than the precipitation composites Fig.. 184 . The annual amplitude of d O variation in the
18 ! . ! .Fig. 3. Plot of the variation of d O values for the Meramec River over the course of several years; 1995 triangles , 1996 circles , 1997! . ! .diamonds , and 1998 squares . In normal years the isotopic values of the river follow the same cycloid-like pattern. An exception is in
early 1998 during which there was a substantial decrease in river d18O values before recovering to near normal values. A dry summer andfall followed by a wet and isotopically depleted El Nino winter skewed the isotopic average of the river reservoir to more negative values.

( )G.C. Frederickson, R.E. CrissrChemical Geology 157 1999 303–317310
18 ! . 18Fig. 4. Comparison of the d O values of half month rain composites from Ladue solid line, from Fig. 2 with the d O values of the
! . ! .Meramec River solid triangles and Big River open triangles . Day a1 corresponds to January 1, 1995. The rivers have a similar pattern ofisotopic variation as does Missouri precipitation, but with a more subdued amplitude. The precipitation composites have an annual variation
of greater than 10‰, but the amplitude of the river isotopic values is on the order of 3–5‰.
rivers is only on the order of 3–5‰, but the rainfall
composites generally vary by more than 10‰ during
the course of a year. For the Meramec River during
the 3-year study period, the most extreme d18Ovalues werey5.2‰ on April 29, 1996 andy10.8‰on March 21, 1998, representing a total difference of
only 5.6‰ for individual samples. Similarly, the Big
River ranged only from y4.5‰ on June 22, 1997 to
y10.4‰ on March 21, 1998. In short, these varia-
tions are much smaller than observed in the precipi-
tation composites, which in turn are even smaller
than those for individual storm events.
Though different in amplitude, the d18O values ofthe two rivers trace out a similar annual pattern to
that of precipitation. Specifically, all these sample
sets have higher d18O values in the summer months
and more depleted values in the winter months.
There is usually little delay between rainfall events
and the isotopic response of the rivers. For example,
during the second half of January, 1997 there was 5! . 18
cm 2 in. of meteoric precipitation with a d O
value of y11.8‰. The d18O value of the Meramec
River shifted from y6.9‰ at mid-month to y9.0‰
near the end of the month, while the Big River
shifted from y6.9‰ to y8.9‰. An exception tothis occurred during the winter of 1997r1998, dur-ing which the two rivers did not respond to the
depleted rainfall until the end of December, almost 2
months after the period of depleted precipitation
began. It is possible that the dry summer and fall of
1997, altered the hydrologic characteristics of the
river catchments, delaying the incorporation of the
depleted rainwater in the river groundwater reser-
voirs.
As discussed above, during the El Nino fall and˜winter, specifically, from mid October, 1997 to mid
! .March, 1998 more than 50 cm 20 in. of consecu-
tive precipitation events had an average d18O value
of y13.2‰. During this 5-month period the d18Ovalue of the Meramec River changed only from
y6.1‰ to y10.8‰, while the Big River shiftedonly from y5.7‰ to y10.4‰. Even though thistotal variation of 4.7‰ for both rivers is larger than
the approximately 3‰ decrease that occurred the
previous winter, the isotopic value of the most ex-
treme river samples did not even reach the average

( )G.C. Frederickson, R.E. CrissrChemical Geology 157 1999 303–317 311
value of y13.2‰ for the winter precipitation, and
these values were much higher than the most de-!pleted individual precipitation events e.g., y21.3,
.y27.7‰ that were analyzed during this period.
This demonstrates the inertia of these systems, and in
particular, the large groundwater contributions to the
rivers. Had overland flow dominated the flood wa-
ters, then the rivers would necessarily have shifted to
much lower d18O values approximating that of the
precipitation. Our estimates for the groundwater con-
tribution to the rivers varies from approximately
50% during rising stormflow to essentially 100%! .during low flow baseflow .
4.4. Oxygen isotopes in Missouri springs
The annual patterns of oxygen isotope variations
for Rockwoods Spring and Maramec Spring are sim-
ilar to those of the precipitation and the rivers, but! . 18
with even smaller amplitudes Fig. 5 . The d O
values of Rockwoods Spring varied only from
y6.6‰ on August 16, 1997 to y9.2‰ on February
12, 1998. Maramec Spring has even less variation,
ranging from y6.3‰ on June 12, 1996 to y8.4‰on March 14, 1998. Thus, the amplitude of the
variation for these springs is about 1–2‰ compared
to more than 10‰ for the rainfall composites, and
3–5‰ for the rivers.
The isotopic variations for these springs share the
overall, cycloid-like shape as the precipitation, with
higher d18O values during the summer and fall
months and excursions to more negative values dur-
ing the winter months. The d18O values of Rock-
woods Spring vary in phase with those for the
precipitation, in that the spring d18O values decreaseat the same time as the first depleted winter rainfall.
However, during the period of depleted rainfall in
the winter of 1997r1998, Maramec Spring did notshift in isotopic value for almost 2 months, thus
exhibiting a similar response to the rivers.
During the period of abundant but unusually de-
pleted rainfall from mid October, 1997 to mid March,
1998 the d18O value of Rockwoods Spring decreasedfrom y7.2‰ to y9.4‰, while Maramec Springchanged only from y6.6‰ to y8.4‰. Thus, the
18 ! . 18Fig. 5. Comparison of the d O values of half month rain composite samples from Ladue solid line, from Fig. 2 and d O values of
! . ! .Rockwoods Spring diamonds and Maramec Spring circles . Day a1 corresponds to January 1, 1995. As with the river samples, the springd18O values have a similar pattern to precipitation, but with a much more subdued amplitude. The amplitude of annual isotopic variation forprecipitation is over 10‰, but only 1–2‰ for the springs.

( )G.C. Frederickson, R.E. CrissrChemical Geology 157 1999 303–317312
springs decreased by only about 2‰ during this very
unusual period.
5. Damped average model
Many previous isotopic studies have used simple
mass balance equations to separate components of
river or spring discharge. When using these mass
balance equations, the d18O value of the groundwa-
ter is usually assumed to be constant. This is com-
monly realistic for deep groundwaters. For example,
wells east of Eureka that extend 100 m downward to
the St. Peter Sandstone yield waters that have con-
stant d18O values of y6.9‰.Such models are not very realistic for the hydro-
logic systems we have investigated. One problem is
that the springs and rivers of the Meramec basin are
mostly supplied by shallow groundwater reservoirs
that are clearly influenced by the amount and iso-
topic character of the previous rainfall events.
Specifically, the isotopic variability of the baseflow
that is evident in Fig. 3 is due to the vagaries of the
weather as well as to the residence times of the water
in the source reservoirs. Another problem with sev-
eral existing models is that the rainfall variations are
represented as sine functions which can be mathe-
matically integrated to determine the residence time
of rainwater in a system. As seen in Fig. 2, the d18Ovariations for precipitation in Missouri are not sinu-
soidal, but instead are more like a cycloid. More-
over, models based on continuous mathematical
functions do not account for the sporadic nature of
rainfall.
In view of these difficulties, we have developed a
new model that relates the isotopic values of the
springs and rivers to the weighted average of previ-
ous precipitation events. The weighting factor is
assumed to be the amount of precipitation multiplied
by an exponential function which in effect ‘damps
out’ the precipitation in such a way that the more
recent rainfall events factor more into the average
than older rainfall events. The equation is:
d P eyt irt" i i18d O s 1! .flow yt rtiP e" i
where d and P are the d18O value and amount fori i
a given rain event, t is the time interval between thei
storm date and the sampling date of the spring or
river, and t is a time constant. The changes in the
time constant, t , effectively result in the incorpora-tion of different rainfall periods into the average. A
large time constant would indicate that the ground-
water that supplies the baseflow for a spring or river
has been mixed over a long period of time. For such
a system, the isotopic variation would be strongly
muted, as is the case for deep groundwaters. In! .contrast, a spring or river with a short few days
time constant would have d18O values that are essen-tially identical to that of the most recent precipita-
tion. Therefore, as the time constants increase, the
amplitude of isotopic variations decrease in an ap-
proximately inverse manner, resulting in progres-
sively subdued d18O variations seen in the particularhydrologic system. A shown below, the above for-
mula can be used to deduce the average residence
time of rain water in the spring or river reservoir.! .Eq. 1 is only for a one component system, but
additional components, each with its own time con-
stant, can be added to the equation:
d P eyt irtA" i i18d O sXflow A yt rti Ad e" i
d P eyt irt B" i iqX q . . . 2! .B yt rti Bd e" i
where d and P are the d18O value and amount fori i
a given rain event, t is the time interval between thei
storm and the sample, t is a time constant for each! .component A, B, etc. , and the x are the fractionali
contributions, such that " x s1. An undesirable fea-i
ture is that each new component adds two additional
variables to the equation, the relative amount and the
time constant of that component. Two or more terms
are probably necessary for many systems, such as
flashy cave springs associated with sinkhole plains,
where very short-term pulses are superimposed on
longer-term baseflow. It is even likely for such
systems that the fraction of the flashy component is
itself a variable, rather than a constant.

( )G.C. Frederickson, R.E. CrissrChemical Geology 157 1999 303–317 313
5.1. Significance of the time constant
! .As the value for t in Eq. 1 approaches infinity,! .the exponential terms approach unity, and Eq. 1
reduces to the elementary formula giving the volu-
metrically-averaged isotopic value of the rainfall. For
such a system, the calculated d18O value is the sameas that of a very large vessel that mixed all rainfall
over a very long period, as is the case for deep
groundwater. Alternatively, as t becomes very small,the damping becomes so severe that only the most
recent rain event will have any significance, repre-
senting the condition of domination of the hydro-
logic system by overland flow.
For real hydrologic systems in temperate regions,
the quantity of flowing surface water at any instant is
generally small compared to the contents of the
associated groundwater reservoir. Over an appropri-
ately long interval, it is necessary that the volume of
water in such a subsurface reservoir is constant, with
rainfall inputs matching the groundwater contribu-
tion to streamflow. For a well-mixed, constant-
volume system, it is easy to show that any perturba-
tion in the stable isotope value will recover exponen-
tially over time. The mathematical problem is the
same as that of a well-stirred lake of constant vol-
ume, with negligible evaporation but with equal! ! .inflow and outflow rates e.g., see Eq. 4.43b of
.Criss, 1999 . This is a useful conceptual model, for it
is evident that the average residence time of the
water in such a lake is equal to its volume divided by
the inflow, a ratio that is identical to the time
constant t of the system. In problems of radioactivedecay, the analogous exponential factor is equal to
!the mean life of the decaying atoms e.g., see Eq.! . . ! .4.12 of Faure, 1986 , and in Eq. 1 , the time
constant t corresponds to the mean residence time ofwater in the groundwater reservoir of interest.
! .Because Eq. 1 is a simple model with only one
free parameter, it cannot incorporate all the possible
complexities of varied natural systems. Such com-
plexities include seasonal differences in the effi-
ciency or timing of groundwater recharge that would
arise from factors such as preferential evapotranspi-
18 ! . ! .Fig. 6. Graph of the measured d O values vs. time for the Meramec River solid triangles and the Big River open triangles compared to18 ! ! ..the calculated d O values of the rivers Eq. 1 using a time constant, t of 100 days. The calculation closely simulates the variation and
amplitude of the measured d18O values. However, the calculated curve predicts lighter d18O values than observed during the summer 1997,possibly due to evaporation.
( )G.C. Frederickson, R.E. CrissrChemical Geology 157 1999 303–317314
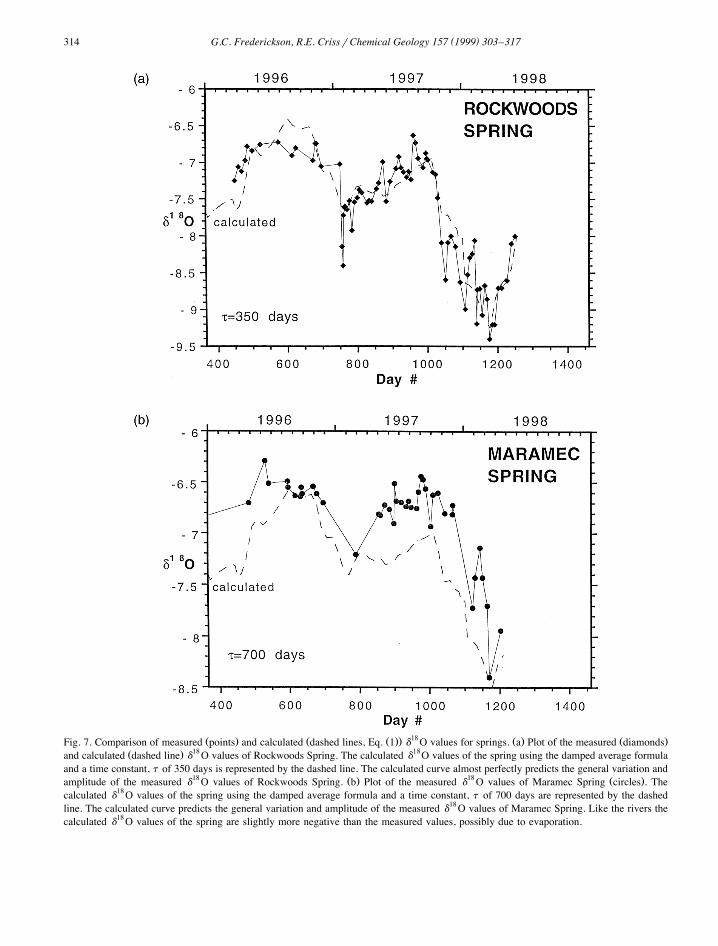
! . ! ! .. 18 ! . ! .Fig. 7. Comparison of measured points and calculated dashed lines, Eq. 1 d O values for springs. a Plot of the measured diamonds! . 18 18
and calculated dashed line d O values of Rockwoods Spring. The calculated d O values of the spring using the damped average formula
and a time constant, t of 350 days is represented by the dashed line. The calculated curve almost perfectly predicts the general variation and18 ! . 18 ! .amplitude of the measured d O values of Rockwoods Spring. b Plot of the measured d O values of Maramec Spring circles . The
calculated d18O values of the spring using the damped average formula and a time constant, t of 700 days are represented by the dashedline. The calculated curve predicts the general variation and amplitude of the measured d18O values of Maramec Spring. Like the rivers thecalculated d18O values of the spring are slightly more negative than the measured values, possibly due to evaporation.

( )G.C. Frederickson, R.E. CrissrChemical Geology 157 1999 303–317 315
ration in summer, or snow melt in spring. Moreover,
flow components such as ‘interflow’ and ‘delayed
return flow’ are not distinguished in this model,
though theoretically, any number of such compo-
nents, each having its own residence time, could be! .independently treated through the use of Eq. 2 .
Last, while an exponential model for groundwater
residence has the advantages of conceptual and com-
putational simplicity, other mathematical models are
possible. Perhaps the best justification for the use of! .Eq. 1 is that it provides a very useful simulation of
the measured d18O values of the hydrologic systemswe investigated, with a minimum of free parameters,
as demonstrated below.
5.2. Application of model to springs and riÕers inMissouri
! ! ..Using the damped average formula Eq. 1 , the
d18O values of the rivers and springs in the Meramec!basin can be calculated from rain gauge data Figs. 6
.and 7a,b . As can be inferred from the different
amplitudes of river and spring variations, the average
residence times for the rivers and springs differ
significantly. The Meramec River and Big River
have time constants of about 100 days, but Rock-
woods Spring has a time constant on the order of a
year. Maramec Spring has even less variation than
Rockwoods Spring, and consequently has an esti-
mated time constant approaching two years.
Given the above-stated time constants for the
various systems, the curves calculated from the rain
gauge data have similar d18O values and amplitudesas the measured curves. Most of the isotopic varia-
tion of the rivers and springs is predicted by a single
component having a time constant of several months
for the rivers and a year or more for the springs.
Most of the river and spring waters, therefore, clearly
consist of groundwater and not overland flow or any
other component with a short time constant.
The calculated curves demonstrate not only the
predominance of the groundwater contribution to the
river and spring systems, but also the highly variable
isotopic value of that groundwater. Thus the base-
flow cannot have a constant isotopic value, but rather
is highly variable and dependent on the amount and
isotopic value of the precipitation of the previous
several months.
6. Discussion
Using the precipitation d18O values from only
one rain gauge located near St. Louis, MO, the
damped average formula can be used to calculate
isotopic values for the rivers and springs that closely
simulate the measured values. There are some dis-
crepancies between the calculated and measured val-
ues, though, and these tend to increase with increas-
ing distance from the Ladue rain gauge. Rockwoods! .Spring Fig. 7a , located approximately 25 km south-
west of the rain gauge, has a calculated curve which
almost perfectly matches the general variation of the
calculated data. On the other hand, Maramec Spring! .Fig. 7b , located almost 145 km to the southwest,
shows less agreement between the measured and
predicted d18O values. Similarly, the catchments forthe rivers extend more than 100 km to the south and
southwest of the rain gauge, and imperfect agree-
ment is found between the measured and calculated
curves. While we expect that the agreement for the
latter sites would be improved if rainfall data were
available throughout the basin, we nevertheless con-
clude that precipitation data from the single rain
gauge can be used to calculate the general variation
of these systems with remarkable accuracy.
Positive deviations between the calculated and
measured values occur during the summer and fall of
1997 for the Meramec and Big Rivers, and for
Maramec Spring. The measured d18O values are
)0.5‰ greater than the calculated values, possibly
indicating that evaporation of the flowing streams
has occurred. Maramec Spring has a similar type of
deviation as the rivers during the summer of 1997,
possibly also due to evaporation. The recharge source
for the spring includes several losing streams such as! .Dry Fork Gann and Harvey, 1975 , that could have
undergone evaporation similar to the Meramec and
Big Rivers. Plots of dD vs. d18O suggest that someevaporation of the river and spring samples occurs
during the summer months. In particular, about 80%
of the summer river samples plot to the right of the
meteoric water line, but during the rest of the year
the values uniformly straddle the meteoric water line,
with only about 50% of the samples plotting to the
right.
During the winter of 1997–1998, several of the
springs and rivers did not respond immediately to the
( )G.C. Frederickson, R.E. CrissrChemical Geology 157 1999 303–317316
depleted rainfall events that occurred, suggesting that
there may be a time lag between a precipitation
event and the d18O response of the springs and
rivers. It is unknown why this time lag occurred at
this time and not during the previous winter, but this
may be related to the relatively dry period during the
preceding summer. The winter storm events gener-
ally were not very large, so the rain water could
possibly have gone into a soil or other reservoir,
delaying the incorporation of that water into the
spring or river reservoirs.! ! ..The damped average formula Eq. 1 demon-
strates not only the importance of groundwater to the
river and spring systems, but also the variability of
the d18O value of the baseflow. This large variationin baseflow isotopic values in part explains the large
discrepancies in baseflow percentage calculated by
other authors even for the same river or spring. If a
constant isotopic value is assumed for baseflow,
mass balance calculations of the relative amount of
streamflow components will not be accurate.
7. Conclusions
Precipitation collected near St. Louis has large
d18O variations, with semi-monthly rain composites
varying from y0.4 to y19.4‰. For most of theyear, rainfall usually has d18O values of roughly
y5‰, but during the winter months, the isotopicvalues of the precipitation composites decrease to
about y15‰. Thus the annual isotopic variation ismore cycloidal than sinusoidal and has an amplitude
exceeding 10‰.
The rivers and springs in the Meramec River
basin have similar patterns and timing of isotopic
variation as the precipitation, but the amplitudes are
much less. The Meramec River and the Big River
have annual variations of 3–5‰, but Rockwoods
Spring and Maramec Spring vary by only 1–2‰.
The d18O variation in the rivers and springs is
modeled using a damped average formula. The pre-
cipitation amount and d18O values are averaged andweighted by an exponential function. The average
residence times t for the river and spring systems
can be estimated using this equation. The rivers have
a residence time of about 100 days, and the springs
have residence times of a year or more.
Using data from only one rain gauge, the calcu-
lated curves for the rivers and springs closely match
the general variation that is measured, indicating that
a majority of the river and spring water is composed
of groundwater baseflow. Deviations from the curve
are probably due to a smaller but volumetrically
significant component with a short time constant.
Deviations also increase with increasing distance of
the system from the rain gauge, and with increasing
evaporation of surface flow. The agreement between
the calculated and measured values for Rockwoods
Spring is superior to that for Maramec Spring which
is far from the rain gauge. The measured d18Ovalues are about 0.5‰ higher than the calculated
values for the Meramec River and the Big River
during the summer of 1997. That summer was rela-
tively dry, so more evaporation may have occurred
than during the rest of the year. Maramec Spring,
which has a catchment containing several large los-
ing streams, also has higher d18O values during the
summer than were predicted.
Acknowledgements
This paper represents part of the M.A. dissertation
project of GCF at Washington University. We thank
Rosanna Ridings and Skip Doak for collecting nu-
merous samples, and D’Arcy Meyer, Sarah
Swedarsky, Carrie Moschitto, and Ellen Wilson for
providing assistance in sample analysis. Seth Rose,
James Drever and an anonymous reviewer provided
helpful critical comments. We thank Washington
University and the Tyson Research Center for con-[ ]tinued support. JD
References
Benson, L.V., 1994. Stable isotopes of oxygen and hydrogen in
the Truckee River–Pyramid Lake surface-water system: I.
Data analysis and extraction of paleoclimatic information.
Limnol. Oceanogr. 39, 344–355.
Bretz, J.H., 1953. Genetic relations of caves to peneplains and big
springs in the Ozarks. Am. J. Sci. 251, 1–24.
Coleman, M.L., Shepherd, T.J., Durham, J.J., Rouse, J.E., Moore,
G.R., 1982. Reduction of water with zinc for hydrogen isotope
analysis. Anal. Chem. 54, 993–995.
Craig, H., 1961. Standard for reporting concentrations of deu-
( )G.C. Frederickson, R.E. CrissrChemical Geology 157 1999 303–317 317
terium and oxygen-18 in natural waters. Science 133, 1833–
1834.
Criss, R.E., 1999. Principles of Stable Isotope Distribution. Ox-
ford Univ. Press, in press.
DeWalle, D.R., Pionke, H.B., 1994. Streamflow generation on a
small agricultural catchment during autumn recharge: II.
Stormflow periods. J. Hydrol. 163, 23–42.
Dreiss, S.J., 1989. Regional scale transport in a karst system: 1.
Component separation of spring flow hydrographs. Water
Resour. Res. 25, 117–125.
Epstein, S., Mayeda, J., 1953. Variation of O18 content of waters
from natural sources. Geochim. Cosmochim. Acta 4, 213–224.
Faure, G., 1986. Principles of Isotope Geology. Wiley, New York,
589 pp.
Ferguson, G.E., Lingham, C.W., Love, S.K., Vernon, R.D., 1947.
Springs of Florida. Florida Geol. Sur. Bull. 31, 196p.
Fetter, C.W., 1988. Applied Hydrogeology. Prentice-Hall, 604 pp.
Frederickson, G.C., 1998. Relationship between the stable iso-
topes of precipitation and springs and rivers in east central
Missouri and southwestern Illinois. Unpublished Masters the-
sis, Washington University, 235 pp.
Fritz, P., Bottomley, D.J., Cherry, J.A., Harrington, R.F., Weyer,
K.U., 1974. Storm runoff and baseflow studies in small forested
watersheds using stable isotopes and major ions. Geol. Soc.
Am. Abstr. with Programs 10, 746.
Fritz, P., Cherry, J.A., Weyer, K.U., Sklash, M.G., 1976. Runoff
analyses using environmental isotope and major ions. In:
Interpretation of Environmental Isotope and Hydrochemical
Data in Groundwater Hydrology. I.A.E.A., Vienna, pp. 111–
130.
Gann, E.E., Harvey, E.J., 1975. Norman Creek, a source of
recharge to Maramec Spring, Phelps County, Missouri. Jour.
Research U.S. Geol. Survey 3, 99–102.
Grawe, O.R., 1945. Pyrites deposits of Missouri. Missouri Geol.
Sur. and Water Resources, 2nd series, 30, 482 pp.
Hooper, R.P., Shoemaker, C.A., 1986. A comparison of chemical
and isotopic hydrograph separation. Water Resour. Res. 22,
1444–1454.
Horton, R.E., 1933. The role of infiltration in the hydrologic
cycle. Trans. Am. Geophys. Union 14, 446–460.
Jackson, J.P., 1984. Passages of a Stream, a Chronicle of the
Meramec. Univ. of Missouri Press, Columbia, 138 pp.
Maloszewski, P., Rauert, W., Stichler, W., Herrmann, A., 1983.
Application of flow models in an alpine catchment area using
tritium and deuterium data. J. Hydrol. 66, 319–330.
Meinzer, O.E., 1927. Large Springs in the United States. U.S.G.S.
Water Supply Paper 557, 94 pp.
Mook, W.G., Groeneveld, D.J., Bouwn, A.E., Gansurjk, A.J.,
1974. Analysis of a run-off hydrograph by means of natural18O. In: Proceedings symposium on isotope techniques in
groundwater hydrology. I.A.E.A., Vienna 1, pp. 145–153.
Pearce, A.J., Stewart, M.K., Sklash, M.G., 1986. Storm runoff
generation in humid headwater catchments: 1. Where does the
water come from?. Water Resour. Res. 22, 1263–1272.
Pilgram, D.H., Huff, D.D., Steele, T.D., 1979. Use of specific
conductance and contact time relations for separating flow
components. Water Resour. Res. 15, 329–339.
Pinder, G.F., Jones, J.F., 1969. Determination of the ground-water
component of peak discharge from the chemistry of total
runoff. Water Resour. Res. 5, 438–445.
Pionke, H.B., DeWalle, D.R., 1994. Streamflow generation on a
small agricultural catchment during autumn recharge: I. Non-
storm periods. J. Hydrol. 163, 1–22.
Rose, S., 1996. Temporal environmental isotopic variation within! .the Falling Creek Georgia Watershed: implications for con-
tributions to streamflow. J. Hydrol. 174, 243–261.
Ruddy, T.M., 1992. Damning the Dam: The St. Louis Corps of
Engineers and the controversy over the Meramec Basin Pro-
ject from its inception to its deauthorization, 134 pp.
Sklash, M.G., Farvolden, R.N., 1979. The role of groundwater in
storm runoff. J. Hydrol. 43, 45–65.
Sklash, M.G., Farvolden, R.N., Fritz, P., 1976. A conceptual
model of watershed response to rainfall, developed through the
use of oxygen-18 as a natural tracer. Can. J. Earth Sci. 13,
271–283.
United States Geological Survey, 1986. Water Resources Data,
Missouri, Water Year 1996. United States Water-Data Report
MO-86-1, 319 pp.
Vandike, J.E., 1992. The hydrogeology of the Bennett Spring
area, Laclede, Dallas, Webster, and Wright counties, Missouri.
Water Resources Report Number 38, Missouri Department of
Natural Resources, 112 pp.
Vineyard, J., Feder, G.L., 1974. Springs of Missouri. Missouri
Geol. Surv. and Water Resources, WR 29, 212 pp.