Isolation, Characterization and Biomimetic Oxidation of ...
151
Isolation, Characterization and Biomimetic Oxidation of Selected Marine Natural Products and their Analogues A thesis Submitted in the Fulfilment of the Requirements for the Degree of Master of Science (Pharmacy) of RHODES UNIVERISTY By Tafadzwa Mutsvairo February 2015
Transcript of Isolation, Characterization and Biomimetic Oxidation of ...

Isolation, Characterization and Biomimetic Oxidation of
Selected Marine Natural Products and their Analogues
A thesis Submitted in the Fulfilment of the Requirements for the Degree of
Master of Science (Pharmacy)
of
RHODES UNIVERISTY
By
Tafadzwa Mutsvairo
February 2015

ii
Acknowledgements
I would like to take the time to acknowledge everyone who has been instrumental to the
success of my research, who have contributed in a big or small way but nevertheless their
support is greatly appreciated.
To my supervisor Professor D.R Beukes, thank you very much boss for the support
and constant encouragement especially during the difficult times. I truly would never
have managed without you.
To my co-supervisor Dr E Antunes, I am truly grateful for all of the support, for
taking care of us both you and boss on our Cape Town trips which helped
tremendously, I will never forget it truly touched my heart.
Professor J Bolton, at the department of Botany at the University of Cape Town for
the identification of marine algae samples.
Dr M Stander and Mr L Mokwena for the mass spectrometry at the Central Analytical
Facilities, University of Stellenbosch.
Mr D Morley for the technical assistance, the support and encouragement and
organizing all our academic trips to Cape Town.
Dr C Oltmann, my tutor , your advice was very invaluable to me.
Dr R Tandlich for looking after us throughout the course of 2014.
Mrs T Kent for the assistance especially when sending samples.
Mama Prudence for always ensuring a clean laboratory for us to work in.
To my G5 lab colleagues with special mention to Chikomborero Chakaingesu and
Archibald Svogie for the good laugh and support it does mean a lot to me
To my G3 labmates: Jameel, Mohammed and Maynard I could never have asked for
any better labmates and friends. Thank you so much.
To Maynard, I am truly grateful that you have been a mentor to me from my fourth
year right to the end. I thank you for being so selfless in assisting me in every way
you are a great friend.
To my friends; Emilia Chibanguza, Sandra Mashava, Trish Gumpo, Shumie Pswarai,
Edith Mshoperi, Kudzai Kuipa, Simba Mtambanengwe, you guys are all amazing
thank you for being a stress relief and always encouraging me.

iii
To my siblings Taku and Fari love you guys so much thanks for being there. Fari
thank you for setting a good example for me to follow, thank you for everything
To my best friend Kudzai Mtambanengwe, thank you so much for putting up with me,
for always encouraging me in difficult times, for being a shoulder to cry on, you are
one in a million.
And to my amazing parents Munyaradzi and Charity Mutsvairo, I owe everything that
I am and who I have become to you. Thank you for being the voice of reason, for
always supporting me, urging me to follow my dreams and nudging me in the right
direction. I love you mum and dad.

iv
For you Mum and Dad,

v
Table of Contents Acknowledgements…………………………………………………………………………...ii
Table of Contents……………………………………………………………………………..v
List of Figures………………………………………………………………………………..vii
List of Schemes………………………………………………………………………………xii
List of Tables………………………………………………………………………………...xii
List of Abbreviations………………………………………………………………………..xiii
Abstract .................................................................................................................................... xv
Chapter 1
General introduction to marine natural products ................................................................ 1
1.1 Natural products ................................................................................................................... 1
1.1.1 Marine natural products ............................................................................................... 1
1.1.1.1 Phaeophyta (Brown algae) ................................................................................... 2
1.1.1.2 Chlorophyta (Green Algae) .................................................................................. 4
1.1.1.3 Rhodophyta (Red Algae) ...................................................................................... 6
1.1.2 Clinically successful drugs from natural products ....................................................... 7
1.2 Research aims and objectives .............................................................................................. 9
1.3 Thesis outline ....................................................................................................................... 9
1.4 References .......................................................................................................................... 10
Chapter 2
Literature review ................................................................................................................... 13
2.1 The drug discovery and development process ................................................................... 13
2.2 Overview of drug metabolism ........................................................................................... 15
2.2.1 The cytochrome P450 monooxygenases .................................................................... 18
2.3 Importance of drug metabolism in drug discovery and medicinal chemistry .................... 20
2.3.1 In vivo drug metabolism models ................................................................................ 20
2.3.2 In vitro drug metabolism models ............................................................................... 20
2.3.2.1 Hepatic tissue slices and isolated hepatocytes ................................................. 21
2.3.2.2 Isolated and expressed enzymes ...................................................................... 22
vi
2.3.2.4 In silico prediction for drug metabolism .......................................................... 22
2.3.2.5 Biomimics of Cytochrome P450 enzymes ....................................................... 23
2.3.2.5.1 Terminal oxidant .................................................................................... 23
2.3.2.5.2 Metalloporphyrin catalysts ..................................................................... 24
2.4 Natural products as potential drug molecules .................................................................... 28
2.5 References: ......................................................................................................................... 30
Chapter 3
Natural products from Brassicophycus brassicaeformis and related species .................... 36
3.1. General introduction ......................................................................................................... 36
3.1.1. Secondary metabolites from genus Bifurcaria .......................................................... 38
3.1.2 Biosynthetic pathways for secondary metabolites from genus Bifurcaria ................ 40
3.1.3 Biological activity of secondary metabolites from the genus Bifurcaria .................. 43
3.1.4 Chapter aims and objectives ....................................................................................... 45
3.2 Results and Discussion ...................................................................................................... 46
3.2.1 Isolation of secondary metabolites from Brassicophycus brassicaeformis ............... 46
3.2.2 Structure elucidation of secondary metabolites from B. brassicaeformis .................. 50
3.2.2.1 Structure elucidation of compound 3.9 .............................................................. 50
3.2.2.2 The structure elucidation of compound 3.16 ...................................................... 53
3.2.2.3 The structure elucidation of compound 3.17 and 3.18 ....................................... 55
3.3 Experimental ...................................................................................................................... 66
3.3.1 General experimental ................................................................................................. 66
3.3.2 Plant material ............................................................................................................. 67
3.3.3 Isolation of secondary metabolites from B. brassicaeformis ..................................... 67
3.3.3.1 Isolated secondary metabolites (3.9, 3.16, 3.17, 3.18) ............................................ 68
3.4 References .......................................................................................................................... 73
Chapter 4
Biomimetic oxidation and its application to selected natural products and their
analogues ................................................................................................................................. 77
4.1 General introduction .......................................................................................................... 77
4.1.1 Models for biomimetic oxidation ............................................................................... 81
4.1.2 Success of the biomimetic models in mimicking in vivo drug metabolism ............... 82
4.1.3 Natural products selected for biomimetic studies ...................................................... 86

vii
4.1.4 Chapter aims and objectives ....................................................................................... 89
4.2 Results and Discussion ...................................................................................................... 90
4.2.1 Biomimetic oxidation models .................................................................................... 90
4.2.1.1 Biomimetic oxidation of phenylbutazone .......................................................... 91
4.2.1.2 Biomimetic oxidation of acetanilide .................................................................. 97
4.2.1.3 Biomimetic oxidation of natural products ........................................................ 102
4.3 Experimental .................................................................................................................... 114
4.3.1 General experimental ............................................................................................... 114
4.3.2 Isolation of sargahydroquinoic acid ......................................................................... 115
4.3.3 Determination of the hydrogen peroxide content ..................................................... 115
4.3.4 Biomimetic oxidation model (Catalyst-H2O2) ......................................................... 115
4.3.5 Biomimetic oxidation model (Catalyst-PhIO(Ac)2) ................................................. 116
4.3.6 Isolated oxidation products ...................................................................................... 117
4.4 References ........................................................................................................................ 119
Chapter 5
Conclusions ........................................................................................................................... 125
Appendices
Appendix 1 ............................................................................................................................. 127
Appendix 2 ............................................................................................................................. 131
Appendix 3 ............................................................................................................................. 133
Appendix 4………………………………………………………………………………….135
Supplementary Data……………………………………………………………………….CD
List of Figures
Figure 1.1 Cytotoxic metabolites isolated from Sargassum tortile .......................................... 4
Figure 1.2 Biologically active halogenated metabolites from Rhodophyta .............................. 7

viii
Figure 2.1 Summary of drug discovery and development process………………………….14
Figure 2.2 Bioactivation of chloramphenicol succinate in vivo……………………………..15
Figure 2.3 Metabolism of paracetamol in the human body ................................................... 16
Figure 2.4 Summary of drug metabolism ............................................................................... 17
Figure 2.5 Protoporphyrin IX core of cytochrome P450 monooxygenase enzyme ................ 18
Figure 2.6 The catalytic cycle occurring in a cytochrome P450 isoenzyme active centre ..... 19
Figure 2.7 Homolytic and heterolytic cleavge with alkylhydroxides and hydrogen peroxide in
biomimetic catalysis .............................................................................................. 24
Figure 2.8 General porphyrin structure ................................................................................... 25
Figure 2.9 Iron tetraphenylporphyrin (FeTPP)Cl ................................................................... 25
Figure 2.10 First generation metalloporphyrin meso-tetraphenylporphyrin (TPP) ................ 26
Figure 2.11 Second generation metalloporphyrin meso-tetrakis(2,6-dichlorophenyl)porphyrin
dianion (TDCPP)................................................................................................... 27
Figure 2.12 Third generation metalloporphyrin meso-tetrakis(4-N-methylpyridinyl)porphyrin
tetracation (TMPyP) .............................................................................................. 28
Figure 3.1 Acyclic diterpenes isolated from Bifurcaria bifurcata………………………….38
Figure 3.2 C16 scaffold for diterpene metabolites for genus Bifurcaria……………………..40
Figure 3.3 A general biosynthetic scheme for geranylgeraniol derived secondary metabolites
.................................................................................................................................................. 42
Figure 3.4 Biogenetic formation of bifurcarenone (3.8) ......................................................... 43
Figure 3.5 Photograph of Brassicophycus brassicaeformis .................................................... 45
Figure 3.6 1H-NMR (600MHz, CDCl3) spectrum of the crude B. brassicaeformis extract ... 46
Figure 3.7 1H-NMR (600 MHz, CDCl3) spectra of the crude and fractions A-I .................... 48
Figure 3.8 1H-NMR (600 MHz, CDCl3) spectrum of fraction C ............................................ 48

ix
Figure 3.9 1H-NMR (600 MHz, CDCl3) spectrum of fraction E ............................................ 49
Figure 3.10 1H-NMR (600 MHz, CDCl3) spectrum of fraction G ......................................... 49
Figure 3.11 1H-NMR spectrum (600 MHz, CDCl3) of compound 3.9 ................................... 51
Figure 3.12 13
C-NMR (150MHz, CDCl3) spectrum of compound 3.9 ................................... 51
Figure 3.13 Key HMBC correlations observed for compound 3.9 ......................................... 53
Figure 3.14 1H-NMR spectrum (600 MHz, CDCl3) of compound 3.16 ................................. 54
Figure 3.15 13
C-NMR spectrum (150 MHz, CDCl3) of compound 3.16 ................................ 55
Figure 3.16 1H-NMR spectra (600 MHz, CDCl3) of crude fraction G and purified
compounds 3.17 and 3.18 ..................................................................................... 56
Figure 3.17 13
C-NMR (150 MHz, CDCl3) spectra of 3.17 and 3.18 ...................................... 57
Figure 3.18 Key 1H-
1H COSY and HMBC correlations observed for the galactosylglycerol
unit in compounds 3.17 and 3.18 .......................................................................... 59
Figure 3.19 GC-MS data for FAME analysis of 3.17 ............................................................. 61
Figure 3.20 GC-MS data for FAME analysis of 3.18 ............................................................. 63
Figure 4.1 The most common metalloporphyrins used in biomimetic oxidation studies ....... 85
Figure 4.2 1H-NMR (400MHz, CDCl3) spectrum of phenylbutazone (4.1) and reaction
product of phenylbutazone containing compound 4.26 ........................................ 91
Figure 4.3 13
C-NMR (100 MHz, CDCl3) spectrum of compound 4.26 .................................. 92
Figure 4.4 Key HMBC correlations for compound 4.26 ........................................................ 94
Figure 4.5 1H-NMR (400 MHz,CDCl3) spectra comparing control 1, control 2 and starting
material (catalyst-H2O2 model) ............................................................................. 96
Figure 4.6 1H-NMR (400 MHz, CDCl3) spectra comparing control 1, control 2 and starting
material (catalyst-PhIO(Ac)2 model) .................................................................... 97
Figure 4.7 TLC assessment of reaction of acetanilide using catalyst-H2O2 biomimetic
oxidation model..................................................................................................... 98

x
Figure 4.8 1H-NMR (400 MHz, CDCl3) spectra of the starting material (4.4) and crude
reaction mixture .................................................................................................... 99
Figure 4.9 HSQC spectrum of crude oxidation product of acetanilide biomimetic oxidation
reaction highlighting some correlations .............................................................. 100
Figure 4.10 1H-NMR (400 MHz, CDCl3) spectrum of sargahydroquinoic acid (4.20) and
sargaquinoic acid (4.30) ...................................................................................... 102
Figure 4.11 13
C-NMR (100 MHz, CDCl3) spectrum of sargahydroquinoic acid (4.20) and
sargaquinoic acid (4.30) ...................................................................................... 103
Figure 4.12 1H-NMR (400 MHz, CDCl3) spectrum of the control reactions of 4.20, SHQA
and SQA highlighting region δ 6.40-6.60 ........................................................... 105
Figure 4.13 1H-NMR (400 MHz, CDCl3) spectrum of lapachol crude reaction mixture and
starting material (4.21) ........................................................................................ 107
Figure 4.14 1H-NMR (400 MHz, CDCl3) region δ 5.25- 7.50 with signals for 4.31 ............ 108
Figure 4.15 Mestrenova®
1H-NMR (400.00 MHz, CDCl3) spectrum prediction of compound
4.31 highlighting the distinguishing doublet signals .......................................... 109
Figure 4.16 1H-NMR (400 MHz, CDCl3) region δ 2.90- 5.10 with signals for 4.32 ............ 110
Figure 4.17 1H-NMR (400 MHz, CDCl3) region δ 2.50- 4.50 with signals for 4.33 ............ 111
Figure 4.18 Edited HSQC spectrum of crude reaction mixture of lapachol biomimetic
oxidation illustrating key correlations in compound 4.33 ................................... 111
List of Schemes
Scheme 3.1 Isolation of secondary metabolites 3.9 and 3.16-3.18 from B.brassicaeformis...47
Scheme 3.2 FAME analysis of monogalactosylglycerol lipids……………………………..60
Scheme 4.1 Phase I metabolites of phenylbutazone (4.1)…………………………………...78

xi
Scheme 4.2 Phase I metabolism of ibuprofen (4.2)………………………………………….79
Scheme 4.3 Phase I metabolism of indomethacin (4.3)……………………………………...80
Scheme 4.4 Phase I metabolism of acetanilide (4.4)……………………………………… 81
Scheme 4.5 Biomimetic oxidation of nicotine ........................................................................ 83
Scheme 4.6 Biomimetic biotransformation of androst-4-en-3,17-dione (4.16) ..................... 84
Scheme 4.7 Proposed oxidation of acetanilide using the biomimetic model catalyst-H2O2 ... 98
Scheme 4.8 Proposed mechanism for sargahydroquinoic acid oxidation catalyzed by
metalloporphyrin catalyst .................................................................................... 106
Scheme 4.9 Proposed reaction mechanism for the formation of 4.33 in a biomimetic
oxidation model................................................................................................... 112
List of Tables
Table 1.1 Examples of clinically significant natural products from Chlorophyta…………….5
Table 3.1 Summary of differences between B. brassicaeformis, B. bifurcata, B.
galapagensis………………………………………………………………………37
Table 3.2 Classification of diterpene metabolites isolated from genus Bifurcaria………….41
Table 3.3 Comparison of observed and literature 1H-NMR (600 MHz, CDCl3) and
13C-NMR
(150 MHz, CDCl3) and observed 1H-
1H- COSY and HMBC correlations of
fucosterol (3.9)…………………………………………………………………….52
Table 3.4 1H-NMR (600 MHz, CDCl3) and
13C-NMR (150 MHz, CDCl3) assignments for
galactosylglycerol moieties of 3.17 and 3.18……………………………………..58

xii
Table 3.5 HRESIMS and LC-MS data for compound 3.17 and 3.18………………………..64
Table 4.1 Summary of natural products……………………………………………………..88
Table 4.2 Metalloporphyrins used in biomimetic oxidation models………………………...90
Table 4.3 Comparison of 4.1 and 4.26 1H-NMR (400 MHz,CDCl3) and
13C-NMR (100
MHz, CDCl3) and 2D NMR (1H-
1H-COSY and HMBC spectroscopic data for
compound 4.26……………………………………………………………………93
Table 4.4 Percentage conversion of phenylbutazone to 4.26 with biomimetic oxidation model
catalyst-H2O2……………………………………………………………………...95
Table 4.5 Percentage conversion of phenylbutazone to 4.26 with biomimetic oxidation model
catalyst-PhIO(Ac)2……………………………………………………………….. 95
Table 4.6 NMR spectroscopic data , 1H-NMR (400 MHz, CDCl3) and
13C-NMR (100 MHz,
CDCl3) comparing compounds 4.20 and 4.30…………………………………...104
Table 4.7 Summary of natural product biomimetic oxidation reactions…………………...113
Table 4.8 TLC solvent systems used in biomimetic oxidation models…………………….117

xiii
List of Abbreviations
°C Degrees Celsius
br. d Broad doublet
br. s Broad singlet
CDCl3 Deuterated chloroform
cDNA Complementary DNA
COSY 1H-
1H Homonuclear Correlation Spectroscopy
CYP Cytochrome
d Doublet
dd Double doublet
DCM Dichloromethane
DEPT Distortionless Enhancement by Polarization Transfer
EtOAc Ethyl acetate
FAME Fatty Acid Methyl Ester
Fe Iron
Fr Fraction
GC Gas Chromatography
GC-MS Gas Chromatography-Mass Spectrometry
HMBC Heteronuclear Multiple Bond Correlation
HPLC High Performance Liquid Chromatography
HRESIMS High Resolution Electron Spray Ionization Mass Spectrometry
HSQC Heteronuclear Single Quantum Coherence
Hz Hertz
J Spin-spin coupling constant (Hz)
LC-MS Liquid chromatography-mass spectrometry
m Multiplet
m/z Mass to charge ratio
MeOH Methanol
MIC Minimum Inhibitory Concentration
Mn Manganese
multi Multiplicity

xiv
NADPH Nicotinamide adenine dinucleotide phosphate
NADP+
Reduced nicotinimide adenine dinucleotide phosphate
MHz Megahertz
NMR Nuclear Magnetic Resonce
s Singlet
t Triplet
TLC Thin Layer Chromatography
UV Ultra Violet
δ Chemical shift (ppm)

xv
Abstract
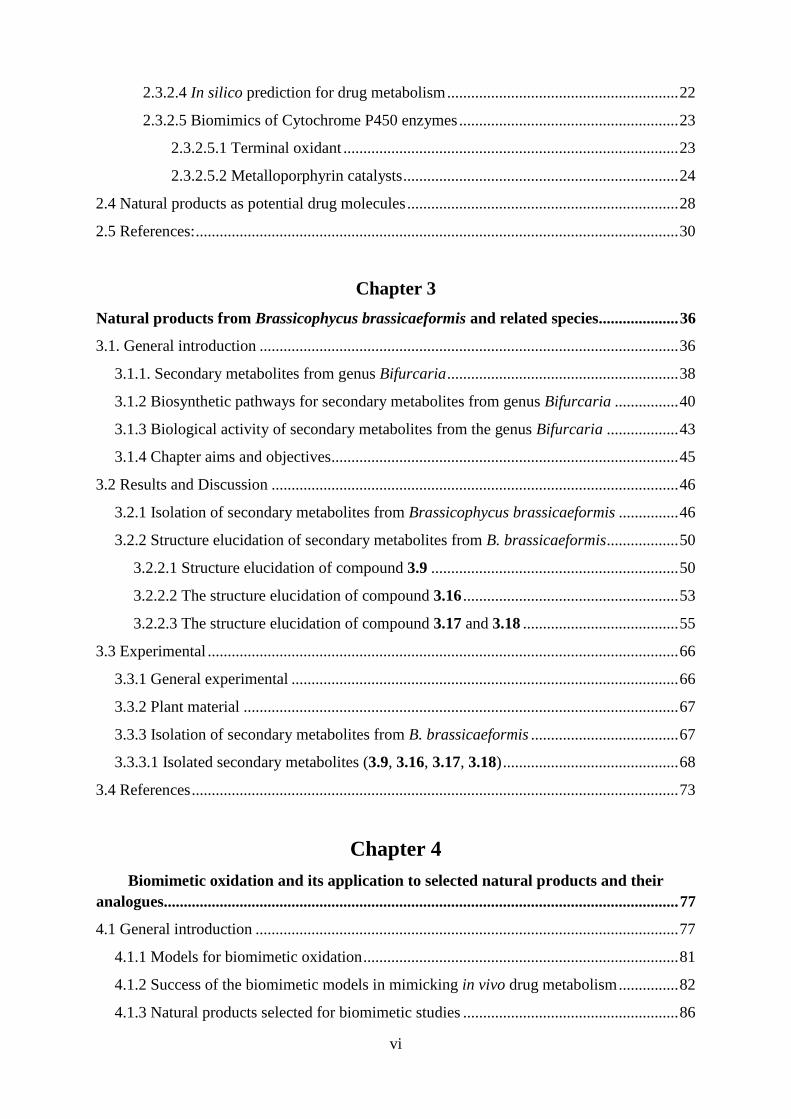
Marine brown algae produce a variety of terpenes with a wide range of biological activities.
However, very few phytochemical studies of brown algae have been conducted in South
Africa. Therefore, in our continued search for biologically active natural products, we
examined the South African brown alga Brassicophycus brassicaeformis. The
dichloromethane-methanol extract of B.brassicaeformis was fractionated by silica gel column
chromatography followed by normal phase HPLC to give pure four pure compounds which
were identified by spectroscopic methods as; fucosterol, fucoxanthin and two
monogalactosyldiacylglycerol lipids.
Many potential drug molecules such as natural products have failed to reach the market due
to poor pharmacokinetic and metabolic profiles despite having potent biological activity.
Therefore the importance of early drug metabolism studies in the drug development process
is clear. A biomimetic oxidation model was used for in vitro drug metabolism studies to
predict any possible metabolites that could be produced by these natural products.
Two biomimetic oxidation models catalyzed by two water soluble metalloporphyrins as
biomimics of cytochrome P450, in the presence of two terminal oxidants either hydrogen
peroxide or iodobenzene diacetete were successfully developed. The models were applied to
a range of natural products. The oxidation of the quinone natural products, sargahydroquinoic
acid, and lapachol was most easily achieved by metalloporphyrins employed in this study.

Chapter 1
1
Chapter 1
General introduction to marine natural products
1.1 Natural products
Marine natural products are secondary metabolites which are produced by living organisms,
plants microorganisms, invertebrates, etc. in the marine environment. These secondary
metabolites differ from the primary metabolites in that the latter metabolites are simple
molecules produced for the provision nutrients, energy and upkeep of organism cells,
whereas secondary metabolites provide an evolutionary advantage to an organism critical to
its survival (Chemler and Koffas, 2008). Secondary metabolites are produced by organisms to
act as herbivore deterrents, as chemical defence agents against predators and in some
organisms, offer a reproductive advantage by acting as chemical attractants (Donia and
Hamann, 2003; Haefner, 2003).
1.1.1 Marine natural products
The marine environment has an immensely rich biodiversity, providing a wide variety of
unique and novel natural products, prompting a renaissance in the marine natural products
research in the search for new potential drugs (Fattorusso et al., 2012; Glaser and Mayer,
2009). Of interest to this work are the marine natural products derived from marine
macroalgae also known as seaweeds (i.e. Chlorophyta, Rhodophyta and Phaeophyta). Marine
macroalgae are a group of heterogeneous plants with a history of fossils which occupy the
littoral zones of the sea (El Gamal, 2010). Seaweeds are considered to be a food delicacy in
East Asian countries such as Japan and China. In these countries, seaweeds were used to treat
iodine deficiencies and other conditions such hypocholesterolaemia and hypoglycaemia (El
Gamal, 2010). This history therefore promises a plethora of biological activities brought
about by the natural product metabolites present in the seaweeds.

Chapter 1
2
1.1.1.1 Phaeophyta (Brown algae)
Almost 1700 species of brown algae have been described in the literature by researchers with
more than 1500 compounds already isolated from this group of marine algae. About two-
thirds of the natural products from brown algae have been isolated from species belonging to
the families Dictyotaceae and Sargassaceae (Muñoz et al., 2012). Brown seaweeds have long
been shown to possess an array of biological activities which include: anti-inflammatory,
antioxidant, cytotoxic activities (Wijesinghe and Jeon, 2011). In the following section,
selected natural products exhibiting these activities will be briefly reviewed.
Anti-inflammatory activity
Inflammation is a process whereby the inflammatory mediators such as histamine and
leukotrienes are produced as highly reactive species in response to cell and tissue damage or
harmful stimuli. It has been associated with several disease states which include cancer and
autoimmune conditions (Tziveleka et al., 2005). The natural products (Z)-sargaquinone (1.1)
and its analogue (E)-sargaquninone (1.2) isolated from the brown alga Taonia atomaria have
demonstrated in vitro anti-inflammatory activity by inhibition of leukotriene biosynthesis.
These two metabolites have also been isolated from Stypopodium zonale and Cystoseira
jabukae (El Gamal, 2010; Tziveleka et al., 2005).
O
O
1.1
O
O
1.2

Chapter 1
3
Antioxidant activity
Free radicals, such as nitric oxide (NO), when produced in large amounts are responsible for
the pathogenesis of several pathological conditions such as tissue damage and carcinogenesis.
Antioxidants are therefore essential in counteracting the activity of free radicals (Lopes et al.,
2014). A novel antioxidant natural product, sargathunbergol (1.3) isolated from Sargassum
thunbergii is structurally related to vitamin E. The antioxidant activity of 1.3 was determined
by the ability of the natural product to scavenge the free radical DPPH (1,1-diphenyl-2-
picrylhydrazyl) by comparison to known antioxidants α-tocopherol and butylated
hydroxytoluene (BHT). Sargathunbergol was found to exhibit better antioxidant activity than
BHT, but less so than α-tocopherol (Lopes et al., 2014).
O
COOHOH
OH
HO
1.3
Cytotoxic activity
Diterpenoid secondary metabolites isolated from brown alga have been shown to possess
potent cytotoxic activities against a wide range of human cancer cell lines. Meroterpenoids
isolated from Sargassum tortile such as sargaol (1.4) and its derivatives sargasal-I (1.5) and
sargasal-II (1.6) were shown to exhibit cytotoxic activity against cultured P-388 lymphatic
leukemia cells with sargasal-I and sargasal-II showing most significant activity (Numata et
al., 1992).

Chapter 1
4
O
HO1.4
O
HO
CHO
1.5
O
HO
CHO
1.6
Figure 1.1 Cytotoxic metabolites isolated from Sargassum tortile
1.1.1.2 Chlorophyta (Green Algae)
Green algae are so named due to the presence of chlorophyll a and b, which gives the
seaweed their characteristic colour (El Gamal, 2010). Fewer novel natural products have been
isolated from green algae compared to the brown and red algae, but those isolated have also
been shown to exhibit biological activities such as anti-inflammatory, cytotoxic and antiviral
activities (Blunt et al., 2007; El Gamal, 2010). Table 1.1 below summarizes the natural
products isolated from Chlorophyta, together with their biological activities.

Chapter 1
5
Table 1.1 Examples of clinically significant natural products from Chlorophyta
Biological
Activity
Example of Natural Product Algae Reference
Anti-
tuberculosis
activity N
N
HO
O
H
O
O
H
H
Natural product Caulerpin, with activity against
Mycobacterium tuberculosis strain H37Rv
Caulerpa sp. Chay et al.,
2014
Cytotoxic
activity
CHOH CHO
HCHO
Halimedatrial, a natural product with cytotoxic and
antimicrobial activities
Halmida
lamouroux
El Gamal,
2010
Antiviral
OOAc
CHO
Halitunal, a marine natural product with in vitro
antiviral activity against murine coronavirus A59
Halimeda
tuna
El Gamal,
2010; Koehn
et al., 1991

Chapter 1
6
1.1.1.3 Rhodophyta (Red Algae)
Red algae are a source of a vast number of biologically significant natural products which are
mostly of terpene and halogenated polyphenol origin. The rich source of halogenated
secondary metabolites is attributed to the presence of haloperoxidases. This group of algae is
so named due to their colour owing to the presence of the pigments phycoerythrin and
phycocyanin which dominate over the other pigments such as chlorophyll a and b and β-
carotene (El Gamal, 2010; Blunt et al., 2007).
Brominated sesquiterpenes, which have been typically isolated from the Laurencia species,
are the most common type of secondary metabolite found in red algae (de Carvalho and
Roque, 2004). In fact, the secondary metabolites isolated from Laurencia species have been
found to have the highest degree of halogenation compared to the other Rhodophyta species.
The plethora of halogenated secondary metabolites include diterpenes, triterpenes,
sesquiterpenes and C-15 acetogenins which exhibit a variety of biological activities (Cabrita
et al., 2010). The biological activities include cytotoxic, antibacterial, antiviral and even
anti-inflammatory activities (Cabrita et al., 2010).
Many species of Laurencia have afforded elatol (1.7) (Figure 1.2), a potent antibacterial and
anti-herbivory agent against the black sea urchin (Cabrita et al., 2010). Elatol has
demonstrated antibacterial activity against Salmonella, Staphylococcus epidermis and
Klebsiella pneumonia (El Gamal, 2010). Other remarkable secondary metabolites isolated
from Rhodophyta include the five halogenated monoterpenes isolated from the South African
red algae, Plocamium cornutum, a species rich in polyhalogenated metabolites. Three
compounds (1.8, 1.9, 1.10) (Figure 1.2) isolated from Plocamium cornutum showed
significant activity against Plasmodium falciparum, the malaria causing parasite, where the
activity has been attributed to the chloromethyl moiety of the compounds. However, the
activities of 1.8 (IC50= 17µM), 1.9 (IC50= 27µM) and 1.10 (IC50= 16µM) against the
Plasmodium parasite were still found to be less than that of chloroquine (IC50= 9.3 nM)
(Afolayan et al., 2009; Cabrita et al., 2010). Another marine red alga, Portiera hornemanni
produces a unique compound halomon (1.11), shown to possess potent anticancer activity
against several human cancer cell lines (Fuller et al., 1992; Davies-Coleman and Beukes,
2004).

Chapter 1
7
Cl
Br
HO
1.7
Cl
Cl Cl
Cl
Cl
1.8
Cl Cl
Cl
Cl
1.9
Cl
CHO Cl
Cl
1.10
Cl
ClCl
Br
Br
1.11
Figure 1.2 Biologically active halogenated metabolites from Rhodophyta
1.1.2 Clinically successful drugs from natural products
The marine environment has provided numerous compounds with prodigious structural,
chemical diversity entwined with a wealth of biological activities; with some metabolites
exhibiting a novel mechanism of action. These novel chemical entities and biological
activities therefore form the basis for further exploration for the natural product and
medicinal chemistry scientist (Liu, 2012). In the period of 1998-2008 the global marine
pharmaceutical pipeline included a total of 592 marine natural products with antitumor and

Chapter 1
8
cytotoxic activities, thus illustrating the potential of marine natural products have in drug
development (Liu, 2012). For example, the first marine natural product to be marketed in the
United States was ziconotide. It was isolated from the tropical marine snail Cornus magus as
a treatment for chronic pain. It was marketed as Prialt® and used in the management of
chronic pain in spinal cord injury (Laser and Mayer, 2009; Liu, 2012). Carraguard® is another
example of a bioactive compound derived from carrageenans from seaweed. It is a
polysaccharide-type metabolite marketed as a vaginal microbicide in preventing sexually
transmitted diseases such as human papilloma virus (HPV) (Marais et al., 2011). Propylene
glycol alginate sodium sulfate (PSS) is the first marine natural product marketed as an
antiangiocardiopathy agent in China in treating heart and brain diseases. PSS is a secondary
metabolite derived from seaweed polysaccharides (Li et al., 2013).
Conclusion
Marine natural products are a source of new chemical entities which provide basis for the
exploration of new drug targets and mechanisms of action. The chemical and biological
diversity pointed out by the marine organisms gives the natural products and medicinal
chemists a key to combat pathologies that have developed resistance (such as microbial
infections) and those that have presented challenges in treatment such as cancer. Marine
natural products therefore present a unique opportunity to provide a wide variety of new drug
molecules as well as an aid in understanding several disease states.

Chapter 1
9
1.2 Research aims and objectives
Many natural products isolated from the marine environment particularly from marine
macroalgae have a wealth of biological activities including cytotoxicity, antimicrobial,
antiviral and anti-inflammatory activities. As a result, it would be worthwhile exploring the
potential metabolites that can be obtained from such natural products. The metabolism of
xenobiotics in humans plays a major role in the development of new drugs. Drug metabolism
impacts on pharmacokinetics and potential toxicity of new chemical entities. It may therefore
be useful to explore the metabolism of lead compounds early in the drug discovery and
development process. The overall aim of the current research was therefore, to discover
biologically active natural products and to develop a general methodology for the biomimetic
metabolism of biologically active natural products.
The objectives of the research were:
To isolate and characterize natural products from marine brown alga Brassicophycus
brassicaeformis
To create an easily reproducible biomimetic oxidation model for use within a
laboratory setting using known non-steroidal anti-inflammatory drugs as an in vitro
drug metabolism study
To apply the biomimetic oxidation models to selected natural products
1.3 Thesis outline
This thesis contains five comprehensive chapters. The first chapter contains a general
introduction to marine natural products while chapter two gives a detailed literature review
for drug metabolism and its place in drug discovery and development. Chapter three
describes the natural products isolated from Brassicophycus brassicaeformis. In the fourth
chapter, the development of biomimetic oxidation models was accomplished and applied to
selected natural products with known biological activities. Finally chapter five provides a
conclusion to the research carried out and evaluation of research outcomes.

Chapter 1
10
1.4 References
Afolayan A.F., Mann M.G.A., Lategan C.A., Smith P.J., Bolton J.J., Beukes D.R. (2009).
Antiplasmodial halogenated monoterpenes from marine alga Plocamium cornutum.
Phytochemistry 70: 597-600
Blunt J.W., Copp B.R., Hu W., Munro M.H.G., Northcote P.T., Prinsep M.R. (2007). Marine
natural products. Natural Product Reports 24: 31-86
Cabrita M.T., Vale C., Rauter A.P. (2010). Halogenated compounds from marine algae.
Marine Drugs 8: 2301-2317
Chay C.I.C., Cansino R.G., Pinzón C.I.E., Torres-Ochoa R.O., Martínez R. (2014). Synthesis
and anti-tuberculosis activity of marine natural product caulerpin and its analogues. Marine
Drugs 12: 1757-1772
Chemler J.A., Koffas M.A.G. (2008). Metabolic engineering for plant natural product
biosynthesis in microbes. Current Opinion in Biotechnology 19: 597-605
Davies-Coleman M.T., Beukes D.R. (2004). Ten years of marine natural products research at
Rhodes University. South African Journal of Science 100: 539- 544
De Carvalho L.R., Roque N.F. (2004). Correlations between primary and secondary
metabolites in Ceramiales (Rhodophyta). Biochemical Systematics and Ecology 32: 337-342
Donia M., Hamann M.T. (2003). Marine natural products and their applications as anti-
infective agents. The Lancet Infectious Diseases 3: 338-348
El Gamal A.A. (2010). Biological importance of marine algae. Saudi Pharmaceutical Journal
18: 1-25
Fattorusso E., Gerwick W.H., Taglialatel-Scafati O. (2012). Part 1: Natural product trends in
different groups of marine life. (Fattorusso E., Gerwick W.H., Taglialatela-Scafati O Ed.)
Dordrecht: Springer, Netherlands: 1- 295

Chapter 1
11
Fuller R.W., Cardellina J.H., Kato Y., Brinen L.S., Clardy J., Snader K.M., Boyd M.R.
(1992). A pentahalogenated monoterpene from red alga Portiera hornemannii produces a
novel cytotoxicity profile against a diverse panel of human tumor cell lines. Journal of
Medicinal Chemistry 35: 3007-3011
Glaser K.B., Mayer A.M.S. (2009). A renaissance in marine pharmacology: from preclinical
curiosity to clinical reality. Biochemical Pharmacology 78: 440-448
Haefner B. (2003). Drugs from the deep: marine natural products as drug candidates. Drug
Discovery Today 8: 536-544
Koehn F.E., Gunasekera S.P., Niel D.N., Cross S.S. (1991). Halitunal, an unusual diterpene
aldehyde from the marine alga Halimeda tuna. Tetrahedron Letters 32: 169-172
Li P., Li C., Xue Y., Li H., Liu H., He X., Yu G., Guan H. (2013). An HPLC method for
microanalysis and pharmacokinetics of marine sulfated polysaccharide PSS-loaded poly
lactic-co-glycolic acid (PLGA) nanoparticles in rat plasma. Marine Drugs 11: 1113-1125
Liu Y. (2012). Renaissance of marine natural product drug discovery and development.
Journal of Marine Science Research and Development 2: 1-2
Lopes G., Daletos G., Proksch P., Andrade P.B., Valentão P. (2014). Anti-inflammatory
potential of monogalactosyl diacylglycerols and a monoacylglycerol from the edible seaweed
Fucus spiralis Linnaeus. Marine Drugs 12: 1406-1418
Marais D., Gawarecki D., Allan B., Ahmed K., Altini L., Cassim N., Gopolang F., Hoffman
M., Ramjee G., Williamson A. (2011). The effectiveness of Carraguard, a vaginal
microbicide, in protecting women against high-risk human papillomavirus infection.
Antiviral Therapy 16: 1219-1226
Muñoz J., Culioli G., Köck M. (2012). Linear diterpenes from the marine brown alga
Bifurcaria bifurcata: a chemical perspective. Phtyochemical Reviews 12: 407-424

Chapter 1
12
Numata A., Kanbara S., Takahashi C., Fujiki R., Yoneda M., Usami Y., Fujita E. (1992). A
cytotoxic principle of brown alga Sargassum tortile and structures of chromenes.
Phytochemistry 31: 1209-1213
Tziveleka L., Abatis D., Paulus K., Bauer R., Vaglas C., Roussis V. (2005). Marine
polyprenylated hydroquinones, quinones and chromenols with inhibitory effects on
leukotriene formation. Chemistry and Biodiversity 2: 901-909
Wijesinghe W.A.J.P., Jeon Y. (2011). Biological activities and potential cosmeceutical
applications of bioactive components from brown seaweeds: a review 10: 431-443

Chapter 2
13
Chapter 2
Literature review
2.1 The drug discovery and development process
Drug discovery and development is a process initiated in the search for new chemical entities
to combat diseases. A need arises for development of new drugs especially when resistance to
existing drugs occurs, prompting the need to search for new drug targets. Drug development
is a long process taking 10-15 years from drug discovery to drug marketing. The process is
very expensive, costing pharmaceutical companies as much as one billion US dollars. Taking
all these factors into consideration, there is consequently a low turnover for new drug
molecules entering the market (Hughes et al., 2011).
The drug development process starts with the identification of a drug target which could be:
proteins, DNA, RNA or even the biochemical pathways essential to the etiology of a disease.
A good drug target should be ‘druggable’, meaning that it should elicit a measurable
biological response upon attachment of the potential drug to the target (Hughes et al., 2011).
After identifying a drug target, lead discovery is the next step involving screening and
isolation of a potential new drug. Lead discovery involves high throughput screening,
combinatorial screening and assay development, and isolation from nature amongst other
processes (Hughes et al., 2011; Nicolau, 2014). Medicinal chemistry studies are the next step
in the drug development process. These studies provide structure-activity information and
facilitate development of a library of compounds via chemical synthesis using the lead
compound as a template (Hughes et al., 2011; Nicolau, 2014).The next stage in the drug
development process is the in vitro and in vivo animal studies which provide activity and
safety data as well as the pharmacokinetic profile of a drug molecule: viz. absorption,

Chapter 2
14
distribution, metabolism and excretion (Gunaratna, 2000; Lin and Lu, 1997). This provides
insight into the safety and efficacy of a potential drug, ultimately assisting in prioritizing lead
compounds. The final stage in the drug development process is the submission of an
Investigational New Drug (IND) application to facilitate human clinical trials (Hughes et al.,
2011). Figure 2.1 gives a summary of the drug discovery and development process.
Figure 2.1 Summary of drug discovery and development process1
Drug metabolism studies are a crucial component of the drug discovery and development
process and provide the safety and efficacy data of any new potential drug molecule. As a
result, early metabolism studies are important in determining these parameters, giving new
insight into the success or failure of a potential drug early in the drug development process.
For this reason, an important part of this research project is centred on early metabolism
studies on biologically active natural products.
1 Accessed (06/01/2015), Adapted from: http://drugdiscovery.com/upimages/1373879800_drug-discovery-1.jpg

Chapter 2
15
2.2 Overview of drug metabolism
Drug metabolism is a process which occurs mainly in the liver, in which lipophilic drug
molecules are converted to water-soluble products that can be excreted from the body. It also
takes part in the bioconversion of inactive drug molecules to therapeutically active molecules;
the basis of prodrug design (Gunaratna, 2000; Cutler and Block, 2004). Chloramphenicol is
an antibacterial agent with poor water solubility which affects the parenteral route of
administration. As a result, a succinate ester of chloramphenicol with no antibacterial activity
was developed which undergoes in vivo ester hydrolysis to release the active
chloramphenicol. Figure 2.2 below shows the prodrug activation of chloramphenicol
succinate (Smith and Clark, 2004).
O2N
N
O
CHCl2
OH
O
O
O- Na+
O
H
hydrolysis
esterases
N
O
CHCl2
O2N
OH
OH
H
+
HO
O
O- Na+
O
chloramphenicol succinate
chloramphenicol
sodium succinate
Figure 2.2 Bioactivation of chloramphenicol succinate in vivo (Adapted from Smith and Clark,
2004)
Drug metabolism also involves bioinactivation of active drug molecules to inactive
metabolites excreted from the body or it may facilitate the conversion of drug molecules to
toxic metabolites resulting in toxicity and side effects. The metabolism of paracetamol
illustrated in Figure 2.3 gives an example of bioinactivation.

Chapter 2
16
conjugation
protein
NHCOCH3
OH
NHCOCH3
O
NHCOCH3
OH
S-Glutathione
NHCOCH3
O-glucuronide
NHCOCH3
O-sulfate
renal excretion
conjugation
Glutathione
Phase I oxidation
CYP 450
conjuagtion
glucuronic acid sulfate
NHCOCH3
OH
protein
hepatotoxicity nephrotoxicity
paracetamol NAPQI
Figure 2.3 Metabolism of paracetamol in the human body (Adapted from Dybing et al., 1984; Xie et
al., 2014)
Metabolism is achieved by phase I and phase II metabolism. Phase I metabolism catalyzed by
cytochrome P450 enzymes which involves functionalization of a drug molecule, rendering it
more polar. The functionalization reactions include oxidation, ester and amide hydrolysis, as
well as hydroxylation reactions (Kumar and Surapaneni, 2001). Phase II metabolism
therefore involves derivatization reactions whereby conjugation of parent drug molecules, or
phase I metabolites with conjugates such as sulfates, glucuronic acid and glutathione occurs
to ensure excretion from the human body (Kumar and Surapaneni, 2001; Cutler and Block,
2004).
Paracetamol has been used as an example to illustrate phase I and phase II metabolic
reactions that occur in the body as well as the possible metabolic fate of a drug upon
administration (Figure 2.3). Paracetamol is mainly metabolized via phase II metabolic
processes by conjugation with glucuronic acid and sulfate to enable renal excretion of
inactive metabolites (Cutler and Block, 2004; Xie et al., 2014). The drug is also oxidized to

Chapter 2
17
its quinone derivative, N-acetyl-p-benzoquinone imine (NAPQI), via phase I metabolism.
NAPQI is a hepatotoxic and nephrotoxic metabolite which accumulates in paracetamol over-
dose causing liver damage. Glutathione conjugation of NAPQI, on the other hand, occurs via
phase II metabolism to form a non-toxic secondary metabolite which is then excreted from
the body (Dybing et al., 1984; Xie et al., 2014).
Drug metabolism is one of the pharmacokinetic processes which a drug undergoes following
administration. When a drug is administered, it is absorbed, distributed and metabolized
before being excreted from the body. Each of these processes is important in ensuring an
effective therapy (Ionescu and Caira, 2006). Figure 2.4 summarizes drug metabolism in the
human body.
DRUG MOLECULE
accumulation
PHASE I metabolism
PHASE II metabolism
biliary
excretion extracellularrenal
excretion
highly lipophilic &
stable lipophilic polar hydrophilic
lipophilicpolar
hydrophilic
plasma
Figure 2.4 Summary of drug metabolism2
2 (Adapted from; Accessed 29/01/2015), Available at: http://3.bp.blogspot.com/-
dH0RnpwIwcQ/UF4jp_fs8dI/AAAAAAAAAFs/w5bkdVYZVUk/s1600/clinical%20pharmacology-
%20drug%20&%20body%20interactions%20part%20I%20&2.117.tiff )

Chapter 2
18
2.2.1 The cytochrome P450 monooxygenases
Cytochrome P450 isoenzymes are a group of enzymes which catalyze phase I metabolism via
oxidation, reduction, epoxidation, hydroxylation and hydrogenation reactions (Stachulski,
2000; Cutler and Block, 2004). Functional groups added to lipophilic drug molecules to
improve polarity include hydroxyl, carboxyl and amino functional groups which are added
via oxidation, reduction and hydrolysis reactions (Cutler and Block, 2004). About 57
cytochrome P450 enzymes are found in the human body, but only a quarter of these are
responsible for the metabolism of xenobiotics (Guengerich, 2006). Some of these include:
CYP3A4, CYP2C9 and CYP1A2 which are amongst the major metabolizing enzymes in the
human body where CYP3A4 metabolizes approximately half of the known drugs (Gunaratna,
2000).
Cytochrome P450 isoenzymes are heme containing monooxygenases with a protoporphyrin
IX (Figure 2.5) core as the active site. The protoporphyrin centre has cysteine as a fifth ligand
and a sixth coordination site where molecular oxygen is able to bind during catalytic
reactions (Lohmann and Karst, 2008).
N N
N N
OH
OH
O
O
FeSCys
Figure 2.5 Protoporphyrin IX core of cytochrome P450 monooxygenase enzyme
(Adapted from Lohmann and Karst, 2008)

Chapter 2
19
The oxygenation of substrates by CYP 450 enzymes occurs in a catalytic cycle (Figure 2.6)
with the end result being the transfer of an oxygen atom to the substrate (Gunaratna, 2000;
Lohmann and Karst, 2008). In the ground state, the Fe (III) moiety of the protoporphyrin core
IX has a water molecule bound to the sixth coordination site. The iron centre attains its
activated state upon receiving electrons from NADPH to release the water molecule and Fe
(IV) oxo-species which are the active oxidants (Lohmann and Karst, 2008; Gunaratna, 2000).
The reaction is summarised below.
NADPH + H++ O2 + substrateCYP 450 enzyme
NADP+ + H2O + substrate[O]
(Gunaratna, 2000; Lohmann and Karst, 2008)
Figure 2.6 The catalytic cycle occurring in a cytochrome P450 isoenzyme active centre3
3 (Adapted from Fleming, 2001)

Chapter 2
20
2.3 The importance of drug metabolism in drug discovery and medicinal
chemistry
Current drug discovery and development guidelines require that in vitro and in vivo
metabolism studies be conducted in the early stages of the process in order to guide drug
development where potential metabolites are ascertained and issues of potential drug-drug
interactions are addressed (Bai and Liu, 2005). There are a number of pre-clinical drug
metabolism studies that have been employed to identify the expected drug metabolites. Some
of these are discussed below.
2.3.1 In vivo drug metabolism models
Animal studies have been conducted as a model for in vivo metabolism studies of potential
drug molecules in humans. In this case, animals such as rats and dogs provide important,
relevant models which may be used to predict the formation of possible metabolites upon
administration of the potential drug molecule to humans (Gunaratna, 2000; Tingle and
Helsby, 2006). Animal models provide the physiological environment for drug metabolism,
illustrating any potential biotransformations new chemical entities are liable to undergo
(Tingle and Helsby, 2006). However, there are drawbacks associated with animal models.
One issue is that they cannot always be translated to human drug metabolism as there are
differences between enzyme expression in animals and humans. Another concern is differing
substrate specificity (Chauret et al., 1997; Tingle and Helsby, 2006; Vaclavikova et al.,
2004). Furthermore, animal studies require ethical clearance since ethical issues arise with
these models and, as such, the studies are expensive to conduct (Bernadou and Meunier,
2004). On the other hand, animal models are useful in predicting pharmacokinetic profiles
for drug molecules that remain unchanged upon excretion, i.e. drug molecules that are cleared
renally (Tingle and Helsby, 2006).
2.3.2 In vitro drug metabolism models
The big question with animal studies is whether the results can be translated to humans, after
factoring in inter-species variation (Tingle and Helsby, 2006; Wrighton et al., 1995). In vitro
drug metabolism models have therefore been developed to counteract inter-species variation

Chapter 2
21
which may occur with animal models (Wrighton et al., 1995). These in vitro models include;
hepatic tissue slices, isolated hepatic cells, expressed enzymes, isolated enzymes, in silico
drug metabolism and biomimics of cytochrome P450 monooxygenases (Gunaratna, 2000).
The liver has been targeted as the source of most in vitro metabolism studies because it is the
site where most of the drug metabolism occurs (Tingle and Helsby, 2006).
2.3.2.1 Hepatic tissue slices and isolated hepatocytes
Hepatic tissue slices provide liver cells with intact cell structure and physiology including
drug metabolizing enzymes, thus the integrity of hepatocytes is maintained. As a result,
potential metabolic pathways of a drug molecule are preserved. These tissue slices are easy to
produce in a rapid process which makes them readily available to conduct studies (Gunaratna,
2000; Wrighton et al., 1995). The major disadvantage with hepatic tissue slices is that they
quickly lose their viability and therefore they cannot be preserved to perform experiments at a
later time. This issue, however, can be counteracted somewhat by cryopreservation of the
tissue slices (Gunaratna, 2000).
Isolated hepatocytes, like tissue slices, are part of cellular systems that have been used in in
vitro drug metabolism studies. They are obtained from tissue cultures or they are isolated
from collagen perfusion techniques from fresh liver cells (Gunaratna, 2000; Wrighton et al.,
1995). Isolated hepatocytes, like tissue slices also preserve cell integrity thus affording study
of the metabolic pathways of a drug. Many disadvantages arise from the use of isolated
hepatocytes. The isolated cells lose their integrity upon cryopreservation due to the freezing
and thawing process (Coundouris et al., 1993; Wrighton et al., 1995). Other studies have
shown that culturing hepatocytes alters the expression of some drug metabolizing enzymes in
the cells, consequently altering the biotransformation of the drug molecules by these cells
(LeCluyse et al., 2001; Wrighton et al., 1995).

Chapter 2
22
2.3.2.2 Isolated and expressed enzymes
Isolated enzymes include cytochrome P450 enzymes and other enzymes such as the
peroxidases which make up the hepatic microsomal system. These are purified and
concentrated enzymes which can be obtained from human hepatocytes. They provide a
purified natural system to enable studies of drug biotransformation (Bernadou et al., 1991).
Isolated enzymes are the most popular and purest in vitro metabolism models available to
scientists because they are easily prepared and stored without any loss of viability of
enzymes. These systems usually provide possible phase I metabolism data, however since
there is no cellular environment fostering the drug metabolism, data may differ from the
actual metabolism that may occur under physiological conditions (Bernadou et al., 1991;
Gunaratna, 2000).
Expressed enzymes are specific cytochrome P450 enzymes which are commercially available
and have been expressed via biotechnological methods. In this case, cDNA specific to a
particular P450 enzyme is cloned and expressed (Gunaratna, 2000; Tingle and Helsby, 2006).
Enzymes are then purified and concentrated for in vitro pharmacokinetic studies. Expressed
enzymes, like isolated enzymes, do not offer a physiological cell environment for metabolism
as that provided by tissue slices and isolated hepatocytes. Furthermore, they lack post
translational folding of the enzyme which occurs in the human body-suggesting differences
with the human cytochrome P450 enzymes (Gunaratna, 2000; Tingle and Helsby, 2006).
2.3.2.3 In silico prediction of drug metabolism
In silico drug metabolism prediction is a form of high throughput screening which can be
applied to facilitate the drug discovery and development (Zhang et al., 2011). It is a computer
generated system which predicts potential drug metabolites, the specific CYP450 enzyme
isoform responsible for the metabolism and the prediction of pharmacokinetic properties of a
new chemical entity (Dimelow et al., 2012; Ntie-Kang et al., 2013; Zhang et al., 2011).
These technologies are gaining ground in drug discovery and development as they eliminate
compounds with the potential to have an undesirable pharmacokinetic profiles and toxic side
effects early in the process (Ntie-Kang et al., 2013). The advantages of in silico drug

Chapter 2
23
metabolism processes are that it reduces the cost of drug development while screening a large
number of potential drugs.
2.3.2.4 Biomimics of cytochrome P450 enzymes
Biomimics of cytochrome P450 monooxygenase enzymes refers to molecules with the ability
to mimic the activity of cytochrome P450 isoenzymes in a chemical system. Biomimics
provide a simple chemical system which overcomes some of the disadvantages that arise with
in vivo drug metabolism models and some of the in vitro models discussed above (Gotardo et
al., 2006). For the purpose of this research, the emphasis is on metalloporphyrins as
biomimics of a cytochrome P450 metabolism system. Biomimics are mainly focused on
oxidation reactions as the majority of the drug metabolism processes occurring in a human
body involves oxidative processes. These systems include: a terminal oxidant, a biomimetic
catalyst and a co-catalyst.
2.3.2.4.1 Terminal oxidant
A biomimetic catalytic system acts to imitate the oxidative reactions catalyzed by CYP450
isoenzymes that occur naturally in the human body, where molecular oxygen is the source of
oxygen. Likewise, in a synthetic metabolic system, an oxygen source is required. Therefore
the terminal oxidants in biomimetic drug metabolism models are used. A wide variety of
terminal oxidants have been used in these models in literature including: iodosylbenzene
(PhIO), peroxides such as hydrogen peroxide (H2O2), cumene hydroperoxide (CumOOH) and
tert-butylhydroperoxide (tBuOOH), sodium hypochlorite (NaOCl) amongst others; all of
which are single oxygen donors (Bernadou and Meunier, 2004). In nature, cytochrome P450
monooxygenases utilize a single oxygen molecule from molecular oxygen which is then
coupled to oxidative reactions, whilst the second oxygen molecule is lost as water (Feiters et
al., 2000).

Chapter 2
24
Alkylhydroperoxide oxidants such as tert-butyl-hydroperoxide as well as hydrogen peroxide
have the main disadvantage of undergoing homolytic fission in the presence of a catalyst to
result in degradation of the oxidant and formation of free radicals, whilst product yields are
low. This has been observed with first generation, unsubstituted metalloporphyrins, which in
the presence of alkylhydroperoxide or H2O2, have led to poor epoxidation of the alkene
moiety while the oxidant rapidly decomposes (Mansuy et al., 1989; Meunier, 1992). This has
been counteracted by the addition of a strong ligand donor which is a nitrogen base such as
pyridine or imidazole. The ligand donor acts to encourage heterolytic cleavage of the oxidant,
facilitating formation of the reactive high-valent, oxo-species (Figure 2.7) (Meunier, 1992).
FeIII + ROOH
Fe(IV)-OH + RO.
Fe (V) = O + ROH
non reactive free radicals
high valent iron-oxo species
homolytic cleavage
heterolytic cleavage
Figure 2.7 Homolytic and heterolytic cleavage with alkylhydroxides and hydrogen peroxide
in biomimetic catalysis (Adapted from Mansuy et al., 1989)
2.3.2.4.2 Metalloporphyrin catalysts
Porphyrins are aromatic, heterocyclic macrocyles consisting of four pyrrole rings where the
nitrogen can coordinate with a transition metal to form the metalloporphyrin. The pyrrole
rings are bridged by a methine moiety to form the macrocyclic structure (Nantes et al., 2011).
Figure 2.8 gives a general porphyrin structure. Transition metals that have been incorporated
into metalloporphyrins include: iron (Fe), manganese (Mn), zinc (Zn) and ruthenium (Ru)
amongst others (Che and Huang, 2009).

Chapter 2
25
NN
N N
H
H
H
H
methine bridges
pyrrole unit
Figure 2.8 General porphyrin structure
Metalloporphyrins have been extensively studied for more than 20 years as biological mimics
of cytochrome P450 in an effort to understand the functional groups of drug molecules most
susceptible to metabolism, as well as in understanding the in vivo metabolism processes
(Gotardo et al., 2006). The first system was described by Groves et al., (1979) where iron
tetraphenyl porphyrin (Figure 2.9) was used to catalyze the epoxidation and hydroxylation
reactions of simple alkenes and alkanes using iodosylbenzene (PhIO) as the single oxygen
donor. Metalloporphyrin chemistry has expanded over the years to such an extent that they
have been grouped into first, second and third generation metalloporphyrins.
NN
N N
Fe Cl
Figure 2.9 Iron tetraphenylporphyrin (FeTPP)Cl

Chapter 2
26
First generation metalloporphyrins
The first generation metalloporphyrins (Figure 2.10) represent the first metalloporphyrins that
were used. These are structurally simple, with no substituents on the β-pyrrole positions or
the aryl positions. These first generation metalloporphyrins have been shown to be highly
susceptible to oxidative degradation, limiting the number of catalytic cycles in the oxidation
process (Bernadou and Meunier, 2004; Lohmann and Karst, 2008).
NN
N N
M
M= Fe, Mn, Ru
-pyrrole position
meso-position
Figure 2.10 First generation metalloporphyrin meso-tetraphenylporphyrin (TPP)
(Bernadou and Meunier, 2004)
Second generation metalloporphyrins
In order to counteract the problem of oxidative degradation experienced by first generation
metalloporphyrins, second generation metalloporphyrins were developed. Electron-
withdrawing and sterically hindering substituents were added to the aryl groups of the meso-
tetraarylporphyrins and the β-pyrrolic positions of the porphyrin ring (Figure 2.11) (Bernadou
and Meunier, 2004; Lohmann and Karst, 2008). The addition of these substituents saw an
increased catalytic efficiency for the metalloporphyrin, with increased reactivity for the high-
valent oxo intermediates, with reduced catalytic degradation (Bernadou and Meunier, 2004;
Lohmann and Karst, 2008).
β

Chapter 2
27
NN
N N
Cl Cl
Cl
Cl
ClCl
Cl
Cl
M
M= Fe, Mn, Ru
Figure 2.11 Second generation metalloporphyrin meso-tetrakis(2,6-dichlorophenyl)porphyrin
dianion (TDCPP) (Bernadou and Meunier, 2004)
Third generation metalloporphyrins
Third generation metalloporphyrins bear substituents such as quaternary ammonium and
sulfonic groups which render them more water soluble. These have been developed for
catalysis within an aqueous medium which may better imitate the natural drug metabolism
environment (Bernadou and Meunier, 2004; Lohmann and Karst, 2008). Figure 2.12 below
gives a general structure for a third generation metalloporphyrin.

Chapter 2
28
NN
N N
N
N
N
N M
M= Fe, Mn, Ru
+
+
+
+ CH3
CH3
H3C
CH3
Figure 2.12 Third generation metalloporphyrin meso-tetrakis(4-N-methylpyridinyl)porphyrin
tetracation (TMPyP) (Bernadou and Meunier, 2004)
2.4 Natural products as potential drug molecules
Natural products present a source of new chemical entities with therapeutic potential against
numerous diseases, thus they have the potential to be marketed as new drug molecules. When
developing a new chemical entity, determination of absorption, distribution, metabolism and
excretion parameters of a potential drug is important in establishing its therapeutic efficacy as
part of the initial stages of drug discovery and development (Ansede and Thakker, 2004; Dos
Santos et al., 2005). Metabolism studies provide information on potential metabolites thus
facilitating prodrug design as well as the determination of the safety and efficacy of the
metabolites. Approximately 40% of new, potential chemical entities fail to proceed to market
due to their poor metabolism and pharmacokinetic profiles (Ansede and Thakker, 2004). As a
result, a natural product chemist should determine any potential metabolites of promising
natural product molecules, therefore establishing safety and toxicity profiles in addition to the
activity of metabolites against disease states, early in the drug development process. The

Chapter 2
29
biomimetic oxidation profiles (in this case, a chemical in vitro drug metabolism system) of
natural products with therapeutic potential, is the main focus of this research.
Conclusions
Biomimetic oxidation models are associated with some disadvantages which include the
absence of the protein environment which is present in the human body and as such, cannot
reproduce the regioselectivity which takes place occurs with the cytochrome enzymes
(Othman et al., 2000) but however, they do present other unique advantages making them a
viable in vitro drug metabolism model. Biomimetic drug metabolism models represent
chemical in vitro drug metabolic studies which allow isolation of potential drug metabolites
in sufficient amounts for characterization, therapeutic and toxicological assays, whilst
avoiding the ethical issues and expense associated with animal studies, the variable potency
seen with liver preparations, and the binding of metabolites to biological matrices as in in
vivo drug metabolism models (Bernadou and Meuiner, 2004; Niehues et al., 2012).

Chapter 2
30
2.5 References:
Ansede J.H., Thakker D.R. (2004). High-throughput screening for stability and inhibitory
activity of compounds towards cytochrome P450- mediated metabolism. Journal of
Pharmaceutical Sciences 93: 239-255
Bai X., Liu C. (2005). Overview of major CYP450 isoforms and “Cocktail Approach”. Asian
Journal of Drug Metabolism and Pharmacokinetics 5: 257-264
Bernadou J. Bonnafous M., Labat G., Loiseau P., Meunier B. (1991). Biomimetic oxidation
of acetaminophen and ellipticine derivatives with water-soluble metalloporphyrins associated
to potassium monopersulfate. Drug Metabolism and Disposition 19: 360-365
Bernadou J., Meunier B. (2004). Biomimetic catalysts in the oxidative activation of drugs.
Advanced Synthesis and Catalysis 346: 171-184
Chauret N., Gauthier A., Martin J., Nicoll-Griffith D.A. (1997). In vitro comparison of
cytochrome P450-mediated metabolic activities in human, dog, cat, horse. Drug Metabolism
and Disposition 25: 1130-1136
Che C., Huang J. (2009). Metalloporphyrins-based oxidation systems: from biomimetic
reactions to application in organic synthesis. Chemical Communications 27: 3996-4015
Coundouris J.A., Grant M.H., Engeset J., Petrie J.C., Hawksworth G.M. (1993).
Cryopreservation of human adult hepatocytes for use in drug metabolism and toxicity studies.
Xenobiotica 23: 1399-1409
Cutler S.J., Block J.H. (2004). Chapter 4 Metabolic Changes of Drugs and Related Organic
Compounds. Wilson and Gisvold’s Textbook of Organic and Pharmaceutical Chemistry 11th
Ed (Troy D.B Ed). Lippincott Williams and Wilkins, Philadelphia: 65-126
Dimelow R.J., Metcalfe P.D., Thomas S. (2012). In silico models of drug metabolism and
drug interactions. Encyclopedia of Drug Metabolism and Interactions VI: 1-55

Chapter 2
31
Dos Santos M.D., Martins P.R., Dos Santos P.A., Bortocan R., Iamamoto Y., Lopes N.P.
(2005). Oxidative metabolism of 5-o-caffeoylquinic acid (chlorogenic acid), a bioactive
natural product by metalloporphyrin and rat liver mitochondria. European Journal of
Pharmaceutical Sciences 26: 62-70
Dybing E., Holme J.A., Gordon W.P., Søderlund E.J., Dahlin D.C., Nelson S.D. (1984).
Genotoxicity studies with paracetamol. Mutation Research 138: 21-32
Feiters M.C., Rowan A.E., Nolte R.J.M. (2000). From simple to supramolecular cytochrome
P450 mimics. Chemical Society Reviews 29: 375-384
Fleming I. (2001). Cytochrome P450 enzymes in vascular homeostasis. Circulation Research
89:753-762
Gotardo M.C.A.F., De Moraes L.A.B., Assis M.D. (2006). Metalloporphyrins as biomimetic
models for cytochrome-P450 in the oxidation of atrazine. Journal of Agricultural and Food
Chemistry 54: 10011-10018
Groves J.T., Nemo T.E., Myers R.S. (1979). Hydroxylation and epoxidation of catalysed by
iron-porphine complexes. Oxygen transfer from iodosylbenzene. Journal of American
Chemical Society 101: 1032-1033
Guengerich, F.P. (2006). Cytochrome P450s and Other Enzymes in Drug Metabolism and
Toxicity. The AAPS Journal 8: E101-E111
Gunaratna, C. (2000). Drug Metabolism and Pharmacokinetics in Drug Discovery: A primer
for Bioanalytical Chemists, Part 1. Current Separations 19: 17-23
Hughes J.P., Rees S., Kalindjian S.B., Philpott K.L. (2011). Principles of early drug
discovery. British Journal of Pharmacology 162: 1239-1249
Ionescu, C. and Caira, M.R. (2006). Drug Metabolism in Concept. Drug Metabolism: Current
Concepts. Berlin: Springer. 1-2.

Chapter 2
32
Kumar G.N., Surapaneni S. (2001). Role of drug metabolism in drug discovery and
development. Medicinal Research Reviews 21: 397-411
LeCluyse E.L. (2001). Human hepatocyte culture systems for the in vitro evaluation of
cytochrome P450 expression and regulation. European Journal of Pharmaceutical Sciences
13: 343-368
Lin J.H., Lu A.Y.H. (1997). Role of pharmacokinetics and metabolism in drug discovery and
development. The American Society for Pharmacology and Experimental Therapeutics 49:
404-449
Lohmann, W. and Karst, U. (2008). Biomimetic modeling of oxidative drug metabolism.
Analytical and Bioanalytical Chemistry 391: 79-96
Mansuy D., Battioni P., Battioni J. (1989). Chemical model systems for drug-metabolizing
cytochrome P-450-dependent monooxygenases. European Journal of Biochemistry 184: 267-
285
Meunier B. (1992). Metalloporphyrins as versatile catalysts for oxidation reactions and
oxidative DNA cleavage. Chemical Reviews 92: 1411-1456
Nantes I.L., Durán N., Pinto S.M.S., da Silva F.B., de Souza J.S., Isoda N., Luz R.A.S., de
Oliveira T.G., Fernandes V.G. (2011). Modulation of the catalytic activity of porphyrins by
lipid-and surfactant-containing nanostructures. Journal of Brazilian Chemical Society 22:
1621-1633
Nicolau K.C. (2014). Advancing the drug discovery and development process. Angewandte
Chemie International Edition 53: 9128-9140
Niehues M., Barros V.P., da Silva E., Dias-Baruffi M., Assis M.D., Lopes N.P. (2012).
Biomimetic in vitro oxidation of lapachol: a model to predict and analyse the in vivo phase I
metabolism of bioactive compounds. European Journal of Medicinal Chemistry 54: 804-812

Chapter 2
33
Ntie-Kang F., Lifongo L.L., Mbah J.A., Owono Owono L.C., Megnassan E., Mbaze L.M.,
Judson P.N., Sippl W., Efange S.M. (2013). In silico drug metabolism and pharmacokinetic
profiles of natural products from medicinal plants in the Congo basin. In silico Pharmacology
1 (12): 1-12
Othman S., Mansuy-Mouries V., Bensoussan C., Battioni P., Mansuy D. (2000).
Hydroxylation of diclofenac: an illustration of the complementary roles of biomimetic
metalloporphyrin catalysts and yeasts expressing human cytochromes P450 in drug
metabolism studies. Comptes Rendus de l'Academie des Sciences Series IIC Chemistry 3:
751-755
Smith F.T., Clark R. (2004). Chapter 5 Prodrugs and Drug Latentiation. Wilson and
Gisvold’s Textbook of Organic and Pharmaceutical Chemistry 11th Ed (Troy D.B Ed).
Lippincott Williams and Wilkins, Philadelphia: 142-159
Stachulski A.V. (2000). Drug Metabolism: The Body’s Defence against Chemical Attack.
Journal of Chemical Education 77: 349-353
Tingle M.D., Helsby N.A. (2006). Can in vitro drug metabolism studies with human tissue
replace in vivo animal studies?. Environmental Toxicology and Pharmacology 21: 184-190
Vaclavikova R., Soucek P., Svobodova L., Anzenbacher P., Simek P., Guengerich F.P., Gut
I. (2004). Different in vitro metabolism of paclitaxel and docetaxel in humans, rats, pigs and
minipigs. Drug Metabolism and Disposition 32: 666-674
Wrighton S.A., Ring B.J., Vandenbranden M. (1995). The use of in vitro metabolism
techniques in the planning and interpretation of drug safety studies. Toxicologic Pathology
23: 199-208
Xie Y., McGill M.R., Dorko K., Kumer S.C., Schmitt T.M., Forster J., Jaeschke H. (2014).
Mechanisms of acetaminophen-induced cell death in primary human hepatocytes. Toxicology
and Applied Pharmacology 279: 266-274

Chapter 2
34
Zhang T., Chen Q., Li L., Liu L.A., Wei D.Q. (2011). In silico prediction of cytochrome
P450-mediated drug metabolism. Combinatorial Chemistry and High Throughput Screening
14:388-395

Chapter 3
35
Chapter 3
Natural products from Brassicophycus brassicaeformis and
related species
Abstract
Brown algae of the family Sargassaceae are responsible for the production of the vast
majority of biologically active brown algal secondary metabolites. Biological activities
exhibited by these metabolites include cytotoxic, antimicrobial, and antifouling activities. In
continuation of our search for new biologically active metabolites from South African marine
algae, an examination of the organic extracts of the alga Brassicophycus brassicaeformis was
conducted.
Two monogalactosyldiacylglycerol lipids 1-O-(5Z,8Z,11Z,14Z-eicosatetraenoyl)-2-O-
(9Z,12Z,15Z-octadecatrienoyl)-3-O-β-D-galactopyranosyl-sn-glycerol (3.17) and 1-O-(9Z-
octadecenoyl)-2-O-(hexadecanoyl)-3-O-β-D-galactopyranosyl-sn-glycerol (3.18) were
isolated, as well as two known compounds fucosterol (3.9) and fucoxanthin (3.16).
This study represents the first phytochemical investigation of Brassicophycus
brassicaeformis.

Chapter 3
36
Chapter 3
Natural products from Brassicophycus brassicaeformis and
related species
3.1. General introduction
Brassicophycus brassicaeformis is a brown marine algae belonging to the Family
Sargassaecae, a combination of the families of Sargassaceae and Cystoseiraceae (Muñoz et
al., 2013). It was previously described as Bifurcaria brassicaeformis (Kützing) (Culioli et
al., 2004) belonging to the genus Bifurcaria Stackhouse a small genus in the family
Cystoseiraceae with three species: Bifurcaria bifurcata (Velley) R.Ross which is distributed
on the Atlantic coasts from Morocco (south) to north west Ireland (north); Bifurcaria
brassicaeformis which is distributed on the western (Stegenga et al., 1997) and Indian ocean
coasts of South Africa (Silva et al., 1996) and Bifurcaria galapagensis (Piccone and Grünow)
Womersley which distributed in the Galapagos (Culioli et al., 2004; Valls and Piovetti,
1995b).
A study by Draisma et al., (2010) showed the genus Bifurcaria as not being monophyletic
with European Bifurcaria bifurcata (accepted name Bifurcaria tuberculata) and thus the
authors suggested that B. brassicaeformis and B. tuberculata be classified as two separate
genera. The three species of Bifurcaria were shown to possess chemotaxonomic differences
which further support the difference between B. bifurcata, B. galapagensis and B.
brassicaeformis. B. bifurcata is known to produce a wide array of acyclic diterpenes; B.
galapagensis produces meroditerpenes as secondary metabolites whilst B. brassicaeformis
does not produce diterpenes but is rich in sterols (Culioli et al., 2004; Draisma et al., 2010).
Structural differences between B. brassicaeformis and the other two species, further supports
the idea postulated by Draisma et al., (2010). B. bifurcaria and B. galapagensis are

Chapter 3
37
monoecious and the algae branches tri-radiate. Both species have conceptacles that are
scattered with where B. bifurcata does not retain the eggs to the receptacles (Draisma et al.,
2010). B. brassicaeformis, however, is dioecious with flat receptacles which expel eggs that
remain part of the stalks of the algae. It branches bilaterally with conceptacles marginalised
on flat receptacles (Draisma et al., 2010). With all these differences, Draisma et al., (2010)
therefore proposed that B. brassicaeformis be classified in a genus of its own viz.
Brassicophycus Draisma, Ballesteros, F.Rousseau and T. Thibaut, a monotypic genus fourth
sargassacean and fifth fucalean endemic to South Africa.
Table 3.1 Summary of the differences between B. brassicaeformis, B. bifurcata, B.
galapagensis
B. brassicaeformis B. bifurcata B. galapagensis
Distribution
South Africa Europe (west) Galapagos
Secondary
metabolites
No diterpenoids
Sterols
Acyclic diterpenes Cyclic
meroditerpenes
Sexual reproduction
structures
Dioecious
Extruded eggs
remain part of algae
stalk
Monoecious
Eggs not retained to
receptacles
Monoecious
Branching of algae
Bilaterally Tri-radiate Tri-radiate
(Daoudi et al., 2001; Culioli et al., 2004; Draisma et al., 2010)

Chapter 3
38
3.1.1. Secondary metabolites from Genus Bifurcaria
Acyclic diterpenes isolated from B. bifurcata (Figure 3.1, structures 3.1-3.7) are
geranylgeraniol (3.1) derived diterpenes and this precursor has been previously isolated from
two Cystoseira brachycarpa and C. balearica species as well as the genus Bifurcaria (Culioli
et al., 1999a). Isolation of geranylgeraniol from B. bifurcata shows a close relationship
between these species and the Mediterranean Cystoseiraceae species i.e. C. brachycarpa and
C. balearica, the last of the Cystoseira species which produces linear diterpenes (Culioli et
al., 1999b; Muñoz, 2013).
OH
3.1
OH
OH
OH
O
3.2
3.3
O
OH
O
3.4
O O3.5
O
O
3.6
O O
O
HO3.7
Figure 3.1 Acyclic diterpenes isolated from Bifurcaria bifurcata

Chapter 3
39
B. galapagensis produces monocyclic diterpenoid metabolites with a methyl hydroquinone
moiety (Combaut and Piovetti, 1983). An example of this class of metabolite is bifurcarenone
(3.8). However, B. galapagensis has been considered to be extinct as it has not been observed
since 1983 (Muñoz et al., 2013).
OH
O
O
OH
HO
3.8
Fucosterol (3.9) is the only phytosterol isolated from organic extracts of Bifurcaria
brassicaeformis which suggest that B. brassicaeformis preferentially synthesizes sterols since
no diterpenes have been isolated (Daoudi et al., 2001). In fact, studies have shown that
fucosterol is the most abundant sterol produced by brown marine algae (Khanavi et al.,
2012).
H H
HO
H
3.9

Chapter 3
40
3.1.2 Biosynthetic pathways for secondary metabolites from genus Bifurcaria
The linear terpenes isolated from Bifurcaria bear a C16 chain with five methyl groups and
four double bonds (Figure 3.2) (Muñoz et al., 2013). Oxidation and isomerization occurs
mainly at the C-1, C-12 and C-13 positions with the C-6/C-7 and C10/-C-11 positions being
less prone to transformation (Muñoz et al., 2013). These terpene metabolites have therefore
been categorized into three main families: family A, B and C with family B being subdivided
into family B1 and B2 (Table 3.2. structures 3.10-3.13). Classification into these families
depends on the position of oxidation in the diterpenes.
OH16
20 17
113
Figure 3.2 C16 scaffold for diterpene metabolites from genus Bifurcaria (Muñoz et al., 2013)
The biosynthetic pathway of geranylgeraniol derivatives provides four major precursors to
the three family classifications of metabolites from the genus Bifurcaria. These are
geranylgeraniol (3.1), 12-hydroxygeranylgeraniol (3.2), eleganolone (3.3) and eleganediol
(Figure 3.3). Of interest is the 1,4 dehydration of 12-hydroxygeranylgeraniol which results in
a compound which belongs to both family A and C (Figure 3.3) (Muñoz et al., 2013).
Meroditerpenes such as bifurcarenone (3.8) are formed from a mixed biogenesis pathway
which results in a hydroquinone moiety linked to a diterpene. In this case, the hydroquinone
is derived from shikimic acid and the diterpene chain from geranylgeraniol. Geranylgeraniol
is therefore used by some species of Sargassaceae as an alkylating agent for the shikimic
acid, an activated aromatic substrate, to result in linear, monocyclic, bicyclic and rearranged
meroditerpene metabolites (Valls and Piovetti, 1995; Amico, 1995). Bifurcarenone for
example, is derived from the intramolecular cyclization of a linear meroditerpene precursor
(3.14) between C-7 and C-11 to form an amentane skeleton (Figure 3.4) (Valls and Piovetti,
1995).

Chapter 3
41
Table 3.2 Classification of diterpene metabolites isolated from genus Bifurcaria
Family Description Example
A
C-12 oxidized
terpenes
OHOH
3.10
B
B1
C-13 oxidized
terpenes bearing
an alcohol
OH
OH
OH
3.11
B2
C-13 oxidized
terpene bearing a
ketone
O O3.12
C
Non C-12/C-13
oxidized terpenes
OH
OH
3.13
Muñoz et al., 2013

Chapter 3
42
Fig
ure
3.3
A g
ener
al b
iosy
nth
etic
sch
eme
for
ger
anylg
eran
iol
der
ived
sec
ondar
y m
etab
oli
tes
(Mu
ño
z et
al.
, 2
013
)

Chapter 3
43
Figure 3.4 Biogenetic formation of bifurcarenone (3.8) (Valls and Piovetti, 1995)
3.1.3 Biological activity of secondary metabolites from the genus Bifurcaria
Linear diterpenes isolated from the brown alga B. bifurcata have been shown to possess
various biological activities including cytotoxic, antiulcer, antimitotic, antimicrobial and
antifouling activities (Guardia et al., 1999; Muñoz et al., 2013). Eleganolone (3.3) was shown
to be useful in the growth inhibition of several Mycobacterium strains such as M. smegmatics
(75µg/ml), M. ranae (100µg/ml) and M. avium (100µg/ml) however, it was found to be
ineffective against M. tuberculosis (Muñoz et al., 2013).
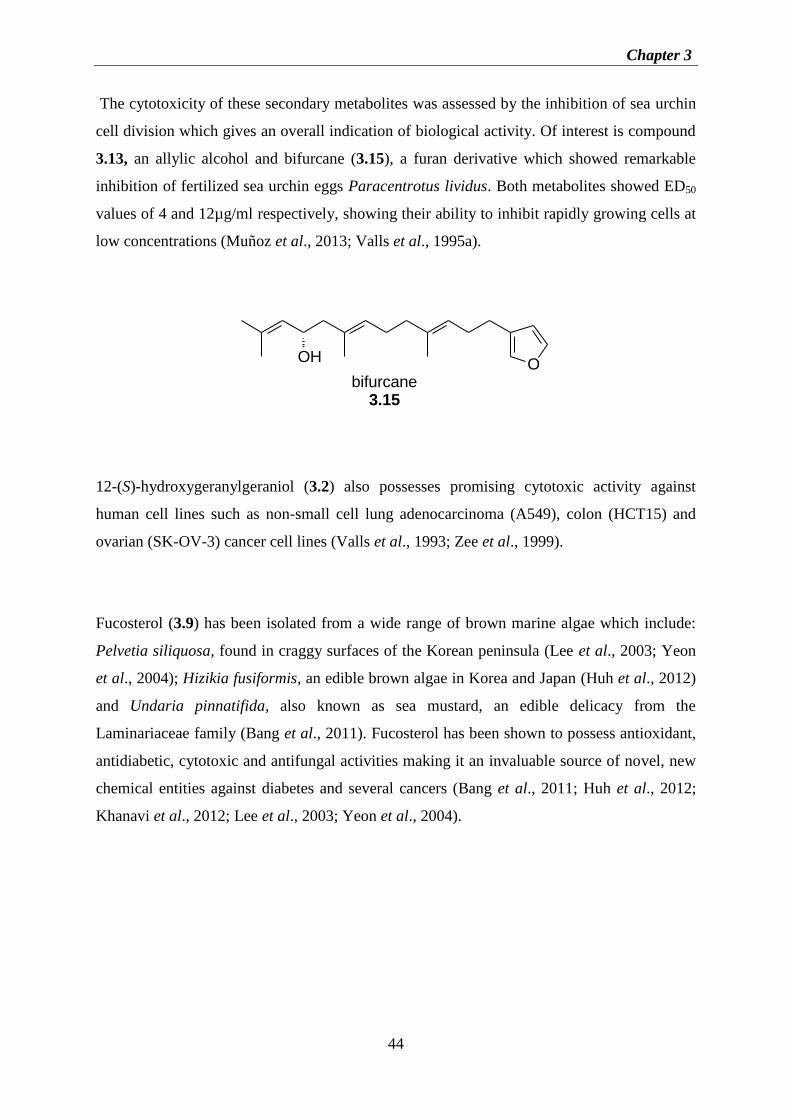
Chapter 3
44
The cytotoxicity of these secondary metabolites was assessed by the inhibition of sea urchin
cell division which gives an overall indication of biological activity. Of interest is compound
3.13, an allylic alcohol and bifurcane (3.15), a furan derivative which showed remarkable
inhibition of fertilized sea urchin eggs Paracentrotus lividus. Both metabolites showed ED50
values of 4 and 12µg/ml respectively, showing their ability to inhibit rapidly growing cells at
low concentrations (Muñoz et al., 2013; Valls et al., 1995a).
OOH
bifurcane3.15
12-(S)-hydroxygeranylgeraniol (3.2) also possesses promising cytotoxic activity against
human cell lines such as non-small cell lung adenocarcinoma (A549), colon (HCT15) and
ovarian (SK-OV-3) cancer cell lines (Valls et al., 1993; Zee et al., 1999).
Fucosterol (3.9) has been isolated from a wide range of brown marine algae which include:
Pelvetia siliquosa, found in craggy surfaces of the Korean peninsula (Lee et al., 2003; Yeon
et al., 2004); Hizikia fusiformis, an edible brown algae in Korea and Japan (Huh et al., 2012)
and Undaria pinnatifida, also known as sea mustard, an edible delicacy from the
Laminariaceae family (Bang et al., 2011). Fucosterol has been shown to possess antioxidant,
antidiabetic, cytotoxic and antifungal activities making it an invaluable source of novel, new
chemical entities against diabetes and several cancers (Bang et al., 2011; Huh et al., 2012;
Khanavi et al., 2012; Lee et al., 2003; Yeon et al., 2004).

Chapter 3
45
3.1.4 Chapter Aims and Objectives
Overall aim:
Brown algae of the family Sargassaceae are responsible for the production of the vast
majority of known, biologically active brown algal secondary metabolites. The biological
activities exhibited by these metabolites include cytotoxic, antimicrobial and antifouling
activities. In continuation of our search for new biologically active metabolites from South
African marine algae, the organic extracts of the alga, Brassicophycus brassicaeformis were
examined.
Objectives of the study:
To isolate and characterize secondary metabolites from the organic extracts of B.
brassicaeformis,
Figure 3.5 Photograph of Brassicophycus brassicaeformis4
4Photograph taken in the Faculty of Pharmacy, Rhodes University, South Africa
Collected from Glencairn beach, Western Cape, South Africa on 1/9/2012 by Professor John Bolton
(University of Capetown)

Chapter 3
46
3.2 Results and Discussion
3.2.1 Isolation of secondary metabolites from Brassicophycus brassicaeformis
The organic extract from the alga was obtained by an initial MeOH soak for 1hr which was
followed by liquid-liquid extraction using CH2Cl2-MeOH (2:1). The organic extracts were
then pooled and collected by solvent evaporation in vacuo to give the crude extract (4.19% of
the algal dry mass). The 1H-NMR spectrum of the crude B. brassicaeformis extract (Figure
3.6) showed complex signals which demanded further fractionation.
Figure 3.6 1H-NMR (600MHz, CDCl3) spectrum of the crude B. brassicaeformis extract
The crude extract was fractionated by step gradient silica gel chromatography with Hexane-
EtOAc in increasing polarity as the mobile phase (Scheme 3.1). This afforded nine fractions
(A-I) which were analyzed by 1H-NMR spectroscopy (Figure 3.7). The
1H-NMR spectra of
fractions C (Figure 3.8), E (Figure 3.9) and G (Figure 3.10) showed that they each contained
one major metabolite worth further investigation. The overlapping signals in the methylene
envelope δ 1-2.4 in 1H-NMR spectrum of fraction C suggested a steroidal structure, whilst
fraction E illustrated signals in the δ 6-7 region characteristic of fucoxanthin. Fraction G
CHCl3

Chapter 3
47
showed 1H-NMR signals characteristic of a sugar moiety (δ 3-4) and an unsaturated system (δ
5.4) characteristic of fatty acids.
Therefore, fraction C and G were further purified by HPLC whilst fraction E was purified by
silica gel column chromatography to obtain pure fractions, 3.9, 3.16, 3.17 and 3.18.
Scheme 3.1 Isolation of secondary metabolites 3.9 and 3.16-3.18 from B. brassicaeformis
Conditions: (i) Normal Phase HPLC, solvent: 7:3 Hexane-EtOAc
(ii) Silica gel column chromatography, solvent: 6:4 Hexane-EtOAc
(iii) Reversed Phase HPLC, solvent: 100% MeOH
Brassicophycus brassicaeformis
DCM-MeOH (2:1)
extraction
Crude B.
Brassicaeformis
Step Gradient column chromatography
A
10:0
(231)
B
9:1
(61)
C
8:2
(204)
D
6:4
(140)
E
4:6
(80)
F
2:8
(84)
G
0:10
(99)
H & I
Column
wash
(181)
Fraction:
Solvent
system:
Mass/mg:
3.9
12mg
3.16
38mg
3.17
18.6 mg
3.18
20mg
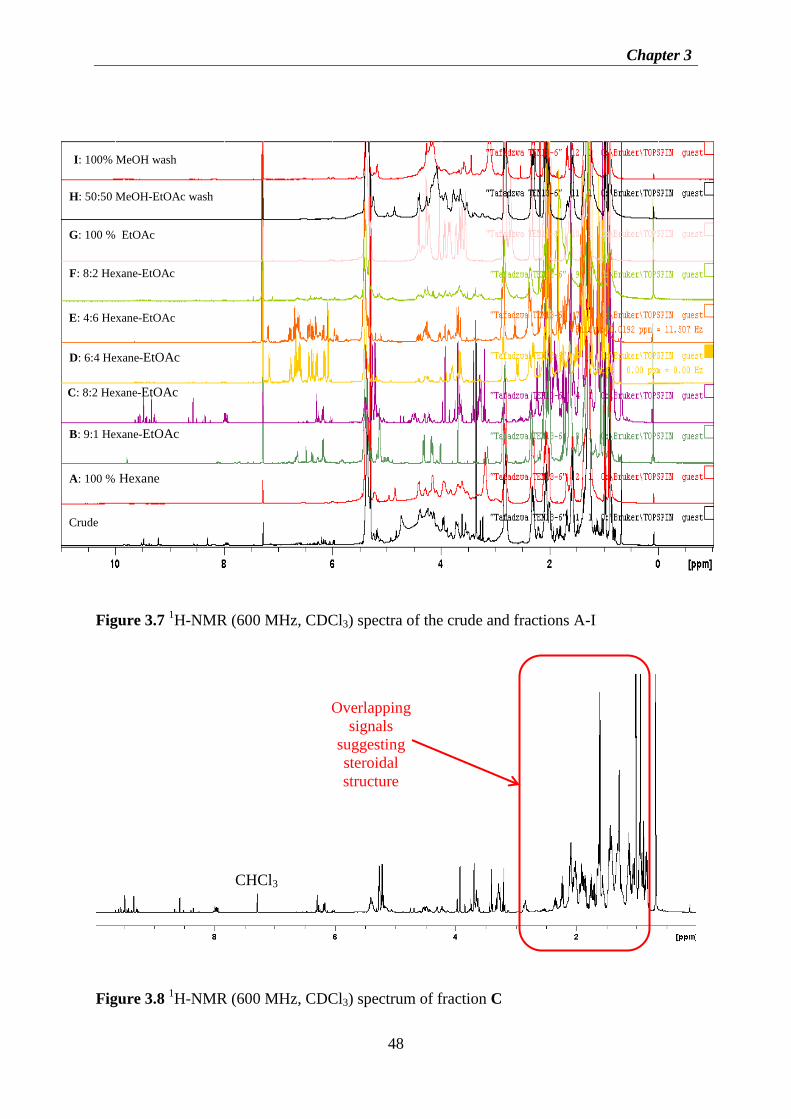
Chapter 3
48
Figure 3.7 1H-NMR (600 MHz, CDCl3) spectra of the crude and fractions A-I
Figure 3.7 1H-NMR (600 MHz, CDCl3) spectra of the crude and fractions A-I
Figure 3.8 1H-NMR (600 MHz, CDCl3) spectrum of fraction C
Crude
A: 100 % Hexane
B: 9:1 Hexane-EtOAc
C: 8:2 Hexane-EtOAc
D: 6:4 Hexane-EtOAc
E: 4:6 Hexane-EtOAc
F: 8:2 Hexane-EtOAc
G: 100 % EtOAc
H: 50:50 MeOH-EtOAc wash
I: 100% MeOH wash
Overlapping
signals
suggesting
steroidal
structure
CHCl3
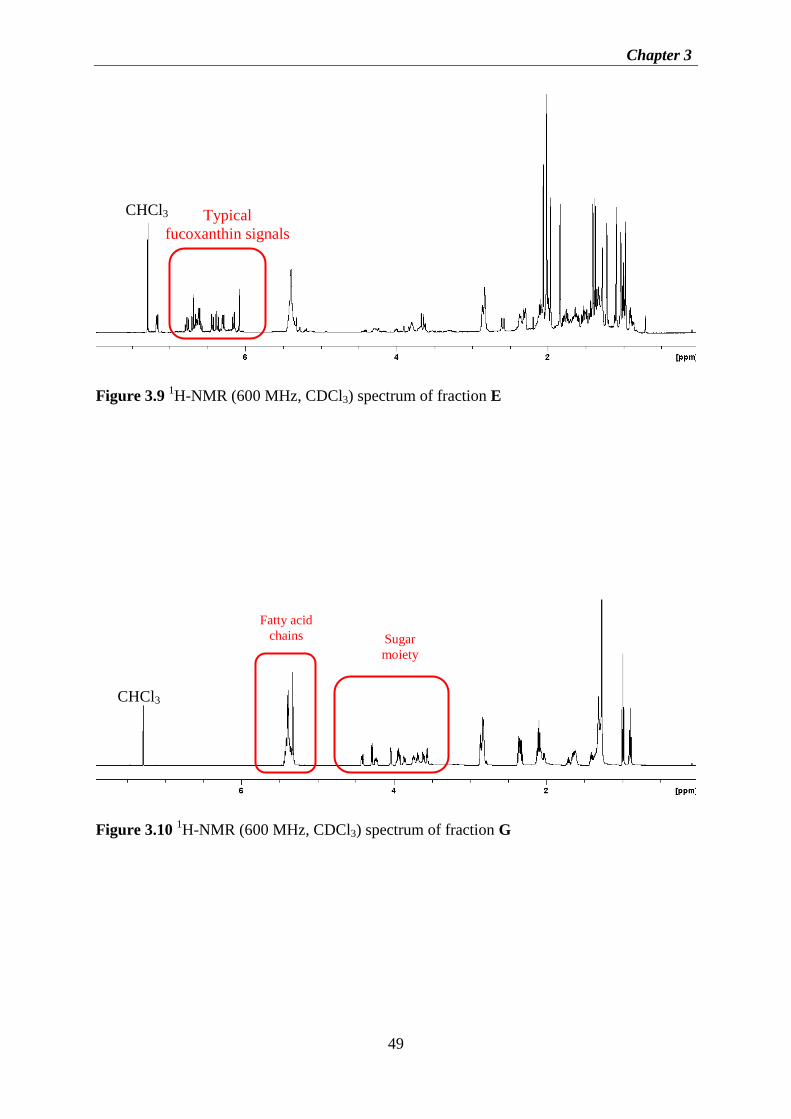
Chapter 3
49
Figure 3.9 1H-NMR (600 MHz, CDCl3) spectrum of fraction E
Figure 3.10 1H-NMR (600 MHz, CDCl3) spectrum of fraction G
Typical
fucoxanthin signals
Fatty acid
chains Sugar
moiety
CHCl3
CHCl3
Chapter 3
50
3.2.2 Structure elucidation of secondary metabolites from B. brassicaeformis
3.2.2.1 Structure elucidation of compound 3.9
Compound 3.9 was isolated by reversed phase HPLC as a whitish-green solid. Its 1H-NMR
(600 MHz, CDCl3) spectrum (Figure 3.11) displayed two olefinic methine protons at δ 5.36
(br. d, J = 4.9 Hz) and δ 5.20 (q, J = 6.7 Hz). An oxymethine proton is shown by the multiplet
residing at δ 3.54, while the doublet at δ 1.59 (d, J = 6.7 Hz) represents allylic methyl
protons. Five methyl groups were indicated by signals at: δ 1.03 (s), δ 1.01 (d, J = 6.8 Hz),
δ1.00 (d, J = 6.7 Hz), δ0.99 (d, J = 6.7 Hz) and δ 0.70 (s). The 13
C-NMR (150 MHz, CDCl3)
spectrum of 3.9 (Figure 3.12) displayed 29 carbon signals which indicated the presence of
two olefin quaternary carbons at δ 147.1 and 140.8, two olefin methine carbon signals at δ
121.8 and 115.7, an oxygenated methine carbon (δ 71.9) and two quaternary carbon signals at
δ 42.4 and 36.5. The 13
C-NMR spectrum together with the DEPT-135 and multiplicity edited-
HSQC also indicated the presence of five methine carbons (δ 56.9, 55.8, 50.2, 34.8 and 31.9),
eleven methylene carbons (δ 42.3, 39.8, 37.2, 36.5, 35.3, 31.9, 31.7, 28.3, 25.7, 24.3 and
21.1), five methyl carbons (δ 22.3, 22.1, 19.4, 18.8 and 11.7) and lastly one allylic methyl
carbon at δ 13.2. The 1H-NMR and
13C-NMR data were compared with those from the
literature and were found to be consistent with the known stigmastane sterol, fucosterol (Huh
et al., 2012). Two-dimensional NMR studies (COSY, HMBC, and HSQC) including DEPT-
135 data (Table 3.3) confirmed this assignment. Figure 3.13 gives the key HMBC
correlations observed for 3.9.

Chapter 3
51
Figure 3.11 1H-NMR spectrum (600 MHz, CDCl3) of compound 3.9
Figure 3.1213
C-NMR (150MHz, CDCl3) spectrum of compound 3.9
CHCl3
CDCl3

Chapter 3
52
Table 3.3 Comparison of observed and literature 1H-NMR (600 MHz, CDCl3) and
13C-NMR
(150 MHz, CDCl3) and observed 1H-
1H- COSY and HMBC correlations of fucosterol (3.9)
Observed Literature5 Observed
Carbon
No
δC
δC, multi δ H (multi, J in Hz)
δC
δ H (multi, J in Hz)
COSY HMBC
1 37.2 CH2 37.26
2 31.7 CH2 31.58 H-3 C-4
3 71.9 CH 3.53 (m) 71.62 3.53 (m) H-2, H-4
4 42.3 CH2 42.24 H-3
5 140.8 C 140.76
6 121.8 CH 5.36 (d, 5.2) 121.52 5.31 (d, 4.8) H-7
7 31.9 CH2 31.89 H-6
8 31.9 CH 31.86
9 50.2 CH 50.14
10 36.5 C 36.46
11 21.1 CH2 21.05
12 39.8 CH2 39.75 C-18
13 42.4 C 42.31
14 56.9 CH 56.74
15 24.3 CH2 24.28
16 28.3 CH2 28.17
17 55.8 CH 55.81
18 11.7 CH3 0.70 (s) 11.79 0.66 (s)
19 19.4 CH3 1.02 (s) 19.33 0.98 (s)
20 36.6 CH 36.35
21 18.8 CH3 1.01 (d, 6.8) 18.73 0.97 (d, 6.8)
22 35.3 CH2 35.19 C-16, C-23
23 25.7 CH2 25.71 C-28
24 147.1 C 146.86
25 34.8 CH 34.72
26 22.3 CH3 0.99 (d,6.8) 22.19 0.96 (d, 6.8) C-25, C-28
27 22.1 CH3 1.01 (d, 6.8) 22.09 0.96 (d, 6.8)
28 115.7 CH 5.20 (q, 6.8) 115.50 5.15 (q, 6.8) H-29
29 13.2 CH3 1.59 (d, 6.8) 13.11 1.54 (d, 6.8) H-28 C-29, C-24
Assignments completed based on the COSY, HMBC and HSQC correlations observed
5 Huh et al., 2012

Chapter 3
53
Figure 3.13 Key HMBC correlations observed for compound 3.9
The isolation of fucosterol from B. brassicaeformis is consistent with literature in stating that
fucosterol is the most abundant sterol in Bifurcaria brassicaeformis (the former genus name
for Brassicophycus brassicaeformis) (Daoudi et al., 2001; Draisma et al., 2010).
3.2.2.2 The structure elucidation of compound 3.16
Compound 3.16 was isolated as a yellow-brown paste. Its 1H-NMR spectrum (Figure 3.14)
was characterized by a cluster of signals in the region δ 6.07-6.78 together with a distinct
doublet at δ 7.16 (d, J = 11.4 Hz). The 13
C- NMR spectrum (Figure 3.15) of 3.16 illustrated
42 resonances with most signals in the region δ 100-150 which are characteristic of olefin
carbon signals, suggesting that the compound is rich in double bonds. Thirteen quaternary
carbons signals were denoted from 13
C-NMR spectra of compound 3.16. Of importance is
the oxygenated quaternary carbon at δ 72.8 (C-5’) and the carbons associated epoxide at C-5
and 6 signalled by δ 66.2 and 67.1. Another characteristic signal includes a carbon associated
with a conjugated ketone at δ 197.8 (C-8) and an oxymethine signal at δ 64.4 is present
corresponding to C-3. The spectral region δ 10-35 presented ten characteristic methyl signals
at δ 11.8 (C-19), 12.8 (C-20), 12.9 (C-20’), 14.0 (C-19’), 21.2 (C-18), 21.4 (C-16’), 25.1 (C-
16), 28.1 (C-17), 31.3 (C-18’) and 32.1 (C-17’). Moreover, the compound’s yellow-brown
colour also suggested the presence of a highly conjugated system such as those present in

Chapter 3
54
carotenoid pigments. Due to overlapping signals in 1H-NMR spectrum of compound 3.16 it
was difficult to analyze the spectrum; the data of compound 3.16 was therefore compared
with the spectroscopic data available from literature (Mori et al., 2004; Afolayan et al., 2008)
allowing the assignment of 3.16 as fucoxanthin.
Fucoxanthin is an abundant carotenoid in brown algae (Phaeophycae) and has been
postulated to be an accessory pigment in photosynthesis (Bonnett et al., 1969). It is mostly
isolated from the edible brown algae of some European and South East Asian countries which
include; Hizikia fusiformis and Undaria pinnatifida (Peng et al., 2011). Fucoxanthin has
exhibited remarkable biological activities which have been linked to its unique carotenoid
structure, possessing antioxidant, antimalarial, anti-inflammatory, anti-cancer and even anti-
obesity activities. Fucoxanthin’s broad spectrum of biological activities makes it lucrative as
a potential new chemical entity in drug discovery (Jongaramruong et al., 2007; Peng et al.,
2011).
.
O
O
OH
HOO
O
3.16
Figure 3.14 1H-NMR spectrum (600 MHz, CDCl3) of compound 3.16
CHCl3

Chapter 3
55
Figure 3.15 13
C-NMR spectrum (150 MHz, CDCl3) of compound 3.16
3.2.2.3 The structure elucidation of compound 3.17 and 3.18
Compounds 3.17 and 3.18 were isolated as colourless oils. The 1H-NMR spectra of the
compounds were similar, with three spectral regions characteristic of glycolipid molecules.
The region δ 0.8- 2.9 showed complex overlapping signals characteristic of methylene and
methyl protons within fatty acids, with differences in the spectra of 3.17 and 3.18 arising due
to the degree of unsaturation of the fatty acids as seen by the allylic methylene protons at δ
2.8 (br m) (Figure 3.16). The terminal methyl protons are signalled at about δ 1.0.
Furthermore, the cluster of signals at about δ 5.4 further supports the presence of an
unsaturated linear system as observed in fatty acid chains. The sugar moiety is represented by
the signals residing at δ 3.5-4.5. Due to the complexity of the signals in the 1H-NMR spectra
of compounds 3.17 and 3.18, 13
C and two-dimensional NMR studies (COSY, HMBC, and
HSQC), as well GC-MS and high resolution mass spectrometry were utilized in deducing the
structures of these compounds.

Chapter 3
56
O
OH
HO
OH
OH
O
O
O
O
O3.17
O
OH
HO
OH
OH
O
O
O
O
O
3.18
Figure 3.16 1H-NMR spectra (600 MHz, CDCl3) of crude fraction G and purified
compounds 3.17 and 3.18
CHCl
Differences in the
presence of allylic
methylene protons
Fraction G
Compound
3.17
Compound
3.18
Terminal methyl
protons in a fatty
acid

Chapter 3
57
The 13
C-NMR spectra of compounds 3.17 and 3.18 (Figure 3.17) showed resonances
characteristic of the different types of carbons present in the two compounds. The signal at
around δ 170 is characteristic of a carbonyl associated with an ester. The most important
difference between the two spectra is in the olefinic region (δ 125-135). Compound 3.18
contains a single double bond (δ 129.9 and 130.3), while compound 3.17 contains seven
methylene-interrupted double bond with carbon resonances in the cluster in the δ 126- 133.
Figure 3.17 13
C-NMR (150 MHz, CDCl3) spectra of 3.17 and 3.18
The acetal carbon at about δ 105 is characteristic of an anomeric carbon linking a sugar
moiety to a fatty acid chain. The carbon resonances characteristic of the sugar moiety had
signals within the region δ 60-105. However the carbon signals due to the glycerol moiety are
found in this same region and have been highlighted in Figure 3.17 (δ 63, 68 and 70). The
quaternary carbon, methine, methylene and methyl groups forming the majority of the fatty
acid carbon chain are represented in the δ 10-40 region. Analysis of the NMR spectroscopic
data together with comparisons to literature allowed the assignment of two
monogalactosylglycerol lipids which differ in fatty acid chain composition (Kim et al., 2007;
Imbs et al., 2013).
63 68 70
-C=O
(ester)
-C=C O-C- -C-OH
C, CH, CH2, CH3
Compound
3.17
Compound
3.18

Chapter 3
58
Table 3.4 1H-NMR (600 MHz, CDCl3) and
13C-NMR (150 MHz, CDCl3) assignments for
galactosylglycerol moieties of 3.17 and 3.18
3.17 3.18
Carbon
no.
δC
δC multi δH (multi, J in Hz)
δC δH (multi, J in Hz)
1 63.2 CH2 4.40 (dd, 12.0, 2.3)
4.23 (dd, 12.0, 6.3)
63.2 4.41 (dd, 12.0, 2.3)
4.23 (dd,12.0, 6.4)
2 70.5 CH 5.36 (m) 70.4 5.35 (m)
3 68.7 CH2 3.99 (dd,11.1, 5.4)
3.76 (dd, 11.3, 6.2)
68.7 4.00 (dd,12.2, 5.8)
3.76 (dd,11.3, 6.2)
1’’’
104.2 CH 4.29 (d, 7.4) 104.2 4.30 (d, 7.4)
2’’’
72.0 CH 3.64 (m) 72.0 3.65 (m)
3’’’
73.7 CH 3.89 (m) 73.7 3.89 (m)
4’’’
69.8 CH 3.93 (dd, 11.1, 5.4) 69.8 3.92 (dd, 11.1, 5.4)
5’’
74.8 CH 3.61 (m) 74.8 3.62 (m)
6’’’
63.0 CH2 3.88 (dd, 10.8, 4.6)
3.62 (m)
62.9 3.88 (dd, 10.8, 4.6)
3.63 (m)
Assignments completed based on the COSY and HMBC correlations observed
The linkage of the glycerol moiety to the galactosyl sugar was identified via a series of 1H-
1H-COSY and HMBC experiments. The methylene protons of the glycerol unit at H-3 (δ 3.99
and 3.76) exhibited HMBC correlations to the anomeric carbon in the sugar moiety at C-1’’’
(δ 104.2) as well as correlations to the methylene carbon at C-1 (δ 63.2) on the glycerol unit.
The methine proton at position H-3 (δ 5.36) of the glycerol showed HMBC correlations to
methylene carbon at position C-1 (δ 63.2) in the same glycerol unit. 1H-
1H COSY
correlations were observed between the methine proton at position H-2 (δ 5.36) and the two
methylene protons at position H-1 (δ 4.41) and H-3 (δ 3.76) in the determination of the
glycerol unit. Table 3.4 illustrates these important spectroscopic correlations. The key 1H-
1H

Chapter 3
59
COSY and HMBC correlations of the galactosylglycerol unit are shown in Figure 3.18
below.
Figure 3.18 Key 1H-
1H COSY and HMBC correlations observed for the galactosylglycerol
unit in compounds 3.17 and 3.18
Overlapping NMR signals made it difficult to ascertain the fatty acid composition of both
3.17 and 3.18; therefore fatty acid methyl ester (FAME) analysis studies were conducted in
order to determine the composition of the fatty acid chains. Compounds 3.17 and 3.18 were
each treated with a 14% boron trifluoride-MeOH reagent following the method reported by
Metcalfe and Schmitz (1961) and Morrison and Smith (1964). The resultant fatty acid methyl
esters were analyzed via Gas Chromatography-Mass spectrometry (GC-MS) (Metcalfe and
Schmitz, 1961; Morrison and Smith, 1964) (Scheme 3.2).

Chapter 3
60
O
OH
HO
OH
OH
O
O
O
O
R''
R'
O
14 % BF3-MeOH
O
OH
HO
OH
OH
OH
OH
OHHOH3CO R'
O
H3CO
O
R''+ ++
Scheme 3.2 FAME analysis of monogalactosylglycerol lipids
Conditions: i) Reflux for 30 min in MeOH
Mass spectral data from the fractions with the most abundant peaks on the gas chromatogram
were considered to be the fractions containing the fatty acid methyl esters of 3.17 (Figure
3.19) and 3.18 (Figure 3.20). The fatty acid methyl esters were compared to a library of
FAME esters of several fatty acids in the identification process.
Mass spectra of the FAME products of 3.17 obtained from GC, indicated that the peak at 15.8
min (Figure 3.19) contained one of the methyl esters of the compound. The m/z peak was
obtained at m/z 292.2 and corresponds to a molecular formula of C19H32O2. These values
were compared to the fatty acid standards to determine that the peak corresponds to methyl
9Z,12Z,15Z-octadecatrienoate (FAME of linolenic acid (18:3) 3.171). The GC peak at 20.7
min (Figure 3.19) in the analysis of the methyl ester products compound of 3.17 represented
the second fatty acid in this compound. The m/z peak in the mass spectrum was determined to
be at m/z 318.2 with a molecular formula C21H34O2 which corresponds to the methyl
5Z,8Z,11Z,14Z-eicosatetraenoate (FAME of arachidonic acid (20:4) 3.172).

Chapter 3
61
Figure 3.19 GC-MS data for FAME analysis of 3.17
6 . 0 0 8 . 0 0 1 0 . 0 0 1 2 . 0 0 1 4 . 0 0 1 6 . 0 0 1 8 . 0 0 2 0 . 0 0 2 2 . 0 0 2 4 . 0 0
5 0 0 0 0 0
1 0 0 0 0 0 0
1 5 0 0 0 0 0
2 0 0 0 0 0 0
2 5 0 0 0 0 0
3 0 0 0 0 0 0
3 5 0 0 0 0 0
4 0 0 0 0 0 0
4 5 0 0 0 0 0
5 0 0 0 0 0 0
5 5 0 0 0 0 0
T i m e - - >
A b u n d a n c e
T I C : T E M 1 4 _ 8 6 G . D \ d a t a . m s
6 . 7 3 0
1 2 . 0 2 9
1 5 . 6 9 7
1 5 . 8 5 2
1 6 . 3 4 4
1 7 . 3 2 8
2 0 . 7 7 5
2 4 . 9 9 1
4 0 6 0 8 0 1 0 0 1 2 0 1 4 0 1 6 0 1 8 0 2 0 0 2 2 0 2 4 0 2 6 0 2 8 0
0
5 0 0 0 0
1 0 0 0 0 0
1 5 0 0 0 0
2 0 0 0 0 0
2 5 0 0 0 0
3 0 0 0 0 0
3 5 0 0 0 0
4 0 0 0 0 0
4 5 0 0 0 0
m / z - ->
A b u n d a n c e
S c a n 1 8 4 3 (1 5 . 8 2 9 m in ) : T E M 1 4 _ 8 6 G . D \ d a t a . m s ( -1 8 6 5 ) ( - )
7 9 . 0
4 1 . 0
1 0 5 . 1
1 6 1 . 11 3 3 . 05 9 . 0
1 9 4 . 12 2 1 . 1
2 6 1 . 1 2 9 0 . 12 4 1 . 1
40 60 80 100 120 140 160 180 200 220 240 260 280 300 320 3400
20000
40000
60000
80000
100000
120000
140000
160000
180000
200000
220000
240000
260000
m/ z-->
Abundanc e
Sc an 2686 (20.743 min): T EM 14_86G.D \ data.ms (-2666) (-)79.0
41.0 105.1
133.0
161.1 201.2247.1 287.1223.1 342.0
Gas Chromatogram of Fame of 3.17
MS spectrum at 15.8min
MS spectrum at 20.7min

Chapter 3
62
The gas chromatogram for the FAME analysis carried out on 3.18 (Figure 3.20) showed a
peak at 12.0 min which was one of the two abundant peaks observed. The mass spectra at this
retention time gave a molecular ion m/z at 270.1 which corresponds to a molecular formula of
C17H34O2. The fatty acid methyl ester was identified as methyl hexadecanoate (FAME of
palmitic acid (16:0) 3.181). Another GC peak at 16.5min gave a molecular ion peak at m/z
296.3 in the mass spectrum with a molecular formula of C19H36O2. This, however, suggested
two possible fatty acids either the cis- isomer methyl 9Z-octadecenoate (FAME of oleic acid
(18:1)) or the trans- isomer methyl 9E-octadecenoate (FAME of elaidic acid (18:1)). To
identify the isomer further 1H-NMR analysis of compound 3.18 was carried out. The
multiplet present at δ 5.36 was observed as two triplets overlaying each other, due to the
methine protons of the double bond. The coupling constants were determined for each triplet
and found to be J= 9.97 Hz for both triplets which is characteristic of a cis double bond.
Therefore the fatty acid was determined to be methyl 9Z-octadecenoate 3.182).

Chapter 3
63
Figure 3.20 GC-MS data for FAME analysis of 3.18
6 . 0 0 8 . 0 0 1 0 . 0 0 1 2 . 0 0 1 4 . 0 0 1 6 . 0 0 1 8 . 0 0 2 0 . 0 0 2 2 . 0 0 2 4 . 0 0
5 0 0 0 0 0
1 0 0 0 0 0 0
1 5 0 0 0 0 0
2 0 0 0 0 0 0
2 5 0 0 0 0 0
3 0 0 0 0 0 0
3 5 0 0 0 0 0
4 0 0 0 0 0 0
4 5 0 0 0 0 0
5 0 0 0 0 0 0
5 5 0 0 0 0 0
6 0 0 0 0 0 0
6 5 0 0 0 0 0
7 0 0 0 0 0 0
7 5 0 0 0 0 0
8 0 0 0 0 0 0
8 5 0 0 0 0 0
9 0 0 0 0 0 0
9 5 0 0 0 0 0
1 e + 0 7
1 . 0 5 e + 0 7
T i m e - - >
A b u n d a n c e
T I C : T E M 1 4 _ 8 6 P . D \ d a t a . m s
1 0 . 5 7 6
1 2 . 0 8 5
1 5 . 7 2 5
1 6 . 5 0 5
1 7 . 3 9 6 2 4 . 4 5 92 4 . 6 7 4
2 5 . 0 0 8
4 0 6 0 8 0 1 0 0 1 2 0 1 4 0 1 6 0 1 8 0 2 0 0 2 2 0 2 4 0 2 6 0 2 8 0
0
1 0 0 0 0 0
2 0 0 0 0 0
3 0 0 0 0 0
4 0 0 0 0 0
5 0 0 0 0 0
6 0 0 0 0 0
7 0 0 0 0 0
8 0 0 0 0 0
9 0 0 0 0 0
1 0 0 0 0 0 0
1 1 0 0 0 0 0
1 2 0 0 0 0 0
1 3 0 0 0 0 0
1 4 0 0 0 0 0
1 5 0 0 0 0 0
1 6 0 0 0 0 0
m / z - - >
A b u n d a n c e
S c a n 1 1 9 7 ( 1 2 . 0 6 4 m i n ) : T E M 1 4 _ 8 6 P . D \ d a t a . m s ( - 1 1 6 4 ) ( - )
7 4 . 0
4 3 . 1
1 4 3 . 1
2 2 7 . 2
2 7 0 . 1
9 7 . 1 1 8 5 . 1
1 1 5 . 11 6 3 . 1 2 0 9 . 1
4 0 6 0 8 0 1 0 0 1 2 0 1 4 0 1 6 0 1 8 0 2 0 0 2 2 0 2 4 0 2 6 0 2 8 0 3 0 0
0
2 0 0 0 0
4 0 0 0 0
6 0 0 0 0
8 0 0 0 0
1 0 0 0 0 0
1 2 0 0 0 0
1 4 0 0 0 0
1 6 0 0 0 0
1 8 0 0 0 0
2 0 0 0 0 0
2 2 0 0 0 0
2 4 0 0 0 0
2 6 0 0 0 0
2 8 0 0 0 0
3 0 0 0 0 0
3 2 0 0 0 0
3 4 0 0 0 0
m / z - - >
A b u n d a n c e
S c a n 1 9 5 5 ( 1 6 . 4 8 2 m i n ) : T E M 1 4 _ 8 6 P . D \ d a t a . m s ( - 1 9 8 5 ) ( - )
5 5 . 1
8 3 . 1
2 6 4 . 1
1 1 0 . 1
2 2 2 . 2
1 8 0 . 21 3 7 . 1
2 9 6 . 3
1 5 7 . 1 2 0 0 . 1
Gas Chromatogram of fame of 3.18
MS spectra at 12.0mim
MS spectra at 16.5min

Chapter 3
64
High resolution mass spectrometry (HRESIMS) was conducted on compound 3.17 and 3.18
whilst Liquid Chromatography-Mass Spectrometry (LCMS) was conducted on the crude
fraction G to assist with the FAME analysis data. The results are thus tabulated below (Table
3.5). The calculated mass of compound 3.18 matched the HRESIMS mass, as well as the low
resolution mass spectrometry (LC-MS) giving the molecular formula as C43H80O10 for
compound 3.18. The HRESIMS for compound 3.17 could not be determined, probably due to
its poor stability, and therefore low resolution mass spectrometry (LCMS) as well as FAME
analysis data were used in determining the compound’s molecular formula. With careful
analysis, the molecular formula of 3.18 was determined to be C47H76O10.
Table 3.5 HRESIMS and LC-MS data for compound 3.17 and 3.18
3.17 3.18
Proposed formula C43H80O10 C47H76O10 1H 80.626 76.5947
12C 516 564
16O 159.9492 159.9492
Calculated m/z value 756.5752 800.5439
ESI +
(+Na)
HRMS ESI m/z value 779.5664 ND
Calculated m/z value 779.5649 823.5336
Difference 0.00148 -
ESI-
(+35
Cl)
HRMS m/z value 791.5440 ND
Calculated m/z value 791.5440 835.5127
Difference 0.0000 -
ESI-
(+37
Cl)
HRMS m/z value 793.5401 ND
Calculated m/z value 793.5411 837.5098
Difference 0.001 -
LC-MS
(+Na)
LC-MS m/z value 779.51 823.64
Calculated m/z value 779.5649 823.5336
Difference 0.05492 0.10638
ND= Not Determined
Differences

Chapter 3
65
Therefore, 3.17 was assigned as 1-O-(5Z,8Z,11Z,14Z-eicosatetraenoyl)-2-O-(9Z,12Z,15Z-
octadecatrienoyl)-3-O-β-D-galactopyranosyl-sn-glycerol and 3.18 assigned as 1-O-(9Z-
octadecenoyl)-2-O-(hexadecanoyl)-3-O-β-D-galactopyranosyl-sn-glycerol.
Monogalactosyldiacylglycerols (MGDGs) are a major component of photosynthetic
membranes in plants, algae and even bacteria. In some species of Phaeophycae, MGDGs
have been produced as herbivore deterrents (Deal et al., 2003; Kim et al., 2007). In the search
for new, biologically active natural products, MGDGs have been found to possess numerous
activities making them suitable candidates as novel drugs in medicinal chemistry. These
MGDGs have been found to possess anti-tumor, anti-viral as well as anti-inflammatory
activities. Bruno et al., (2005) have postulated that the biological activities of these MGDGs
are linked to the degree of unsaturation of the fatty acid chain; i.e. MGDGs with highly
unsaturated fatty acid chains possess high biological activity (Imbs et al., 2013).

Chapter 3
66
3.3 Experimental
3.3.1 General experimental
Solvents
All solvents used for extraction and chromatography were of HPLC grade (LiChrosolv®;
Merck®, Darmstadt, Germany).
Chromatographic procedures
Column Chromatographic purification procedures were achieved using Merck® silica gel 60
(0.040-0.063mm) 230-400 mesh ASTM product. All thin layer chromatography experiments
were run on Merck® silica gel 60F254 20x20 aluminium sheets and visualization was done
using Syngene UV lamp, with dual wavelengths 254nm and 365nm.
HPLC procedures
A Waters HPLC machine consisting of a Waters 1515 Isocratic HPLC Pump with a Waters
2414 Refractive Index Detector was used. Normal phase HPLC was done on a Whatman
Partsil® 10 (50 x 1 cm) column while reverse phase HPLC was carried out on a Phenomex
®
C18 (25 x 1 cm) column. All solvents were prepared by filtering under vacuum through a 0.45
μm membrane filter and degassed by sonicating for 20 min using an Ultrasonic
Manufacturing Company®
sonicator.
Nuclear magnetic resonance spectroscopy
NMR studies were conducted using a Bruker® Avance 600 MHz spectrometer with
deuterated chloroform (CDCl3) as the NMR solvent. All chemical shifts were recorded in part
per million (δ) and coupling constants J given in hertz (Hz).All spectra were referenced to
residual solvent (δH 7.28, δC 77.0).

Chapter 3
67
Gas chromatography-mass spectrometry
GC-MS analyses were carried out at the Central Analytical Facilities (CAF), University of
Stellenbosch. An Agilent 6890N GC with CTC CombiPAL Autosampler and Agilent 5975B
MS equipped with a ZB 274305 SemiVolatiles column (30 m, 0.25 mm ID, 0.25 µm film
thickness). Helium was used as carrier gas in all experiments with the temperature set at 280
°C. The ionization voltage was set at 70 eV.
High resolution mass spectrometry
High resolution mass spectrometry analyses were also conducted at the CAF, University of
Stellenbosch using a Waters Synapt G2 instrument.
Liquid chromatography-mass spectrometry
LC-MS analyses were carried out in the positive ion mode in theDepartment of Chemistry at
Rhodes University using a Finnigan MAT LCQ MS equipped with an ESI source and an ion
trap.
3.3.2 Plant material
Brassicophycus brassicaeformis was collected from Glencairn beach on the south-western
coast in Simons Town on 1/9/2012. Plant material was hand-picked and identified by
Professor John Bolton, Department of Botany, University of Cape Town. A voucher
specimen was prepared and kept in the Department of Pharmaceutical Chemistry, Rhodes
University. The alga was stored at -20 °C prior to extraction and then air dried following
extraction.
3.3.3 Isolation of secondary metabolites from B. brassicaeformis
Algal material (dry mass 36.40g) was thawed and washed with distilled water before an
initial MeOH (850ml) soak for 1h at room temperature. The solvent was then decanted and

Chapter 3
68
the plant material extracted with 2:1 CH2Cl2-MeOH (1200ml) at 40oC for 30 min. The
organic CH2Cl2 layer was separated from the aqueous methanolic layer by phase separation
through the addition of water. The organic crude (1.59g) was concentrated by solvent
evaporation under reduced pressure. Fractionation of the crude product (0.86g) was done by
step gradient column chromatography eluted by Hexane-EtOAc in increasing polarity to
obtain eight fractions (TEM13 A-H). Fraction C was further purified by normal phase HPLC
(7:3 Hexane-EtOAc) to yield 3.9 (11.2mg). Fraction D was purified by passing through silica
gel column chromatography (6:4 Hexane-EtOAc) to give 3.16 (38mg). Fraction D was
purified to give compounds 3.17 (18.6mg) and 3.18 (20mg) by reversed phase HPLC (100 %
MeOH). (Step gradient chromatography illustrated in Scheme 3.1 page 47).
3.3.3.1 Isolated secondary metabolites (3.9, 3.16, 3.17, 3.18)
Compound 3.9 (Isolation code TEM13-16H)
HO
H
HH3.9
1
36
11
18
19
29
2127
25
3β-Hydroxy-5,24(28)- stigmastadiene (3.9): White solid- 1H NMR (600 MHz, CDCl3) and
13C NMR (150 MHz, CDCl3) data available in Table 3.3 and are consistent with literature
values (Huh et al., 2012).

Chapter 3
69
Compound 3.16 (Isolation code TEM13-20H, K, L)
.
O
O
OH
HOO
19
O
3.16
1
3
20
20' 19'
11 15
15'
9'
1'
3'
16' 17'1617
Fucoxanthin (3.16): Yellow Brown Paste- 1H NMR (600 MHz, CDCl3): δ 0.91 (s, Me-17), δ
0.99 (s, Me-16), δ 1.06 (s, Me-17’), δ 1.09 (s, H-18), δ 1.25 (s, H-18’), δ 1.28 (dd, J=7.2, 14.2
Hz, H-2ax), δ 1.38 (s, Me-16’), δ 1.40 (dd, J= 10.3, 15.7 Hz, H-2ax’), δ 1.51 (dd, J= 2.3, 12.4
Hz, H-2eq), δ 1.53 (dd, J= 11.7, 16.4 Hz, H-4’ax), δ 1.82 (dd, J= 7.2, 14.7 Hz, H-4ax), δ
1.84 (s, H-19’), δ 1.97 (s, H-19), δ 2.01 (s, H-20), δ 2.01 (s, H-20’), δ 2.07 (dd, J= 2.9, 14.1
Hz, H-2’eq), δ 2.19 (s, Me,C-3’OAc), δ 2.32 (dd, J= 2.3, 17.7 Hz, H-4’eq), δ 2.32 (dd, J=
2.3, 17.7 Hz, H-4eq), δ 2.62 (d, J= 17.9, H-7), δ 3.7 (d, J= 18.4 H-7), δ 3.84 (m, H-3), δ 5.41
(tt, J= 8.5, 14.3 Hz, H-3’), δ 6.08 (s, H-8’), δ 6.15 (d, J= 10.2, H-10’), δ 6.29 (d, J= 10.2 Hz,
H-14’), δ 6.37 (d, J= 14.8, H-12’), δ 6.43 (d, J= 11.5, H-14), δ 6.61 (m, H-11), δ 6.68 (t, J=
14.7, H-12), δ 6.72 (m, H-15), δ 6.76 (dd, J= 11.7, 14.5 Hz, H-15’), δ 6.77 (t, J= 11.7, H-
11’), δ 7.17 (d, J= 11.2, H-10). 13
C-NMR (150 MHz, CDCl3): δ 35.8 (C-1), δ 35.2 (C-1’), δ
47.1 (C-2), δ 45.5 (C-2’), δ 64.4 (C-3), δ 68.1 (C-3’), δ 41.7 (C-4), δ 45.2 (C-4’), δ 66.2 (C-
5), δ 72.8 (C-5’), δ 67.1 (C-6), δ 117.4 (C-6’), δ 40.8 (C-7), δ 202.4 (C-7’), δ 197.9 (C-8), δ
103.4 (C-8’), δ 134.5 (C-9), δ 132.5 (C-9’), δ 139.2 (C-10), δ 128.6 (C-10’), δ 123.4 (C-11), δ
125.7 (C-11’), δ 145.0 (C-12), δ 137.1 (C-12’), δ 135.5 (C-13), δ 17.8 (C-13’), δ 136.8 (C-
14), δ 132.2 (C-14’), δ 129.5 (C-15), δ 132.5 (C-15’), δ 25.1 (C-16), δ 21.4 (C-16’), δ 28.1
(C-17), δ 32.1 (C-17’), δ 21.2 (C-18), δ 31.3 (C-18’), δ 11.8 (C-19), δ 14.0 (C-19’), δ 12.8
(C-20), δ 12.9 (C-20’), δ 21.5 and 170.6 (3’-OAc). All 1H- NMR and
13C-NMR data were
consistent with literature values (Mori et al., 2004, Afolayan et al., 2008).

Chapter 3
70
Compound 3.17 (Isolation code TEM13-69G)
O
OH
HO
OH
OH
O
O
O
O
O3.17
131'''
6'''
1'18'
1'' 20''
1-O-(5Z,8Z,11Z,14Z-eicosatetraenoyl)-2-O-(9Z,12Z,15Z-octadecatrienoyl)-3-O-β-D-
galactopyranosyl-sn-glycerol (3.17): Colourless oil- 1H NMR and
13C NMR data available in
Table 3.4; LC-MS (positive mode) m/z 823.64 (calculated 823.5336) C47H76O10Na [M+Na]
Compound 3.18 (Isolation code TEM13-69P)
O
OH
HO
OH
OH
O
O
O
O
O
3.18
1'''
6'''
13
1'
1'' 16''
18''
1-O-(9Z-octadecenoyl)-2-O-(hexadecanoyl)-3-O-β-D-galactopyranosyl-sn-glycerol (3.18):
Colourless oil- 1H NMR and
13C NMR data available in Table 3.4; HRESIMS (positive
mode) , m/z 779.5664 (calculated 779.56492) C43H80O10Na [M+Na].

Chapter 3
71
Derivatization of fatty acid methyl esters of compounds 3.17 and 3.18
A solution of MGDG (3.17 (6mg); 3.18 (4mg)) in MeOH (9ml) was treated with 14 % BF3-
MeOH reagent and the mixture refluxed for 30 min. Progress of the reaction was monitored
by TLC on a silica gel plate which was developed by charring with 50% sulphuric acid.
Methyl esters were isolated by phase separation between Hexane (30ml) and water (15ml).
The lipophilic hexane layer containing the methyl esters was concentrated under reduced
pressure and the samples analyzed using an Agilent 6890NGC GC-MS with CTC CombiPAL
Autosampler and Agilent 5975B MS, Column ZB 274305 SemiVolatiles (30 m, 0.25 mm ID,
0.25 µm film thickness) at the Central Analytical Facility, University of Stellenbosch.
Fatty acid methyl esters of 3.17 Isolation code TEM14-86G
H3CO
O3.171
1'18'
Methyl 9Z,12Z,15Z-octadecatrienoate (3.171): Colourless oil : ESIMS (positive mode) m/z
292.2 (calculated 292.24023) C19H32O2 [M+1]
H3CO
O
3.172
1''20''
Methyl 5Z,8Z,11Z,14Z-eicosatetraenoate (3.172): Colourless oil: ESIMS (positive mode) m/z
318.2 (calculated 318.2559) C21H34O2 [M+1]

Chapter 3
72
Fatty acid methyl esters of 3.18 Isolation code TEM14-86P
H3CO
O
3.1811'
16'
Methyl hexadecanoate (3.191): Colourless oil: ESIMS (positive mode) m/z 270.2 (calculated
270.25588) C17H34O2 [M+1].
H3CO
O 3.182
1''18''
Methyl 9Z-octadecenoate (3.182): Colourless oil- ESIMS (positive mode) m/z 296 (calculated
296.27153) C19H36O2 [M+1].

Chapter 3
73
3.4 References
Afolayan A.F., Bolton J.J., Lategan C.A., Smith P.J., Beukes D.R. (2008). Fucoxanthin,
tetraprenylated toluquinone and toluhydroquinone metabolites from Sargassum
heterophyllum inhibit the in vitro growth of malaria parasite Plasmodium falciparum.
Zeitschrift für Naturforschung B 63: 848-852
Amico V. (1995). Marine brown algae of family cystoseiraceae: chemistry and
chemotaxonomy. Phytochemistry 39: 1257-1279
Bang M., Kim H., Lee D., Han M., Baek Y., Chung D.K., Baek N. (2011). Anti-osteoporotic
activities of fucosterol from sea mustard (Undaria pinnatifida). Food Science and
Biotechnology 20: 343-347
Bonnett R., Mallams A.K., Spark A.A., Tee J.L., Weedon B.C.L. (1969). Carotenoids and
related compounds. Part XX.1 Structure and reactions of fucoxanthin. Journal of Chemical
Society C 429-454
Bruno A., Rossi C., Marcolongo G., Di Lena A., Venzo A., Berrie C.P., Corda D. (2005).
Selective in vivo anti-inflammatory action of the galactolipid monogalactosyldiacylglycerol.
European Journal of Pharamcology 524: 159-168
Combaut G., Piovetti L. (1983). A novel acyclic diterpene from the brown alga Bifurcaria
bifurcata. Phytochemistry 22: 1787-1789
Culioli G., Mesguiche V., Piovetti L., Valls R. (1999). Geranylgeraniol and geranylgeraniol-
derived diterpenes from the brown alga Bifurcaria bifurcata (Cystoseiraceace). Biochemical
Systematics and Ecology 27: 665-668
Culioli G., Daoudi M., Mesguiche V.,Valls., Piovetti L. (1999). Geranylgeraniol-derived
diterpenoids from the brown alga Bifurcaria bifurcata. Phytochemiostry 52: 1447-1454
Culioli G., Ortalo-Magné A., Daoudi M., Thomas-Gyon H., Valls R., Piovetti L. (2004).
Trihydroxylated linear diterpenes from the brown alga Bifurcaria bifurcata. Phytochemistry
65: 2063-2069

Chapter 3
74
Daoudi M., Bakkas S., Culioli G., Ortalo-Magné A., Piovetti L., Guiry MD. (2001). Acyclic
diterpenes and sterols from genera Bifurcaria and Bifurcariopsis (Cystoseiraceae,
Phaeophyceae). Biochemical Systematics and Ecology 29: 973-978
Deal M.S., Hay M.E., Wilson D., Fenical W. (2003). Galactolipids rather than phlorotannins
as herbivore deterrents in the brown seaweed Fucus vesiculosus. Oecologia 136: 107-114
Draisma S.G.A., Ballesteros E., Rousseau F., Thibaut T. (2010). DNA sequence data
demonstrate the polyphyly of the genus Cystoseira and other Sargassaceae genera
(Phaeophyceae). Journal of Phycology 46: 1329-1345
Guardia S., Valls R., Mesguiche V., Brunel J., Culioli G. (1999). Enantioselective synthesis
of (-)-Bifurcadiol: A Natural Antitumor Marine Product. Tetrahedron Letters 40: 8359-8360
Huh G., Lee D., In S., Lee D., Park S., Yi T., Kang H., Seo W., Baek N. (2012). Fucosterols
from Hizikia fusiformis and their proliferative activities on osteosarcoma-derived cell MG63.
Journal of the Korean Society for Applied Biological Chemistry 55: 551-555
Imbs T.I., Ermakova S.P., Fedoreyev S.A., Anastyuk S.D., Zvyagintseva T.N. (2013).
Isolation of fucoxanthin and highly unsaturated monogalactosyldiacylglycerol from brown
alga Fucus evanescens C Agardh and in vitro investigation of their antitumor activity. Marine
Biotechnology 15: 606-612
Jongaramruong J., Kongkam N. (2007). Novel diterpenes with cytotoxic, anti-malarial and
anti-tuberculosis activities from a brown alga Dictyota sp. Journal of Asian Natural Products
Research 9: 743-751
Khanavi M., Gheidarloo R., Sadati N., Ardekani M.R.S., Nabavi S.M.B., Tavajohi S., Ostad
S.N. (2012). Cytotoxicity of fucosterol containing fraction of marine algae against breast and
colon carcinoma cell line. Pharmacognosy Magazine 8: 60-64
Kim Y.H., Kim E., Lee C., Kim M., Rho J. (2007). Two new monogalactosyl diacylglycerols
from brown alga Sargassum thunbergii. Lipids 42: 395-399
Lee S., Lee Y.S., Jung S.H., Kang S.S., Shin K.H. (2003). Anti-oxidant activities of
fucosterol from the marine algae Pelvetia siliquosa. Archives of Pharmacal Research 26:
719-722

Chapter 3
75
Lee Y.S., Shin K.H., Kim B., Lee S. (2004). Anti-diabetic activities of fucosterol from
Pelvetia siliquosa. Archives of Pharmacal Research 27: 1120-1122
Metcalfe L.D., Schmitz A.A. (1961). The rapid preparation of fatty acid esters for GC
analysis. Armour Industrial Chemical Co., McCook III 33: 363-364
Mori K., Ooi T., Hiraoka M., Oka N., Hamada H., Tamura M., Kusumi T. (2004).
Fucoxanthin and its metabolites in edible brown algae cultivated in deep seawater. Marine
Drugs 2: 63-72
Morrison W.R., Smith L.M. (1964). Preparation of fatty acid methyl esters and
dimethylacetals from lipids with boron trifluoride-MeOH. Journal of Lipids Research 5: 600-
608
Muñoz J., Culioli G., Köck M. (2013). Linear diterpenes from the brown marine alga
Bifurcaria bifurcata: a chemical perspective. Phytochemistry Reviews 12: 407-424
Peng J., Yuan J., Wu C., Wang J. (2011). Fucoxanthin, a marine carotenoid present in brown
seaweeds and diatoms: metabolism and bioactivities relevant to human health. Marine Drugs
9: 1806-1828
Silva P.C., Basson P.W., Moe R.L. (1996). Catalogue of benthic marine algae of the Indian
Ocean. University of California Publications in Botany 79: 1259
Stegenga H., Bolton J.J., Anderson R.J. (1997). Bolus Herbarium. Univeristy of Cape Town,
Cape Town
Valls R., Banaigs B., Piovetti L., Archavlis A., Artaud J.(1993). Linear diterpene with
antimitotic Activity from the brown alga Bifurcaria bifurcata. Phytochemistry 34:1585-1588
Valls R., Piovetti L., Archavlis A., Pellegrini M. (1995). (S)-13-Hydroxygeranylgeraniol-
derived furanoditerpenes from Bifurcaria bifurcata. Phytochemistry 39: 145-149
Valls R., Piovetti L. (1995). The chemistry of the Cystoseiracease (fucales: Pheophyceae):
chemotaxonomic relationships. Biochemical Systematics and Ecology 23: 723-745
Zee O.P., Kim D.K., Choi S.U., Lee C.O., Lee K.R. (1999). A new cytotoxic acyclic
diterpene from Carpesium divaricatum. Archives of Pharmacal Research 22: 225-227

Chapter 4
76
Chapter 4
Biomimetic oxidation and its application to selected
natural products and their analogues
Abstract
In the drug discovery and development process, drug metabolism studies have been
established as a necessity early in the process in order to predict the pharmacokinetics and
metabolic processes a potential drug may undergo. With this in mind, biomimetic oxidation
models mimicking cytochrome P450 oxidative processes were developed in this chapter
using the non-steroidal anti-inflammatory drugs such as phenylbutazone and acetanilide as
model substrates.
The developed biomimetic oxidations were applied to a selected number of natural products
with known biological activity and successful oxidation was achieved with lapachol and
sargahydroquinoic acid. The oxidation of sargahydroquinoic acid (4.20) yielded sargaquinoic
acid (4.32), an active metabolite with cytotoxic and antioxidant activity, while lapachol (4.21)
yielded three napthoquinone derivatives. Of importance was the dehydro-α-lapachone (4.33),
a metabolite isolated from in vivo drug metabolism animal models of lapachol, thus alluding
to the potential of biomimetic oxidation models in predicting the in vivo metabolism of drug
molecules.

Chapter 4
77
Chapter 4
Biomimetic oxidation and its application to selected
natural products and their analogues
4.1 General introduction
In this chapter we explored the application of metalloporphyrins in the oxidation of selected
natural products isolated in our research group. Metalloporphyrins have been shown to be a
versatile catalyst for the assessment of in vitro drug metabolism of a variety of medicinally
important and biologically active compounds (Lohmann and Karst, 2008; Mac Leod et al.,
2008). Non-steroidal anti-inflammatory drugs (NSAIDs) have been studied extensively and
their drug metabolites are well known (Balogh and Keserű, 2004; Othman et al., 2000). This
drug class is metabolized mainly via extensive oxidation in hepatic drug transformation
(Nakajima et al., 1998). As a result, NSAIDs are deemed to be the most suitable to study in
vitro phase I drug metabolism. It is on this basis that they were chosen as suitable model
compounds to develop and optimize methods for biomimetic oxidation. For the purpose of
this research, the focus was on the following NSAIDs: phenylbutazone (4.1), ibuprofen (4.2),
indomethacin (4.3) and acetanilide (4.4).
Phenylbutazone
Phenylbutazone (4.1) was first introduced in the 1950s as an anti-inflammatory drug, in the
short term, and chronic management of various forms of arthritis. It is a highly metabolized
drug molecule with only about 1% of the drug excreted in urine unchanged (Lees and
Toutain, 2012). Oxyphenbutazone, γ-hydroxyphenylbutazone and p-γ-
dihydroxyphenylbutazone are some of the metabolites produced in its metabolism in the

Chapter 4
78
body, with oxyphenbutazone and γ-hydroxyphenylbutazone being the most predominant
phase I metabolites with biological activity (Dieterle et al., 1976; Lees and Toutain, 2012).
Scheme 4.1 below illustrates phase I metabolism of phenylbutazone in the human body.
N
N
O
O
N
N
O
O
N
N
O
O
HO
N
N
O
O
OH
N
N
O
O
OH
HO
oxyphenbutazone -hydroxyphenylbutazone
-hydroxyphenylbutazone
phenylbutazone
4.1
Scheme 4.1 Phase I metabolites of phenylbutazone (4.1) (Adapted from Dieterle et al., 1976)
Ibuprofen
Ibuprofen (4.2) is metabolized mainly via phase I metabolism to produce a number of
metabolites which are ultimately excreted from the human body in urine as glucuronide
conjugates (Kepp et al., 1997; Neunzig et al., 2012). The two major metabolites formed in
the human body are 2-hydroxyibuprofen and carboxyibuprofen, whilst 1-hydroxyibuprofen
and 3-hydroxyibuprofen are minor metabolites (Kepp et al., 1997; Neunzig et al., 2012). The
overall phase I metabolism of ibuprofen has been summarised in Scheme 4.2.
γ
p- γ

Chapter 4
79
OH
Ophase I metabolism
OH
O
OH
COOH
OH
O
OH
OHO
HO
OH
O
2-hydroxyibuprofen
carboxyibuprofen
1-hydroxyibuprofen
3-hydroxyibuprofen
major metabolites
minor metabolites
ibuprofen
4.2
Scheme 4.2 Phase I metabolism of ibuprofen (4.2)
(Adapted from Kepp et al., 1997; Neunzig et al., 2012)
Indomethacin
Indomethacin (4.3) is a widely used anti-inflammatory drug which has mainly been used in
treating arthritic conditions such as rheumatoid arthritis (Nakajima et al., 1998; Remmel et
al., 2004). Indomethacin undergoes O-demethylation to form its main metabolite O-
desmethylindomethacin (4.5), an inactive metabolite which is conjugated with glucuronic
acid and eliminated in urine (Duggan et al., 1972; Nakajima et al., 1998). N-deacylation of
O-desmethylindomethacin also occurs as part of the major metabolism pathway to form O-
desmethyl-N-deschlorobenzoylindomethacin (4.6), whilst direct N-deacylation of
indomethacin constitutes its minor metabolism pathway to form N-

Chapter 4
80
deschlorobenzoylindomethacin (4.7) (Duggan et al., 1972; Nakajima et al., 1998). The phase
I metabolism of indomethacin has been illustrated in Scheme 4.3 below.
N
O
H3COCH2COOH
Cl
CH3
major metabolism pathway
N
O
HOCH2COOH
Cl
CH3
4.5indomethacin
4.3
O-demethylationN-deacylation
N
HOCH2COOH
CH3
H
4.6
N-deacylation minor metabolism pathway
N
H3COCH2COOH
CH3
H
4.7
Scheme 4.3 Phase I metabolism of indomethacin (4.1) (Adapted from Nakajima et al., 1998)
Acetanilide
In the human body, acetanilide is metabolized via two routes. The major metabolic route
involves para-hydroxylation of acetanilide to form acetaminophen (4.8), the active metabolite
with anti-pyretic activity. Acetaminophen is eliminated by conjugation with glucuronic acid.
In a minor metabolism route, deacetylation of acetanilide occurs to form aniline (4.9) with no
activity (Atkinson and Markey, 2012) (Scheme 4.4).

Chapter 4
81
N
O
H
major metabolite
N
OHO
H
minor metabolite
<1%
NH2
4.4
4.8
4.9
Scheme 4.4 Phase I metabolism of acetanilide (4.4) (Adapted from Atkinson and Markey, 2012)
4.1.1 Models for biomimetic oxidation
Metalloporphyrins have been used for more than 20 years in understanding the functional
groups of drug molecules most susceptible to metabolism as well as in understanding their in
vivo metabolism processes (Gotardo et al., 2006). In this chapter, two biomimetic oxidation
models were developed and optimized in the oxidation of NSAIDs as model compounds and
selected natural products.
Biomimetic oxidation model (catalyst-hydrogen peroxide)
The model was adapted from Segrestaa et al., 2002 and involved the oxidation of
phenylbutazone and ibuprofen in the presence of a second generation lipophilic catalyst
manganese (III) tetrakis-(2,6-dichlorophenyl) porphyrin (Mn(TDCPP)Cl (4.10) (Figure 4.1) ,
imidazole as the co-catalyst and hydrogen peroxide (30% v/v) (H2O2) as a single oxygen
donor at room temperature. In this reaction, formic acid was added to improve the oxidation

Chapter 4
82
efficiency of the substrate. Throughout this chapter, this biomimetic oxidation model shall be
referred to as catalyst-H2O2 where ‘catalyst’ is replaced by the abbreviated name of the
metalloporphyrin catalyst used.
Biomimetic oxidation model (catalyst-iodosobenzene diacetate)
This biomimetic model involved the use of an efficient oxygen donor iodosylbenzene (PhIO),
derived from iodobenzene diacetate (PhIO(Ac)2) in the presence of a metalloporphyrin
catalyst. The biomimetic model was adapted from In et al., (2003), where iodobenzene
diacetate was used as an efficient oxygen donor in the oxidation of olefins and alkanes, this
time in the presence of an iron (III) metalloporphyrin iron meso-
tetrakis(pentafluorophenyl)porphyrinato chloride (Fe(TPFPP)Cl) (4.11) (Figure 4.1) at room
temperature. In these reactions, iodobenzene diacetate was hydrolysed to form
iodosylbenzene in situ, the terminal oxidant. The hydrolysis of iodobenzene diacetate was
preferred over iodosylbenzene because it is soluble in organic solvents and additionally the
potential to explode at room temperature conditions was eliminated (In et al., 2003; Stang
and Zhdankin, 1996). In this model by In et al., (2003), two different concentrations of
iodobenzene diacetate were used for the olefin epoxidation reactions and alkane
hydroxylation. These were 0.3 mmol and 0.05 mmol, were respectively added to 1:200
catalyst to substrate ratio in a reaction medium. Throughout this chapter, this biomimetic
oxidation model shall be referred to as catalyst-PhIO(Ac)2 where catalyst is replaced by the
abbreviated name of the metalloporphyrin catalyst used.
4.1.2 Success of the biomimetic models in mimicking in vivo drug metabolism
The importance of using biomimetic models in drug metabolism studies is to determine any
possible metabolites of potential drug molecules and to isolate them in large quantities to
facilitate toxicological, histopathologic, and pathologic or genotoxic testing (Chorgade et al.,
1996). Some biomimetic studies have produced unique metabolites, whilst other studies have
managed to produce metabolites which have been isolated in human metabolism studies. For
example, the oxidation of nicotine (4.12) in the presence of the meso-tetraphenylporphyrin
iron (III) chloride (Fe(TPP)Cl) catalyst (4.13) (Figure 4.1) and PhIO, i.e. Fe(TPP)Cl-PhIO

Chapter 4
83
produced cotinine (4.14), a major in vivo metabolite of nicotine produced in humans (Scheme
4.5) (Balogh and Keserű, 2004).
N
N Fe(TPP)Cl-PhIO
N
NO
4.12 4.14
Scheme 4.5 Biomimetic oxidation of nicotine (Balogh and Keserű, 2004)
Another example where biomimetic oxidation products have been translated into in vivo
metabolism products is the oxidation of androst-4-en-3,17-dione (4.15). This androgen
undergoes biotransformation in the presence of microsomal cytochrome P450 aromatase, a
member of the monoxygenase family of heme enzymes to produce: 19-hydroxyandrost-4-en-
3,17-dione (4.16), androst-4-en-3,17,19-trione (4.17) and estrone (4.18) (estrogens)
(Vijayarahavan and Chauhan, 1990; Balough and Keserű, 2004). The same metabolites 4.16,
4.17 and 4.18 were isolated when androst-4-en-3,17-dione was oxidized by the
metalloporphryrin iron (III) tetrakis-(2,6-dichlorophenyl) porphyrin Fe(TDClPP)Cl (4.19)
(Figure 4.1) and CumOOH in the presence of N-methylimidazole (Scheme 4.6)
(Vijayarahavan and Chauhan, 1990; Balough and Keserű, 2004).

Chapter 4
84
O
OFe(TDClPP)Cl
CumOOHN-methylimidazole
O
HO
O
O
O
O
O
O
4.15
4.16
4.17
4.18
Scheme 4.6 Biomimetic biotransformation of androst-4-en-3,17-dione (4.15) (Vijayarahavan
and Chauhan, 1990; Balough and Keserű, 2004)
The above discussion clearly indicates the potential of biomimetic metabolism studies during
drug development. These studies generate potential drug metabolites in sufficient quantities
enabling assessment of their activity, toxicity and potential contribution to the side-effect
profile of a potential new drug. In addition, when applied to new natural products, these
studies are capable of generating new “natural product-like” chemical entities that can also be
part of the studies in drug discovery and development.

Chapter 4
85
Mn(TDClPP)ClFe(TPFPP)Cl
Fe(TPP)Cl Fe(TDClPP)Cl
NN
N N
Cl Cl
Cl
Cl
ClCl
Cl
Cl
Mn
Cl
4.104.11
Fe Cl
NN
N N
F F
FF
F
F
F
F
F
F
FF
F F
F
F
F
F
F
F
4.13
Fe Cl
NN
N N
4.19
Fe ClNN
N N
Cl Cl
Cl
Cl
ClCl
Cl
Cl
Figure 4.1 The most common metalloporphyrins used in biomimetic oxidation studies

Chapter 4
86
4.1.3 Natural products selected for biomimetic studies
The natural products that were available in sufficient quantity for biomimetic studies were:
sargahydroquinoic acid (4.20), sargaquinoic acid, sargachromenol, fucoxanthin, lapachol
(4.21), sclareol, cinnamic acid and cholesterol.
Sargahydroquinoic acid
Sargahydroquinoic acid (4.20) is a prenylated quinone-type secondary metabolite which has
been isolated from the Sargassum species of brown algae (Kim et al., 2008; Kim et al.,
2011).
COOH
OH
OH
4.20
Sargahydroquinoic acid has shown antioxidant activity, moderate antimalarial activity, as
well as an ability to induce peroxisome proliferator activator receptor (PPARα/γ) activity
which has been implicated in the treatment of metabolic disorders such as diabetes mellitus
(Afolayan et al., 2008; Kim et al., 2008; Kim et al., 2011).
Lapachol
Lapachol (4.21) is a naphthoquinone natural product which has been mainly isolated from the
Tabebuia plant species of the family Bignoniaceae (Niehues et al., 2012). Lapachol has been
shown to possess many biological activities which include trypanocidal, antimalarial and
cytotoxic activities (de Almeida, 2009; Niehues et al., 2012). Lapachol reached early clinical
studies as an anti-cancer agent due to its ability to induce oxidative stress, as well as its
ability to carry out the alkylation of cell nucleophiles. However, its progress to market was
impeded by the toxic side effects of its metabolites at therapeutic doses. Lapachol’s success

Chapter 4
87
was also limited by its low serum concentration following administration of a therapeutic
dose (Niehues et al., 2012).
OH
O
O
4.21
Cholesterol
Cholesterol (4.22) is an animal sterol but it has been isolated from the green alga Ulva
lactuca. It has been isolated together with cholesta-5,24 (25)-dien-3β-ol (4.23), a precursor
for cholesterol (Kanazawa et al., 1972; Kapetanovic et al., 2005; Zivanovic, 2012).
HO
H
H H
HO
H
H H
4.22 4.23
Cholesterol is an important component of the lipid bilayer of the biological membrane. It acts
as a structural scaffold for steroids and steroidal hormones within the human body and it is
important in the formation of bile salts. Humans obtain cholesterol mainly from the diet and
from biogenesis (Valenzuela et al., 2003).
A summary of the other natural products pertinent to this research has been given in Table
4.1 below.
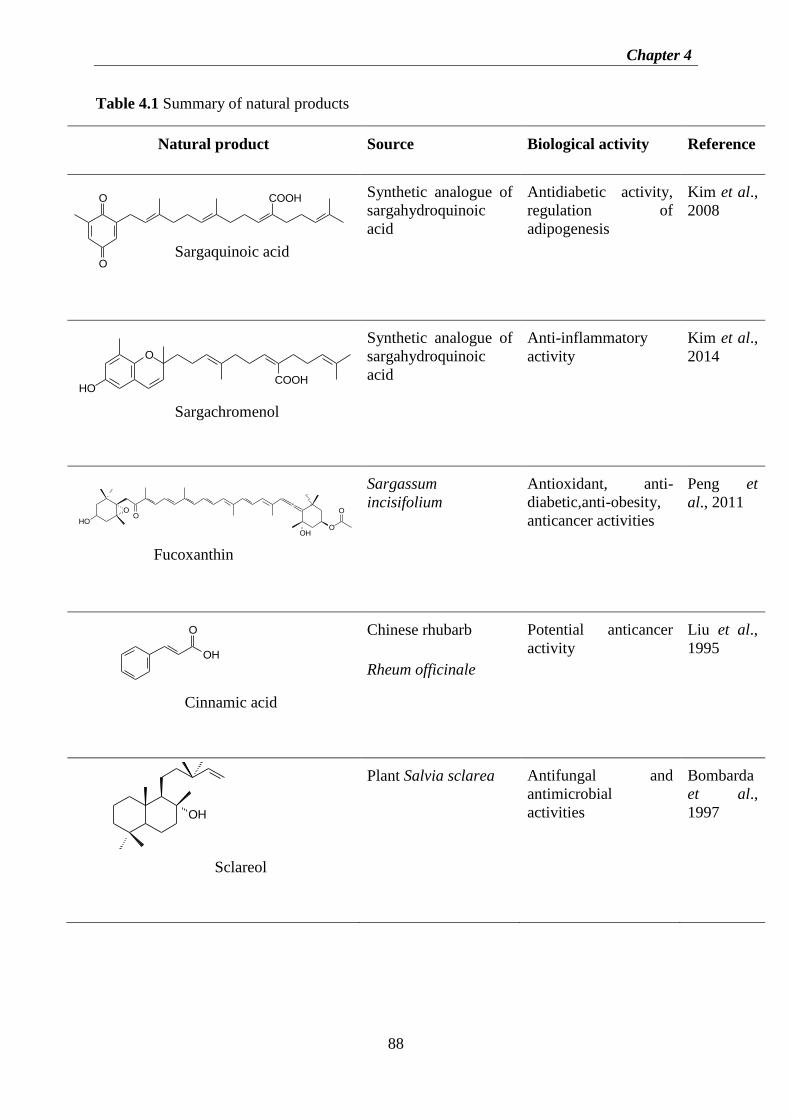
Chapter 4
88
Table 4.1 Summary of natural products
Natural product Source Biological activity Reference
Synthetic analogue of
sargahydroquinoic
acid
Antidiabetic activity,
regulation of
adipogenesis
Kim et al.,
2008
Synthetic analogue of
sargahydroquinoic
acid
Anti-inflammatory
activity
Kim et al.,
2014
Sargassum
incisifolium
Antioxidant, anti-
diabetic,anti-obesity,
anticancer activities
Peng et
al., 2011
Chinese rhubarb
Rheum officinale
Potential anticancer
activity
Liu et al.,
1995
Plant Salvia sclarea Antifungal and
antimicrobial
activities
Bombarda
et al.,
1997
COOHO
OSargaquinoic acid
.
O
O
OH
HOO
O
Fucoxanthin
O
COOHHO
Sargachromenol
OH
O
Cinnamic acid
OH
Sclareol

Chapter 4
89
4.1.4 Chapter Aims and Objectives
Natural products research has resulted in the identification of promising molecules with
interesting chemistry which can combat many disease states such as cancer and malaria. In a
drug discovery and development process, metabolism studies have become one of the first
studies carried out in the process in order to evaluate the therapeutic efficacy of a new drug
molecule. Therefore, this chapter has been divided into two sections. The first section deals
with the development of two biomimetic oxidation models which act as chemical in vitro
drug metabolism models. The second section focuses on the oxidative drug metabolism
reactions (using the developed biomimetic oxidation models with metalloporphyrins as
biomimetic catalysts) of a selected range of natural products with therapeutic importance and
the potential metabolites that can be obtained from the oxidation process.
Objectives:
1. To develop simple biomimetic oxidation models using the NSAIDs such as
acetanilide and phenylbutazone.
2. To apply the developed biomimetic oxidation systems to a few selected natural
products of therapeutic importance.
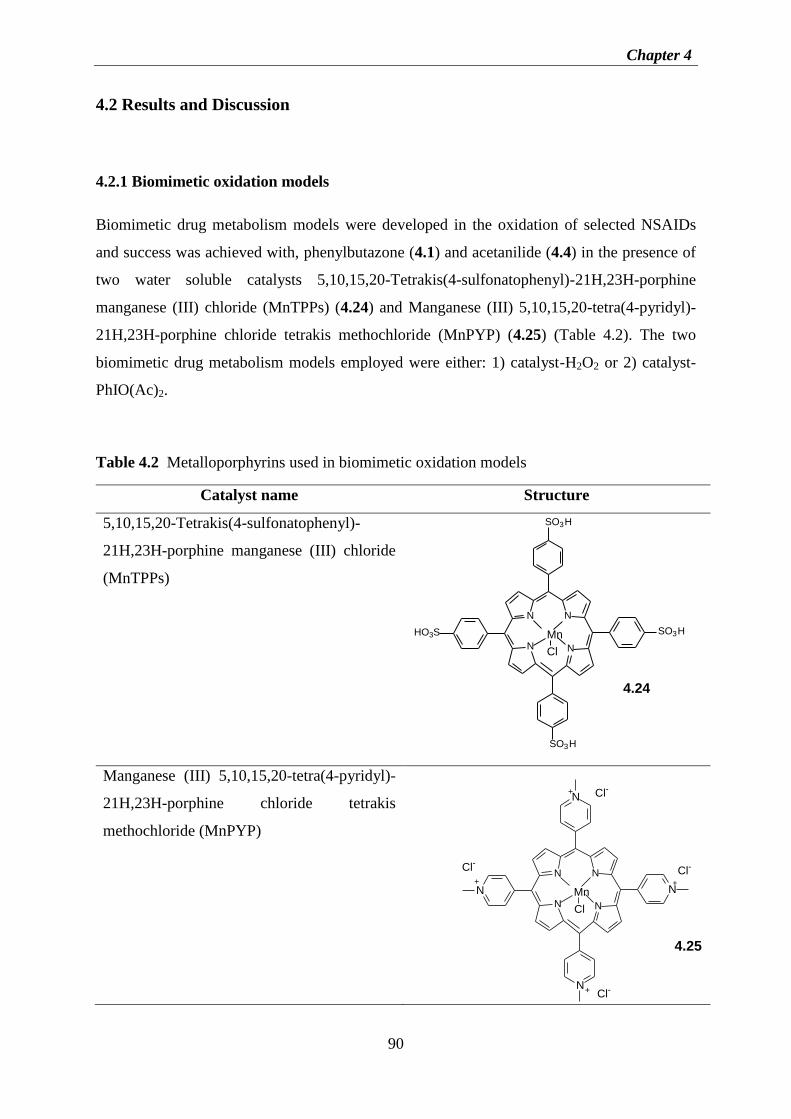
Chapter 4
90
4.2 Results and Discussion
4.2.1 Biomimetic oxidation models
Biomimetic drug metabolism models were developed in the oxidation of selected NSAIDs
and success was achieved with, phenylbutazone (4.1) and acetanilide (4.4) in the presence of
two water soluble catalysts 5,10,15,20-Tetrakis(4-sulfonatophenyl)-21H,23H-porphine
manganese (III) chloride (MnTPPs) (4.24) and Manganese (III) 5,10,15,20-tetra(4-pyridyl)-
21H,23H-porphine chloride tetrakis methochloride (MnPYP) (4.25) (Table 4.2). The two
biomimetic drug metabolism models employed were either: 1) catalyst-H2O2 or 2) catalyst-
PhIO(Ac)2.
Table 4.2 Metalloporphyrins used in biomimetic oxidation models
Catalyst name Structure
5,10,15,20-Tetrakis(4-sulfonatophenyl)-
21H,23H-porphine manganese (III) chloride
(MnTPPs)
4.24
NN
N N
SO3H
SO3H
SO3H
HO3S Mn
Cl
Manganese (III) 5,10,15,20-tetra(4-pyridyl)-
21H,23H-porphine chloride tetrakis
methochloride (MnPYP)
+
+
+
+
Cl-
Cl-
Cl-
Cl-
4.25
NN
N N
N
N
N
N Mn
Cl

Chapter 4
91
4.2.1.1 Biomimetic oxidation of phenylbutazone (4.1)
Phenylbutazone was reacted with either catalyst-H2O2 or catalyst-PhIO(Ac)2 where the
catalyst was MnTPPs (4.24) or MnPYP (4.25) and stirred for 4h and 30 min respectively. The
reaction progress was followed by thin layer chromatography (TLC). After the 4h and 30 min
reaction time for each reaction model, the aqueous medium was extracted with
dichloromethane (DCM) and the DCM extract dried and analyzed by 1H-NMR spectroscopy.
Figure 4.2 shows the 1H-NMR spectra for the starting material and reaction product (4.26).
Figure 4.2 1H-NMR (400MHz, CDCl3) spectrum of phenylbutazone (4.1) and reaction
product of phenylbutazone containing compound 4.26
The 1H-NMR spectra of the oxidation product of phenylbutazone showed important spectral
features which suggested oxidation at the C-4 position. The spectrum of the crude reaction
mixture included signals at δ 0.88 (3H, t, J= 7.2 Hz), δ 1.36 (2x CH2, m), δ 2.07 (CH2, t, J=
7.3 Hz), δ 3.48 (CH, s), and the aromatic signals at δ 7.21-7.35 (10H, m, 2x phenyl).
Formation of a hydroxyl group on position 4 was revealed by the presence of a singlet at δ
3.48. However, a small amount of the phenylbutazone was still found to be present in the
reaction product (4.26) as seen by the methine triplet of the pyrazolidine ring at δ 3.41. In
addition, a change in the multiplicity for the methylene protons at δ 2.11 from a multiplet to a
triplet at δ 2.07 also suggested the formation of the hydroxyl moiety.
Crude reaction
mixture
Phenylbutazone

Chapter 4
92
Figure 4.3 13
C-NMR (100 MHz, CDCl3) spectrum of compound 4.26
The 13
C-NMR (100 MHz, CDCl3) (Figure 4.3) of 4.26 revealed the presence of 10 carbon
signals: the carbonyl signals in the pyrazolidine ring are represented by a signal at δ 170.7,
the olefin methine and quaternary carbon signals in the phenyl ring were present at δ 135.3,
129.3, 127.5, 123.0, the oxygenated methine carbon was found to reside at δ 74.2, three
methylene carbon signals for the butyl chain were observed at δ 37.4, 24.7, 22.5 and lastly the
methyl carbon of the butyl chain at δ 14.0. All 1H and
13C-NMR data were consistent with
literature values and assisted in identifying the reaction product as 4-hydroxy-4-n-butyl-1,2-
diphenylpyrazolidine-3,5-dione (4.26) (Segrestaa et al., 2002; Chauhan et al., 1999).
-C-OH

Chapter 4
93
Two-dimensional NMR analyses (HMBC, HSQC, and COSY) of 4.26 were also carried out
to determine the structure of the hydroxyl metabolite of phenylbutazone. These values were
compared with the data for phenylbutazone (4.1) itself (Table 4.3). Figure 4.4 shows some of
the key HMBC correlations identified in determining structure of 4.26.
Table 4.3 Comparison of 4.1 and 4.26 1H-NMR (400 MHz, CDCl3) and
13C-NMR (100MHz,
CDCl3) and 2D NMR (1H-
1H COSY and HMBC) spectroscopic data for compound 4.26
4.1 4.26
Carbon
no
δC
δC
multi
δH (multi, J=
Hz) δC
δH
(multi, J=
Hz)
Observed
COSY
Observed
HMBC
3 170.5 C - 170.7 -
4 46.1 CH 3.41 (t, 5.7) 74.2 3.48 (s) H-6
5 170.5 C - 170.7 -
6 27.94 CH2 2.11 (m) 37.7 2.07 (t, 7.1) H-4 C-9,C-4,C-
5,C-3
7 27.91 CH2 1.39 (m) 24.7 1.30-1.45 (m) H-8 C-8,C-9
8 22.7 CH2 1.50 (m) 22.7 H-7, H-9
9 13.8 CH3 0.93 (t, 7.3 ) 13.8 0.88 (t, 7.2) H-8
10 136.0 C - 135.5 -
11 122.8 CH 7.31-7.34
(m)
123.0 7.29-7.75 (m)
12 129.3 CH 129.6
13 127.0 CH 7.20 (m) 127.5 7.21 (m)
Assignments completed based on the COSY, HMBC and HSQC correlations observed

Chapter 4
94
Figure 4.4 Key HMBC correlations for compound 4.26
Control oxidation reactions for phenylbutazone were carried out. Each reaction model
(catalyst-H2O2 and catalyst-PhIO(Ac)2) had two controls: one in the absence of
metalloporphyrin catalyst (referred to as control1) and the other in the absence of the oxidant
(referred to as control 2). The control reactions also revealed the presence of the 4-hydroxy
metabolite of phenylbutazone (4.26). However the metabolite was isolated in smaller yields
when metalloporphyrin catalyst was omitted as opposed to the catalyzed reactions. The
percentage conversion of phenylbutazone to 4.26 in Table 4.4 was determined by weighing
the mass of the isolated product 4.26. In Table 4.5, the percentage conversion of
phenylbutazone to 4.26 was determined by assessing the 1H-NMR spectra of the crude
reaction mixtures (i.e. by observing the absence of the methine signal at δ 3.41). Masses of
crude reaction mixtures were not determined in cases where reaction products were not
isolated.

Chapter 4
95
Table 4.4 Percentage conversion of phenylbutazone to 4.26 with biomimetic oxidation model
catalyst-H2O2
% conversion of phenylbutazone to 4-hydroxy-4-n-butyl-1,2-
diphenylpyrazolidine-3,5-dione
Cata
lyst
s
Catalyzed reaction Control reaction 1 Control reaction 2
MnTPPs (4.24) 66 29 ND
MnPYP (4.25) 64 ND ND
ND= Not Determined
Table 4.5 Percentage conversion of phenylbutazone to 4.26 with biomimetic oxidation model
catalyst-PhIO(Ac)2
% conversion of phenylbutazone to 4-hydroxy-4-n-butyl-1,2-
diphenylpyrazolidine-3,5-dione
Cata
lyst
s
Catalyzed reaction Control reaction1 Control reaction 2
MnTPPs (4.24) 100 100 ND
MnPYP (4.25) 100 ND ND
ND= Not Determined
Interestingly, the biomimetic oxidation of phenylbutazone to 4.26, occurred in the absence of
the oxidant but in the presence of the both catalysts (MnTPPs and MnPYP) (control 2). The
1H-NMR spectra of the control reaction showed the disappearance of the triplet at δ 3.41 (t, J
= 5.7 Hz). This was not expected in control 1 because the reactions were carried out in the
absence of oxidant. The control experiments were carried out under normal atmospheric
conditions; i.e. the reaction vials were not flushed with nitrogen to exclude the presence of
molecular oxygen, which suggests that the methine proton is prone to oxidation even in the
presence of molecular oxygen only, under biomimetic conditions. The biomimetic oxidation

Chapter 4
96
system proceeded to completion in 4 hours, with complete oxidation of phenylbutazone to its
hydroxyl metabolite (Figure 4.5).
Figure 4.5 1H-NMR (400 MHz, CDCl3) spectra comparing control 1, control 2 and the
starting material (catalyst-H2O2 model)
However, with the control reactions for the second model (catalyst-PhIO(Ac)2) control 2,
where the reaction proceeded for 30 min, a reaction mixture containing both phenylbutazone
and 4-hydroxy-4-n-butyl-1,2-diphenylpyrazolidine-3,5-dione was observed (Figure 4.6). This
was probably due to a shorter reaction time. Therefore, it is possible that complete oxidation
of phenylbutazone by molecular oxygen can be achieved if stirred in the presence of the
catalyst for at least 4 hours.
The aromatic signals that are found with oxidation models in the presence of catalyst
PhIO(Ac)2 were unknown but were suspected to be by-products of the hydrolysis of
iodobenzene diacetate as they do not resemble any of the known oxidation products of
phenylbutazone (i.e. meta or para oxidation of the phenyl rings). Additional work would have
to be carried out to identify these compounds.
Control reaction 2;
no oxidant
Control reaction 1;
no catalyst
Phenylbutazone

Chapter 4
97
Figure 4.6 1H-NMR (400 MHz, CDCl3) spectra comparing control 1, control 2 and starting
material (catalyst-PhIO(Ac)2 model)
The in vivo metabolites of phenylbutazone (oxyphenbutazone and γ-hydroxyphenylbutazone)
differ from the isolated product from the biomimetic oxidation of phenylbutazone. 4-
hydroxy-4-n-butyl-1,2-diphenylpyrazolidine-3,5-dione has been tested as a possible
immunosuppressant but the metabolite showed weak anti-cytokine activity suggesting that it
is an inactive biomimetic metabolite of phenylbutazone.
4.2.1.2 Biomimetic oxidation of acetanilide
Biomimetic oxidation of acetanilide using H2O2
The biomimetic oxidation of acetanilide (4.4) was aimed at mimicking the metabolism of
acetanilide taking place in humans. The oxidized products that were expected in these
reactions were acetaminophen (4.27) as well as further oxidation of acetaminophen to the
imino-quinone N-acetyl-p-benzoquinone imine (NAPQI) (4.28), a toxic metabolite which
causes liver damage in humans (Atkinson and Markey, 2012) (Scheme 4.7).
Control reaction 2;
no oxidant
Control reaction 1;
no catalyst
Phenylbutazone

Chapter 4
98
H2O2
imidazoleformic acid
model I
N
O
H
4.4
N
OHO
H
4.27
N
OO
H
4.28
xMnTPPS/ MnPYP
further oxidation
Scheme 4.7 Proposed oxidation of acetanilide using the biomimetic model catalyst-H2O2
However, oxidation of acetanilide by H2O2 in a biomimetic oxidation model did not yield any
of the desired oxidized products for acetanilide after 4 hours. The completion of each reaction
progress was monitored by TLC, where the reaction mixtures and the control reactions were
compared to acetanilide and acetaminophen. TLC analyses confirmed the presence of the
starting material in each of the reactions after a four hour reaction time (Figure 4.7).
Figure 4.7 TLC assessment of reaction of acetanilide using catalyst-H2O2 biomimetic
oxidation model
TLC elution solvent:
CH2Cl2/Acetonitrile (1:1)
1= Acetaminophen
2= Acetanilide
3=Reaction mixture
4=Control Reaction (no catalyst)

Chapter 4
99
Biomimetic oxidation of acetanilide using PhIO(Ac)2
Acetanilide (4.4) was oxidized using iodobenzene diacetate (PhIO(Ac)2) at the concentration
used for olefin epoxidation (In et al., 2003) to yield a complex reaction mixture which was
analyzed by NMR spectroscopic methods.
The 1H-NMR spectra of the oxidation product of acetanilide revealed the presence of starting
material (δ 2.19 (3H, s), δ 7.06 (t, J= 7.3 Hz), δ 7.33 (t, J= 7.9 Hz), δ 7.56 (d, J= 7.9 Hz)) and
a singlet at δ 6.80 which suggested the presence of 1,4-benzoquinone (BQ) (4.29) (Figure
4.8). 1H-NMR data was consistent with the literature value for 1,4-benzoquinone (Tedeschi
and Rezende, 2009).
Figure 4.8 1H-NMR (400 MHz, CDCl3) spectra of the starting material (4.4) and crude
reaction mixture
HSQC correlations proved useful in determining the composition of the crude mixture
composition. The methine singlet at δ 6.80 correlated to a methine carbon at δ 136.6,
typically associated with a methine carbon in the benzoquinone ring. Typical proton-carbon
correlations for acetanilide were also apparent in the HSQC spectrum. The following 13
C-
Crude
reaction
mixture
Acetanilide

Chapter 4
100
NMR (100 MHz, CDCl3) nuclei were deemed to belong to acetanilide including the methyl
signal at δ 24.4 and three methine signals at δ 119.9, 122.0 and 129.5. However, the crude
oxidation product contained the reaction by-product iodobenzene. The presence of
iodobenzene was suspected to be denoted by the doublet signal in the 1H-NMR spectrum at δ
7.72 (d, J= 7.9), a consistent doublet observed in all oxidation reactions in the presence of
PhIO(Ac)2. This doublet signal corresponded to the methine signal at δ 137.4 in the
iodobenzene ring. Figure 4.9 below shows the HSQC spectrum for the crude oxidation
product of acetanilide.
Figure 4.9 HSQC spectrum of crude oxidation product of acetanilide biomimetic oxidation
reaction highlighting some important correlations
O
O
4.29
I
iodobenzene

Chapter 4
101
Acetanilide is less likely to be oxidized in a biomimetic oxidation reaction model due to the
presence of the acetamide group on the para-position, a moderately activating group for
electrophilic aromatic substitution (Fox and Whitesell, 2004). However the presence an
efficient oxidant such as iodobenzene diacetate catalyzed by metalloporphyrin facilitated the
oxidation of acetanilide to produce BQ. These products were not observed in the control
reactions.
In summary, the selected metalloporphyrin catalysts used for carrying out biomimetic
oxidation reactions were found to be suitable since the formation of highly reactive
manganese (IV) oxo species responsible for substrate oxidation occurs. Both the catalysts
MnTPPs and MnPYP contained electron withdrawing ligands (i.e. sulfonic acid and pyridyl
moieties, respectively) on the porphyrin macrocyle which results in the high reactivity of the
subsequent oxo species formed thus facilitating olefin epoxidation and alkane hydroxylation
reactions (Goh and Nam, 1999; Jeong et al., 2008; Lee et al., 2009).
The use of single oxygen donors as terminal oxidants such as iodosylbenzene in biomimetic
oxidation reactions is preferred since these do not facilitate the free radical side chain
reactions associated with alkyl hydroperoxides and hydrogen peroxide. Free radical chain
reactions have been shown to be the result of the weak O-H bonds in alkyl hydroperoxide
which therefore diminish the efficiency of the oxidant as a result of the low turnover of the
high valent oxo species of the metalloporphyrin. As a result, olefin epoxide and alkane
hydroxyl product yields are low (De Faria et al., 2011; Meunier, 1992; Mansuy et al., 1989).
However, alkyl hydroperoxides and hydrogen peroxide are more environmentally friendly as
opposed to iodosylbenzene with water as the only by-product (De Faria et al., 2011).
Iodosylbenzene which was once a common oxidant used in the biomimetic oxidation models
has seen diminished use due to its hazardous nature (De Faria et al., 2011; Stang and
Zhdankin, 1996). For this set of biomimetic oxidation models, iodobenzene diacetate was
used in place of iodosylbenzene as it is less toxic and it was able to form the efficient oxidant
iodosylbenzene in situ (In et al., 2003). Overall, iodobenzene diacetate was the most efficient
oxidant as it was efficient in the oxidation of both phenylbutazone and acetanilide in the
biomimetic oxidation model whilst hydrogen peroxide is most environmentally friendly and
closely resembles molecular oxygen.

Chapter 4
102
4.2.1.3 Biomimetic oxidation of natural products
The biomimetic oxidation models MnTPPs-H2O2 and MnTPPs-PhIO(Ac)2 were applied to a
selected number of natural products namely: sargahydroquinoic acid, sargaquinoic acid,
sargachromenol, fucoxanthin, lapachol, cholesterol, cinnamic acid and sclareol. The main
focus of this section is on the natural products that underwent conversion in both biomimetic
oxidation models.
Biomimetic oxidation of sargahydroquinoic acid (4.20)
The biomimetic oxidation of sargahydroquinoic acid (SHQA) using both biomimetic
oxidation models resulted in the oxidation of the hydroquinone moiety to form sargaquinoic
acid (SQA) (4.30). The 1H-NMR spectrum of sargahydroquinoic acid (4.20) (Figure 4.10)
showed similarities to that of sargaquinoic acid (4.30) as expected, where the main difference
is the proton signals attributed to the hydroquinone moiety; i.e. a change in multiplicity of
the two doublets at δ 6.50 (d, J= 2.8 Hz) and δ 6.49 (d, J= 2.9 Hz) in 4.20 to two broad
singlet signals at δ 6.56 and 6.48 in 4.30 respectively, was observed.
Figure 4.10 1H-NMR (400 MHz, CDCl3) spectrum of sargahydroquinoic acid (4.20) and
sargaquinoic acid (4.30)
SQA (4.30)
SHQA (4.20)

Chapter 4
103
The 13
C-NMR (100 MHz, CDCl3) spectrum of compound 4.30 (Figure 4.11) revealed a signal
at δ 188.1, characteristic of a quaternary carbon attached to a ketone, further confirming the
change in the hydroquinone moiety of sargahydroquinoic acid to a quinone in sargaquinoic
acid. All NMR data was found to be in agreement with literature values (Afolayan et al.,
2008). Table 4.6 compares the 1H-NMR data of compounds 4.20 and 4.30.
Figure 4.11 13
C-NMR (100 MHz, CDCl3) spectrum of sargahydroquinoic acid (4.20) and
sargaquinoic acid (4.30)
SQA (4.30)
SHQA (4.20)
-C=O
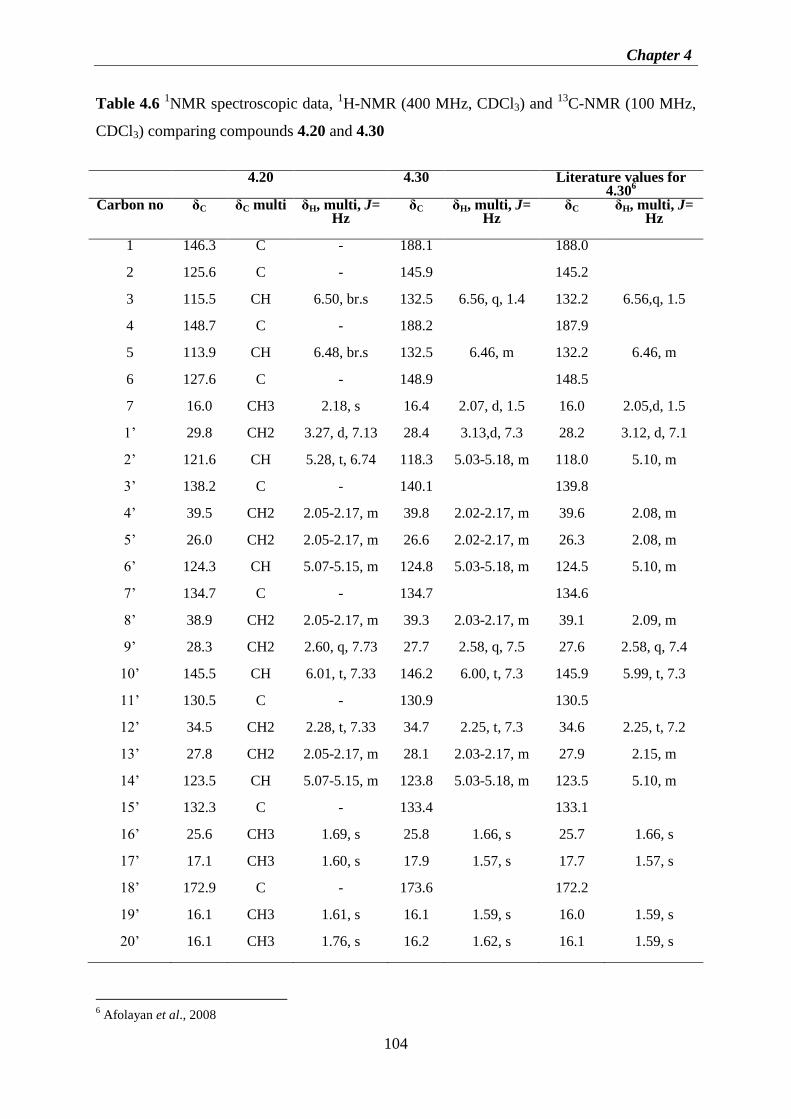
Chapter 4
104
Table 4.6 1NMR spectroscopic data,
1H-NMR (400 MHz, CDCl3) and
13C-NMR (100 MHz,
CDCl3) comparing compounds 4.20 and 4.30
4.20 4.30 Literature values for 4.30
6
Carbon no δC δC multi δH, multi, J= Hz
δC δH, multi, J= Hz
δC δH, multi, J= Hz
1 146.3 C - 188.1 188.0
2 125.6 C - 145.9 145.2
3 115.5 CH 6.50, br.s 132.5 6.56, q, 1.4 132.2 6.56,q, 1.5
4 148.7 C - 188.2 187.9
5 113.9 CH 6.48, br.s 132.5 6.46, m 132.2 6.46, m
6 127.6 C - 148.9 148.5
7 16.0 CH3 2.18, s 16.4 2.07, d, 1.5 16.0 2.05,d, 1.5
1’ 29.8 CH2 3.27, d, 7.13 28.4 3.13,d, 7.3 28.2 3.12, d, 7.1
2’ 121.6 CH 5.28, t, 6.74 118.3 5.03-5.18, m 118.0 5.10, m
3’ 138.2 C - 140.1 139.8
4’ 39.5 CH2 2.05-2.17, m 39.8 2.02-2.17, m 39.6 2.08, m
5’ 26.0 CH2 2.05-2.17, m 26.6 2.02-2.17, m 26.3 2.08, m
6’ 124.3 CH 5.07-5.15, m 124.8 5.03-5.18, m 124.5 5.10, m
7’ 134.7 C - 134.7 134.6
8’ 38.9 CH2 2.05-2.17, m 39.3 2.03-2.17, m 39.1 2.09, m
9’ 28.3 CH2 2.60, q, 7.73 27.7 2.58, q, 7.5 27.6 2.58, q, 7.4
10’ 145.5 CH 6.01, t, 7.33 146.2 6.00, t, 7.3 145.9 5.99, t, 7.3
11’ 130.5 C - 130.9 130.5
12’ 34.5 CH2 2.28, t, 7.33 34.7 2.25, t, 7.3 34.6 2.25, t, 7.2
13’ 27.8 CH2 2.05-2.17, m 28.1 2.03-2.17, m 27.9 2.15, m
14’ 123.5 CH 5.07-5.15, m 123.8 5.03-5.18, m 123.5 5.10, m
15’ 132.3 C - 133.4 133.1
16’ 25.6 CH3 1.69, s 25.8 1.66, s 25.7 1.66, s
17’ 17.1 CH3 1.60, s 17.9 1.57, s 17.7 1.57, s
18’ 172.9 C - 173.6 172.2
19’ 16.1 CH3 1.61, s 16.1 1.59, s 16.0 1.59, s
20’ 16.1 CH3 1.76, s 16.2 1.62, s 16.1 1.59, s
6 Afolayan et al., 2008

Chapter 4
105
The hydroquinone moiety of sargahydroquinoic acid is very reactive and it therefore
undergoes slow oxidation to form sargaquinoic acid in the presence of air. This reaction
however, takes place over a prolonged period of time. When sargahydroquinoic acid was
stirred at room temperature for the biomimetic oxidation reactions, sargaquinone was formed
after 4 hours (using MnTPPs-H2O2) and 1h 30 min (using MnTPPs-PhIO(Ac)2). Moreover,
the oxidation reaction in the presence of iodobenzene diacetate only (i.e. with no catalyst),
still yielded the quinone derivative (Figure 4.12) which was not observed in a similar
experiment where H2O2 alone was used (also with no catalyst).
Figure 4.12 1H-NMR (400 MHz, CDCl3) spectrum of the control reactions of 4.20, SHQA
and SQA highlighting the region δ 6.40-6.60
The presence of a catalyst in the biomimetic model MnTPPs-H2O2 reactions facilitated the
formation of sargaquinoic acid in the presence of the weak oxidant H2O2. However,
iodobenzene diacetate fully oxidized sargahydroquinoic acid in 1h 30 min in the absence of
catalyst, illustrating the high reactivity of the hydroquinone moiety and the efficient oxidation
capacity of iodobenzene diacetate. Scheme 4.8 outlines the proposal for the formation of
sargaquinoic acid from sargahydroquinoic acid in a biomimetic oxidation model. The high
valent manganese oxo species catalyzes the oxidation reaction by an initial deprotonation
SHQA
SQA
H2O2; No
catalyst
PhIO(Ac)2;
No catalyst

Chapter 4
106
reaction which then facilitates the formation of the phenoxide. The phenoxy radical then
undergoes further deprotonation and a loss of electrons to form the quinone.
Scheme 4.8 Proposed mechanism for sargahydroquinoic acid oxidation catalyzed by
metalloporphyrin catalyst
Sargaquinoic acid is a secondary metabolite which has been isolated from several species of
Sargassum such as S. incisifolium and S. serratifolium. It has been shown to possess
biological activities which include antimalarial, antioxidant and anti-diabetic activities
(Afolayan et al., 2008; Kim et al., 2008). This metabolism study therefore suggests that
sargahydroquinoic acid as a potential new chemical entity may undergo in vivo oxidation
catalyzed by cytochrome P450 enzymes to give sargaquinoic acid, the active metabolite.
Biomimetic oxidation of lapachol (4.21)
The biomimetic oxidation of lapachol was also carried out using both biomimetic oxidation
models MnTPPs-H2O2 (over 4 hours) and MnTPPs-PhIO(Ac)2 (over 1h 30 min), to give the
napthoquinone derivatives of lapachol. Further separation of the metabolites of the lapachol

Chapter 4
107
oxidation reaction was avoided to ensure that there was no loss of any possible volatile
products likely to form (Pires et al., 2011). The reaction mixture for each model was
therefore analyzed by NMR to identify the different lapachol metabolites present. The
reaction mixture for the biomimetic oxidation model catalyst-H2O2 gave a clear 1H-NMR
spectrum which was useful in identifying the napthoquinone derivatives of lapachol (Figure
4.13).
Figure 4.13 1H-NMR (400 MHz, CDCl3) spectrum of lapachol crude reaction mixture and
starting material (4.21)
The spectrum (Figure 4.13) was zoomed into the regions of interest to identify key 1H-NMR
signals specific for the various lapachol metabolites formed. The aromatic protons within the
metabolites (4.31 and 4.32) were masked by the aromatic protons in lapachol which was still
present in the crude reaction mixture.
The first region enlarged was δ 5.25- 6.25 (Figure 4.14). In this region, two doublets at δ 5.41
(d, J= 6.6 Hz) and δ 6.10 (d, J= 6.6 Hz) were identified as the two olefinic methine protons in
the lactone ring suggesting cyclization of the alkene side chain of the lapachol into a six
membered lactone ring. These values were compared with literature values, as well as
Lapachol
(4.21)
Lapachol crude
reaction
mixture

Chapter 4
108
through the use of Mestrenova® NMR prediction software (Figure 4.15). These assisted in the
identification of the metabolite as dehydro-α-lapachone (4.31) (Pires et al., 2011).
Figure 4.14 1H-NMR (400 MHz, CDCl3) region δ 5.25- 7.50 with signals for 4.31
δ 6.10 (d, J= 6.6 Hz) δ 5.41 (d, J= 6.6 Hz)
O
O
O4.31

Chapter 4
109
Figure 4.15 Mestrenova®
1H-NMR (400.00 MHz, CDCl3) spectrum prediction of compound
4.31 highlighting the distinguishing doublet signals
The second 1H-NMR spectral region analyzed was the δ 2.90-5.10 region (Figure 4.16) which
was characterized by a doublet at δ 3.17 (d, J= 10.0 Hz) and a triplet at δ 4.85 (t, J= 10.0 Hz).
The doublet at δ 3.17 corresponds to the methylene protons, while the triplet at δ 4.85 is due
to the methine proton all within the furanolactone ring. These values were compared to
literature values to again assist with the assignment of a furanonapthoquinone, 2-(1-Hydroxy-
1-methylethyl)-2,3-dihydronaphtho[2,3-b]furan-4,9-dione (4.32). Compound 4.32 has also
been previously isolated in biomimetic oxidation reactions of lapachol by Pires et al., (2011).

Chapter 4
110
Figure 4.16 1H-NMR (400 MHz, CDCl3) region δ 2.90- 5.10 with signals for 4.32
The 1H-NMR spectral regions between 2.50-4.50 ppm (Figure 4.17) provided three key
spectral features in the elucidation of metabolite 4.33. A doublet of doublets at δ 2.56 (dd, J=
3.3, 18.0 Hz), a doublet of doublets at δ 2.95 (dd, J= 6.7, 18.0 Hz) and a double doublet at δ
4.24 (dd, J= 3.3, 6.4 Hz) were observed. The 13
C-NMR (100 MHz, CDCl3) and 2D NMR
data were instrumental in providing insight into the structure of compound 4.33 and
suggested that it could be a furanolactone. Firstly, an HSQC correlation (Figure 4.18) was
observed between the main key protons at δ 2.56 and 2.95 to the methylene carbon signal at δ
38.2 while the multiplet at δ 4.20 was found to be attached to the oxymethine carbon at δ
74.3. These values were compared to literature values (Pires et al., 2011) which assisted with
the assignment of a furanolactone, 4-Hydroxy-5,5-dimethyldihydrofuran-2(3H)-one (4.33) .
δ 4.85 (t, J= 10.0 Hz)
δ 3.17 (d, J= 10.0 Hz)
OOH
O
O 4.32

Chapter 4
111
Figure 4.17 1H-NMR (400 MHz, CDCl3) region δ 2.50- 4.50 with signals for 4.33
Figure 4.18 Edited HSQC spectrum of crude reaction mixture of lapachol biomimetic
oxidation illustrating key correlations in compound 4.33
δ 4.24 (dd, J= 3.3, 6.4 Hz)
δ 2.95 (dd, J= 6.7, 18.0)
δ 2.56 (dd, J= 3.3, 18.1)
O
O
OH
4.33

Chapter 4
112
This metabolite (4.33) has been proposed to form as a result of a series of oxidation, ring
opening and cleavage reactions of the prenyl moiety of lapachol illustrated in Scheme 4.9
below. An initial epoxidation of the alkene in the quinone ring is presumed to be the initial
step of lapachol oxidation, followed by cleavage of the quinone ring and further oxidation
and cleavage of the prenyl side chain (Niehues et al., 2012). Cyclization of the cleaved prenyl
chain occurs after another oxidation step occurs to form the furanolactone metabolite (4.33).
O
O
OH
+ Mn
O
V
manganese oxospecies
4.13
O
O
OH
OH
OH
O
OHO
OH
OHfurther
oxidation H
OO
furtheroxidation
OO
OHcyclization
4.33
O
Scheme 4.9 Proposed reaction mechanism for the formation of 4.33 in a biomimetic
oxidation model (Pires et al., 2011)
Dehydro-α-lapachone (4.31) has previously been isolated in the in vivo metabolism studies of
lapachol conducted on female wistar rats. It has been suggested to be a metabolite formed as
a result of cytochrome P450 catalyzed oxidation reactions of lapachol. Therefore, this
confirms that biomimetic oxidation models are useful tools in predicting the possible
metabolites that can be obtained from potential drug molecules.
Biomimetic oxidation reactions were also attempted on other natural products; however no
success was achieved with these reactions. These have been summarised in the table below
(Table 4.7).
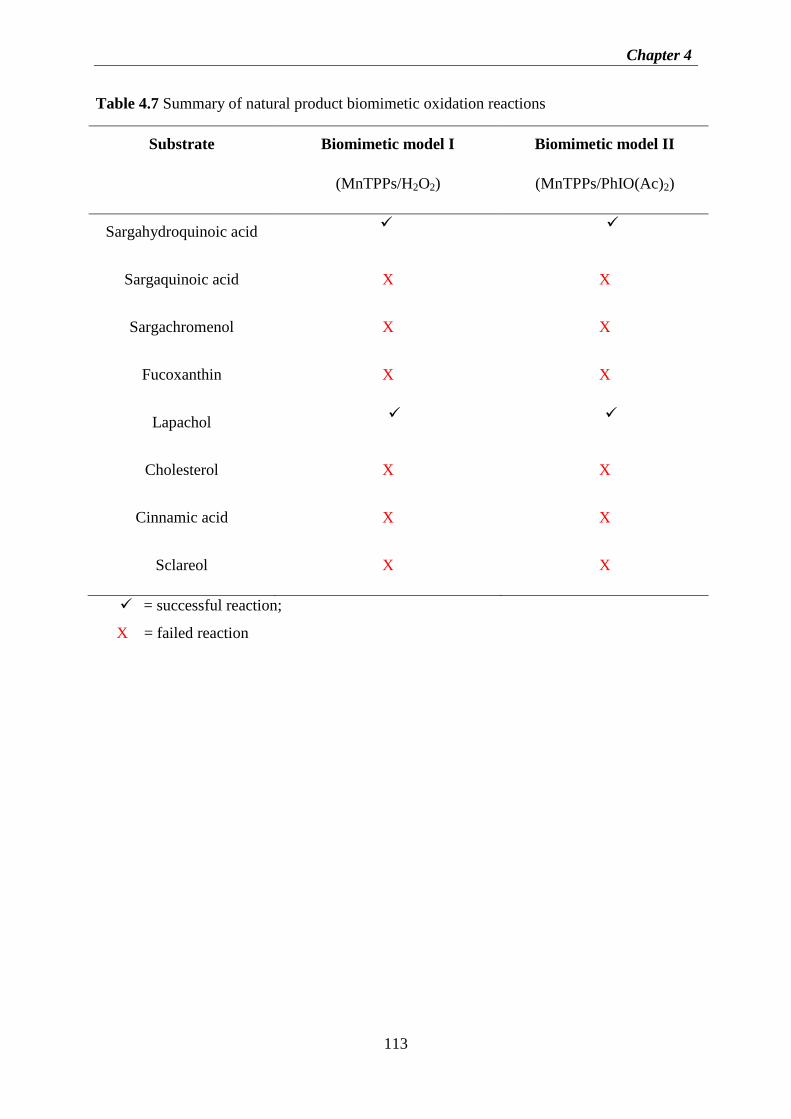
Chapter 4
113
Table 4.7 Summary of natural product biomimetic oxidation reactions
Substrate Biomimetic model I
(MnTPPs/H2O2)
Biomimetic model II
(MnTPPs/PhIO(Ac)2)
Sargahydroquinoic acid
Sargaquinoic acid X X
Sargachromenol X X
Fucoxanthin X X
Lapachol
Cholesterol X X
Cinnamic acid X X
Sclareol X X
= successful reaction;
X = failed reaction
Chapter 4
114
4.3 Experimental
4.3.1 General experimental
Solvents
All solvents used for extraction and chromatography were HPLC grade (LiChrosolv®;
Merck®, Darmstadt, Germany).
Reagents
All reagents used for the two biomimetic models which are hydrogen peroxide (30% v/v)
solution, imidazole, iodobenzene diacetate, cinnamic acid and the metalloporphyrins:
MnTPPs, MnPYP were purchased from Sigma-Aldrich®, South Africa. Formic acid,
acetanilide and cholesterol were obtained from Saarchem (Pty) Limited, South Africa.
Phenylbutazone, lapachol, ibuprofen and indomethacin, were obtained from the library of
compounds in the Faculty of Pharmacy at Rhodes University. Sclareol and crude Sargassum
incisifolium extract was obtained from the library of compounds from the Faculty of
Pharmacy at University of Western Cape. The purity of all natural products and NSAIDs was
determined by 1H-NMR spectroscopy prior to starting the oxidation reactions.
Chromatographic procedures
Column chromatographic purification procedures were achieved using Merck® silica gel 60
(0.040-0.063mm) 230-400 mesh ASTM products. All thin layer chromatography experiments
were run on Merck® silica gel 60F254 20x20 aluminium sheets and visualization was done
using Syngene UV lamp, with dual wavelengths 254nm and 365nm.
Nuclear magnetic resonance
NMR studies were conducted using a Bruker® Avance 400 MHz spectrometer with
deuterated chloroform (CDCl3) as the NMR solvent. All chemical shifts were recorded in part
per million (δ) and coupling constants J given in hertz (Hz).All spectra were referenced to
residual solvent (δH 7.28, δC 77.0) for CDCl3.

Chapter 4
115
4.3.2 Isolation of sargahydroquinoic acid
The crude product (2.34g) obtained from the initial extraction of Sargassum incisifolium was
fractionated via step gradient chromatography and eluted using Hexane-EtOAc (ethyl acetate)
in increasing polarity. The 6:4 Hexane-EtOAc fraction (0.95g) was of importance containing
since it contained the sargahydroquinoic acid component. The fraction was analyzed using
1H-NMR and
13C-NMR.
4.3.3 Determination of the hydrogen peroxide content
The exogenous oxygen donor for biomimetic oxidation model catalyst-H2O2 was hydrogen
peroxide. There was therefore a need to determine its peroxide content prior to conducting
any metabolism studies. The content of hydrogen peroxide was determined by titration with
KMnO4 (0.025M) in the presence of H2SO4 (3M). The content of peroxide was found to be
29.68%.
4.3.4 Biomimetic oxidation model (Catalyst-H2O2)
General procedure
Hydrogen peroxide (H2O2) (30% v/v) (5 mmol) in acetonitrile (1:9 v/v) was slowly added to
a solution of catalyst (0.025 mol equiv.), imidazole (0.6 mmol), substrate (1 mmol), and
formic acid (168 mmol) in DCM/acetonitrile (1:1 v/v) over 2h at room temperature. The
reaction mixture was then stirred for a further 2h. Total reaction time was 4h. Reaction
progress was assessed via TLC every 1h. The solvent from the successful reaction mixture
(as determined by TLC) was then evaporated under reduced pressure and subjected to column
chromatography and analysed by NMR. For natural product biomimetic reactions, crude
reaction product was extracted by DCM.

Chapter 4
116
4.3.5 Biomimetic oxidation model (Catalyst-PhIO(Ac)2)
General procedure
Iodosobenzene diacetate (PhIO(Ac)2) (1.5 mmol) for the olefin epoxidations was added to a
reaction mixture with catalyst (0.005 mol equiv.), H2O (5 µL), and substrate (1 mmol) in
solution of DCM/acetonitrile (1:1 v/v). The reaction mixture was then stirred at room
temperature for 30 min (NSAID oxidations) 1h 30min (natural product oxidations). Reaction
progress was assessed every 30 min via TLC. Successful reaction mixtures were further
purified via column chromatography to isolate oxidized products and analysed via NMR
techniques. For natural product biomimetic reactions, crude reaction product was extracted
by DCM.
Control reactions
The control reactions were conducted one in the absence of metalloporphrin (control 1)
catalyst and the other in the absence of oxidant (control 2).
Thin layer chromatography procedures
The TLC solvent used in analyzing each of the substrates used in the biomimetic models
above have been tabulated below (Table 4.8). TLC staining with 10% methanolic sulphuric
acid was employed in the analysis of cholesterol reaction products. All the other TLC
visualizations were done under UV at 254 nm wavelength. TLC solvent systems were used in
column chromatographic procedures.

Chapter 4
117
Table 4.8 TLC solvent systems used in the biomimetic oxidation models
Substrate TLC solvent system
Phenylbutazone Hexane/DCM/Acetic acid (7:3:1)
Acetanilide Acetonitrile/DCM (1:1)
Indomethacin Chloroform/MeOH (5:1)
Ibuprofen DCM/Diethyl ether
Sargahydroquinoic acid Hexane/EtOAc(6:4)
Sargaquinoic acid Hexane/EtOAc (6:4)
Sargachromenol Hexane/EtOAc (6:4)
Fucoxanthin Hexane/EtOAc (4:6)
Lapachol Hexane/EtOAc (1:2)
Cholesterol Hexane/EtOAc (8:2)
Cinnamic acid DCM/EtOAc/Acetic acid (5:5:1)
Sclareol Hexane/EtOAc (6:4)
4.3.6 Isolated oxidation products
Compound 4.20
Sargahydroquinoic acid (4.20): Green paste-1H-NMR (400 MHz, CDCl3),
13C-NMR (100
MHz, CDCl3). See Table 4.6.
COOHOH
OH

Chapter 4
118
Compound 4.28
4-hydroxy-4-n-butyl-1,2-diphenylpyrazolidine-3,5-dione (4.26): White solid- 1H-NMR (400
MHz, CDCl3). See Table 4.3.
Compound 4.30
O
O
COOH
Sargaquinoic acid (4.30): Green paste-1H-NMR (400 MHz, CDCl3),
13C-NMR (100 MHz,
CDCl3). See Table 4.6.
N
N
O
O
OH

Chapter 4
119
4.4 References
Afolayan A.F., Bolton J.J., Lategan C.A., Smith P.J., Beukes D.R. (2008). Fucoxanthin,
tetraprenylated toluquinone and toluhydroquinone metabolites from Sargassum
heterophyllum inhibit the in vitro growth of malaria parasite Plasmodium falciparum.
Zeitschrift für Naturforschung B 63: 848-852
Alexander D.M., Mathew G.M., Wilson B.J. (1985). Metabolism of phenylbutazone in rats.
Xenobiotica 15: 123-128
Artkinson A.J., Markey S.A. (2012). Chapter 16 Biochemical mechanisms of drug toxicity.
Principles of Clinical Pharmacology 3rd
Ed. (Atkinson A.J Ed.). Academic Press, USA: 259-
280
Balogh G., Keserű G. (2004). Metalloporphyrin mediated biomimetic oxidations. A useful
tool for the investigation of cytochrome P450 catalyzed oxidative metabolism. Arkivoc 7:
124-139
Bombarda I., Becerra V.O., Mela P., Gaydou E.M. (1997). Cyclization of sclareol epoxides
catalyzed by boron trifluoride in methanol. Journal of Essential Oil Research 9:551-554
Bussy U., Giraudeau P., Tea I., Boujtita M. Understanding the degradation of
electrochemically-generated reactive drug metabolites by quantitative NMR. Talanta 116:
554-558
Chauhan S.M.S., Srinivas K.A., Mohapatra P.P. (1999). Oxidation of phenylbutazone with
hydrogen peroxide catalyzed by 5, 10, 15,20-tetraaryl-porphyrinatoiron (III) chlorides in
dichloromethane. Indian Journal of Chemistry 38B: 724-725
Chorgade M.S., Hill D.R., Lee E.C., Pariza R.J., Dolphin D.H., Hino F., Zhang L. (1996).
Metalloporphrins as chemical mimics of cytochrome P-450 systems. Pure and Applied
Chemistry 68: 753-756
Chorgade M.S., Dolphin D.H., Hill D.R., Hino F., Lee E.C. (1998). Use of synthetic
metalloporphyrins for preparation and prediction of drug metabolites. US Patent 5760216

Chapter 4
120
De Almeida E.R. (2009). Preclinical and clinical studies of lapachol and beta-lapachone. The
Open Natural Products Journal 2: 42-47
De Faria E.H., Ricci G.P., Lemos F.M., e Silva M.L.A., Filho A.A.D., Calefi P.S., Nassar
E.J., Ciuffi K.J. (2011). Chapter 7 Green oxidation reactions of drugs catalyzed by bio-
inspired complexes as an efficient methodology to obtain new active molecules. Biomimetic
Based Applications. (Prof. Marko Cavrak Ed.) 163-182. ISBN: 978-953-307-195-4. InTech,
Available from: http://www.intechopen.com/books/biomimetic-based-applications/green-
oxidationreactions-of-drugs-catalyzed-by-bio-inspired-complexes-as-an-efficient-
methodology-t
Dieterle W., Faigle J.W., Früh F., Mory H., Theoblad W., Alt K.O., Richter W.J. (1976).
Metabolism of phenylbutazone in man. Arzneimittel-Forschung 26: 572-577.
Duggan D.E., Hogans A.F., Kwan K.C., McMahon F.G. (1972). The metabolism of
indomethacin in man. The Journal of Pharmacology and Experimental Therapeutics 181:
563-575
Fox M.A., Whitesell J.K. (2004). Chapter 11 Electrophilic Aromatic Substitution . Organic
Chemistry 3rd
Ed. (Bruno L.C Ed). Jones and Bartlett, Canada: 524-569
Goh Y.M., Nam W. (1999). Significant electronic effect of porphyrin ligand on the
reactivities of high valent iron (IV) oxo porphyrin cation radical complexes. Inorganic
Chemistry 38: 914-920
Gotardo M.C.A.F., De Moraes L.A.B., Assis M.D. (2006). Metalloporphyrins as biomimetic
models for cytochrome P-450 in the oxidation of atrazine. Journal of Agricultural and Food
Chemistry 54: 10011-10018
Huguet M., Simon V., Gallard H. (2014). Transformation of paracetamol into 1,4-
benzoquinone by a manganese oxide filter. Journal of Hazardous Materials 271:245-251
In J., Park S., Song R., Nam W. (2003). Iodobenzene diacetate as an efficient terminal
oxidant in iron (III) porphyrin complex-catalyzed oxygenation reactions. Inorganica Chimica
Acta 343: 373-376
Chapter 4
121
Jeong Y.J., Kang Y., Han A., Lee Y., Kotani H., Fukuzumi S., Nam W. (2008). Hydroge
atom abstraction and hydride transfer reactions by iron (IV)-oxo porphyrins. Angewandte
Chemie International Edition 47: 7321-7324
Kanazawa A., Yoshioka M., Teshima S. (1972). Sterols in some red algae. Memoirs of
Faculty of Fisheries Kagoshima University 21: 103-107
Kapetanović R., Sladić D., Popov S., Zlatović M., Kljajić Z., Gašić. (2005). Sterol
composition of the Adriatic Sea algae Ulva lactuca, Codium dichotomum, Cystoseira
adriatica and Fucus virsoides. Journal of Serbian Chemical Society 70: 1395-1400
Kepp D.R., Sidelmann U.G., Hansen S.H. (1997). Isolation and characterization of major
phase I and II metabolites of ibuprofen. Pharmaceutical Research 14: 676-680
Kim S., Choi H.Y., Lee W., Park G.M., Shin W.S., Kim Y.K. (2008). Sargaquinoic acid and
sargahydroquinoic acid from Sargassum yezoense stimulate adipocyte differentiation through
PPARα/γ activation in 3T3-L1 cells. FEBS Letters 582: 3465-3472
Kim M.C., Kwon H.C., Kim S.N., Kim H.S., Um B.H. (2011). Plastoquinones from
Sargassum yezoense; chemical structures and effects on the activation of peroxisome
proliferator-activated receptor gamma. Chemical and Pharmaceutical Bulletin 59: 834-838
Kim S., Lee M., Lee B., Gwon W., Joung E., Yoon N., Kim H. (2014). Anti-inflammatory
effects of sargachromenol-rich ethanolic extract of Myagropis myagroides on
lipopolysaccharide-stimulated BV-2 cells. BMC Complementary and Alternative Medicine
14: 231-243
Lee J.Y., Lee Y., Kotani H., Nam W., Fukuzumi S. (2009). High-valent manganese (v)-oxo
porphyrin complexes in hydride transfer reactions. Chemical Communications 6: 704-706
Lees P., Toutain P. (2013). Pharmacokinetics, pharmacodynamics, metabolism, toxicology
and residues of phenylbutazone in humans and horses. The Veterinary Journal 196: 294-303
Liu L., Hudgins W.R., Shack S., Yin M.Q. (1995). Cinnamic acid: a natural product with
potential use in cancer intervention. International Journal of Cancer 62: 345-350

Chapter 4
122
Lohmann W., Karst U. (2008). Biomimetic modeling of oxidative drug metabolism.
Analytical and Bioanalytical Chemistry 391: 79-96
Mac Leod T.C.O., Faria A.L., Barros V.P., Queiroz M.E.C., Assis M.D. (2008). Primidone
oxidation catalyzed by metalloporphyrins and Jacobsen catalyst. Journal of Molecular
Catalysis A: Chemical 296: 54-60
Mansuy D., Battioni P., Battioni J. (1989). Chemical model systems for drug-metabolizing
cytochrome-P-450-dependent monooxygenases. European Journal of Biochemistry 184: 267-
285
Meunier B. (1992). Metalloporphyrins as versatile catalysts for oxidation reactions and
oxidative DNA cleavage. Chemical Reviews 92: 1411-1456
Nakajima M., Inoue T., Shimada N., Tokudome S., Yamamoto T., Kuroiwa Y. (1998).
Cytochrome P450 2C9 catalyzes indomethacin o-demethylation in human liver microsomes.
Drug Metabolism and Disposition 26: 261-266
Neunzing I., Göhring A., Drăgan C., Zapp J., Peters F.T., Maurer H.H., Bureik M. (2012).
Production and NMR analysis of the human ibuprofen metabolite 3-hydroxyibuprofen.
Journal of Biotechnology 157: 717-420.
Niehues M., Barros V. P., Emery F. D., Dias-Baruffi M., Assis M.D., Lopes N.P. (2012).
Biomimetic in vitro oxidation of lapachol: A model to predict and analyse the in vivo phase I
metabolism of bioactive compounds. European Journal of Medicinal Chemistry: 804-812
Othman S., Mansuy-Mouries V., Bensoussan C., Battioni P., Mansuy D. (2000).
Hydroxylation of diclofenac: an illustration of the complementary roles of biomimetic
metalloporphyrin catalysts and yeasts expressing human cytochromes P450 in drug
metabolism studies. Bioorganic and Medicinal Chemistry 3: 751-755
Peng J., Yuan J., Wu C., Wang J. (2011). Fucoxanthin, a marine carotenoid present in brown
seaweeds and diatoms: metabolism and bioactivities relevant to human health. Marine Drugs
9: 1806-1828

Chapter 4
123
Pires S.M.G., De Paula R., Simões M.M.Q., Silva A.M.S., Domingues M.R.M., Santos
I.C.M.S., Vargas M.D., Ferreira V.F., Neves M.G.P.M.S., Cavaleiro J.A.S. (2011). Novel
biomimetic oxidation of lapachol with H2O2 catalysed by a manganese (III) porphyrin
complex . RSC Advances 1: 1195-1199
Potter D.W., Hinson J.A. (1987). Mechanisms of acetaminophen oxidation to N-acetyl-P-
benzoquinone imine by horseradish peroxidase and cytochrome P450. The Journal of
Biological Chemistry 262: 966-973
Remmel R.P., Crews B.C., Kozak K.R., Kalgutkar A.S., Marnett L.J. (2004). Studies on the
metabolism of novel, selective cyclooxygenase-2 inhibitor indomethacin phenethylamide in
rat, mouse and human liver microsomes: identification of active metabolites. Drug
Metabolsim and Disposition 32: 113-122
Segrestaa J., Vérité P., Estour F., Ménager S., Lafont O. (2002). Improvements of a
biomimetic porphyrin catalytic system by addition of acids. Chemical and Pharmaceutical
Bulletin 50: 744-748
Stang P.J., Zhdankin V.V. (1996). Organic polyvalent iodine compounds. Chemical Reviews
96: 1123-1178
Tedeschi E., Rezende D.B. (2009). On the 1H-NMR spectra of 2-substituted benzoquinones.
Annals of Magnetic Resonance 8: 9-13
Valenzuela A., Sanhueza J., Nieto S. (2003). Cholesterol oxidation: Health hazard and the
role of antioxidants in prevention. Biological Research 36: 291-302
Vijayarahavan B., Chauhan S.M.S. (1990). Chloroiron(III)-5,10,15,20-
tetraarylporphyrinate/N-methylimidazole catalyzed oxidation of androst-4-en-3,17-dione by
cumene hydroperoxide. Tetrahedron Letters 31: 6223-6226
Zhang D., Luo G., Ding X., Lu C. (2012). Preclinical experimental models of drug
metabolism and disposition in drug discovery and development. Acta Pharmaceutica Sinica B
2: 549-561

Chapter 4
124
Zivanovic A. (2012). Marine natural products isolation, screening and analogue synthesis.
PhD thesis. University of Wollongong

Chapter 5
125
Chapter 5
Conclusions
With the ever increasing need for new drug molecules, it is important to facilitate the drug
discovery and development process to increase the turnover of new drug molecules on the
market. Implementing early drug metabolism studies in the drug development process is
important in selecting appropriate potential drug molecules with suitable pharmacokinetic
and metabolic profiles. Biomimetic oxidation models provide a simple chemical model which
allows the isolation and characterization of possible drug metabolites from potential drug
molecules.
In this study, two biomimetic model systems catalyzed by water-soluble metalloporphyrins
were successfully developed in assessing possible metabolites from natural products with
therapeutic importance. Lapachol derivatives were determined which were isolated in a
previous biomimetic oxidation model study with dehydro-α-lapachone also isolated from an
in vivo metabolism model with female wistar rats. This therefore illustrates the potential of
biomimetic oxidation models as a useful in vitro system to predict in vivo drug metabolism.
The most efficient biomimetic oxidation model was in the presence of PhIO(Ac)2 but this is
associated with unfavourable by-products such iodobenzene resulting in complex NMR
signals. However, the biomimetic oxidation model in the presence of hydrogen peroxide was
the most favourable as it closely resembles molecular oxygen, produces water as the only by-
product and is environmentally friendly.
The phytochemical analysis of Brassicophycus brassicaeformis resulted in the isolation of
four compounds: fucosterol (3.9), fucoxanthin (3.16),two Monogalactosyldiacylglycerols; 1-
O-(5Z,8Z,11Z,14Z-eicosatetraenoyl)-2-O-(9Z,12Z,15Z-octadecatrienoyl)-3-O-β-D-
galactopyranosyl-sn-glycerol (3.17) and 1-O-(9Z-octadecenoyl)-2-O-(hexadecanoyl)-3-O-β-

Chapter 5
126
D-galactopyranosyl-sn-glycerol (3.18). This study represents the first phytochemical analysis
of Brassicophycus brassicaeformis.
Future work and considerations
The biomimetic oxidation model can be modified by controlling the pH of the reaction
medium to pH 7.4 as well as providing an aqueous environment for oxidation reactions to
occur. This provides a better environment mimicking the physiological environment at the
cytochrome P450 active site. Furthermore, it is essential to determine the biological activity
or lack thereof of all metabolites derived from the biomimetic oxidation models of natural
products including toxicological tests. A major consideration should therefore be the scale-up
and isolation of all biomimetic products.
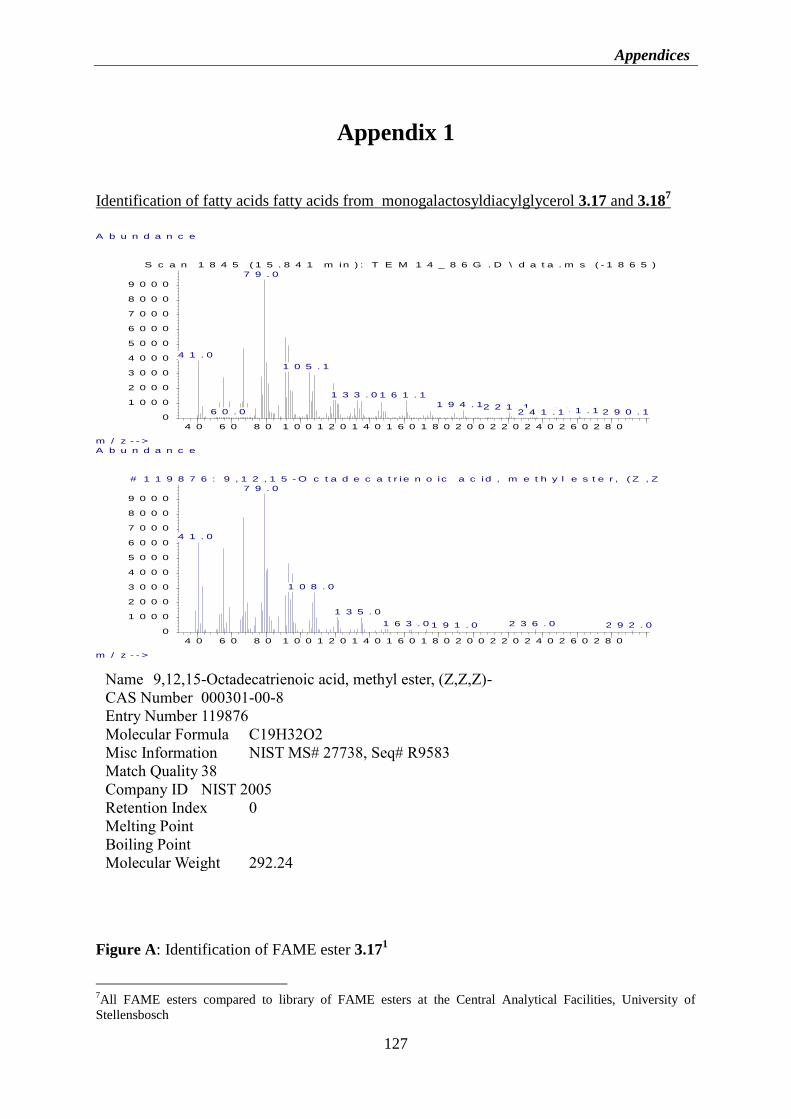
Appendices
127
Appendix 1
Identification of fatty acids fatty acids from monogalactosyldiacylglycerol 3.17 and 3.187
Figure A: Identification of FAME ester 3.171
7All FAME esters compared to library of FAME esters at the Central Analytical Facilities, University of
Stellensbosch
4 0 6 0 8 0 1 0 0 1 2 0 1 4 0 1 6 0 1 8 0 2 0 0 2 2 0 2 4 0 2 6 0 2 8 0
0
1 0 0 0
2 0 0 0
3 0 0 0
4 0 0 0
5 0 0 0
6 0 0 0
7 0 0 0
8 0 0 0
9 0 0 0
m / z - - >
A b u n d a n c e
S c a n 1 8 4 5 ( 1 5 . 8 4 1 m in ) : T E M 1 4 _ 8 6 G . D \ d a t a . m s ( - 1 8 6 5 ) ( - )
7 9 . 0
4 1 . 0
1 0 5 . 1
1 3 3 . 0 1 6 1 . 1
1 9 4 . 12 2 1 . 12 6 1 . 16 0 . 0 2 9 0 . 12 4 1 . 1
4 0 6 0 8 0 1 0 0 1 2 0 1 4 0 1 6 0 1 8 0 2 0 0 2 2 0 2 4 0 2 6 0 2 8 0
0
1 0 0 0
2 0 0 0
3 0 0 0
4 0 0 0
5 0 0 0
6 0 0 0
7 0 0 0
8 0 0 0
9 0 0 0
m / z - - >
A b u n d a n c e
# 1 1 9 8 7 6 : 9 , 1 2 , 1 5 - O c t a d e c a t r ie n o ic a c id , m e t h y l e s t e r , ( Z , Z , Z ) -
7 9 . 0
4 1 . 0
1 0 8 . 0
1 3 5 . 0
1 6 3 . 0 2 3 6 . 01 9 1 . 0 2 9 2 . 0
Name 9,12,15-Octadecatrienoic acid, methyl ester, (Z,Z,Z)-
CAS Number 000301-00-8
Entry Number 119876
Molecular Formula C19H32O2
Misc Information NIST MS# 27738, Seq# R9583
Match Quality 38
Company ID NIST 2005
Retention Index 0
Melting Point
Boiling Point
Molecular Weight 292.24

Appendices
128
Figure B: Identification of FAME ester 3.172
4 0 6 0 8 01 0 01 2 01 4 01 6 01 8 02 0 02 2 02 4 02 6 02 8 03 0 03 2 03 4 03 6 0
0
1 0 0 0
2 0 0 0
3 0 0 0
4 0 0 0
5 0 0 0
6 0 0 0
7 0 0 0
8 0 0 0
9 0 0 0
m / z - - >
A b u n d a n c e
S c a n 2 6 9 4 ( 2 0 . 7 8 9 m i n ) : T E M 1 4 _ 8 6 G . D \ d a t a . m s ( - 2 6 7 0 ) ( - )
7 9 . 0
1 0 5 . 14 1 . 1
1 3 3 . 0
1 6 1 . 12 0 1 . 1
2 4 7 . 12 8 7 . 12 2 4 . 0 3 1 5 . 93 4 2 . 1
4 0 6 0 8 01 0 01 2 01 4 01 6 01 8 02 0 02 2 02 4 02 6 02 8 03 0 03 2 03 4 03 6 0
0
1 0 0 0
2 0 0 0
3 0 0 0
4 0 0 0
5 0 0 0
6 0 0 0
7 0 0 0
8 0 0 0
9 0 0 0
m / z - - >
A b u n d a n c e
# 1 9 2 0 0 4 : M e t h y l a r a c h i d o n a t e $ $ 5 , 8 , 1 1 , 1 4 - E i c o s a t e t r a e n o i c a c i d , m e t h y l e s t e r , ( a l l - Z ) - ( C A S ) $ $ M E T H Y L 5 , 8 , 1 1 , 1 4 - E I C O S A T E T R A E N O A T E $ $ A r a c h i d o n i c a c i d m e t h y l e s t e r $ $ M e t h y l a l l -
7 9 . 0
4 1 . 0
1 0 5 . 0
1 5 0 . 0
1 7 5 . 02 0 3 . 0
2 4 7 . 02 7 5 . 0 3 1 8 . 0
Name Methyl arachidonate $$ 5,8,11,14-Eicosatetraenoic acid, methyl
ester, (all-Z)- (CAS) $$ METHYL 5,8,11,14-EICOSATETRAENOATE
$$ Arachidonic acid methyl ester $$ Methyl all-cis-5,8,11,14-
eicosatetraenoate $$ 5,8,11,14-Eicosatetraenoic acid, methyl ester
CAS Number 002566-89-4
Entry Number 192004
Molecular Formula C21H34O2
Misc Information QI=563, Source=NS-0-0-0
Match Quality 52
Company ID 330326
Retention Index 0
Melting Point
Boiling Point
Molecular Weight 318.26

Appendices
129
Figure C: Identification of FAME ester 3.181
4 0 6 0 8 0 1 0 0 1 2 0 1 4 0 1 6 0 1 8 0 2 0 0 2 2 0 2 4 0 2 6 0 2 8 0
0
1 0 0 0
2 0 0 0
3 0 0 0
4 0 0 0
5 0 0 0
6 0 0 0
7 0 0 0
8 0 0 0
9 0 0 0
m / z - - >
A b u n d a n c e
S c a n 1 2 0 2 ( 1 2 . 0 9 3 m in ) : T E M 1 4 _ 8 6 P . D \ d a t a . m s ( - 1 1 6 4 ) ( - )
7 4 . 1
4 3 . 11 4 3 . 1
2 2 7 . 22 7 0 . 3
1 8 5 . 19 7 . 11 1 5 . 1
1 6 3 . 1 2 0 9 . 1
4 0 6 0 8 0 1 0 0 1 2 0 1 4 0 1 6 0 1 8 0 2 0 0 2 2 0 2 4 0 2 6 0 2 8 0
0
1 0 0 0
2 0 0 0
3 0 0 0
4 0 0 0
5 0 0 0
6 0 0 0
7 0 0 0
8 0 0 0
9 0 0 0
m / z - - >
A b u n d a n c e
# 1 5 3 6 2 9 : H e x a d e c a n o ic a c id , m e t h y l e s t e r ( C A S ) $ $ M e t h y l p a lm i t a t e $ $ M e t h y l h e x a d e c a n o a t e $ $ M e t h y l n - h e x a d e c a n o a t e $ $ U n ip h a t A 6 0 $ $ M e t h o le n e 2 2 1 6 $ $ P a lm i t ic a c id m e t h y l e s t e r
7 4 . 0
4 3 . 0
1 4 3 . 0
2 2 7 . 09 7 . 0 2 7 0 . 01 8 5 . 01 1 5 . 0
Name Hexadecanoic acid, methyl ester (CAS) $$ Methyl palmitate $$
Methyl hexadecanoate $$ Methyl n-hexadecanoate $$ Uniphat A60 $$
Metholene 2216 $$ Palmitic acid methyl ester $$ Palmitic acid, methyl
ester $$ n-Hexadecanoic acid methyl ester $$ PALMITIC ACID-
CAS Number 000112-39-0
Entry Number 153629
Molecular Formula C17H34O2
Misc Information QI=553, Source=NS-0-0-0
Match Quality 99
Company ID 329104
Retention Index 0
Melting Point
Boiling Point
Molecular Weight 270.26

Appendices
130
Figure D: Identification of FAME ester 3.182
4 0 6 0 8 0 1 0 0 1 2 0 1 4 0 1 6 0 1 8 0 2 0 0 2 2 0 2 4 0 2 6 0 2 8 0 3 0 0
0
1 0 0 0
2 0 0 0
3 0 0 0
4 0 0 0
5 0 0 0
6 0 0 0
7 0 0 0
8 0 0 0
9 0 0 0
m / z - - >
A b u n d a n c e
S c a n 1 9 5 8 ( 1 6 . 4 9 9 m in ) : T E M 1 4 _ 8 6 P . D \ d a t a . m s ( - 1 9 9 7 ) ( - )
5 5 . 1
7 4 . 0
9 7 . 1
2 6 4 . 1
2 2 2 . 21 2 3 . 11 8 0 . 2
1 5 2 . 12 9 6 . 1
1 9 9 . 1 2 4 1 . 1
4 0 6 0 8 0 1 0 0 1 2 0 1 4 0 1 6 0 1 8 0 2 0 0 2 2 0 2 4 0 2 6 0 2 8 0 3 0 0
0
1 0 0 0
2 0 0 0
3 0 0 0
4 0 0 0
5 0 0 0
6 0 0 0
7 0 0 0
8 0 0 0
9 0 0 0
m / z - - >
A b u n d a n c e
# 1 7 5 2 2 8 : 9 - O c t a d e c e n o ic a c id ( Z ) - , m e t h y l e s t e r ( C A S ) $ $ M e t h y l o le a t e $ $ M e t h y l c i s - 9 - o c t a d e c e n o a t e $ $ O le i c a c id m e t h y l e s t e r $ $ O le i c a c id , m e t h y l e s t e r $ $ E m e r y o le ic a c id e s t
5 5 . 0
7 4 . 0
9 7 . 0
2 6 4 . 0
1 2 3 . 0 2 2 2 . 01 8 0 . 0
1 5 2 . 0 2 9 6 . 01 9 9 . 0
2 0 4 0 6 0 8 0 1 0 0 1 2 0 1 4 0 1 6 0 1 8 0 2 0 0 2 2 0 2 4 0 2 6 0 2 8 0 3 0 0
0
2 0 0 0
4 0 0 0
6 0 0 0
8 0 0 0
m / z - - >
A b u n d a n c e
S c a n 1 9 5 8 ( 1 6 . 4 9 9 m in ) : T E M 1 4 _ 8 6 P . D \ d a t a . m s ( - 1 9 9 7 ) ( - )
5 5 . 1
8 3 . 1
2 6 4 . 1
1 1 1 . 12 2 2 . 2
1 8 0 . 21 3 7 . 0
2 9 6 . 11 5 7 . 1 2 0 0 . 1 2 4 2 . 3
2 0 4 0 6 0 8 0 1 0 0 1 2 0 1 4 0 1 6 0 1 8 0 2 0 0 2 2 0 2 4 0 2 6 0 2 8 0 3 0 0
0
2 0 0 0
4 0 0 0
6 0 0 0
8 0 0 0
m / z - - >
A b u n d a n c e
# 1 7 5 2 4 1 : 9 - O c t a d e c e n o i c a c i d , m e t h y l e s t e r , ( E ) - ( C A S ) $ $ M e t h y l e l a i d a t e $ $ M E T H Y L - T R A N S 9 - O C T A D E C E N O A T E $ $ E la i d i c a c i d m e t h y l e s t e r $ $ E la i d i c a c i d , m e t h y l e s t e r $ $ M e t h y l t r a n
5 5 . 0
8 3 . 0
2 9 . 0
2 6 4 . 0
1 1 1 . 02 2 2 . 0
1 8 0 . 01 3 7 . 0 2 9 6 . 01 5 7 . 0 2 0 0 . 0 2 4 4 . 0
Name 9-Octadecenoic acid, methyl ester, (E)- (CAS) $$ Methyl elaidate $$ METHYL-TRANS 9-
OCTADECENOATE $$ Elaidic acid methyl ester $$ Elaidic acid, methyl ester $$ Methyl trans-9-
octadecenoate $$ (E)-9-Octadecenoic acid methyl ester
CAS Number 001937-62-8
Entry Number 175241
Molecular Formula C19H36O2
Misc Information QI=883, Source=NS-0-0-0
Match Quality 99
Company ID 299237
Retention Index 0
Melting Point
Boiling Point
Molecular Weight 296.27
Or

Appendices
131
Appendix 2
LC-MS Data for crude fraction G containing Monogalactosyldiacylglycerols 3.17 and 3.18
Figure A: LC-MS spectrum of crude fraction G identifying monogalactosyldiacylglycerol
3.17
TEM13-32G pos #2-5 RT: 0.05-0.14 AV: 4 NL: 6.63E4
T: + c Full ms [ 225.00-2000.00]
650 700 750 800 850 900
m/z
0
5000
10000
15000
20000
25000
30000
35000
40000
45000
50000
55000
60000
65000
Inte
nsi
ty
753.49
849.17
825.50
754.48
824.37 826.58823.33
850.98
779.51
780.50
787.03851.83
805.93755.57 848.25 875.40
827.73752.40 890.18
928.45765.13
685.62 726.99714.53648.21
Compound
3.17

Appendices
132
Figure B: LC-MS spectrum of crude fraction G identifying monogalactosyldiacylglycerol
3.18
TEM13-32D pos_130827102129 #2-3 RT: 0.04-0.06 AV: 2 NL: 7.10E5
T: + c Full ms [ 134.00-1500.00]
200 400 600 800 1000 1200 1400
m/z
0
50000
100000
150000
200000
250000
300000
350000
400000
450000
500000
550000
600000
650000
700000
Inte
nsity
825.67
827.03
239.08 823.64
622.13431.80
893.27714.64277.19 432.75 963.22 1067.04
451.94 1251.08 1313.96 1456.81
Compound
3.18

Appendices
133
Appendix 3
High resolution mass spectrometry (HRESIMS) of monogalactosyldiacylglycerol 3.17
Figure A: HRESIMS of monogalactosyldiacylglycerol 3.18 (ESI+ mode)
TEM 13 72P
m/z500 550 600 650 700 750 800 850 900 950 1000 1050 1100 1150
%
0
100
MS_Direct_141204b_15 19 (0.106) Cm (19:28-3:8) 1: TOF MS ES+ 3.09e4779.5664
774.6100
515.3181
510.3589
470.2164
541.3359
516.3212
557.3306
573.3250
661.9628617.9337610.1894
772.0316684.4714 727.9988
780.5687
795.5580
811.5516
812.5593
813.5618847.5503
1002.4965952.6548860.0695 1025.6605
779.5664

Appendices
134
Figure B: HRESIMS of monogalactosyldiacylglycerol 3.18 (ESI- mode)
TEM 13 72P
m/z275 300 325 350 375 400 425 450 475 500 525 550 575 600 625 650 675 700 725 750 775 800 825 850 875 900 925 950 975 1000
%
0
100
MS_Direct_141204b_18 29 (0.136) Cm (22:35-(1:6+159:183)) 1: TOF MS ES- 4.03e3309.0475
293.0529
289.0696
311.0467
801.5756
537.3261
527.2964
312.0500
472.2877
325.1809425.0392
423.0362
345.0310357.0307
394.2765
377.0801427.8663 491.3180
499.1858
791.5440563.3412
569.3087
579.3372
631.3293585.2958
605.3122678.5213632.3339
639.3649 693.4542 771.5494704.2712
802.5745
869.5595
817.5689
833.5631
834.5696
870.5617
937.5457871.5651
901.5239970.5243
791.5440

Appendices
135
Appendix 4
Antimicrobial assays8 were conducted on fucosterol (3.9), monogalactosyldiacylglycerol 3.17
and monogalactosyldiacylglycerol 3.18 against Acinetobacter baumannii (ATCC BAA-
1605), Enterococcus faecalis (ATCC 51299), Escherichia coli (ATCC 25922),
Staphylococcus aureus (ATCC 33591) and Candida albicans (ATCC 90028D-5). The results
have been tabulated below.
Table 1: Antimicrobial assays of the natural products 3.9, 3.17 and 3.18
Compound
code
Disk-diffusion assay Bioautography MIC (µg/ml)
TEM13-72P
3.18
- - Candida albicans – 50
Escherichia coli – 100
Entericoccus faecalis – 100
TEM13-72 g
3.17
- + Ef Escherichia faecalis – 100
Acinetobacter baumannii – 1
TEM13-16
3.9
- -
The results above illustrate positive antimicrobial activity of 1-O-(5Z,8Z,11Z,14Z-
eicosatetraenoyl)-2-O-(9Z,12Z,15Z-octadecatrienoyl)-3-O-β-D-galactopyranosyl-sn-glycerol
(3.17) against Acinetobacter baumannii with monogalactosyldiacylglycerol 3.18 showing less
antimicrobial activity. This supports the fact that biological activity in
Monogalactosyldiacylglycerols is linked to the degree of unsaturation of the fatty acids with
more unsaturated fatty acids resulting in more biological activity (Bruno et al., 2005; Imbs et
al., 2013).
No antimicrobial activity was determined for fucosterol.
8 Assays were conducted at University of Kwazulu Natal by Roes-Hill M.L and Durrell K.A.
Appendices
136
References
Bruno A., Rossi C., Marcolongo G., Di Lena A., Venzo A., Berrie C.P., Corda D. (2005).
Selective in vivo anti-inflammatory action of the galactolipid monogalactosyldiacylglycerol.
European Journal of Pharamcology 524: 159-168
Imbs T.I., Ermakova S.P., Fedoreyev S.A., Anastyuk S.D., Zvyagintseva T.N. (2013).
Isolation of fucoxanthin and highly unsaturated monogalactosyldiacylglycerol from brown
alga Fucus evanescens C Agardh and in vitro investigation of their antitumor activity. Marine
Biotechnology 15: 606-612