Isolation by distance and sharp discontinuities in gene ...
15
Molecular Ecology (2004) 13, 1883–1897 doi: 10.1111/j.1365-294X.2004.02212.x © 2004 Blackwell Publishing Ltd Blackwell Publishing, Ltd. Isolation by distance and sharp discontinuities in gene frequencies: implications for the phylogeography of an alpine insect species, Carabus solieri S. GARNIER,*† P. ALIBERT,† P. AUDIOT,* B. PRIEUR * and J.-Y. RASPLUS * *INRA, Centre de Biologie et de Gestion des Populations, Campus International de Baillarguet, CS 30016, 34988 Montferrier sur Lez, France, †UMR-CNRS 5561 Biogéosciences, Université de Bourgogne, 6 blvd Gabriel, 21000 Dijon, France Abstract Analysis of genetic isolation by distance (IBD) is of prime importance for the study of processes responsible for spatial population genetic structure and is thus frequently used in case studies. However, the identification of a significant IBD pattern does not necessarily imply the absence of sharp discontinuities in gene frequencies. Therefore, identifying barriers to gene flow and /or secondary contact between differentiated entities remains a major challenge in population biology. Geographical genetic structure of 41 populations (1080 individuals) of an alpine insect species, Carabus solieri, was studied using 10 micro- satellite loci. All populations were significantly differentiated and spatially structured according to IBD over the entire range. However, clustering analyses clearly identified three main clusters of populations, which correspond to geographical entities. Whereas IBD also occurs within each cluster, population structure was different according to which group of populations was considered. The southernmost cluster corresponds to the most fragmented part of the range. Consistently, it was characterized by relatively high levels of differentiation associated with low genetic diversity, and the slope of the regression of genetic differentiation against geographical distances was threefold those of the two other clusters. Comparisons of within-cluster and between-cluster IBD patterns revealed barriers to gene flow. A comparison of the two approaches, IBD and clustering analyses, provided us with valuable information with which to infer the phylogeography of the species, and in particular to propose postglacial colonization routes from two potential refugia located in Italy and in southeastern France. Our study highlights strongly the possible confounding contribution of barriers to gene flow to IBD pattern and emphasizes the utility of the model-based clustering analysis to identify such barriers. Keywords: barrier to gene flow, clustering analysis, colonization, ground beetle, isolation by dis- tance, microsatellites Received 4 December 2003; revision received 19 March 2004; accepted 19 March 2004 Introduction The evolutionary potential of a species depends mainly on population structure, which results from a balance of evolutionary forces producing either local differentiation or homogeneity (Slatkin 1987). The relative importance of each factor may change in space and time, and some events can leave imprints for a long period of time (Hewitt 2000). In such a context the distinction between historical and present processes is considered a key point in studies of population differentiation. For species with low dispersal ability, a higher genetic similarity is expected between neighbouring individuals or populations than between distant ones. This pattern of genetic structure is called isolation by distance (IBD, Wright 1943). At equilibrium, under dispersal and genetic drift, IBD pattern is revealed by a positive and significant correlation between genetic Correspondence and present address: S. Garnier. UMR-CNRS 5561 Biogéosciences, Université de Bourgogne, 6 blvd Gabriel, 21000 Dijon, France. Fax: + 33 (0) 3 80 39 62 31; E-mail: [email protected]
Transcript of Isolation by distance and sharp discontinuities in gene ...

Molecular Ecology (2004)
13
, 1883–1897 doi: 10.1111/j.1365-294X.2004.02212.x
© 2004 Blackwell Publishing Ltd
Blackwell Publishing, Ltd.
Isolation by distance and sharp discontinuities in gene frequencies: implications for the phylogeography of an alpine insect species,
Carabus solieri
S . GARNIER,
*†
P . ALIBERT,
†
P . AUDIOT,
*
B . PRIEUR
*
and J . -Y . RASPLUS
*
*
INRA, Centre de Biologie et de Gestion des Populations, Campus International de Baillarguet, CS 30016, 34988 Montferrier sur Lez, France,
†
UMR-CNRS 5561 Biogéosciences, Université de Bourgogne, 6 blvd Gabriel, 21000 Dijon, France
Abstract
Analysis of genetic isolation by distance (IBD) is of prime importance for the study ofprocesses responsible for spatial population genetic structure and is thus frequently usedin case studies. However, the identification of a significant IBD pattern does not necessarilyimply the absence of sharp discontinuities in gene frequencies. Therefore, identifyingbarriers to gene flow and/or secondary contact between differentiated entities remains amajor challenge in population biology. Geographical genetic structure of 41 populations(1080 individuals) of an alpine insect species,
Carabus solieri
, was studied using 10 micro-satellite loci. All populations were significantly differentiated and spatially structuredaccording to IBD over the entire range. However, clustering analyses clearly identifiedthree main clusters of populations, which correspond to geographical entities. WhereasIBD also occurs within each cluster, population structure was different according to whichgroup of populations was considered. The southernmost cluster corresponds to the mostfragmented part of the range. Consistently, it was characterized by relatively high levels ofdifferentiation associated with low genetic diversity, and the slope of the regression ofgenetic differentiation against geographical distances was threefold those of the two otherclusters. Comparisons of within-cluster and between-cluster IBD patterns revealed barriersto gene flow. A comparison of the two approaches, IBD and clustering analyses, providedus with valuable information with which to infer the phylogeography of the species, andin particular to propose postglacial colonization routes from two potential refugia locatedin Italy and in southeastern France. Our study highlights strongly the possible confoundingcontribution of barriers to gene flow to IBD pattern and emphasizes the utility of themodel-based clustering analysis to identify such barriers.
Keywords
: barrier to gene flow, clustering analysis, colonization, ground beetle, isolation by dis-tance, microsatellites
Received 4 December 2003; revision received 19 March 2004; accepted 19 March 2004
Introduction
The evolutionary potential of a species depends mainlyon population structure, which results from a balance ofevolutionary forces producing either local differentiationor homogeneity (Slatkin 1987). The relative importance of
each factor may change in space and time, and some eventscan leave imprints for a long period of time (Hewitt 2000).In such a context the distinction between historical andpresent processes is considered a key point in studies ofpopulation differentiation. For species with low dispersalability, a higher genetic similarity is expected betweenneighbouring individuals or populations than betweendistant ones. This pattern of genetic structure is calledisolation by distance (IBD, Wright 1943). At equilibrium,under dispersal and genetic drift, IBD pattern is revealedby a positive and significant correlation between genetic
Correspondence and present address: S. Garnier. UMR-CNRS5561 Biogéosciences, Université de Bourgogne, 6 blvd Gabriel,21000 Dijon, France. Fax: + 33 (0) 3 80 39 62 31; E-mail: [email protected]

1884
S . G A R N I E R
E T A L .
© 2004 Blackwell Publishing Ltd,
Molecular Ecology
, 13, 1883–1897
differentiation and geographical distances (Slatkin 1993;Rousset 1997). Identification of IBD can help to showequilibrium between migration and genetic drift (contemp-orary processes), or to link limited dispersal ability andgenetic differentiation. It can also allow the determinationof the neighbouring size, the estimation of demographicparameters or the comparison of the relative influencesof gene flow and drift on population structure amongdifferent regions (Slatkin 1993; Rousset 1997; Hutchison &Templeton 1999; Rousset 2000; Pogson
et al
. 2001). Althoughempirical studies provide numerous examples of IBDoccurrence in natural populations (Slatkin 1993; Peterson1996; Pogson
et al
. 2001 and references therein), there isgrowing evidence that many species have not yet reachedmigration-drift equilibrium and that observed patternsof genetic differentiation reflect population history ratherthan current levels of gene flow (e.g. Latta & Mitton 1999;Pogson
et al
. 2001; Turgeon & Bernatchez 2001). In suchnonequilibrium systems, the study of the relationshipbetween genetic and geographical distances can still beinformative revealing, for instance, recent range expansionor a quasi absence of gene flow (Slatkin 1993; Hutchison& Templeton 1999). Hence, analyses of IBD patterns are ofprime importance in identifying processes responsiblefor spatial population genetic structure and are thus usedwidely in case studies.
The occurrence and pattern of IBD depends on thespatial scale considered and can also change according toregion and time, due to spatial and/or temporal variationin relative influences of forces moulding populationstructure (Slatkin 1993; Rousset 1997; Castric & Bernatchez2003). Moreover, the assumptions of spatial and temporalstability in some models contrast with heterogeneity interms of demography, environmental conditions or historycharacterizing natural populations. As a consequence, asignificant IBD pattern does not necessarily mean a spa-tially homogeneous gene flow. Indeed, some authors havepointed out that signficiant IBD pattern could exist despitethe presence of barriers to gene flow (Bossart & Prowell1998; Lugon-Moulin & Hausser 2002). In such a context, itis of prime importance to be able to identify heterogeneityof gene flow due to such barriers. A model-based clusteringmethod (Pritchard
et al
. 2000) can help to approach thisproblem. This method was developed to infer populationstructure and to assign individuals to populations usingmultilocus genotype data. Unlike previous assignmentmethods, the genetic composition of source populationsis unknown (populations are not defined a priori). Wewill show that the combined analysis of IBD patterns andclustering analysis is a powerful approach to detect sharpdiscontinuities in gene frequencies due to physical barriersto gene flow and/or secondary contact.
In the present study we used 10 microsatellite loci todescribe the genetic population structure of
Carabus solieri
Dejean (Coleoptera, Carabidae), a ground beetle distrib-uted in the Southern Alps of France and Italy. This speciesexhibits high levels of diversity and differentiation forseveral characters including neutral genetic markers,morphology and colour (Bonadona 1973; Darnaud
et al
. 1978;Rasplus
et al
. 2001). As with many other ground beetlesspecies, this brachypterous insect has limited dispersalabilities and is therefore susceptible to exhibit an IBD pat-tern if it has reached migration-drift equilibrium. How-ever, it is suspected that current population structure stillcontains historical imprints and that the pattern of populationstructure is due partly to historical events, i.e. hybridizationafter a secondary contact between two differentiatedentities considered as subspecies (Rasplus
et al
. 2001). Inaddition, the habitat structure within its range appearsrather heterogeneous (due, in particular, to the mountainousrelief) and provides numerous potential barriers to geneflow. Hence, our objectives were (i) to test for migration-drift equilibrium by studying the IBD pattern, (ii) to detectand identify potential barriers to gene flow, (iii) to deter-mine the nature of such barriers (secondary contact vs.physical barriers) and (iv) to discuss plausible phylogeo-graphical scenarios and in particular to infer recolonizationroutes and the origin of the different entities recognizedin
C. solieri
.
Materials and methods
Species studied and sampling scheme
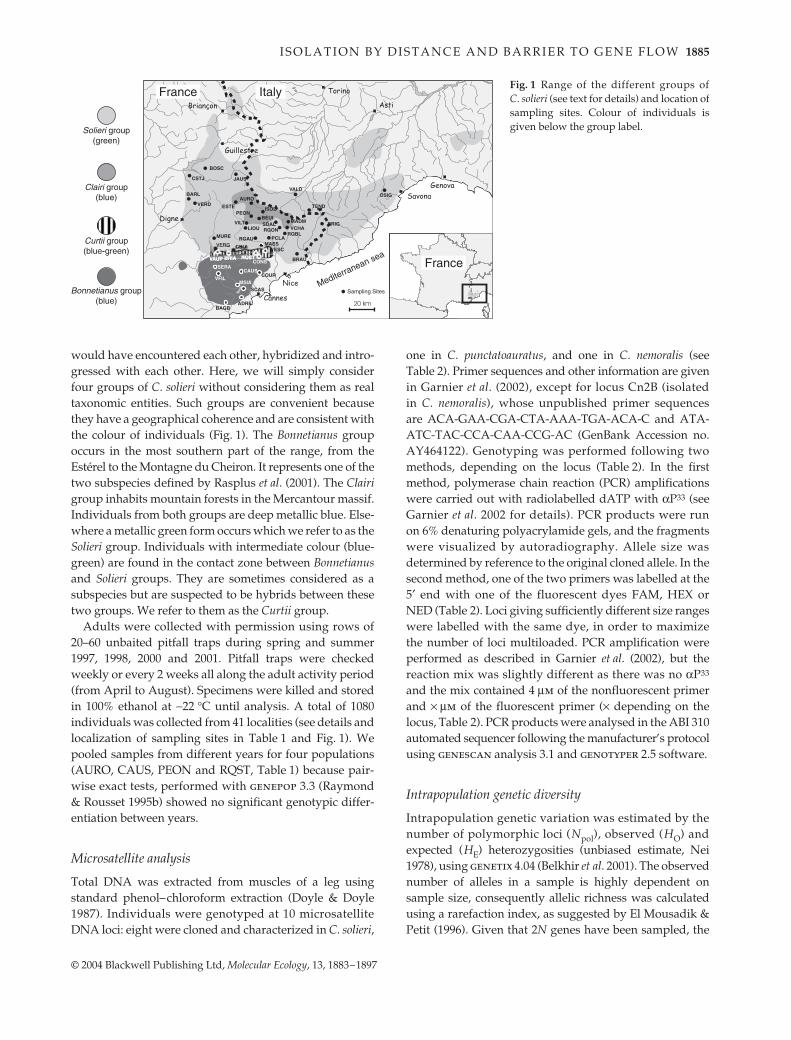
C. solieri
occurs in a relatively restricted area in the south-ern and Ligurian Alps (Fig. 1). This species is associatedmainly with humid forests, either deciduous or coniferous,but the species also occurs in dry Mediterranean forest andalpine grasslands. It is a spring breeder, laying eggs inspring and summer, depending on environmental condi-tions. Larval development occurs in summer and teneralsemerge in late summer or autumn, and overwinter in thesoil. Mating will occur during the following spring. Thisground beetle is endangered mainly by habitat destructionand fragmentation, especially in highly man-modifiedhabitats in Estérel (southern France), and to a lesser extentby exhaustive collection by entomologists in specific areas.Consequently,
C. solieri
is protected in France.Despite its limited range,
C. solieri
exhibits importantvariation in colour, morphology and genes (see Rasplus
et al
. 2001). As a result, intraspecific classification of
C.solieri
is unclear. Depending on authors, three to six sub-species are recognized, but some authors describe more.Rasplus
et al
. (2001) have proposed that
C. solieri
could besubdivided into two distinctive entities considered assubspecies, which differentiated during last glaciationswithin two different refugia, one in the south of France andone in Italy. After postglacial recolonization, these entities
I S O L A T I O N B Y D I S T A N C E A N D B A R R I E R T O G E N E F L O W
1885
© 2004 Blackwell Publishing Ltd,
Molecular Ecology
, 13, 1883–1897
would have encountered each other, hybridized and intro-gressed with each other. Here, we will simply considerfour groups of
C. solieri
without considering them as realtaxonomic entities. Such groups are convenient becausethey have a geographical coherence and are consistent withthe colour of individuals (Fig. 1). The
Bonnetianus
groupoccurs in the most southern part of the range, from theEstérel to the Montagne du Cheiron. It represents one of thetwo subspecies defined by Rasplus
et al
. (2001). The
Clairi
group inhabits mountain forests in the Mercantour massif.Individuals from both groups are deep metallic blue. Else-where a metallic green form occurs which we refer to as the
Solieri
group. Individuals with intermediate colour (blue-green) are found in the contact zone between
Bonnetianus
and
Solieri
groups. They are sometimes considered as asubspecies but are suspected to be hybrids between thesetwo groups. We refer to them as the
Curtii
group.Adults were collected with permission using rows of
20–60 unbaited pitfall traps during spring and summer1997, 1998, 2000 and 2001. Pitfall traps were checkedweekly or every 2 weeks all along the adult activity period(from April to August). Specimens were killed and storedin 100% ethanol at
−
22
°
C until analysis. A total of 1080individuals was collected from 41 localities (see details andlocalization of sampling sites in Table 1 and Fig. 1). Wepooled samples from different years for four populations(AURO, CAUS, PEON and RQST, Table 1) because pair-wise exact tests, performed with
genepop
3.3 (Raymond& Rousset 1995b) showed no significant genotypic differ-entiation between years.
Microsatellite analysis
Total DNA was extracted from muscles of a leg usingstandard phenol–chloroform extraction (Doyle & Doyle1987). Individuals were genotyped at 10 microsatelliteDNA loci: eight were cloned and characterized in
C. solieri
,
one in
C. punctatoauratus
, and one in
C. nemoralis
(seeTable 2). Primer sequences and other information are givenin Garnier
et al
. (2002), except for locus Cn2B (isolatedin
C. nemoralis
), whose unpublished primer sequencesare ACA-GAA-CGA-CTA-AAA-TGA-ACA-C and ATA-ATC-TAC-CCA-CAA-CCG-AC (GenBank Accession no.AY464122). Genotyping was performed following twomethods, depending on the locus (Table 2). In the firstmethod, polymerase chain reaction (PCR) amplificationswere carried out with radiolabelled dATP with
α
P
33
(seeGarnier
et al
. 2002 for details). PCR products were runon 6% denaturing polyacrylamide gels, and the fragmentswere visualized by autoradiography. Allele size wasdetermined by reference to the original cloned allele. In thesecond method, one of the two primers was labelled at the5
′
end with one of the fluorescent dyes FAM, HEX orNED (Table 2). Loci giving sufficiently different size rangeswere labelled with the same dye, in order to maximizethe number of loci multiloaded. PCR amplification wereperformed as described in Garnier
et al
. (2002), but thereaction mix was slightly different as there was no
α
P
33
and the mix contained 4
µ
m
of the nonfluorescent primerand
×
µ
m
of the fluorescent primer (
×
depending on thelocus, Table 2). PCR products were analysed in the ABI 310automated sequencer following the manufacturer’s protocolusing
genescan
analysis 3.1 and
genotyper
2.5 software.
Intrapopulation genetic diversity
Intrapopulation genetic variation was estimated by thenumber of polymorphic loci (
N
pol
), observed (
H
O
) andexpected (
H
E
) heterozygosities (unbiased estimate, Nei1978), using
genetix
4.04 (Belkhir
et al
. 2001). The observednumber of alleles in a sample is highly dependent onsample size, consequently allelic richness was calculatedusing a rarefaction index, as suggested by El Mousadik &Petit (1996). Given that 2
N
genes have been sampled, the
Fig. 1 Range of the different groups ofC. solieri (see text for details) and location ofsampling sites. Colour of individuals isgiven below the group label.

1886
S . G A R N I E R
E T A L .
© 2004 Blackwell Publishing Ltd,
Molecular Ecology
, 13, 1883–1897
expected number of alleles in a subsample of 2
n
genes(
n
≤
N
) was estimated using
fstat
2.9.3 (Goudet 1995) [
n
isfixed as the smallest number of individuals genotypedfor a locus in a sample, i.e.
n
= 11 (ESTE sample)]. Differentstatistics were computed because the behaviour of thesestatistics can vary according to population history (Cornuet &Luikart 1996). Intrapopulation genetic diversity was assessedbecause it can reflect past range expansion (Le Corre &Kremer 1998; Hewitt 2000) or current habitat fragmentation.
Linkage disequilibrium between all pairs of loci anddeparture from Hardy–Weinberg equilibrium for eachlocus were tested within each population using exact tests.A global test for Hardy–Weinberg equilibrium across all
loci was constructed using Fisher’s method (Sokal & Rohlf1995), providing that statistical independence of lociwas established previously. Calculations were performedusing
genepop
3.3 (Raymond & Rousset 1995b). Deviationsfrom Hardy–Weinberg proportions were quantified by theunbiased estimator of Wright’s inbreeding coefficient
F
IS
calculated according to Weir & Cockerham (1984).
Population differentiation and IBD
In order to assess the among-population variability, wefirst considered each sampling site as a distinct popula-tion. Differentiation for both all populations and all
LocalityYear of sampling N Npol A HO HE
Les Adrets de l’Estérel ADRE 1997 20 7 3.0 0.43 0.41Auron AURO 1998, 2001 20 9 4.0 0.46 0.46Bagnols en Forêt BAGB 2000 24 5 1.5 0.15 0.14Barles BARL 2001 25 8 2.9 0.37 0.35Beuil BEUI 1998 27 9 4.5 0.52 0.53Boscodon BOSC 2001 29 8 2.6 0.28 0.30Col de Braus BRAU 1998 24 10 3.5 0.47 0.50Briançonnet BRIA 2000 30 8 2.9 0.45 0.42La Brigue BRIG 1998 21 10 5.3 0.60 0.67Caussols CAUS 1998, 2000 27 9 2.8 0.48 0.49Col du Buis CBUI 2000 30 8 3.3 0.43 0.45Conségudes CONS 2000 30 10 4.6 0.58 0.56Courmette COUR 1998 20 8 2.5 0.34 0.34Col Saint-Jean CSTJ 2001 15 8 2.8 0.30 0.31Esteng ESTE 1998 11 8 4.6 0.45 0.50Isola ISOL 1998 21 10 4.5 0.55 0.56Jausiers JAUS 2001 25 5 1.7 0.23 0.21Le Liouc LIOU 2001 41 8 3.1 0.38 0.37La Madone de Fenestre MADM 1998 22 10 4.2 0.50 0.51Malaussène MAES 2000 26 10 4.0 0.48 0.49Montauroux MSIA 2001 31 5 2.2 0.25 0.26Mure MURE 1998 18 6 3.1 0.33 0.34Osiglia OSIG 1997 44 10 5.2 0.58 0.64Pont de Clans PCLA 2000 36 8 3.4 0.42 0.44Péone PEON 1998, 2000 33 9 4.8 0.53 0.54Rigaud RGAU 1998 21 8 3.3 0.40 0.41Rigons RGON 2000 30 10 4.9 0.60 0.60Roquebillière RQBL 2000 30 9 3.9 0.54 0.57Roquestéron RQST 1997, 1998, 2000 26 10 3.7 0.47 0.47Saint-Cassien SCAS 1997 28 7 2.4 0.32 0.34Saint-Dalmas SDAL 2000 17 9 4.7 0.56 0.57Séranon SERA 2000 30 9 3.9 0.48 0.47Tende TEND 1998 25 10 5.1 0.58 0.63Valdieri VALD 1998 25 9 2.3 0.36 0.32Vauplane VAUP 1998 24 9 3.7 0.50 0.48Vallon des Châtaigniers VCHA 2000 30 10 3.8 0.43 0.45Verdaches VERD 2001 35 7 2.9 0.33 0.34Vergons VERG 1998 20 9 4.1 0.52 0.52Vescous VESC 2000 30 8 2.7 0.35 0.37Vallon du Fil VFIL 2000 30 9 2.9 0.32 0.35Villetalle VILT 2000 29 9 4.1 0.49 0.52
Table 1 Sampling sites and genetic poly-morphism of the 41 populations studied. N,sample size; Npol, number of polymorphicloci; A, allelic richness (estimated for asample of 11 individuals); HO, observedheterozygosity; HE, gene diversity; A, HO,HE are averaged over 10 loci
I S O L A T I O N B Y D I S T A N C E A N D B A R R I E R T O G E N E F L O W
1887
© 2004 Blackwell Publishing Ltd,
Molecular Ecology
, 13, 1883–1897
population pairs was tested using a log-likelihood (G)-based exact test (Goudet
et al
. 1996). These tests wereperformed for each locus and then combined in a globaltest with Fisher’s method (Manly 1985). In addition, bothglobal and pairwise estimates of
F
ST
were computedfollowing Weir & Cockerham (1984) to quantify levelsof differentiation.
Finally, IBD over the distribution area was assessed bytesting the correlation between genetic and geographicaldistance considering all population pairs in using theregression of
F
ST
/(1–
F
ST
) estimates on logarithm of dis-tance for populations, as suggested by Rousset (1997). Thismodel was tested using Mantel’s tests. For geographicaldistances, we considered straight-line distances betweenall pairs of sampling sites. IBD was also tested in eachcluster of populations identified according to the results ofthe clustering analysis (see Results section) with the sameprocedure. All these tests and calculations were performedwith
genepop
3.3 (Raymond & Rousset 1995b).
Genetic model-based clustering
We used the model-based clustering method describedby Pritchard
et al
. (2000) to infer population structure andassign individuals to populations using multilocus geno-type data, as implemented in the program
structure
. Themodel assumes K populations (or clusters; K may beunknown, as in the present case) modelled each by itsown set of allele frequencies at each locus. The geneticcomposition of these populations and the assignationof individuals are both unknown. Assuming Hardy–Weinberg equilibrium and complete linkage equilibriumbetween loci within populations, population allele frequen-
cies and assignation of individuals to populations wereinferred simultaneously using a Bayesian approach.
Generally, the number of clusters (
K
) in the data isinferred from the posterior probability distribution Pr(
K
|
X
)calculated from the posterior probability of the data Pr(
X
|
K
)(
X
being the genotypes of the sampled individuals).Choosing
K
that maximizes the posterior probability ofthe data (PPD) can be difficult to apply for complex datasets including many groups (Rosenberg
et al
. 2002). In thiscase of highly structured data, as
K
is increased the mostdivergent groups separate into distinct clusters first, insome cases analogously to the hierarchical branching oftree diagrams (Pritchard
et al
. 2000; Rosenberg
et al
. 2002).As we should aim for the smallest value of
K
that capturesthe major structure in the data, a second way to choose
K
is to consider the successive increase of the PPD forincreasing values of
K
, which can be regarded as the gainof information at each addition of a set of allele frequencies.However, it should be emphasized that the PPD is not anaccurate estimate and should be regarded as a heuristicguide to which models are most consistent with the data(see Pritchard
et al
. 2000). In the simple case of individualssampled from two differentiated locations, the more differ-entiated these two populations, the more important wouldbe the increase of PPD between
K
= 1 and
K = 2. Supposenow a set of differentiated populations exhibiting anIBD pattern. As runs are performed with increasing K, thestudy area would be partitioned into smaller and smallersubareas, until each sampling location, and populationswould be clustered according to their geographical prox-imities. Differences in allelic frequencies between clusterswould be less important as K is incremented. Thus, wewould expect the PPD increase from K = 1 to K to be equal
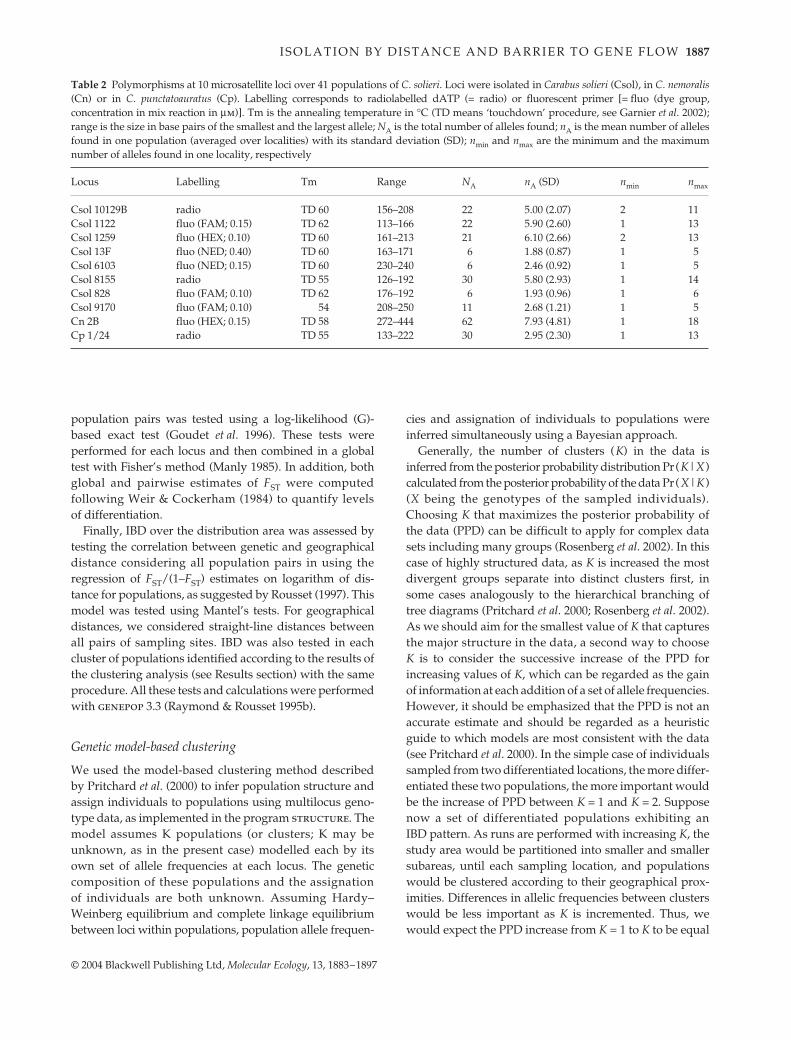
Table 2 Polymorphisms at 10 microsatellite loci over 41 populations of C. solieri. Loci were isolated in Carabus solieri (Csol), in C. nemoralis(Cn) or in C. punctatoauratus (Cp). Labelling corresponds to radiolabelled dATP (= radio) or fluorescent primer [= fluo (dye group,concentration in mix reaction in µm)]. Tm is the annealing temperature in °C (TD means ‘touchdown’ procedure, see Garnier et al. 2002);range is the size in base pairs of the smallest and the largest allele; NA is the total number of alleles found; nA is the mean number of allelesfound in one population (averaged over localities) with its standard deviation (SD); nmin and nmax are the minimum and the maximumnumber of alleles found in one locality, respectively
Locus Labelling Tm Range NA nA (SD) nmin nmax
Csol 10129B radio TD 60 156–208 22 5.00 (2.07) 2 11Csol 1122 fluo (FAM; 0.15) TD 62 113–166 22 5.90 (2.60) 1 13Csol 1259 fluo (HEX; 0.10) TD 60 161–213 21 6.10 (2.66) 2 13Csol 13F fluo (NED; 0.40) TD 60 163–171 6 1.88 (0.87) 1 5Csol 6103 fluo (NED; 0.15) TD 60 230–240 6 2.46 (0.92) 1 5Csol 8155 radio TD 55 126–192 30 5.80 (2.93) 1 14Csol 828 fluo (FAM; 0.10) TD 62 176–192 6 1.93 (0.96) 1 6Csol 9170 fluo (FAM; 0.10) 54 208–250 11 2.68 (1.21) 1 5Cn 2B fluo (HEX; 0.15) TD 58 272–444 62 7.93 (4.81) 1 18Cp 1/24 radio TD 55 133–222 30 2.95 (2.30) 1 13

1888 S . G A R N I E R E T A L .
© 2004 Blackwell Publishing Ltd, Molecular Ecology, 13, 1883–1897
to the number of sampling sites but to a lesser and lesserextent. In other words, the information brought by eachsuccessive additional set of allele frequencies wouldgradually decrease. By adopting this approach, it is thentheoretically possible to identify clusters of populationsseparated by barriers to gene flow (or vicariant events),as strong allele frequency changes are usually evident oneither side of these barriers. In such a context, the gainof PPD would be high until the value of K is equal to thenumber N of such clusters; then, this gain would drop fora value of K = N + 1 and eventually gradually decrease forgreater values of K if IBD is occurring in some clusters. Wethen paid attention both to values of the PPD for eachrun and to the importance of the increase of the PPD forsuccessive values of K.
Independent runs of the program were carried out forthe total data set for values of K comprised between oneand 40 (almost the number of sampling sites). As threemain clusters were identified (see Results section), struc-ture runs were then performed within each cluster. Allruns were based on 100 000 iterations after a burn-in periodof 20 000 iterations. A minimum of five independent runswere conducted for each situation (number of cluster— data set combination) in order to assess the consistencyof the results across runs, using admixture model anduncorrelated allele frequencies model without incorporat-ing population information (see Pritchard et al. 2000 fordetails). We used the program distruct (Rosenberg 2002)to display individuals’ membership coefficients for eachcluster. Finally, we also performed an analysis of molecu-lar variance (amova, Excoffier et al. 1992) as implementedin arlequin 2.0 (Schneider et al. 2000) to quantify thedifferent genetic variance components (among groups,among populations within groups, within populations).
Results
Intrapopulation genetic diversity
Data relative to polymorphism of each locus are presentedin Table 2. Considering all the loci, a total number of 216alleles were found. The amount of polymorphism variedgreatly among loci, ranging from six to 62 alleles (Table 2).The mean number of alleles per locus found in one localityvaried from 1.88 to 7.93. Some loci presented high intra-population polymorphisms, e.g. 18 alleles found in thelocality OSIG (44 individuals) for the locus Cn 2B (Table 2).
Thirty of 41 localities had a fixed allele for at least onelocus, some of which BAGB, JAUS and MSIA showed fixedalleles for five of the 10 loci (Table 1). Allelic richnessaveraged over loci ranged from 1.5 to 5.3 (Table 1). Genediversity also varied among localities, ranging from 0.14for BAGB to 0.67 for BRIG (Table 1). Both allelic richnessand gene diversity exhibited the same clear spatial pattern,
i.e. an increase from south to northeast and from northwestto east (Fig. 2).
Out of the 1335 exact tests performed (population–locipair combinations) for genotypic disequilibrium, only 57(4.27%) were significant at the 0.05 level. This was less thanthe 5% expected to be significant by chance alone. Moreover,a single test remained significant after Bonferroni correc-tion. There was therefore no evidence of linkage betweenloci, which were then considered statistically independent.
Hardy–Weinberg equilibrium was tested for each locusin all populations. A total of 335 exact tests was performedand 23 (6.9%) were significant at the 0.05 level, which isslightly over the proportion expected by chance alone.These significant tests concerned eight of the 10 loci and 16of the 41 localities (results not shown). Four tests remainedsignificant after Bonferroni correction: loci Csol1259 forBRIG, Csol13F and Cn2B for OSIG, and Csol13F for RQBL.Global test was significant for nine populations (twoheterozygote excess and seven heterozygote deficiency) atthe 0.05 level and only two remained significant (BRIG andOSIG) after Bonferroni correction. Amplification of locus
Fig. 2 Geographical distribution of (a) mean allelic richnessestimated for a standardized sample size of 11 individuals [A] and(b) gene diversity [HE]. Limits of the four groups of C. solieri areenclosed by grey lines.

I S O L A T I O N B Y D I S T A N C E A N D B A R R I E R T O G E N E F L O W 1889
© 2004 Blackwell Publishing Ltd, Molecular Ecology, 13, 1883–1897
Csol13F could not be obtained for five individuals fromthe OSIG population. Microsatellite isolation used an indi-vidual from SCAS population, one of the furthest popula-tions from OSIG and belonging to a different subspecies(Rasplus et al. 2001). Therefore, we cannot exclude thepresence of null alleles, e.g. due to mutation in the flankingregion as a cause of the heterozygote deficiency observed.However, as there was no tendency for a particular locus topresent systematically a heterozygote excess or deficiency,all loci were included in the following analyses.
Population differentiation and IBD
Genetic differentiation across all populations was highlysignificant for each locus and over all loci (P < 0.0001).Values of FST ranged from 0.256 for locus Csol1259 to 0.550for locus Csol6103, and FST was 0.335 over all loci.
Of 8200 exact tests for single-locus genotypic differe-ntiation between population pairs, 7090 (86.5%) were signi-ficant at the 0.05 level. The proportion of significant testsvaried from 61.34% for locus Csol 13F to 98.90% for locusCsol 1122, which is much more than expected under thenull hypothesis of identical genotypic distribution acrosspopulations. All pairwise tests (820 population pairs) overall loci were highly significant, even after Bonferronicorrection. Multilocus FST ranged from 0.022 (SDAL vs.RGON) to 0.789 (BAGB vs. JAUS). The overall level ofdifferentiation is high as nearly 50% of the pairwise multi-locus FST were over 0.3 and 11% were greater than 0.5,whereas only 5% were lower than 0.1. As seen previously,this level of differentiation was not due to one or twoparticular loci. Finally, genetic differentiation betweenpopulation pairs increased significantly with geographicaldistance (r = 0.41, P < 10−5; Fig. 3).
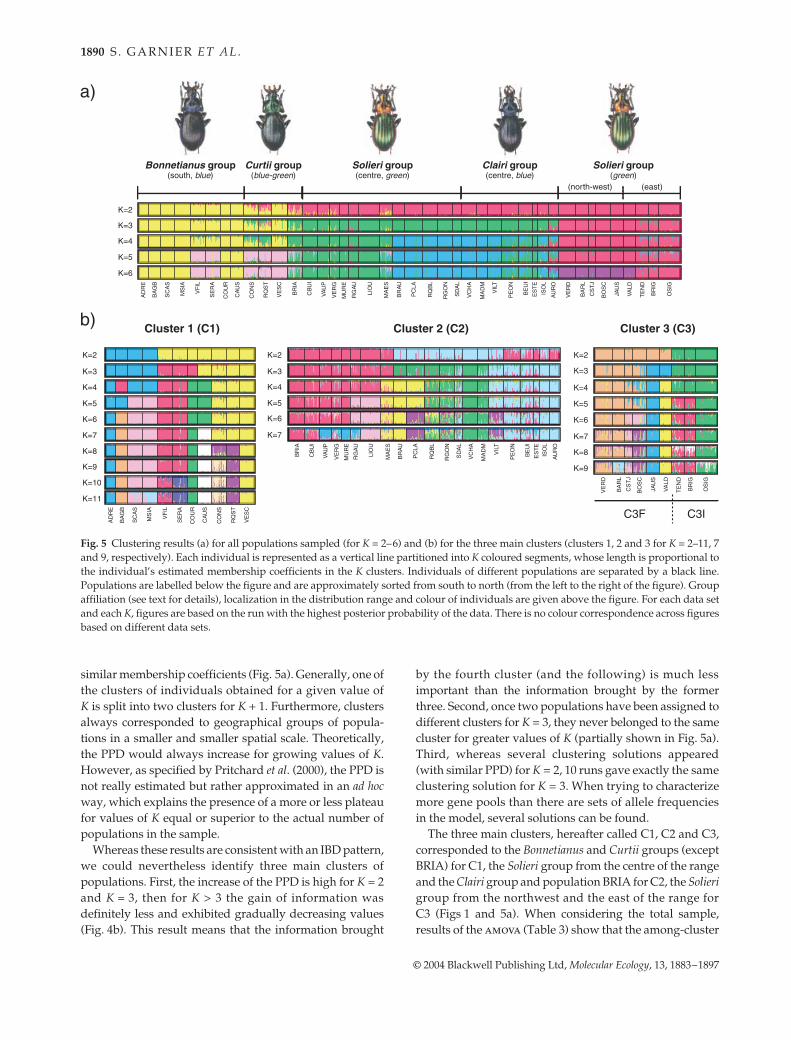
Genetic model-based clustering
Genetic structure over the whole distribution range. When con-sidering all individuals, the PPD increased from K = 1 toK = 30, where it reached its maximum value and exhibiteda plateau (Fig. 4a). This result indicates that differentiationoccurs between most of the sampling sites. Concurrently,almost all individuals from the same population had
Fig. 3 Isolation by distance pattern in the distribution area.Regression of genetic differentiation [estimated by FST/(1 − FST)]against logarithm of geographical distances (km) for all pairs ofsampled populations.
Fig. 4 Posterior probability of the data (PPD) against the maximumnumber of clusters (K) considered (a) and increase of PPD given K(b and c). For K clusters, this increase is calculated as (Ln PPDK –Ln PPDK−1). (a and b) Analysis for all data. (c) Analysis for thethree main clusters (clusters 1, 2 and 3).
1890 S . G A R N I E R E T A L .
© 2004 Blackwell Publishing Ltd, Molecular Ecology, 13, 1883–1897
similar membership coefficients (Fig. 5a). Generally, one ofthe clusters of individuals obtained for a given value ofK is split into two clusters for K + 1. Furthermore, clustersalways corresponded to geographical groups of popula-tions in a smaller and smaller spatial scale. Theoretically,the PPD would always increase for growing values of K.However, as specified by Pritchard et al. (2000), the PPD isnot really estimated but rather approximated in an ad hocway, which explains the presence of a more or less plateaufor values of K equal or superior to the actual number ofpopulations in the sample.
Whereas these results are consistent with an IBD pattern,we could nevertheless identify three main clusters ofpopulations. First, the increase of the PPD is high for K = 2and K = 3, then for K > 3 the gain of information wasdefinitely less and exhibited gradually decreasing values(Fig. 4b). This result means that the information brought
by the fourth cluster (and the following) is much lessimportant than the information brought by the formerthree. Second, once two populations have been assigned todifferent clusters for K = 3, they never belonged to the samecluster for greater values of K (partially shown in Fig. 5a).Third, whereas several clustering solutions appeared(with similar PPD) for K = 2, 10 runs gave exactly the sameclustering solution for K = 3. When trying to characterizemore gene pools than there are sets of allele frequenciesin the model, several solutions can be found.
The three main clusters, hereafter called C1, C2 and C3,corresponded to the Bonnetianus and Curtii groups (exceptBRIA) for C1, the Solieri group from the centre of the rangeand the Clairi group and population BRIA for C2, the Solierigroup from the northwest and the east of the range forC3 (Figs 1 and 5a). When considering the total sample,results of the amova (Table 3) show that the among-cluster
Fig. 5 Clustering results (a) for all populations sampled (for K = 2–6) and (b) for the three main clusters (clusters 1, 2 and 3 for K = 2–11, 7and 9, respectively). Each individual is represented as a vertical line partitioned into K coloured segments, whose length is proportional tothe individual’s estimated membership coefficients in the K clusters. Individuals of different populations are separated by a black line.Populations are labelled below the figure and are approximately sorted from south to north (from the left to the right of the figure). Groupaffiliation (see text for details), localization in the distribution range and colour of individuals are given above the figure. For each data setand each K, figures are based on the run with the highest posterior probability of the data. There is no colour correspondence across figuresbased on different data sets.

I S O L A T I O N B Y D I S T A N C E A N D B A R R I E R T O G E N E F L O W 1891
© 2004 Blackwell Publishing Ltd, Molecular Ecology, 13, 1883–1897
variance component (19.5%) is nearly equal to the among-population within-cluster component (18.7%). Thus, thewithin-population variance component accounted foraround 60% of the genetic diversity of C. solieri.
Genetic structure at regional scale. The clustering analysiswas conducted independently for each of the three mainclusters. Individuals from RQST and CONS (Curtii group)had partial membership in two or three clusters (Fig. 5a).Two reasons enabled us to include these populations inC1: (i) individuals were assigned mainly to C1 (averagemembership coefficients to C1, C2 and C3 were 0.55, 0.26and 0.19 for RQST and 0.68, 0.29 and 0.03 for CONS);and (ii) for K > 4, individuals were assigned with otherpopulations of C1. Similarly, AURO was included in C2.
For each cluster, we found similar patterns: (i) the PPDincreased with increasing value of K; (ii) similar member-ship coefficients were observed for individuals sampledin the same locality; and (iii) nearby populations werealways clustered. However, several elements show thatpopulation structure is different according to the clusterconsidered. Individuals from C1 were more stronglyassigned to populations than individuals from C2 and C3clusters (Fig. 5b). Furthermore, the among-populationvariance component accounted for a third of the geneticdiversity of C1, while it accounted for only a fifth for C2and C3 (Table 3). Finally, the increase of PPD in C3 wasimportant between K = 1 and 2, but sharply diminishedfrom K = 3 (Fig. 4c). Populations assigned to differentclusters for K = 2 never clustered together for greatervalues of K. As a result, C3 could be subdivided into twosubgroups: C3F (for France) and C3I (for Italy) (Fig. 5b).On the other hand, such subdivision was not feasible inC1 and C2.
Within- and between-cluster IBD patterns. The relationshipbetween genetic differentiation and geographical distancewas assessed in each cluster independently, and betweenadjacent clusters. Within each cluster, genetic differentiation
was correlated positively and significantly to geographicaldistance (P = 0.035, P < 0.001 and P = 0.011 for C1, C2 andC3, respectively). However, the slope of the regression wasthree times higher in C1 than in both C2 and C3 (Fig. 6). Weplotted population pairs belonging to different clusters onthe same figures. In the case of C1 and C2, for the same geo-graphical distances, between-cluster differentiation (C1C2)was higher than within-C2 differentiation (C2C2) but wasequivalent or slightly lower than within-C1 differentiation(C1C1, Fig. 6a). This indicates that the strong allele frequen-cies changes between C1 and C2 separated a homogeneouscluster (C2, among-population variance component = 18.0%,Table 3) and a heterogeneous cluster (C1, among-populationvariance component = 34.7%, Table 3). C1 seems more proneto genetic drift compared to gene flow than C2.
In order to assess the spatial variation of the relativeinfluence of drift and gene flow in the contact zonebetween C1 and C2, we defined six ‘latitudinal groups ofpopulations’ (LG, Fig. 7). We assessed trends of the regres-sion slopes from IBD analysis within each of these groups(Fig. 6c). Slopes of the regressions were gentle for LG atthe north of the Curtii group (LG4, LG5, LG6). The slopewas steep for LG3, and even steeper when consideringsouthern groups (LG1 and LG2), both belonging to theBonnetianus group.
In the case of clusters 2 and 3, we distinguished pairsimplicating populations from C3F and C3I subgroups in theintercluster population pairs because they clearly exhibit adifferent pattern. When considering C3I and C2, between-cluster differentiation (C2C3I) is the same as within-clusterdifferentiation (C2C2 and C3C3, Fig. 6b) for comparablegeographical distances. Slopes of the regressions are alsosimilar. On the other hand, when considering C3F, slopes ofregressions are similar but between-cluster differentiation(C2C3F) is much higher than within-cluster differentiation(C2C2 and C3C3, Fig. 6b) for similar geographical distances,thus clearly indicating the presence of a barrier to geneflow between C2 and C3F. Neither comparison of regres-sion slope in IBD analysis in the two subgroups C3F and
Data setNo. of populations
Variance components
Among clusters
Among populations within cluster
Within populations
All populations 41 19.5 18.7 61.8C1 + C2 32 16.5 19.9 63.6C1 + C3 20 26.1 21.3 52.6C2 + C3 30 19.0 15.3 65.7C1 11 34.7 65.3C2 21 18.0 82.0C3 9 20.8 79.2
Table 3 Results of the analysis of molecularvariance (amova). C1, C2 and C3 are thethree main clusters defined according to theclustering analysis

1892 S . G A R N I E R E T A L .
© 2004 Blackwell Publishing Ltd, Molecular Ecology, 13, 1883–1897
C3I nor comparison of intra- and intersubgroup regres-sions were performed because C3I subgroup is constitutedof only three populations and intra- and intersubgroupspatial scales were different.
Discussion
Population differentiation and IBD
An important first result of our study is that there issignificant genetic differentiation among C. solieri popu-lations and that these populations are geographicallystructured according to an IBD pattern. All populationspairs were significantly differentiated, even at a geographicaldistance as small as 3 km (e.g. between RGON and SDAL).As a whole, levels of differentiation were high, as 40%of the genetic variance was due to differences amongpopulations (Table 3), and pairwise values of FST reached amaximum value of 0.789 (between BAGB and JAUS).Previous studies on ground beetles have reported popu-lation differentiation at local scale (less than 15 km) even inrelatively homogeneous areas (Assmann & Weber 1997;Brouat et al. 2003; Keller & Largiadèr 2003) and identifiedroads and nonforest areas as effective barriers to gene flow.Here, however, differentiation levels are much higher. Forinstance, for similar geographical distances (less than 15 km),pairwise FST range from 0.07 to 0.28 for C. solieri, whereasthey range from 0.01 to 0.06 for Carabus punctatoauratus,another forest brachypterous ground beetle (Brouat et al.
Fig. 7 Definition of six latitudinal groups of populations calledLG1 to LG6 from the south to the north. BRAU population wasincluded in any group because of its outlying position.
Fig. 6 Relationship between genetic differentiation [estimated byFST/(1-FST)] and logarithms of geographical distances (km) inparts of the distribution area. Scatterplots and regression for (a)clusters 1 and 2: within-cluster 1 population pairs (G1G1), within-cluster 2 population pairs (G2G2) and between-cluster populationpairs (G1G2); (b) clusters 2 and 3: within-cluster 2 population pairs(G2G2), within-cluster 3 population pairs (G3G3), and between-cluster 2 and subclusters 3F (G2G3F) and 3I (G2G3I), respectively.(c) Latitudinal groups of populations (LG): populations werepooled according to their latitude, from the south (LG1, within-LG1 population pairs) to the north (LG6, within-LG6 populationpairs) (see Fig. 7 for the definition of these groups).

I S O L A T I O N B Y D I S T A N C E A N D B A R R I E R T O G E N E F L O W 1893
© 2004 Blackwell Publishing Ltd, Molecular Ecology, 13, 1883–1897
2003). However, this result is not surprising because thehabitat of C. solieri is heterogeneous and potential barriersto gene flow are numerous (e.g. relief, nonforest areas, roads,rivers).
IBD in the whole range of this beetle was revealedthrough a significant positive and monotonic relationshipbetween genetic differentiation and geographical distance(Fig. 3). Similar conclusions can be drawn from the cluster-ing analysis. A decline of gene flow among populationsin relation to geographical distance has been shown fornumerous insect species (Peterson 1996 and referencestherein), although not always at all geographical scales.For instance, Peterson (1995) reported the absence of cor-relation between gene flow and geographical distances inthe butterfly Euphilotes enoptes over distances up to 30 km,and in contrast a significant IBD over a larger spatial scale(Peterson 1996). No data related to dispersal exist for C.
solieri. However, this species is brachypterous and hasclearly limited dispersal abilities, as with many other largeground beetles. Data published for other Carabus speciesrange from less than 1 m to several tens of metres in 24 hand a few hundred metres in longer time-spans (den Boer1970; Thiele 1977; Niehues et al. 1996). Because of thislimited dispersal power and the heterogeneity of itshabitat, C. solieri probably approaches a stepping-stonemodel of regional population structure.
Genetic model-based clustering and hierarchical population structure
A second important result is that although being consist-ent with an IBD pattern, clustering analysis clearly identifiedthree main clusters of populations isolated by barriers togene flow and exhibiting different patterns of differentiation.
Fig. 8 Hypothetical postglacial colonization routes of C. solieri. Black arrows indicate the two colonization routes from the Italian refugeand the northward expansion from the French refuge (the possible colonization of the Mercantour from this latter refuge is shown by thedashed arrow). Symbols of sampling sites indicate the cluster to which they were assigned (see text for details).

1894 S . G A R N I E R E T A L .
© 2004 Blackwell Publishing Ltd, Molecular Ecology, 13, 1883–1897
Within-clusters population structure. A significant IBD pat-tern was revealed within each of the three clusters (C1,C2 and C3). However, population structure is differentaccording to the cluster considered. First, populationsubdivision is stronger in C1 than in C2 and C3, as shownby a greater among-population variance component, astronger assignment of individuals from C1 in clusteringanalysis and a steeper slope of the regression from the IBDanalysis in C1. Moreover, intrapopulation genetic diversityis low in C1 relatively to C2 and C3 to the exception of thenorthwestern populations. Hedrick (1999) pointed out thatlevels of within-group variation could heavily influencemeasures of differentiation between groups for highlyvariable loci such as microsatellites, the maximum valueof FST being at maximum less than the average within-population homozygosity. It could thus be argued thatthe difference of levels of differentiation observed betweenC1 and C2 would be due only to their difference of poly-morphism (higher for C2, Table 1 and Fig. 2). However,levels of differentiation similar to those found in C2 wereobserved in samples originating from the northwest of therange and were associated with low levels of polymorphism(as those observed in C1). The high level of differentiationand the low genetic diversity in the southern part of thedistribution of C. solieri are thus certainly related to thestrong habitat fragmentation, which probably reduces bothfavourable habitat size and gene flow between habitats.
Among-cluster population structure. When considering C1plus C2, we found between-cluster levels of differentiationhigher than within C2 alone and about the same orderas within C1 (Fig. 6a). Gene flow seemed to be moreimportant in the north of the Curtii group range — whichcorresponds to the limit between C1 and C2 — anddecreases strongly towards the south (Fig. 6c). This patterncould be due partly to the relief in this region. The Curtiigroup is located in the valley of the Estéron river (seeFig. 8), lined in the north by a crest, orientated east–west,and ranging from 1100 to 1550 m above sea level. Thismountain range exhibits dry and open habitats unfavour-able to C. solieri on its south slope and is also the southernlimit of the Var river valley, another potential barrier todispersal for the beetle. In the south of the Estéron valleya succession of mountain ranges, with an east–westorientation and a maximal elevation of 1777 m, probablyrestrict north–south gene flow. These ranges are coveredby forests on their northern slopes and by dry Mediter-ranean vegetation on their southern slopes, with numerouscliffs. However, it remains to be determined whether thebarrier between C1 and C2 is due to the present habitatstructure and/or to a secondary contact between two gen-etically differentiated entities (see below).
When considering pairwise population differentiationbetween C2 and C3, results are different depending on the
C3 subgroup considered. Obviously, a strong barrier togene flow occurs between C2 and C3F but not betweenC2 and C3I (Fig. 6b). Even though the difference of geneticdiversity between C3F and C3I (low and high, respect-ively) could cause a bias in the observed differentiationwith C2 — the theoretical maximum value of FST beinghigher for C3F than for C3I (Hedrick 1999) — this is notsufficient to explain this result. If one considers two popu-lations of C2 and C3F with similar genetic diversity level,for instance BRIA and BARL, respectively, pairwise differ-entiation with any population from C2 is always higherwhen considering BARL (pairwise FST from 0.30 to 0.46)than when considering BRIA (pairwise FST from 0.13 to0.30) for similar geographical distances. The barrier to geneflow evidenced between C2 and C3F fit to a crest rangingfrom 2350 to 3300 m elevation, from the Argentera massifto the north of the Mercantour Massif (see Fig. 8). Also, theabsence of barrier to gene flow between C2 and C3I isconsistent with the clustering analysis. Indeed, individualsfrom C3I sites have partial mean memberships also incluster C2 (probabilities of 0.07, 0.11 and 0.25 for OSIG,TEND and BRIG, respectively; K = 3, Fig. 5a). This resultshould be related to the absence of a strong barrier betweenthe Italian part and the centre of the range of C. solieri andprovides interesting insights to the phylogeography ofthe species.
Phylogeography of C. solieri
We have shown that if IBD is the basic process ofpopulation structuring in C. solieri, the current populationstructure is likely to also show historical imprints. Accord-ing to morphological and molecular markers, Rasplus et al.(2001) recently proposed that C. solieri has been isolatedduring the last Quaternary ice age into two refugia, oneprobably located in Italy and the other in south of France(Estérel and/or Maures massifs). The Iberic peninsula,Italy and the Balkans are often identified as importantrefugia for numerous species in Europe (Taberlet et al. 1998;Hewitt 1999), but other places have also been proposed, inparticular in the south of France (Pons 1981; Konnert &Bergmann 1995; Blondel & Aronson 1999; Vogel et al. 1999;Kropf et al. 2002). In the case of C. solieri, location of therefugia suited the fact that the most southern extension ofthe Alpine ice sheet during the last glacial period (Würm)was in the Alpes Maritimes and Ligurian region (see Kropfet al. 2002).
Postglacial recolonization would have then occurrednorthward as the blue form differentiated in the south ofFrance and westward as the green form differentiated inItaly, probably following two ways as suggested by thepresent results (see Fig. 8). A first postglacial colonizationroute from Italy could have occurred in the north ofArgentera and Mercantour massifs following the Stura di

I S O L A T I O N B Y D I S T A N C E A N D B A R R I E R T O G E N E F L O W 1895
© 2004 Blackwell Publishing Ltd, Molecular Ecology, 13, 1883–1897
Demonte valley, and crossed the Larche pass (1991 melevation) to reach the present northwest part of the rangeof C. solieri. This colonization area corresponds to the rangeof the C3 cluster. Genetic variability estimated either byallelic richness or genetic diversity declines from east to west(Fig. 2). This is consistent with theoretical and empiricalworks reporting a general pattern of gradual loss of geneticdiversity produced by colonization (Austerlitz et al. 1997;Le Corre & Kremer 1998; Hewitt 1999; but see Comps et al.2001). The most frequent alleles in populations from north-west of the range (C3F) were also among the most frequentin populations from Italy (C3I), whereas most alleles withlow frequencies observed in populations from C3I wereabsent in populations from C3F. The loss of diversity inC3F relative to C3I could be explained by the cross of theLarche pass and/or the colonization process through thenarrow Stura di Demonte valley. A second postglacialcolonization route from Italy probably progressed betweenthe Mercantour massif and the Mediterranean Sea. Therange from the Argentera massif to the north of theMercantour massif (2350–3300 m high) could have pre-vented the mix of populations originating from the twocolonization routes. This is illustrated by the barrier togene flow identified between C3F and C2.
Hybridization and introgression between the two differ-entiated entities are supposed to have occurred followingtheir secondary contact (Rasplus et al. 2001). The Alpinebarrier is indeed one European region concentrating ahigh number of hybrid zones resulting from postglacialsecondary contact (the so-called suture zones, Taberletet al. 1998; Hewitt 2000). However, there is still uncertaintyabout the exact location of the first contact zone betweenthe two original subspecies of C. solieri. It could correspondto the present Curtii group range. This would mean thatthe blue colour of the Clairi group results from an inde-pendent acquisition. An alternative hypothesis could bethat the initial contact zone corresponds to the current limitbetween C2 and C3I. In this case the Clairi group wouldillustrate the northernmost expansion of the blue entitydifferentiated in south of France. Even though the presentstudy does not show more genetic proximity between theClairi and Bonnetianus groups than between the formerand the Solieri group in the centre of the range, as expectedunder the alternative hypothesis, this does not allow us tofirmly reject this second scenario. Additional studies arerequired.
Conclusions
In the present study, we showed empirically that asignificant IBD pattern suggesting gradual and steadychange in gene frequencies can nevertheless hide sharpdiscontinuities in gene frequencies. Indeed, we identifiedtwo major barriers to gene flow in the distribution area of
C. solieri. If the physical nature of the first (i.e. a crest range)is evident, it remains to determine the origin of the second(secondary contact and/or habitat structure). IBD patternsare quite different when considering clusters of popu-lations defined by such barriers independently or together.The slope of the regression of genetic differentiation againstgeographical distances is much higher when consideringpopulations altogether (for instance 0.173 for C2 and C3)than when conducting independent analyses for each cluster(0.075 and 0.069 for C2 and C3, respectively). This resulthighlights strongly the possible confounding contributionof barriers to gene flow to IBD pattern and emphasizes theutility of the model-based clustering analysis used in thisstudy to investigate genetic population structure moreeffectively, and in particular to detect barriers to gene flowor secondary contact. The three main clusters identifiedwere characterized by different population structures,suggesting that relative influences of evolutionary forcesare quite different between the corresponding regions.Here, the combined analyses of IBD patterns and cluster-ing provided new and valuable insights to the studyof C. solieri phylogeography, allowing in particular theidentification of colonization routes from the Italian refuge.Whereas the main clusters and subgroups identified areprobably related to its colonization history, the significantIBD pattern determined within each cluster suggests thatthe current equilibrium between migration and geneticdrift is mainly responsible for the observed populationstructures.
Acknowledgements
We thank Serge Meusnier, Olivier Duron, Elisabeth Pêcheur andAriane Bernard-Laurent for their significant help during fieldsampling. We are also grateful to Thomas Lenormand and RaphaëlLeblois for valuable discussions during the preparation of themanuscript. Comments of T. Lenormand improved an earlierversion of the manuscript. Thanks also to Louis Bernatchez and totwo anonymous reviewers for their constructive criticisms andto Jonathan Pritchard for a discussion about PPD. Eleanor Hainehelped with the English language revisions. This work was sup-ported partially by research funds from the Bureau des RessourcesGénétiques and by the Institut Français de la Biodiversité. S.G. wassupported by a grant from the French Ministère de l’EducationNationale, de la Recherche et de la Technologie. This work is acontribution of the ‘Equipe Systématique, Phylogénie et Phylo-géographie’ from the CBGP and the ‘Equipe Différenciation etEspèces’ from the UMR-CNRS 5561.
ReferencesAssmann T, Weber F (1997) On the allozyme differentiation of
Carabus punctatoauratus Germar (Coleoptera, Carabidae). Journalof Zoological Systematics and Evolutionary Research, 35, 33–43.
Austerlitz F, Jung-Muller B, Godelle B, Gouyon P-H (1997) Evolu-tion of coalescence times, genetic diversity and structure duringcolonization. Theoretical Population Biology, 51, 148–164.

1896 S . G A R N I E R E T A L .
© 2004 Blackwell Publishing Ltd, Molecular Ecology, 13, 1883–1897
Belkhir K, Borsa P, Chikhi L, Raufaste N, Bonhomme F (2001)Genetix 4.02, Logiciel Sous Windows TM Pour La Génétique DesPopulations. Laboratoire Génome, Populations, Interactions, CNRSUMR. 5000, Université de Montpellier II, Montpellier.
Blondel J, Aronson J (1999) Biology and Wildlife of the MediterraneanRegion. Oxford University Press, Oxford.
den Boer PJ (1970) On the significance of dispersal power forpopulations of Carabid-beetles (Coleoptera, Carabidae).Oecologia, 4, 1–28.
Bonadona P (1973) Nouvelle contribution à la connaissancedes races françaises de Chrysocarabus solieri (Col, Carabidae).Annales de la Société Entomologique de France, 9, 759–812.
Bossart JL, Prowell DP (1998) Genetic estimates of populationstructure and gene flow: limitations, lessons and new directions.Trends in Ecology and Evolution, 13, 202–206.
Brouat C, Sennedot F, Audiot P, Leblois R, Rasplus J-Y (2003)Fine-scale genetic structure of two carabid species with con-trasted levels of habitat specialization. Molecular Ecology, 12,1731–1745.
Castric V, Bernatchez L (2003) The rise and fall of isolation bydistance in the anadromous brook charr (Salvelinus fontinalisMitchill). Genetics, 163, 983–996.
Comps B, Gömöry D, Letouzey J, Thiébaut B, Petit RJ (2001)Diverging trends between heterozygosity and allelic richnessduring postglacial colonization in the European beech. Genetics,157, 389–397.
Cornuet J-M, Luikart G (1996) Description and power analysis oftwo tests for detecting recent population bottlenecks from allelefrequency data. Genetics, 144, 2001–2014.
Darnaud J, Lecumberry M, Blanc R (1978) Coléoptères CarabidaeChrysocarabus solieri Dejean 1826. Iconographie entomologique.Coléoptères. Planche, 4, 1–6.
Doyle JJ, Doyle JL (1987) A rapid isolation procedure for smallquantities of fresh leaf tissue. Phytochemical Bulletin, 19, 11–15.
El Mousadik A, Petit RJ (1996) High level of genetic differentiationfor allelic richness among populations of the argan tree (Arganiaspinosa (L.) Skeels) endemic to Morocco. Theoretical AppliedGenetics, 92, 832–839.
Excoffier L, Smouse PE, Quattro JM (1992) Analysis of molecularvariance inferred from metric distances among DNA haplo-types: application to human mitochondrial DNA restrictiondata. Genetics, 131, 479–491.
Garnier S, Brouat C, Mondor-Genson G, Prieur B, Sennedot F,Rasplus J-Y (2002) Microsatellite DNA markers for two endemicground beetles: Carabus punctatoauratus and C. solieri. MolecularEcology Notes, 2, 572–574.
Goudet J (1995) fstat (version 1.2): a computer program tocalculate F-statistics. Journal of Heredity, 86, 485–486.
Goudet J, Raymond M, de Meeüs T, Rousset F (1996) Testingdifferentiation in diploid populations. Genetics, 144, 1933–1940.
Hedrick PW (1999) Highly variable loci and their interpretation inevolution and conservation. Evolution, 53, 313–318.
Hewitt G (1999) Post-glacial re-colonization of European biota.Biological Journal of the Linnean Society, 68, 87–112.
Hewitt G (2000) The genetic legacy of the Quaternary ice ages.Nature, 405, 907–913.
Hutchison DW, Templeton AR (1999) Correlation of pairwisegenetic and geographic distance measures: inferring the relativeinfluences of gene flow and drift on the distribution of geneticvariability. Evolution, 53, 1898–1914.
Keller I, Largiadèr CR (2003) Recent habitat fragmentation causedby major roads leads to reduction of gene flow and loss of
genetic variability in ground beetles. Proceedings of the RoyalSociety of London B, 270, 417–423.
Konnert M, Bergmann F (1995) The geographical distribution ofgenetic variation of silver fir (Abies alba, Pinaceae) in relation toits migration history. Plant Systematics and Evolution, 196, 19–30.
Kropf M, Kadereit JW, Comes HP (2002) Late Quaternary dis-tributional stasis in the submediterranean mountain plantAnthyllis montana L. (Fabaceae) inferred from ITS sequences andamplified fragment length polymorphism markers. MolecularEcology, 11, 447–463.
Latta RG, Mitton JB (1999) Historical separation and present geneflow through a zone of secondary contact in ponderosa pine.Evolution, 53, 769–776.
Le Corre V, Kremer A (1998) Cumulative effects of foundingevents during colonization on genetic diversity and differ-entiation in an island and stepping-stone model. Journal ofEvolutionary Biology, 11, 495–512.
Lugon-Moulin N, Hausser J (2002) Phylogeographical structure,postglacial recolonization and barriers to gene flow in thedistinctive Valais chromosome race of common shrew (Sorexaraneus). Molecular Ecology, 11, 785–794.
Manly BJF (1985) The Statistics of Natural Selection. Chapman &Hall, London.
Nei M (1978) Estimation of average heterozygosity and geneticdistance from a small number of individuals. Genetics, 89, 583–590.
Niehues FJ, Hockmann P, Weber F (1996) Genetics and dynamics ofa Carabus auronitens metapopulation in the Westphalian Lowlands(Coleoptera, Carabidae). Annales Entomologici Fennici, 33, 85–96.
Peterson MA (1995) Phenological isolation, gene flow and develop-mental differences among low- and high-elevation populationsof Euphilotes enoptes (Lepidoptera: Lycaenidae). Evolution, 49,446–455.
Peterson MA (1996) Long-distance gene flow in the sedentarybutterfly, Euphilotes enoptes (Lepidoptera: Lycaenidae). Evolution,50, 1990–1999.
Pogson GH, Taggart CT, Mesa KA, Boutilier RG (2001) Isolationby distance in the atlantic cod, Gadus morhua, at large and smallgeographic scales. Evolution, 55, 131–146.
Pons A (1981) The history of the Mediterranean shrublands. In:Maquis and Chaparrals. Ecosystems of the World (eds diCastri F,Goodall DW, Specht RL), pp. 131–138. Elsevier, Amsterdam.
Pritchard JK, Stephens M, Donnelly P (2000) Inference of popula-tion structure using multilocus genotype data. Genetics, 155,945–959.
Rasplus J-Y, Garnier S, Meusnier S, Piry S, Mondor G, Audiot P,Cornuet J-M (2001) Setting conservation priorities: the casestudy of Carabus solieri (Col. Carabidae). Genetics, Selection andEvolution, 33, S141–S175.
Raymond M, Rousset F (1995a) An exact test for population differ-entiation. Evolution, 49, 1280–1283.
Raymond M, Rousset F (1995b) genepop version 1.2: populationgenetics software for exact tests and ecumenism. Journal ofHeredity, 86, 248–249.
Rosenberg NA (2002) DISTRUCT: a Program for the Graphical Display ofStructure Results. http://www-hto.usc.edu/∼noahr/distruct.html.
Rosenberg NA, Pritchard JK, Weber JL et al. (2002) Genetic struc-ture of human populations. Science, 298, 2381–2385.
Rousset F (1997) Genetic differentiation and estimation of geneflow from F-statistics under isolation by distance. Genetics, 145,1219–1228.
Rousset F (2000) Genetic differentiation between individuals.Journal of Evolutionary Biology, 13, 58–62.

I S O L A T I O N B Y D I S T A N C E A N D B A R R I E R T O G E N E F L O W 1897
© 2004 Blackwell Publishing Ltd, Molecular Ecology, 13, 1883–1897
Schneider S, Roessli D, Excoffier L (2000) ARLEQUIN 2.000. a Softwarefor Population Genetics Data Analysis. Genetics and BiometryLaboratory, University of Geneva, Geneva.
Slatkin M (1987) Gene flow and the geographic structure ofnatural populations. Science, 236, 787–792.
Slatkin M (1993) Isolation by distance in equilibrium and non-equilibrium populations. Evolution, 47, 264–279.
Sokal RR, Rohlf FJ (1995) Biometry: the Principles and Practices ofStatistics in Biology Research, 3rd edn. W.H. Freeman, NewYork.
Taberlet P, Fumagalli L, Wust-Saucy A-G, Cossons J-F (1998)Comparative phylogeography and postglacial colonizationroutes in Europe. Molecular Ecology, 7, 453–464.
Thiele H (1977) Carabid Beetles in Their Environments. Springer-Verlag, Berlin.
Turgeon J, Bernatchez L (2001) Clinal variation at microsatelliteloci reveals historical secondary intergradation between glacial
races of Coregonus artedi (Teleostei: Coregoninae). Evolution, 55,2274–2286.
Vogel JC, Rumsey FJ, Schneller JJ, Barrett JA, Gibby M (1999)Where are the glacial refugia in Europe? Evidence from pterido-phytes. Biological Journal of the Linnean Society, 66, 23–37.
Weir BS, Cockerham CC (1984) Estimating F-statistics for theanalysis of population structure. Evolution, 38, 1358–1370.
Wright S (1943) Isolation by distance. Genetics, 28, 114–138.
This work constitutes part of S. Garnier’s PhD thesis. He studieddifferentiation and hybridization in Carabus solieri using popula-tion genetics and geometric morphometrics approaches. P. Alibertis a senior scientist working on population differentiation andspeciation. J.-Y. Rasplus is a senior scientist working on systematic,evolution and conservation genetics of insects.