ISOLATION AND IDENTIFICATION OF A LIPASE PRODUCING...
65
ISOLATION AND IDENTIFICATION OF A LIPASE PRODUCING PSYCHROTROPHIC BACTERIA FROM SOIL: CLONING AND PARTIAL CHARACTERIZATION OF ITS LIPASE A Thesis Submitted to the Graduate School of Engineering and Sciences of İzmir Institute of Technology in Partial Fulfillment of the Requirements for the Degree of MASTER OF SCIENCE in Molecular Biology and Genetics by Aysun ADAN December 2009 İZMİR
-
Upload
trinhhuong -
Category
Documents
-
view
221 -
download
1
Transcript of ISOLATION AND IDENTIFICATION OF A LIPASE PRODUCING...

ISOLATION AND IDENTIFICATION OF A LIPASE
PRODUCING PSYCHROTROPHIC BACTERIA FROM SOIL: CLONING AND PARTIAL CHARACTERIZATION OF ITS LIPASE
A Thesis Submitted to the Graduate School of Engineering and Sciences of
İzmir Institute of Technology in Partial Fulfillment of the Requirements for the Degree of
MASTER OF SCIENCE
in Molecular Biology and Genetics
by Aysun ADAN
December 2009 İZMİR

We approve the thesis of Aysun ADAN __________________________________ Assist. Prof. Dr. Alper ARSLANOĞLU Supervisor __________________________________ Assist. Prof. Dr. H. Çağlar KARAKAYA Co-Supervisor __________________________________ Assoc. Prof. Dr. Ahmet KOÇ Committee Member __________________________________ Assoc. Prof. Dr. Talat YALÇIN Committee Member 16 December 2009 ____________________________ ____________________________ Assoc. Prof. Dr. Sami DOĞANLAR Assoc. Prof. Dr. Talat YALÇIN Head of the Department of Molecular Dean of the Graduate School of Biology and Genetics Engineering and Sciences

ACKNOWLEDGEMENTS
I wish to express my grateful thanks to my supervisor Assist. Prof. Dr. Alper
ARSLANOĞLU for giving me chance to work with him and also I would like to thank
him for his supervision, encouragement, criticism and patience to guide me during my
thesis studies.
Also I would like to thank my co-supervisor Assist. Prof. Dr. H. Çağlar
KARAKAYA for his valuable comments and help during my thesis studies.
My special thanks go to my dear friends Burcu ÜNSAL, Burcu ŞENGEZ and
Elvan ERGÜLEN who are working with me in the Molecular Microbiology Laboratory
for their sincere help offers, friendships and moral support.
I would like to thank Ece YAPAŞAN, Zeynep Melda GÜRAY and Hande
KARAOSMANOĞLU for sharing their experiences with me.
I want to express my grateful thanks to İsmail GÖKBULUT for being with me
through all the times during this study. I also thank to him for his motivation, support
and endless love.
Finally, I express my deep gratitude and appreciation to my family members
Osman ADAN, Hatice ADAN and Aylin ADAN for their unconditional love, belief,
support and enormous encouragement.

iv
ABSTRACT
ISOLATION AND IDENTIFICATION OF A LIPASE PRODUCING PSYCHROTROPHIC BACTERIA FROM SOIL: CLONING AND
PARTIAL CHARACTERIZATION OF ITS LIPASE
Lipases are serine hydrolases and catalyze both the hydrolysis and synthesis of
long-chain triacylglycerols. Lipases have great importance since their wide usage in
industry. Lipases are produced by microorganisms (bacteria and fungi), plants and
animals. However, microbial lipases, especially from bacteria, more useful than their
plant and animal derivatives because of several important properties.
The primary goals of this thesis were to isolate and identify a lipase producing
bacterium from soil sample from Erciyes mountain in Kayseri by 16S rRNA sequence
analysis, find the sequence of lipase gene by degenerate PCR and inverse PCR and
analyze of lipase gene for some important features like active site residues. The other
purposes of this study were determination of lipase production conditions like optimum
production time, partial purification and characterization of native lipase enzyme.
Purification was performed by ammonium sulfate precipitation and gel filtration.
Spectrophotometric lipase assay was used for enzyme characterization.
As conclusion, a lipase producer bacterium was isolated from soil using
rhodamine B-olive oil plate assay and identified as a strain of Pseudomonas fluorescens
based on 16S rRNA sequence homology. Its partial lipase gene was obtained and it was
suggested that the lipase belong to group 3 Pseudomonas lipases according to gene and
amino acid homology search. Moreover, native lipase partially purified and
characterized. The molecular mass of purified lipase was estimated to be approximately
43 kDa by SDS-PAGE. The optimum temperature and pH for the lipase were found to
45°C and pH 8, respectively.

v
ÖZET
LİPAZ ÜRETEN PSİKROTROF BİR BAKTERİNİN TOPRAKDAN İZOLASYONU VE TANIMLANMASI: LİPAZIN KLONLANMASI VE
KISMİ KARAKTERİZASYONU
Lipazlar serin hidrolazlardır ve uzun zincirli triaçilgliserollerin hem hidroliz
hemde sentezlerini katalizlerler. Lipazlar endüstrideki yaygın kullanımları nedeniyle
büyük öneme sahiptirler. Lipazlar mikrooraganizmalar (bakteri ve mantarlar), bitkiler
ve hayvanlar tarafından üretilirler. Fakat, mikrobiyal lipazlar, özellikle bakteri kaynaklı
olanlar, birkaç önemli özellikleri nedeniyle bitki ve hayvan türevlerinden daha
kullanışlıdırlar.
Bu çalışmanın öncelikli hedefleri; Kayseri Erciyes’den gelen toprak örneğinden
lipaz üreten bir bakterinin izole edilmesi ve 16S rRNA sekans analizi ile tanımlanması,
lipaz geninin sekansının dejenere PCR ve invers PCR ile bulunması ve lipaz geninin
aktif bölge rezidüleri gibi bazı önemli özellikler bakımından incelenmesidir. Bu
çalışmanın diğer amaçları ise optimum lipaz üretim zamanı gibi lipaz üretim
koşullarının belirlenmesi, doğal lipaz enziminin kısmi olarak saflaştırılması ve
karakterizasyonudur. Saflaştırma amonyum sülfat çöktürmesi ve jel filtrasyonu ile
gerçeklestirilmiştir. Enzim karakterizasyonu için spektrofotometrik lipaz methodu
kullanılmıştır.
Sonuç olarak, lipaz üreten bir bakteri rodamine B-zeytinyağı petri yöntemi
kullanılarak toprakdan izole edilmiş ve 16S rRNA sekans homolojisine dayanarak
Pseudomonas fluorescens in bir suşu olarak tanımlanmıştır. Lipaz geninin kısmi sekansı
elde edilmiş ve aminoasit ve gen homoloji analizine göre Pseudomonas grup 3 lipaz
grubuna ait olduğu önerilmiştir. Ayrıca, doğal lipaz enzimi kısmi olarak saflaştırılıp
karakterize edilmiştir. Molekül ağırlığı sodyum dodesilsülfat poliakrilamit jel
elektroforezi ile yaklaşık 43 kilodalton olarak hesaplanmıştır. Lipaz için optimum
sıcaklık ve pH sırasıyla 45°C ve pH 8 olarak bulunmuştur.
vi
TABLE OF CONTENTS
LIST OF FIGURES ......................................................................................................... ix
LIST OF TABLES........................................................................................................... xi
ABBREVIATIONS ........................................................................................................xii
CHAPTER 1. INTRODUCTION ..................................................................................... 1
1.1. Microorganisms as Bio-factories ........................................................... 1
1.2. Definition of a Lipase ............................................................................ 2
1.3. General Lipase Structure ....................................................................... 4
1.4. Sources of Lipases ................................................................................. 6
1.5. Bacterial Lipases.................................................................................... 7
1.6. Detection of Lipolytic Microorganisms............................................... 10
1.6.1. Method Based on Changes in Substrate Appearance .................... 11
1.6.2. Dye-Based Methods....................................................................... 12
1.7. Industrial Applications of Microbial Lipases ..................................... 12
1.7.1. Lipases in the Food Industry.......................................................... 13
1.7.2. Lipases in the Detergents............................................................... 14
1.7.3. Lipases in Pulp and Paper Industry................................................ 15
1.7.4. Lipases in the Leather Industry...................................................... 15
1.7.5. Lipases in Environmental Management ........................................ 16
1.7.6. Lipases as Biosensors .................................................................... 16
1.7.7. Lipases in Pharmacy ...................................................................... 16
1.8. The Aim of this Work.......................................................................... 17
CHAPTER 2. MATERIALS AND METHODS ............................................................ 18
2.1. Materials .............................................................................................. 18
2.2. Methods ............................................................................................... 18
2.2.1. Selection of a Lipase Producer Bacterial Strain from a
Soil Sample .................................................................................... 18

vii
2.2.2. Genetic Identification of Isolated Strain by PCR
Amplification of Partial 16S rRNA Gene ..................................... 19
2.2.3. Design of an E.coli Expression Vector.......................................... 20
2.2.3.1. Control the Expression Capacity of the Designed
Plasmid.................................................................................. 21
2.2.4. PCR Amplification, Cloning and Sequence Analysis of
Lipase Gene from Pseudomonas sp. KE38 ................................... 22
2.2.5. Purification and Characterization of Lipase from
Pseudomonas sp. KE38 ................................................................ 23
2.2.5.1. Determination of Optimum Lipase Production
Time and Carbon Source ...................................................... 23
2.2.5.2. Partial Purification of KE38 Lipase...................................... 24
2.2.5.3. Characterization of Partially Purified Lipase
Enzyme ................................................................................. 24
2.2.5.3.1. Effect of Temperature and pH on Enzyme
Activity ..................................................................... 25
2.2.5.3.1. SDS-PAGE and Native PAGE ................................. 25
CHAPTER 3. RESULTS AND DISCUSSION.............................................................. 26
3.1. Isolation and Identification of a Lipase Positive Bacterium
from Erciyes Soil Sample .................................................................... 26
3.2. Designing an Inducible E.coli Expression Vector by PCR-
Based cloning....................................................................................... 29
3.3. Cloning and Sequence Analysis of a Partial Lipase Gene
from a Psychrotrophic Pseudomonas sp. KE38................................... 31
3.4. Partial Purification and Characterization of Pseudomonas
sp. KE38 Lipase. .................................................................................. 38
3.4.1. Effect of Temperature and pH on Lipase Activity ........................ 40
3.4.2. Determination of Molecular Mass ................................................. 42
CHAPTER 4. CONCLUSIONS ..................................................................................... 43
REFERENCES ............................................................................................................... 46

viii
APPENDICES
APPENDIX A. PARTIAL SEQUENCES OF 16S rRNA AND LIPASE
GENES OF IDENTIFIED BACTERIAL STRAIN ........................... 50
APPENDIX B. THE SEQUENCES AND POSITIONS OF INVERSE PCR
PRIMERS ON PARTIAL LIPASE FRAGMENT ............................. 51
APPENDIX C. BUFFERS AND STOCK SOLUTIONS ............................................ 52

ix
LIST OF FIGURES
Figure Page
Figure 1.1. Hydrolytic and synthetic actions of lipase................................................... 4
Figure 1.2. The α/β hydrolase fold ................................................................................. 5
Figure 1.3. The 3D structure of the lipase from Pseudomonas aeruginosa................... 6
Figure 1.4. Type I secretion pathway ............................................................................ 8
Figure 1.5. Model for Pseudomonas aeruginosa lipase secretion pathway................... 9
Figure 3.1. Photos of selected lipase positive strain under UV light, grown
at 25°C and 4°C, respectively................................................................... 27
Figure 3.2. Positive and negative controls under UV light .......................................... 27
Figure 3.3. Agarose gel analysis of PCR amplified partial 16S rRNA gene
region of the experimental strain ............................................................... 28
Figure 3.4. Colony PCR result ..................................................................................... 28
Figure 3.5. The construction of phylogenetic tree based on 16S rRNA
analysis....................................................................................................... 29
Figure 3.6. Construction of pUCex by PCR-based cloning ........................................ 30
Figure 3.7. Control the presence of tetracycline gene cloned into pUCex
by colony PCR........................................................................................... 31
Figure 3.8. The phylogenetic tree predicted from sequence aligment of
lipases from 53 different Pseudomonas strains ......................................... 32
Figure 3.9. Design the degenerate primers LIPPFF and LIPPRR by
multiple aligment of 23 different Pseudomonas fluorescens
lipases......................................................................................................... 33
Figure 3.10. The partial lipase fragment amplified by temperature gradient PCR
using degenarate primers, LIPPFF and LIPPRR ....................................... 34
Figure 3.11. Multiple aligment of Pseudomonas sp. KE38 partial lipase gene
sequence with other lipase sequences of Pseudomonas
fluorescens strains...................................................................................... 35
Figure 3.12. Multiple aligment of Pseudomonas sp. KE38 lipase with other
lipases of Pseudomonas fluorescens strains .............................................. 37
Figure 3.13. Time course of lipase production of Pseudomonas sp. KE38 in
an olive oil containing medium ................................................................ 39

x
Figure 3.14. Effect of temperature a) and pH b) on enzyme activity based
on relative enzyme activiy values.............................................................. 41
Figure 3.15. SDS-PAGE of partially purified lipase enzyme from
Pseudomonas sp. KE38 ............................................................................. 42

xi
LIST OF TABLES
Table Page
Table 3.1. Optimization of lipase production time ........................................................ 38
Table 3.2. Effect of glucose and olive oil on growth and enzyme production .............. 40
Table B.1. The sequences of inverse PCR primers ........................................................ 51

xii
ABBREVIATIONS
LB Luria-Bertani
UV Ultraviolet
rpm Revolutions per minute
CTAB Cetyl trimethylammonium bromide
PCR Polymerase chain reaction
OD Optic density
rRNA Ribosomal ribonucleic acid
rDNA ribosomal deoxyribonucleic acid
ng Nanogram
µg Microgram
Taq Thermus aquaticus (DNA polymerase)
μl Microliter
ml Milliliter
μM Micromolar
mM Millimolar
IPTG Isopropyl-thio-β-D-galactopyranoside
X-Gal 5-bromo-4-chloro-3 indolyl-B-D-galactoside
BLASTn Basic local alignment search tool for nucleic acids
min Minute
sec Second
w/v Weight per volume
v/v Volume per volume
μm Micrometer nm Nanometer
sp. species (singular)
bp Base pair
kb Kilobase pairs
kDa Kilodalton

1
CHAPTER 1
INTRODUCTION
1.1. Microorganisms as Bio-Factories
The biosphere is occupied by a wide variety of microorganisms that carry out
important functions like global primary energy and element cycling and they form the
largest part of living organisms in the sense of total biomass cell numbers (6 x1030
bacteria, 1.3 x1028 archaea, 3.1 x 1029 eukarya), cell biomass (6 x 10¹⁸ kg bacteria, 1.3 x
1016 kg archaea and 3.1 x 10¹⁷ kg eukarya) and species diversity. This diversity of
microorganisms is the most common source of genes which can be used in several
industrial and research applications (Beloqui, et al. 2008).
Microorganisms are found everywhere. It means that they can be observed in the
deepest ocean sediments, at high atmospheric pressure, at unusually high and cold
temperatures and also in highly polluted environments. Microbes are able to break down
a variety of usual and unusual carbon and energy sources and convert them into
aminoacids, nucleotides, vitamins, carbohydrates and fatty acids by producing specific
enzymes. Enzymes that carry out metabolic processes in microbes also have several
practical and industrial usage to perform certain reactions apart from the cell. So, due to
their ability to adapt a wide range of conditions and produce specific enzymes,
microorganisms have been paid attention as little bio-factories (Sanchez 2005).
In the beginning of enzyme technology, crude preparations from certain animal
tissues like pancreas and stomach mucosa, or plant tissues found applications in textile,
leather and other industries. However, such preparations had some disadvantages such
as high cost and shortage of tissues from animals and plants. It was realized that some
microorganisms produce enzymes similar to that of plants and animals in terms of
actions. Dr. Jokichi Takamine (1894, 1914) was the first person to introduce microbial
enzymes to industry. Although he was mainly interested in fungal enzymes, Boidin and
Effront (1917) were pioneers in the production of bacterial enzymes. Since that time
microbial enzymes have taken the place of enzymes from plants and animals
(Underkofler, et al. 1957).

2
Microbial enzymes have a great number of usage in food, pharmaceutical,
textile, paper, leather and other industries (Hasan, et al. 2006). Their applications have
been increasing rapidly. Among industrially important enzymes, hydrolases come in the
first place and include enzymes with a wide substrate specifity. Carbohydrases,
proteases, pectinases and lipases are classified into hydrolases. They catalyze the
hydrolysis of natural organic compounds (Rajan 2001, Underkofler, et al. 1957). We
will focus on lipase from a cold-adapted bacterium in this particular study.
1.2. Definition of a Lipase
The large part of the earth’s biomass is represented by lipids. Lipids are essential
to all living systems. They are the most important source of energy, play structural roles
in membranes and are involved in signaling events. To be able to carry out these
functions, lipids require lipolytic enzymes during their metabolism. Lipolytic enzymes
catalyze the turnover of these water-insoluble compounds (Gilham and Lehner 2005).
They also breakdown lipids and make them mobile within the cells of individual
organisms (Beisson, et al. 2000). Lipolytic enzymes are grouped into 3 main categories,
which are esterases, phospholipases and lipases (Arpigny and Jaeger 1999).
Lipases were first discovered in 1856 by Claude Bernard when he studied the
role of the pancreas in fat digestion (Peterson and Drabløs 1994). Since then, many
different lipases have been identified in and isolated from bacteria, fungi, plants, and
animals. The presence of lipases has been noticed as early as in 1901 for Bacillus
prodigiosus, B. pyocyaneus and B. fluorescens which are now called Serratia
marcescens, Pseudomonas aeruginosa and Pseudomonas fluorescens, respectively
(Jaeger, et al. 1999, Hasan, et al. 2006).
In 1958, lipases were first defined by Sarda and Desnuelle based on the
phenomenon of interfacial activation, which was first observed in 1936 by Holwerda et
al and then in 1945 by Schonheyder and Volqwarts. After the discovery of this
phenomenon, Sarda and Desnuelle concluded that the activity of lipases were related to
the formation of interface between the water-insoluble substrate and water (Verger
1997).
Human pancreatic lipase and Rhizomucor miehei lipase were the first ones
whose 3D structures elucidated in 1990. These two lipases were found to have a lid like

3
structure covering the active site of the enzyme and the presence of such a lid might be
a good explanation for interfacial activation of the enzyme. It was postulated that this
structure had to show a change in conformation in the presence of lipid-water interface
and this might be related to the activation of enzymes (Frenken, et al. 1992). Finally, it
was clearly identified that both lipases were active via the movement of lid that closes
the active site. Since, the active site of the enzyme became accessible to the substrate.
On the other hand, The European BRIDGE-T-LIPASE project, carried out from 1990 to
1994, found some lipases with exceptional 3D structures from P.glumae, P.aeruginosa
and Candida antartica B. All of them have a lid structure, but do not show interfacial
activation to be active (Schmid and Verger 1998, Verger 1997).
In conclusion, based on exceptions, interfacial activation as well as presence of a
lid domain are not a suitable criteria to determine true lipases. Therefore, lipases are
defined basically as fat-splitting enzymes that catalyze the hydrolysis of long-chain
triacylglycerols to form glycerol and fatty acid in the presence of excess water (Figure
1.1). Also, they can catalyze the reverse reaction, synthesis of triacylglycerols, under
non-aqueous conditions (Jaeger, et al. 1999, Gupta, et al. 2004, Pascale, et al. 2008).
Glycerolesters with an acyl chain length ≥ 10 carbon atoms can be said as lipase
substrates (Jensen 1983). In addition to lipases, esterases are also grouped into
hydrolases and these two enzymes were confused for a long time. Now, it is realized
that they are really different from each other in terms of substrate specificity (Zhang and
Zeng 2008). Esterases break ester bonds of short chain fatty acids whereas lipases
catalyze the hydrolysis of long chain fatty acids that are insoluble or poorly soluble.
Therefore, the lipase must be capable of identifying an insoluble or aggregated
substrate. Esterase activity is found to be highest towards more water soluble substrate
(Fojan, et al. 2000).

4
Figure 1.1. Hydrolytic and Synthetic Actions of Lipase (Source: Jaeger and Reetz 1998)
1.3. General Lipase Structure
It is very important to know three-dimensional structures of lipases in order to
make them fit for specific applications. Human pancreatic lipase and the lipase from the
fungus Rhizomucor miehei were the first ones whose 3D structures elucidated. Various
other fungal lipase structures, from Geotrichum candidum, Fusarium solani, Candida
rugosa, Candida antarctica, Humicola lanuginose and Rhizopus delemar, followed
them (Jaeger, et al. 1999, Jaeger, et al. 1994). In contrast, 3D structues of bacterial
lipases were determined slowly. The first bacterial lipase structure, from Pseudomonas
glumae, was clarified in 1993 (Noble, et al. 1993). Many bacterial lipases have been
studied structurally since 1993.
After the determination of first lipase structures, it was realized that they shared
a common folding pattern in spite of not showing sequence similarity (Fan, et al. 2008).
This folding pattern was identified in 1992 by Ollis et al. Ollis and his friends compared
five hydrolytic enzymes which were dienelactone hydrolase, haloalkane dehalogenase,
wheat serine carboxypeptidase II, acetylcholinesterase and the lipase from Geotrichum
candidum. They concluded that they share a same folding pattern called α/β hydrolase
fold. Because they all catalyze a hydrolysis reaction (Arpigny and Jaeger 1999, Nardini
and Dijkstra 1999). So, the alpha/beta-hydrolase fold family consists of structurally
related enzymes with diverse catalytic functions.
The α/β hydrolase fold includes a central, mostly parallel eight- stranded β sheet
(only the second β strand is antiparallel ) surrounded on both sides by α helices (Figure
1.2). The β sheet displays a left-handed superhelical twist and the first and the last

5
strands cross each other at an angle of approximately 90° (Jaeger, et al. 1999). The
bacterial lipase structures known so far possess the α/β hydrolase fold with some
variations. The number of β strands in β sheet can be changeable for lipases from
different bacterial species. For instance, the lipases from B.glumae and B.cepacia have
six parallel β strands whereas that from S.exfoliatus contains an extra antiparallel β
strand in the central β sheet of the α/β hydrolase fold (Nardini and Dijkstra 1999).
Figure 1.2. The α/β hydrolase fold (Source: Jaeger, et al. 1999)
The active site of the α/β hydrolase fold enzymes contains three catalytic
residues which are nucleophilic residues (serine, cysteine or aspartate), a catalytic acid
residue (aspartate or glutamate) and a histidine residue. In lipases the nucleophile
residue has been determined to be a serine residue, but the catalytic acid can be either an
aspartate or a glutamate residue. The active site serine residue is located in a higly
conserved Gly-X-Ser-X-Ser pentapeptide (Pascale, et al. 2008, Joseph, et al. 2008). In
contrast, this well conserved pentapeptide differs in lipases from Bacillus strains where
the first Gly residue is replaced by an Ala (Jaeger, et al. 1994).
Another unusual and interesting feature of the structure of most lipases is the
presence of a lid-like structure that consists of one or two α-helices. This property
results in a conformational change in lipase if there is an interface between oil and water
(interfacial activation phenomenon). The lid moves away from the active site, thereby

6
allowing it to become accessible for the substrate (Angkawidjaja and Kanaya 2006).
However, this phenomenon does not include all lipases. Remarkable exceptions are the
lipases from P.glumae and C.antartica B. In spite of having a lid, these lipases do not
show interfacial activation (Schmid and Verger 1998).
Finally, some Pseudomonas lipases are shown to have a calcium binding site
(Figure 1.3). This calcium binding site is located near the active site, but it is not related
to catalytic activity. It is thought to play a role in stabilization of the general structure of
the enzyme.
Figure 1.3. The 3D structure of the lipase from Pseudomonas aeruginosa (Source: Jaeger and Reetz 1998)
1.4. Sources of Lipases
Lipases are found throughout all kingdoms of life, which are prokaryotes
including bacteria and archaea and eukaryotes including plants, animals and fungi (Cai-
hong, et al. 2008). Microbial lipases are more useful than enzymes derived from plants
and animals, since they have great variety of catalytic activities and microorganisms are

7
easy to manipulate genetically and cabaple of rapid growth on inexpensive media.
Furthermore, microorganisms are not affected by seasonal fluctuations so they can be
supplied regularly and high amounts of lipases may be obtained from microbial cells.
Microbial lipases are also more stable than their plant and animal derivatives and their
production is easier and safer for industrial and research applications (Schmidt-Dannert
1999).
Bacterial enzymes are more preferred over fungal enzymes because of their
higher activities and neutral or alkaline pH optima. In order to increase the cell yields
and the enzymatic activities of the cells or to produce altered enzymes, genetic and
enviromental manipulations can be performed more readily on bacterial cells due to
their short generation times, their simple nutrional needs and easy screening procedures
for desired properties (Hasan, et al. 2006).
1.5. Bacterial Lipases
A variety of lipases are produced from both Gram-positive and Gram-negative
bacteria. Greater part of bacterial lipases comes from Gram-negative bacteria and the
most important Gram-negative genus is Pseudomonas which contains at least seven
lipase producing species, that are P. aeruginosa, P. alcaligenes, P.fragi, P. glumae, P.
cepacia, P. fluorescens and P. putida (Jaeger, et al. 1994, Kojima, et al. 2003).
Pseudomonas lipases are classified into three groups based on their amino acid
homologies and some biological properties (Zhang, et al. 2008). Group I contains
lipases from P.aeruginosa, P.alcaligenes and P.fragi. Lipases in this group are
composed of approximately 285 amino acids with a molecular weight of 30 000 dalton.
Also, they include two cysteine residues to form a disulfide bond and need another
protein called lipase-spesific foldase for correct folding and secretion. Moreover, they
include a specific sequence at their N-terminal. Group II lipases contain 320 amino
acids correspondig to a molecular weight of 33 000 dalton, one disulfide bond and an
N-terminal signal sequence like group I lipases. Additionally, There is % 60 amino acid
homology between group I and group II lipases and they also require lipase specific
foldases in order to be active and secreted into extracellular environment. Lipases from
P.glumae and P.cepacia are prototypes for group II. Group III Pseudomonas lipases are
larger containing about 475 amino acids and a molecular weight of 50 000 dalton.
8
P.fluorescens lipases are prototypes of this group (Arpigny and Jaeger 1999). Group III
lipases are separeted from group I and group II lipases in several ways a) they do not
contain cysteine residues, b) they do not require any lipase specific foldases and c) they
do not contain an N-terminal signal sequence. According to these differences, it is said
that group III lipases use a different secretion pathway. Group I and II lipases use type
II secretion pathway (also called secreton-mediated secretion) while group III lipases
are secreted via type I secretion system (also named ABC exporters) (Rosenau and
Jaeger 2000).
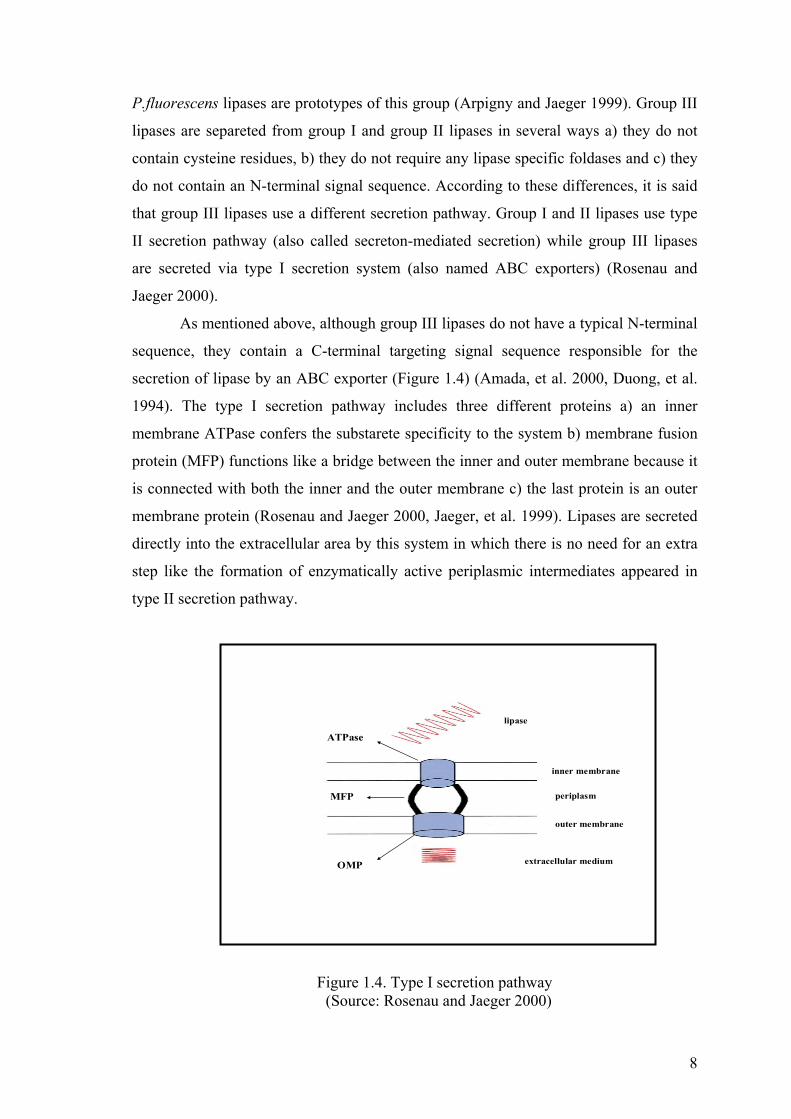
As mentioned above, although group III lipases do not have a typical N-terminal
sequence, they contain a C-terminal targeting signal sequence responsible for the
secretion of lipase by an ABC exporter (Figure 1.4) (Amada, et al. 2000, Duong, et al.
1994). The type I secretion pathway includes three different proteins a) an inner
membrane ATPase confers the substarete specificity to the system b) membrane fusion
protein (MFP) functions like a bridge between the inner and outer membrane because it
is connected with both the inner and the outer membrane c) the last protein is an outer
membrane protein (Rosenau and Jaeger 2000, Jaeger, et al. 1999). Lipases are secreted
directly into the extracellular area by this system in which there is no need for an extra
step like the formation of enzymatically active periplasmic intermediates appeared in
type II secretion pathway.
Figure 1.4. Type I secretion pathway (Source: Rosenau and Jaeger 2000)
ATPase
MFP
OMP
lipase
inner membrane
periplasm
outer membrane
extracellular medium

9
On the other hand, group I and group II lipases have an N-terminal signal
sequence which is used for efficient secretion through the inner membrane by a Sec-
dependent mechanism. This mechanism contains a multisubunit protein complex called
Sec translocase that recognizes the N-terminal sequences of lipases. While lipase is
secreted through the inner membrane, signal sequence is removed and lipase interact
with its specific foldase as well (Rosenau, et al. 2004). As a result, lipases fold into an
enzymatically active conformation in the periplasm. Moreover, this process is assisted
by the Dsb (disulfide bond formation)-proteins which catalyzes the formation of
disulfide bonds. Alternatively, misfolded lipases may be degraded by periplasmic
proteases. Finally, lipases are transported through the outer membrane by the help of a
complex machinery called secreton which contains different proteins forming type II
secretion pathway or secreton mediated- secretion (Figure 1.5).
Figure 1.5. Model for Pseudomonas aeruginosa lipase secretion pathway (Source: Rosenau and Jaeger 2000)

10
Besides Pseudomonas species Achromobacter, Alcaligenes, Burkholderia and
Chromobacterium strains are the most common lipase producing gram-negatives (Gupta
and Rathi 2004).
Gram-positive lipase producers are Staphylococcus (especially, S.aureus and
S.hyicus), Streptomyces and Bacillus species. The most useful lipase producer genus
used in industry is Bacillus among gram-positive bacteria (Jaeger, et al. 1994). Most bacterial species studied for lipase production are non-pathogenic, mainly
because these lipases were aimed to be used for biotechnological applications. It is a
fact that extracellular lipases are important microbial virulence factors in addition to
their industrial usage. In connection with this aspect, human pathogenic bacteria has
been examined recently. One of them is Staphylococcus epidermidis, which is an
opportunistic pathogen. During infection, it secretes two lipases that are considered to
play a role in the colonization on the skin by breaking sebum-derived triacylglycerols.
As well as Staphylococcus, other bacterial species seem to produce lipases for
pathogenicity. Propionibacterium acnes, acting as the cause of acne vulgaris, produces
an extracellular lipase, which functions in the microbial colonization of human skin
(Stehr, et al. 2003).
1.6. Detection of Lipolytic Microorganisms
There must be three factors to detect a lipase-positive bacterium by culturing it.
These factors include (i) growth of the organism, (ii) production of lipase by that
organism under suitable growth conditions and (iii) the presence of a sensitive method
to detect lipase acitivity (Shelley, et al. 1987).
Growth conditions affect the synthesis of lipase by microorganisms. Carbon and
nitrogen sources, the presence of activators and inhibitors, incubation temperature, pH,
inoculum amount and oxygen tension can influence lipase production (Gupta, et al.
2004). The carbon source has been reported as the major factor that affect lipase
expression, since lipases are inducible enzymes. The production of these enzymes
depends on the presence of a lipid, such as olive oil or any other inducer, such as
triacylglycerols, fatty acids and tweens (Treichel, et al. 2009).
Lipase activity is identified by using triacylglycerols composed of long-chain
fatty acids. Triolein is the most ideal substrate due to its liquid form at common assay

11
temperatures. This feature facilitates emulsification of it into growth media.
Alternatively, olive oil can be used instead of triolein. Olive oil has the advantage of
including high concentration of oleic acid and being more economical (Jensen 1983).
Substrates like tweens and tributyrin can also be used for the detection of lipases.
However, since they can also be hydrolyzed by esterases, they don’t give lipase specific
results (Jensen 1983, Shelley, et al. 1987). In conclusion, tweens and tributyrin can be
used for only primary screening procedures.
Microorganisms are often tested for lipase production on solid media. All
methods containing agar can be grouped into two categories; (1) Methods based on
substrate changes in appearance as a result of lipolysis and (2) methods including the
usage of an indicator dye to detect lipolysis (Thomson, et al. 1999). In all methods, it is
important that there must be a contact between substrate and enzyme. Thus the agar
content in screening media can be reduced for increased diffusibility of extracellular
lipase (Hou and Johnston 1992).
1.6.1. Methods Based on Changes in Substrate Appearance
It is possible to visualize lipase-producing microbial colonies on solid media
depending on the used lipase substrate. This type of detection have several advantages
like the elimination of the requirement for specific dyes, that can reduce the cost of
analysis and prevent the inhibiton of microbial growth because microorganisms may be
sensitive to dyes (Thomson, et al. 1999).
A diffusion assay can be used to identify lipase-producing microorganisms. In
this method, a growth medium with tributyrin or triolein is prepared and microbial
culture is put into wells cut in the agar. Lipase activity is defined by a clear zone
formation around colonies after incubation (Thomson, et al. 1999).
In direct observation methods, the formation of clear or turbid zones around
colonies, or the production of crystals on the agar surface displays the presence of
lipolytic activity (Shelley, et al. 1987). Triolein is used as the substrate in lipase
detection methods; however, it is difficult to visualize zones of hydrolysis. When
Tweens are used as lipase substrates, clear zones are easy to observe (Shelley et al.
1987). Shelley et al. (1987) concluded that agar media can be useful for only screening
of lipase production, but not to measure lipase acitivity.

12
1.6.2. Dye-Based Methods
Lipolytic activity of microorganisms can also be detected by using specific dyes
like Victoria blue B, Spirit blue, Nile blue sulfate, and night blue. These dyes can be
used by either directly putting into the growth medium or applying to the plate after
incubation. In dye-based methods, indicator dyes must show a clear and distinguishable
color changes as a result of pH changes that occur due to the release of free fatty acids
from triacylglycerols during lipolysis. Various combinations of substrates like tributyrin
and tweens and dyes such as Victoria blue B and night blue can be used in these
methods (Thomson, et al. 1999). However, These substrates are not suitable to detect
true lipases because they are hydrolyzed by esterases, too. The formation of clear zones
around colonies against an opaque background on tributyrin agar lacking Victoria blue
B indicates lipolytic microbes, but in the presence of Victoria blue B lipolytic colonies
are surrounded by dark zones against an opaque, light blue background (Jones and
Richards 1952).
Microbial lipase activity can also be identified by using fluorogenic dye
Rhodamine B. The method containing Rhodamine B as an indicator of the presence of
lipase and olive oil as lipid substrate was firstly found by Kouker and Jaeger (1987).
Agar plates containing olive oil and rhodamine B are opaque and pink colored. Lipase
producing bacteria forms orange fluorescent halos around their colonies under UV light,
but lipase negative bacteria do not show orange fluorescence upon UV irradiation
(Kouker and Jaeger 1987). The fluorescence is related to the formation of a rhodamine
B-long chain fatty acid conjugate (Jaeger, et al. 1994). Methods used to find lipolytic
microbes with triacylglycerols and pH indicator dyes such as Victoria blue B are
sensitive to any pH changes and can inhibit the growth of some bacteria. The rhodamine
B plate method is not affected by pH changes and does not inhibit the growth of test
microorganism or change its physiological properties (Kouker and Jaeger 1987,
Thomson, et al. 1999).
1.7. Industrial Applications of Microbial Lipases
The global industrial enzyme market was about $ 2 billion in 2004 and is
estimated to reach nearly $ 2.4 billion in 2009. Lipases represent about % 4 of this

13
market and has been paid an increasing attention due to their biotechnological potential
(Hasan, et al. 2006).
Lipases as biocatalysts have many favourable properties that make them suitable
for specific applications compared with chemical catalysts. Lipase-catalyzed reactions
are higly specific because of their broad substrate specificity and high regio and/or
stereoselective features while chemical processes are typically more non-specific. Due
to the specificity of lipases, the production of unwanted products in the waste stream are
decreased or eliminated. Moreover, the use of enzymes decreases the side reactions and
make post-reaction separation problems simpler (Pandey, et al. 1999, Hasan, et al.
2006). Thus, it can be said that lipases are environmental friendly.
Additionally, lipases can carry out reactions under mild conditions of pH and
temperature and this reduces energy needs to direct reactions at unusual temperatures
and pressures. As a result, unstable reactants and products are protected from
destruction. Other reasons for biotechnological potential of microbial lipases are their
stability in organic solvents and being active without the aid of cofactors (Jaeger and
Reetz 1998).
The lipases can be employed in industry by cultivating lipase producing
microorganism in the medium containing a suitable substrate (especially in the food
industry), which is named in situ application or by using immobilized pure enzymes
(especially in the production of fine chemicals) called ex situ application (Pandey, et al.
1999).
1.7.1. Lipases in the Food Industry
Lipases have found broad applications in the modern food industry instead of
traditional chemical processes. Nowadays, lipases are commonly used in the production
of a variety of products like fruit juices, baked foods, fermented vegetables, cheese,
butter, dressings, soups and sauces.
Modification of lipids (oils and fats) is one of the important processes in food
industry. Some moities can be added to or deleted from triacylglycerols by lipase-
catalyzed specific reactions. Also, several esterification and transesterification reactions
can be carried out by lipases to form modified lipids. Especially regiospecific and fatty
acid specific microbial lipases have been used to convert oils into more nutritionally

14
valuable ones. Cheap oils could be improved to synthesize nutritionally important
modified triacylglycerols such as cocoa butter substitutes, triacylglycerols with low
calorie and oils containing high amounts of oleic acid (Hasan, et al. 2006). For instance
cocoa butter includes palmitic and stearic acids and has a melting point about 37°C that
makes it melt in the mouth. In 1976, Unilever found a method with a mixed hydrolysis
and synthesis reaction and produced a cocoa-butter substitute using an immobilized
lipase. This method based on an immobilized lipase from R. miehei is now used
commercially by Quest-Loders Croklaan. This lipase is responsible for a
transesterification reaction replacing palmitic acid in palm oil with stearic acid to form
the stearic- oleic- stearic triglyceride with the desired melting point for use in cholotae
(Sharma, et al. 2001, Jaeger and Reetz 1998).
Lipases are also used to give special flavour and taste to food by synthesis of
fatty acids and alcohols, which are accepted as flavour and fragrance compounds
(Gandhi 1997). In this case, lipases are commonly employed in dairy industry for the
hydrolysis of milk fat. Improvement of flavour in cheeses, the acceleration of cheese
ripening, the production of cheese like products and the lipolysis of butterfat and cream
is achieved by the help of lipase enzymes. Addition of lipases to such products
primarily releases short- chain (C4 and C6) fatty acids that form sharp flavour but the
release of medium- chain (C12 and C14) fatty acids leads to formation of a smooth taste
(Saxena, et al. 1999).
Lipases have been used to produce meat like fish meat without excess amount of
fat. The fat is removed during the processing of the fish meat by adding lipases and this
procedure is called biolipolysis (Sharma, et al. 2001, Seitz 1974).
1.7.2. Lipases in the Detergents
Lipases are largely employed as additives to detergents, which are used
commonly in household and industrial laundry and in household dishwashers.
Approximately 1000 tons of lipases are sold every year in this area. Lipases are
generally added to the detergents primarily in association with proteases and cellulases
(Pandey, et al. 1999). However, other enzymes such as amylases, peroxidases and
oxidases should be also included. Lipases catalyze the hydrolysis of fatty stains into

15
more hydrophilic parts that are easily removed than similar non-hydrolyzed stains
(Joseph, et al. 2007).
In 1994, the first commercial lipase was introduced by Novo Nordisk. This
lipase ,named LipolaseTM,was produced by the fungus T. Lanuginosus and expressed in
Aspergillus oryzae. In 1995, Genencor International produced two bacterial lipases,
which are Lumafast™ from Pseudomonas mendocina and Lipomax™ from
Pseudomonas alcaligenes (Jaeger and Reetz 1998).
To be a suitable additive in detergents, lipases should be both thermophilic (30-
60 °C) and alkalophilic (pH 10-11) and capable of functioning in the presence of the
various components of washing powder formulations like surfactants and proteases. In
addition, they should have wide substrate specifity to be able to hydrolyze fats of
various compositions (Sharma, et al. 2001, Jaeger and Reetz 1998). Lipases with these
properties can be identified by the aid of a combination of genetic and protein
engineering.
In addition to their application in laundry, lipases are also included in dish
washing, contact lens cleaning, degradation of organic wastes on the surface of exhaust
pipes and toilet bowls, and etc (Hasan, et al. 2006).
1.7.3. Lipases in Pulp and Paper Industry
Wood is the main source of paper and pulp industry and the presence of the
hydrophobic components (mainly triglycerides and waxes), also named pitch, in wood
causes serious problems in the production of paper and pulp. Lipases are used to remove
the pitch from pulp produced for paper making. In Japan, Nippon Paper Industries have
found a pitch control system to remove most of the wood triglycerides. This system is
based on the usage of a lipase from Candida rugosa (Jaeger and Reetz 1998).
1.7.4. Lipases in Leather Industry
The main processes in leather industry are the removal of subcutaneous fat and
dehairing. Conventional methods including organic solvents and surfactants to remove
fat from animal skins can be harmful to environment due to the production of dangerous
final products like volatile organic compound (VOC) emissions (Hasan, et al. 2006).

16
Usage of lipases in association with other hydrolytic enzymes like proteases is a new
approach in leather processing. Since the process is carried out at alkaline pH,
alkalophilic lipases are used in combination with alkaline or neutral proteases and other
necessary hydrolytic enzymes (Pandey, et al. 1999).
1.7.5. Lipases in Environmental Management
Employment of lipases in bioremediation processes is a new aspect in lipase
biotechnology. The wastes of lipid- processing factories and restaurants can be cleaned
by the help of lipases from different origins. In this sector, lipases could be used by
either ex situ or in situ (Pandey, et al. 1999).
1.7.6. Lipases as biosensors
Lipases have an ability to sense lipids and lipid-binding proteins. Therefore,
lipases can be manipulated as biosensors. The quantitative determination of
triacylglycerols especially in food industry and in clinical diagnosis is the most common
application of lipases as biosensors. In clinical diagnosis, lipases are used to form
glycerol from the triacylglycerol in the analytical sample and the released glycerol is
quantified by a chemical or enzymic method. It was shown that the patients with
cardiovascular complaints have been diagnosed very precisely by this principle.
Shoemaker et al. discovered a method including the use of microbial lipase. In this
method, the glycerol produced as a result of lipid hydrolysis was oxidized by glycerol
dehydrogenase. NADH formed during the reaction was measured by fluorescence
spectroscopy. Non- specific lipases are generally employed as biosensors (Pandey, et al.
1997).
1.7.7. Lipases in Pharmacy
Lipases are very commonly used in pharmaceutical industry because of its
regioselective property. Production of enantiomeric compounds, racemic esters,
catalysis of synthetic reactions, kinetic resolution process for the preparation of

17
optically active chiral compounds can be examples to the usage of lipases in
pharmaceutical industry. Especially, preparation of homochiral compounds that are used
against HIV and synthesis of anti-tumour agents, alkaloids, antibiotics and vitamins can
be said to be the vital applications of lipases (Jaeger and Eggert 2002).
1.8. The Aim of this Work
The primary goals of this thesis were to isolate and identify a lipase producing
bacterial strain from soil samples from Erciyes mountain in Kayseri, find and then
analyze the sequence of its lipase gene. Rhodamine B-olive oil screening system was
used to find lipase producers from soil samples. To identify the selected lipase producer
strain, 16S rRNA gene sequence analysis was applied as well as the some taxonomical
studies. Degenerate PCR and inverse PCR were performed to find the sequence of the
lipase gene. The other purposes of this study were determination of lipase production
conditions like optimum production time, partial purification and characterization of
native lipase enzyme. Purification was performed by ammonium sulfate precipitation
and gel filtration. Spectrophotometric extracellular lipase assay was used for enzyme
characterization.

18
CHAPTER 2
MATERIALS AND METHODS
2.1. Materials
A detailed list of commonly used chemicals, buffers, solutions and their
compositions are presented in Appendix C.
2.2. Methods
2.2.1. Selection of a Lipase Producer Bacterial Strain From a Soil Sample
A soil sample was collected from Erciyes Mountain in Kayseri in september
2006. This soil sample was diluted several times with Luria-Bertani (LB) broth and
diluted soil mixtures were plated on agar plates of Luria-Bertani (LB) medium (1%
tryptone, 0.5% yeast extract, 0.5% NaCl, 1% gellan gum, pH 7.2) supplemented with 1% v/v olive oil (Applichem) as substrate and 1% rhodamine B solution (0.1% w/v)
(Applichem). Lipase producing strains were identified on spread plates after several
days incubation at 25 °C by the formation of orange fluorescent halos around the
colonies monitored by fluorescence with UV light at 350 nm. A strain showing the
highest lipolytic activity was picked out for further study. This selected strain was
plated on fresh LB agar to obtain pure cultures and grown at several temperatures as
well as 25°C to identify its growth and lipase production temperature range using LB
agar alone and supplemented with olive oil and rhodamine B. At the same time the
positive control with commercial lipase from porcine pancreas (Applichem) and the
negative control with E.coli were made using rhodamine B-olive oil LB plates. These
two control groups were incubated overnight at 37 °C.

19
2.2.2. Genetic Identification of Isolated Strain by PCR Amplification of Partial 16S rRNA Gene
Total genomic DNA of the strain was isolated by CTAB/NACI method
(Jaufeerally-Fakim and Dookun 2000) which consists of chemical lysis with detergent,
incubation with a nonspecific protease, followed by a CTAB extraction in which CTAB
complexes both with polysaccharides and with residual protein. This procedure is very
effective in producing high quality chromosomal DNA from a variety of gram-negative
bacteria, all of which normally produce large amounts of polysaccharides (Wilson
2001). 30 ml of 24 hour bacterial culture (OD600 :1) grown at 25 °C with shaking (200
rpm) was used for the genomic DNA isolation. Isolated genomic DNA concentration
measured visually after electrophoresis in 1% agarose gel.
16S rRNA gene of isolated strain was amplified from its genomic DNA using a
pair of universal bacterial primer, E334F (5’ CCAGACTCCTACGGGAGGCAG 3’) as
forward primer and E1115R (5’CAACGAGCGCAACCCT3’) as reverse primer. PCR
was performed as follows: genomic DNA ( 100 ng/ μl ) 1 μl, E334F- E1115R primers
(10 μM) 1 μl each, 25 μl 2X PCR master mix (Fermentas) and 22 μl dH2O were mixed
in a total volume of 50 μl. The conditions for PCR amplification were as follows : an
initial denaturation step at 94 °C for 2 minutes; followed by 25 cycles including
denaturation at 94°C for 30 seconds , primer annealing at 62°C for 30 seconds and
elongation at 72°C for 1 minute and also final elongation at 72°C for 5 minutes. PCR
products were visualized by agarose gel electrophoresis and purified by PCR
purification Kit (Qiagen). The amplified and purified 16S rDNA fragment was cloned
into the pTZ57R/T cloning vector (Fermentas), used as TA cloning vector for PCR
product amplified with taq polymerase, according to the manufacturer’s instructions.
E.coli Dh5α competent cells were transformed with pTZ57R/T- amplified 16S rDNA
fragment via heat-shock method. Transformation mixtures were plated on LB plates
containing 100 µg/ml ampicillin, 0.5 mM IPTG and 80 µg/ml X-Gal and incubated
overnight at 37°C. Recombinant clones were identified by blue-white screening. Clones
that contain PCR product produce white colonies in most cases. White colonies were
chosen for colony PCR to verify the insert presence in the vector. Plasmid specific
primers M13F (5’gtaaaacgacggccagt 3’) and M13R (5’caggaaacagctatgacc 3’) were
used in colony PCR. The PCR reaction mixture included 12.5 µl 2X PCR Master Mix
(Fermentas), 1 µl of M13F (10µM), 1 µl of M13R Primer (10µM), 10.5 µl dH2O and

20
white colonies that picked up from plates via pipette tip and suspended into 25 µl PCR
reaction mixture. The conditions for PCR amplification were as follows: 94°C /2 min;
94°C /1 min, 55°C /1 min, 72°C /1 min for 25 cycles; 72°C /5 min; hold at 4°C. The
positive clones based on the result of colony PCR were selected and pTZ57R/T-16S
rDNA plasmids were isolated from overnight cultures of positive clones using GeneJet
Plasmid Miniprep Kit (Fermentas). All steps in plasmid isolation were carried out
according to the manufacturer’s instructions. Finally purified plasmids were sequenced
with vector (pTZ57R/T) specific primers (M13F and M13R) to determine the sequence
of the cloned DNA fragments. Blast searches (National Center for Biotechnology
Information, NCBI) were performed on the DNA sequence to determine the most
closely related 16S rRNA species and to further testify the subfamily of the lipase from
the experimental strain. A phylogenetic tree was also made based on the homology of
known 16S rRNA sequences deposited in GenBank.
2.2.3. Design of an E.coli Expression Vector
PUC19 cloning vector was used as a starting template to design of an inducible
E.coli expression vector by PCR-based cloning. For this purpose, a pair of specific
primer was designed to remove lacZ structural gene except the inducible lac promoter
from PUC19 vector. These primers were named PUC5’ (5’ CTG ATA TCG GAT CCT
AGC TGT TTC CTG TGT G 3’) (The underlined and the thick sequences are ECORV
and BamHI restriction sites, respectively) and PUC3’ (5’ CTG ATA TCG AAT TCG
GTG GCA CTT TTC GGG 3’) (The underlined and the thick sequences are ECORV
and ECORI restriction sites, respectively). PCR was performed in a total reaction
volume of 50 µl containing 25 µl 2X PCR master mix (Fermentas), 1 µl PUC5’ (20
µM), 1µl PUC3’ (20 µM) and 1 µl PUC19 (100ng). PCR cycles were as follows: 94°C
/2 min; 94°C /30 s min, 55°C /30 s, 72°C /2.5 min for 30 cycles; 72°C /5 min; hold at
4°C. Amplified products were run on a 1% agarose gel to control its size. PCR product
was cleaned using High Pure PCR Purification Kit (Roche) and blunted with a
thermostable DNA blunting enzyme (Genejet PCR cloning Kit, Fermentas). These two
reactions were carried out according to the manufacturer’s instructions. Self
circularization of blunt ended linear PCR fragment was performed using T4 DNA ligase
and E.coli Dh5α competent cells were transformed with the resulting mixture.

21
Transformation mixture was inoculated on LB plates with ampicillin. Colonies were
controlled by colony PCR after overnight incubation at 37°C. Colony PCR was
performed using M13R and PUC5’ primers. PCR cycles were 94°C /2 min; 94°C /30 s,
55°C /30 s, 72°C /2.5 min for 30 cycles; 72°C/5 min; hold at 4°C. PCR product size was
checked by 1% agarose gel. The expected plasmid based on gel result was isolated
from overnight E.coli cultures using plasmid isolation kit (Roche). Furthermore, the
isolated plasmid was digested with TaqI, ECORV and Cfr113I enzymes to control
whether it was correct one or not. PUC19 was also digested with the same enzymes to
compare two plasmid restriction results.
2.2.3.1 Control the Expression Capacity of the Designed Plasmid
In order to check whether the designed plasmid has the ability to express any
gene inserted in it, the tetracycline resistance gene open reading frame (orf), 1210 bp,
from pBR322 cloning vector was amplified by a PCR with the primer set, tet5’ ( 5’ tcg
aga tct atg aaa tct aac aat gcg c 3’) and tet3’ (tcg gaa ttc tca ggt cga ggt ggc c 5’),
containing restriction enzyme sites of the italic letters with Bgl II/EcoRI, respectively.
PCR was run with the following conditions: an initial denaturation at 94°C for 2 min,
denaturation at 94°C 30 s, annealing at 65°C for 30 s and an extension step at 72°C for
2 min. The sequence was repeated 25 times followed by a 5-min final extension step at
72°C. PCR result was evaluated by 1% agarose gel and PCR product was purified with
commercial kit (Invitrogen). The pure tetracyline gene fragment was cloned into TA
cloning vector (pTZ57R/T, Fermentas) following the protocol in kit and E.coli Dh5α
competent cells were used as host cells. Following transformation, blue-white screening
was performed and white colonies were picked up for colony PCR to control insert
presence. In colony PCR tet5’ and tet3’ primers were used so the colony PCR cycles
were same as described above. Positive plasmid construct (pTZ57R/T- tet gene) was
isolated using GeneJET Plasmid Miniprep Kit (Fermentas) and tetracyline gene was
removed from the construct via EcoRI/BglII double digestion and then ligated into
EcoRI/BamHI digested newly designed expression vector and transformed into E.coli
Dh5α. The E. coli transformed with this plasmid was plated on both LB agar containing
(12.5 µg/ml) tetracycline plus 0.5 mM IPTG and only tetracyline. Plates were evaluated
after overnight incubation at 37°C. Colony PCR was also performed to control the
22
presence of tetracyline gene using tet5’ and tet3’ primers with the same PCR conditions
as mentioned above.
2.2.4. PCR Amplification, Cloning, and Sequence Analysis of Lipase Gene from Pseudomonas sp. KE38
For initial cloning of part of the lipase gene from the experimental strain,
complete lipase gene sequences from 53 different Pseudomonas strains were
downloaded from the Entrez Search and Retrieval System at the National Center for
Biotechnology Information (NCBI), they were aligned using ClustalW and a
phylogenetic tree was constructed. 23 different Pseudomonas fluorescens lipases were
selected from this tree and they were aligned using ClustalW program. According to the
aligment result, a set of degenerate primers LIPPFF, 5’-ATG GGT ITN TIY GAC
TAY AAI AAC-3’ and LIPPRR, 5’-GCG TAR TGR TCG TTG AAG ITG ACG ATR-
3’ was constructed at higly conserved regions in the lipases. PCR amplification was
performed in a 25 μl volume containing 10 ng of DNA template, 5 μM of each primer
and 12.5 μl 2X PCR master mix. The reaction mixture was subjected to 30 cycles of
amplification with the following conditions: 94°C/ 2 min for denaturing, 45°C/55°C
(temperature gradient) for 1 min for annealing, 72°C/1 min for extension and 72°C/5
min for final extension. Purified PCR product was cloned into pTZ57R/T prior to
sequencing. Ligation mixture was transformed into E.coli Dh5α competent cells. After
colony PCR, the recombinant plasmids were purified with the GeneJET Plasmid
Miniprep Kit and sequenced at the Biotechnology and Bioengineering Central Research
Laboratories, Izmir Institute of Technology. Homology analysis using BLAST was
performed on the obtained partial sequence. Also, partial amino acid sequence was
analyzed using UniProt/EBI.
The rest of the lipase gene was tried to be obtained by performing a kind of PCR
method called inverse PCR. Inverse PCR resembles the PCR, but it uses the primers
oriented in the reverse direction. These primers must be synthesized from known
sequences. The template for the inverse PCR is the self-circulated genomic DNA
fragments digested with suitable restriction enzymes that have no restriction sites within
the known sequence.. In this method, the DNA regions that flank a known DNA
sequence can be amplified (Ochman, et al. 1988).

23
Based on the sequence of the DNA fragment, three pairs of primers, lip3/lip4,
lip5/lip6 and lip7/lip8, for inverse PCR were constructed in the opposite direction. The
sequences and the positions of these primers were given in Appendix B. Partial lipase
fragment was analyzed to find appropriate restriction enzymes using Clone Manager 5
software. Through this analysis, PstI, HindIII and SmaI enzymes were chosen. The
genomic DNA (20 μg) of the strain was subjected to restriction enzyme digestion by
these enzymes (10 units each). Digested DNA was purified and self-circulated by T4
DNA ligase. Three Inverse PCR reactions were performed with lip3/lip4, lip5/lip6 and
lip7/lip8 primer pairs using the circularized, digested genomic DNA as template. These
three reactions were subjected to predenature for 5 min at 94°C, and then the following
30 cycles were carried out: 94°C for 30 s, 55°C for 1 min, 72°C for 2 min, and finally
72°C for 5 min. The amplified DNA was sequenced and analyzed.
2.2.5. Purification and Characterization of Lipase from Pseudomonas sp. KE38
2.2.5.1. Determination of Optimum Lipase Production Time and Carbon Source
To increase the inoculum size for enzyme production, Pseudomonas sp. KE38
was grown at 25°C under shaking (200 rpm) for 24 hour in 10 ml minimal medium
supplemented with %1 (v/v) olive oil as lipase substrate and sole carbon source. 2 ml of
the seed culture was transferred into a 500 ml flask containing 200 ml minimal medium
with %1 (v/v) olive oil and grown at 25°C with shaking (200 rpm) for 1 to 5 days.
Aliquots of the culture broth were withdrawn at each day and harvested (10,000g, at
4°C for 30 min) to determine the optimum time for lipase production. The supernatants
were used for measurement of lipase activity.
To monitor the effect of glucose, olive oil and their combination on the
production of lipase, 4 ml of %20 (w/v) glucose solution, %1 (v/v) olive oil and both
glucose and olive oil were added to 200 ml minimal medium seperately. Pseudomonas
sp. KE38 was grown on these three media at 25°C with shaking (200 rpm) for 4 days.
After incubation, all cultures were harvested at 10,000 g for 30 min. The cell free
supernatants were subjected to lipase assay described below.
24
2.2.5.2. Partial Purification of KE38 Lipase
After the determination of optimum lipase production time and suitable carbon
source, Pseudomonas sp. KE38 was cultured at 25°C with shaking (200 rpm) for 4 days
in 200 ml minimal medium plus %1 (v/v) olive oil. After incubation, the culture broth
was centrifuged (10,000g, at 4°C for 30 min) and the cell-free culture supernatant was
collected. The supernatant was passed through a 0.22 μm filter to remove any remaining
cells. This filtrate was called as crude lipase. The obtained crude lipase was partially
purified by ammonium sulfate precipitation and Sephadex G-100 size-exclusion
chromatography.
In ammonium sulfate precipitation, sufficient amount of solid ammonium sulfate
was added slowly to crude enzyme mixture (200 ml) until % 30 saturation (w/v) with
stirring at 4°C. The mixture was allowed to stand overnight at 4°C with gentle stirring
and then centrifuged at 4°C and 10.000g for 30 min. The precipitate was dissolved in 3
ml of 50 mM Tris-HCl buffer, pH 8.0. This solution was loaded on Sephadex G-100
column equilibrated with 50 mM Tris-HCl buffer, pH 8.0 and fractions were collected.
Spectrophotometric lipase assay described below (at 25°C) was applied to all fractions
to find lipase-containing ones. Fractions contained lipase were combined and used for
enzyme characterization.
2.2.5.3. Characterization of Partially Purified Lipase Enzyme
Lipase assay: Lipase activity was measured by spectrophotometer using p-
nitrophenyl laurate as substrate. In this assay, amount of released p-nitrophenyl was
measured at 400 nm. The reaction mixture contained 980 µl 100 mM sodium phosphate
buffer including 150 mM sodium chloride and % 0,5 triton X-100, pH 7,2, 10 µl 50 mM p-nitrophenyl laurate and finally 10 µl enzyme solution. Blank contained the same
components except enzyme solution.

25
2.2.5.3.1. Effect of Temperature and pH on Lipase Activity
The optimum temperature for lipase activity was determined by incubating the
assay mixture described above at different temperatures between 4°C and 65°C for 2
hours at 10°C intervals and the resulting enzyme activity was measured
spectrophotometrically at 400 nm based on the release of p-nitrophenyl.
In order to find the pH profiling of lipase activity, sodium acetate buffer (pH 3-
5), potassium phosphate buffer (pH 5-7), tris-HCL buffer (pH 7-9) and glycine-NaOH
buffer (pH 9-12) were selected. All buffers were at 50 mM concentration. The assay
mixture (980 µl each buffer, 10 µl 50 mM p-nitrophenyl laurate and 10 µl enzyme
solution) was incubated at 45°C for 2 hours in different pH values of above buffers and
the enzyme activity was determined by spectrophotometric lipase assay.
2.2.5.3.2. SDS-PAGE and Native PAGE
The molecular mass of partially purified KE38 lipase was determined by SDS-
PAGE according to the protocol of Laemmli (1970). %12 polyacrylamide gel (resolving
gel) was used together with % 4 stacking gel. Lipase containing (7) fractions were
loaded on SDS gel. Electrophoresis was performed at 65 volts for 30 minutes and then
105 volts for 2 hours. Gels were stained with Bromophenol Blue overnight. Spectra™
Multicolor Broad Range Protein Ladder (Fermentas) was used as molecular mass
marker.
Native PAGE (% 7.5 resolving gel together with % 4 stacking gel) was also
performed to observe native lipase enzyme via activity staining. Plates containing
rhodamine-B solution, %1 (v/v) olive oil and % 1 (w/v) gellan gum were prepared for
activity staining. The gel was placed on the plates after running the native PAGE. In
native PAGE, same SDS-PAGE procedure was followed without using SDS in required
steps. Also, the protein samples were not boiled before loading them on the gel and the
sample buffer solution did not contain 2-mercaptoethanol. The running conditions for
native gel was same with the SDS-PAGE.

26
CHAPTER 3
RESULTS AND DISCUSSION
3.1. Isolation and Identification of a Lipase Positive Bacterium from Erciyes Soil Sample
A soil sample taken from Erciyes Mountain in Kayseri was examined for the
presence of lipase positive strains using a screening method suitable for detection of
lipase producers as described in materials and methods. Lipase producer strains in the
soil were identified by the formation of orange fluorescent halos around the colonies
when olive oil-rhodamine B spread plates incubated at 25°C were exposed to UV light
at 350 nm. Olive oil is used as lipase substrate and rhodamine B is the indicator of
lipase activitiy. The fluorescence is related to the formation of a rhodamine B-long
chain fatty acid conjugate in this method, but the mechanism underlined this situation is
not known (Jaeger, et al. 1994). Several bacteria were screened and a strain was selected
as the most effective producer of lipase because it formed the largest halo. Selected
strain was plated on LB agar alone and LB agar including olive oil and rhodamine B
and incubated at temperatures other than 25°C to identify its growth and lipase
production temperature range. As a result, it was found that the optimal and highest
temperatures for growth of strain were 25°C and 30°C and also it exhibited sigmoidal
growth even at +4°C. It was not able to grow at temperatures higher than 30°C. So, it
can be concluded that the experimental strain is a psychrotrophic bacterium which is not
fully adapted to the cold and have an upper growth limit at temperatures >20°C
(Gerday, et al. 2000). Furthermore, the lipase activity was detected only when the strain
was grown at temperatures between +4°C and 25 °C (Figure 3.1). No activity could be
detected when cells were grown at 30°C. However, its growth and lipase production
took longer time with decreasing temperatures.
On solid media, it formed yellowish-white, smooth, mucoid and large colonies.
Taxonomical studies on lipase-producing strain showed that the strain is gram-negative,
rod-shaped, aerobic, catalase and oxidase-positive. From these results, this strain was
classified into the genus of Pseudomonas according to Bergey’s manual.

27
To be able to control whether rhodamine B plates works or not, positive control
with commercial lipase and negative control with E.coli known as lipase-negative
(Jaeger, et al. 1999) were also made and their results showed that this lipase screening
system works efficiently (Figure 3.2).
Figure 3.1. Photos of selected lipase positive strain under UV light, grown at 25 °C and 4 °C, respectively
Figure 3.2. Positive and negative controls under UV light
To identify the experimental strain exactly according to 16S rRNA sequence
analysis as well as taxonomical studies, genomic DNA of the strain was used as
template to amplify partial 16S rRNA using universal bacterial primer pairs, E334 and
E1115 (Figure 3.3) and amplified fragments were cloned into pTZ57R/T cloning vector.
False-positive clones were eliminated by colony PCR using vector specific primers and
the expected length of fragment (~780 bp) was observed in 1% gel electrophoresis

28
(Figure 3.4). The chosen positive clones were sequenced. Finally, the obtained partial
16S rRNA sequence of this strain was analyzed with BLASTn. It was found to have 95-
98% identity with different strains of Pseudomonas fluorescens. Among them, it
showed high similarity (%98) with Pseudomonas fluorescens WR3-08 and
Pseudomonas fluorescens CTS22. However, no strain identical to isolated strain could
be found. So the strain was named as Pseudomonas sp. KE38. The sequence of
amplified partial region of 16S rRNA gene of identified bacterial strain was given in
Appendix A. A phylogenetic tree was also constructed based on the homology of
known 16S rRNA sequences (Figure 3.5).
1 2
Figure 3.3. Agarose gel analysis of PCR amplified partial 16S rRNA gene region of the experimental strain. Line 1: 1 kb DNA size marker (Fermentas) ( 250, 500, 750, 1000, 1500 bp….). Line 2: ~780 bp PCR product
Figure 3.4. Colony PCR result. Line 1: 1 kb DNA size marker (Fermentas). Line 2: ~780 bp insert (16S rRNA gene)
29
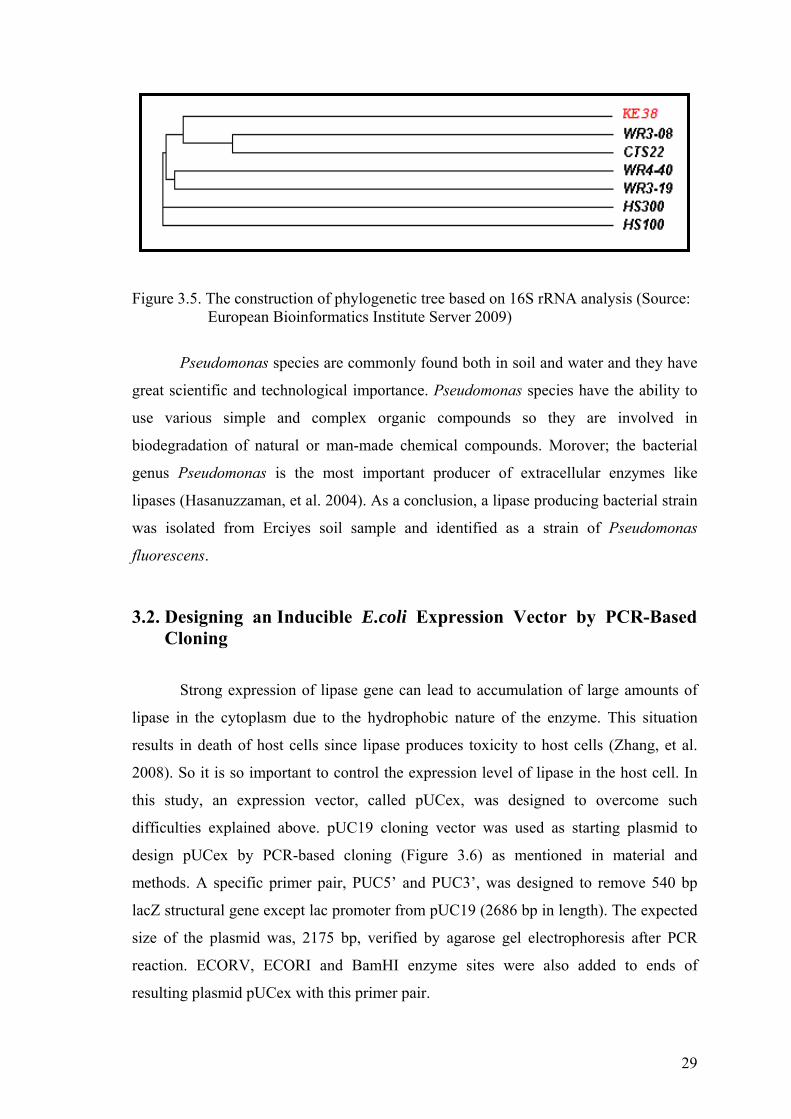
Figure 3.5. The construction of phylogenetic tree based on 16S rRNA analysis (Source: European Bioinformatics Institute Server 2009)
Pseudomonas species are commonly found both in soil and water and they have
great scientific and technological importance. Pseudomonas species have the ability to
use various simple and complex organic compounds so they are involved in
biodegradation of natural or man-made chemical compounds. Morover; the bacterial
genus Pseudomonas is the most important producer of extracellular enzymes like
lipases (Hasanuzzaman, et al. 2004). As a conclusion, a lipase producing bacterial strain
was isolated from Erciyes soil sample and identified as a strain of Pseudomonas
fluorescens.
3.2. Designing an Inducible E.coli Expression Vector by PCR-Based Cloning
Strong expression of lipase gene can lead to accumulation of large amounts of
lipase in the cytoplasm due to the hydrophobic nature of the enzyme. This situation
results in death of host cells since lipase produces toxicity to host cells (Zhang, et al.
2008). So it is so important to control the expression level of lipase in the host cell. In
this study, an expression vector, called pUCex, was designed to overcome such
difficulties explained above. pUC19 cloning vector was used as starting plasmid to
design pUCex by PCR-based cloning (Figure 3.6) as mentioned in material and
methods. A specific primer pair, PUC5’ and PUC3’, was designed to remove 540 bp
lacZ structural gene except lac promoter from pUC19 (2686 bp in length). The expected
size of the plasmid was, 2175 bp, verified by agarose gel electrophoresis after PCR
reaction. ECORV, ECORI and BamHI enzyme sites were also added to ends of
resulting plasmid pUCex with this primer pair.

30
Figure 3.6. Construction of pUCex by PCR-based cloning
After making the amplified fragment blunt-ended and self-circulated, E.coli
Dh5α cells transformed with the ligation mixture. Colonies grown on LB agar with
ampicillin were checked by colony PCR using M13R and PUC5’ primers. This primer
pair was used to understand whether obtained colonies were really the new plasmid or
not because PCR with this primer pair amplifies both pUCex and pUC19. However,
PCRs including these two plasmids as template gave bands with different sizes, 2175 bp
for the new plasmid and 2686 bp for pUC19. According to the colony PCR result, only
one colony was positive. The plasmid isolated from this colony was also verified by
digesting it with TaqI, ECORV and Cfr113I enzymes. The restriction profile of pUCex
was compared with pUC19 digested with the same enzymes and the newly designed
plasmid was the expected one according to the restriction profile.
This plasmid is an IPTG inducible plasmid due to the presence of lac promoter
so expression level of a gene cloned into it can be controlled via increasing or
decreasing amount of IPTG. To contol whether pUCex express any gene or not,
tetracyline gene from pBR322 was cloned into ECORI/BamHI site of it as mentioned in
material and methods and expression was observed on LB plates with IPTG and
tetracyline since the transformants were cabaple of growing in the presence of
tetracyline. It means that the pUCex expressed tetracyline gene successfully. Growing
pUC19
2686
EcoRITaqISacIKpnIEco88ISmaIBamHIXbaIHincIISalIXmiITaqIPstIHindIII
lacZ
ori
amp pUCex2175 bps
EcoRVBamHIEcoRI
EcoRV
lacP
ori
amp
Removal of lacZ gene (540 bp)
except its promoter

31
colonies on tetracyline plates were also checked by colony PCR in the means of insert
presence (Figure 3.7) and all selected colonies contained the tetracyline gene. Also,
there was little or no expression in the absence of IPTG on tetracyline plates. It also
showed that pUCex was an IPTG inducible expression vector.
Figure 3.7. Control the presence of tetracyline gene cloned into pUCex by colony PCR. Line 1: 1 kb DNA size marker (Fermentas) Line 2: The tetracyline gene
3.3. Cloning and Sequence Analysis of a Partial Lipase Gene from a Psychrotrophic Pseudomonas sp. KE38
A pair of degenerated oligonucleotide primers (LIPPFF and LIPPRR) was
carefully designed based on the higly conserved regions in the 23 different
Pseudomonas fluorescens lipases which were chosen according to the tree (B part)
constructed using lipases from 53 different Pseudomonas strains (Figure 3.8). This tree
was constructed to be able to group and differentiate these lipases. Especially, P.
fluorescens lipases were selected because 16S rRNA sequence of the strain showed high
homology (%98) with Pseudomonas fluorescens WR3-08 and Pseudomonas
fluorescens CTS22. Most of the lipases from P. fluorescens strains belong to group 3
lipases. Therefore, the strain has been suggested as a member of Pseudomonas group 3
lipase. Detailed information about group 3 lipases was given in section 1.5. The
conserved regions were identified as a result of aligment procedure using ClustalW
(Figure 3.9).

32
Figure 3.8. Phylogenetic tree predicted from sequence aligment of lipases from 53 different Pseudomonas strains.A: Lipases from P. aeruginosa, P. alcaligenes P. fragi and P. wisconsinensis B: Lipases from P.fluorescens strains. Lipases were represented with their accession numbers
A
B

33
LIPPFF ****** * * ***** ** *** 1 ATGGGTATCTTTGACTATAAAAAC.............TATCGTCAGCTTCAACGACCACTACGCCTCGACGCTGTGGAATATCCTGCCGTTTTCGATCGTCAACCTGCCGACCTGGGTCT--- 2 ATGGGTATCTTTGACTATAAAAAC.............CATCGTCAGCTTCAACGACCACTACGCCTCGACCCTGTGGAATGTGCTGCCGTTCTCCATCGTCAACCTGCCGACCTGGGTCT--- 3 ATGGGTATCTTTGACTATAAAAAC.............CATCGTCAGCTTCAACGACCACTACGCCTCGACGCTGTGGAATGTGCTGCCGTTTTCCATCGTCAACCTGCCCACCTGGGTCT--- 4 ATGGGTATCTTTGACTATAAAAAC.............CATCGTCAGCTTCAACGACCACTACGCCTCGACGCTGTGGAATGTGCTGCCGTTTTCCATCGTCAACCTGCCCACCTGGGTCT--- 5 ATGGGTGTCTTTGACTATAAAAAC.............TATCGTCAGCTTCAACGATCACTATGCGTCGACGCTGTGGAATGTCCTGCCGTTTTCCATCGTCAATGTGCCGACCTGGATCT--- 6 ATGGGTATCTTTGACTATAAAAAC.............TATCGTCAGCTTCAACGACCACTACGCCTCAACGCTGTGGAATGTGTTGCCGTTCTCCATCGTCAACCTGCCGACCTGGGTTT--- 7 ATGGGTGTATTCGACTATAAAAAC.............TATCGTCAGCTTCAACGACCATTACGCCTCGACGCTGTGGAATGTGCTGCCGTTTTCCATCACCAACCTGCCGACCTGGATCT--- 8 ATGGGTGTATTCGACTATAAAAAC.............TATCGTCAGCTTCAACGACCATTACGCCTCGACGCTGTGGAATGTGCTGCCGTTTTCCATCACCAACCTGCCGACCTGGATCT--- 9 ATGGGTGTATTCGACTATAAAAAC.............TATCGTCAGCTTCAACGACCATTACGCCTCGACGCTCTGGAATGTGCTGCCGTTTTCCATCACCAACCTGCCGACCTGGATCT--- 10 ATGGGTGTGTTCGACTATAAAAAC.............TATCGTCAGCTTCAACGACCACTACGCCTCGACGTTGTGGAATGTGCTGCCGTTTTCCATCACCAACCTGCCGACCTGGATCT--- 11 ATGGGTGTATTTGACTACAAGAAC.............CATCGTCAGCTTCAACGACCACTACGCCTCGACGTTGTGGAATGTGCTGCCGTTTTCCATCGCCAACCTGTCGACCTGGGTGT--- 12 ATGGGTGTATTTGACTACAAGAAC.............CATCGTCAGCTTCAACGACCACTACGCCTCGACGTTGTGGAATGTGCTGCCGTTTTCCATCGCCAACCTGTCGACCTGGGTGT--- 13 ATGGGTGTATTTGACTACAAGAAC.............CATCGTCAGCTTCAACGACCACTACGCCTCGACGTTGTGGAATGTGCTGCCGTTTTCCATCGCCAACCTGTCGACCTGGGTGT--- 14 ATGGGTATCTTTGACTATAAAAAC.............CATTGTCAGTTTGAACGATCACTACGCCTCATCCCTGTGGAACGTGCTGCCGTTTTCCATCCTCAACCTGCCCACTTGGGTTT--- 15 ATGGGTGTGTATGACTACAAGAAC.............CATCGTCAGCTTCAACGATCACTACGCCTCGACCGCGTGGAATCTGCTGCCGTTCTCGATTCTCAATATCCCGACCTGGATCT--- 16 ATGGGTGTGTATGACTACAAGAAC.............CATCGTCAGCTTCCACGATCACTACGCCTCGACCGCGTGGAATCTGCTGCCGTTCTCCATTCTCAACATCCCGACCTGGATCT--- 17 ATGGGTGTGTATGACTACAAAAAC.............CATCGTCAGCTTCAACGATCACTACGCCTCGACGGCGTGGAATCTGCTGCCGTTCTCCATCCTCAACATCCCGACCTGGATCT--- 18 ATGGGTGTGTATGACTACAAGAAC.............CATCGTCAGCTTCAACGACCACTACGCCTCGGCGGCGTGGAACGTGCTGCCGTTCTCGATCGTCAACATTCCGACCTGGATCT--- 19 ATGGGTGTGTATGACTACAAGAAC.............CATCGTCAGCTTCAACGACCACTACGCCTCGGCGGCGTGGAACGTGCTGCCGTTCTCGATCGTCAACATTCCGACCTGGATCT--- 20 ATGGGTGTATACGACTACAAGAAC.............TATCGTCAGCTTCAACGATCACTACGCCTCGAACGCCTGGAACGTGCTGCCGTATTCGATCCTGAACATTCCGACGTGGATTT--- 21 ATGGGTGTGTATGACTACAAGAAC.............CATCGTCAGCTTCAACGATCACTACGCCTCGACCGCATGGAATGTGCTGCCGTTCTCCATCCTCAACATCCCGACCTGGATCT--- 22 ATGGGTGTCTTTGACTACAAGAAC.............CATCGTCAACTTCAACGACCATTACGCCTCGACCCTGTGGAACGTGCTGCCGTTCTCGATCCTCAACATCCCCACCTGGATTT--- 23 ATGGGTGTGTTAGACTACAAGAAC.............CATCGTCAACTTCAACGAGCACTATGCGTCGACCCTGGAGAACCTGCTGCCGCAGAGCATCCTCAACCCGCTGTCGTGGAAGG--- ** **** ** ***** ** ** ** ** *** * ***** ** ** * *** LIPPRR Figure 3.9. Design the degenerate primers LIPPFF and LIPPRR by multiple aligment of 23 different Pseudomonas fluorescens lipases.
1. P.fluorescens lipase (lipB68), 2. P.fluorescens lipase (lip), 3. P.fluorescens PrtB (prtB) and lipase (lipA), 4. P.fluorescens lipase (M86350), 5. P.fluorescens gene for lipase (AB009011), 6. Uncultured Pseudomonas sp. lipase (lipJ03), 7. Uncultured Pseudomonas sp. Lipase (lipJ02), 8. Pseudomonas sp. Lipase (M74125), 9. P.fluorescens lipase gene (AY304500), 10. Pseudomonas sp. KB700A KB-lip gene for lipase, 11. P.fluorescens gene for triacylglycerol lipase, 12. P.fluorescens,W1, lipase, 13. P.fluorescens PrtA, protease inhibitor Inh, ABC transporter TliD (tliD), ABC transporter TliE (tliE), ABC transporter TliF (tliF), and thermostable lipase TliA (tliA) genes, 14. P.fluorescens polyurethanase lipase A, 15. Pseudomonas sp. MIS38 gene for lipase, 16. P.fluorescens lipase (lipB) gene 17. P.fluorescens lipA gene for lipase, 18. P. fluorescens lipase (lipB52) gene, 19. P.fluorescens lipase (lipB41) gene, 20. P.fluorescens strain 26-2 lipase class 3 gene, 21. Pseudomonas sp. 7323 lipase gene, 22. Pseudomonas sp. JZ-2003 lipase gene, 23. Pseudomonas sp. lip35 lipase33

34
Forward primer including initiation codon ATG was designed according to the
relative high similarity at N-termination. Using these primers, a band of about 879 bp
length was amplified from the chromosomal DNA of Pseudomonas sp. KE38 (Figure
3.10). Temperature gradient (45°C/55°C) PCR was performed due to the degeneracy of
the primer pair. As is seen in Figure 3.9, the primer pair amplified the target sequence
perfectly (there was no non-specific binding) at all temperatures between 45°C and
55°C. The amplified fragment was cloned into pTZ57R/T prior to sequencing. After
sequencing with plasmid-specific M13F and M13R primers, obtained sequence was
examined and sequence aligment by BLAST confirmed that the cloned 879 nucleotide
fragment belonged to a lipase gene. The partial sequence of cloned fragment was given
in Appendix A.
55°C 45°C
Figure 3.10. The partial lipase fragment amplified by temperature gradient PCR using degenarate primers, LIPPFF and LIPPRR.
A search for homology in protein and gene banks (UniProtKB for proteins and
GenBank/NCBI for genes) indicated that the partial nucleotide and aminoacid sequence
of lipase had high similarity with lipases classified in group 3 lipases as suggested
before. This partial lipase was % 92 identical to Pseudomonas sp. 7323 lipase, % 90
identical to both Pseudomonas sp. MIS38 lipase and Pseudomonas sp. UB48 lipase, %
88 identical to P. fluorescens PfO-1 lipase, and % 79 identical to Pseudomonas sp.
KB700A lipase (Figure 3.11 and Figure 3.12). The deduced aminoacid sequence
contained a lipase consensus sequence, GHSLGG, which is most conserved in
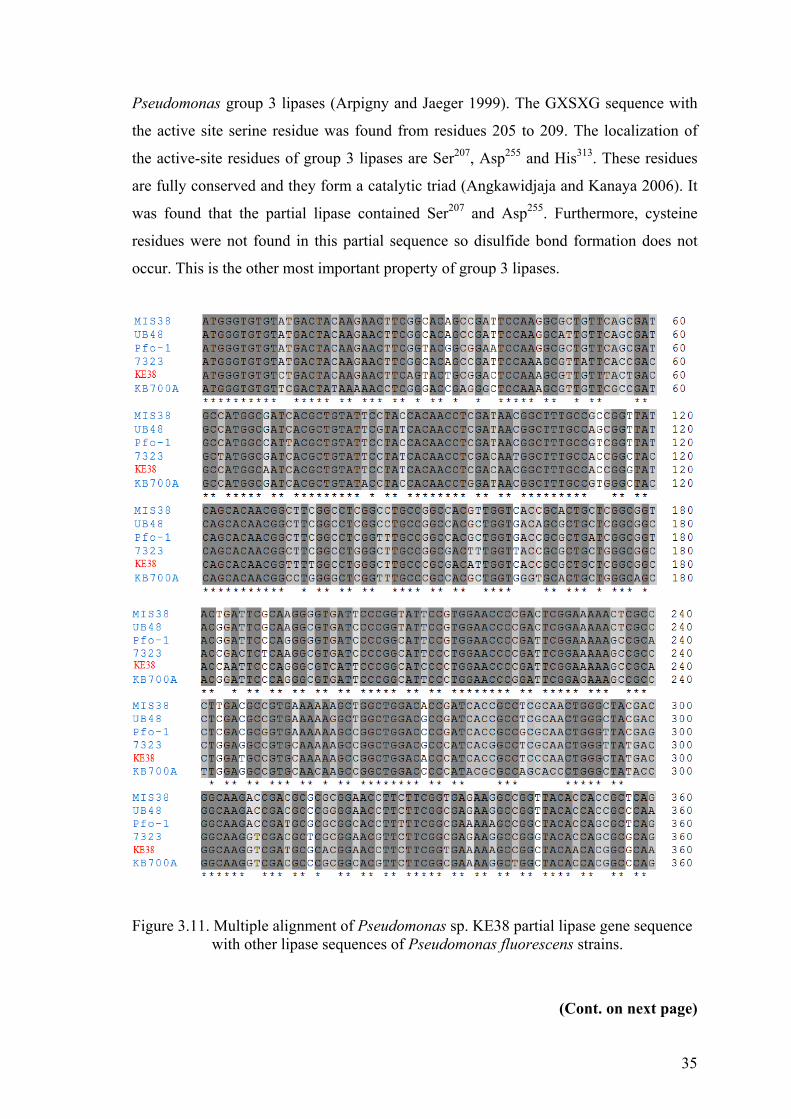
35
Pseudomonas group 3 lipases (Arpigny and Jaeger 1999). The GXSXG sequence with
the active site serine residue was found from residues 205 to 209. The localization of
the active-site residues of group 3 lipases are Ser207, Asp255 and His313. These residues
are fully conserved and they form a catalytic triad (Angkawidjaja and Kanaya 2006). It
was found that the partial lipase contained Ser207 and Asp255. Furthermore, cysteine
residues were not found in this partial sequence so disulfide bond formation does not
occur. This is the other most important property of group 3 lipases.
Figure 3.11. Multiple alignment of Pseudomonas sp. KE38 partial lipase gene sequence with other lipase sequences of Pseudomonas fluorescens strains.
(Cont. on next page)

36
Figure 3.11. (cont.)
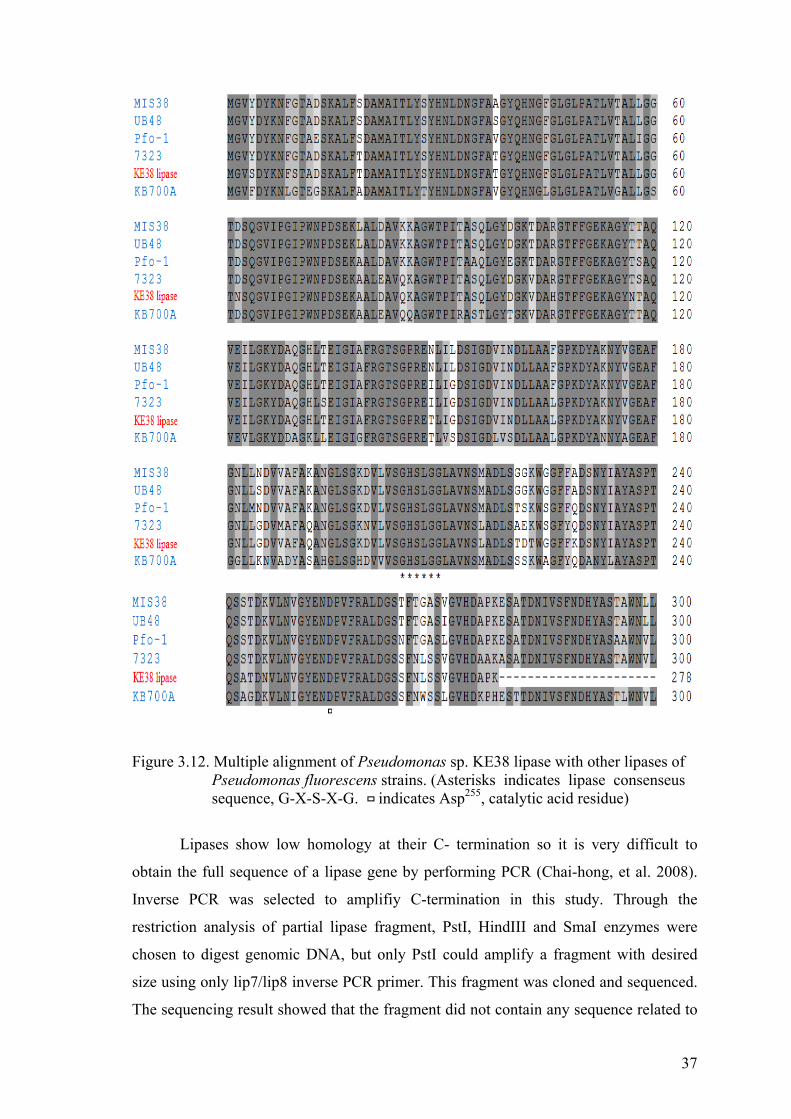
37
Figure 3.12. Multiple alignment of Pseudomonas sp. KE38 lipase with other lipases of Pseudomonas fluorescens strains. (Asterisks indicates lipase consenseus sequence, G-X-S-X-G. indicates Asp255, catalytic acid residue)
Lipases show low homology at their C- termination so it is very difficult to
obtain the full sequence of a lipase gene by performing PCR (Chai-hong, et al. 2008).
Inverse PCR was selected to amplifiy C-termination in this study. Through the
restriction analysis of partial lipase fragment, PstI, HindIII and SmaI enzymes were
chosen to digest genomic DNA, but only PstI could amplify a fragment with desired
size using only lip7/lip8 inverse PCR primer. This fragment was cloned and sequenced.
The sequencing result showed that the fragment did not contain any sequence related to

38
lipase gene. Therefore, the rest of the lipase gene was not obtained. Native lipase
enzyme purification was performed to find the rest of the protein by mass spectrometric
approaches like MALDI analysis.
3.4. Partial Purification and Characterization of Pseudomonas sp. KE38 lipase
Minimal medium with %1 olive oil was selected as lipase production media.
This medium contained only some minerals and inorganic nitrogen source. The strain
was enforced to produce lipase by using only olive oil as sole carbon source. To find the
optimum time for lipase production, Pseudomonas sp. KE38 was grown at 25°C for 1 to
5 days and supernatant for each day was evaluated in the means of lipase activity using
spectrophotometric lipase assay as described in materials and methods. The results
showed that higher lipase activity (1.64 units/ml) exhibited at incubation times of 4 days
(Figure 3.13) and decreased after 5 days. Also, the lipase activity was found to increase
along with the cell growth (Table 3.1)
Table 3.1. Optimization of lipase production time
Incubation Days Growth (OD600) (1:100 dilution) Activity (units/ml)
1 0.0785 0.4
2 0.1301 0.78
3 0.2130 1.32
4 0.2405 1.64
5 0.2701 1.4

39
00,2
0,40,60,8
11,21,4
1,61,8
1 2 3 4 5
Days
Act
ivity
(U/m
l)
Figure 3.13. Time course of lipase production of Pseudomonas sp. KE38 in an olive oil containing medium.
After the determination of optimum incubation time, the effects of glucose and
olive oil on both growth and lipase production were examined. It has been shown that
the presence of lipids or fatty acids in the growth medium induce extracellular lipase
production strongly (Kiran, et al. 2008). In this study, olive oil was found to induce
lipase production significantly and to support good growth (Table 3.2). In the presence
of other carbon sources like glucose, there was a reduction in lipase production. This
could be due to catabolite repression by easily usable carbon sources in the medium
(Kiran, et al. 2008). As is seen in table 3.12, the presence of glucose in the medium
caused the great repression although it supported growth. Furthermore, to investigate
the induction effect of the lipid-related substrates on lipase production, mixed carbon
source (glucose+olive oil) medium was used. This kind of medium gives the bacterium
the possibility to use both substrates in a sequential or simultaneous way based on its
metabolism. Table 3.2 showed that the use of glucose and olive oil together did not
improve the result obtained by using only olive oil as lipid and carbon source. Although
the cells was grown perfectly, there was no increase in activity. This situation could be
due to the preferential usage of glucose to olive oil or a relation between extracellular
lipase production and lipids utilization. It was suggested that olive oil was not
consumed completely during 4 days incubation period.

40
Table 3.2. Effect of glucose and olive oil on growth and enzyme production
Medium type Cell growth (OD600) 1:100 dilution Activity (units/ml)
M.M+glucose 0.0810 0.473 M.M+olive oil 0.2405 6.2
M.M+glucose+olive oil 0.1713 1.01 M.M as negative control No growth No activity
*Ammonium sulfate precipitation was applied to cell-free extract to measure lipase activity.
Lipase from Pseudomonas sp. KE38 grown in minimal medium with %1 olive
oil for 4 days was partially purified by ammonium sulfate precipitation and then
Sephadex G-100 size-exclusion chromatography. Lipase assay was applied to 84
fractions and only 7 fractions was found to contain lipase enzyme. These 7 fractions
were combined and used for enzyme characterization.
3.4.1. Effect of Temperature and pH on Lipase Activity
The effect of temperature (a) and pH (b) on enzyme activity was indicated in
Figure 3.13. The lipase showed activity in the temperature range of 25-45°C and the
maximum activity was observed at 45°C. At higher temperature (55°C) the enzyme lost
% 41.8 of the maximum activity. The lipase lost its activity rapidly above 55°C with
only % 7.4 of the remaining activity at 65°C. Pseudomonas sp. KE38 used in this study
grows optimum at 25°C, but its lipase has maximum activity at 45°C. So, it was the
another evidence to classify KE38 lipase into group 3 lipases. Although group 3 lipases
are generally produced from mesophilic or psychrotrophic bacteria, they have optimum
temperature for activity in the mesophilic or thermophilic range (Angkawidjaja and
Kanaya 2006). The effect of pH on enzyme activity was examined at different pH
values ( pH 4 to 12) at 45°C. The lipase exhibited activity in the pH range of 7.0-9.0,
and the optimum activity was observed at pH 8. The lipase retained % 65.11 of its
maximum activity at pH 9.0 and pH 10.0 the enzyme lost % 66.86 of its maxiumum
activity. In the acidic range, significant reduction in enzyme activity was observed. For
instance, at pH 6.0 the lipase retained only % 6.48 of its maximum activity. No activity
was observed at pH 4 and pH 5.

41
Also, lipase activity showed a linear increase only within 40 minutes at higher alkaline
pH values (pH 11 and pH 12) and then activity decreased rapidly. So, activity was
calculated according to the increase in 40 minutes. It was speculated that the active site
of the lipase enzyme could be ionized irreversibly at too alkaline and acidic
environment.
a)
b)
0
20
40
60
80
100
120
pH: 4
pH: 5
pH: 6
pH: 7
pH: 8
pH: 9
pH: 1
0pH
: 11
pH: 1
2
pH
Rela
tive
Act
ivity
(%)
Figure 3.14. Effect of temperature a) and pH b) on enzyme activity based on relative enzyme activity values. The maximum activity of the enzyme was taken as %100
0
20
40
60
80
100
120
4°C 15°C 25°C 35°C 45°C 55°C 65°C
Temperature
Rela
tive
activ
ity (%
)
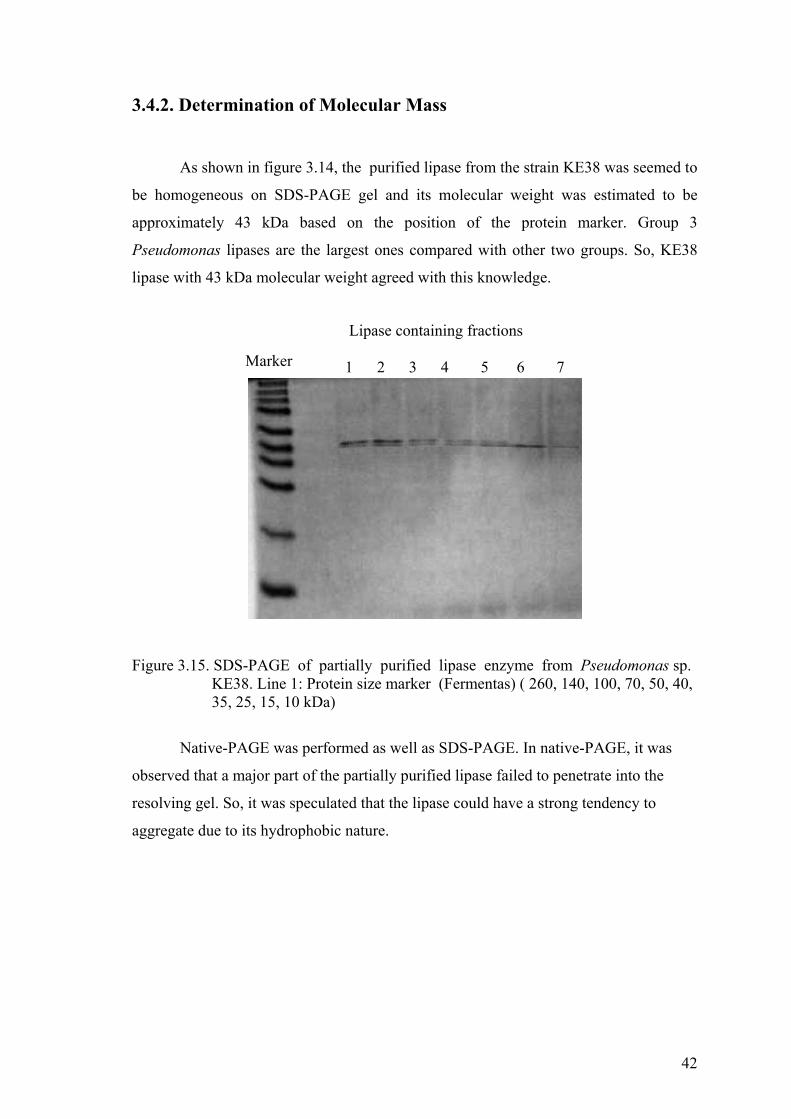
42
3.4.2. Determination of Molecular Mass
As shown in figure 3.14, the purified lipase from the strain KE38 was seemed to
be homogeneous on SDS-PAGE gel and its molecular weight was estimated to be
approximately 43 kDa based on the position of the protein marker. Group 3
Pseudomonas lipases are the largest ones compared with other two groups. So, KE38
lipase with 43 kDa molecular weight agreed with this knowledge.
Figure 3.15. SDS-PAGE of partially purified lipase enzyme from Pseudomonas sp. KE38. Line 1: Protein size marker (Fermentas) ( 260, 140, 100, 70, 50, 40, 35, 25, 15, 10 kDa)
Native-PAGE was performed as well as SDS-PAGE. In native-PAGE, it was
observed that a major part of the partially purified lipase failed to penetrate into the
resolving gel. So, it was speculated that the lipase could have a strong tendency to
aggregate due to its hydrophobic nature.
Lipase containing fractions 1 2 3 4 5 6 7
Marker

43
CHAPTER 4
CONCLUSIONS
Lipases are classified into serine hydrolases and they catalyze both the
hydrolysis and synthesis of long-chain triacylglycerols. Extracellular lipases are
produced by microorganisms, fungi and bacteria. Lipases from bacteria have been paid
much attention due to their common usage in a variety of biotechnological applications.
Pseudomonas lipases are the most important ones which have a significant potential in
detergent industry, organic chemistry and so on.
In this study, we screened lipase positive bacterial strains from soil samples
from Erciyes mountain in Kayseri using a screening system (rhodamine B-olive oil
plates) suitable for the detection of lipase producers. We selected a bacterial strain
among others based on the formation of orange-fluorescent halos with highest intensity
around its colonies. In order to identify this bacterium, some taxonomical studies and
16S rRNA gene analysis were performed. As a result, it was identified as a strain of
Pseudomonas fluorescens and no strain identical to our strain was found. So, we called
it as Pseudomonas sp. KE38.
To be able to find the nucleotide sequence of the lipase gene from KE38, we
carefully designed a pair of degenarate primer based on the higly conserved regions in
the selected 23 different Pseudomonas fluorescens lipases. A fragment with 879 bp
lenght was obtained by using this primers and this fragment was found to belong to a
lipase gene based on BLAST analysis. According to the results of gene and aminoacid
homology search, the lipase from KE38 has been found as a member of group 3
Pseudomonas lipases because of several facts: a) it had high similarity with lipases
classified in group 3 lipases (it was % 92 identical to Pseudomonas sp. 7323 lipase, %
90 identical to both Pseudomonas sp. MIS38 lipase and Pseudomonas sp. UB48 lipase,
% 88 identical to P. fluorescens PfO-1 lipase, and % 79 identical to Pseudomonas sp.
KB700A lipase), b) the deduced partial aminoacid sequence contained a lipase
consensus sequence, GHSLGG, which is most conserved in Pseudomonas group 3
lipases, c) the partial lipase contained Ser207 and Asp255, which are found to be
conserved in Pseudomonas group 3 lipases, d) the partial lipase did not contain cysteine

44
residues to form disulfide bonds, another important feature of group 3 lipases
(Angkawidjaja and Kanaya 2006). Several inverse PCR attempts were performed to
find the complete sequence of the KE38 lipase, but the rest of the gene could not be
obtained.
Furthermore, we determined optimum lipase production time and monitored the
effect of glucose, olive oil and their combination on growth and lipase production. The
maximum lipase production was observed at incubation times of 4 days and lipase
activity increased along with the cell growth. Olive oil supported good growth and
increased lipase activity significantly. So, olive oil was found to act as an inducer of
lipase production for our strain. This result agreed with the knowledge in the literature
in which lipase production has been shown to be induced remarkably in the presence of
lipidic carbon sources like oils, fatty acids etc. (Kiran, et al. 2008). On the other hand,
glucose was found to act as a repressor of lipase production because it caused a great
repression although it supported growth. This was also an expected result based on the
literature. In the precence of other carbon sources like carbohydrates, lipase production
could decrease due to the catabolite repression (Dalmau, et al. 2000). We also
investigated the inducer effect of olive using both glucose and olive oil in the same
medium. The presence of two carbon sources supported good growth, but did not
improve lipase production compared with olive oil containing media. We speculated
that our strain used glucose as primary carbon source and started to use olive oil after
the complete consumption of glucose. So, the lipase production was directly related to
the lipid utilization. After determining optimum lipase production time and carbon
source, native lipase enyzme was partially purified by ammonium sulfate precipitation
and then Sephadex G-100 size-exclusion chromatography. Lipase containing 7 fractions
were used for enzyme characterization.
The optimum temperature and pH for lipase activity were 45°C and pH 8. At
temperatures above 45°C, enzyme losts its activity rapidly. At acidic pH values, no or
little activity was observed. From these results, it is said that the lipase from strain
KE38 was an alkaline enzyme which can be used in several industrial areas after more
purification steps. Its molecular weight was estimated about 43 kDa by SDS-PAGE.
Mass spectrometry can be used to identify the rest of the amino acid sequence of
enzyme. For this purpose, the bands were cut from SDS gel and digested with tripsin.
The resulting peptides will be analyzed via MALDI analysis as a further study. At
present, it is not known that the purified enzyme is the same one with the lipase whose

45
partial gene sequence has been found. After MALDI analysis, we will make a comment
about this situation.

46
REFERENCES
Amada, K., M. Haruki, T. Imanaka, M. Morikawa, and S. Kanaya. 2000.
Overproduction in Escherichia coli, purification and characterization of a family I.3 lipase from Pseudomonas sp. MIS38. Biochimica et Biophysica Acta (BBA) - Protein Structure and Molecular Enzymology 1478 (2): 201-210.
Angkawidjaja, C., and S. Kanaya. 2006. Family I.3 lipase: bacterial lipases secreted by
the type I secretion system. Cell. Mol. Life Sci 63: 2804-2817. Arpigny, J. L., and K.E. Jaeger. 1999. Bacterial lipolytic enzymes: classification and
properties. Biochem. J. 343: 177-183. Basic Local Alignment Search Tool. 2009. National Center for Biotechnology
Information, Nucleotide Basic Local Alignment Search Tool. http://blast.ncbi.nlm.nih.gov/Blast.cgi (accessed October 17, 2009).
Beisson, F., V. Arondel, and R. Verger. 2000. Assaying Arabidopsis lipase activity.
Biochemical Society Transactions 28 (6): 773-775.
Beloqui, A., P. D. de Maria, P. N. Golyshin, and M. Ferrer.2008 Recent trends in industrial microbiology. Current Opinion in Microbiology 11: 240-248.
Bergey, D.H. 2005. Bergey's Manual of Systematic Bacteriology. New York: Springer
Press. Cai-hong, W., G. Run-fang, Y. Hong-wei, and J. Ying-min. 2008. Cloning and
Sequence Analysis of a Novel Cold-Adapted Lipase Gene from Strain lip35 (Pseudomonas sp.). Agricultural Sciences in China 7(10): 1216-1221.
Dalmau, E., J.L. Montesinos, M. Lotti , C. Casas. 2000. Effect of Different Carbon Sources on Lipase Production by Candida rugosa. Enzyme and Microbial Technology 26: 657–663. Duong, F., C. Soscia, A. Lazdunski, and M. Murgier. 1994. The Pseudomonas
fluorescens lipase has a C-terminal secretion signal and is secreted by a three-component bacterial ABC-exporter system. Molecular Microbiology 11 (6): 1117-1126.
European Bioinformatics Institute Server. 2009. Universal Protein Resource.
http://www.ebi.ac.uk/uniprot/search/SearchTools.html (accessed October 17, 2009).
Fan, Z., C. Yue, Y. Tang, and Y. Zhang. 2008. Cloning, sequence analysis and
expression of bacterial lipase-coding DNA fragments from environment in Escherichia coli. Molecular Biology Reports 36 (6): 1515-1519.

47
Frenken, L. G. J., M. R. Egmond, A. M. Batenburg, J. W. Bos, C. Visser, and C. T. Verrips. 1992. Cloning of the Pseudomonas glumae Lipase Gene and Determination of the Active Site Residues. Applied And Environmental Microbiology 58: 3787-3791.
Fojan, P., P.H. Jonson, M.T.N. Petersen, and S.B. Petersen. 2000. What distinguishes an
esterase from a lipase: A novel structural approach. Biochimie 82: 1033-1041. Gandhi, N. N. 1997. Applications of Lipase. JAOCS 74: 621-634. Gerday, C., M. Aittaleb, M. Bentahir, J.P. Chessa, P. Claverie, T. Collins, S. D’Amico,
J. Dumont, G. Garsoux, D. Georlette, A. Hoyoux, T. Lonhienne, M.A. Meuwis, and G. Feller. 2000. Cold-adapted enzymes: from Fundamentals to biotechnology. TIBTECH MARCH 18:103-107.
Gilham, D., and R. Lehner. 2005. Techniques to measure lipase and esterase activity in vitro. Methods 36: 139-147.
Gupta, R., N. Gupta, and P. Rathi. 2004. Bacterial lipases: an overview of production,
purification and biochemical properties. Appl Microbiol Biotechnol 64: 763- 781.
Hasan, F., A. A. Shah, and A. Hameed. 2006. Industrial applications of microbial
lipases. Enzyme and Microbial Technology 39: 235-251. Hasanuzzaman, M., K.M. Umadhay-Briones, S.M. Zsiros, N. Morita,Y. Nodasaka, I.
Yumoto, and H. Okuyama. 2004. Isolation, Identification, and Characterization of a Novel, Oil-Degrading Bacterium, Pseudomonas aeruginosa T1. Current Microbiology 49:108-114.
Hou, C. T., T. M. Johnston. 1992. Screening of lipase activities with cultures from the
Agricultural Research Service culture collection. J. Am. Oil Chem. Soc 69: 1088-1097.
Jaeger, K.E, S. Ransac, B. W. Dijkstra, C. Colson, M. van Heuvel, and O. Misset. 1994.
Bacterial Lipases. FEMS Microbiology Reviews 15: 29-63. Jaeger, K.E, and M. T. Reetz. 1998. Microbial lipases form versatile tools for
Biotechnology. Trends in Biotechnology16 (9): 396-403. Jaeger, K.E, B.W. Dijkstra, and M.T. Reetz. 1999. BACTERIAL BIOCATALYSTS:
Molecular Biology, Three-Dimensional Structures, and Biotechnological Applications of Lipases. Annu. Rev. Microbiol 53:315–51.
Jaeger, K.E, and T. Eggert. 2002. Lipases for biotechnology. Current Opinion in
Biotechnology 13: 390-397. Jaufeerally-Fakim, Y., and A. Dookun. 2000. Extraction of High Quality DNA From
Polysaccharides-Secreting Xanthomonads. Science And Technology 6:34-40.
48
Jensen, Robert G. 1983. Detection and Determination of Lipase (Acylglycerol Hydrolase) Activity from Various Sources Lipids 18: 650-657.
Jones, A., and T. Richards. 1952. Night Blue And Victoria Blue As Indicators In
Lipolysis Media. Journal of Applied Microbiology 15:82-93. Joseph, B., P. W. Ramteke, G. Thomas, and N. Shrivastava. 2007. Standard Review
Cold-active microbial Lipases: a versatile tool for industrial applications. Biotechnology and Molecular Biology Review 2(2): 39-48.
Joseph, B., P. W. Ramteke, and G. Thomas. 2008. Cold active microbial lipases: Some
hot issues and recent developments. Biotechnology Advances 26 (5): 457-470. Kiran, G. S., S. Shanmughapriya, J. Jayalakshmi, J. Selvin , R. Gandhimathi , S. Sivaramakrishnan, M. Arunkumar, T. Thangavelu, and K. Natarajaseenivasan. 2008. Optimization of Extracellular Psychrophilic Alkaline Lipase Produced by Marine Pseudomonas sp. (MSI057). Bioprocess Biosyst Eng 31: 483–492. Kojima, Y., M. Kobayashi, and S. Shimizu. 2003. A Novel Lipase from Pseudomonas
fluorescens HU380: Gene Cloning, Overproduction, Reneturation-Activation, Two-Step Purification, and Characterization. Journal of bioscience and bioengineering 96(3): 242-249.
Kouker, G., and K.E Jaeger. 1987. Specific and Sensitive Plate Assay for Bacterial
Lipases. Applied and Environmental Microbiology 53: 211-213. Nardini, M., and B. W. Dijkstra. 1999. α/β Hydrolase fold enzymes: the family keeps
growing. Current Opinion in Structural Biology 9: 732-737. Noble, M.E.M., A. Cleasby, L.N. Johnson, M.R. Egmond, and L.G.J. Frenken. 1993.
The crystal structure of triacylglycerol lipase from Pseudomonas glumae reveals a partially redundant catalytic aspartate. FEBS LETTERS 331 (1-2): 123-128.
Ochman, H., A. S. Gerber, and D.L. Hart. 1988. Genetic Applications of an Inverse
Polymerase Chain Reaction. Genetics 120:621-623. Pandey, A., S. Benjamin, C.R. Soccol, P. Nigam, N. Krieger and V. T. Soccol. 1999.
The realm of microbial lipases in biotechnology. Biotechnol. Appl. Biochem 29: 119-131.
Pascale, D., A.M. Cusano, F. Autore, E. Parrilli, G. di Prisco, G. Marino, and M. L.
Tutino. 2008. The cold-active Lip1 lipase from the Antarctic bacterium Pseudoalteromonas haloplanktis TAC125 is a member of a new bacterial lipolytic enzyme family. Extremophiles 12: 311-323.
Peterson, S.B., and F. Drabløs. 1994. A sequence analysis of lipases, esterases, and
related proteins. In Lipases-their structure, biochemistry, and application, ed. P. Woolley , and S.B. Peterson, 23-48. Cambridge: Cambridge University Press.

49
Rosenau, F., and K.E. Jaeger. 2000. Bacterial lipases from Pseudomonas: Regulation of gene expression and mechanisms of secretion. Biochimie 82 :1023-1032.
Rosenau, F., J. Tommassen, and K.E. Jaeger. 2004. Lipase-Specific Foldases.
ChemBioChem 5: 152-161. Sanchez, S. 2005. Ecology and industrial microbiology Microbial diversity-the bright
and promising future of microbial manufacturing. Current Opinion in Microbiology 8: 229-233.
Saxena, R. K., P. K. Ghosh, R. Gupta, W. S. Davidson, S. Bradoo, and R. Gulati. 1999.
Microbial lipases: Potential biocatalysts for the future industry. Current Science 77(1): ?
Schmid, R.D., and R. Verger . 1998. Lipases: Interfacial Enzymes with Attractive
Applications. Angew. Chem. Int. Ed. 37: 1608-1633. Seitz, E. W. 1974. Industrial Applications of Microbial Lipases: A Review. Journal of
the American Oil Chemists' Society 51 (2): 12-16. Sharma, R., Y. Chisti, U.C. Banerjee. 2001. Production, purification, characterization,
and applications of lipases. Biotechnology Advances 19: 627-662. Shelley, A.W., H.C. Deeth, and I.C. MacRae. 1987. Review of methods of enumeration,
detection and isolation of lipolytic microorganisms with special reference to dairy applications. J. Microbiol. Methods 6:123-137.
Stehr, F., M. Kretschmar, C. Kröger, B. Hube, and W. Schäfer. 2003. Microbial lipases
as virulence factors. Journal of Molecular Catalysis B: Enzymatic 22(5-6):347-355.
Thomson, C.A., P.J. Delaquis, and G. Mazza.1999. Detection and Measurement of Microbial Lipase Activity: A Review. Critical Reviews in Food Science and Nutrition 39(2): 165-187.
Underkofler, L.A., R.R. Barton, and S.S. Rennert. 1957. Production of Microbial
Enzymes and Their Applications. Appl Microbiology 6(3): 212-221. Verger, R. 1997. Interfacial activation of lipases: facts and artifacts. Trends in
Biotechnology 15 (1): 32-38. Wilson, K. 2001. Preparation of Genomic DNA from Bacteria. Current Protocols in Molecular Biology. Zhang, A., R. Gao, N. Diao, G. Xie, G. Gao, and S. Cao. 2008. Cloning, expression and
characterization of an organic solvent tolerant lipase from Pseudomonas fluorescens JCM5963. Journal of Molecular Catalysis B: Enzymatic 56 (2-3): 78-84.

50
APPENDIX A
PARTIAL SEQUENCES OF 16S rRNA AND LIPASE
GENES OF IDENTIFIED BACTERIAL STRAIN
Pseudomonas sp. KE38 16S ribosomal RNA gene CCAGACTCCTACGGGAGGCAGCAGTGGGGAATATTGGACAATGGGCGAAAGCCTGATCCAGCCATGCCGCGTGTGTGAAGAAGGTCTTCGGATTGTAAAGCACTTTAAGTTGGGAGGAAGGGTTGTAACCTAATACGTTGCAATCTTGACGTTACCGACAGAATAAGCACCGGCTAACTCTGTGCCAGCAGCCGCGGTAATACAGAGGGTGCAAGCGTTAATCGGAATTACTGGGCGTAAAGCGCGCGTAGGTGGTTCGTTAAGTTGGATGTGAAATCCCCGGGCTCAACCTGGGAACTGCATTCAAAACTGACGAGCTAGAGTATGGTAGAGGGTGGTGGAATTTCCTGTGTAGCGGTGAAATGCGTAGATATAGGAAGGAACACCAGTGGCGAAGGCGACCACCTGGACTGATACTGACACTGAGGTGCGAAAGCGTGGGGAGCAAACAGGATTAGATACCCTGGTAGTCCACGCCGTAAACGATGTCAACTAGCCGTTGGGAGCCTTGAGCTCTTAGTGGCGCAGCTAACGCATTAAGTTGACCGCCTGGGGAGTACGGCCGCAAGGTTAAAACTCAAATGAATTGACGGGGGCCCGCACAAGCGGTGGAGCATGTGGTTTAATTCGAAGCAACGCGAAGAACCTTACCAGGCCTTGACATCCAATGAACTTTCCAGAGATGGATTGGTGCCTTCGGGAACATTGAGACAGGTGCTGCATGGCTGTCGTCAGCTCGTGTCGTGAGATGTTGGGTTAAGTCCCGCAACGAGCGCAACCCT Partial sequence of lipase gene from Pseudomonas sp. KE38 ATGGGTGTGTCTGACTACAAGAACTTCAGTACTGCGGACTCCAAAGCGTTGTTTACTGACGCCATGGCAATCACGCTGTATTCCTATCACAACCTCGACAACGGCTTTGCCACCGGGTATCAGCACAACGGTTTTGGCCTGGGCTTGCCCGCGACATTGGTCACCGCGCTGCTCGGCGGCACCAATTCCCAGGGCGTCATTCCCGGCATCCCCTGGAACCCCGATTCGGAAAAAGCCGCACTGGATGCCGTGCAAAAAGCCGGCTGGACACCCATCACCGCCTCCCAACTGGGCTATGACGGCAAGGTCGATGCGCACGGAACCTTCTTCGGTGAAAAAGCCGGCTACAACACGGCGCAAGTCGAGATCCTCGGCAAGTACGATGCCCAGGGGCACCTGACCGAAATCGGCATCGCCTTTCGCGGCACCAGCGGCCCACGGGAAACCCTGATCGGCGATTCCATTGGCGACGTGATCAACGACCTGCTGGCAGCGTTGGGTCCCAAGGATTACGCGAAAAATTACGTCGGCGAAGCGTTCGGCAACCTGCTCGGCGACGTTGTGGCGTTTGCCCAGGCCAATGGCTTGTCGGGAAAAGACGTCCTGGTCAGCGGCCATAGCCTCGGCGGGTTGGCGGTCAACAGCCTGGCGGACTTGAGCACGGACACCTGGGGCGGGTTCTTCAAGGACTCCAACTACATCGCCTACGCATCACCCACCCAAAGCGCCACCGACAACGTGCTCAACGTCGGCTATGAAAACGATCCGGTGTTTCGTGCGCTCGATGGTTCATCGTTCAACCTGTCGTCGGTGGGGGTTCACGATGCGCCCAAAAGAGTCGGCCACCGATAACATCGTCACCTTCAACGACCACTACGC

51
APPENDIX B
THE SEQUENCES AND POSITIONS OF INVERSE PCR
PRIMERS ON PARTIAL LIPASE FRAGMENT
Table B.1. The sequences of inverse PCR primers
Primers Sequences (5’ 3’)
lip3 CAACGCTTTGGAGTCCGC
lip4 CCAAAAGAGTCGGCCACCG
lip5 CCAATGGCTTGTCGGGAAAAG
lip6 CAGTTGGGAGGCGGTGATGGG
lip7 ACGTGATCAACGACCTGCTGG
lip8 CTTGCGCCGTGTTGTAGCCGG
Figure B.1. Positions of inverse PCR primers on partial lipase fragment
ATGGGTGTGTCTGACTACAAGAACTTCAGTACTGCGGACTCCAAAGCGTTGTTTACTGACGCCATGGCAATCACGCTGTATTCCTATCACAACCTCGACAACGGCTTTGCCACCGGGTATCAGCACAACGGTTTTGGCCTGGGCTTGCCCGCGACATTGGTCACCGCGCTGCTCGGCGGCACCAATTCCCAGGGCGTCATTCCCGGCATCCCCTGGAACCCCGATTCGGAAAAAGCCGCACTGGATGCCGTGCAAAAAGCCGGCTGGACACCCATCACCGCCTCCCAACTGGGCTATGACGGCAAGGT
CGATGCGCACGGAACCTTCTTCGGTGAAAAAGCCGGCTACAACACGGCGCAAGTCGAGATCCTCGGCAAGTACGATGCCCAGGGGCACCTGACCGAAATCGGCATCGCCTTTCGCGGCACCAGCGGCCCACGGGAAACCCTGATCGGCGATTCCATTGGCGACGTGATCAACGACCTGCTGGCAG
CGTTGGGTCCCAAGGATTACGCGAAAAATTACGTCGGCGAAGCGTTCGG
CAACCTGCTCGGCGACGTTGTGGCGTTTGCCCAGGCCAATGGCTTGTCGGGAAAAGACGTCCTGGTCAGCGGCCATAGCCTCGGCGGGTTGGCGGTCAACAGCCTGGCGGACTTGAGCACGGACACCTGGGGCGGGTTCTTCAAGGACTCCAACTACATCGCCTACGCATCACCCACCCAAAGCGCCACCGACAACGTGCTCAACGTCGGCTATGAAAACGATCCGGTGTTTCGTGCGCTCGATGGTTCATCGTTCAACCTGTCGTCGGTGGGGGTTCACGATGCGCCCAAAAGAGTCGGCCACCGATAACATCGTCACCTTCAACGACCACTACGC
lip3
lip5
lip4
lip6 lip8
lip7

52
APPENDIX C
BUFFERS AND STOCK SOLUTIONS
Luria Bertani (LB) broth, per liter 10 g tryptone, 5 g yeast extract, 5 g NaCl and dH2O up to 1 L.
Modified Luria Bertani (LB) agar, per liter 10 g tryptone, 5 g yeast extract, 5 g NaCl, 10g gellan gum instead of 15g agar and dH2O
up to 1 L.
Rhodamine B solution (0.1% w/v) 0.1 g rhodamine B in 100 ml dH2O.
Amphicilin (100 mg/ml) 0.1 g amphicilin in 1 ml dH2O
X-GAL Stock Solution (50 mg/ml) 0.1 g x-gal in 2 ml N-N di-methyl formimide.
IPTG Stock Solution (0.1 M) 1.2 g IPTG was dissolved in 50 ml of deionized water
Tetracyline (12.5 mg/ml) 0.0125 g tetracyline in 1 ml dH2O and keep away from light.
CTAB/NACI Dissolve 4.1 g NaCl in 80 ml of water and slowly add 10 g CTAB while heating
(≈65°C) and stirring. This takes more than 3 hrs to dissolve CTAB. Adjust final volume
to 100 ml and sterilize by filter or autoclave.

53
5X minimal salt solution
64g Na2HPO4.7H2O, 15g KH2PO4, 2,5g NaCl and 5g NH4Cl (nitrogen source) dissolved
in 1 liter water and autoclaved at 121oC, 1 bar for 15 minutes.
Minimal Medium, per liter 200 ml of 5X minimal salt solution, dH2O up 1 L. After autoclave, 2ml 1M MgSO4 and
0,1ml 1M CaCl2 was added.
Sodium phosphate buffer (100 mM), pH 7,2 0,3g NaH2PO4.H2O, 1,09g Na2HPO4 (anhydrous) dissolved in 100 ml water and then
150 mM NaCl and % 0.5 Triton-X was added.
Sodium acetate buffer (50 mM), pH 4 to 5 0,4 g sodium acetate dissolved in 100 ml water and then its pH was adjusted with acetic
acid.
Potassium phosphate buffer (50 mM), pH 6 to7 0,68 g potassium dihydrogen phosphate dissolved in 100 ml water and then pH was
adjusted with phosphoric acid.
Tris-HCL biffer (50 mM), pH 8 0,6 g tris base dissolved in 100 ml water and then pH was adjusted with HCL
Glycine-NaOH buffer (50 mM), pH 9 to 12 0,36 g gylcine dissolved in 100 ml water and then pH was adjusted with NaOH.
p-nitrophenyl laurate solution (50 mM) 1,6 g p-nitrophenyl laurate dissolved in 100 ml acetonitrile.