Isolation and characterization of the major natural dyestuff
6
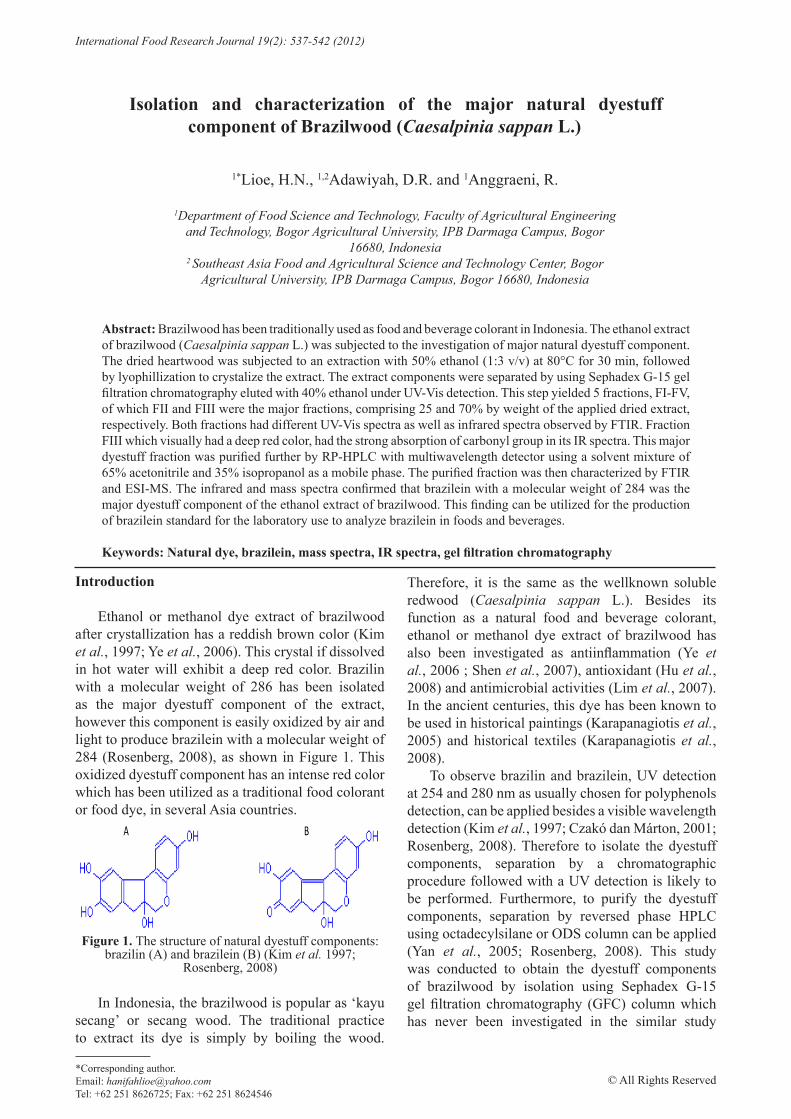
© All Rights Reserved *Corresponding author. Email: [email protected] Tel: +62 251 8626725; Fax: +62 251 8624546 International Food Research Journal 19(2): 537-542 (2012) 1* Lioe, H.N., 1,2 Adawiyah, D.R. and 1 Anggraeni, R. 1 Department of Food Science and Technology, Faculty of Agricultural Engineering and Technology, Bogor Agricultural University, IPB Darmaga Campus, Bogor 16680, Indonesia 2 Southeast Asia Food and Agricultural Science and Technology Center, Bogor Agricultural University, IPB Darmaga Campus, Bogor 16680, Indonesia Isolation and characterization of the major natural dyestuff component of Brazilwood (Caesalpinia sappan L.) Abstract: Brazilwood has been traditionally used as food and beverage colorant in Indonesia. The ethanol extract of brazilwood (Caesalpinia sappan L.) was subjected to the investigation of major natural dyestuff component. The dried heartwood was subjected to an extraction with 50% ethanol (1:3 v/v) at 80°C for 30 min, followed by lyophillization to crystalize the extract. The extract components were separated by using Sephadex G-15 gel filtration chromatography eluted with 40% ethanol under UV-Vis detection. This step yielded 5 fractions, FI-FV, of which FII and FIII were the major fractions, comprising 25 and 70% by weight of the applied dried extract, respectively. Both fractions had different UV-Vis spectra as well as infrared spectra observed by FTIR. Fraction FIII which visually had a deep red color, had the strong absorption of carbonyl group in its IR spectra. This major dyestuff fraction was purified further by RP-HPLC with multiwavelength detector using a solvent mixture of 65% acetonitrile and 35% isopropanol as a mobile phase. The purified fraction was then characterized by FTIR and ESI-MS. The infrared and mass spectra confirmed that brazilein with a molecular weight of 284 was the major dyestuff component of the ethanol extract of brazilwood. This finding can be utilized for the production of brazilein standard for the laboratory use to analyze brazilein in foods and beverages. Keywords: Natural dye, brazilein, mass spectra, IR spectra, gel filtration chromatography Introduction Ethanol or methanol dye extract of brazilwood after crystallization has a reddish brown color (Kim et al., 1997; Ye et al., 2006). This crystal if dissolved in hot water will exhibit a deep red color. Brazilin with a molecular weight of 286 has been isolated as the major dyestuff component of the extract, however this component is easily oxidized by air and light to produce brazilein with a molecular weight of 284 (Rosenberg, 2008), as shown in Figure 1. This oxidized dyestuff component has an intense red color which has been utilized as a traditional food colorant or food dye, in several Asia countries. In Indonesia, the brazilwood is popular as ‘kayu secang’ or secang wood. The traditional practice to extract its dye is simply by boiling the wood. Therefore, it is the same as the wellknown soluble redwood (Caesalpinia sappan L.). Besides its function as a natural food and beverage colorant, ethanol or methanol dye extract of brazilwood has also been investigated as antiinflammation (Ye et al., 2006 ; Shen et al., 2007), antioxidant (Hu et al., 2008) and antimicrobial activities (Lim et al., 2007). In the ancient centuries, this dye has been known to be used in historical paintings (Karapanagiotis et al., 2005) and historical textiles (Karapanagiotis et al., 2008). To observe brazilin and brazilein, UV detection at 254 and 280 nm as usually chosen for polyphenols detection, can be applied besides a visible wavelength detection (Kim et al., 1997; Czakó dan Márton, 2001; Rosenberg, 2008). Therefore to isolate the dyestuff components, separation by a chromatographic procedure followed with a UV detection is likely to be performed. Furthermore, to purify the dyestuff components, separation by reversed phase HPLC using octadecylsilane or ODS column can be applied (Yan et al., 2005; Rosenberg, 2008). This study was conducted to obtain the dyestuff components of brazilwood by isolation using Sephadex G-15 gel filtration chromatography (GFC) column which has never been investigated in the similar study A B Figure 1. The structure of natural dyestuff components: brazilin (A) and brazilein (B) (Kim et al. 1997; Rosenberg, 2008)
Transcript of Isolation and characterization of the major natural dyestuff
© All Rights Reserved*Corresponding author. Email: [email protected]: +62 251 8626725; Fax: +62 251 8624546
International Food Research Journal 19(2): 537-542 (2012)
1*Lioe, H.N., 1,2Adawiyah, D.R. and 1Anggraeni, R.
1Department of Food Science and Technology, Faculty of Agricultural Engineering and Technology, Bogor Agricultural University, IPB Darmaga Campus, Bogor
16680, Indonesia2 Southeast Asia Food and Agricultural Science and Technology Center, Bogor
Agricultural University, IPB Darmaga Campus, Bogor 16680, Indonesia
Isolation and characterization of the major natural dyestuff component of Brazilwood (Caesalpinia sappan L.)
Abstract: Brazilwood has been traditionally used as food and beverage colorant in Indonesia. The ethanol extract of brazilwood (Caesalpinia sappan L.) was subjected to the investigation of major natural dyestuff component. The dried heartwood was subjected to an extraction with 50% ethanol (1:3 v/v) at 80°C for 30 min, followed by lyophillization to crystalize the extract. The extract components were separated by using Sephadex G-15 gel filtration chromatography eluted with 40% ethanol under UV-Vis detection. This step yielded 5 fractions, FI-FV, of which FII and FIII were the major fractions, comprising 25 and 70% by weight of the applied dried extract, respectively. Both fractions had different UV-Vis spectra as well as infrared spectra observed by FTIR. Fraction FIII which visually had a deep red color, had the strong absorption of carbonyl group in its IR spectra. This major dyestuff fraction was purified further by RP-HPLC with multiwavelength detector using a solvent mixture of 65% acetonitrile and 35% isopropanol as a mobile phase. The purified fraction was then characterized by FTIR and ESI-MS. The infrared and mass spectra confirmed that brazilein with a molecular weight of 284 was the major dyestuff component of the ethanol extract of brazilwood. This finding can be utilized for the production of brazilein standard for the laboratory use to analyze brazilein in foods and beverages.
Keywords: Natural dye, brazilein, mass spectra, IR spectra, gel filtration chromatography
Introduction
Ethanol or methanol dye extract of brazilwood after crystallization has a reddish brown color (Kim et al., 1997; Ye et al., 2006). This crystal if dissolved in hot water will exhibit a deep red color. Brazilin with a molecular weight of 286 has been isolated as the major dyestuff component of the extract, however this component is easily oxidized by air and light to produce brazilein with a molecular weight of 284 (Rosenberg, 2008), as shown in Figure 1. This oxidized dyestuff component has an intense red color which has been utilized as a traditional food colorant or food dye, in several Asia countries.
In Indonesia, the brazilwood is popular as ‘kayu secang’ or secang wood. The traditional practice to extract its dye is simply by boiling the wood.
Therefore, it is the same as the wellknown soluble redwood (Caesalpinia sappan L.). Besides its function as a natural food and beverage colorant, ethanol or methanol dye extract of brazilwood has also been investigated as antiinflammation (Ye et al., 2006 ; Shen et al., 2007), antioxidant (Hu et al., 2008) and antimicrobial activities (Lim et al., 2007). In the ancient centuries, this dye has been known to be used in historical paintings (Karapanagiotis et al., 2005) and historical textiles (Karapanagiotis et al., 2008).
To observe brazilin and brazilein, UV detection at 254 and 280 nm as usually chosen for polyphenols detection, can be applied besides a visible wavelength detection (Kim et al., 1997; Czakó dan Márton, 2001; Rosenberg, 2008). Therefore to isolate the dyestuff components, separation by a chromatographic procedure followed with a UV detection is likely to be performed. Furthermore, to purify the dyestuff components, separation by reversed phase HPLC using octadecylsilane or ODS column can be applied (Yan et al., 2005; Rosenberg, 2008). This study was conducted to obtain the dyestuff components of brazilwood by isolation using Sephadex G-15 gel filtration chromatography (GFC) column which has never been investigated in the similar study
A B
Figure 1. The structure of natural dyestuff components: brazilin (A) and brazilein (B) (Kim et al. 1997;
Rosenberg, 2008)
538 Lioe, H.N., Adawiyah, D.R. and Anggraeni, R.
International Food Research Journal 19(2): 537-542
before, and to characterize its pure component after purification by HPLC with ODS column. GFC using Sephadex G-15 can separate components with molecular weights of less than 1500 dalton (Hagel, 1998). The characterization was performed for its separation yield, UV-Vis spectra, infrared spectra, HPLC profile, and mass spectra.
Materials and Methods
Sample Brazilwood or ‘kayu secang’ (Caesalpinia sappan
L) was obtained in the form of dried heartwood slices from a local market in Bogor, Indonesia.
Extraction of dyestuff components The dyestuff components in dried heartwood
were extracted with 50% of ethanol solution in water at a volume ratio of 1:3, and by applying heat at 80°C for 30 min. The extract was then lyophillized to yield crystals.
Dyestuff component separation by gel filtration chromatography
A sample in crystal form as much as 0.5 g was dissolved in 7.5 mL of 60% ethanol in water. The sample solution was then applied into a gel filtration chromatography column.
Sephadex G-15 as much as 50 g was suspended in Milli-Q water (1:3 v/v) and boiled for 1 h. The slurry was then cooled at room temperature. The cooled slurry was poured into a glass column, 2.5 cm in diameter, at once to form a homogenous bed with a height of 36.0 cm. Conditioning of the column was performed by the elution of 1 L of 40% ethanol solution in water.
Sample solution described above was applied after the column conditioning performed. The sample was pipetted right on top of the Sephadex G-15 bed. The sample was then eluted using 40% ethanol at room temperature. As much as 150 fractions with a volume of 5 mL each were collected by a fraction collector (Toyo SF 100, Toyo Kagaku Sangyo Co., Japan). Each fraction was monitored simultaneously at 254, 280 and 445 nm by Spectrophotometer Shimadzu UV160 (Shimadzu Co., Japan). The result was then plotted against fraction number to evaluate the separation profile and determine the separated fractions of the dye extract. The tubes from the same separated fraction was then collected into one bottle, and then lyophillized to dryness. The dried dyestuff fraction was weighed to know the separation yield. Each of the dried fractions obtained was then dissolved in 5.0 mL of 40% ethanol. The UV-Vis spectra of the fraction
was analyzed by Spectrophotometer Shimadzu UV160. The observation of infrared spectra and HPLC profile of the dyestuff fractions was conducted under the methods described below.
Infrared spectra observationInfrared spectra was observed for the 2 major
dyestuff fractions from Sephadex G-15 separation by a Tensor 37 Fourier Transform Infrared (FTIR) instrument (Bruker, Germany) and Opus program in the range 4000−370 cm−1 with a spectral resolution of 4 cm−1 and 64 scan accumulations. The infra red absorption spectra of each sample were obtained by the following procedures: 2 mg of dried sampel was mixed with KBr salt crystals by using a mortar, then the mix was pressed under vacuum for 5 min to form a pellet. The sample pellet was then analysed for its infrared (IR) spectra.
HPLC profile of dyestuff fractions obtained from Sephadex G-15 separation
HPLC profiles of the dyestuff fractions were obtained by performing reversed phase HPLC (RP-HPLC) separation using multiwavelength detector (MWD). The profile evaluation was aimed to know the number of major peaks in the fractions from Sephadex G-15 result. The fractions were injected separately to a HPLC instrument (Agilent Series 1200, Agilent Tech., USA) under this following condition: Zorbax C18 column (15 cm × 4,6 cm i.d.), isocratic system at room temperature using a mobile phase of acetonitrile and isopropanol (65:35 v/v) with a flow rate of 0.6 mL/menit, injection volume 20 µL, and detection under UV 254 nm. The fractions (in 5.0 mL of 40% ethanol) were diluted in a certain dillution factor with 40% ethanol prior to HPLC injection. This dillution was conducted to obtain a clear separation profile and to avoid the overloaded peaks. Area integration of each peak in the HPLC profile was used to estimate its concentration in the dyestuff fractions.
Isolation and purification of the major dyestuff component by HPLC
Isolation and purification of the dyestuff component was performed by conducting several injections (each 100 µL) of a major Sephadex G-15 fraction (with a 5 times dillution in 40% ethanol) into HPLC and the respective major peak having a certain retention time from each injection was then collected. The total injection volume of the fraction injected into HPLC was 2500 µL. The collected HPLC fraction was then dried under a nitrogen gas stream, and then dissolved in 500 µL of ethanol 50%. This purified
Isolation and characterization of the major natural dyestuff component of Brazilwood (Caesalpinia sappan L.) 539
International Food Research Journal 19(2): 537-542
dyestuff solution was subjected to infrared spectra and mass spectra analyses. The mass spectra analysis was performed to evaluate the molecular weight of its component. The analysis was conducted by direct infusion of the purified component in methanol to an electrospray ionization-mass spectrometer (ESI-MS) instrument (LCQ DECA, Thermo Finnigan, USA) with a negative-ion mode and a mass scan range at 150 – 1000 m/z.
Results and Discussion
Isolation of the major dyestuff fractions of Brazilwood extract by Sephadex G-15 gel filtration chromatography
Gel filtration chromatography by using Sephadex G-15 gel and 40% ethanol as a mobile phase was performed to separate the dyestuff components in the ethanol extract of brazilwood. The mobile phase was chosen based on the previous trial on a Silica 60 thin layer chromatography using several solvents at different polarities and using ethanol at different concentrations (10 to 40%). The chromatography using Sephadex G-15 can be used to separate components with molecular weights of less than 1500 dalton (Hagel, 1998) which was previously predicted found in the brazilwood extract.
The 5 mL volume of eluate collected in each tube was determined to obtain several clear fractions which could be differentiated from each other. The monitoring of each tube by a spectrophotometer at UV 254 and 280 nm was usually chosen for monitoring phenolic compounds, however the monitoring at 445 nm was determined according to the information about the maximum absorption of brazilein, a compound which is likely found in the extract and has an intense red color (Kim et al. 1997; Czakó dan Márton, 2001; Rosenberg, 2008).
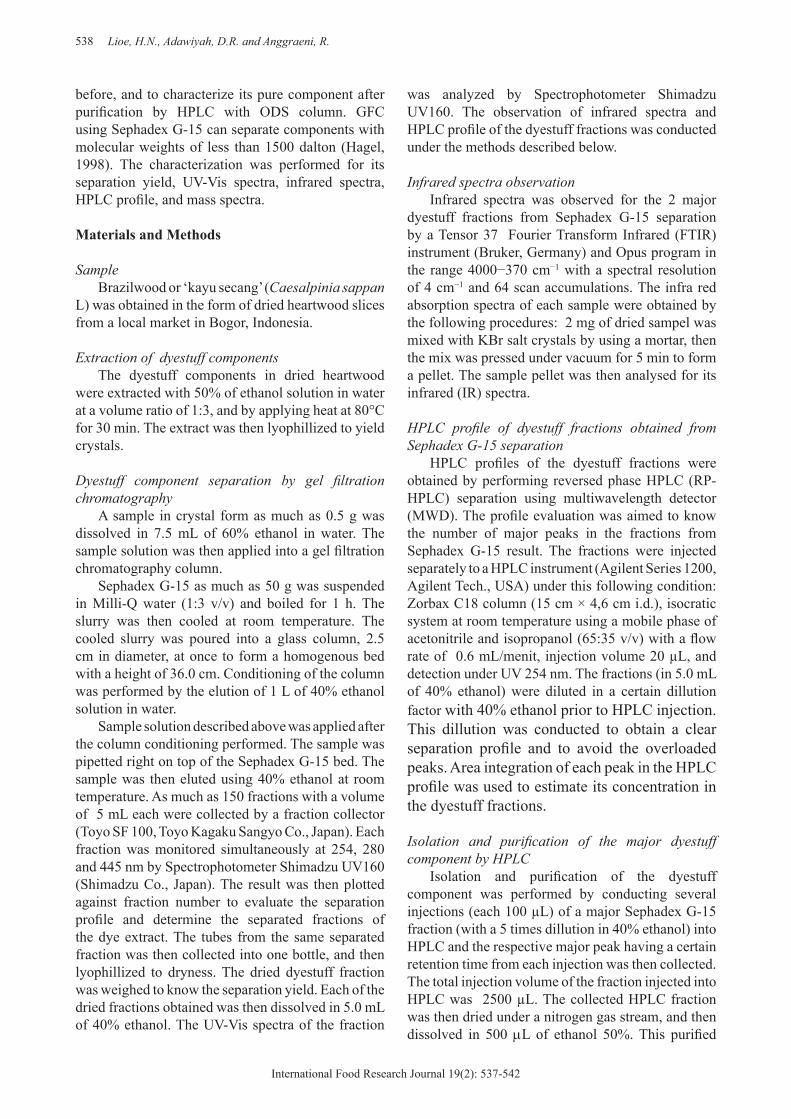
Figure 2 showed the separation result of brazilwood extract on a Sephadex G-15 column (36.0 cm × 2.5 cm). It is obvious that the dye extract could be separated further into 5 dyestuff fractions (Fraksi I−V). They were visually noted with the colors of brown, light orange, and reddish orange for Fractions I−III respectively, while Fractions IV and V had light orange color. The separation by Sephadex G-15 occurred due to the differences in molecular sizes, polarities, and hydrophobic interaction with the gel matrix (Hagel, 1998). The 5 fractions have different UV-Vis spectra as shown in Figure 3, this means that they may contain different dyestuff components.
The volumes of collected eluate were 20 mL in Fraction I, 125 mL in Fraction II, 235 mL in Fraction III, 145 mL in Fraction IV and 140 mL in Fraction V.
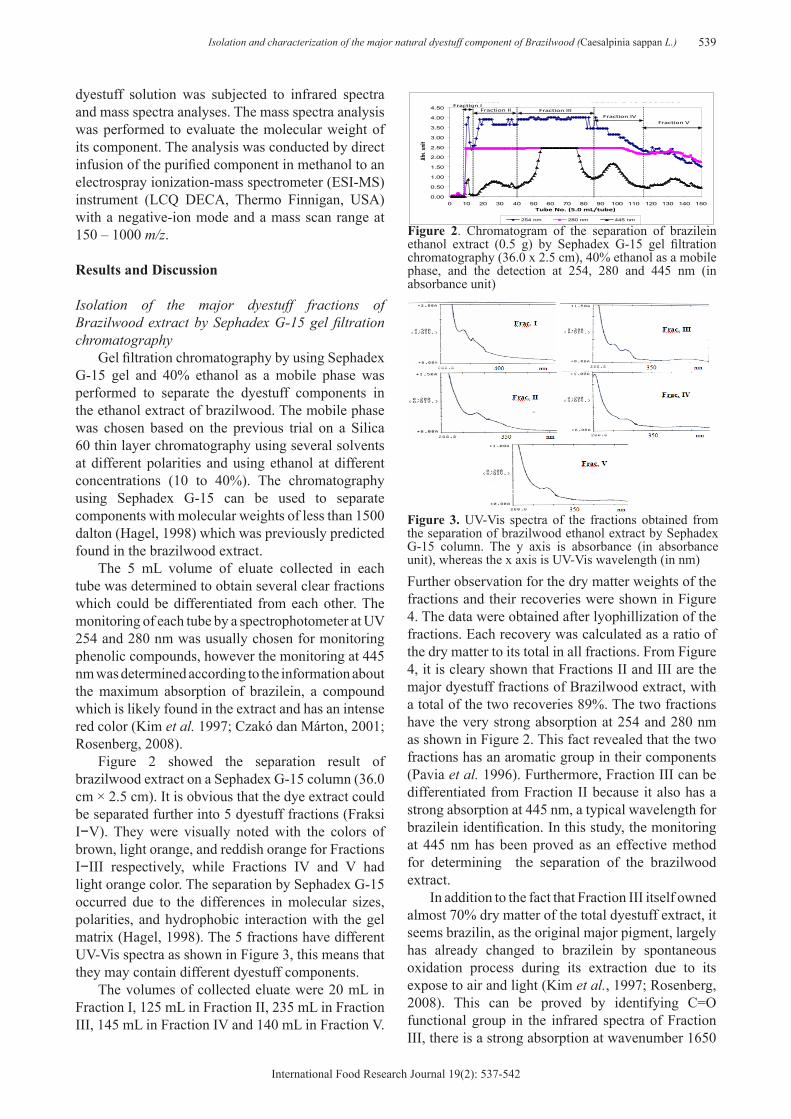
Further observation for the dry matter weights of the fractions and their recoveries were shown in Figure 4. The data were obtained after lyophillization of the fractions. Each recovery was calculated as a ratio of the dry matter to its total in all fractions. From Figure 4, it is cleary shown that Fractions II and III are the major dyestuff fractions of Brazilwood extract, with a total of the two recoveries 89%. The two fractions have the very strong absorption at 254 and 280 nm as shown in Figure 2. This fact revealed that the two fractions has an aromatic group in their components (Pavia et al. 1996). Furthermore, Fraction III can be differentiated from Fraction II because it also has a strong absorption at 445 nm, a typical wavelength for brazilein identification. In this study, the monitoring at 445 nm has been proved as an effective method for determining the separation of the brazilwood extract.
In addition to the fact that Fraction III itself owned almost 70% dry matter of the total dyestuff extract, it seems brazilin, as the original major pigment, largely has already changed to brazilein by spontaneous oxidation process during its extraction due to its expose to air and light (Kim et al., 1997; Rosenberg, 2008). This can be proved by identifying C=O functional group in the infrared spectra of Fraction III, there is a strong absorption at wavenumber 1650
Kromatografi dengan Sephadex G15 28Juli08
0.00
0.50
1.00
1.50
2.00
2.50
3.00
3.50
4.00
4.50
0 10 20 30 40 50 60 70 80 90 100 110 120 130 140 150No Tabung (5.0 ml/tabung)
Abso
rbans
i
254 nm 280 nm 445 nm
Fraction V Fraction IV
Fraction III Fraction II Fraction I
Tube No. (5.0 mL/tube)
Abs. u
nit
Figure 2. Chromatogram of the separation of brazilein ethanol extract (0.5 g) by Sephadex G-15 gel filtration chromatography (36.0 x 2.5 cm), 40% ethanol as a mobile phase, and the detection at 254, 280 and 445 nm (in absorbance unit)
Figure 3. UV-Vis spectra of the fractions obtained from the separation of brazilwood ethanol extract by Sephadex G-15 column. The y axis is absorbance (in absorbance unit), whereas the x axis is UV-Vis wavelength (in nm)
540 Lioe, H.N., Adawiyah, D.R. and Anggraeni, R.
International Food Research Journal 19(2): 537-542
cm−1, which is absent in the spectra of Fraction II, as shown in Figure 5. This result was in accordance with the same study on infrared spectroscopy conducted by Oliveira et al. (2002). By visual observation, Fraction III had much more intense reddish color than Fraction II. The intense color is desired, therefore the isolation and purification of the pigment component in Fraction III became the subsequent investigation.
The HPLC profiles of 5 dyestuff fractions obtained from the Sephadex G-15 separation are shown in Figure 6. The dillution was needed to observe the profiles, i.e. 5, 100, 1000, 100 and 100 times more dilute than the 5.0 mL fraction solutions of Fraction I to V respectively. The HPLC profiles showed that Fraction I had 1 dominant peak with a retention time (RT) of 2.0 min. Fraction II had 3 dominant peaks with RT 1.85, 2.3 dan 4.0 min. Fraksi III to V had only 1 dominant peak with RT 2.3 min. It seems that the same component as in Fraction II was also found in Fraction III, by looking at the same RT. By considering the area integration of the peaks compared to the total area and the dillution factor of the fractions, it is obvious that the most major peak was that with RT 2.3 min. It had around 78% total area integration by crude calculation to all peak area obtained. It is then followed by the peak with RT 1.8−1.9 min with a
share of 19% and the lowest 2% for peak with RT 4.0 min. The pigment component assigned by the peak at RT 2.3 min was the major dyestuff component of Fraction III and its content approached 80% of the total area at the same retention time (RT 2.3 min). As described previously, Fraction III is predicted to contain brazilein and its concentration is relatively high. This high concentration may have a benefit for the production of brazilein standard for the laboratory use, by only performing Sephadex G-15 separation.
Characterization of the purified component in the major dyestuff fraction
Fraction III of brazilwood extract from Sephadex G-15 separation was chromatographed further by HPLC to obtain the pure dyestuff component for its characterization by UV-Vis spectrophotometer, FTIR and ESI mass spectrometers. The purification was performed by several times of HPLC injection, and collecting the eluate at RT 2.3 min that appeared as the major peak of Fraction III. The collected eluate had an intense reddish color. After drying by nitrogen gas and dissolving it in 50% ethanol at a certain volume, it was subjected to further characterization. Reinjection into HPLC of the purified HPLC fraction confirmed the 90% purity based on its area integration.
0
20
40
60
80
100
120
140
160
I II III IV V
Fraksi
Pad
ata
n k
eri
ng
(m
g) A
0102030405060708090
100
I II III IV V
Fraksi
Rec
over
y (%
)
B
Fraction Fraction
Dry
mat
ter
(mg)
Figure 4. Total dry matter (A) and recovery (B) of the fractionation result of brazilwood extract (0.5 g) by Sephadex G-15 gel filtration chromatography with 40% ethanol as a mobile phase
Wavenumber (cm−1)
C - H H
O - H
Tran
smitt
ance
(%) A
100
C=O C-H O-H
Wavenumber (cm−1)
Tran
smitt
ance
(%) B
100
Figure 5. Infrared spectra of Fraction II (A) and Fraction III (B) of brazilwood extract obtained by Sephadex G-15
column separation
Fraction I (dillution 5 times)
Fraction IV (dillution 100 times)
Fraction V (dillution 100 times)
Fraction III (dillution 1000 times)
Fraction II (dillution 100 times)
Figure 6. HPLC Profiles of 5 dyestuff fractions obtained from the separation by Sephadex G-15 column of brazilwood ethanol extract. HPLC condition: isocratic, column C18 (15 cm X 4.6 cm i.d., 5 µm), detection at UV 254 nm by multiwavelength detector (MWD), mobile phase: the mix of acetonitrile and isopropanol (65:35), flow rate 0.6 mL/min
Isolation and characterization of the major natural dyestuff component of Brazilwood (Caesalpinia sappan L.) 541
International Food Research Journal 19(2): 537-542
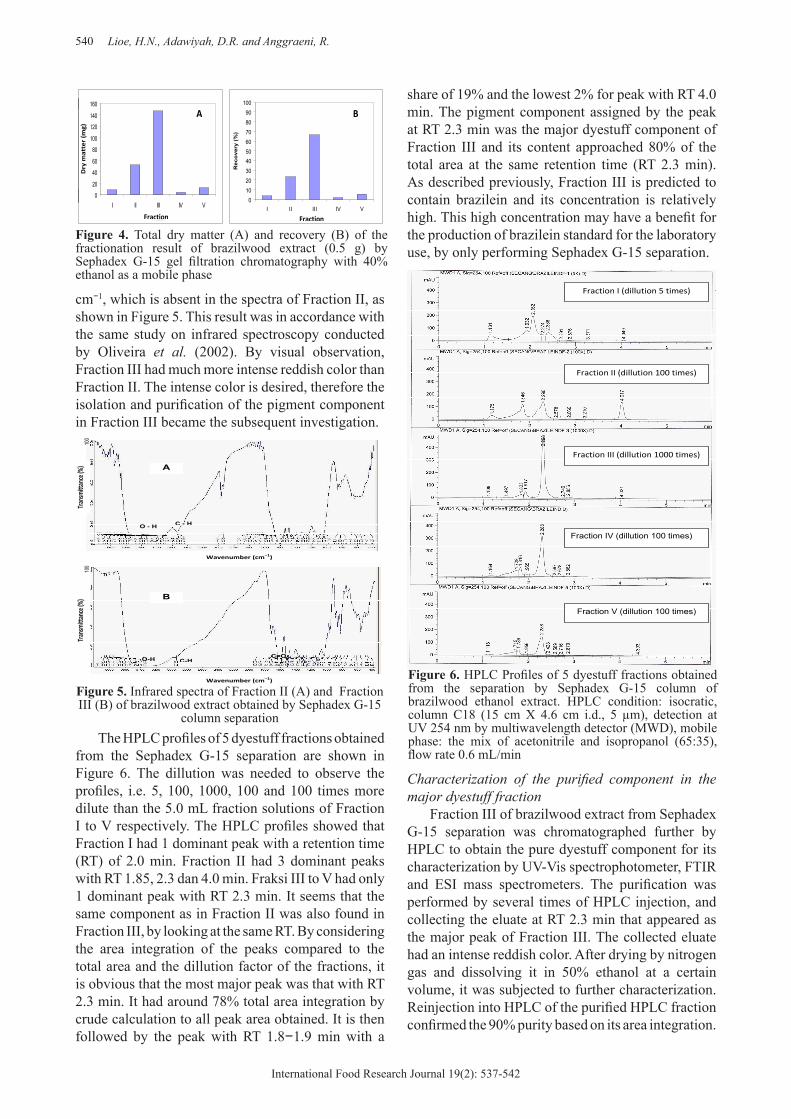
Its infrared spectra obtained by a FTIR instrument (Figure 7) showed a very strong absorption at 1650 cm−1. This result mentions that the component has a C=O (carbonyl) functional group (Oliveira et al., 2002) which is present in the structure of brazilein as a predicted component. Different from brazilein, brazilin does not have this C=O group in its structure (Figure 1). However, this prediction needs further confirmation by ESI-MS instrument to confirm its molecular weight.
Molecular weight of the major component can be elucidated by the analysis using a ESI-MS instrument. This instrument is usually used for the mass spectra analysis of polar and non volatile compounds. The analysis by ESI-MS has a soft ionization mode, therefore the information gained from its result is only on the molecular weight (Agilent Technologies, 2005; Rosenberg, 2008), which can be seen in the resulted mass spectra. The highest peak in the ESI-MS spectra is the molecule ion peak which directly mentions its molecule ion mass, and therefore used for the determination of the molecular weight.
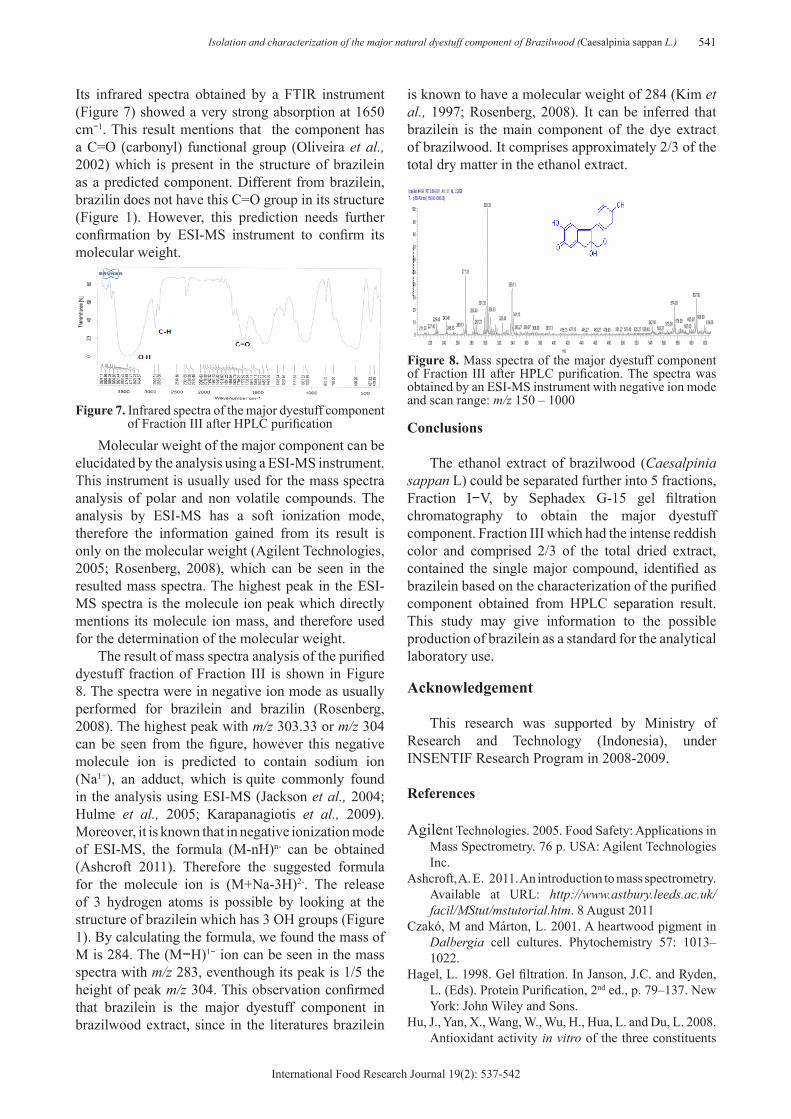
The result of mass spectra analysis of the purified dyestuff fraction of Fraction III is shown in Figure 8. The spectra were in negative ion mode as usually performed for brazilein and brazilin (Rosenberg, 2008). The highest peak with m/z 303.33 or m/z 304 can be seen from the figure, however this negative molecule ion is predicted to contain sodium ion (Na1+), an adduct, which is quite commonly found in the analysis using ESI-MS (Jackson et al., 2004; Hulme et al., 2005; Karapanagiotis et al., 2009). Moreover, it is known that in negative ionization mode of ESI-MS, the formula (M-nH)n- can be obtained (Ashcroft 2011). Therefore the suggested formula for the molecule ion is (M+Na-3H)2-. The release of 3 hydrogen atoms is possible by looking at the structure of brazilein which has 3 OH groups (Figure 1). By calculating the formula, we found the mass of M is 284. The (M−H)1− ion can be seen in the mass spectra with m/z 283, eventhough its peak is 1/5 the height of peak m/z 304. This observation confirmed that brazilein is the major dyestuff component in brazilwood extract, since in the literatures brazilein
is known to have a molecular weight of 284 (Kim et al., 1997; Rosenberg, 2008). It can be inferred that brazilein is the main component of the dye extract of brazilwood. It comprises approximately 2/3 of the total dry matter in the ethanol extract.
Conclusions
The ethanol extract of brazilwood (Caesalpinia sappan L) could be separated further into 5 fractions, Fraction I−V, by Sephadex G-15 gel filtration chromatography to obtain the major dyestuff component. Fraction III which had the intense reddish color and comprised 2/3 of the total dried extract, contained the single major compound, identified as brazilein based on the characterization of the purified component obtained from HPLC separation result. This study may give information to the possible production of brazilein as a standard for the analytical laboratory use.
Acknowledgement
This research was supported by Ministry of Research and Technology (Indonesia), under INSENTIF Research Program in 2008-2009.
References
Agilent Technologies. 2005. Food Safety: Applications in Mass Spectrometry. 76 p. USA: Agilent Technologies Inc.
Ashcroft, A. E. 2011. An introduction to mass spectrometry. Available at URL: http://www.astbury.leeds.ac.uk/facil/MStut/mstutorial.htm. 8 August 2011
Czakó, M and Márton, L. 2001. A heartwood pigment in Dalbergia cell cultures. Phytochemistry 57: 1013–1022.
Hagel, L. 1998. Gel filtration. In Janson, J.C. and Ryden, L. (Eds). Protein Purification, 2nd ed., p. 79–137. New York: John Wiley and Sons.
Hu, J., Yan, X., Wang, W., Wu, H., Hua, L. and Du, L. 2008. Antioxidant activity in vitro of the three constituents
Figure 7. Infrared spectra of the major dyestuff component of Fraction III after HPLC purification
D:\brasilien 6/19/2009 3:48:05 PM Brazilienneg mode
RT: 0.00 - 0.99
0.00 0.05 0.10 0.15 0.20 0.25 0.30 0.35 0.40 0.45 0.50 0.55 0.60 0.65 0.70 0.75 0.80 0.85 0.90 0.95Time (min)
0
10
20
30
40
50
60
70
80
90
100
Rela
tive A
bundance
0.430.40
0.160.07 0.330.240.100.04 0.360.60
0.780.730.570.67 0.82
0.94 0.970.90
NL:3.39E10TIC MS brasilien
brasilien #4-54 RT: 0.06-0.81 AV: 51 NL: 2.26E8T: - p ESI Full ms [ 150.00-1000.00]
220 240 260 280 300 320 340 360 380 400 420 440 460 480 500 520 540 560 580 600 620m/z
0
10
20
30
40
50
60
70
80
90
100
Rela
tive A
bundance
303.33
271.33
339.13
607.00301.33 574.93
304.33283.40341.13 608.00243.40 325.40 605.00229.40 576.00287.27 542.93 619.00573.00269.13 587.00227.40 345.27 359.07 369.00245.33 393.13211.33 553.27507.40501.27 539.40525.27427.13415.13 445.27 476.93463.27
Figure 8. Mass spectra of the major dyestuff component of Fraction III after HPLC purification. The spectra was obtained by an ESI-MS instrument with negative ion mode and scan range: m/z 150 – 1000
542 Lioe, H.N., Adawiyah, D.R. and Anggraeni, R.
International Food Research Journal 19(2): 537-542
from Caesalpinia sappan L. Tsinghua Science and Technology 13: 474–479.
Hulme, A. N., McNab, H., Peggie, D. A. and Quye, A. 2005. Negative ion electrospray mass spectrometry of neoflavonoids. Phytochemistry 66: 2766–2770.
Jackson, A. T., Slade, S. E. and Scrivens, J. H. 2004. Characterisation of poly(alkyl methacrylate)s by means of electrospray ionisation-tandem mass spectrometry (ESI-MS/MS). International Journal of Mass Spectrometry 238: 265–277.
Karapanagiotis, I., sist. Daniilia, Andreas, T. And Chryssoulakis, Y. 2005. Identification of red natural dyes in post-byzantine icons by HPLC. Journal of Liquid Chromatography and Related Technologies 28: 739–749.
Karapanagiotis, I., Minopoulou, E., Valianou, L., Daniilia, S. and Chryssoulakis, Y. 2009. Investigation of the colourants used in icons of the Cretan School of iconography. Analytica Chimica Acta 647: 231– 242.
Karapanagiotis, I., Lakka, A., Valianou, L. and Chryssoulakis, Y. 2008. High-performance liquid chromatographic determination of colouring matters in historical garments from the Holy Mountain of Athos. Microchimica Acta 160: 477–483.
Kim, D. S., Baek, N. I., Oh, S. R., Jung, K. Y., Lee, I. S. and Lee, H. K. 1997. NMR assignment of brazilein. Phytochemistry 46: 177–178.
Lim, M. Y, Jeon, J. H., Jeong, E. Y., Lee, C. H. and Lee, H. S. 2007. Antimicrobial activity of 5-hydroxy-1,4-naphthoquinone isolated from Caesalpinia sappan toward intestinal bacteria. Food Chemistry 100: 1254–1258.
Oliveira, L. F. C., Edwards, H. G. M., Velozo, E. S. and Nesbitt, M. 2002. Vibrational spectroscopic study of brazilin and brazilein, the main constituents of brazilwood from Brazil. Vibrational Spectroscopy 28: 243–249.
Pavia, D. L., Lampman, G. M. and Kriz, G. S. 1996. Introduction to Spectroscopy, 2nd ed., 511 p. Philadelphia: Harcourt Brace College Publ.
Rosenberg, E. 2008. Characterisation of historical organic dyestuffs by liquid chromatography-mass spectrometry. Analytical and Bioanalytical Chemistry 391: 33–57.
Shen, J., Zhang, H., Lin, H., Su, H., Xing, D. and Du, L. 2007. Brazilein protects the brain against focal cerebral ischemia reperfusion injury correlating to inflammatory response suppression. European Journal of Pharmacology 558: 88–95.
Yan, X., Wang, W., Xing, D., Zhao, Y. and Du, L. 2005. Development and optimization of a method for the analysis of Brazilein by HPLC with electrochemical detection. Journal of Chromatography A 1077: 44–48.
Ye, M., Xie, W., Lei, F., Meng, Z., Zhao, Y., Su, H. and Du, L. 2006. Brazilein, an important immunosuppressive component from Caesalpinia sappan L. International Immunopharmacology 6: 426–432.