ISO New England Overview - Connecticut · ISO New England Overview . ISO NEW ENGLAND OVERVIEW ......
37
OCTOBER 23, 2013 | HARTFORD, CT Eric Johnson DIRECTOR, EXTERNAL AFFAIRS Resources Recovery Task Force Meeting ISO New England Overview
Transcript of ISO New England Overview - Connecticut · ISO New England Overview . ISO NEW ENGLAND OVERVIEW ......
O C T O B E R 2 3 , 2 0 1 3 | H A R T F O R D , C T
Eric Johnson D I R E C T O R , E X T E R N A L A F F A I R S
Resources Recovery Task Force Meeting
ISO New England Overview
ISO NEW ENGLAND OVERVIEW Eric Johnson, Director, External Affairs
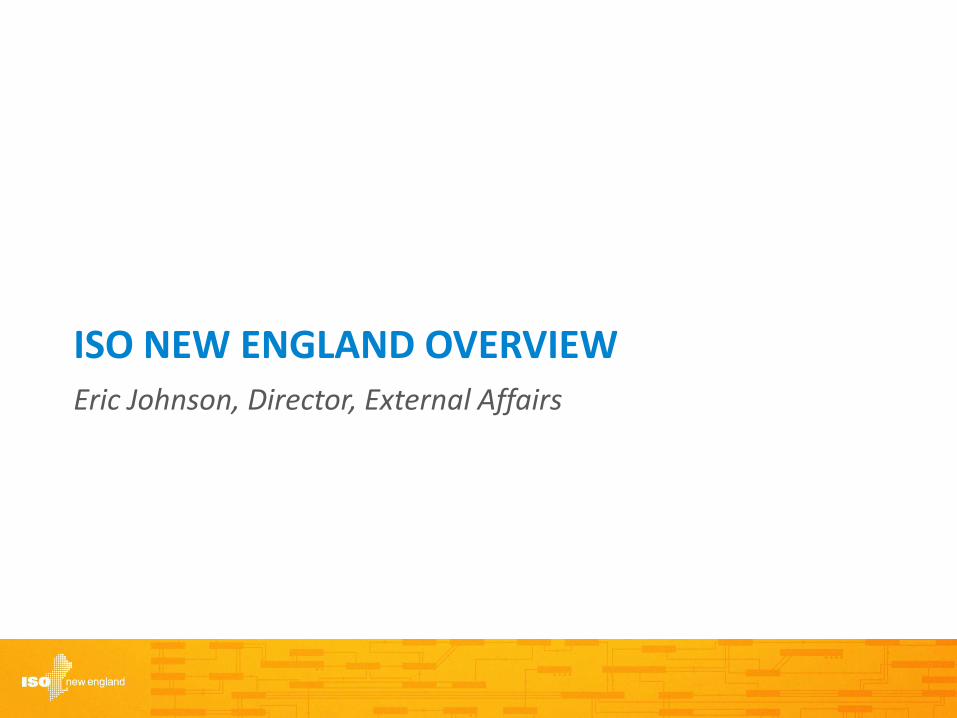
About ISO New England
• Not-for-profit corporation created in 1997 to oversee New England’s restructured electric power system – Regulated by the Federal Energy Regulatory
Commission (FERC)
• Regional Transmission Organization
– Independent of companies doing business in the market
– No financial interest in companies participating in the market
– Neutral as to resource fuel type
• Major Responsibilities – Operating the Regional Power System – Administering Wholesale Electricity Markets – Regional Power System Planning
3
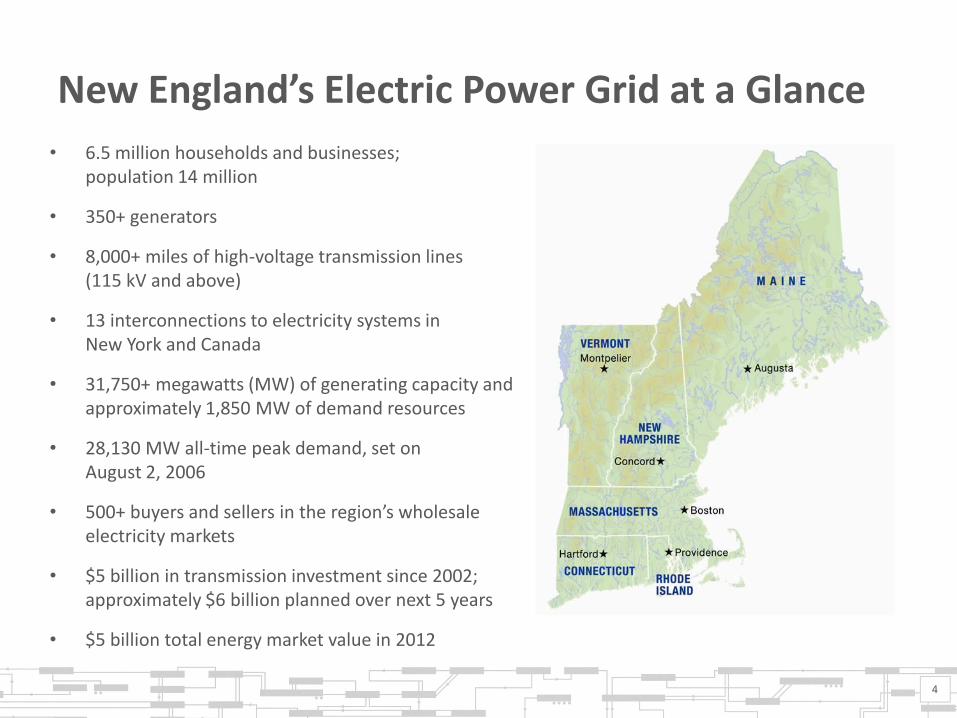
New England’s Electric Power Grid at a Glance
• 6.5 million households and businesses; population 14 million
• 350+ generators
• 8,000+ miles of high-voltage transmission lines (115 kV and above)
• 13 interconnections to electricity systems in New York and Canada
• 31,750+ megawatts (MW) of generating capacity and approximately 1,850 MW of demand resources
• 28,130 MW all-time peak demand, set on August 2, 2006
• 500+ buyers and sellers in the region’s wholesale electricity markets
• $5 billion in transmission investment since 2002; approximately $6 billion planned over next 5 years
• $5 billion total energy market value in 2012
4
Industry Structure in New England
5
*NESCOE: New England States Committee on Electricity *NECPUC: New England Conference of Public Utilities Commissioners
Federal Energy Regulatory Commission
North American Electric Reliability Corporation
Northeast Power Coordinating Council
Independent Board of Directors
ISO New England New England Electricity
Market Participants (NEPOOL)
New England States
Policymakers
Public Utility Commissions (NECPUC)*
Environmental Regulators
Energy Boards and Commissions
Governors (NESCOE)*
Consumer Advocates,
Attorneys General, Consumer Liaison
Group
Six Sectors: Generators, Transmission Owners,
Suppliers, Publicly Owned Entities, End Users, Alternative
Resources
Participants Committee and Technical Committees
Markets, Reliability, and Transmission
Committees
Operating the Power System
Administering Wholesale
Electricity Markets
Power System Planning
Comprehensive Regional Planning Process through
Planning Advisory Committee
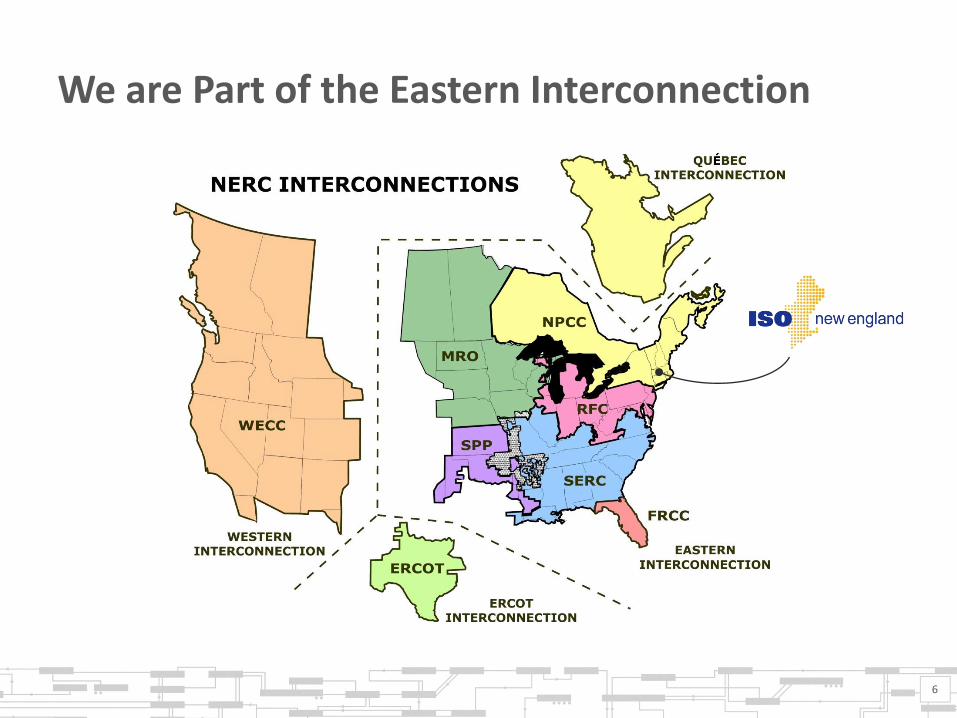
We are Part of the Eastern Interconnection
6
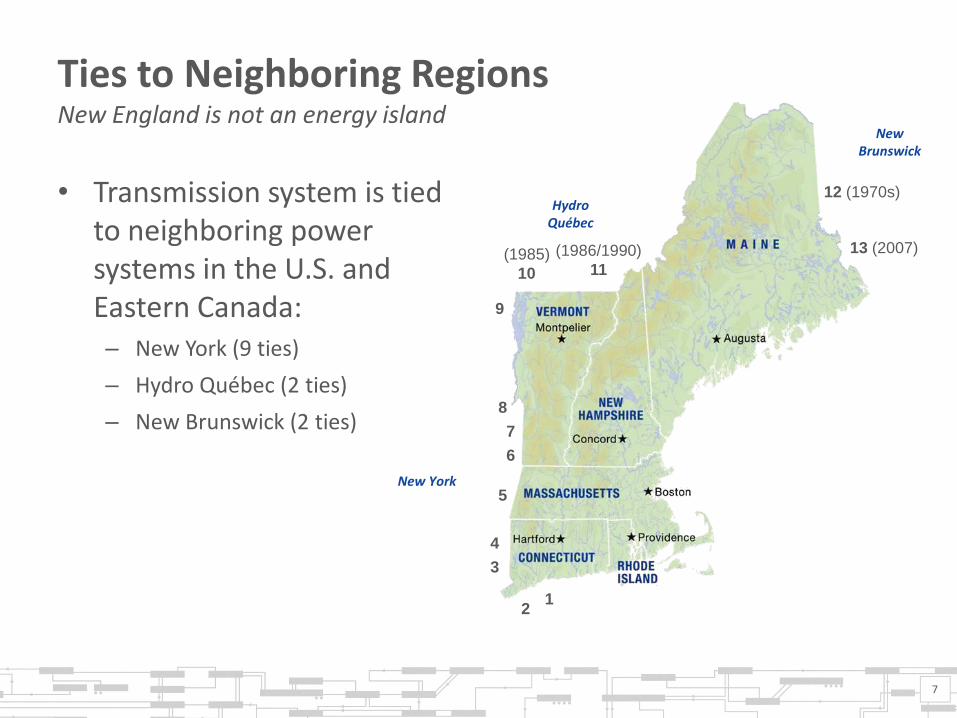
Ties to Neighboring Regions New England is not an energy island
• Transmission system is tied to neighboring power systems in the U.S. and Eastern Canada: – New York (9 ties)
– Hydro Québec (2 ties)
– New Brunswick (2 ties)
7
New Brunswick
Hydro Québec
New York 5
6
(1986/1990)
11 (1985)
10
12 (1970s)
1 2
4
8
9
3
13 (2007)
7
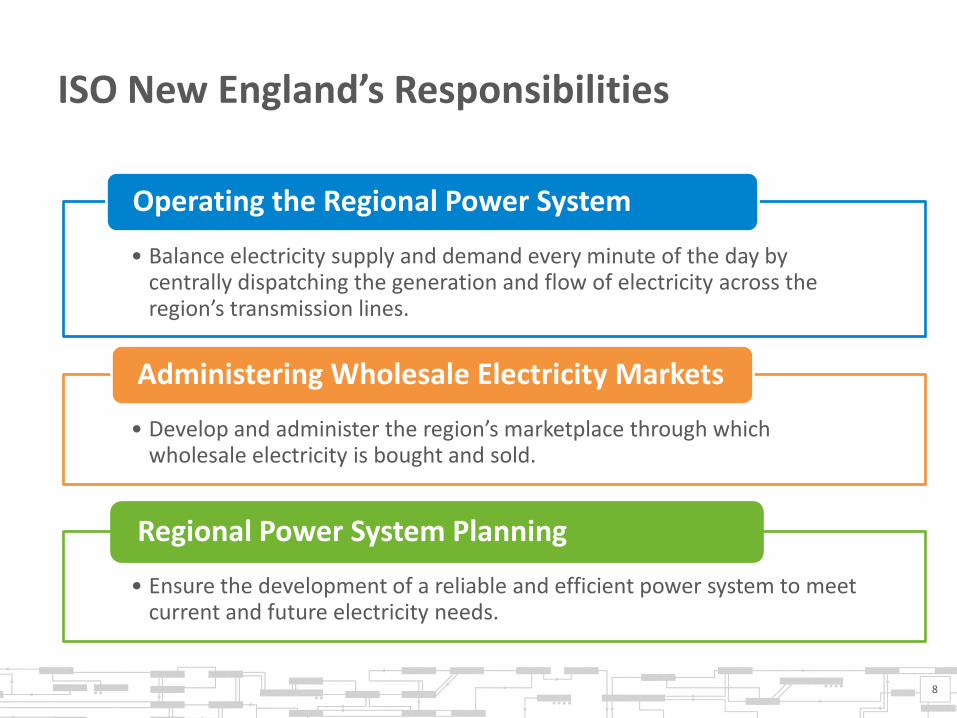
ISO New England’s Responsibilities
• Balance electricity supply and demand every minute of the day by centrally dispatching the generation and flow of electricity across the region’s transmission lines.
Operating the Regional Power System
• Ensure the development of a reliable and efficient power system to meet current and future electricity needs.
Regional Power System Planning
• Develop and administer the region’s marketplace through which wholesale electricity is bought and sold.
Administering Wholesale Electricity Markets
8
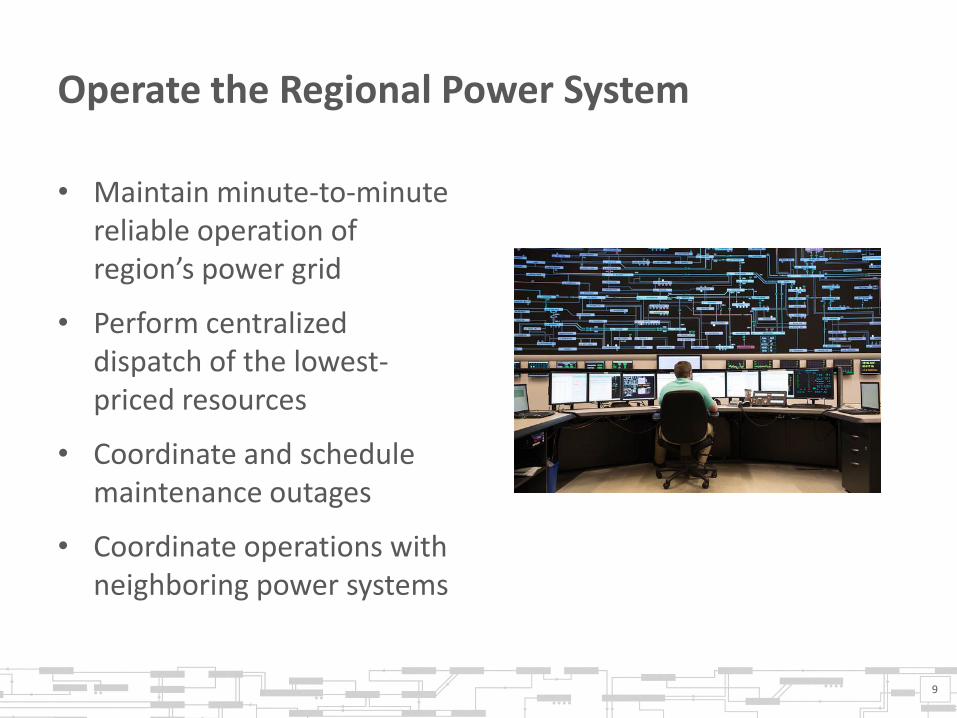
Operate the Regional Power System
• Maintain minute-to-minute reliable operation of region’s power grid
• Perform centralized dispatch of the lowest-priced resources
• Coordinate and schedule maintenance outages
• Coordinate operations with neighboring power systems
9
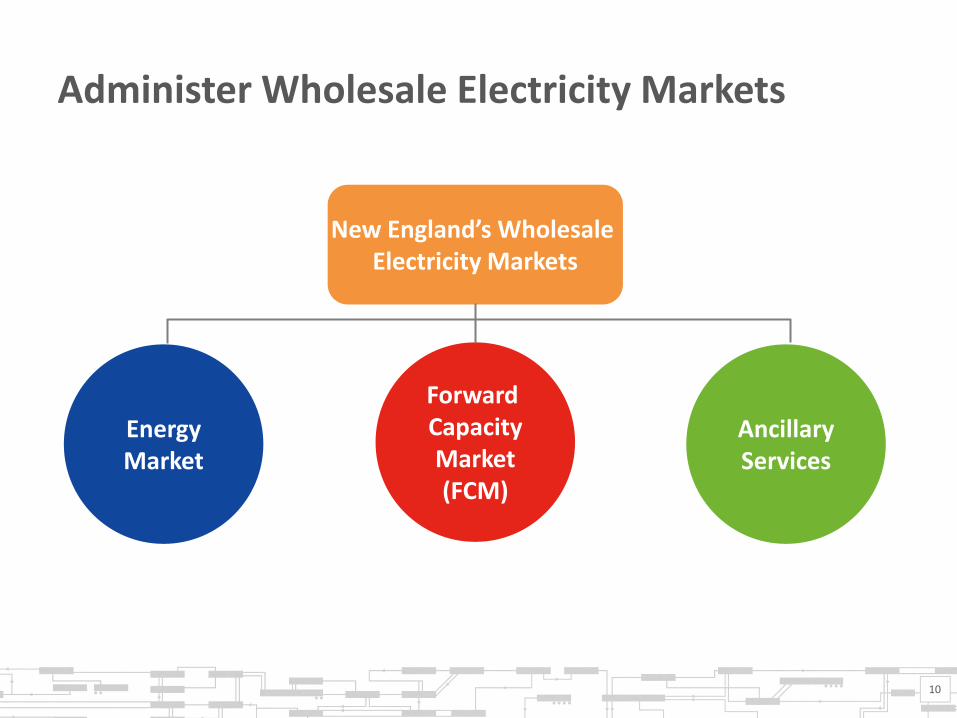
Administer Wholesale Electricity Markets
Energy Market
New England’s Wholesale Electricity Markets
Forward Capacity Market (FCM)
Ancillary Services
10
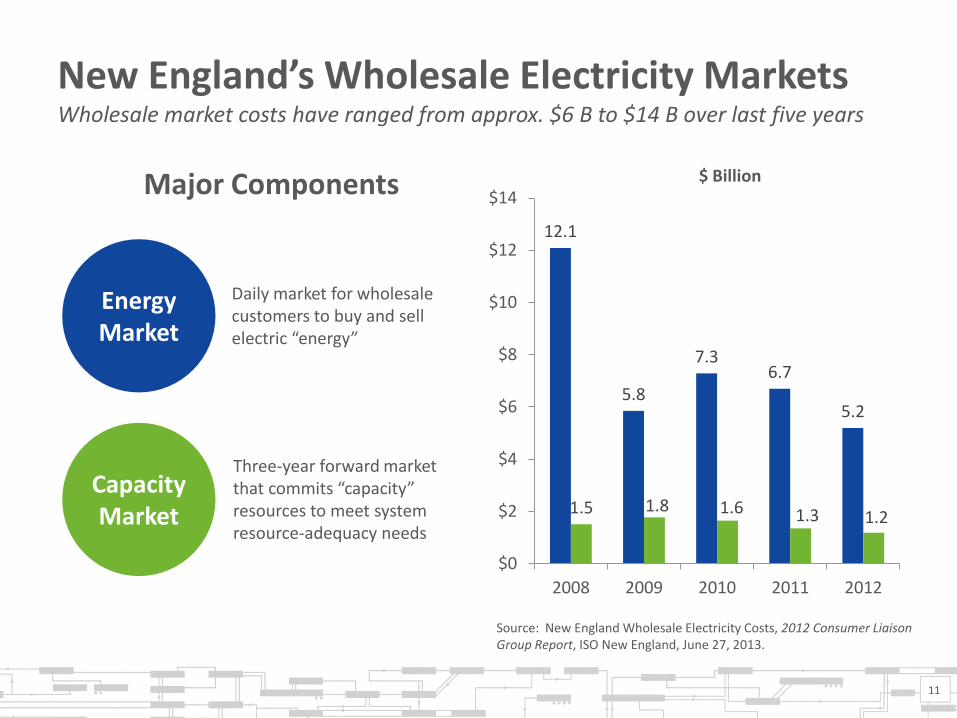
New England’s Wholesale Electricity Markets Wholesale market costs have ranged from approx. $6 B to $14 B over last five years
$ Billion
Capacity Market
Three-year forward market that commits “capacity” resources to meet system resource-adequacy needs
Energy Market
Daily market for wholesale customers to buy and sell electric “energy”
Major Components
11
12.1
5.8
7.3 6.7
5.2
1.5 1.8 1.6 1.3 1.2
$0
$2
$4
$6
$8
$10
$12
$14
2008 2009 2010 2011 2012
Source: New England Wholesale Electricity Costs, 2012 Consumer Liaison Group Report, ISO New England, June 27, 2013.
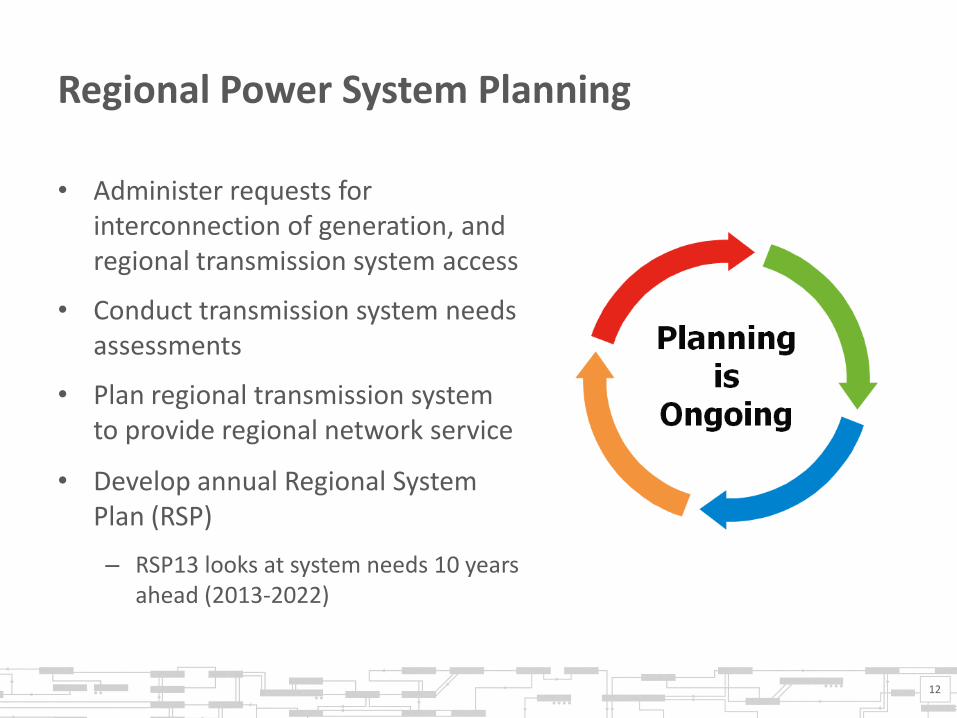
Regional Power System Planning
• Administer requests for interconnection of generation, and regional transmission system access
• Conduct transmission system needs assessments
• Plan regional transmission system to provide regional network service
• Develop annual Regional System Plan (RSP)
– RSP13 looks at system needs 10 years ahead (2013-2022)
12
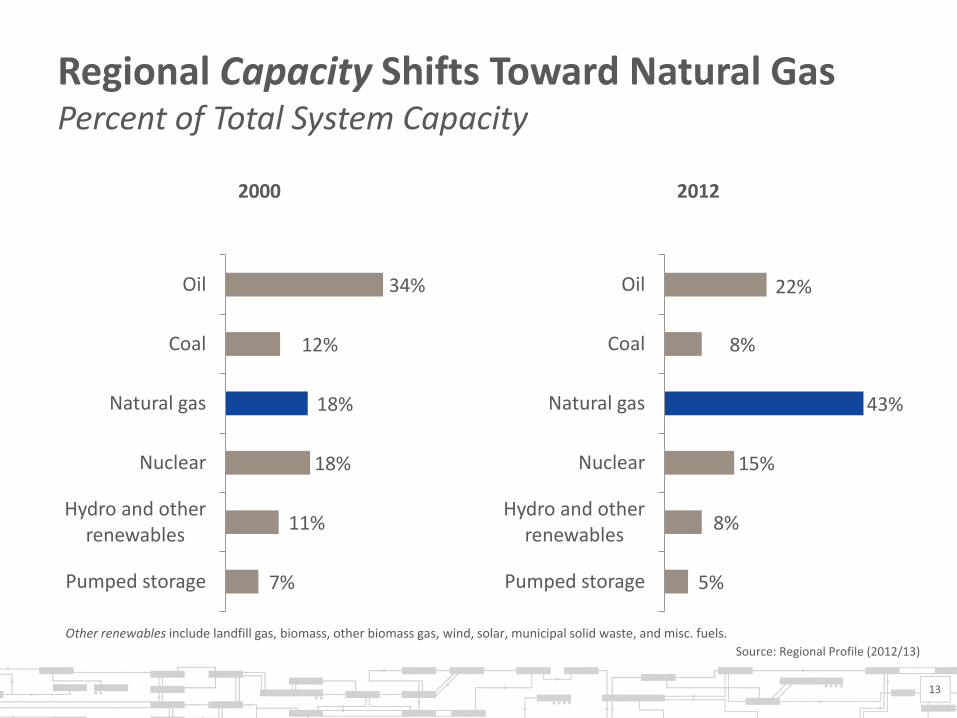
Regional Capacity Shifts Toward Natural Gas Percent of Total System Capacity
7%
11%
18%
18%
12%
34%
Pumped storage
Hydro and other renewables
Nuclear
Natural gas
Coal
Oil
2000
5%
8%
15%
43%
8%
22%
Pumped storage
Hydro and other renewables
Nuclear
Natural gas
Coal
Oil
2012
13
Other renewables include landfill gas, biomass, other biomass gas, wind, solar, municipal solid waste, and misc. fuels.
Source: Regional Profile (2012/13)
Regional Energy Shifts Toward Natural Gas Percent of Total Electric Energy Production
2%
13%
31%
15%
18%
22%
Pumped storage
Hydro and other renewables
Nuclear
Natural gas
Coal
Oil
2000
1%
13%
31%
52%
3%
Pumped storage
Hydro and other renewables
Nuclear
Natural gas
Coal
Oil
2012
14
Other renewables include landfill gas, biomass, other biomass gas, wind, solar, municipal solid waste, and misc. fuels.
<1%
Source: Regional Profile (2012/13)
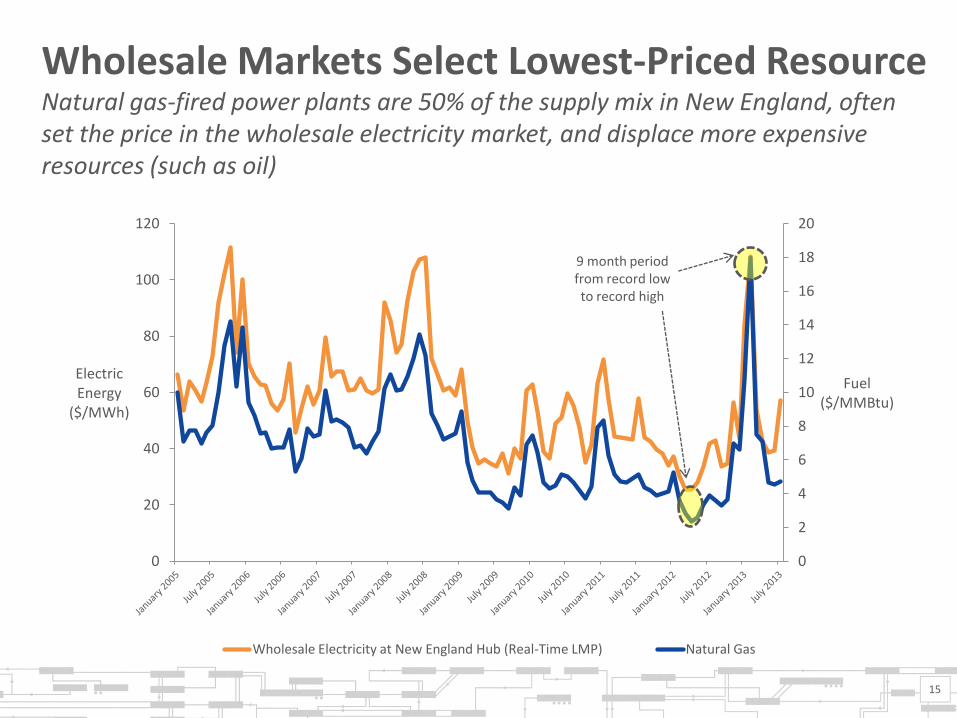
Wholesale Markets Select Lowest-Priced Resource Natural gas-fired power plants are 50% of the supply mix in New England, often set the price in the wholesale electricity market, and displace more expensive resources (such as oil)
0
2
4
6
8
10
12
14
16
18
20
0
20
40
60
80
100
120
Fuel ($/MMBtu)
Electric Energy
($/MWh)
Wholesale Electricity at New England Hub (Real-Time LMP) Natural Gas
9 month period from record low to record high
15
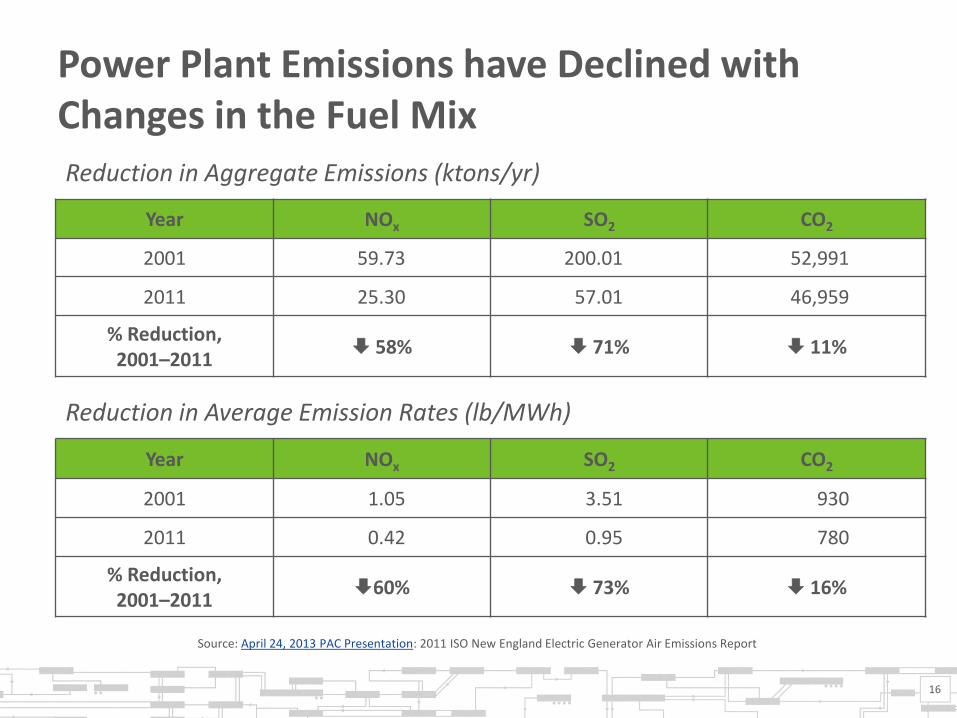
Power Plant Emissions have Declined with Changes in the Fuel Mix
16
Year NOx SO2 CO2
2001 59.73 200.01 52,991
2011 25.30 57.01 46,959
% Reduction, 2001–2011
58% 71% 11%
Year NOx SO2 CO2
2001 1.05 3.51 930
2011 0.42 0.95 780
% Reduction, 2001–2011
60% 73% 16%
Source: April 24, 2013 PAC Presentation: 2011 ISO New England Electric Generator Air Emissions Report
Reduction in Aggregate Emissions (ktons/yr)
Reduction in Average Emission Rates (lb/MWh)
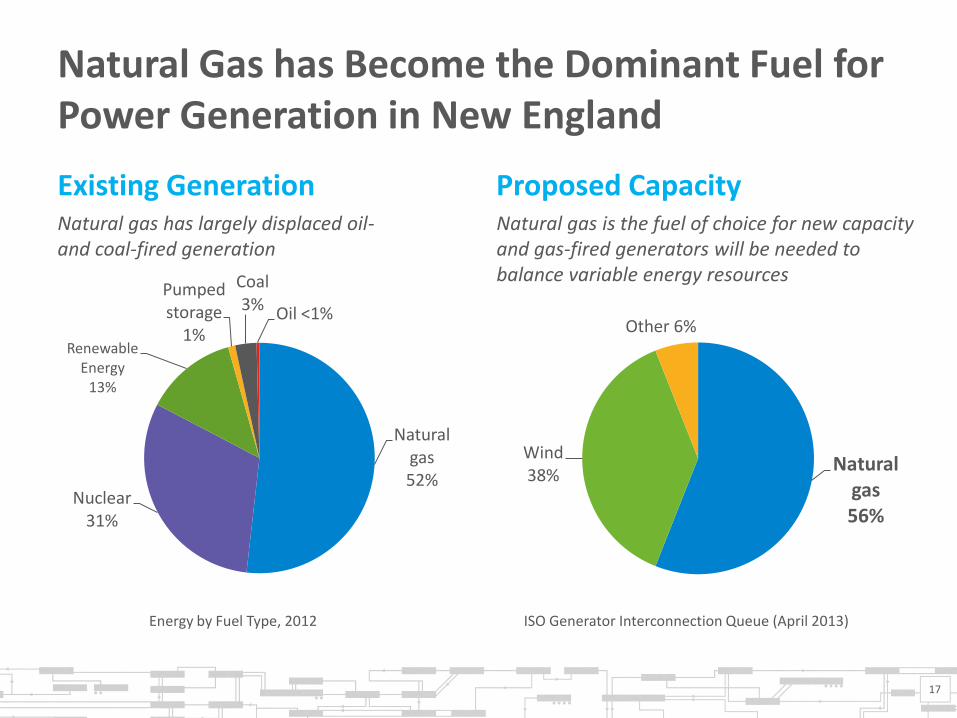
Natural Gas has Become the Dominant Fuel for Power Generation in New England
Existing Generation
Natural gas 52%
Nuclear 31%
Renewable Energy
13%
Pumped storage
1%
Coal 3% Oil <1%
Proposed Capacity
Natural gas 56%
Wind 38%
Other 6%
17
Energy by Fuel Type, 2012 ISO Generator Interconnection Queue (April 2013)
Natural gas is the fuel of choice for new capacity and gas-fired generators will be needed to balance variable energy resources
Natural gas has largely displaced oil- and coal-fired generation
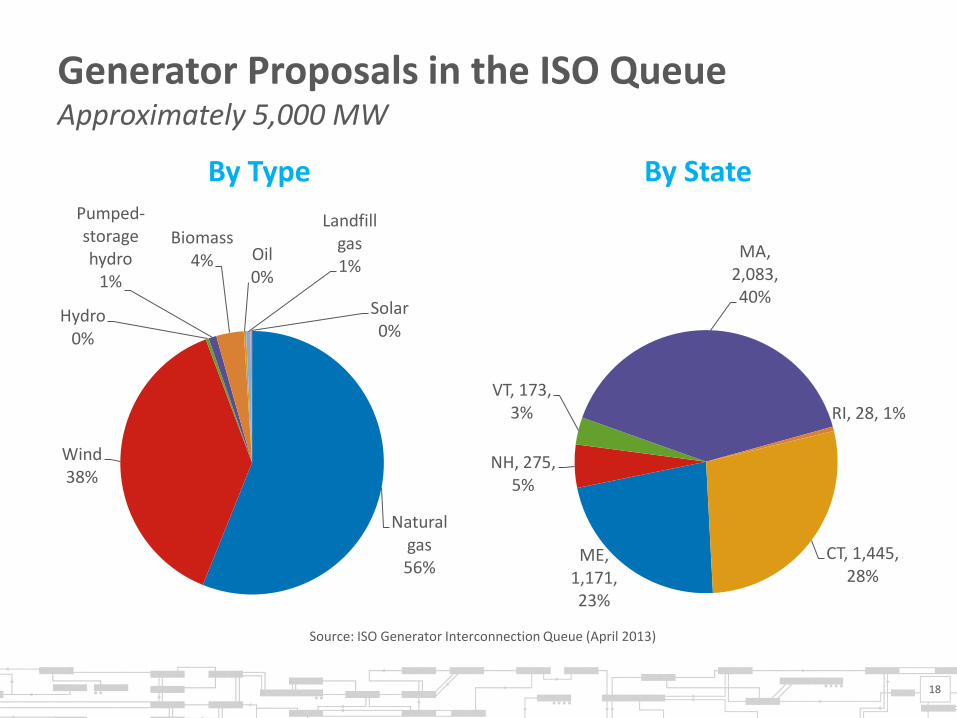
Generator Proposals in the ISO Queue Approximately 5,000 MW
By Type
Natural gas 56%
Wind 38%
Hydro 0%
Pumped-storage hydro
1%
Biomass 4% Oil
0%
Landfill gas 1%
Solar 0%
By State
ME, 1,171, 23%
NH, 275, 5%
VT, 173, 3%
MA, 2,083, 40%
RI, 28, 1%
CT, 1,445, 28%
Source: ISO Generator Interconnection Queue (April 2013)
18
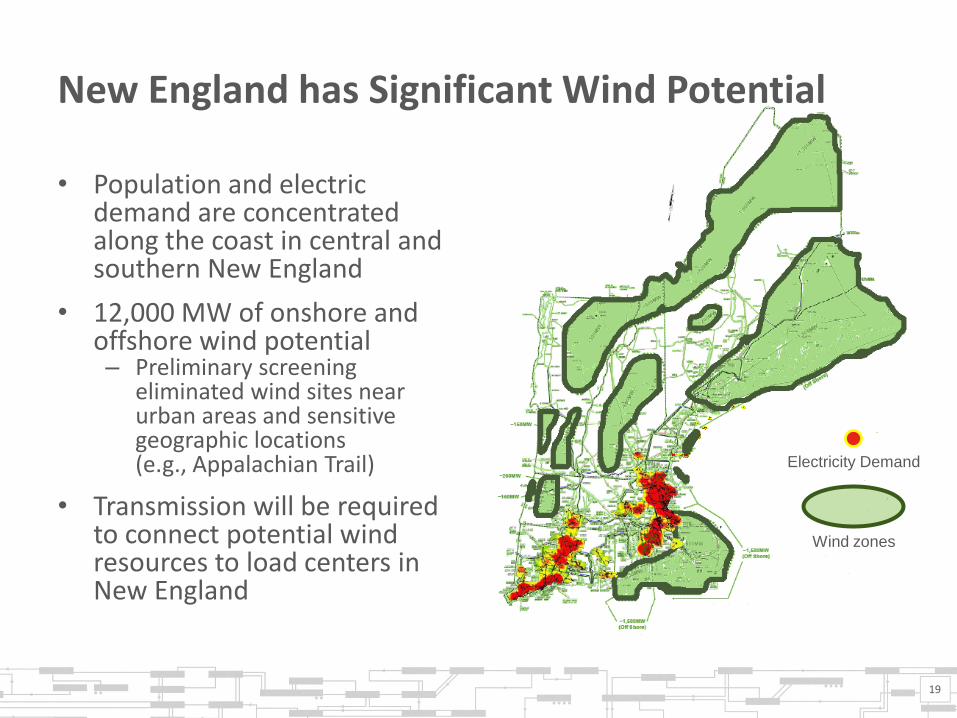
New England has Significant Wind Potential
• Population and electric demand are concentrated along the coast in central and southern New England
• 12,000 MW of onshore and offshore wind potential – Preliminary screening
eliminated wind sites near urban areas and sensitive geographic locations (e.g., Appalachian Trail)
• Transmission will be required to connect potential wind resources to load centers in New England
19
Wind zones
Electricity Demand
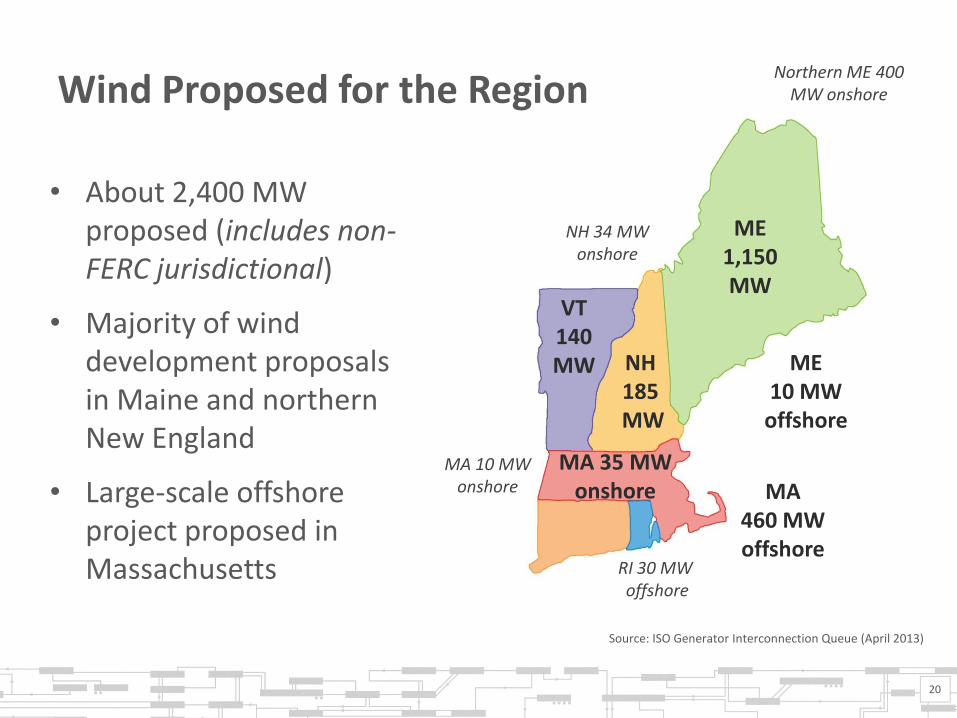
Wind Proposed for the Region
• About 2,400 MW proposed (includes non-FERC jurisdictional)
• Majority of wind development proposals in Maine and northern New England
• Large-scale offshore project proposed in Massachusetts
20
MA 35 MW onshore MA
460 MW offshore
ME 1,150 MW
NH 185
MW
VT 140 MW ME
10 MW offshore
RI 30 MW offshore
Northern ME 400 MW onshore
MA 10 MW onshore
NH 34 MW onshore
Source: ISO Generator Interconnection Queue (April 2013)
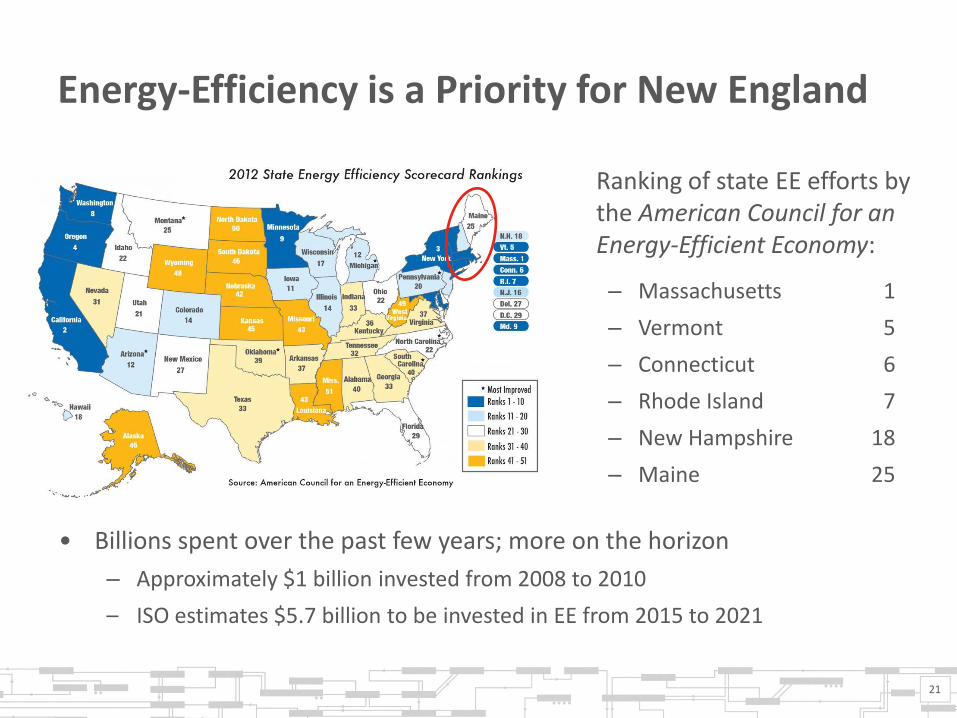
Energy-Efficiency is a Priority for New England
Ranking of state EE efforts by the American Council for an Energy-Efficient Economy:
– Massachusetts 1
– Vermont 5
– Connecticut 6
– Rhode Island 7
– New Hampshire 18
– Maine 25
• Billions spent over the past few years; more on the horizon
– Approximately $1 billion invested from 2008 to 2010
– ISO estimates $5.7 billion to be invested in EE from 2015 to 2021
21
130,000
135,000
140,000
145,000
150,000
155,000
2013 2015 2017 2019 2021
Fo
reca
st
of
An
nu
al E
lectr
ic E
ne
rgy
De
ma
nd
(G
Wh
)
RSP13 RSP13-FCM RSP13-FCM-EEF
28,000
29,000
30,000
31,000
32,000
33,000
34,000
35,000
2013 2015 2017 2019 2021
Fo
rca
st o
f 9
0/1
0 S
um
me
r P
ea
k (
MW
)
RSP13 RSP13-FCM RSP13-FCM-EEF
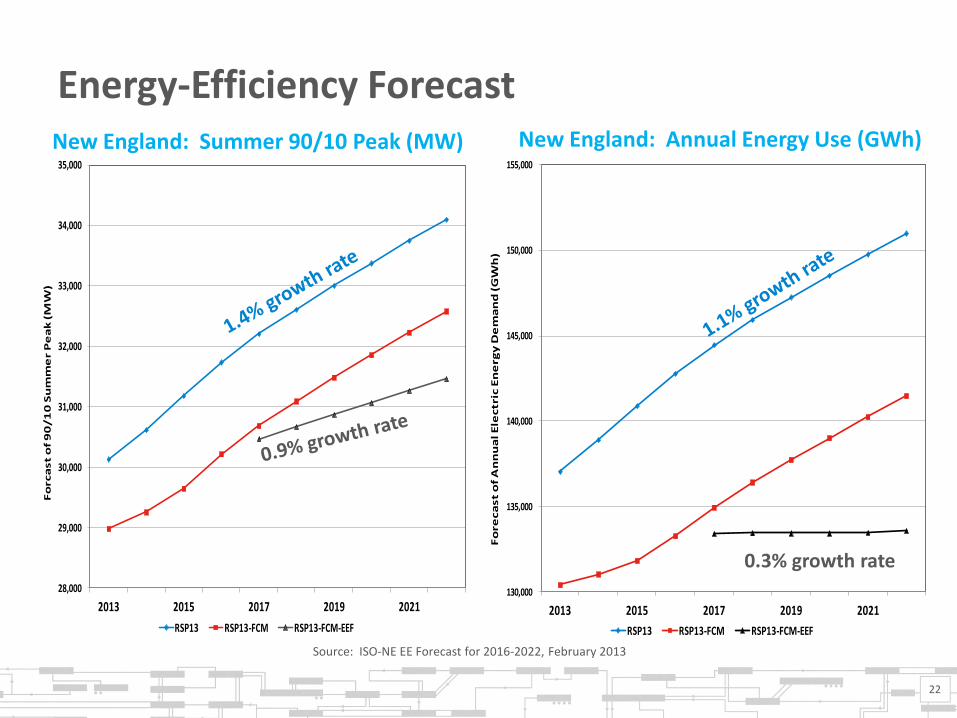
Energy-Efficiency Forecast
22
New England: Annual Energy Use (GWh) New England: Summer 90/10 Peak (MW)
0.3% growth rate
Source: ISO-NE EE Forecast for 2016-2022, February 2013
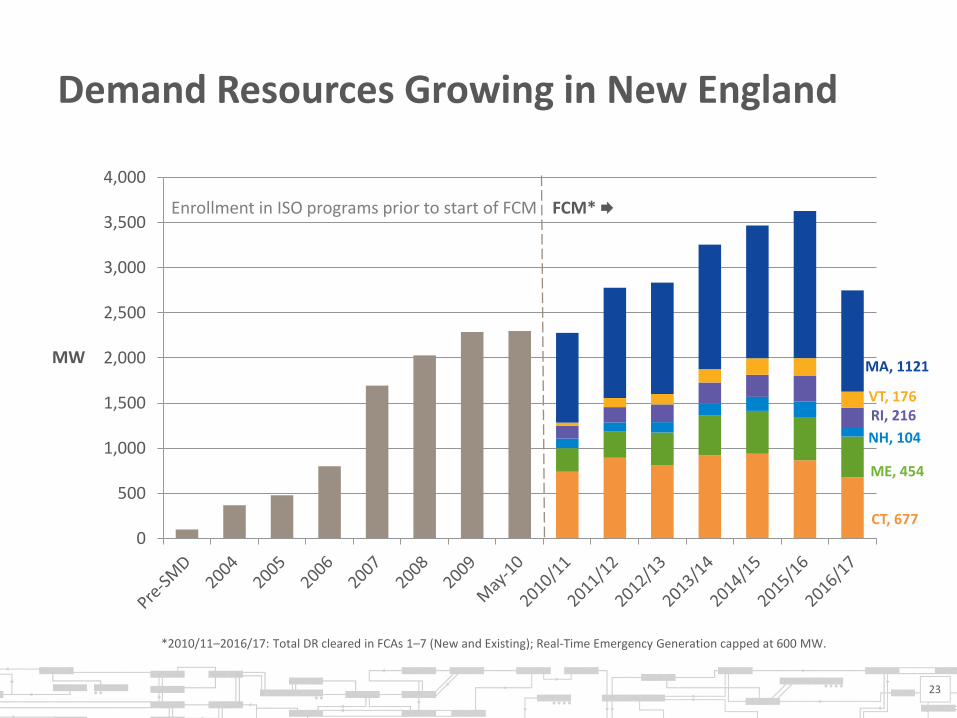
Demand Resources Growing in New England
23
0
500
1,000
1,500
2,000
2,500
3,000
3,500
4,000
MW
FCM* Enrollment in ISO programs prior to start of FCM
*2010/11–2016/17: Total DR cleared in FCAs 1–7 (New and Existing); Real-Time Emergency Generation capped at 600 MW.
CT, 677
ME, 454
NH, 104
RI, 216 VT, 176
MA, 1121
GENERATOR RETIREMENT
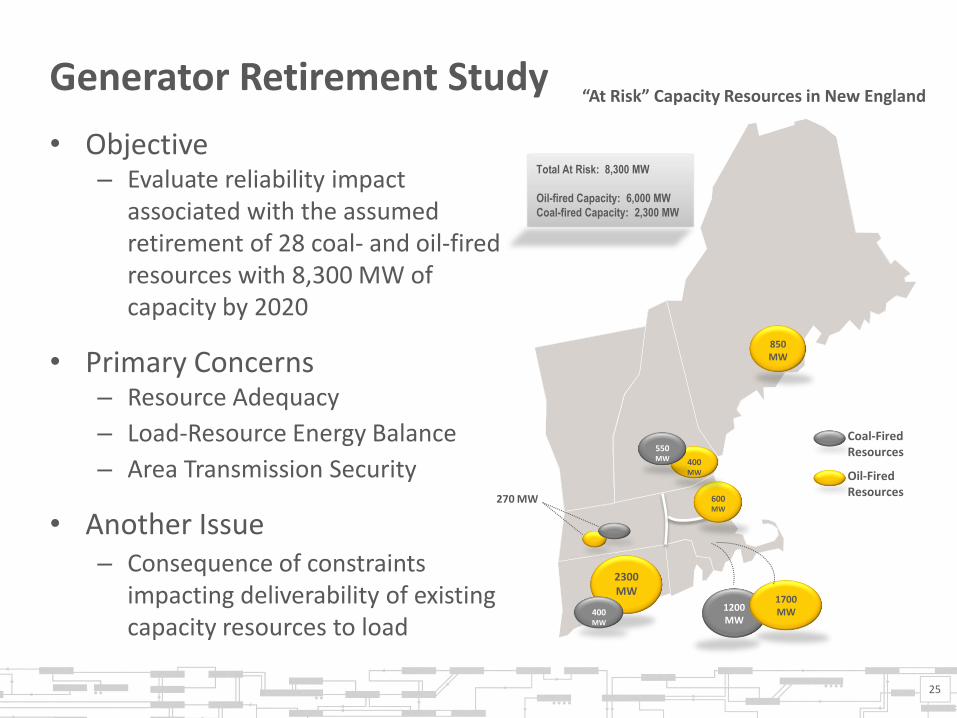
Generator Retirement Study
25
• Objective – Evaluate reliability impact
associated with the assumed retirement of 28 coal- and oil-fired resources with 8,300 MW of capacity by 2020
• Primary Concerns – Resource Adequacy
– Load-Resource Energy Balance
– Area Transmission Security
• Another Issue – Consequence of constraints
impacting deliverability of existing capacity resources to load
2300 MW
1200 MW
1700 MW
850 MW
600MW
400MW
550MW
Coal-Fired Resources
Oil-Fired Resources
“At Risk” Capacity Resources in New England
Total At Risk: 8,300 MW
Oil-fired Capacity: 6,000 MW
Coal-fired Capacity: 2,300 MW
400MW
270 MW
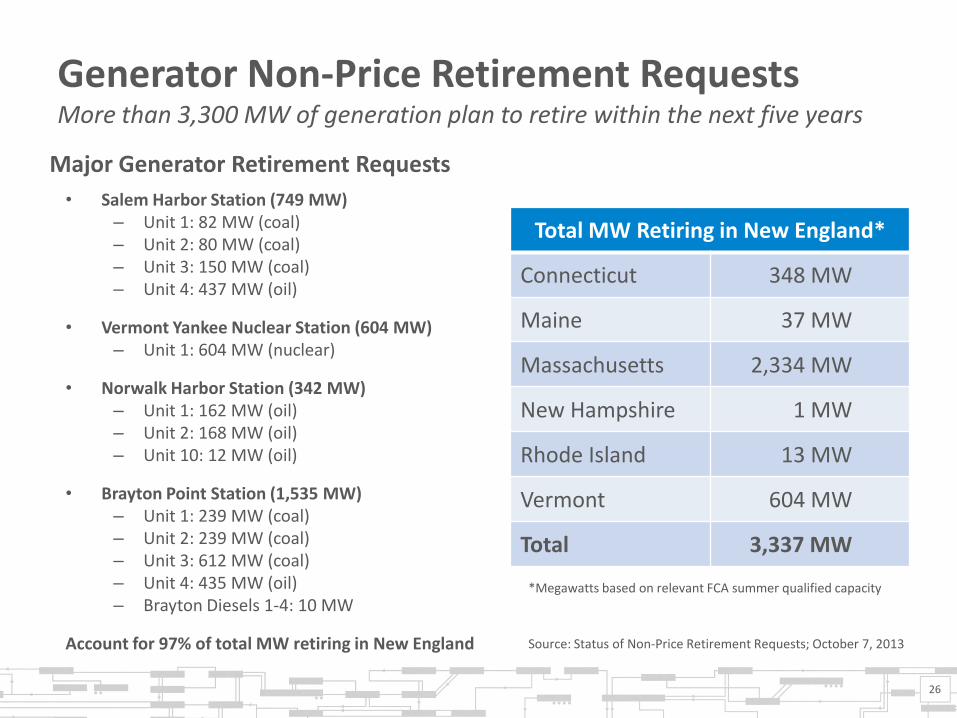
Generator Non-Price Retirement Requests More than 3,300 MW of generation plan to retire within the next five years
• Salem Harbor Station (749 MW) – Unit 1: 82 MW (coal) – Unit 2: 80 MW (coal) – Unit 3: 150 MW (coal) – Unit 4: 437 MW (oil)
• Vermont Yankee Nuclear Station (604 MW) – Unit 1: 604 MW (nuclear)
• Norwalk Harbor Station (342 MW) – Unit 1: 162 MW (oil) – Unit 2: 168 MW (oil) – Unit 10: 12 MW (oil)
• Brayton Point Station (1,535 MW) – Unit 1: 239 MW (coal) – Unit 2: 239 MW (coal) – Unit 3: 612 MW (coal) – Unit 4: 435 MW (oil) – Brayton Diesels 1-4: 10 MW
Account for 97% of total MW retiring in New England
Total MW Retiring in New England*
Connecticut 348 MW
Maine 37 MW
Massachusetts 2,334 MW
New Hampshire 1 MW
Rhode Island 13 MW
Vermont 604 MW
Total 3,337 MW
26
Major Generator Retirement Requests
*Megawatts based on relevant FCA summer qualified capacity
Source: Status of Non-Price Retirement Requests; October 7, 2013
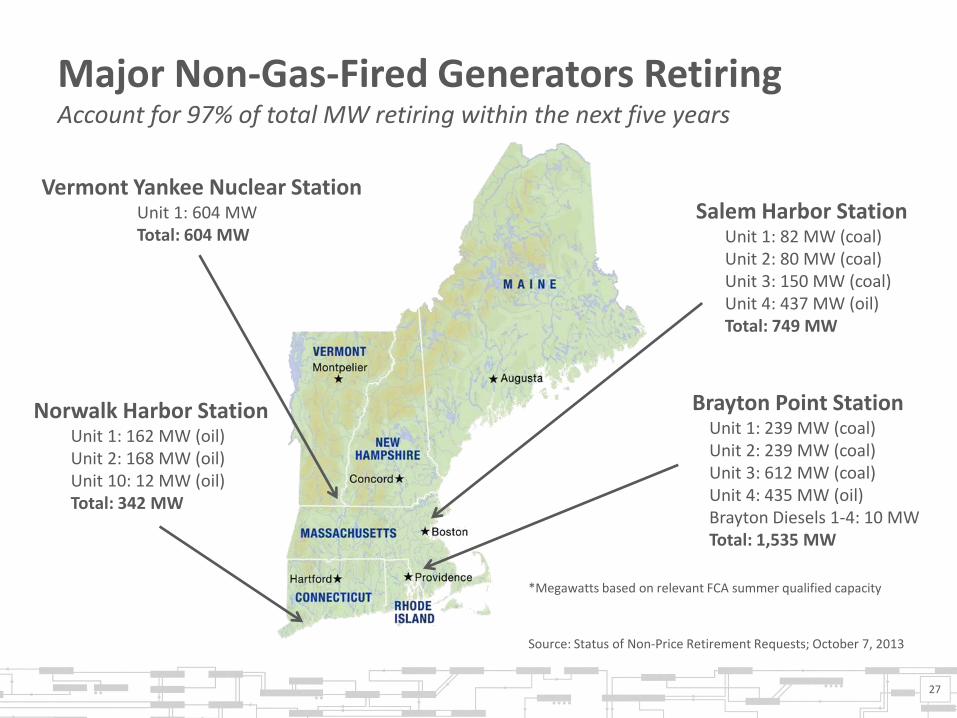
Major Non-Gas-Fired Generators Retiring Account for 97% of total MW retiring within the next five years
27
Brayton Point Station Unit 1: 239 MW (coal) Unit 2: 239 MW (coal) Unit 3: 612 MW (coal) Unit 4: 435 MW (oil) Brayton Diesels 1-4: 10 MW Total: 1,535 MW
Norwalk Harbor Station Unit 1: 162 MW (oil) Unit 2: 168 MW (oil) Unit 10: 12 MW (oil) Total: 342 MW
Vermont Yankee Nuclear Station Unit 1: 604 MW Total: 604 MW
Salem Harbor Station Unit 1: 82 MW (coal) Unit 2: 80 MW (coal) Unit 3: 150 MW (coal) Unit 4: 437 MW (oil) Total: 749 MW
*Megawatts based on relevant FCA summer qualified capacity
Source: Status of Non-Price Retirement Requests; October 7, 2013
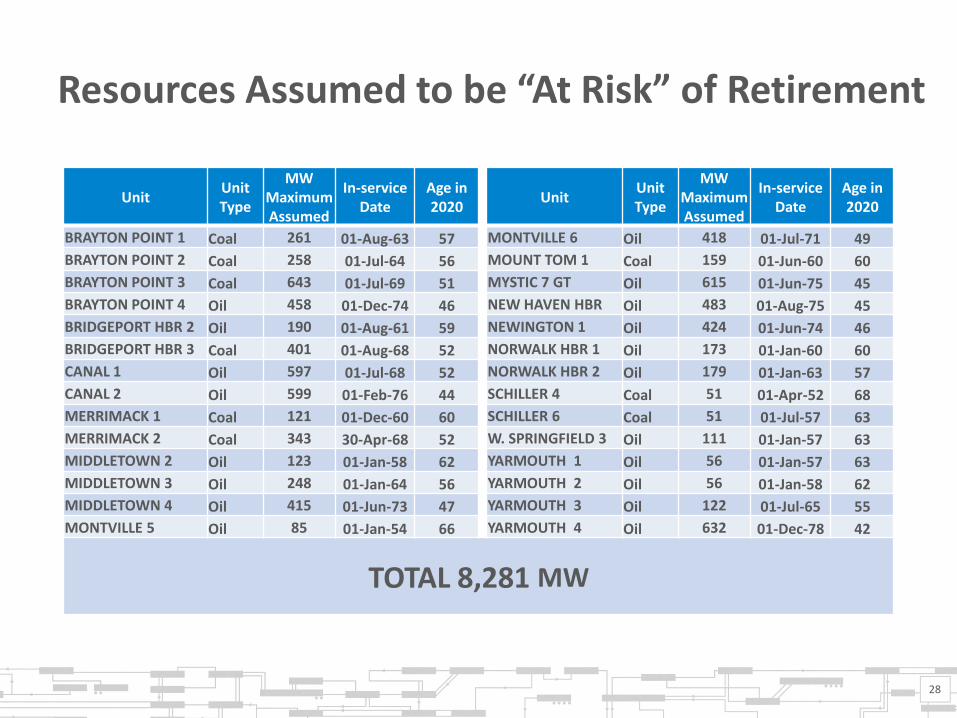
Resources Assumed to be “At Risk” of Retirement
28
Unit Unit Type
MW Maximum Assumed
In-service Date
Age in 2020
Unit Unit Type
MW Maximum Assumed
In-service Date
Age in 2020
BRAYTON POINT 1 Coal 261 01-Aug-63 57 MONTVILLE 6 Oil 418 01-Jul-71 49
BRAYTON POINT 2 Coal 258 01-Jul-64 56 MOUNT TOM 1 Coal 159 01-Jun-60 60
BRAYTON POINT 3 Coal 643 01-Jul-69 51 MYSTIC 7 GT Oil 615 01-Jun-75 45
BRAYTON POINT 4 Oil 458 01-Dec-74 46 NEW HAVEN HBR Oil 483 01-Aug-75 45
BRIDGEPORT HBR 2 Oil 190 01-Aug-61 59 NEWINGTON 1 Oil 424 01-Jun-74 46
BRIDGEPORT HBR 3 Coal 401 01-Aug-68 52 NORWALK HBR 1 Oil 173 01-Jan-60 60
CANAL 1 Oil 597 01-Jul-68 52 NORWALK HBR 2 Oil 179 01-Jan-63 57
CANAL 2 Oil 599 01-Feb-76 44 SCHILLER 4 Coal 51 01-Apr-52 68
MERRIMACK 1 Coal 121 01-Dec-60 60 SCHILLER 6 Coal 51 01-Jul-57 63
MERRIMACK 2 Coal 343 30-Apr-68 52 W. SPRINGFIELD 3 Oil 111 01-Jan-57 63
MIDDLETOWN 2 Oil 123 01-Jan-58 62 YARMOUTH 1 Oil 56 01-Jan-57 63
MIDDLETOWN 3 Oil 248 01-Jan-64 56 YARMOUTH 2 Oil 56 01-Jan-58 62
MIDDLETOWN 4 Oil 415 01-Jun-73 47 YARMOUTH 3 Oil 122 01-Jul-65 55
MONTVILLE 5 Oil 85 01-Jan-54 66 YARMOUTH 4 Oil 632 01-Dec-78 42
TOTAL 8,281 MW
TRANSMISSION DEVELOPMENT
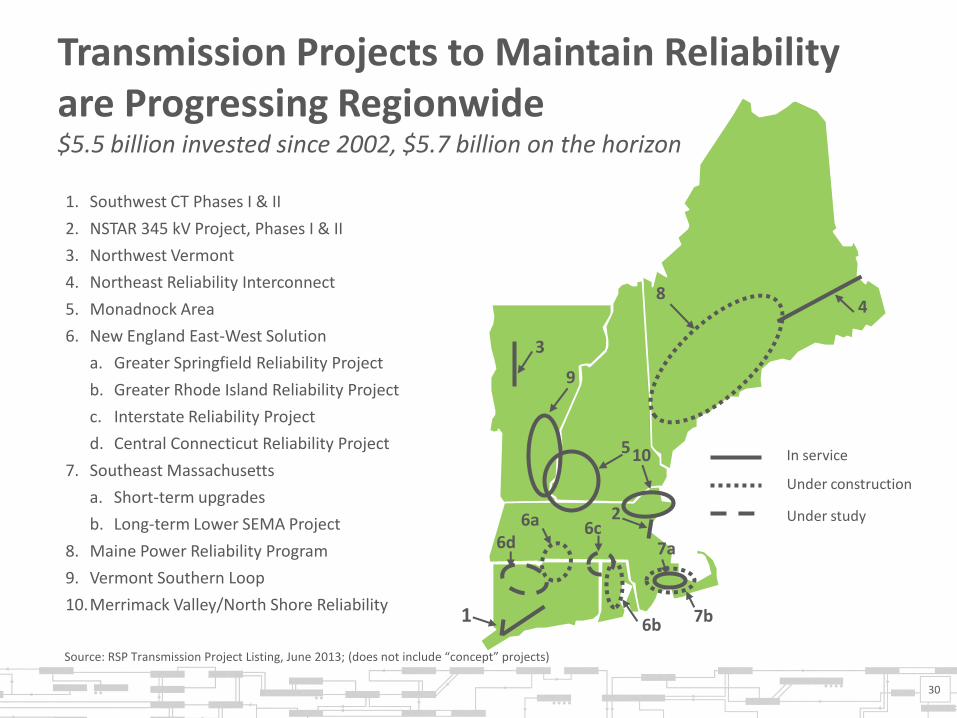
30
3
4
1
6d
8
7b
2
5
9
1. Southwest CT Phases I & II
2. NSTAR 345 kV Project, Phases I & II
3. Northwest Vermont
4. Northeast Reliability Interconnect
5. Monadnock Area
6. New England East-West Solution
a. Greater Springfield Reliability Project
b. Greater Rhode Island Reliability Project
c. Interstate Reliability Project
d. Central Connecticut Reliability Project
7. Southeast Massachusetts
a. Short-term upgrades
b. Long-term Lower SEMA Project
8. Maine Power Reliability Program
9. Vermont Southern Loop
10.Merrimack Valley/North Shore Reliability
In service
Under construction
Under study
7a
6a
6b
6c
Transmission Projects to Maintain Reliability are Progressing Regionwide $5.5 billion invested since 2002, $5.7 billion on the horizon
10
Source: RSP Transmission Project Listing, June 2013; (does not include “concept” projects)
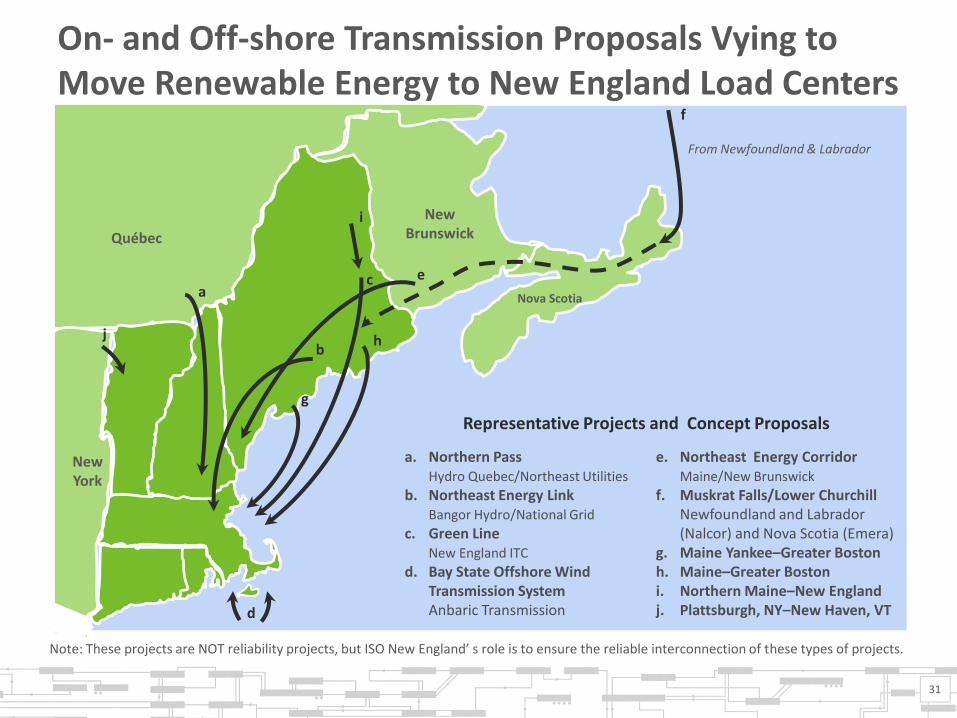
5
a. Northern Pass Hydro Quebec/Northeast Utilities
b. Northeast Energy Link Bangor Hydro/National Grid
c. Green Line New England ITC
d. Bay State Offshore Wind Transmission System
Anbaric Transmission
e. Northeast Energy Corridor Maine/New Brunswick
f. Muskrat Falls/Lower Churchill Newfoundland and Labrador (Nalcor) and Nova Scotia (Emera)
g. Maine Yankee–Greater Boston h. Maine–Greater Boston i. Northern Maine–New England j. Plattsburgh, NY–New Haven, VT
b
d
a c e
h j
i New Brunswick
Nova Scotia
Québec
New York
On- and Off-shore Transmission Proposals Vying to Move Renewable Energy to New England Load Centers
31
f
From Newfoundland & Labrador
g
Note: These projects are NOT reliability projects, but ISO New England’ s role is to ensure the reliable interconnection of these types of projects.
Representative Projects and Concept Proposals
STRATEGIC PLANNING INITIATIVE
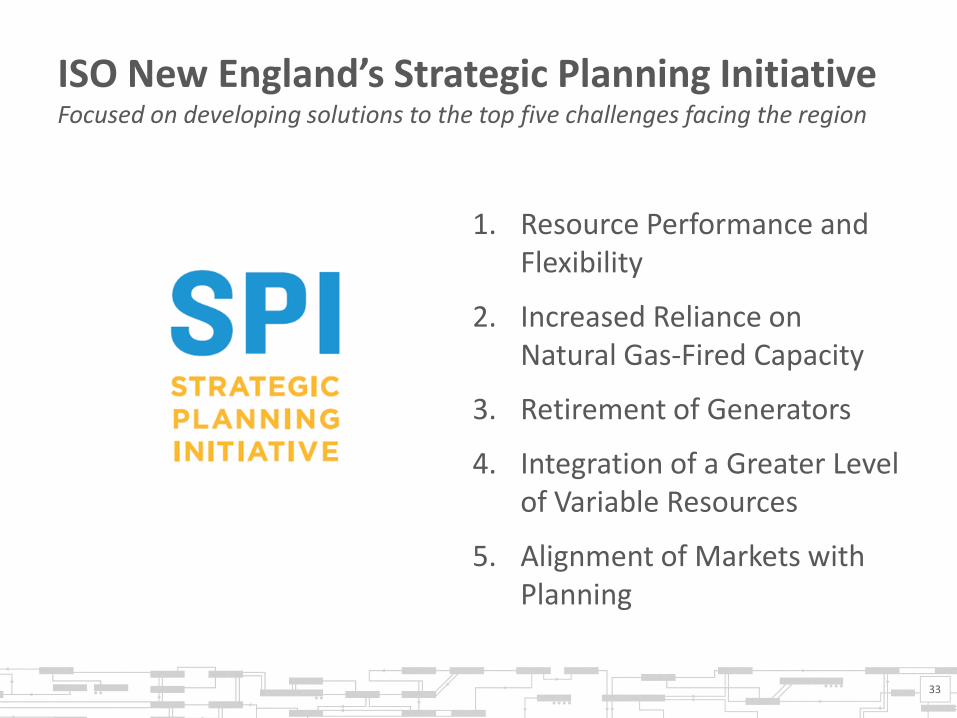
ISO New England’s Strategic Planning Initiative Focused on developing solutions to the top five challenges facing the region
1. Resource Performance and Flexibility
2. Increased Reliance on Natural Gas-Fired Capacity
3. Retirement of Generators
4. Integration of a Greater Level of Variable Resources
5. Alignment of Markets with Planning
33
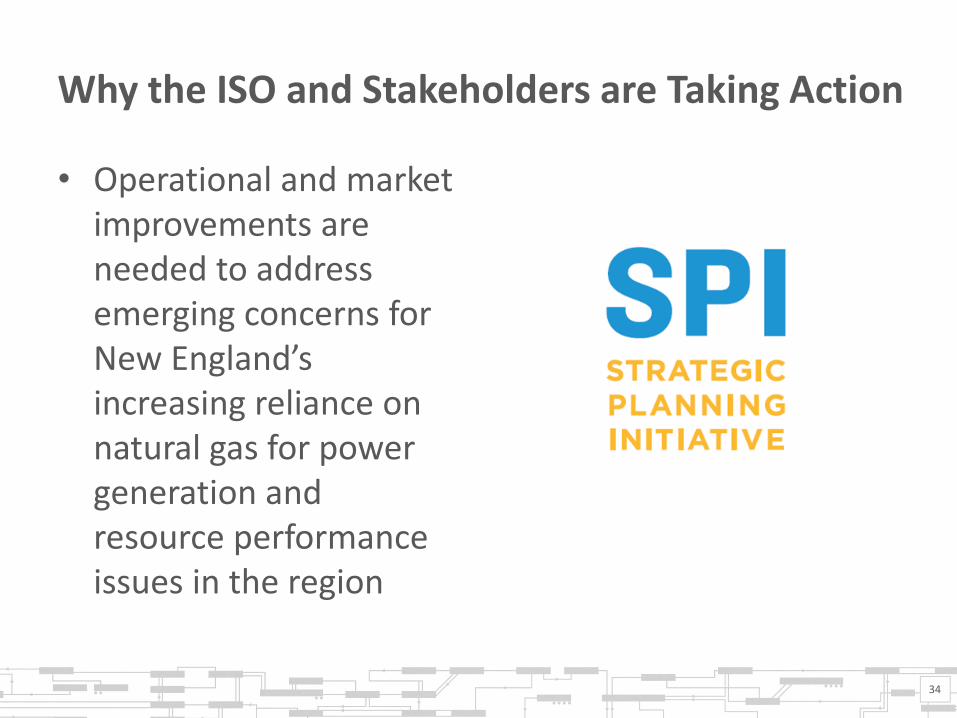
Why the ISO and Stakeholders are Taking Action
• Operational and market improvements are needed to address emerging concerns for New England’s increasing reliance on natural gas for power generation and resource performance issues in the region
34
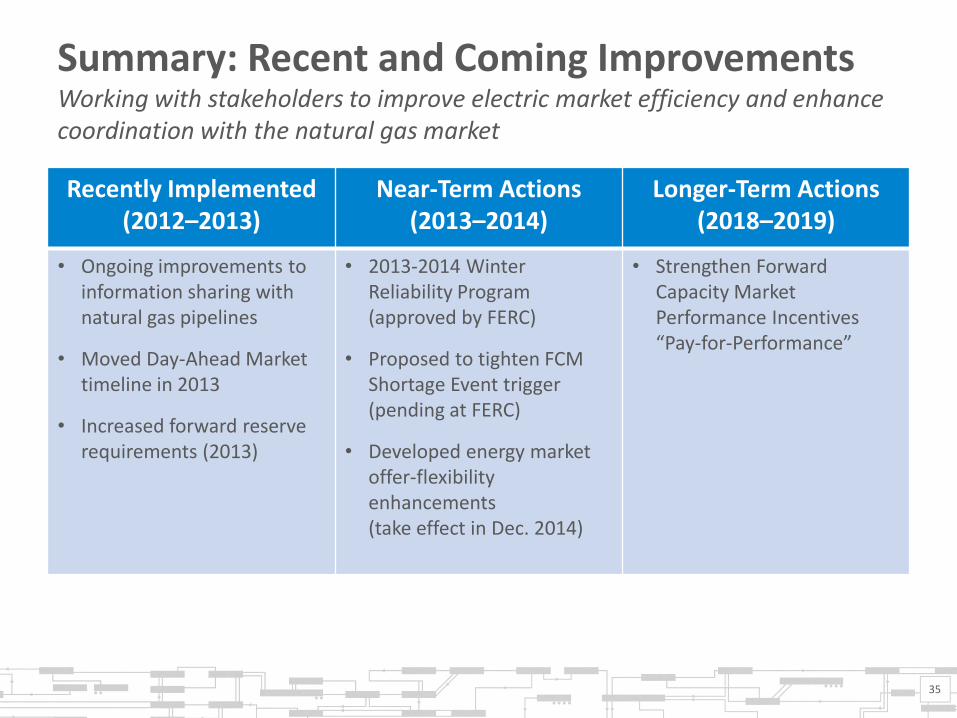
Summary: Recent and Coming Improvements Working with stakeholders to improve electric market efficiency and enhance coordination with the natural gas market
Recently Implemented (2012–2013)
Near-Term Actions (2013–2014)
Longer-Term Actions (2018–2019)
• Ongoing improvements to information sharing with natural gas pipelines
• Moved Day-Ahead Market timeline in 2013
• Increased forward reserve requirements (2013)
• 2013-2014 Winter Reliability Program (approved by FERC)
• Proposed to tighten FCM Shortage Event trigger (pending at FERC)
• Developed energy market offer-flexibility enhancements (take effect in Dec. 2014)
• Strengthen Forward Capacity Market Performance Incentives “Pay-for-Performance”
35
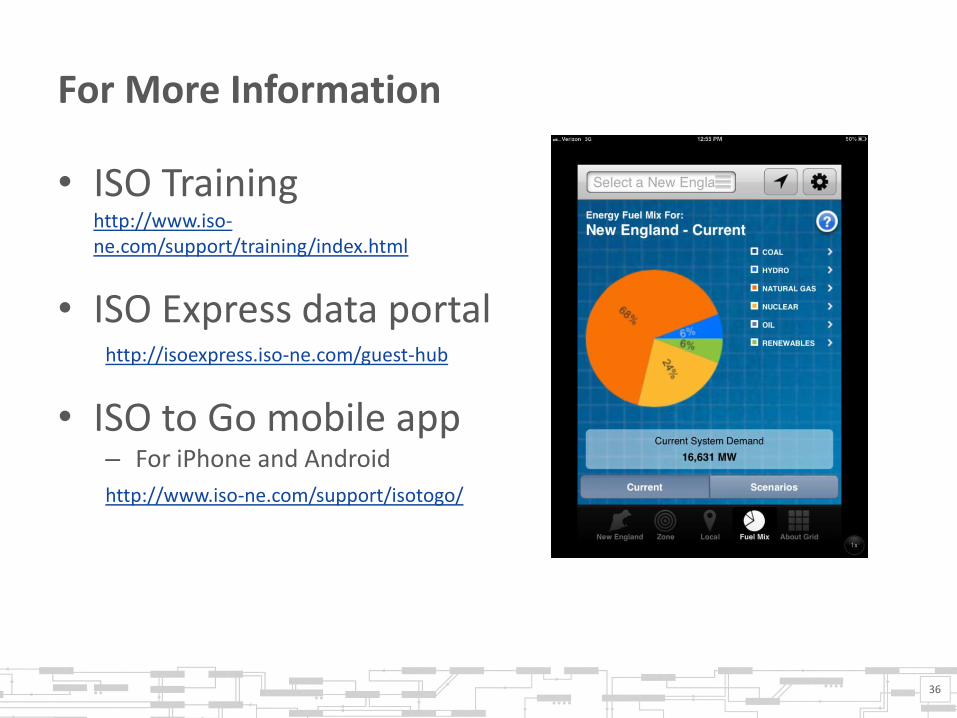
For More Information
• ISO Training http://www.iso-ne.com/support/training/index.html
• ISO Express data portal http://isoexpress.iso-ne.com/guest-hub
• ISO to Go mobile app – For iPhone and Android
http://www.iso-ne.com/support/isotogo/
36

37