Iso-charts: Stretch-driven Mesh Parameterization using ... · Iso-charts: Stretch-driven Mesh...
29
Iso-charts: Stretch-driven Mesh Parameterization using Spectral Analysis KUN ZHOU Microsoft Research Asia JOHN SNYDER Microsoft Research BAINING GUO and HEUNG-YEUNG SHUM Microsoft Research Asia We describe a fully automatic method, called iso-charts, to create texture atlases on arbitrary meshes. It is the first to consider stretch not only when parameterizing charts, but also when forming charts. The output atlas bounds stretch by a user-specified constant, allowing the user to balance the number of charts against their stretch. Our approach combines two seemingly in- compatible techniques: stretch-minimizing parameterization, based on the surface integral of the trace of the local metric tensor, and the “IsoMap” parameterization, based on an eigen-analysis of the matrix of squared geodesic distances between pairs of mesh vertices (spectral analysis). We show that only a few iterations of nonlinear stretch optimization need be applied to the IsoMap parameterization to obtain low-stretch atlases. The close relationship we discover between these two parameterizations also allows us to apply spectral clustering based on IsoMap to partition the mesh into charts having low stretch. We also novelly apply the graph cut algorithm in opti- mizing chart boundaries to further minimize stretch, follow sharp features, and avoid meandering. Overall, our algorithm creates texture atlases quickly, with fewer charts and lower stretch than previous methods, providing improvement in applications like geometric remeshing and texture synthesis. We also describe an extension, signal-specialized atlas creation, to efficiently sample surface signals, and show for the first time that considering signal stretch in chart formation produces better texture maps. Categories and Subject Descriptors: I.3.3 [Computer Graphics]: mesh, parameterization Additional Key Words and Phrases: eigenanalysis, chartification, graph cutting, multi-chart ge- ometry image, signal-specialized parameterization, texture synthesis 1. INTRODUCTION Parameterization forms the basis of many geometry processing algorithms, such as texture mapping, morphing, editing, remeshing and compression. For parameteriz- ing arbitrary meshes, a popular technique is to build texture atlases [Maillot et al. 1993; Pedersen 1995; L´ evy et al. 2002; Sander et al. 2001]. The target surface is Authors’ addresses: K. Zhou, B. Guo and H.-Y. Shum, Microsoft Research Asia, 3F, Beijing Sigma Center, No. 49, Zhichun Road, Haidian District, Beijing 100080, P.R.C.; J. Snyder, Microsoft Research, Redmond, WA, 98052, USA. Permission to make digital/hard copy of all or part of this material without fee for personal or classroom use provided that the copies are not made or distributed for profit or commercial advantage, the ACM copyright/server notice, the title of the publication, and its date appear, and notice is given that copying is by permission of the ACM, Inc. To copy otherwise, to republish, to post on servers, or to redistribute to lists requires prior specific permission and/or a fee. c 20YY ACM 0730-0301/20YY/0100-0001 $5.00 ACM Transactions on Graphics, Vol. V, No. N, Month 20YY, Pages 1–0??.
Transcript of Iso-charts: Stretch-driven Mesh Parameterization using ... · Iso-charts: Stretch-driven Mesh...

Iso-charts: Stretch-driven Mesh Parameterizationusing Spectral Analysis
KUN ZHOU
Microsoft Research Asia
JOHN SNYDER
Microsoft Research
BAINING GUO and HEUNG-YEUNG SHUM
Microsoft Research Asia
We describe a fully automatic method, called iso-charts, to create texture atlases on arbitrarymeshes. It is the first to consider stretch not only when parameterizing charts, but also whenforming charts. The output atlas bounds stretch by a user-specified constant, allowing the userto balance the number of charts against their stretch. Our approach combines two seemingly in-compatible techniques: stretch-minimizing parameterization, based on the surface integral of thetrace of the local metric tensor, and the “IsoMap” parameterization, based on an eigen-analysisof the matrix of squared geodesic distances between pairs of mesh vertices (spectral analysis). Weshow that only a few iterations of nonlinear stretch optimization need be applied to the IsoMapparameterization to obtain low-stretch atlases. The close relationship we discover between thesetwo parameterizations also allows us to apply spectral clustering based on IsoMap to partitionthe mesh into charts having low stretch. We also novelly apply the graph cut algorithm in opti-mizing chart boundaries to further minimize stretch, follow sharp features, and avoid meandering.Overall, our algorithm creates texture atlases quickly, with fewer charts and lower stretch thanprevious methods, providing improvement in applications like geometric remeshing and texturesynthesis. We also describe an extension, signal-specialized atlas creation, to efficiently samplesurface signals, and show for the first time that considering signal stretch in chart formationproduces better texture maps.
Categories and Subject Descriptors: I.3.3 [Computer Graphics]: mesh, parameterization
Additional Key Words and Phrases: eigenanalysis, chartification, graph cutting, multi-chart ge-ometry image, signal-specialized parameterization, texture synthesis
1. INTRODUCTION
Parameterization forms the basis of many geometry processing algorithms, such astexture mapping, morphing, editing, remeshing and compression. For parameteriz-ing arbitrary meshes, a popular technique is to build texture atlases [Maillot et al.1993; Pedersen 1995; Levy et al. 2002; Sander et al. 2001]. The target surface is
Authors’ addresses: K. Zhou, B. Guo and H.-Y. Shum, Microsoft Research Asia, 3F, Beijing SigmaCenter, No. 49, Zhichun Road, Haidian District, Beijing 100080, P.R.C.; J. Snyder, MicrosoftResearch, Redmond, WA, 98052, USA.Permission to make digital/hard copy of all or part of this material without fee for personalor classroom use provided that the copies are not made or distributed for profit or commercialadvantage, the ACM copyright/server notice, the title of the publication, and its date appear, andnotice is given that copying is by permission of the ACM, Inc. To copy otherwise, to republish,to post on servers, or to redistribute to lists requires prior specific permission and/or a fee.c© 20YY ACM 0730-0301/20YY/0100-0001 $5.00
ACM Transactions on Graphics, Vol. V, No. N, Month 20YY, Pages 1–0??.
2 · Zhou, Snyder, Guo, and Shum
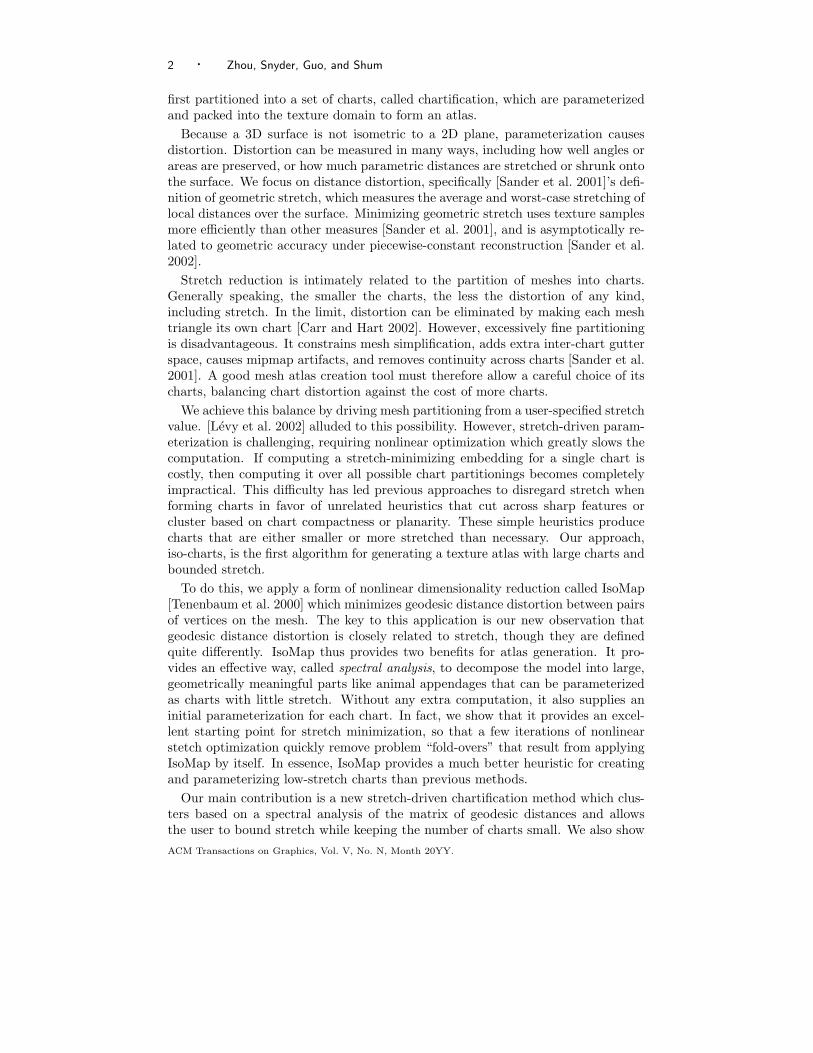
first partitioned into a set of charts, called chartification, which are parameterizedand packed into the texture domain to form an atlas.
Because a 3D surface is not isometric to a 2D plane, parameterization causesdistortion. Distortion can be measured in many ways, including how well angles orareas are preserved, or how much parametric distances are stretched or shrunk ontothe surface. We focus on distance distortion, specifically [Sander et al. 2001]’s defi-nition of geometric stretch, which measures the average and worst-case stretching oflocal distances over the surface. Minimizing geometric stretch uses texture samplesmore efficiently than other measures [Sander et al. 2001], and is asymptotically re-lated to geometric accuracy under piecewise-constant reconstruction [Sander et al.2002].
Stretch reduction is intimately related to the partition of meshes into charts.Generally speaking, the smaller the charts, the less the distortion of any kind,including stretch. In the limit, distortion can be eliminated by making each meshtriangle its own chart [Carr and Hart 2002]. However, excessively fine partitioningis disadvantageous. It constrains mesh simplification, adds extra inter-chart gutterspace, causes mipmap artifacts, and removes continuity across charts [Sander et al.2001]. A good mesh atlas creation tool must therefore allow a careful choice of itscharts, balancing chart distortion against the cost of more charts.
We achieve this balance by driving mesh partitioning from a user-specified stretchvalue. [Levy et al. 2002] alluded to this possibility. However, stretch-driven param-eterization is challenging, requiring nonlinear optimization which greatly slows thecomputation. If computing a stretch-minimizing embedding for a single chart iscostly, then computing it over all possible chart partitionings becomes completelyimpractical. This difficulty has led previous approaches to disregard stretch whenforming charts in favor of unrelated heuristics that cut across sharp features orcluster based on chart compactness or planarity. These simple heuristics producecharts that are either smaller or more stretched than necessary. Our approach,iso-charts, is the first algorithm for generating a texture atlas with large charts andbounded stretch.
To do this, we apply a form of nonlinear dimensionality reduction called IsoMap[Tenenbaum et al. 2000] which minimizes geodesic distance distortion between pairsof vertices on the mesh. The key to this application is our new observation thatgeodesic distance distortion is closely related to stretch, though they are definedquite differently. IsoMap thus provides two benefits for atlas generation. It pro-vides an effective way, called spectral analysis, to decompose the model into large,geometrically meaningful parts like animal appendages that can be parameterizedas charts with little stretch. Without any extra computation, it also supplies aninitial parameterization for each chart. In fact, we show that it provides an excel-lent starting point for stretch minimization, so that a few iterations of nonlinearstetch optimization quickly remove problem “fold-overs” that result from applyingIsoMap by itself. In essence, IsoMap provides a much better heuristic for creatingand parameterizing low-stretch charts than previous methods.
Our main contribution is a new stretch-driven chartification method which clus-ters based on a spectral analysis of the matrix of geodesic distances and allowsthe user to bound stretch while keeping the number of charts small. We also showACM Transactions on Graphics, Vol. V, No. N, Month 20YY.
Iso-charts: Stretch-driven Mesh Parameterization using Spectral Analysis · 3
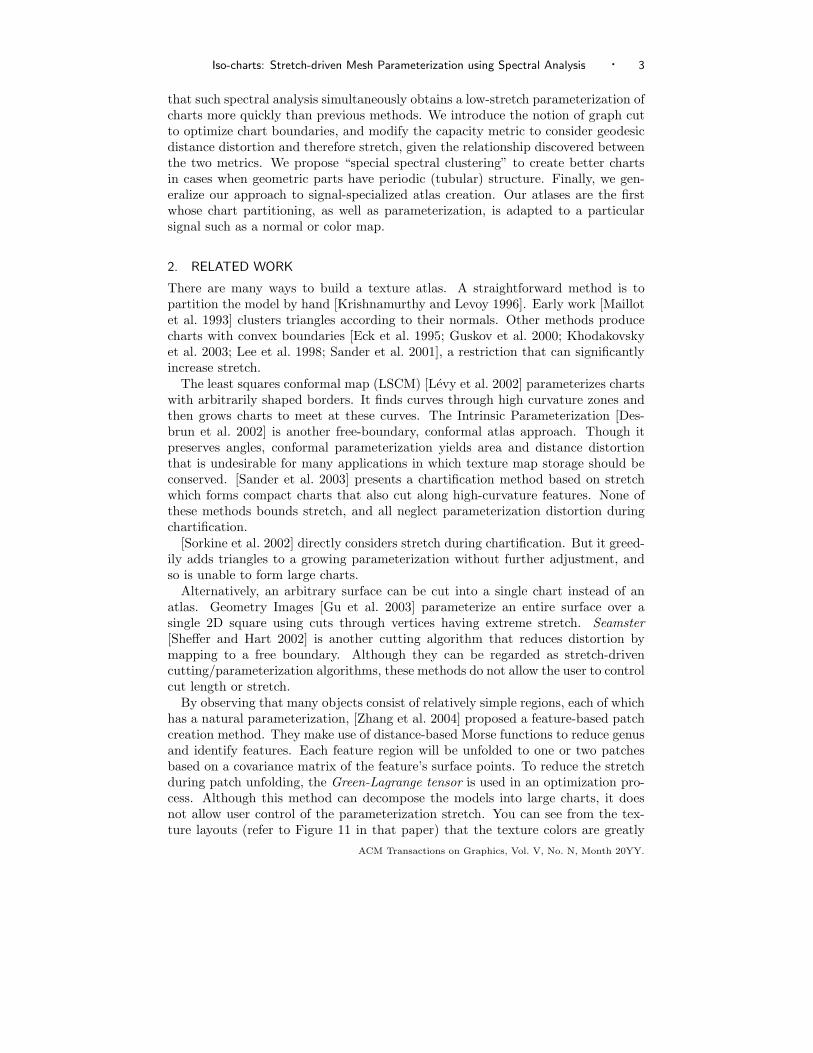
that such spectral analysis simultaneously obtains a low-stretch parameterization ofcharts more quickly than previous methods. We introduce the notion of graph cutto optimize chart boundaries, and modify the capacity metric to consider geodesicdistance distortion and therefore stretch, given the relationship discovered betweenthe two metrics. We propose “special spectral clustering” to create better chartsin cases when geometric parts have periodic (tubular) structure. Finally, we gen-eralize our approach to signal-specialized atlas creation. Our atlases are the firstwhose chart partitioning, as well as parameterization, is adapted to a particularsignal such as a normal or color map.
2. RELATED WORK
There are many ways to build a texture atlas. A straightforward method is topartition the model by hand [Krishnamurthy and Levoy 1996]. Early work [Maillotet al. 1993] clusters triangles according to their normals. Other methods producecharts with convex boundaries [Eck et al. 1995; Guskov et al. 2000; Khodakovskyet al. 2003; Lee et al. 1998; Sander et al. 2001], a restriction that can significantlyincrease stretch.
The least squares conformal map (LSCM) [Levy et al. 2002] parameterizes chartswith arbitrarily shaped borders. It finds curves through high curvature zones andthen grows charts to meet at these curves. The Intrinsic Parameterization [Des-brun et al. 2002] is another free-boundary, conformal atlas approach. Though itpreserves angles, conformal parameterization yields area and distance distortionthat is undesirable for many applications in which texture map storage should beconserved. [Sander et al. 2003] presents a chartification method based on stretchwhich forms compact charts that also cut along high-curvature features. None ofthese methods bounds stretch, and all neglect parameterization distortion duringchartification.
[Sorkine et al. 2002] directly considers stretch during chartification. But it greed-ily adds triangles to a growing parameterization without further adjustment, andso is unable to form large charts.
Alternatively, an arbitrary surface can be cut into a single chart instead of anatlas. Geometry Images [Gu et al. 2003] parameterize an entire surface over asingle 2D square using cuts through vertices having extreme stretch. Seamster[Sheffer and Hart 2002] is another cutting algorithm that reduces distortion bymapping to a free boundary. Although they can be regarded as stretch-drivencutting/parameterization algorithms, these methods do not allow the user to controlcut length or stretch.
By observing that many objects consist of relatively simple regions, each of whichhas a natural parameterization, [Zhang et al. 2004] proposed a feature-based patchcreation method. They make use of distance-based Morse functions to reduce genusand identify features. Each feature region will be unfolded to one or two patchesbased on a covariance matrix of the feature’s surface points. To reduce the stretchduring patch unfolding, the Green-Lagrange tensor is used in an optimization pro-cess. Although this method can decompose the models into large charts, it doesnot allow user control of the parameterization stretch. You can see from the tex-ture layouts (refer to Figure 11 in that paper) that the texture colors are greatly
ACM Transactions on Graphics, Vol. V, No. N, Month 20YY.
4 · Zhou, Snyder, Guo, and Shum
distorted in some regions. Another advantage of our method is that it runs muchfaster. For the Stanford bunny (70k faces), our method takes about 1 minute on a3.0 GHz PC, while the running time for the 10K bunny model using their methodis over 9 minutes on a 2.4 GHz PC. Furthermore, our algorithm can also be gener-alized to produce signal-specialized atlases which represents a given surface signalusing textures as compact as possible.
Many algorithms can parameterize charts over planar regions [Bennis et al. 1991;Campagna and Seidel 1998; Desbrun et al. 2002; Eck et al. 1995; Floater 1997;2003; Hormann and Greiner 1999; Levy and Mallet 1998; Levy et al. 2002; Maillotet al. 1993; Sander et al. 2001]. We refer the interested reader to the recent surveyby [Floater and Hormann 2004].
Like our method, [Zigelman et al. 2002] also applies IsoMap to mesh parameter-ization, but allows only simple (disk-topology) meshes and often produces triangleflips. Our method handles an arbitrary mesh, automatically divides it into multiplecharts, guarantees no triangle flips, and extends to signal-specialized parameteri-zation. We also show that the IsoMap parameterization is connected to a stretchminimizing one.
Recently, [Peyre and Cohen 2004] presented a surface flattening method basedon another nonlinear data dimensionality reduction method, called Locally LinearEmbedding (LLE) [Roweis and Saul 2000]. LLE aims at finding a mapping whichpreserves the relationship between neighboring data points. Therefore the LLE-based flattening approach is more local than the IsoMap-based approach [Zigelmanet al. 2002], which tends to preserve the pairwise geodesic distances between surfacevertices. However, both methods cannot guarantee validity of the flattening.
A form of spectral analysis has been used for geometry compression and smooth-ing [Karni and Gotsman 2000; Taubin 1995]. These methods are based on themesh’s Laplacian which depends only on its connectivity, rather than geodesic dis-tance. Recently, [Gotsman et al. 2003] applies spectral graph theory to solve thespherical parameterization problem.
We apply stretch-minimization [Sander et al. 2001] to optimize parameterizationscreated by spectral analysis. We also use geometric stretch [Sander et al. 2001] orsignal stretch [Sander et al. 2002] to determine when to terminate chart subdivision.
[Katz and Tal 2003] decompose meshes using geodesic distance and optimizeboundaries using graph cut. We apply these ideas to atlas creation, but also in-troduce spectral analysis to aid decomposition and produce geodesic distance pre-serving parameterizations. We extend their notion of graph cut “flow capacity” torespect parameterization distortion, and their notion of distance to build signal-specialized atlases.
3. ALGORITHM OVERVIEW
Our approach is a top-down, stretch-driven method. Given a surface and a user-specified stretch value, it performs the following steps:
(1) Compute the surface spectral analysis, providing an initial parameterization(Section 4.1).
(2) Perform a few iterations of stretch optimization [Sander et al. 2001].(3) If the stretch of this derived parameterization is less than the threshold, stop.ACM Transactions on Graphics, Vol. V, No. N, Month 20YY.

Iso-charts: Stretch-driven Mesh Parameterization using Spectral Analysis · 5
Fig. 1. Iso-chart atlas for the Stanford bunny. The model is partitioned into 15 large charts,which can be flattened with lower stretch than previous methods (L2 = 1.01, L∞ = 2.26).
(4) Perform spectral clustering to partition the surface into charts (Section 5.1).(5) Optimize chart boundaries using the graph cut technique (Section 5.2).(6) Recursively split charts until the stretch criterion is met.
The result is a set of charts whose parameterizations have bounded stretch. Charttopology need not be explicitly checked; the stretch-driven process ensures that allcharts are eventually subdivided into topological disks since otherwise parameteri-zation stretch is infinite. We do check that the parameterization domain does notoverlap itself and subdivide in that rare case. As a post-processing step, we mergesmall charts together if the parameterization stretch of the merged chart is lessthan the user specified stretch value.
Distortion is bounded using two norms on geometric or signal stretch, proposedin [Sander et al. 2001]. The L2 norm integrates (γ2
max + γ2min)/2 over the surface,
followed by an overall square root. The L∞ norm maximizes max{γmax, 1/γmin}over the entire surface. Here, γmax and γmin are scalar functions over the surfacerepresenting the largest and smallest singular values of the Jacobian of the affinemapping from texture space to model/signal space at any point. The inclusion ofshrink, 1/γmin, in the L∞ norm is a modification which penalizes undersampling.
Figure 1 shows the chartification and parameterization results for the Stanfordbunny. Notice how meaningful parts of the model like its head, ears, and body aredecomposed into large charts. The whole computation takes about 1 minute.
4. SPECTRAL ANALYSIS
4.1 Applying IsoMap
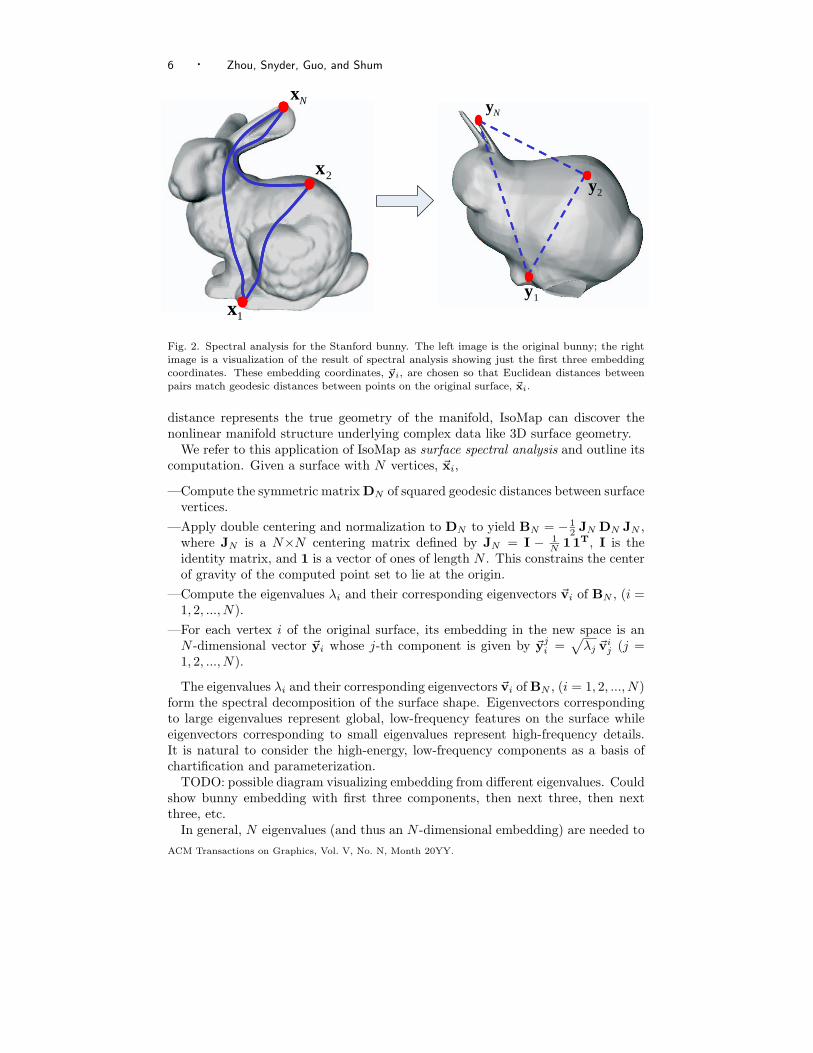
Our algorithm builds upon the dimensionality reduction method called IsoMap(isometric feature mapping) [Tenenbaum et al. 2000]. Given a set of points on ahigh-dimensional manifold, IsoMap computes geodesic distances along the manifoldas sequences of hops between neighboring points. It then applies MDS (multidi-mensional scaling) to find a set of points embedded in a low-dimensional spacewhose Euclidean distances are similar to the corresponding geodesic distances onthe original manifold, as shown in Figure 2. Since geodesic rather than Euclidean
ACM Transactions on Graphics, Vol. V, No. N, Month 20YY.
6 · Zhou, Snyder, Guo, and Shum
1x
2x
NxNy
2y
1y
Fig. 2. Spectral analysis for the Stanford bunny. The left image is the original bunny; the rightimage is a visualization of the result of spectral analysis showing just the first three embeddingcoordinates. These embedding coordinates, �yi, are chosen so that Euclidean distances betweenpairs match geodesic distances between points on the original surface, �xi.
distance represents the true geometry of the manifold, IsoMap can discover thenonlinear manifold structure underlying complex data like 3D surface geometry.
We refer to this application of IsoMap as surface spectral analysis and outline itscomputation. Given a surface with N vertices, �xi,
—Compute the symmetric matrix DN of squared geodesic distances between surfacevertices.
—Apply double centering and normalization to DN to yield BN = − 12 JN DN JN ,
where JN is a N×N centering matrix defined by JN = I − 1N 11T, I is the
identity matrix, and 1 is a vector of ones of length N . This constrains the centerof gravity of the computed point set to lie at the origin.
—Compute the eigenvalues λi and their corresponding eigenvectors �vi of BN , (i =1, 2, ..., N).
—For each vertex i of the original surface, its embedding in the new space is anN -dimensional vector �yi whose j-th component is given by �yj
i =√
λj �vij (j =
1, 2, ..., N).
The eigenvalues λi and their corresponding eigenvectors �vi of BN , (i = 1, 2, ..., N)form the spectral decomposition of the surface shape. Eigenvectors correspondingto large eigenvalues represent global, low-frequency features on the surface whileeigenvectors corresponding to small eigenvalues represent high-frequency details.It is natural to consider the high-energy, low-frequency components as a basis ofchartification and parameterization.
TODO: possible diagram visualizing embedding from different eigenvalues. Couldshow bunny embedding with first three components, then next three, then nextthree, etc.
In general, N eigenvalues (and thus an N -dimensional embedding) are needed toACM Transactions on Graphics, Vol. V, No. N, Month 20YY.

Iso-charts: Stretch-driven Mesh Parameterization using Spectral Analysis · 7
fully represent a surface with N vertices. In practice, a small number of themtypically dominate the energy. For the bunny model shown in Figure 1, thetop 5 eigenvalues constitute over 85% of the squared energy; in other words,(∑5
i=1 λi)/(∑N
i=1 λi) > 85%. Therefore we calculate only the n � N largest eigen-values and corresponding eigenvectors, leading to a n-dimensional embedding forall vertices.
The distortion of this n-dimensional embedding can be calculated as the sum ofthe geodesic distance distortion over all vertices. For each vertex i, its geodesicdistance distortion (GDD) under the embedding is defined as:
GDD(i) =
√√√√ 1N − 1
N∑j=1
(‖�yi − �yj‖ − dgeo(i, j))2 (1)
where �yi is the n-dimensional embedding coordinate of vertex i, and dgeo(i, j) isthe geodesic distance between vertex i and j. This definition can be extended froma vertex to a triangle by averaging the distortions of its three vertices, and is usedin Section 5.2.
When n = 2, surface spectral analysis yields a surface parameterization minimiz-ing the sum of squared GDD over all vertices. This is the key idea of the mappingalgorithm in [Zigelman et al. 2002]. Our observation is that the same technique,surface spectral analysis, can be simultaneously applied to two critical problems:decomposition necessary for chartification, and parameterization.
To calculate the geodesic distances between surface points of polygonal mod-els, we use the fast matching method [Kimmel and Sethian 1998], which runs atO(N2 lg N) and obtains more precise results than the Dijkstra graph search method,since it allows paths that cut across mesh triangles.
4.2 Analyzing Isomap Stretch
GDD-minimizing [Zigelman et al. 2002] and stretch-minimizing [Sander et al. 2001]parameterizations both focus on distance distortion. Still, GDD differs from stretchin several ways. It is global rather than local, since it considers distance betweenvertices that are arbitrarily far on the surface, rather than local stretch inducedby the Jacobian at a point. It is difference-based rather than ratio-based sinceit penalizes differences between the original and parametric distances rather thanhow much unit-length tangent vectors are stretched. And it is discrete rather thancontinuous since it only considers distance distortions between vertex pairs ratherthan stretch in every triangle and in every direction.
The discrete nature of spectral analysis, which measures distance distortion onlybetween vertex pairs, gives rise to the main problem in [Zigelman et al. 2002]:triangle flips. Our algorithm provides a simple solution. Since triangle flips are de-fined to cause infinite stretch, and our algorithm always splits charts whose stretchis above the user’s threshold, any finite threshold guarantees the final atlas willcontain no flips.
Spectral analysis requires solution of a low-dimensional eigenvalue problem ratherthan general nonlinear optimization. We accelerate the computation even furtherusing the “landmark” extension (see Section 5). Despite differences between stretchand GDD, we find that spectral analysis reduces stretch very effectively.
ACM Transactions on Graphics, Vol. V, No. N, Month 20YY.
8 · Zhou, Snyder, Guo, and Shum
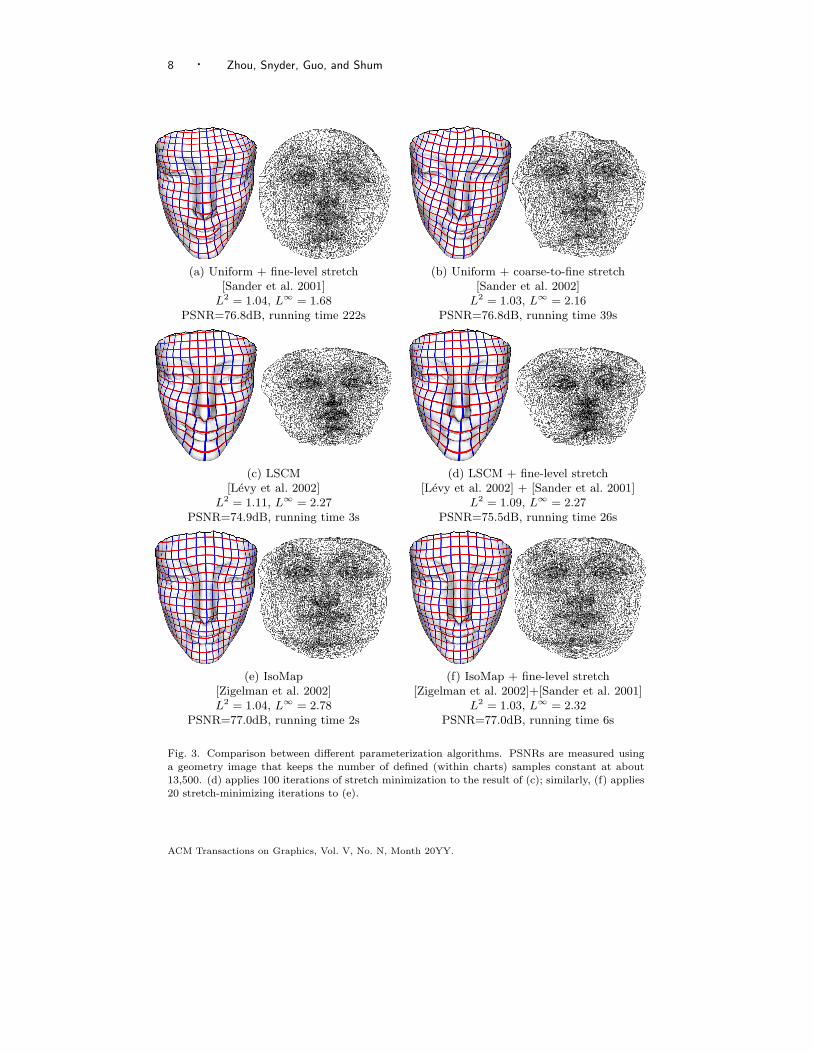
(a) Uniform + fine-level stretch (b) Uniform + coarse-to-fine stretch[Sander et al. 2001] [Sander et al. 2002]
L2 = 1.04, L∞ = 1.68 L2 = 1.03, L∞ = 2.16PSNR=76.8dB, running time 222s PSNR=76.8dB, running time 39s
(c) LSCM (d) LSCM + fine-level stretch[Levy et al. 2002] [Levy et al. 2002] + [Sander et al. 2001]
L2 = 1.11, L∞ = 2.27 L2 = 1.09, L∞ = 2.27PSNR=74.9dB, running time 3s PSNR=75.5dB, running time 26s
(e) IsoMap (f) IsoMap + fine-level stretch[Zigelman et al. 2002] [Zigelman et al. 2002]+[Sander et al. 2001]L2 = 1.04, L∞ = 2.78 L2 = 1.03, L∞ = 2.32
PSNR=77.0dB, running time 2s PSNR=77.0dB, running time 6s
Fig. 3. Comparison between different parameterization algorithms. PSNRs are measured usinga geometry image that keeps the number of defined (within charts) samples constant at about13,500. (d) applies 100 iterations of stretch minimization to the result of (c); similarly, (f) applies20 stretch-minimizing iterations to (e).
ACM Transactions on Graphics, Vol. V, No. N, Month 20YY.
Iso-charts: Stretch-driven Mesh Parameterization using Spectral Analysis · 9
1.4
1.8
2.2
2.6
3
1 2 3 4 5 6
number of patches
Linf
Stre
tch
1
1.04
1.08
1.12
1.16
1.2
1 2 3 4 5 6
L2 S
tretc
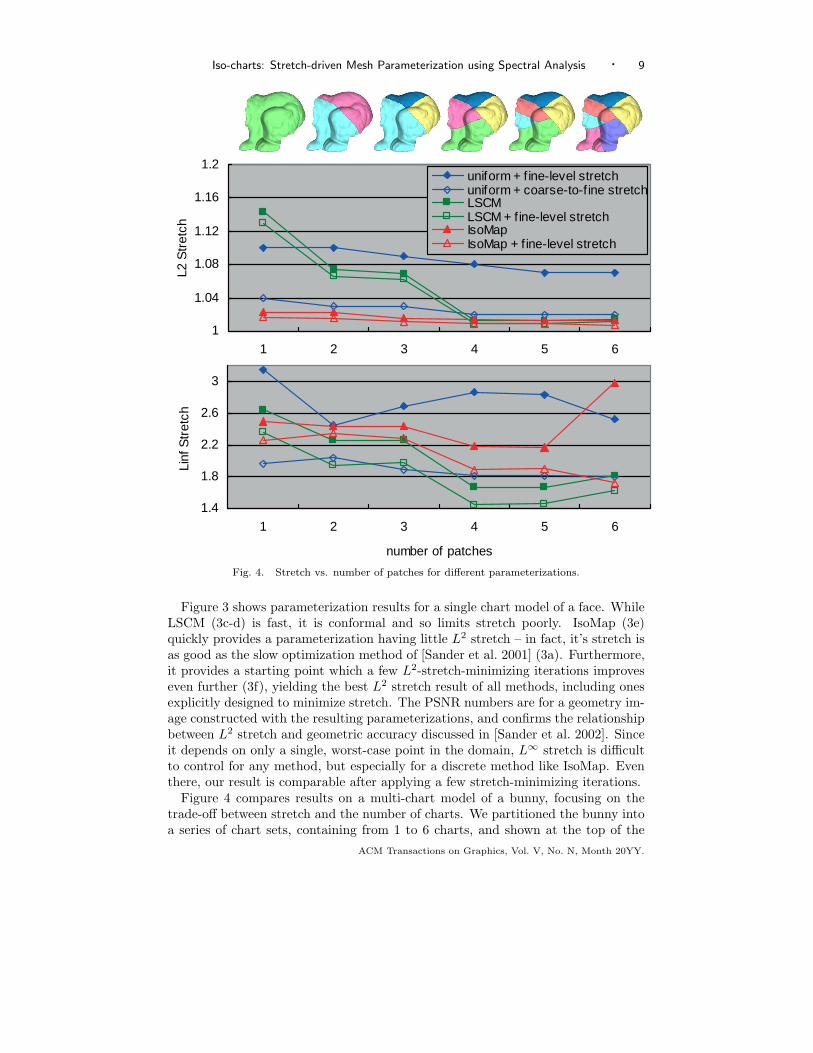
huniform + f ine-level stretchuniform + coarse-to-f ine stretchLSCMLSCM + f ine-level stretchIsoMapIsoMap + f ine-level stretch
Fig. 4. Stretch vs. number of patches for different parameterizations.
Figure 3 shows parameterization results for a single chart model of a face. WhileLSCM (3c-d) is fast, it is conformal and so limits stretch poorly. IsoMap (3e)quickly provides a parameterization having little L2 stretch – in fact, it’s stretch isas good as the slow optimization method of [Sander et al. 2001] (3a). Furthermore,it provides a starting point which a few L2-stretch-minimizing iterations improveseven further (3f), yielding the best L2 stretch result of all methods, including onesexplicitly designed to minimize stretch. The PSNR numbers are for a geometry im-age constructed with the resulting parameterizations, and confirms the relationshipbetween L2 stretch and geometric accuracy discussed in [Sander et al. 2002]. Sinceit depends on only a single, worst-case point in the domain, L∞ stretch is difficultto control for any method, but especially for a discrete method like IsoMap. Eventhere, our result is comparable after applying a few stretch-minimizing iterations.
Figure 4 compares results on a multi-chart model of a bunny, focusing on thetrade-off between stretch and the number of charts. We partitioned the bunny intoa series of chart sets, containing from 1 to 6 charts, and shown at the top of the
ACM Transactions on Graphics, Vol. V, No. N, Month 20YY.
10 · Zhou, Snyder, Guo, and Shum
Analysis
Clustering
(a) (b)
(c)
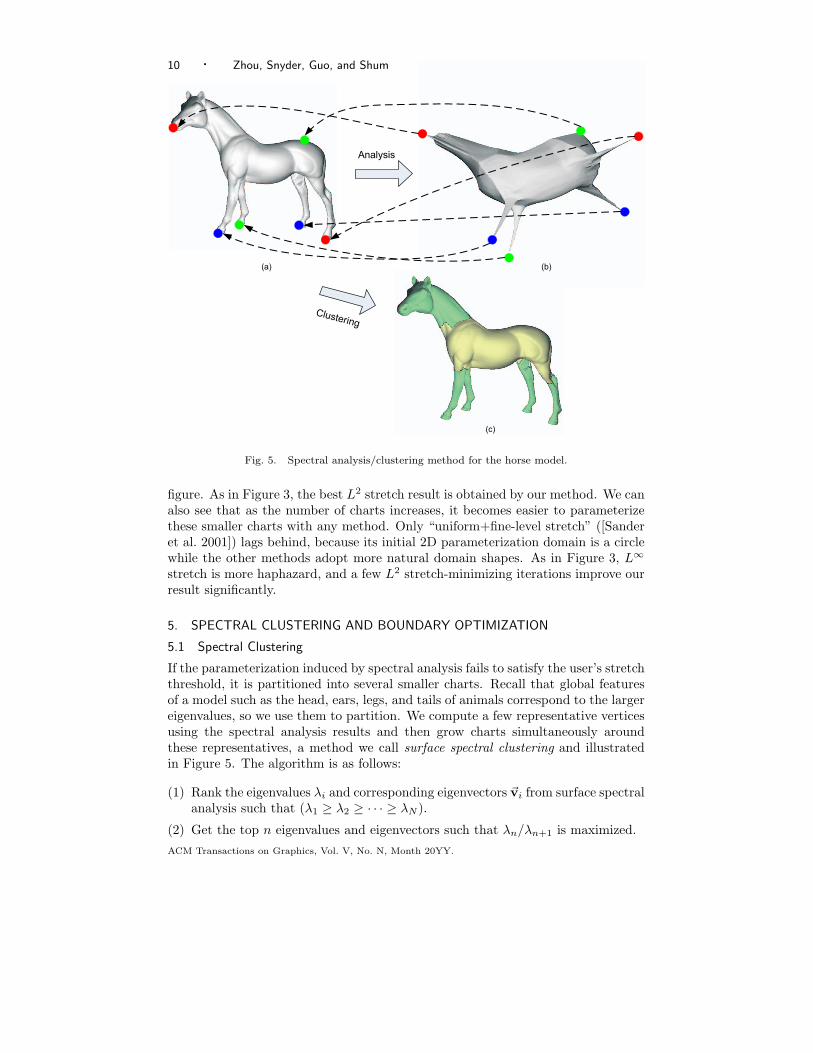
Fig. 5. Spectral analysis/clustering method for the horse model.
figure. As in Figure 3, the best L2 stretch result is obtained by our method. We canalso see that as the number of charts increases, it becomes easier to parameterizethese smaller charts with any method. Only “uniform+fine-level stretch” ([Sanderet al. 2001]) lags behind, because its initial 2D parameterization domain is a circlewhile the other methods adopt more natural domain shapes. As in Figure 3, L∞
stretch is more haphazard, and a few L2 stretch-minimizing iterations improve ourresult significantly.
5. SPECTRAL CLUSTERING AND BOUNDARY OPTIMIZATION
5.1 Spectral Clustering
If the parameterization induced by spectral analysis fails to satisfy the user’s stretchthreshold, it is partitioned into several smaller charts. Recall that global featuresof a model such as the head, ears, legs, and tails of animals correspond to the largereigenvalues, so we use them to partition. We compute a few representative verticesusing the spectral analysis results and then grow charts simultaneously aroundthese representatives, a method we call surface spectral clustering and illustratedin Figure 5. The algorithm is as follows:
(1) Rank the eigenvalues λi and corresponding eigenvectors �vi from surface spectralanalysis such that (λ1 ≥ λ2 ≥ · · · ≥ λN ).
(2) Get the top n eigenvalues and eigenvectors such that λn/λn+1 is maximized.ACM Transactions on Graphics, Vol. V, No. N, Month 20YY.

Iso-charts: Stretch-driven Mesh Parameterization using Spectral Analysis · 11
∑∑
=
=
Nii
nii
,1
,1
λ
λn=3 n=4
1+i
i
λλ 43 λλ
Fig. 6. Eigenvalues for the horse model.
(3) For each vertex i of the mesh, compute its n-dimensional embedding coordi-nates: �yj
i =√
λj �vij (j = 1, 2, ..., n).
(4) For each of the n embedding coordinates, find the two vertices with maximumand minimum coordinate values and set them as 2n representatives, shown aspairs of colored dots in Figure 5.
(5) Remove representatives which are too close together, yielding m ≤ 2n repre-sentatives.
(6) Partition the mesh into m parts by growing charts simultaneously around therepresentatives using the geodesic distance calculated in surface spectral anal-ysis. Each triangle is assigned to the chart whose representative is closest tothe triangle.
Step 2 computes n by finding the “knee” in the curve relating the sum of eigen-values to the number of eigenvalues, as shown in the top graph of Figure 6. Tofind this knee, we look at the ratio of successive eigenvalues, findng the pair wherethe eigenvalues are dropping fastest; i.e., finding i maximizing λi/λi+1. In the casewhere the top three eigenvalues constitute 90% or more of the total eigenvalue sum,we perform binary subdivision. Otherwise, we find the n ≥ 3 which maximizes theratio of successive eigenvalues and proceed with this n using the above 6 steps.The bottom part of Figure 6 shows the ratio graph and the optimal value of n = 3selected for this horse example.
The value of n is a measure of shape complexity: n < 3 implies a fairly flatshape; large n implies a complicated shape with significant detail. Eliminating theremaining N − n eigenvalues ignores high frequency detail and avoids partitioninginto too many charts. Our implementation also restricts n ≤ 10 (see Section 6),which in turn restricts the maximum number of sub-charts.
ACM Transactions on Graphics, Vol. V, No. N, Month 20YY.

12 · Zhou, Snyder, Guo, and Shum
(a) n = 1 (b) n = 2 (c) n = 3 (d) n = 4
Fig. 7. Spectral clustering results for the horse model as a function of n.
Since representatives computed from different dimensions in Step 4 may be closeand so redundant, Step 5 removes them. We use a distance threshold of 10 timesthe average edge length of the input mesh. In Step 6, the geodesic distance froma triangle to a representative vertex is computed as the average of the geodesicdistances of the triangle’s three vertices to the representative.
Figure 7 shows clustering results for different values of n on the horse model.Note how identifiable features, such as the legs, are partitioned using this method.The top row in Figure 13 demonstrates spectral clustering results for other models.Charts correspond to global features in the model such as the wings of the feline,and the neck, legs and tail of the dinosaur.
5.2 Computing Optimal Partition Boundaries with Graph Cutting
After splitting charts, we optimize the boundaries between them. Chart boundariesshould satisfy two objectives: 1) they should cut through areas of high curvaturewithout being too jaggy, and 2) they should minimize the embedding distortions ofthe charts they border.
The first objective has been addressed in previous chartification work [Sanderet al. 2001; Levy et al. 2002; Sander et al. 2003], which minimize various measuresof chart compactness while choosing chart cuts of shortest length or along edgeshaving high dihedral angle. Recently [Katz and Tal 2003] has used graph cut todecompose meshes, an idea we apply to the mesh parameterization problem. Thesecond objective relates to our desire for a stretch-minimizing partition, and hasnever been addressed as far as we know.
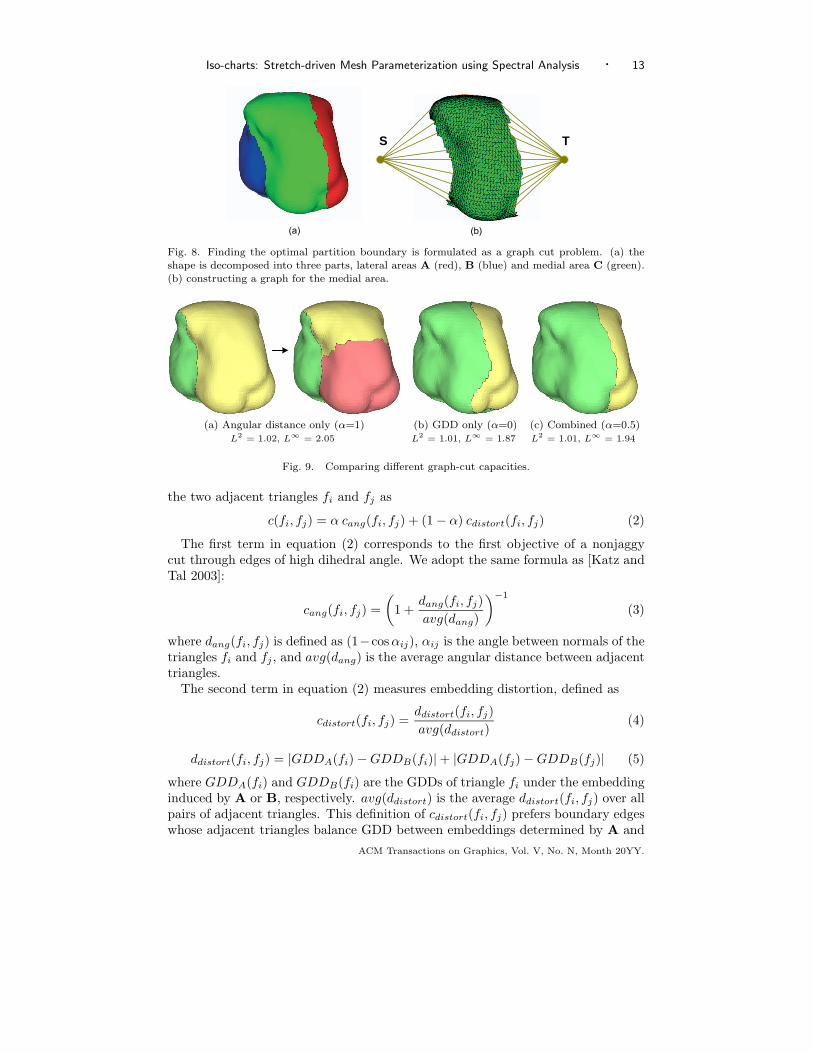
Our solution is to formulate the optimal boundary problem as a graph cuttingproblem. For simplicity, we discuss the binary case which splits the surface into two.When subdividing into more than two charts, we consider each pair of neighboringcharts in turn.
Figure 8a gives an example. Suppose we seek an optimal boundary betweentwo charts A and B. The initial partition is generated by using surface spectralclustering. We then generate a medial region, C, by expanding an area to eitherside of the initial split boundary. The medial region’s size is proportional to thetotal area of the unsplit patch; we use 30% for all examples. Now an undirectedflow network graph (Figure 8b) can be constructed from C using an extension of themethod in [Katz and Tal 2003]. We modify their definition of “capacity” betweenACM Transactions on Graphics, Vol. V, No. N, Month 20YY.
Iso-charts: Stretch-driven Mesh Parameterization using Spectral Analysis · 13
(a) (b)
S T
Fig. 8. Finding the optimal partition boundary is formulated as a graph cut problem. (a) theshape is decomposed into three parts, lateral areas A (red), B (blue) and medial area C (green).(b) constructing a graph for the medial area.
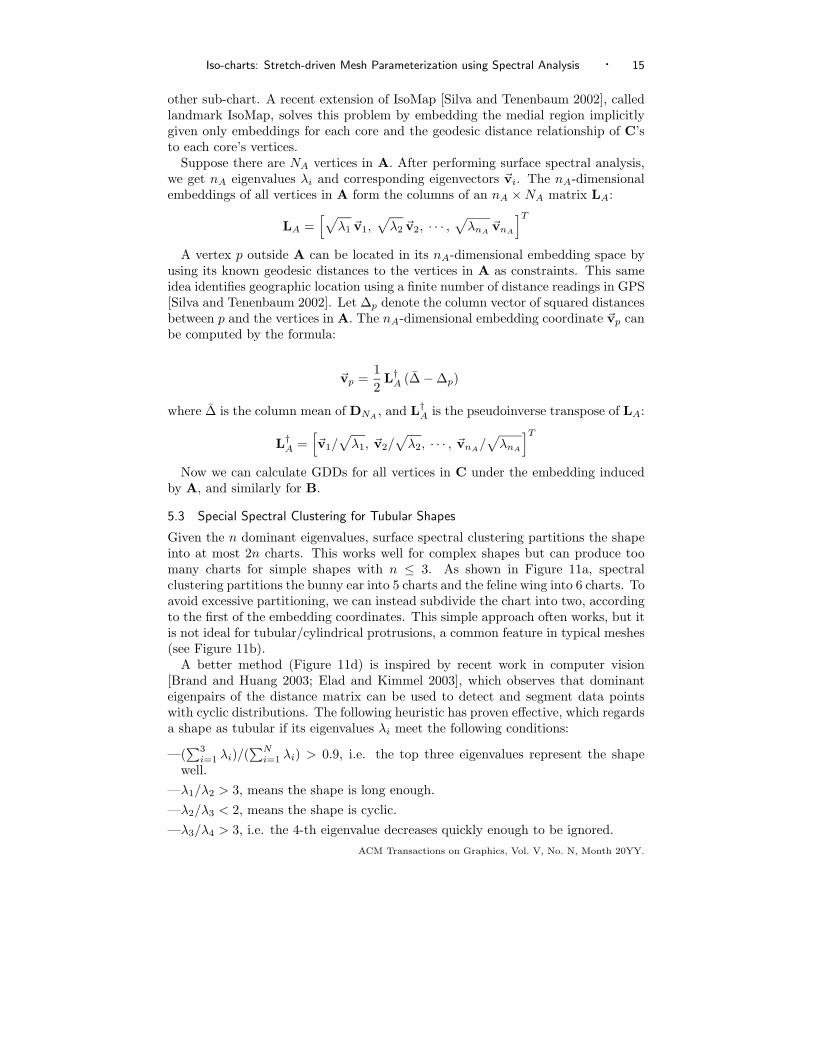
(a) Angular distance only (α=1) (b) GDD only (α=0) (c) Combined (α=0.5)
L2 = 1.02, L∞ = 2.05 L2 = 1.01, L∞ = 1.87 L2 = 1.01, L∞ = 1.94
Fig. 9. Comparing different graph-cut capacities.
the two adjacent triangles fi and fj as
c(fi, fj) = α cang(fi, fj) + (1 − α) cdistort(fi, fj) (2)
The first term in equation (2) corresponds to the first objective of a nonjaggycut through edges of high dihedral angle. We adopt the same formula as [Katz andTal 2003]:
cang(fi, fj) =(
1 +dang(fi, fj)avg(dang)
)−1
(3)
where dang(fi, fj) is defined as (1−cos αij), αij is the angle between normals of thetriangles fi and fj , and avg(dang) is the average angular distance between adjacenttriangles.
The second term in equation (2) measures embedding distortion, defined as
cdistort(fi, fj) =ddistort(fi, fj)avg(ddistort)
(4)
ddistort(fi, fj) = |GDDA(fi) − GDDB(fi)| + |GDDA(fj) − GDDB(fj)| (5)
where GDDA(fi) and GDDB(fi) are the GDDs of triangle fi under the embeddinginduced by A or B, respectively. avg(ddistort) is the average ddistort(fi, fj) over allpairs of adjacent triangles. This definition of cdistort(fi, fj) prefers boundary edgeswhose adjacent triangles balance GDD between embeddings determined by A and
ACM Transactions on Graphics, Vol. V, No. N, Month 20YY.

14 · Zhou, Snyder, Guo, and Shum
(a) before boundary optimization13 charts, L2 = 1.04, L∞ = 2.40
(b) after boundary optimization11 charts, L2 = 1.01, L∞ = 1.84
Fig. 10. Boundary optimization results for the hand model.
B. In other words, the cut should avoid placing a triangle on the wrong side whereit creates unnecessary distortion.
Given the graph in Figure 8b with edge weights defined via equation (2), theminimum cut algorithm generates a boundary satisfying our two objectives: itpasses through areas of high curvature (if they exist) without meandering andyields low embedding distortion of its bordering charts.
The weight parameter α trades off the two objectives. α=1 defines capacity as in[Katz and Tal 2003] and achieves good results for models with sharp features. Forshapes whose dihedral angles vary smoothly in the medial area, it tends toward acut of shortest length (see Figure 9a), often generating unbalanced cuts that poorlycontrol stretch. For example in Figure 9a (left), splitting by α = 1 produces toomuch stretch in the yellow chart, requiring it to be split again to satisfy the user’sthreshold (right).
On the other hand, we can set α = 0 to minimize GDD as Figure 9b illustrates,which avoids needless chart subdivision but makes the boundary jaggier. Figure 9csets α = 0.5. Although the parameterization stretch is a little larger than 9b, asmoother boundary is desirable for many applications.
Figure 10 shows the result of graph-cut boundary optimization on a hand model.Note how optimized chart boundaries follow creases in the model, such as thebetween the thumb and hand. Stretch of the resulting charts is also significantlydecreased, even though fewer are required to satisfy the stretch threshold.
5.2.1 Landmark IsoMap for Medial Region Embedding. To compute the aboveoptimal partition boundary, we require two embeddings over the unsplit chart: onecorresponding to side A and one to side B. These two embeddings define GDDA
and GDDB . Neither sub-chart “core”, A or B, contains the inner vertices of themedial region C. So we can’t compute the embedding coordinates of C’s verticesusing spectral analysis on A or B alone. Since we don’t yet know which trianglesof C will be joined with A and which with B, we desire embeddings for eachsub-chart that will not be too distorted by triangles that end up inserted in theACM Transactions on Graphics, Vol. V, No. N, Month 20YY.
Iso-charts: Stretch-driven Mesh Parameterization using Spectral Analysis · 15
other sub-chart. A recent extension of IsoMap [Silva and Tenenbaum 2002], calledlandmark IsoMap, solves this problem by embedding the medial region implicitlygiven only embeddings for each core and the geodesic distance relationship of C’sto each core’s vertices.
Suppose there are NA vertices in A. After performing surface spectral analysis,we get nA eigenvalues λi and corresponding eigenvectors �vi. The nA-dimensionalembeddings of all vertices in A form the columns of an nA × NA matrix LA:
LA =[√
λ1 �v1,√
λ2 �v2, · · · ,√
λnA�vnA
]T
A vertex p outside A can be located in its nA-dimensional embedding space byusing its known geodesic distances to the vertices in A as constraints. This sameidea identifies geographic location using a finite number of distance readings in GPS[Silva and Tenenbaum 2002]. Let ∆p denote the column vector of squared distancesbetween p and the vertices in A. The nA-dimensional embedding coordinate �vp canbe computed by the formula:
�vp =12
L†A (∆ − ∆p)
where ∆ is the column mean of DNA, and L†
A is the pseudoinverse transpose of LA:
L†A =
[�v1/
√λ1, �v2/
√λ2, · · · , �vnA
/√
λnA
]T
Now we can calculate GDDs for all vertices in C under the embedding inducedby A, and similarly for B.
5.3 Special Spectral Clustering for Tubular Shapes
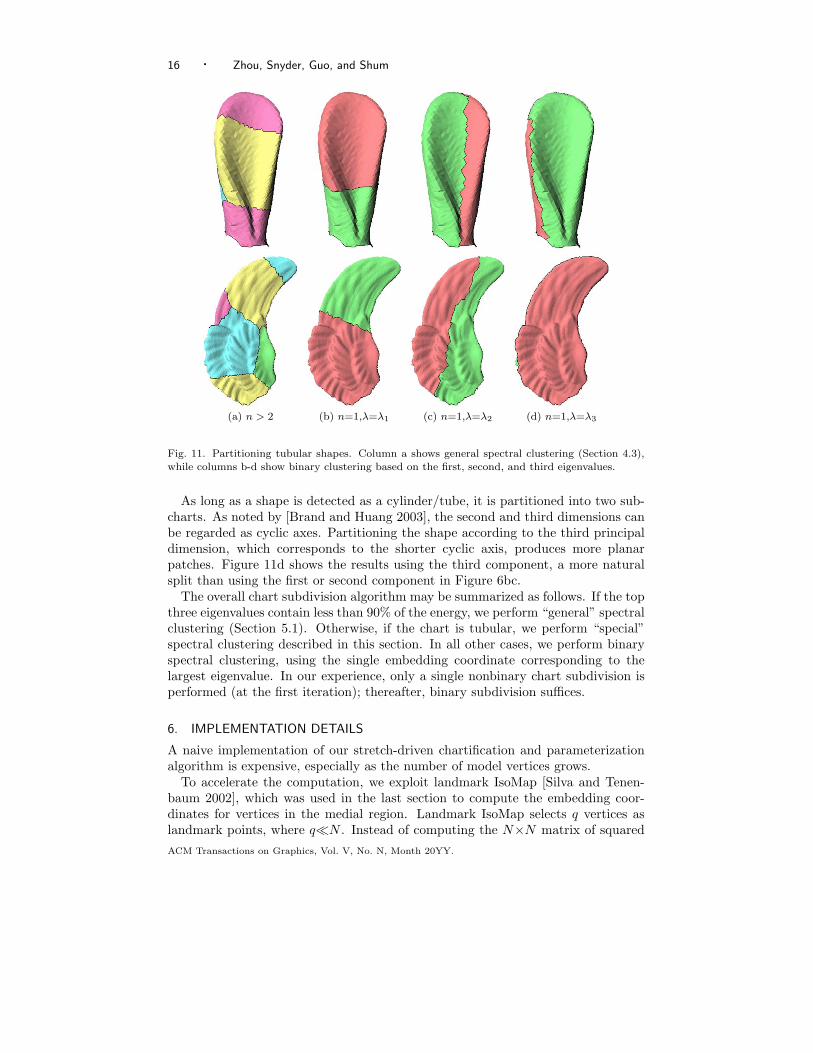
Given the n dominant eigenvalues, surface spectral clustering partitions the shapeinto at most 2n charts. This works well for complex shapes but can produce toomany charts for simple shapes with n ≤ 3. As shown in Figure 11a, spectralclustering partitions the bunny ear into 5 charts and the feline wing into 6 charts. Toavoid excessive partitioning, we can instead subdivide the chart into two, accordingto the first of the embedding coordinates. This simple approach often works, but itis not ideal for tubular/cylindrical protrusions, a common feature in typical meshes(see Figure 11b).
A better method (Figure 11d) is inspired by recent work in computer vision[Brand and Huang 2003; Elad and Kimmel 2003], which observes that dominanteigenpairs of the distance matrix can be used to detect and segment data pointswith cyclic distributions. The following heuristic has proven effective, which regardsa shape as tubular if its eigenvalues λi meet the following conditions:
—(∑3
i=1 λi)/(∑N
i=1 λi) > 0.9, i.e. the top three eigenvalues represent the shapewell.
—λ1/λ2 > 3, means the shape is long enough.—λ2/λ3 < 2, means the shape is cyclic.—λ3/λ4 > 3, i.e. the 4-th eigenvalue decreases quickly enough to be ignored.
ACM Transactions on Graphics, Vol. V, No. N, Month 20YY.
16 · Zhou, Snyder, Guo, and Shum
(a) n > 2 (b) n=1,λ=λ1 (c) n=1,λ=λ2 (d) n=1,λ=λ3
Fig. 11. Partitioning tubular shapes. Column a shows general spectral clustering (Section 4.3),while columns b-d show binary clustering based on the first, second, and third eigenvalues.
As long as a shape is detected as a cylinder/tube, it is partitioned into two sub-charts. As noted by [Brand and Huang 2003], the second and third dimensions canbe regarded as cyclic axes. Partitioning the shape according to the third principaldimension, which corresponds to the shorter cyclic axis, produces more planarpatches. Figure 11d shows the results using the third component, a more naturalsplit than using the first or second component in Figure 6bc.
The overall chart subdivision algorithm may be summarized as follows. If the topthree eigenvalues contain less than 90% of the energy, we perform “general” spectralclustering (Section 5.1). Otherwise, if the chart is tubular, we perform “special”spectral clustering described in this section. In all other cases, we perform binaryspectral clustering, using the single embedding coordinate corresponding to thelargest eigenvalue. In our experience, only a single nonbinary chart subdivision isperformed (at the first iteration); thereafter, binary subdivision suffices.
6. IMPLEMENTATION DETAILS
A naive implementation of our stretch-driven chartification and parameterizationalgorithm is expensive, especially as the number of model vertices grows.
To accelerate the computation, we exploit landmark IsoMap [Silva and Tenen-baum 2002], which was used in the last section to compute the embedding coor-dinates for vertices in the medial region. Landmark IsoMap selects q vertices aslandmark points, where q�N . Instead of computing the N×N matrix of squaredACM Transactions on Graphics, Vol. V, No. N, Month 20YY.
Iso-charts: Stretch-driven Mesh Parameterization using Spectral Analysis · 17
geodesic distances, DN , an q×N matrix Dq,N is computed measuring distancesfrom each vertex to the landmark points only. Embedding coordinates of the qlandmark points are computed using surface spectral analysis while the remainingvertices can be computed using the method described in Section 5.2.1.
To get the landmark points, models are simplified by performing half edge col-lapse operations based on the quadric error metric [Garland and Heckbert 1997].Progressive meshes [Hoppe 1996] free us from having to simplify each chart fromscratch. We only need to perform enough vertex splits recorded in the PM to obtainenough landmark points within the chart.
For all charts, we use q = 100 landmark points, which makes the processing fasteven on large charts. When the chart has fewer than 100 vertices, we simply includethem all as landmark points. Though the landmark embedding can exhibit morestretch than the full analysis, this is likely only for large chart that have high stretchand will need to be refined anyway. Landmark embedding with q independent ofchart size thus provides a fast but very reasonable heuristic.
Since the the top 10 eigenvalues constitute over 95% of the squared energy in ourtest models, another speed-up is to calculate only the first 10 eigenpairs in surfacespectral analysis. In summary, the geodesic distance computation is reduced toO(q N logN) and spectral decomposition to O(q2).
To stretch-optimize the parameterization produced by spectral analysis, we per-form a few iterations of the method in [Sander et al. 2002]. We first find each vertexwhose L2 stretch in its 1-ring neighborhood is greater than the user-specified limit,and rank these vertices in decreasing order of stretch. For each vertex, we then per-form the following steps. If a vertex is not in the convex kernel of its neighborhood,we relocate it to the centroid of the kernel. We then take a random direction andminimize stretch along that direction. Directional minimizations are performed upto 6 times or until an iteration fails to improve stretch sufficiently (using a thresholdof at least 10% improvement).
After generating an atlas, we perform a post-processing step that merges chartsusing a simple heuristic. We begin by ranking the charts in increasing order ofnumber of faces belonging to the chart and computing an average normal for eachchart. Only “small” charts are considered, having no more than 10% of the totalnumber of faces. For each small chart, we consider merging each of its neighboringcharts in decreasing order of dot products of average normals. Chart pairs aregreedily merged in this order if the stretch after merging still satisfies the stretchthresholds.
Our packing algorithm is an extension of the “Tetris” algorithm in [Levy et al.2002] (refer to Figure 7 in that paper). In [Levy et al. 2002], charts can only beintroduced from the top; we can introduce them from the top, bottom, left or rightdirections. Our algorithm therefore keeps track of the current “horizons” for each ofthe four directions, given all the charts introduced so far. A horizon for a direction(up, down, left, right) is the distance in that direction to the nearest chart for eachedge pixel. For example, the top horizon is the distance in the vertical directionfrom the top of the packing to the nearest chart inserted, for each pixel in the toprow.
The user specifies the desired width and height of the atlas, W and H. OurACM Transactions on Graphics, Vol. V, No. N, Month 20YY.
18 · Zhou, Snyder, Guo, and Shum
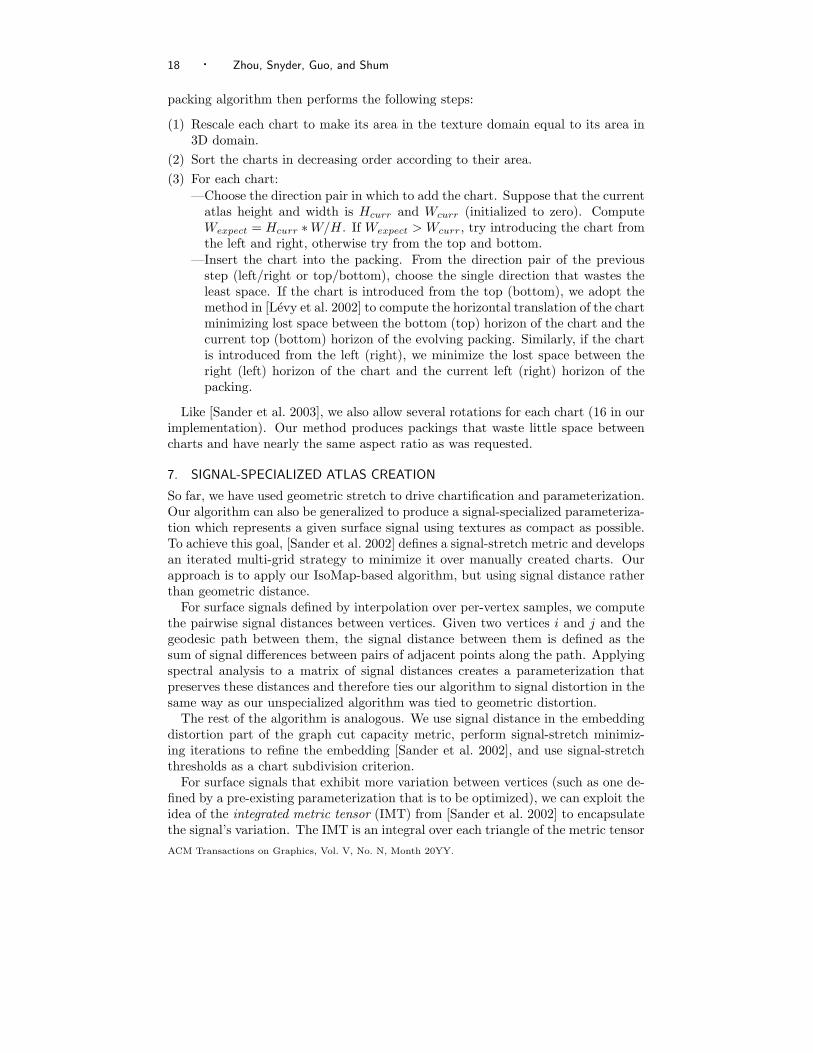
packing algorithm then performs the following steps:
(1) Rescale each chart to make its area in the texture domain equal to its area in3D domain.
(2) Sort the charts in decreasing order according to their area.(3) For each chart:
—Choose the direction pair in which to add the chart. Suppose that the currentatlas height and width is Hcurr and Wcurr (initialized to zero). ComputeWexpect = Hcurr ∗W/H. If Wexpect > Wcurr, try introducing the chart fromthe left and right, otherwise try from the top and bottom.
—Insert the chart into the packing. From the direction pair of the previousstep (left/right or top/bottom), choose the single direction that wastes theleast space. If the chart is introduced from the top (bottom), we adopt themethod in [Levy et al. 2002] to compute the horizontal translation of the chartminimizing lost space between the bottom (top) horizon of the chart and thecurrent top (bottom) horizon of the evolving packing. Similarly, if the chartis introduced from the left (right), we minimize the lost space between theright (left) horizon of the chart and the current left (right) horizon of thepacking.
Like [Sander et al. 2003], we also allow several rotations for each chart (16 in ourimplementation). Our method produces packings that waste little space betweencharts and have nearly the same aspect ratio as was requested.
7. SIGNAL-SPECIALIZED ATLAS CREATION
So far, we have used geometric stretch to drive chartification and parameterization.Our algorithm can also be generalized to produce a signal-specialized parameteriza-tion which represents a given surface signal using textures as compact as possible.To achieve this goal, [Sander et al. 2002] defines a signal-stretch metric and developsan iterated multi-grid strategy to minimize it over manually created charts. Ourapproach is to apply our IsoMap-based algorithm, but using signal distance ratherthan geometric distance.
For surface signals defined by interpolation over per-vertex samples, we computethe pairwise signal distances between vertices. Given two vertices i and j and thegeodesic path between them, the signal distance between them is defined as thesum of signal differences between pairs of adjacent points along the path. Applyingspectral analysis to a matrix of signal distances creates a parameterization thatpreserves these distances and therefore ties our algorithm to signal distortion in thesame way as our unspecialized algorithm was tied to geometric distortion.
The rest of the algorithm is analogous. We use signal distance in the embeddingdistortion part of the graph cut capacity metric, perform signal-stretch minimiz-ing iterations to refine the embedding [Sander et al. 2002], and use signal-stretchthresholds as a chart subdivision criterion.
For surface signals that exhibit more variation between vertices (such as one de-fined by a pre-existing parameterization that is to be optimized), we can exploit theidea of the integrated metric tensor (IMT) from [Sander et al. 2002] to encapsulatethe signal’s variation. The IMT is an integral over each triangle of the metric tensorACM Transactions on Graphics, Vol. V, No. N, Month 20YY.

Iso-charts: Stretch-driven Mesh Parameterization using Spectral Analysis · 19
(Jacobian transpose times Jacobian) of the mapping from points on the triangleinto the signal space. It is a symmetric, 2×2 matrix regardless of the signal’s di-mensionality and is therefore a compact measure of per-triangle signal variation,requiring only three numbers per triangle. For mapped signals, the Jacobian isnot constant over each triangle, as it is for a signal defined by linear interpolationbetween triangle vertices, but varies spatially. Thus, computing IMTs for mappedsignals requires numerical integration.
Given the geodesic path between vertices i and j, we can use the sequence ofIMTs of each triangle traversed by the path to compute the signal distance alongthe path from i to j. Let Mk be the IMT of the k-th triangle traversed by thisgeodesic path, and pk and qk be the first and last points along the linear segmentof the path within this triangle. Then the contribution to signal distance of thepath segment from pk to qk is given by
(pk − qk)T Mk (pk − qk).
In other words, the IMT is interpreted as a quadratic form that maps geometricdifference vectors within a triangle to squared signal distances.
Typical signals such as textured colors can exhibit much more variation thanthe underlying geometry. Unsurprisingly, surface spectral analysis using signaldistances produces a very complex embedding with many dominant eigenvaluesand leads to excessive partitioning. The analogous problem led [Sander et al. 2002]to combine geometric and signal stretch; our solution defines distance with a similarcombination of geodesic and signal distances:
dcomb(i, j) = βdgeo(i, j)avg(dgeo)
+ (1 − β)dsig(i, j)avg(dsig)
(6)
where dsig(i, j) is the signal distance between i and j. We achieve good results withβ = 0.5.
8. ISOCHARTS FOR TEXTURE SYNTHESIS
Surface texture synthesis algorithms [Wei and Levoy 2001; Turk 2001] build a meshpyramid, or sequence of successively coarser meshes, to extend multi-resolution tex-ture synthesis from 2D images to 3D surfaces. The retiling method [Turk 1991] isused for this purpose, which distributes points over the surface and then recon-structs their connectivity. To render the synthesis results, per-vertex colors areassociated with the mesh. More efficient use of graphics hardware results fromusing a texture map, which can be created as a post-process.
We instead construct a good mesh pyramid and compact texture maps simulta-neously. The idea is based on the multi-chart geometry image (MCGIM) [Sanderet al. 2003] which uses an atlas to sample a surface’s geometric coordinates and thenzippers chart boundaries to ensure that a “watertight” mesh can be reconstructed.
Our method first creates a geometric stretch minimizing atlas. We then applythe sampling, zippering and packing of [Sander et al. 2003] to build a series ofsuccessively coarser MCGIMs (e.g., 128×128, 64×64, 32×32) all derived from thissame atlas. Because these different resolution MCGIMs are packed and zipperedseparately, a natural correspondence does not exist between their samples. We
ACM Transactions on Graphics, Vol. V, No. N, Month 20YY.
20 · Zhou, Snyder, Guo, and Shum
128x12864x6432x32
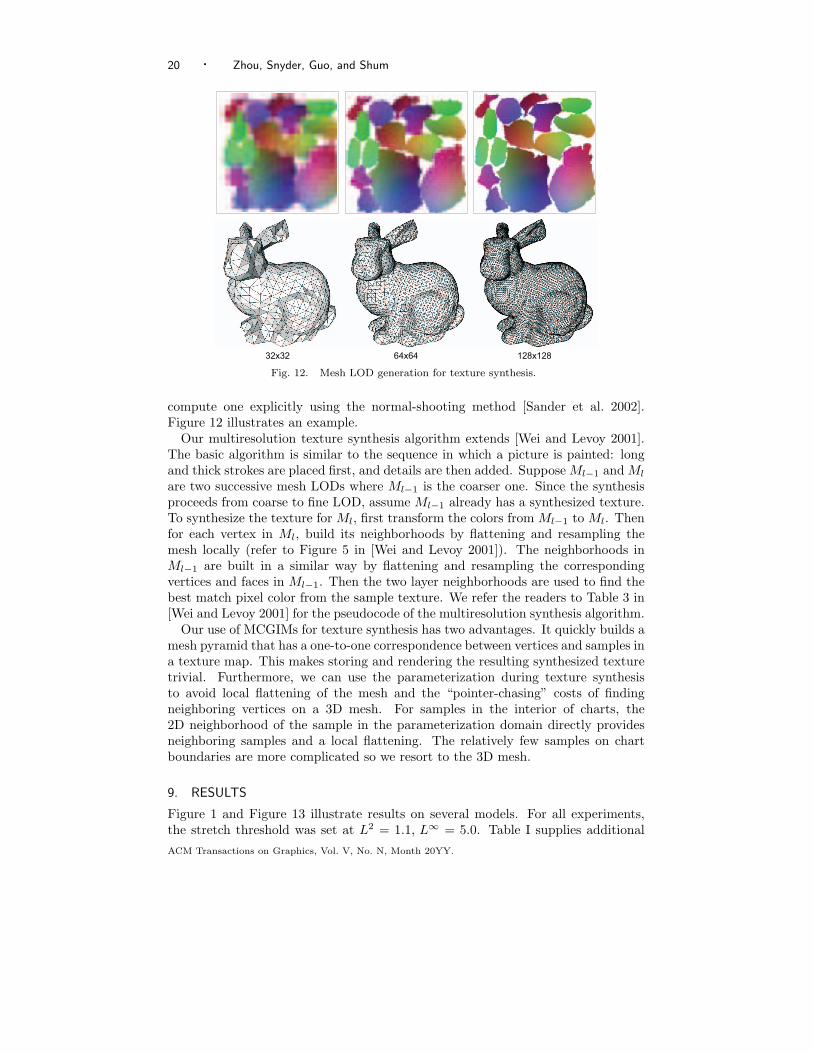
Fig. 12. Mesh LOD generation for texture synthesis.
compute one explicitly using the normal-shooting method [Sander et al. 2002].Figure 12 illustrates an example.
Our multiresolution texture synthesis algorithm extends [Wei and Levoy 2001].The basic algorithm is similar to the sequence in which a picture is painted: longand thick strokes are placed first, and details are then added. Suppose Ml−1 and Ml
are two successive mesh LODs where Ml−1 is the coarser one. Since the synthesisproceeds from coarse to fine LOD, assume Ml−1 already has a synthesized texture.To synthesize the texture for Ml, first transform the colors from Ml−1 to Ml. Thenfor each vertex in Ml, build its neighborhoods by flattening and resampling themesh locally (refer to Figure 5 in [Wei and Levoy 2001]). The neighborhoods inMl−1 are built in a similar way by flattening and resampling the correspondingvertices and faces in Ml−1. Then the two layer neighborhoods are used to find thebest match pixel color from the sample texture. We refer the readers to Table 3 in[Wei and Levoy 2001] for the pseudocode of the multiresolution synthesis algorithm.
Our use of MCGIMs for texture synthesis has two advantages. It quickly builds amesh pyramid that has a one-to-one correspondence between vertices and samples ina texture map. This makes storing and rendering the resulting synthesized texturetrivial. Furthermore, we can use the parameterization during texture synthesisto avoid local flattening of the mesh and the “pointer-chasing” costs of findingneighboring vertices on a 3D mesh. For samples in the interior of charts, the2D neighborhood of the sample in the parameterization domain directly providesneighboring samples and a local flattening. The relatively few samples on chartboundaries are more complicated so we resort to the 3D mesh.
9. RESULTS
Figure 1 and Figure 13 illustrate results on several models. For all experiments,the stretch threshold was set at L2 = 1.1, L∞ = 5.0. Table I supplies additionalACM Transactions on Graphics, Vol. V, No. N, Month 20YY.

Iso-charts: Stretch-driven Mesh Parameterization using Spectral Analysis · 21
L2=1.04, L∞=3.29L2=1.07, L∞=5.12L2=1.03, L∞=2.87 L2=1.03, L∞=2.78 L2=1.06, L∞=4.13
Fig. 13. Chartification and parameterization results produced by our algorithm. The top rowshows the charts on the 3D surface; the bottom row shows iso-parameter lines over the surfaceand the texture atlases.
bunny horse dino feline skull dinosaur
# vertices 35k 48k 24k 75k 20k 56k
# faces 69k 97k 48k 150k 40k 112k
# charts 15 19 20 38 6 23
# charts before merge 21 32 36 67 6 39
packing ratio 0.72 0.69 0.66 0.65 0.71 0.70
L2 stretch 1.01 1.03 1.04 1.07 1.03 1.06
L∞ stretch 2.26 2.78 3.29 5.12 2.87 4.13
chart¶m (s) 40 68 20 165 14 87
merging (s) 15 10 26 72 0 32
packing (s) 15 20 10 50 3 43
total (s) 70 98 56 287 17 162
Table I. Statistics and timings for models presented in the paper. Times were measured on anIntel Xeon 3.0G machine.
statistics, including running times, for the resulting atlases. The results demon-strate that our method produces low-stretch atlases with a small number of charts.The following sections demonstrate applications of our method and compare it toprevious work.
9.1 Insensitivity to Noise and Mesh Resolution
Since our algorithm is based on the surface spectral analysis, it relies only on thegeodesic distances between surface vertices, which are fairly insensitive to noiseand resolution change. Figure 14 shows the results of applying our algorithm toa noisy bunny and a low resolution bunny (3,000 triangles). In both cases, thechart numbers of the texture atlases are similar to that in Figure 1, although the
ACM Transactions on Graphics, Vol. V, No. N, Month 20YY.
22 · Zhou, Snyder, Guo, and Shum
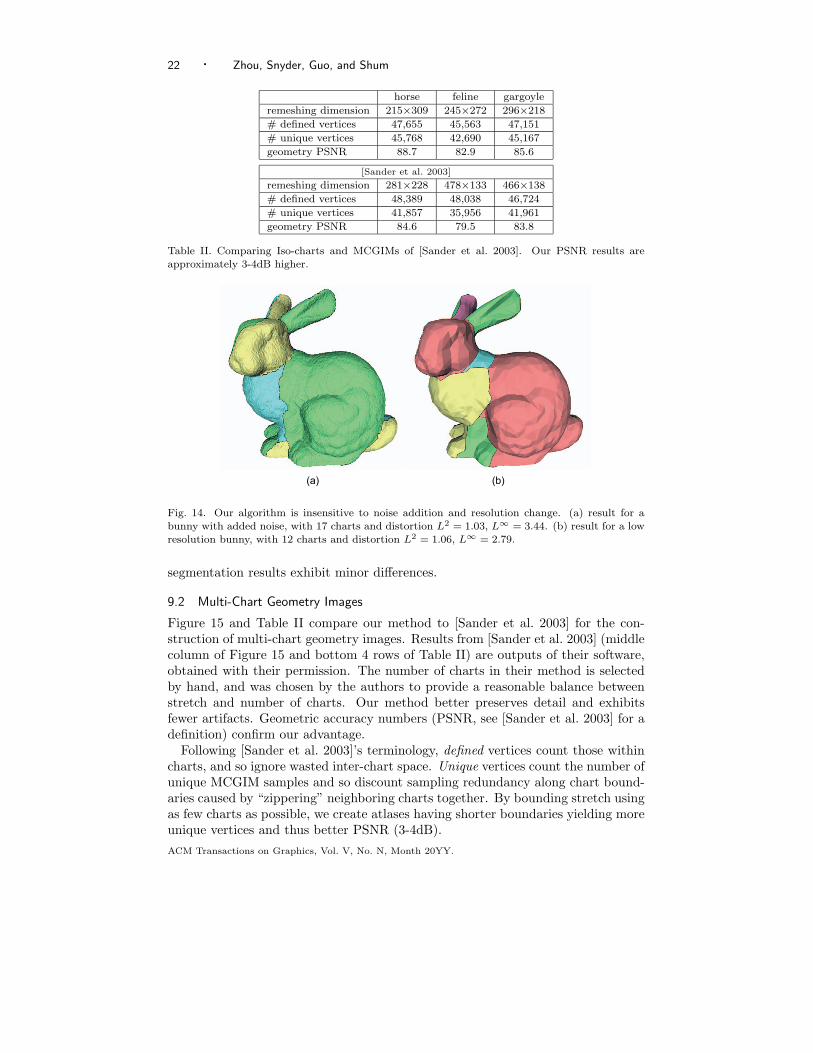
horse feline gargoyle
remeshing dimension 215×309 245×272 296×218
# defined vertices 47,655 45,563 47,151
# unique vertices 45,768 42,690 45,167
geometry PSNR 88.7 82.9 85.6
[Sander et al. 2003]
remeshing dimension 281×228 478×133 466×138
# defined vertices 48,389 48,038 46,724
# unique vertices 41,857 35,956 41,961
geometry PSNR 84.6 79.5 83.8
Table II. Comparing Iso-charts and MCGIMs of [Sander et al. 2003]. Our PSNR results areapproximately 3-4dB higher.
(a) (b)
Fig. 14. Our algorithm is insensitive to noise addition and resolution change. (a) result for abunny with added noise, with 17 charts and distortion L2 = 1.03, L∞ = 3.44. (b) result for a lowresolution bunny, with 12 charts and distortion L2 = 1.06, L∞ = 2.79.
segmentation results exhibit minor differences.
9.2 Multi-Chart Geometry Images
Figure 15 and Table II compare our method to [Sander et al. 2003] for the con-struction of multi-chart geometry images. Results from [Sander et al. 2003] (middlecolumn of Figure 15 and bottom 4 rows of Table II) are outputs of their software,obtained with their permission. The number of charts in their method is selectedby hand, and was chosen by the authors to provide a reasonable balance betweenstretch and number of charts. Our method better preserves detail and exhibitsfewer artifacts. Geometric accuracy numbers (PSNR, see [Sander et al. 2003] for adefinition) confirm our advantage.
Following [Sander et al. 2003]’s terminology, defined vertices count those withincharts, and so ignore wasted inter-chart space. Unique vertices count the number ofunique MCGIM samples and so discount sampling redundancy along chart bound-aries caused by “zippering” neighboring charts together. By bounding stretch usingas few charts as possible, we create atlases having shorter boundaries yielding moreunique vertices and thus better PSNR (3-4dB).ACM Transactions on Graphics, Vol. V, No. N, Month 20YY.
Iso-charts: Stretch-driven Mesh Parameterization using Spectral Analysis · 23
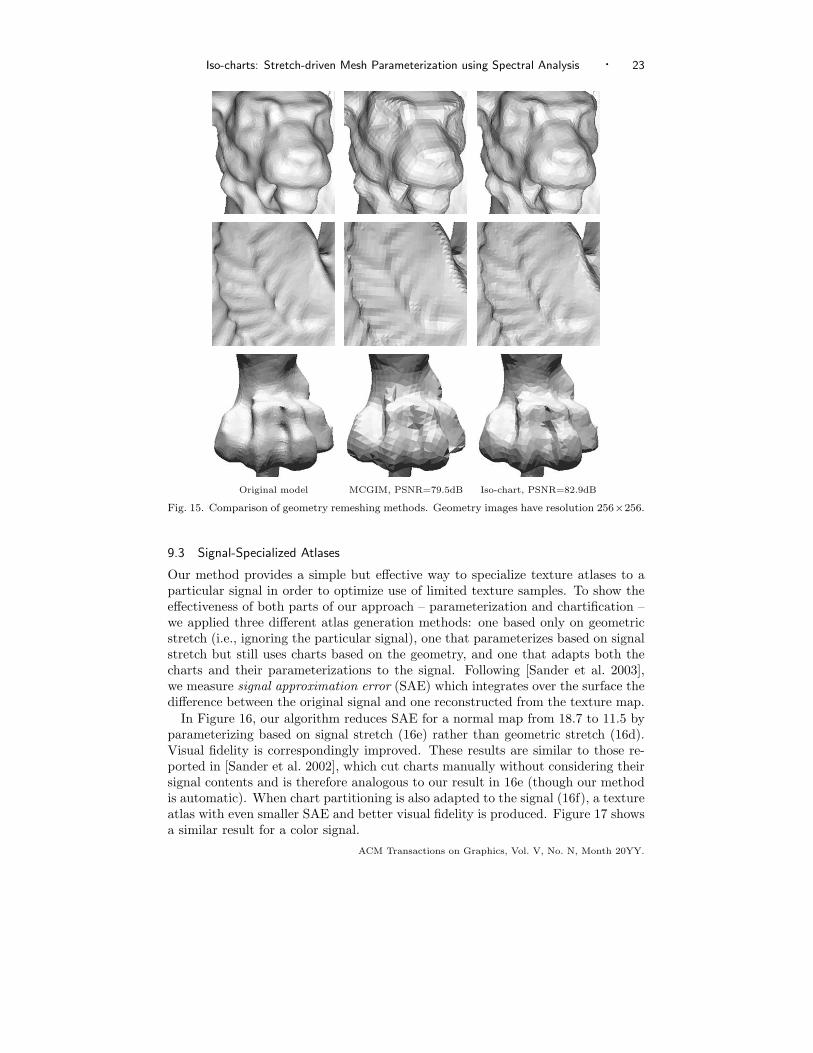
Original model MCGIM, PSNR=79.5dB Iso-chart, PSNR=82.9dB
Fig. 15. Comparison of geometry remeshing methods. Geometry images have resolution 256×256.
9.3 Signal-Specialized Atlases
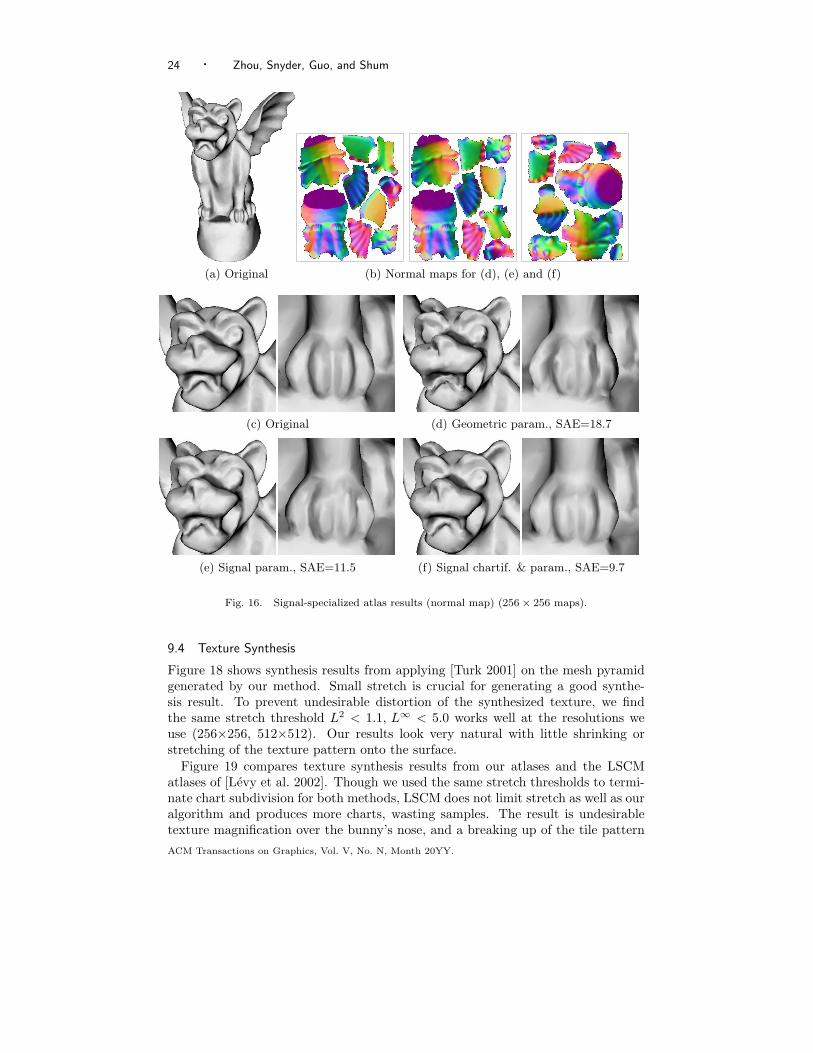
Our method provides a simple but effective way to specialize texture atlases to aparticular signal in order to optimize use of limited texture samples. To show theeffectiveness of both parts of our approach – parameterization and chartification –we applied three different atlas generation methods: one based only on geometricstretch (i.e., ignoring the particular signal), one that parameterizes based on signalstretch but still uses charts based on the geometry, and one that adapts both thecharts and their parameterizations to the signal. Following [Sander et al. 2003],we measure signal approximation error (SAE) which integrates over the surface thedifference between the original signal and one reconstructed from the texture map.
In Figure 16, our algorithm reduces SAE for a normal map from 18.7 to 11.5 byparameterizing based on signal stretch (16e) rather than geometric stretch (16d).Visual fidelity is correspondingly improved. These results are similar to those re-ported in [Sander et al. 2002], which cut charts manually without considering theirsignal contents and is therefore analogous to our result in 16e (though our methodis automatic). When chart partitioning is also adapted to the signal (16f), a textureatlas with even smaller SAE and better visual fidelity is produced. Figure 17 showsa similar result for a color signal.
ACM Transactions on Graphics, Vol. V, No. N, Month 20YY.
24 · Zhou, Snyder, Guo, and Shum
(a) Original (b) Normal maps for (d), (e) and (f)
(c) Original (d) Geometric param., SAE=18.7
(e) Signal param., SAE=11.5 (f) Signal chartif. & param., SAE=9.7
Fig. 16. Signal-specialized atlas results (normal map) (256 × 256 maps).
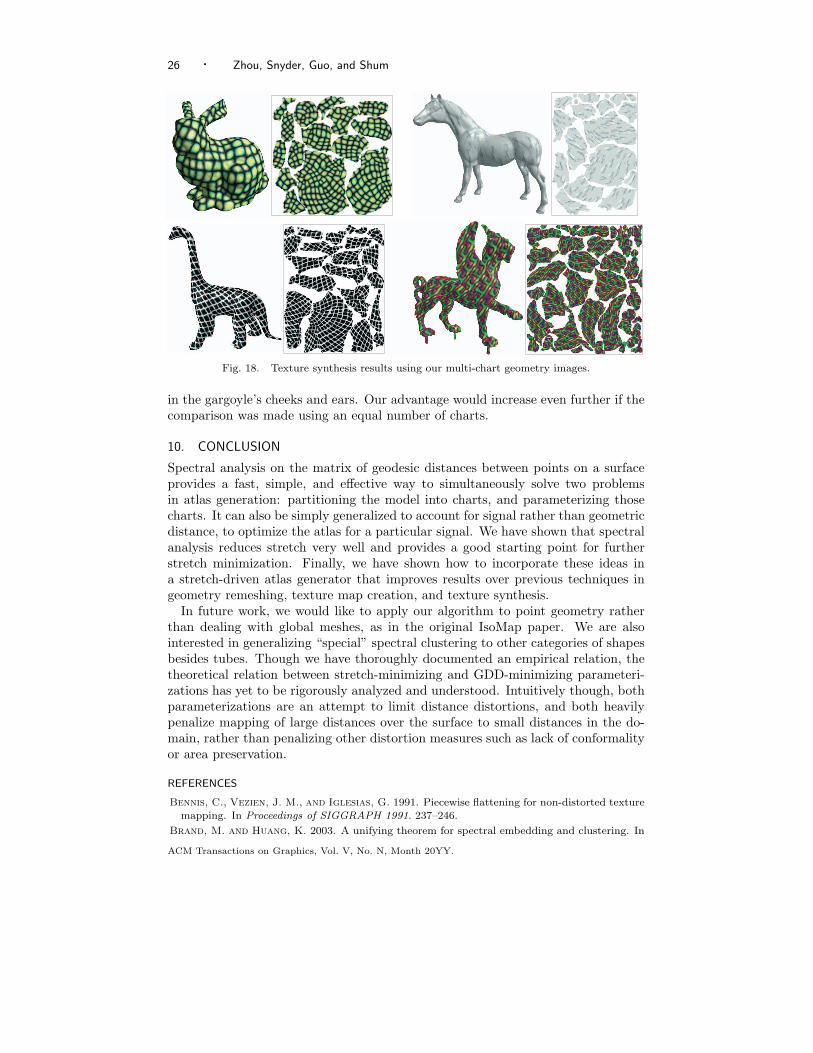
9.4 Texture Synthesis
Figure 18 shows synthesis results from applying [Turk 2001] on the mesh pyramidgenerated by our method. Small stretch is crucial for generating a good synthe-sis result. To prevent undesirable distortion of the synthesized texture, we findthe same stretch threshold L2 < 1.1, L∞ < 5.0 works well at the resolutions weuse (256×256, 512×512). Our results look very natural with little shrinking orstretching of the texture pattern onto the surface.
Figure 19 compares texture synthesis results from our atlases and the LSCMatlases of [Levy et al. 2002]. Though we used the same stretch thresholds to termi-nate chart subdivision for both methods, LSCM does not limit stretch as well as ouralgorithm and produces more charts, wasting samples. The result is undesirabletexture magnification over the bunny’s nose, and a breaking up of the tile patternACM Transactions on Graphics, Vol. V, No. N, Month 20YY.

Iso-charts: Stretch-driven Mesh Parameterization using Spectral Analysis · 25
(a) Original (b) Color maps for (d), (e) and (f)
(c) Original (d) Geometric param., SAE=20.8
(e) Signal param., SAE=17.9 (f) Signal chartif. & param., SAE=16.5
Fig. 17. Signal-specialized atlas results (color map) (256 × 256 maps).
ACM Transactions on Graphics, Vol. V, No. N, Month 20YY.
26 · Zhou, Snyder, Guo, and Shum
Fig. 18. Texture synthesis results using our multi-chart geometry images.
in the gargoyle’s cheeks and ears. Our advantage would increase even further if thecomparison was made using an equal number of charts.
10. CONCLUSION
Spectral analysis on the matrix of geodesic distances between points on a surfaceprovides a fast, simple, and effective way to simultaneously solve two problemsin atlas generation: partitioning the model into charts, and parameterizing thosecharts. It can also be simply generalized to account for signal rather than geometricdistance, to optimize the atlas for a particular signal. We have shown that spectralanalysis reduces stretch very well and provides a good starting point for furtherstretch minimization. Finally, we have shown how to incorporate these ideas ina stretch-driven atlas generator that improves results over previous techniques ingeometry remeshing, texture map creation, and texture synthesis.
In future work, we would like to apply our algorithm to point geometry ratherthan dealing with global meshes, as in the original IsoMap paper. We are alsointerested in generalizing “special” spectral clustering to other categories of shapesbesides tubes. Though we have thoroughly documented an empirical relation, thetheoretical relation between stretch-minimizing and GDD-minimizing parameteri-zations has yet to be rigorously analyzed and understood. Intuitively though, bothparameterizations are an attempt to limit distance distortions, and both heavilypenalize mapping of large distances over the surface to small distances in the do-main, rather than penalizing other distortion measures such as lack of conformalityor area preservation.
REFERENCES
Bennis, C., Vezien, J. M., and Iglesias, G. 1991. Piecewise flattening for non-distorted texturemapping. In Proceedings of SIGGRAPH 1991. 237–246.
Brand, M. and Huang, K. 2003. A unifying theorem for spectral embedding and clustering. In
ACM Transactions on Graphics, Vol. V, No. N, Month 20YY.

Iso-charts: Stretch-driven Mesh Parameterization using Spectral Analysis · 27
Iso-chart, 9 chartsL2 = 1.09, L∞ = 4.90
LSCM, 18 chartsL2 = 1.10, L∞ = 3.50
Iso-chart, 15 chartsL2 = 1.01, L∞ = 2.26
LSCM, 18 chartsL2 = 1.06, L∞ = 2.05
Fig. 19. Minimizing parameterization stretch without using too many charts is crucial for ahigh-quality synthesis result.
Proceedings of the Ninth International Workshop on Artificial Intelligence and Statistics 2003,C. M. Bishop and B. J. Frey, Eds.
Campagna, S. and Seidel, H. 1998. Parameterizing meshes with arbitrary topology. In Proceed-ings of Image and Multidimensional Digital Signal. 287–290.
Carr, N. and Hart, J. 2002. Meshed atlases for real-time procedural solid texturing. ACMTransaction on Graphics 21, 2, 106–131.
Desbrun, M., Meyer, M., and Alliez, P. 2002. Parameterizing meshes with arbitrary topology.In Proceedings of Eurographics 2002.
Eck, M., DeRose, T., Duchamp, T., Hoppe, H., Lounsbery, M., and Stuetzle, W. 1995.Multiresolution analysis of arbitrary meshes. In Proceedings of SIGGRAPH 1995. 173–182.
Elad, A. and Kimmel, R. 2003. On bending invariant signatures for surfaces. IEEE Transactionon PAMI 25, 10, 1285–1295.
Floater, M. 1997. Parameterization and smooth approximation of surface triangulations.CAGD 14, 3, 231–250.
Floater, M. 2003. Mean value coordinates. CAGD 20, 1, 19–27.
Floater, M. and Hormann, K. 2004. Surface parameterization: a tutorial and survey. In Ad-
vances in Multiresolution analysis of Geometric Modelling, M. F. N.A. Dodgson and M. Sabin,Eds. Springer, 259–284.
Garland, M. and Heckbert, P. 1997. Surface simplification using quadric error metrics. InProceedings of SIGGRAPH 1997. 209–216.
ACM Transactions on Graphics, Vol. V, No. N, Month 20YY.
28 · Zhou, Snyder, Guo, and Shum
Gotsman, C., Gu, X., and Sheffer, A. 2003. Fundamentals of spherical parameterization for3d meshes. In Proceedings of SIGGRAPH 2003. 358–363.
Gu, X., Gortler, S., and Hoppe, H. 2003. Geometry images. In Proceedings of SIGGRAPH2002. 355–361.
Guskov, I., Vidimce, K., Sweldens, W., and Schroder, P. 2000. Normal meshes. In Proceedingsof SIGGRAPH 2000. 95–102.
Hoppe, H. 1996. Progressive mesh. In Proceedings of SIGGRAPH 1996. 99–108.
Hormann, K. and Greiner, G. 1999. Mips: An efficient global parameterization method. InCurve and Surface Design: Saint-Malo. Vanderbilt University Press, 219–226.
Karni, Z. and Gotsman, C. 2000. Spectral compression of mesh geometry. In Proceedings ofSIGGRAPH 2000. 279–286.
Katz, S. and Tal, A. 2003. Hierachical mesh decomposition using fuzzy clustering and cuts. InProceedings of SIGGRAPH 2003. 954–961.
Khodakovsky, A., Litke, N., and Schroder, P. 2003. Globally smooth parameterizations withlow distortion. In Proceedings of SIGGRAPH 2003. 350–357.
Kimmel, R. and Sethian, J. 1998. Computing geodesics on manifolds. In Proceedings of Nat’lAcademy Sciences. 8431–8435.
Krishnamurthy, V. and Levoy, M. 1996. Fitting smooth surfaces to dense polygon meshes. InProceedings of SIGGRAPH 1996. 313–324.
Lee, A., Sweldens, W., Schroder, P., Cowsar, L., and Dobkin, D. 1998. Maps: multi-resolution adaptive parameterization of surfaces. In Proceedings of SIGGRAPH 1998. 95–104.
Levy, B. and Mallet, J.-L. 1998. Non-distortion texture mapping for sheared triangulatedmeshes. In Proceedings of SIGGRAPH 1998. 343–352.
Levy, B., Petitjean, S., Ray, N., and Mallet, J.-L. 2002. Least squares conformal maps forautomatic texture atlas generation. In Proceedings of SIGGRAPH 2002. 362–371.
Maillot, J., Yahia, H., and Verroust, A. 1993. Interactive texture mapping. In Proceedingsof SIGGRAPH 1993. 27–34.
Pedersen, H. 1995. Decorating implicit surfaces. In Proceedings of SIGGRAPH 1995. 291–300.
Peyre, G. and Cohen, L. 2004. Geodesic computations for fast and accurate surface flattening.Preprint CMAP n536 .
Roweis, S. and Saul, L. 2000. Nonlinear dimensionality reduction by locally linear embedding.Science 290, 2323–2326.
Sander, P., Gortler, S., Snyder, J., and Hoppe, H. 2002. Signal-specialized parameterization.In Proceedings of Eurographics Workshop on Rendering 2002.
Sander, P., Snyder, J., Gortler, S., and Hoppe, H. 2001. Texture mapping progressive meshes.In Proceedings of SIGGRAPH 2001. 409–416.
Sander, P., Wood, Z., Gortler, S., Snyder, J., and Hoppe, H. 2003. Multi-chart geometryimages. In Symposium on Geometry Processing 2003. 146–155.
Sheffer, A. and Hart, J. 2002. Seamster: inconspicuous low-distortion texture seam layout. InProceedings of IEEE Visualization 2002. 291–298.
Silva, V. and Tenenbaum, J. 2002. Global versus local methods in nonlinear dimensionalityreduction. In Advances in Neural Information Processing Systems. 705–712.
Sorkine, G., Cohen-Or, D., Goldenthal, R., and Lischinski, D. 2002. Bounded-distortionpiecewise mesh parameterization. In Proceedings of IEEE Visualization 2002. 355–362.
Taubin, G. 1995. A signal processing approach to fair surface design. In Proceedings of SIG-GRAPH 1995. 351–358.
Tenenbaum, J., Silva, V., and Langford, J. 2000. A global geometric framework for nonlineardimensionality reduction. Science 290, 2319–2323.
Turk, G. 1991. Generating textures for arbitrary surfaces using reaction-diffusion. In Proceedingsof SIGGRAPH 1991. 289–298.
Turk, G. 2001. Texture synthesis on surfaces. In Proceedings of SIGGRAPH 2001. 347–354.
Wei, L. and Levoy, M. 2001. Texture synthesis over arbitrary manifold surfaces. In Proceedingsof SIGGRAPH 2001. 355–360.
ACM Transactions on Graphics, Vol. V, No. N, Month 20YY.

Iso-charts: Stretch-driven Mesh Parameterization using Spectral Analysis · 29
Zhang, E., Mischaikow, K., and Turk, G. 2004. Feature-based surface parameterization andtexture mapping. to appear in ACM Transaction on Graphics.
Zigelman, G., Kimmel, R., and Kiryati, N. 2002. Texture mapping using surface flattening viamultidimensional scaling. IEEE Transactions on Visualization and Computer Graphics 8, 2,198–207.
ACM Transactions on Graphics, Vol. V, No. N, Month 20YY.