ISO 14000 STANDARDS VOLUNTARY …ageconsearch.umn.edu/bitstream/61855/2/ISO 14000 Standards -...
22
1 ISO 14000 STANDARDS: VOLUNTARY ENVIRONMENTAL GOVERNANCE AS A TRADE FACILITATION STRATEGY? Kathryn A. Boys a Jason H. Grant b a Dept. of Applied Economics & Statistics Clemson University Clemson, SC b Dept. of Agricultural & Applied Economics Virginia Polytechnic Institute and State University Blacksburg, VA PRELIMINARY RESULTS: PLEASE DO NOT QUOTE Selected Paper prepared for presentation at the Agricultural & Applied Economics Association 2010 AAEA, CAES, & WAEA Joint Annual Meeting, Denver, Colorado, July 25-27, 2010 Copyright © 2010 by Kathryn A. Boys and Jason H .Grant. All rights reserved. Readers may make verbatim copies of this document for non-commercial purposes by any means, provided that this copyright notice appears on all such copies.
-
Upload
phamnguyet -
Category
Documents
-
view
224 -
download
1
Transcript of ISO 14000 STANDARDS VOLUNTARY …ageconsearch.umn.edu/bitstream/61855/2/ISO 14000 Standards -...
1
ISO 14000 STANDARDS: VOLUNTARY ENVIRONMENTAL GOVERNANCE AS A TRADE
FACILITATION STRATEGY?
Kathryn A. Boysa
Jason H. Grantb
a Dept. of Applied Economics & Statistics
Clemson University
Clemson, SC
bDept. of Agricultural & Applied Economics
Virginia Polytechnic Institute and State University
Blacksburg, VA
PRELIMINARY RESULTS: PLEASE DO NOT QUOTE
Selected Paper prepared for presentation at the Agricultural & Applied Economics
Association 2010
AAEA, CAES, & WAEA Joint Annual Meeting, Denver, Colorado, July 25-27, 2010
Copyright © 2010 by Kathryn A. Boys and Jason H .Grant. All rights reserved. Readers may
make verbatim copies of this document for non-commercial purposes by any means,
provided that this copyright notice appears on all such copies.
2
INTRODUCTION
The continued increase in social and environmental consciousness, coupled with an increasingly
globalized marketplace, has fostered an increasingly important role for independent
environmental standards. Among the most widely recognized and internationally accepted of
such programs is the ISO 14000 environmental management standard (EMS).
The intent of ISO 14000 is not to address specific, environmental issues such as green building
(LEED), or green consumer product design and manufacture (Green Seal). Instead, its purpose
is to provide firms guidance as to how they can: ‘identify and control the environmental impact
of its activities, products or services’, systematically set and work toward environmental
objectives and targets, and continually improve their environmental performance (www.iso.org).
Companies that become ISO 14000 certified must develop, document and implement an
extensive list of internal operational procedures regarding issues such as: emergency
preparedness, industry/government regulations and agency approvals, training, contract control,
and monitoring and measurement. Through this process organizations become more efficient,
and are more capable of responding to the needs of their customers. Further, while certification
requires companies to be regularly reviewed by third-party auditors, current and potential
customers are provided assurance that their suppliers do adhere to their stated internal
procedures. Overall, it has been reported that ISO14000 can positively impact both the
performance of the environmental management system (EMS) as well as overall corporate
performance (Montabon et al., 2006). It is not surprising then, that many firms use ISO 14000 as
a minimum requirement of organizations with whom they are considering doing business. As of
3
December 2008, more than 188,000 companies in 155 countries were ISO 14000 certified (ISO
Survey, 2008).
The potential benefits of this program are numerous and include production gains through
reduced waste and more efficient use of energy and other inputs, and lower distribution costs. Of
less tangible benefit, adherence to this standard is thought by some to be an effective tool to
improve a corporation’s image as a socially and/or environmentally conscious organization
(Poksinska, 2003). Of particular value, this standard has been found to induce firms to
progressively and meaningfully reduce their pollution output and better comply with government
environmental regulations (Anton et al., 2004; Potoski and Prakash, 2005a, 2005b). Overall, it
has been reported that ISO14000 can positively impact both the performance of the
environmental management system (EMS) as well as overall corporate performance (Montabon
et al., 2006).
Despite these touted benefits, this program is not without critics. The ISO 14000 program
requires only that an EMS be implemented and continually improved upon, rather than
mandating a certain level of environmental performance. As such, it has been charged this
program can be used to ‘greenwash’ firms’ poor environmental performance (Steinzor, 1998;
King and Lenox, 2000). Also, critics often point to the ISO 14000 registration process as an
exercise in documentation and formalization (Curkovic et al., 2004) which has reduced the
commitment of certified firm employees to the program. Other challenges levied against the
value of this standard are similar to that directed toward other general and/or voluntary
standards. In particular, because ISO 9000 is both international and cross-industry in scope, its
4
potential benefits may be limited because the extent to which countries adhere to the demands of
this standard remains unclear. For these reasons it is unclear what, if any, trade facilitation
benefits are offered by ISO 14000 registration.
An extensive literature explores the impact of ISO 14000 standards on business operations. This
research has focused largely the varied motivations of firms in different countries and industries
of seeking ISO 14000 certification, and case-studies regarding the various benefits and costs
which may be derived from it. From a macro perspective, the few studies examining patterns of
adoption of ISO 14000 have reported that export dependence, environmental attitudes, ISO 9000
certification (Corbett and Kirsch, 2001), and the extent that trading partners have adopted this
program (Potoski and Prakash, 2004) are significant factors in the uptake of this standard.
Ex post empirical econometric analyses examining the impact ISO 14000 on trade flows
however, is surprisingly limited. Using trade-weighted ISO 14000 registration count data,
Potoski and Prakash (2006) explored the impact of ISO 14000 on bilateral trade flows. While
results of this analysis indicate that ISO standards can have a positive impact on trade, using this
approach it is unclear if the ISO variables are picking up industrial county effects, or improved
trade potential due to ISO 4000. In addition, the current research insufficiently controls for the
levels of trading partner’s environmental commitment, and the overlap in the adoption of this
EMS and other business management standards (i.e. ISO 9000). Finally, although it is
recognized that there is significant industry variance in the adoption of EMS programs, to date,
industry considerations have been altogether omitted from these analyses.
5
The objectives of this study are three-fold. First, using the case study of ISO 14000, this study
seeks to assess the trade facilitation impacts of international environmental management
standards (ISO 14000)–a non-governmental association–on participating and non-participating
members’ international trade flows. Secondly, this study examines the question of whether
countries who demonstrate a commitment to environmental protections trade more with other
countries who similarly value the use of these environmental standards. Finally this study will
attempt to quantify the market access effect of developing country exports to developed
countries when developing nations have a relatively high proportion of ISO 14000 certified
firms.
The remainder of this paper is organized as follows. Section two develops our empirical
strategy, while section three describes the data used in this analysis. Section four presents
descriptive statistics and formal econometric results, and in the final section we conclude.
2. METHODS AND DATA
The starting point of this analysis is the gravity equation applied to international trade flows:
h
ijk
jk
jk
ik
ik
ijhjkikkijkF
ISO
F
ISOZPRPRM lnlnlnlnln )1(
2121
where, Mijk is the value of bilateral imports from country i to country j in industry k, αk is a
comprehensive set of industry-level fixed effects, PRik (PRjk) is the value of sector k production
of country i (j), and Zij is a set of extraneous factors influencing trade including distance, tariff
rates and indicator variables for contiguous borders, common languages, landlocked countries,
6
island countries, free trade agreements, participation in the WTO and currency unions, and
participation in environmental treaties.
It is usual for studies examining the impact of standards on trade to use only a simple count
variable (e.g. the number of certified firms in country i or j) to estimate the trade flow effect of
certification. Yet count variables in this context are fundamentally flawed. Do the trade
increases reported in these studies reflect the fact that larger countries simply have more firms
and therefore more ISO 14000 certifications compared to smaller countries (i.e., an industrial
country effect)? Or is the count variable actually picking up improved trade potential due to ISO
14000? This is the fundamental problem with atheoretical count measures because it does not
take into account the proportion of ISO 14000 certified firms in the total number of firms in the
country.
In this study we address this common limitation by considering the number of ISO 14000
certified firms relative to the total number of firms in a given industry and country. As such, in
this baseline version of the model (Eqn 1), the coefficients of particular interest are λ1 and λ2
which measure the trade flow impact of an change in the sector-specific proportion of ISO 14000
certified firms in country i or j (ISO14ik/Fik and ISO14jk/Fjk).
Alternative specifications of equation (1) are used to assess the second and third objectives. The
second objective examines whether those with a commitment to voluntary environmental
standards trade more with others who similarly subscribe to such programs. This potential
preference by assessed by examining whether nations (industries) with above average adoption
7
of ISO 14000, prefer to import from those who also demonstrate above average certification
rates.1 Finally, through the third objective, the question of whether adherence to voluntary
environmental standards offers any market access benefit for developing country exporters. This
is assessed by incorporating additional dummy variables to indicate the development status of
the exporter and importer and a series of interaction terms with ISO14ik/Fi and ISO14jk/Fj to test
for market access effects of developing country exports to developed countries (and other
combinations). Alternative specifications will also examine interactions between proportion of
ISO 14000 and ISO 9000 certified firms.
Data
This analysis makes use of data drawn from a number of sources. Bilateral trade flows and are
derived as described by Nicita and Olarreaga (2007) and the extended version of this dataset
made available by the Centre d’Etudes Prospectives et’Informations Internationales (CEPII).
Trade. Bilateral trade flows are derived from the United Nations Commodity Trade Statistics
Database (COMTRADE). Real GDP data (in US dollars) are obtained from two primary sources:
the World Bank (WB) Development Indicators database; and the United Nations (UN) National
Accounts database. GDP data from the International Monetary Fund’s (IMF) Financial Statistics
Yearbook are used to supplement WB and UN data when it is missing or incomplete
Distance, contiguity, common language, island status and landlocked country indicators are
taken from CEPII’s geo-distance dataset (Mayer and Zignago 2006). CEPII uses the great circle
formula to calculate the geographic distance between countries, referenced by latitudes and
1 Specifically, do those with above average ISO 14000 certification ratios (ISO14ik/Fik ) tend to trade more
with exporters who also have above average certification ratios (ISO14jk/Fjk ).
8
longitudes of the largest urban agglomerations in terms of population. We also document whether
trading partners are members of one or more of the same Regional Trade Agreements (RTAs).
To assess the impact of ISO certification on trade, this study makes use of the ISO Survey of
Certifications which provides measures of the number of ISO 14000 certified firms by industry
and country. The ISO Survey is an annual survey sponsored by the ISO Central Secretariat
(ISO/CS) of the certification bodies accredited by the International Accreditation Forum (IAF).
These surveys have been done since 1993 and through this source the aggregate annual (count)
data of the number of ISO certifications in each country are available since this time. In more
recent years, releases of the results of this survey have also been disaggregated by industry. It is
the 2005 release of these results which is used in this analysis (ISO, 2005). This count data is
combined with information regarding the number of establishments or enterprises in a given
country, industry and year (Nicita and Olarreaga, 2007) to generate the ratio of ISO certified
firms.
At the industry level, information regarding the number of ISO certifications classified according
to the European Accreditation of Certification (EA) Code. Indicator and trade flow variables,
however are aggregated at the industry level using ISIC (Rev. 2). Although, in broad terms,
these classification systems are similar in their level of disaggregation, their concordance across
industries is imperfect.2 As such, for this analysis it was required that a new industry a new
classification system be developed. This new industry classification system, and the mapping of
2 By way of example, in some instances several EA classified industries (e.g. ‘shipbuilding’, ‘other transportation
equipment’) map to one ISIC (rev. 2) sector (e.g. Transport equipment). For other industries, multiple ISIC sectors
map into one EA sector.
9
these industries to those used to disaggregate the ISO certification count data (EA Codes) and the
trade flow and indicator variables (ISIC rev. 2) is presented in Table 1. The completed cross-
sectional dataset includes 243,000 observations reflecting trade flows between 221 importers and
73 exporters in 2005.
3. RESULTS
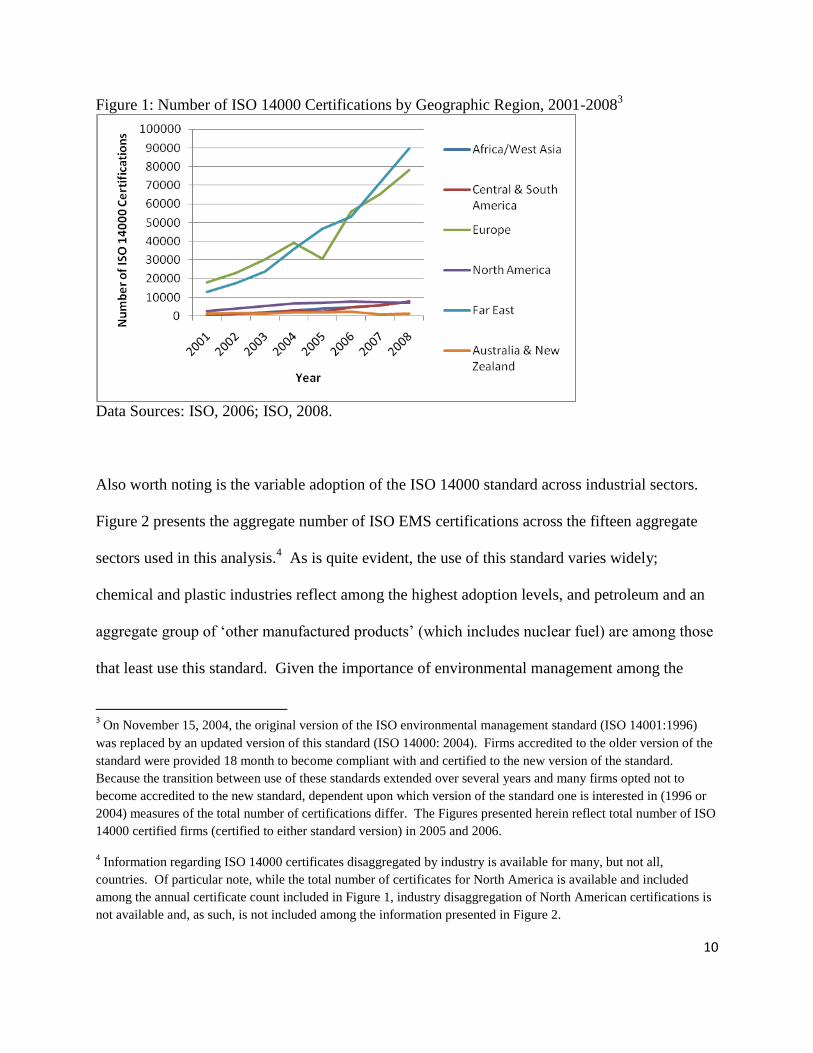
Adoption of the ISO 14000 standard has varied significantly across time and across industrial
sectors. Figure 1 depicts the growth in the number of ISO 14000 certifications across major
geographic regions. From this Figure it is clear that the Far East and Europe are, far and away,
the largest adopters of this program. North America, Central & South America, Africa, and
Australia and New Zealand all have similar and a relatively low absolute number of firms that
are certified. Among this latter group, however, in recent years Central and South America has
seen a relative increase in the adoption of this standard.
10
Figure 1: Number of ISO 14000 Certifications by Geographic Region, 2001-20083
Data Sources: ISO, 2006; ISO, 2008.
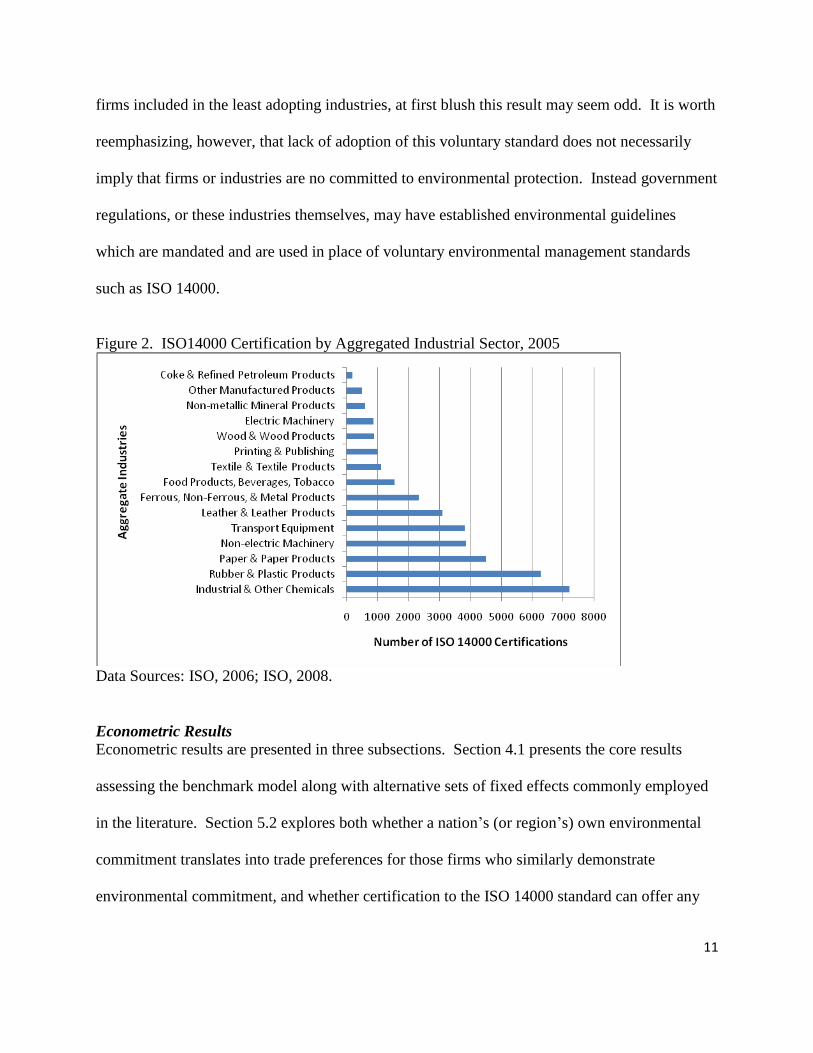
Also worth noting is the variable adoption of the ISO 14000 standard across industrial sectors.
Figure 2 presents the aggregate number of ISO EMS certifications across the fifteen aggregate
sectors used in this analysis.4 As is quite evident, the use of this standard varies widely;
chemical and plastic industries reflect among the highest adoption levels, and petroleum and an
aggregate group of ‘other manufactured products’ (which includes nuclear fuel) are among those
that least use this standard. Given the importance of environmental management among the
3 On November 15, 2004, the original version of the ISO environmental management standard (ISO 14001:1996)
was replaced by an updated version of this standard (ISO 14000: 2004). Firms accredited to the older version of the
standard were provided 18 month to become compliant with and certified to the new version of the standard.
Because the transition between use of these standards extended over several years and many firms opted not to
become accredited to the new standard, dependent upon which version of the standard one is interested in (1996 or
2004) measures of the total number of certifications differ. The Figures presented herein reflect total number of ISO
14000 certified firms (certified to either standard version) in 2005 and 2006.
4 Information regarding ISO 14000 certificates disaggregated by industry is available for many, but not all,
countries. Of particular note, while the total number of certificates for North America is available and included
among the annual certificate count included in Figure 1, industry disaggregation of North American certifications is
not available and, as such, is not included among the information presented in Figure 2.
11
firms included in the least adopting industries, at first blush this result may seem odd. It is worth
reemphasizing, however, that lack of adoption of this voluntary standard does not necessarily
imply that firms or industries are no committed to environmental protection. Instead government
regulations, or these industries themselves, may have established environmental guidelines
which are mandated and are used in place of voluntary environmental management standards
such as ISO 14000.
Figure 2. ISO14000 Certification by Aggregated Industrial Sector, 2005
Data Sources: ISO, 2006; ISO, 2008.
Econometric Results
Econometric results are presented in three subsections. Section 4.1 presents the core results
assessing the benchmark model along with alternative sets of fixed effects commonly employed
in the literature. Section 5.2 explores both whether a nation’s (or region’s) own environmental
commitment translates into trade preferences for those firms who similarly demonstrate
environmental commitment, and whether certification to the ISO 14000 standard can offer any
12
developed country market access benefit to firms in developing and least developed nations. All
regressions are based on a cross-section of trade flow and ISO information from 2004.
Section 5.1
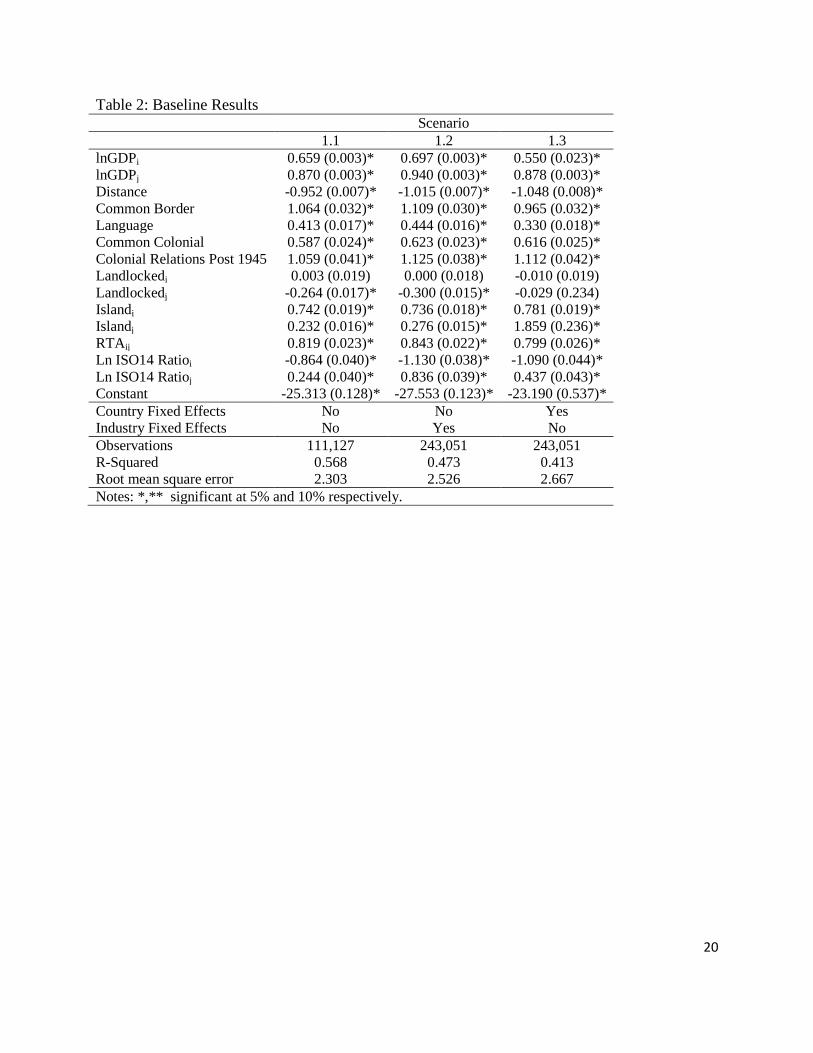
Table 2 present the baseline results of this analysis. In Scenario 1 the standard gravity model is
combined with the two ISO 14000 variables of interest. In this, and all other regressions
presented in both this and subsequent Tables, the standard gravity equation coefficients are
economically plausible, statistically significant, and of the correct sign. As anticipated, the
economic size (GDP) of both importers and exporters is consistently positive, and distance
(Distance) has the typical negative coefficient close to unity. Sharing a boarder (Common
Border), speaking a common language (Language), colonial relationships, and regional trade
agreements all stimulate trade. National which are landlocked (Landlocked) tend to trade less,
and island countries (Island) trade more.
The impact of ISO 14000 certification for importers and exporters are reflected by Ln ISO14
Ratioi and Ln ISO14 Ratioj respectively. In each regression in Scenario 1, the impact of
certification to this environmental standard was found to be statistically significant for both
importers and exporters. In the case of exporters, the effect was positive – higher ratios of
ISO14000 certified firms in an industry resulted in a 27.6% increase in trade relative to instances
where firms were not certified to this standard5. With regard to importers, however, the ISO
14000 certification ratio was found to be negatively correlated with increased trade. In this
5 This trade impact is calculated by transforming the coefficient on the ISO ratio variable (0.244) in the following
manner: (exp(0.244)-1)*100 = 27.6%.
13
instance, ISO certification was associated with a 57.8% decrease in trade. These results are
robust in sign and larger in magnitude across scenarios which included industry fixed effects
(Scenario 1.2) and country fixed effects (Scenario 1.3).
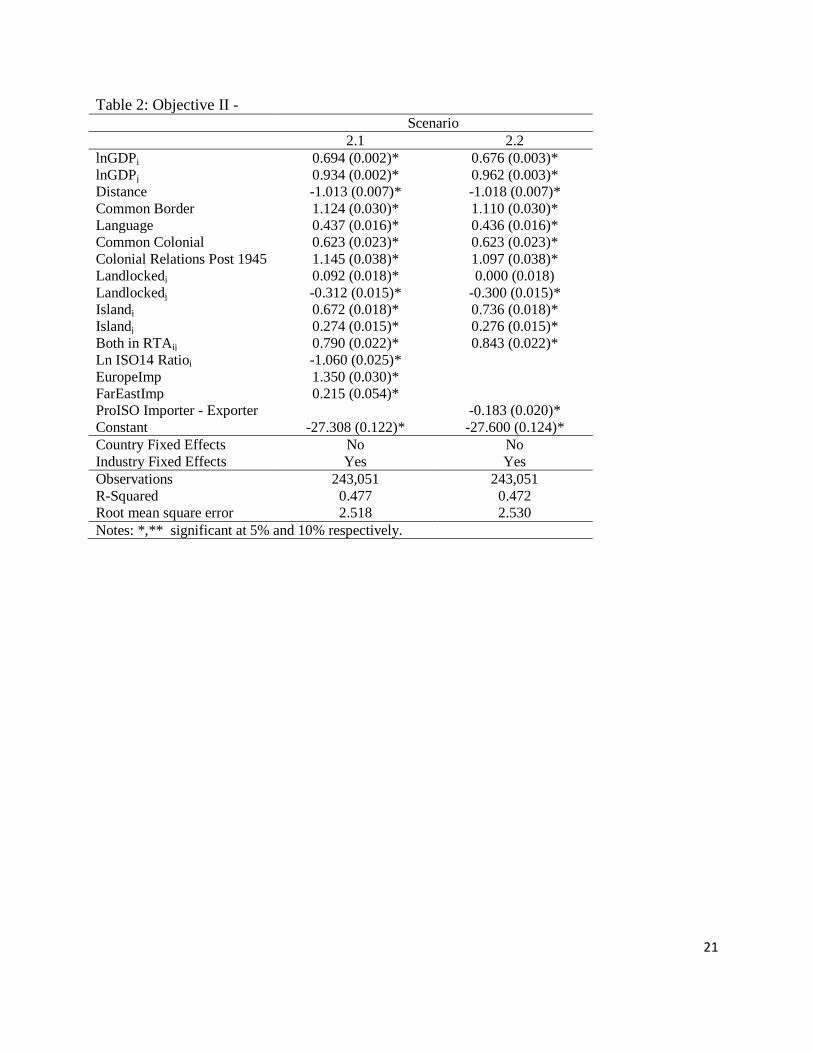
Section 5.2
Analyses in Table 3 future explore the question of whether or not importers who make relatively
extensive use the ISO 14000 standard, preferentially import from industries who also make more
extensive use of this standard. Results of this analysis are striking. Scenario 2.2 specifically
examines imports by European and FarEast countries (EuropImp and FarEastImp respectively).
Results suggest that ISO 14000 certification is significant and large facilitator of trade to both of
these regions: in the case of Europe, certification is correlated to a remarkable increase of 285%
in trade, while for the FarEast, certification is correlated with a 24% trade increase. Importantly,
however, this positive effect does not extend to all ‘Pro ISO 14000’ importers. In examining the
case of all importers with greater than average industry levels of ISO certification trading with
exporters with the same characteristic trade actually decreased by 17% (Scenario 2.2) as
compared to trade between countries where one or both partners were not ‘Pro ISO 14000’.
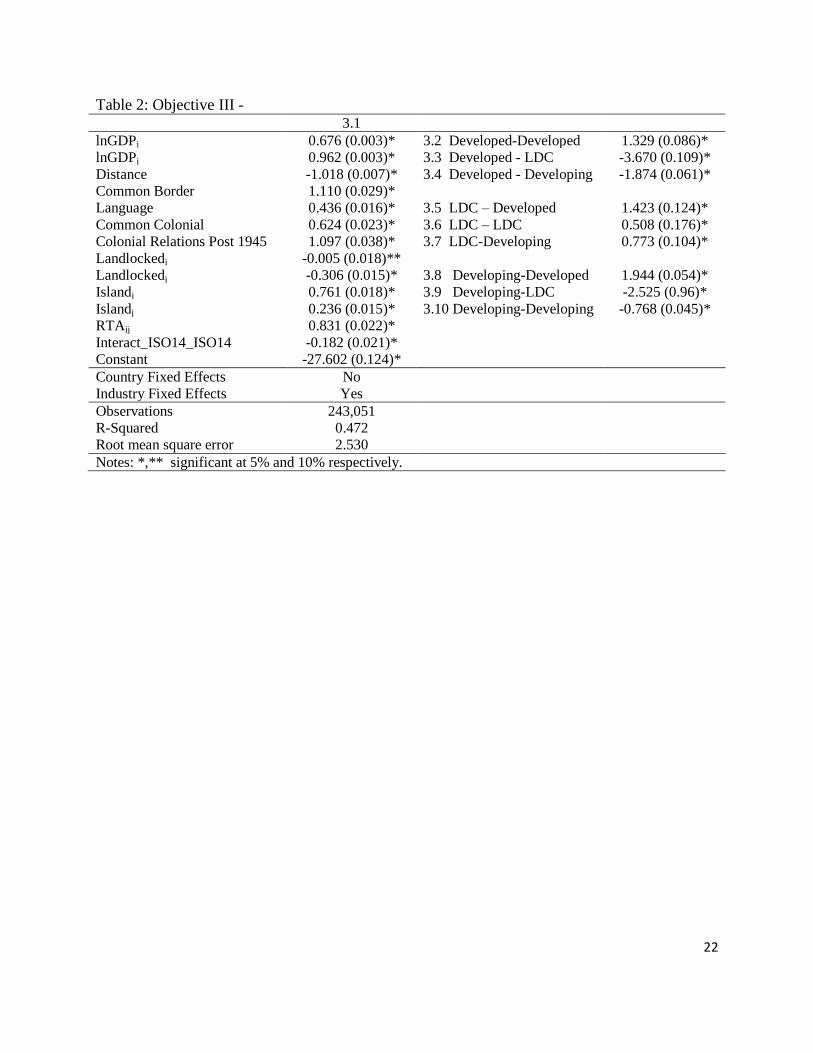
A variable effect of ISO 14000 on trade between countries of various economic development
status is examined. In Table 3 results of trade between partners who are both ISO certified is
assessed. Unlike in Scenario 2.2 in which the regression was restricted to examining only those
who had greater than average industry levels of certification, here all rates of certification are
examined.

14
In Scenario 3.1, results are similar to those observed in the case of trade between those who have
above average rates of ISO certification (Scenario 2.2); here again, increased levels of ISO
14000 certification lead to a 17% decrease in trade. Differences, however, are observed when
this relationship is disaggregated by importer and exporter development status. When both
trading partners are Developed, increased rates of certification by both trading partners can
contribute to a notable increase in trade (Scenario 3.2). This trade facilitation benefit, however,
does not extend to developing countries or LDCs who wish to export to developed nations
(Scenarios 3.3-3.4). Similarly, in seeking to export to developing countries, ISO 14000
certification offers an advantage only to developed countries (Scenario 3.8); here again
certification does not appear to improve market access for other developing countries or for
LDCs to developing country markets (Scenario 3.9-3.10). Only in the case of improving trade
with LDCs does this standard appear to offer a trade advantage.
CONCLUSIONS
Given that importers who make use of this standard to not, in general, appear to preferentially
select trading partners who also make relatively high use of this standard (Scenario 1.3, 2.2),
upon first blush, the finding that standard is correlated with a notable trade increase for exporters
(Scenarios 1.1-1.3) is rather curious. It is possible that rather than the standard itself offering
exporters a trade benefit, that certification to this standard indicates something about the firms
which, instead, is conducive to trade facilitation. For example good internal reporting and
responsive communication channels are required both by this standard and are necessary for
effective international supplier-purchaser relationships. These types of characteristics may,
instead be what is inducing the positive ISO 14000 trade response.
15
In examining the use of other ISO standards (i.e. ISO 9000), those with a higher use of this
standard tend to trade more with those who themselves have a higher relative use of that same
standard (Boys and Grant, 2009). This result is also supported on the firm level where several
studies have found that companies adhering to a voluntary standard often prefer suppliers who
themselves adhere to the same standard. As such, it may be that certification to another standard,
or joint membership in another, similar program may be responsible for this result. These issues
will be further examined in future iterations of this research.
16
REFERENCES
Blind, K. 2001. The impact of Innovation and Standards on Trade of Measurement and Testing
Products: E
Blind, K. and A. Jungmittag. 2005. Trade and the impact of innovations and standards: the case
of Germany and the UK. Applied Economics. 37: 1382-1398.
Corbett, C. and D. Kirsch. 2001. International Diffusion of ISO 14000 Certification.
Production and Operations Management. 10(3): 327-342.
Clougherty, J.A. and M. Grajek. 2009. ISO 9000: New Form of Protectionism or Common
Language in International Trade. ESMT Research Working Papers No. ESMT-09-006.
CEPII. n. d. Databases and Models. Distances. Retrieved March 22, 2009, from:
http://www.cepii.fr/anglaisgraph/bdd/distances.htm
Grajek, M. 2004. Diffusion of ISO 9000 Standards and International Trade. CIG Working
Ppaers SP II 2004-16, Wissenschaftszentrum Berlin (WZB), Research Unit: Competition and
Innovation (CIG).
ISO, 2006. The ISO Survey of Certifications - 2005. ISO Central Secretariat, Genève,
Switzerland.
ISO, 2008. The ISO Survey of Certifications - 2007. ISO Central Secretariat, Genève,
Switzerland.
Moenius, J. 2004. Information Versus Product Adaptation: The Role of Standards in Trade.
Available at SSRN: http://ssrn.com/abstract=608022
Potoski, M. and A. Prakash. 2008. Signaling Quality and Increasing Trade? Examining the
Impact of ISO 9000 Quality Management Systems on Bilateral Trade, 1994-2002. Paper
presented at the annual meeting of the ISA's 49th
Annual Convention, Bridgin Multiple Divides,
Hilton San Francisco, San Francisco, CA, USA
Swann, P., P. Temple, and M. Shurmer. 2006. Standards and trade performance: the UK
experience. Economic Journal. 106: 1297-313.
King, Andrew and Michael Lenox. 2000. Industry Self-Regulation without sanctions: The
Chemical Industry’s Responsible Care Program. Academy of Management Journal 43(August):
698-716.
Poksinska, B., J. Dahlgaard, J. Eklund. 2003. Implementing ISO 14000 in Sweden: Motives,
Benefits and Comparisons with ISO 9000. International Journal of Quality & Reliability
Management. 585-606.
17
Potoski, Matthew and Aseem Prakash. 2005a. Covenents with Weak Swords: ISO 14000 and
Firms’ Enviornmental Permeance. Journal of Policy Analysis and Management.
Potoski, Matthew and Aseem Prakash. 2005b. Green Clubs and Voluntary Governance: ISO
14001 and Firms’ Regulatory Compliance. American Journal of Political Science. 49(2): 235-
48.
Potoski, M. and A. Prakash. 2004. Regulatory Convergence in Nongovernmental Regimes?
Cross-National Adoption of ISO 14001 Certifications. The Journal of Politics. 66(3): 885-905.
Prakash, A. and M. Potoski. 2006. Racing to the Bottom? Trade, Environmental Governance,
and ISO 14001. American Journal of Political Science. 50(2): 350-364.


19
Table 1: Concordance of Industry Sectors Industry
Code ISIC Rev. 2 Code EA Code
1 Food products, beverages, tobacco
311 Food products
3 Food products, beverages and tobacco 313 Beverages
314 Tobacco
2 Textiles and textile products 321 Textiles
4 Textiles and textile products 322 Wearing apparel, except footwear
3 Leather and leather products (incl.
footwear)
323 Leather products 5 Leather and leather products
324 Footwear, except rubber or plastic
4 Wood and wood products (incl. furniture) 331 Wood products, except furniture
6 Wood and wood products 332 Furniture, except metal
5 Paper and paper products 341 Paper and products 7 Pulp, paper and paper products
6 Printing and publishing 342 Printing and publishing 8 Publishing companies
9 Printing companies
7 Industrial and other chemicals 351 Industrial chemicals 12 Chemicals, chemical products & fibers
352 Other chemicals 13 Pharmaceuticals
8 Manufacture of coke & refined petroleum
products
353 Petroleum refineries
10 Manufacture of coke & refined petroleum
products 354 Miscellaneous petroleum and coal
products
9 Rubber and plastic products 355 Rubber products
14 Rubber and plastic products 356 Plastic products
10 Non-metallic mineral products (incl. glass,
construction materials)
361 Pottery, china, earthenware 15 Non-metallic mineral products
362 Glass and products 16 Concrete, cement, lime, plaster etc.
369 Other non-metallic mineral products
11 Ferrous, non-ferrous, and metal products
371 Iron and steel
17 Basic metal & fabricated metal products 372 Non-ferrous metals
381 Fabricated metal products
12 Non-electric machinery 382 Machinery, except electrical 18 Machinery and equipment
13 Electric machinery (incl. professional
equipment)
383 Machinery, electric 19 Electrical and optical equipment
385 Professional and scientific equipment
14 Transport equipment 384 Transport equipment
20 Shipbuilding
21 Aerospace
22 Other transport equipment
15 Other manufactured products (incl. nuclear
fuel) 390 Other manufactured products
23 Manufacturing not elsewhere classified
11 Nuclear fuel
20
Table 2: Baseline Results Scenario
1.1 1.2 1.3
lnGDPi 0.659 (0.003)* 0.697 (0.003)* 0.550 (0.023)*
lnGDPj 0.870 (0.003)* 0.940 (0.003)* 0.878 (0.003)*
Distance -0.952 (0.007)* -1.015 (0.007)* -1.048 (0.008)*
Common Border 1.064 (0.032)* 1.109 (0.030)* 0.965 (0.032)*
Language 0.413 (0.017)* 0.444 (0.016)* 0.330 (0.018)*
Common Colonial 0.587 (0.024)* 0.623 (0.023)* 0.616 (0.025)*
Colonial Relations Post 1945 1.059 (0.041)* 1.125 (0.038)* 1.112 (0.042)*
Landlockedi 0.003 (0.019) 0.000 (0.018) -0.010 (0.019)
Landlockedj -0.264 (0.017)* -0.300 (0.015)* -0.029 (0.234)
Islandi 0.742 (0.019)* 0.736 (0.018)* 0.781 (0.019)*
Islandj 0.232 (0.016)* 0.276 (0.015)* 1.859 (0.236)*
RTAij 0.819 (0.023)* 0.843 (0.022)* 0.799 (0.026)*
Ln ISO14 Ratioi -0.864 (0.040)* -1.130 (0.038)* -1.090 (0.044)*
Ln ISO14 Ratioj 0.244 (0.040)* 0.836 (0.039)* 0.437 (0.043)*
Constant -25.313 (0.128)* -27.553 (0.123)* -23.190 (0.537)*
Country Fixed Effects No No Yes
Industry Fixed Effects No Yes No
Observations 111,127 243,051 243,051
R-Squared 0.568 0.473 0.413
Root mean square error 2.303 2.526 2.667
Notes: *,** significant at 5% and 10% respectively.
21
Table 2: Objective II - Scenario
2.1 2.2
lnGDPi 0.694 (0.002)* 0.676 (0.003)*
lnGDPj 0.934 (0.002)* 0.962 (0.003)*
Distance -1.013 (0.007)* -1.018 (0.007)*
Common Border 1.124 (0.030)* 1.110 (0.030)*
Language 0.437 (0.016)* 0.436 (0.016)*
Common Colonial 0.623 (0.023)* 0.623 (0.023)*
Colonial Relations Post 1945 1.145 (0.038)* 1.097 (0.038)*
Landlockedi 0.092 (0.018)* 0.000 (0.018)
Landlockedj -0.312 (0.015)* -0.300 (0.015)*
Islandi 0.672 (0.018)* 0.736 (0.018)*
Islandj 0.274 (0.015)* 0.276 (0.015)*
Both in RTAij 0.790 (0.022)* 0.843 (0.022)*
Ln ISO14 Ratioi -1.060 (0.025)*
EuropeImp 1.350 (0.030)*
FarEastImp 0.215 (0.054)*
ProISO Importer - Exporter -0.183 (0.020)*
Constant -27.308 (0.122)* -27.600 (0.124)*
Country Fixed Effects No No
Industry Fixed Effects Yes Yes
Observations 243,051 243,051
R-Squared 0.477 0.472
Root mean square error 2.518 2.530
Notes: *,** significant at 5% and 10% respectively.
22
Table 2: Objective III - 3.1
lnGDPi 0.676 (0.003)* 3.2 Developed-Developed 1.329 (0.086)*
lnGDPj 0.962 (0.003)* 3.3 Developed - LDC -3.670 (0.109)*
Distance -1.018 (0.007)* 3.4 Developed - Developing -1.874 (0.061)*
Common Border 1.110 (0.029)*
Language 0.436 (0.016)* 3.5 LDC – Developed 1.423 (0.124)*
Common Colonial 0.624 (0.023)* 3.6 LDC – LDC 0.508 (0.176)*
Colonial Relations Post 1945 1.097 (0.038)* 3.7 LDC-Developing 0.773 (0.104)*
Landlockedi -0.005 (0.018)**
Landlockedj -0.306 (0.015)* 3.8 Developing-Developed 1.944 (0.054)*
Islandi 0.761 (0.018)* 3.9 Developing-LDC -2.525 (0.96)*
Islandj 0.236 (0.015)* 3.10 Developing-Developing -0.768 (0.045)*
RTAij 0.831 (0.022)*
Interact_ISO14_ISO14 -0.182 (0.021)*
Constant -27.602 (0.124)*
Country Fixed Effects No
Industry Fixed Effects Yes
Observations 243,051
R-Squared 0.472
Root mean square error 2.530
Notes: *,** significant at 5% and 10% respectively.