Islamic University-Gaza Faculty of Engineering Civil...
32
Islamic University-Gaza Faculty of Engineering Civil Engineering Department Design of Al-Forqan Water Network (Data submitted to fulfill Hydraulics Engineering (ECIV3322) project requirements) by: Rami M. Ziara Shehab B. Ahmed Ahmad N. Abu-Safieh May 2011
Transcript of Islamic University-Gaza Faculty of Engineering Civil...

Islamic University-Gaza
Faculty of Engineering
Civil Engineering Department
Design of Al-Forqan Water Network
(Data submitted to fulfill Hydraulics Engineering (ECIV3322) project requirements)
by:
Rami M. Ziara
Shehab B. Ahmed
Ahmad N. Abu-Safieh
May 2011
1
Contents 1 Introduction .................................................................................................................................... 3
1.1 Advantages of PVC Pipes: ....................................................................................................... 3
1.2 The effect of engineering development on the water networks............................................ 3
1.3 Background on the development of water networks in Gaza Strip: ...................................... 4
2 Water resources in the Gaza-Strip .................................................................................................. 4
2.1 Water resources and Quantities in the Gaza Strip: ................................................................ 4
2.1.1 Groundwater Aquifer: ..................................................................................................... 5
2.2 Groundwater Quantity: ........................................................................................................... 6
2.3 Problems of water resources in Gaza strip: ............................................................................ 7
2.3.1 Future Water Consumption: ........................................................................................... 8
3 Groundwater Quality: ..................................................................................................................... 8
4 Water Distribution Systems in Gaza-Strip..................................................................................... 10
4.1 Water distribution systems ................................................................................................... 10
4.1.1 Types of water distribution systems ............................................................................. 10
4.1.2 Direct and indirect distribution systems advantages and disadvantages: ................... 11
4.2 Water supply means ............................................................................................................. 11
4.2.1 Advantages and disadvantages of gravity and pumps .................................................. 12
4.3 Water Supply systems ........................................................................................................... 12
4.3.1 Water supply systems types ......................................................................................... 12
4.3.2 Advantages and disadvantages of the supply system types ......................................... 12
5 Design of water distribution systems ........................................................................................... 13
5.1 Stages of design .................................................................................................................... 13
5.1.1 Preliminary Studies ....................................................................................................... 13
5.1.2 Network Layout ............................................................................................................. 13
5.1.3 Hydraulic Analysis ......................................................................................................... 14
6 Basis of Design: ............................................................................................................................. 14
6.1 Flow Rates Projections .......................................................................................................... 14
7 Design Standards of Water Networks ........................................................................................... 15
7.1 Water Distribution: ............................................................................................................... 15
7.1.1 Distribution System Design: .......................................................................................... 15
7.2 Design Checks ....................................................................................................................... 16
7.2.1 Head loss ....................................................................................................................... 16
7.2.2 Friction Loss .................................................................................................................. 17
7.2.3 Appurtenance Energy Losses: ....................................................................................... 18
7.3 Sizing of Pipes........................................................................................................................ 18
7.3.1 Design flows: ................................................................................................................. 18
7.3.2 Design Velocity: ............................................................................................................. 19
8 Study of the current and future situation of the studied area: .................................................... 19
9 Consumption calculations: ............................................................................................................ 20
9.1 Residential Areas: ................................................................................................................. 20
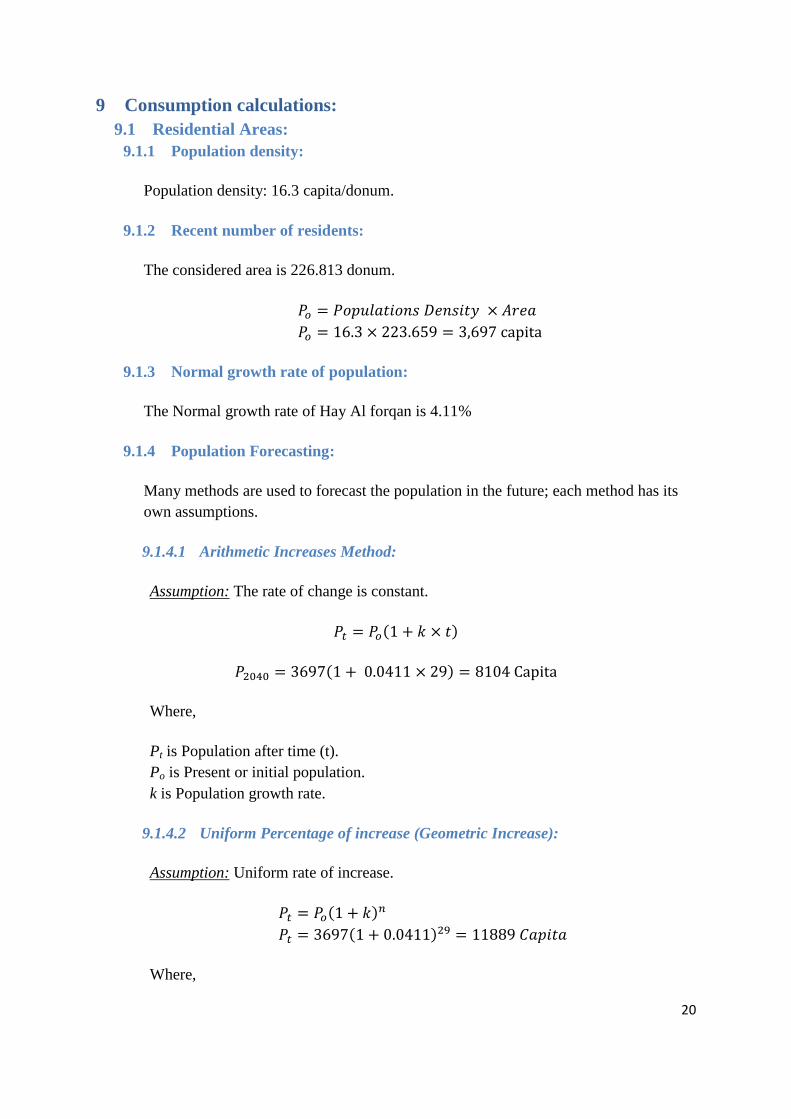
9.1.1 Population density: ........................................................................................................ 20
9.1.2 Recent number of residents: .......................................................................................... 20
9.1.3 Normal growth rate of population: ................................................................................ 20

2
9.1.4 Population Forecasting: ................................................................................................. 20
9.1.5 Population saturation: ................................................................................................... 21
9.1.6 Domestic Demand: ........................................................................................................ 22
9.2 Other types of consumption: ................................................................................................. 23
9.2.1 Residential water: .......................................................................................................... 23
9.2.2 Industrial or commercial water: .................................................................................... 23
9.2.3 Public water: ................................................................................................................. 23
9.2.4 Lost Water: .................................................................................................................... 23
10 Factors affecting the quantity of the required water: ................................................................ 24
11 Projection of nodes on maps: .................................................................................................... 24
12 Calculation Qdemostic for each junction: ...................................................................................... 25
13 Calculation Qschool and Qmosque for each junction: ...................................................................... 26
14 Tabulate the consumption table: .............................................................................................. 26
15 Analysis the water network using WaterCAD: .......................................................................... 29
16 References: ............................................................................................................................... 30
3
1 Introduction As we know, water is one of the most important things in our life. Nothing can live without water. So
people, from long time ago, search for water resources and live near it. People use water in drinking,
cooking, washing and agriculture.
But freshwater resources are not distributed in an equal way over the land and with the high growth
rates of population, that make people thinking about some methods to transfer water from the
water resources to other places where they live using water networks.
Initially, people depend on using the traditional ways and tools to transfer water to their homes and
lands. Traditional methods for transfer water, such as drilling wells and channels are not expensive.
But at the same time it doesn't achieve the minimum acceptable values for health and safety factors.
With the large progress in the science and engineering techniques, scientists and engineers try to
develop the water networks and design it depending on physical, chemical and engineering basis to
achieve the required goals effectively.
Recently, we start to use water pipes to transfer water. Water pipes may be made from concrete,
plastic, copper, steel or polyvinyl chloride (PVC/UPVC) according to the purpose from it.
1.1 Advantages of PVC Pipes:
1- PVC due to non-corrosive in nature and unaffected by chemicals, electrolytic and ironic corrosion can stay for very long time than other pipes which impart it with high corrosion resistance.
2- PVC pipes have a smoother bore than all other pipes (AC, CI, GI pipes) thereby the flow rate in PVC pipes is more than 30 per cent higher than the rest of pipes.
3- PVC pipes are perfect for transporting potable drinking water as they do not subject to contamination as they are completely odorless and hygienic.
4- PVC pipes require no maintenance such as painting and coating …etc. 5- PVC pipes are having a high chemical resistance therefore they can resist to all kinds of acids,
alkalis, oxidizing agents, oils and domestic effluents. 6- Resistant to rusting, chemical reactions and free from scale formation hence PVC pipes lasts
for life time. 7- PVC pipes are the most cost effective as they are cheap than all other kinds of pipes which
make them most economical and light in weight to carry.
1.2 The effect of engineering development on the water networks
The new water networks make a big difference in the quality and quantity of transferred water which we use. Here a list of some benefits of water networks:
1- By using water networks, people can live in new places far away from the water resources and that consistent with the high growth rates of population. By other words, we can live in the place which we want.
2- Water networks work to achieve an organized distribution of water on different regions. 3- People can get water from water networks easier and faster than the case without water
networks.
4
4- Use of modern techniques in the design of water networks contributes in conservation of water quantities which may be lost during transportation and thus we can benefit from the largest possible amount of water.
5- New materials of water pipes make the transportation of water from place to other more safe, healthy and effective.
1.3 Background on the development of water networks in Gaza Strip:
Water networks in the Gaza Strip are gradually developed over the years. This development started with drilling wells and channels in the past to the new water networks nowadays. Water networks become more effective and reach most areas in the Gaza Strip. But still far away from the modern techniques and classification and need a lot of work and maintenance in order to continue in service. Israeli occupation has always been intended to destroy the infrastructure (including water networks) in Gaza Strip and with the lack of water quantities in Gaza Strip, that make a fatal problems which faced the development of water networks and make the most focus in how to repair the networks and make it useable not on developing it. Palestinian National Authority and in cooperation with community organizations worked on the development of infrastructure including water systems through the formation of many governmental or public institutions such as the Palestinian Water Authority, Coastal Municipalities Water Utility (CMWU) and Palestinian Hydrology Group (PHG). And also by providing the required financial support for water networks projects.
2 Water resources in the Gaza-Strip
2.1 Water resources and Quantities in the Gaza Strip:
Gaza Strip is one of the semi-arid area where rainfall is falling in the winter season from September to April, the rate of rainfall is varying in the Gaza Strip and ranges between 200mm/year in the south to about 400mm/year in the north, while the long term average rainfall rate in all over the Gaza Strip is about 317mm/year.
Groundwater aquifer is considered the main and only water supply source for all kind of human usage in the Gaza Strip (domestic, agricultural and industrial). This source has been faced a deterioration in both quality and quantity for many reasons, e.g. low rainfall, increased in the urban areas which led to a decrease in the recharge quantity of the aquifer, also increasing the population will depleting the groundwater aquifer and led to seawater intrusion in some areas as a result in pressure differences between the groundwater elevation and sea water level.
Gaza Strip is one of the highest population intensity in the world where the population has reached
more than 1.6 Million inhabitants (PCBS) living within 365 Km2, and it is expected to reach 2.97
Million inhabitants by year 2025.
Considering the amount of rainfall quantity is about 110MCM/year, where part of that is feeding the
groundwater aquifer through natural recharging process. The recharge rate is varying in accordance
to the soil porosity and the thickness of the unsaturated zone that overlaying the groundwater
aquifer. Previous studies showed that the recharge rate is about 25% in the low porous area like the
eastern part of the Gaza Strip, and about 75% in porous area where the sand dunes are still found in

5
the north and south of the Gaza Strip. Also the rainfall intensity plays an important role in the
recharge quantity to the aquifer. The long term average recharge is considered to be 40% of the
whole rainfall quantity (PWA, 2005). In other words the recharge amount from rainfall to the
groundwater aquifer is about 45MCM/Year.
2.1.1 Groundwater Aquifer:
As stated before the main and only source of water in the Gaza Strip is the Groundwater aquifer. While the groundwater underneath the Gaza Strip is limited to the Gaza Strip area, while the coastal aquifer is extended from Haifa in the north to Sinai desert in the south, Hebron Mountain in the east and the Mediterranean Sea in the west and as a result of Israeli occupation practices, the groundwater underneath the Gaza Strip becomes limited due to construction of trapped wells along the eastern part of the Gaza Strip to catch the natural flow from east to west, also building dams along the wadi Gaza to collect the rainwater flow in the wadi and recharge it outside the Gaza Strip for Israeli usages.
The thickness of the saturated groundwater aquifer underneath the Gaza Strip ranges from few meters in the eastern and south east of the Gaza Strip to about 120- 150m in the west and along the Mediterranean Sea. The aquifer is mainly composed of unconsolidated sand stone known as Kurkar formation, which overlaying the impermissible layer called Saqiya formation which is considered as the bottom of the Gaza Coastal Aquifer with thickness varies from 800-1000m.
Schematic Drawing for the Gaza Aquifer Hydro-Geologic Cross Section – East to West
The thickness of the unsaturated aquifer which is the overlaying part of the saturated groundwater aquifer ranges from 70–80m in the eastern and south-eastern part of the Gaza Strip to about few meters in the western and along the coast.

6
2.2 Groundwater Quantity:
The available groundwater quantity could be identified if the saturated aquifer reservoir thickness is known in addition to the hydrological parameters of the aquifer such as effective porosity. The area of the groundwater reservoir is limited to the area of the political border of the Gaza Strip. The area where the groundwater quantity less than 250mg/L is about 44.8Km2, and with an effective porosity of 20%, also with a saturated groundwater ranging from 10 to 50m, hence the stored fresh groundwater quantity is ranging from 100MCM to 450MCM. In previous studies in year 2000, the same calculation has been performed where the groundwater quantity was ranging from 450MCM to 600MCM, which led to a depletion of about 250MCM from freshwater since year 2000. The following table represents the groundwater abstraction quantity in year 2007 for different usage, where it is observed that the domestic and industrial usage were about 83MCM.
Usage Governorate Area Abstracted
Groundwater Quantity (MCM)
Total
Domestic and Industrial Usage
North 22,017,871
83,483,091
Gaza 29,921,704
Middle 10,715,483
Khan Younis 14,323,750
Rafah 6,504,283
Agricultural Usage
Gaza Strip 80,000,000 (1) 80,000,000
Total Abstracted Quantities – Year 2007 163,483,091 MCM
(1) Source: PWA report in May 2006
7
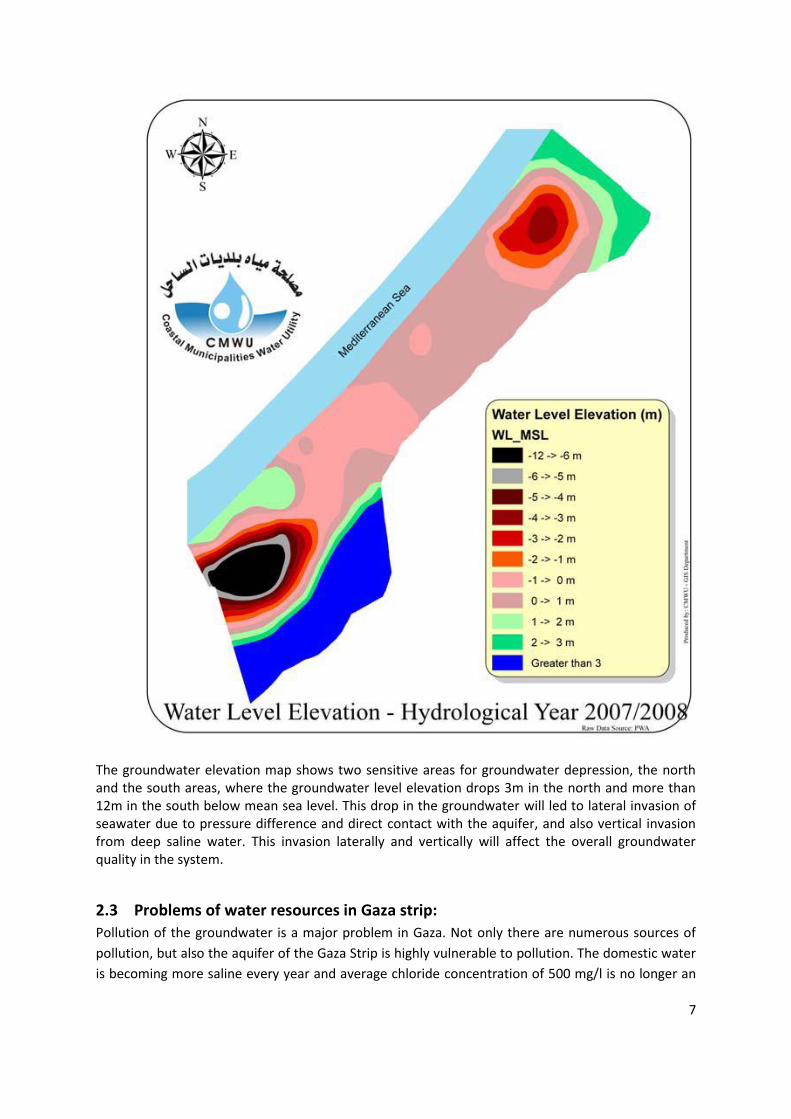
The groundwater elevation map shows two sensitive areas for groundwater depression, the north and the south areas, where the groundwater level elevation drops 3m in the north and more than 12m in the south below mean sea level. This drop in the groundwater will led to lateral invasion of seawater due to pressure difference and direct contact with the aquifer, and also vertical invasion from deep saline water. This invasion laterally and vertically will affect the overall groundwater quality in the system.
2.3 Problems of water resources in Gaza strip:
Pollution of the groundwater is a major problem in Gaza. Not only there are numerous sources of
pollution, but also the aquifer of the Gaza Strip is highly vulnerable to pollution. The domestic water
is becoming more saline every year and average chloride concentration of 500 mg/l is no longer an

8
exception. The permissible limits for nitrate are exceeded by a factor of 8 times for a number of
public wells; most of the public water supply wells don't comply with the drinking water quality
standards.
The main causes of deterioration of ground water quality are:
Infiltration of untreated domestic and industrial wastewater.
Discharge of poorly operating wastewater treatment plants.
Infiltration of wastewater from cesspits.
Mismanagement and extensive use and disposal of pesticides and fertilisers.
Leakage from unprotected solid and hazardous waste dump sites.
Seawater intrusion into coastal aquifers due to over pumping.
Saline water upcoming due to over pumping.
Discharge of industrial waste and waste water generated by the Israeli settlers.
Increase the volume of the groundwater abstracted by the Israeli settlers, and by the Israeli
wells around the border of Gaza Strip.
Lack of wastewater infrastructure and treatment facilities in Gaza Strip.
2.3.1 Future Water Consumption:
In this section we will compute our future water demand based on three factors; • Projected population based on 3.5% growth rate. • Improving the regional and local water supply network to minimize the loss to 20% only. • Improving the water quota per person to reach 150L by year 2025. The following charts shows the future projected population in the Gaza Strip based on 3.5% growth as has been discussed in previous studies. The chart shows that the population will reach more than 2.8 Million inhabitants by year 2025. Based on the mentioned factors, the future water consumption will be more than 190MCM by year 2025. The groundwater storage with the following stresses suffering from deficits reaches more than 60MCM, what will be the case by year 2025 with needed water for drinking usage reaches more than 190MCM which is twice the water usage for drinking supply in the current situation.
3 Groundwater Quality: The groundwater quality is monitored through all municipal wells and some agricultural wells distributed all over the Gaza Strip. The agricultural monitoring wells are tested against chloride and nitrate ions twice a year by the MOA, while the municipal wells are monitored through all the cations and anion’s twice a year with the cooperation of both MOH and CMWU. The groundwater quality is varies from place to another and from depth to another.
The chloride ion concentration varies from less than 250mg/L in the sand dune areas as the northern and south-western area of the Gaza Strip to about more than 10,000mg/L where the seawater intrusion has occurred.

9
The source of the nitrate ion in the groundwater chemical components has resulted from different sources i.e. intensive use of agricultural pesticides beside the existence of septic tanks to dispose the domestic wastewater in the areas where there is no wastewater collection system. The nitrate ion concentration reaches a very high range in different areas of the Gaza Strip, while the WHO standard recommended nitrate concentration less than 50mg/L.

10
The observer of the chloride and nitrate maps will find that they are inversely related.
4 Water Distribution Systems in Gaza-Strip
4.1 Water distribution systems
4.1.1 Types of water distribution systems
Water can be transferred by canals, tunnels, or pipelines. In Gaza the water is only transferred by
pipelines as most of the supplied water is underground water.

11
Typical types of pipelines distribution systems:
1) Direct pumping system: at which the water is pumped directly from the well to the
distribution areas.
2) Indirect pumping system: at which the water is pumped to the reservoirs and then re-
injected again to the areas of distribution networks.
4.1.2 Direct and indirect distribution systems advantages and disadvantages:
In Gaza-Strip the indirect pumping system is preferred because of the following:
The process of pumping from the reservoir to the network gives more ease to control the
pressure and quantity of water to be pumped, especially when supplying the network from
more than one well, if the direct system used it’ll be difficult to control the quantities,
pressures and speeds of the supplied water.
If any problem occurs in any well of the wells feeding the area, there will be no shortfall in
the amount of the supplied water, as the other wells can feed that tank and so there’ll be no
problem. In the other hand if that happens in the direct system there would be a real
shortfall in the amount of water as the only supplying well is out of supply That mean that
we can collect water in the reservoir of several wells and that gives it a stockpile, while a
disruption of the wells that feed directly leads to water shortages in the region based on this
well.
We can mix the water coming from different water wells; the fresh and the saline. So we can
have a fair distribution of the quality of water. Vice versa, if the direct system used, we can’t
mix the water, and so, we may find small water networks of fresh water occurs adjacent to
another water network of saline water.
Another disadvantage direct system is that the water reaches with a high concentration of
chlorine to the areas near the well, because the chemicals pumped directly from the well
inside the water line feeders, and we find that the areas away from the well have lacked the
concentration required of chlorine sanitizer.
The comfort of the citizen as the existence of water in the direct system is longer relative to
the indirect system.
The maintenance rate is higher in the method of direct pumping.
Notes:
The only reason for which the direct system is preferred is its’ pump cost in terms of energy which is
low relative to the energy consumed in the indirect system.
The direct system shouldn’t be chosen or used except for irregular situations.
4.2 Water supply means
Water can be supplied in means of gravity, pumps or the combined system which include the gravity
and pressure of pumping. When gravity is used, the source of supply should be at a sufficient
elevation above the distribution area (consumers). In Gaza the pumped supply and the combined
system are used.
12
4.2.1 Advantages and disadvantages of gravity and pumps
Advantages of Gravity supply:
No energy costs.
Simple operation.
Low maintenance costs.
No sudden pressure changes.
Disadvantages of pumped supply:
Complicated operation and maintenance.
Dependent on reliable power supply.
Precautions have to be taken in order to enable permanent supply:
- Stock with spare parts.
- Alternative source of power supply
The pumped supply is used when:
The source of water is lower than the area to which we need to distribute water to
(consumers).
The source cannot maintain minimum pressure required.
4.3 Water Supply systems
4.3.1 Water supply systems types
Branching system (Tree).
Grid system (Looped).
Combined system
4.3.2 Advantages and disadvantages of the supply system types
4.3.2.1 Branching System (tree system)
Advantages:
Simple to design and build.
Less expensive than other systems.
Disadvantages:
The large number of dead ends which results in sedimentation and bacterial growths.
When repairs must be made to an individual line, service connections beyond the point of
repair will be without water until the repairs are made.
The pressure at the end of the line may become undesirably low as additional extensions are
made.

13
4.3.2.2 Grid System (Looped system)
Advantages:
The grid system overcomes all of the difficulties of the branching system discussed before.
No dead ends. (All of the pipes are interconnected).
Water can reach a given point of withdrawal from several directions.
Disadvantages
Hydraulically far more complicated than branching system (Determination of the pipe sizes
is somewhat more complicated).
Expensive (consists of a large number of loops.
4.3.2.3 Combined System
It’s a mixture of the two systems, so it can be used to have the advantages of the two systems and
avoiding their problems as possible.
5 Design of water distribution systems Designing water distribution systems depends on many factors, which should be taken as
requirements for a good design. These requirements are; satisfied quality and quantity standards,
reliable operation during irregular situations, maintenance and extension and flexibility with respect
to the future extensions.
5.1 Stages of design
1. Preliminary Studies.
2. Network Layout.
3. Hydraulic Analysis.
5.1.1 Preliminary Studies
Preliminary studies are those studies which are prepared before starting the design so that it can
clarify all the related information needed to reach the most probable design, by studying the nature
of the place the design for, feasibility of such kinds of design compared to others and other related
factors which can affect the convenience of the design to the it’s corresponding area.
Preliminary Studies includes many other studies as follows:
Topographical Studies(Contour lines, Digital maps and Location of water sources).
Water Demand Studies(Domestic demand, Industrial and Commercial demand, Agricultural
demand, Fire demand, Leakage and Losses)
5.1.2 Network Layout
This stage comes in place through two steps; the estimation of pipe sizes on the basis of water
demand and local code requirements, drawing the network on a digital map, and make a suitable
hydraulic model. A hydraulic model is useful for examining the impact of design and operation
decisions.

14
5.1.3 Hydraulic Analysis
Two popular methods of hydraulic analysis can be used; the assignment of the pipe size or the
assignment of the required pressures and velocities.
6 Basis of Design:
The flow rates of the proposed system should be based on actual data from similar systems,
taking into account domestic, agricultural, and industrial consumptions, lot size, degree of
urbanization, and water losses and any other factors that affect the water network. Such
data are usually provided from similar cases of study. When actual data is not available,
network should be designed to meet design parameters provided by specialized agencies.
The water network should be designed to supply all existing homes and lots in the intended
area, whether they have requested services or not, a reasonable growth rate should be
considered.
6.1 Flow Rates Projections
Target year will be 2040. Target domestic consumption at year 2040 is 150 L/c/d. Commercial consumption at year 2040 is 15% of the domestic consumption. Coverage by water supply is 100% of the population in the project boundaries. Target physical losses is about 15%. Peak flow: water is consumed mainly during the day. Where flows occur only during
that period with two district peaks, one in early morning and the second occurs in afternoon. The water lines should be able to handle these peak flows. Peaks tend to be lower when population is large according to the well-known pattern. There are several mathematical equations that describe this phenomenon. The peak factor range to be used in calculating the maximum hourly discharge is from 2.0 – 4.0.
Water pipes connected to fire hydrants should be at least 150mm in diameter. The discharge points should be able to supply at least 12 liter/sec (43 m3/hr) with 14-m pressure head. The flow rates necessary to provide an auxiliary supply for firefighting are shown in the following table:
Individual houses, low density housing, smaller industrial and
business areas
12 – 24 liter/sec (43 – 86
m3/hr)
Large industrial areas, High density built-up areas 30 – 60 liter/sec (108 – 216
m3/hr)

15
7 Design Standards of Water Networks
7.1 Water Distribution:
7.1.1 Distribution System Design:
7.1.1.1 Pressures
The range of water pressure experienced at any location is a function of the
hydraulic grade and the service elevation within a specific pressure zone. The
hydraulic grade is affected by the reservoir water level, pressure reducing valve
setting, and friction losses in the distribution system.
The maximum pressure within a pressure zone is based on the high water level
of the reservoir or highest pressure reducing valve setting and the elevation at
any specific point in the zone. The minimum system pressure will be 20 m
pressure head. The maximum value is 60 m pressure head.
7.1.1.2 Pipes, Valves and others
Both steel, UPVC and PE pipes are the most practical types that can be used in water network. The selection of one type will mainly depend on the economical considerations. For small size pipes up to 300 mm the UPVC pipes are the most economical materials in our conditions.
Pipes of 63 mm or less shall be MDPE or HDPE. Sub-surface utility warning tape will be placed not less than neither 150 mm
nor more than 300mm below the proposed finished grade and directly over the pipe
Dead ends should be minimized by looping of mains. Where dead ends occur, they shall be provided with blow-off valve assembly.
Valves will be placed on each intersecting line and located no more than 90 cm from each fitting unless otherwise specified.
Air release valve will be placed at high points and drainage valve will be provided at low points.
Number of gate valves will be one less than the number of branching connections.
No air vent, meter or blow off chamber shall be connected directly to a storm or sanitary sewer.
Joint deflection shall not exceed 80% of the manufactures allowable maximum. Fire hydrants will be located at distances between 300-400m considering that
trucks carry out firefighting. Minimum water main serving fire hydrants shall be 110-mm except for hydrant
branch lines

16
7.1.1.3 Depth Requirements
Water mains shall have a minimum 110-cm of cover at carriage way and 80 cm at sidewalks.
Water service lines, smaller than 50-mm, shall have a minimum cover of 80 cm. Horizontal distance between water mains and sewer will be a minimum of 3 m.
when local conditions prevent a horizontal distance of 3 m, the water line may be laid closer to the sewer line or manhole provided that the bottom of the water main is 45 cm above the top of the sewer.
Horizontal distance between water mains and other utilities, except sewer, will be a minimum of 150 cm.
Vertical clearance between water mains crossing over sewer mains shall be 45 cm (water over sewer). When local conditions prevent a minimum 45 cm vertical separation between water and sewer, the following construction shall be used:
Water lines shall pass under sewers only if approved in the pre-design process.
Water lines passing under sewers shall be protected by providing:
1. A vertical separation of at least 45cm between the bottom of the sewer and the top of the water line.
2. Adequate structural support for sewers to prevent excessive deflection of the joints and settling on and breaking of the water line.
3. That the length of the water line be centered at the point of the crossing so that joints shall be equidistant the sewer.
7.2 Design Checks
7.2.1 Head loss
The piping system is to be checked by considering the head loss or pressure drop that
occurs when transporting flows from one point to another. Friction losses through
pressure piping is based on the Hazen –Williams formula:
V = 0.849 C R0.63 S0.54
Where,
V = velocity (m/sec).
C = roughness coefficient, depends on the pipe material and typical values shown in
the table below.
R = hydraulic radius (m).
S = friction head loss per unit length.

17
7.2.1.1.1 Pipe Material 7.2.1.1.2 C
7.2.1.1.2.1.1.1 PVC 135-150
7.2.1.1.2.1.1.2 Steel with mortar lining 120-145
Steel (unlined )120-140 110-130
Ductile iron (with mortar lining) 100-140
Asbestos cement 120-140
Concrete pressure pipe 130-140
Ductile iron (unlined) 80-120
7.2.2 Friction Loss
There still are differences in the way in which friction losses through pipes are
calculated. These are:
Darcy-Weisbach
Hazen-Williams
Manning’s Equation
The choice is up to the designer and the available manufacturer’s data. Generally, Hazen-Williams is used for the losses throughout the water network
Hazen-Williams:
The Hazen-Williams equation for friction loss, the most widely used equation, appears as follows:
165.185.1
85.1
DC
LVCh u
f
Where, h f = friction loss, m L = length of pipe, m Cu = unit conversion coefficient = 6.83 SI V = discharge velocity, m/s C = Friction factor D= pipe diameter, m
The Hazen-Williams equation should only be used for turbulent flow and is most applicable to water at a temperature of about 16 C (60 F). The friction factor, C, for

18
the Hazen-Williams varies with pipe material and is typically in the range of 60 to 160.
7.2.3 Appurtenance Energy Losses:
The most common approach to computing energy losses through appurtenances such as valves and elbows, etc. is by use of a dimensionless loss factor, K, applied to the velocity head as follows:
g
VKhl
2
2
Where, hl = friction loss through appurtenance, m K = loss factor based on standard data or manufacturer’s specified data V = velocity through appurtenance, m/s g = acceleration due to gravity, m/s2
Where an appurtenance incurs a velocity change, such as a reducer or expansion, the head loss calculation takes the following form:
g
VK
g
VVKhl
2
)(
2
22
1
2
2
Where, hl = friction loss through appurtenance, m K = loss factor based on standard data or manufacturer’s specified data V1 = entrance velocity to appurtenance, m/s V2 = exit velocity from appurtenance, m/s g = acceleration due to gravity, m/s2
7.3 Sizing of Pipes
The sizing of pipes implies the determination of the pipe diameter. In order to do
that, two parameters are required; the design flow and the permissible flowing
velocity.
7.3.1 Design flows:
The forecasting of the design flows for any segment of pipe entails the estimation of
the number of end users who will be connected in addition to the average
consumption per capita per day. To estimate the number of consumers, the
following parameters are to be used:

19
1. The domestic design flow rates are estimated based on the assumption that the future water demand will be 150 L/C/D. This demand has been obtained from the Water Sector Strategic Planning study that was adopted by PWA.
2. The physical losses are assumed to be 15% in the future in all the project areas.
3. It is assumed that in the future, the supply will be continuous (24 hr/day). 4. The peak factor for the future scenario is 2.5.
7.3.2 Design Velocity:
The design velocity used to size the proposed pipes varies from a minimum velocity
of 0.6m/sec and a maximum of 2.4m/sec. The preferred velocity is the cleansing
one, which is 1.1m/sec.
Upon sizing the pipes for the future population and future demand, the pipes are
checked for the existing flow conditions.
8 Study of the current and future situation of the studied area:
The studied area, which is called AlForqan Neighborhood, lies in the western-south part of
Gaza-strip to the west of Rafah camp.
Visiting the area, we’ve noticed that;
The area covers a wide range of sand dunes and hills unless it’s a coastal area.
The vegetation in the area isn’t a general property as there are a small number of
trees.
The adjacent areas are high population density areas.
The area is identified as a slum area where the building construction has been out of
the authorities’ control.
The current water supply is taken from temporary wells which have been constructed
by the civilians in the area.
Most of the civilians are the ones whose houses have been destroyed by the Zionists.
The water networks are undersigned ones which have being distributed over the earth
surface.
No sewage or telephone networks available in the area.
The studied area is an old area of Zionists’ settlements.
The urban planning of the studied area clarifies a future plans for the construction of
schools, universities and mosques.
20
9 Consumption calculations:
9.1 Residential Areas:
9.1.1 Population density:
Population density: 16.3 capita/donum.
9.1.2 Recent number of residents:
The considered area is 226.813 donum.
9.1.3 Normal growth rate of population:
The Normal growth rate of Hay Al forqan is 4.11%
9.1.4 Population Forecasting:
Many methods are used to forecast the population in the future; each method has its
own assumptions.
9.1.4.1 Arithmetic Increases Method:
Assumption: The rate of change is constant.
( )
( )
Where,
Pt is Population after time (t).
Po is Present or initial population.
k is Population growth rate.
9.1.4.2 Uniform Percentage of increase (Geometric Increase):
Assumption: Uniform rate of increase.
( )
( )
Where,

21
n = number of years.
9.1.4.3 Curvilinear Method:
It is a method of comparison of the city under consideration with similar cities larger
in size.
The maximum population of 2040 is taken to be 12176 Capita.
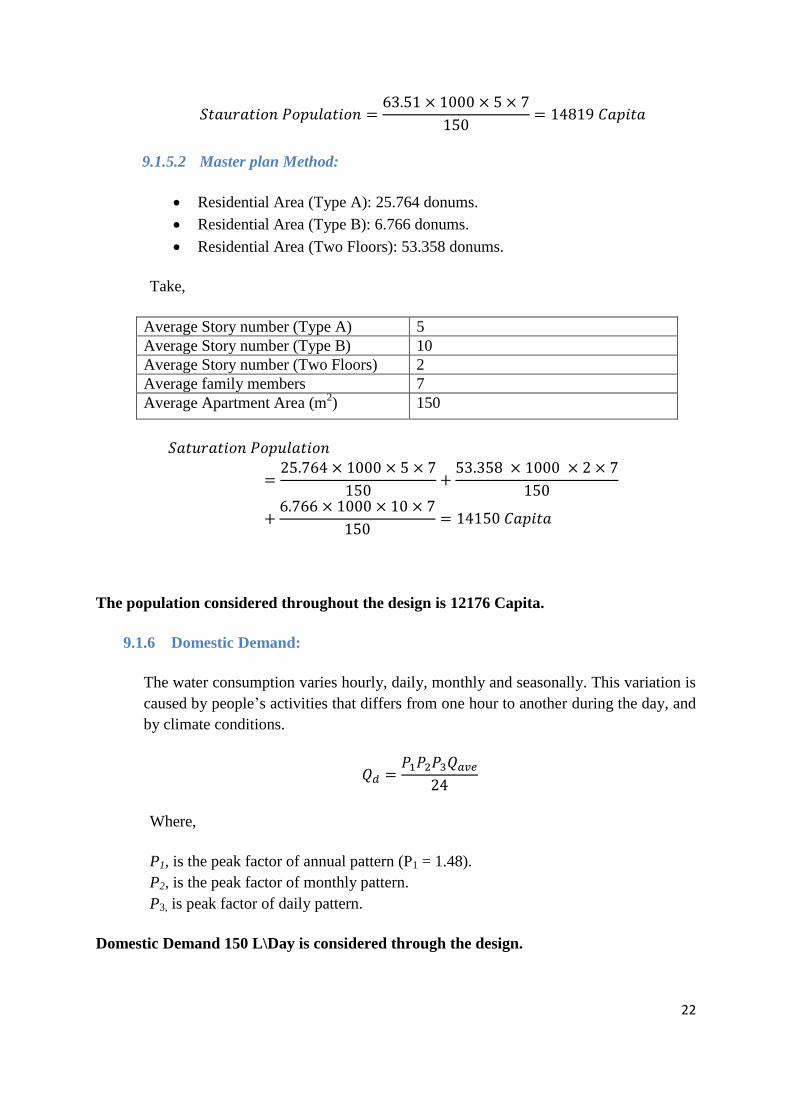
9.1.5 Population saturation:
Although the population forecasting methods give the population at the end of the
design period, the maximum possible population is also estimated according to the
number of apartment and stories per unit area and the number of maximum family
members. The Saturation population can be determined using the International
Method and the Master plan for the area and its general laws. The minimum of the
two values is taken in consideration when the network is designed.
9.1.5.1 International Method:
Using the international method the area considered is divided into subareas
according to the following criteria.
Usage of Area Percentage of total area
Roads 25
Green Areas 5
Residential Areas 70
The residential area is then divided according to the following criteria.
Usage of Area Percentage of Residential Area
Residential Buildings 40
Apostasy 60
Take,
Average story number 5
Average family members 7
Average Apartment Area (m2) 150
22
9.1.5.2 Master plan Method:
Residential Area (Type A): 25.764 donums.
Residential Area (Type B): 6.766 donums.
Residential Area (Two Floors): 53.358 donums.
Take,
Average Story number (Type A) 5
Average Story number (Type B) 10
Average Story number (Two Floors) 2
Average family members 7
Average Apartment Area (m2) 150
The population considered throughout the design is 12176 Capita.
9.1.6 Domestic Demand:
The water consumption varies hourly, daily, monthly and seasonally. This variation is
caused by people’s activities that differs from one hour to another during the day, and
by climate conditions.
Where,
P1, is the peak factor of annual pattern (P1 = 1.48).
P2, is the peak factor of monthly pattern.
P3, is peak factor of daily pattern.
Domestic Demand 150 L\Day is considered through the design.
23
9.2 Other types of consumption:
There are many types of water consumed by the users of this water, so water consumed
can be divided into four sections:
9.2.1 Residential water:
The water used by people in ordinary residential buildings, drinking, cooking,
washing, etc. and gives some references competent estimate of the amount of water
consumed per person at his home in one day through various household activities as
follows:
Drinking: 3-5 liter, Cooking: 5-10 liters, shower: 30-40 liters, ablution: 20-30 liters,
baths: 50-70 liters, laundry: 20-30 liter, rinsing: 10-30 liters, Others : 10-40 liters.
Daily consumption can be estimated per person of about 120-380 ml, appropriate
amount of consumption can also be estimated of the region between 120-180 liters /
day per person.
9.2.2 Industrial or commercial water:
The water used in industry and trade which quantity is related to a lot of changing
conditions, depends on the type of industry or trade, and generally range in the
developing countries between 5-12 cubic meters for every flat meter for the industrial
or commercial buildings, and in some semi-industrial cities, a rate of 150-200% is
adopted from the population amount of consumption.
9.2.3 Public water:
Namely, water consumed by the public facilities such as hospitals, parks, prisons,
schools or mosques. And even can be named for any not paid water. The public
consumption can reach to 75 liters / day / per person as an average for the population
of city people.
9.2.4 Lost Water:
The amount of water that can't be calculated, or that do not interfere in the design
calculations, which came as a result of leakage from the meters, connections and
valves, or as a result of illegal connections. The percentage loss in most advanced
cities reach to 15%, and is taken as 30-40% in developing countries.
24
10 Factors affecting the quantity of the required water:
The factors affecting the quantity of the required water for the supply of an area is based on
the following factors:
1. Water cost: as the cost of water increases the care of the consumer about the used
water quantity increases and so the required quantity of water decreases.
2. City area: the area of the studied city is directly proportional to the consumption,
which is based on the industrial or commercial nature of the city and the people
traditions.
3. Industry and trade: as they rise, the need for water increases, and this relation is
related to the different industries’ requirements.
4. The designed pressure of the network: as the pressure increases, the losses increases
and the water is easily reachable to the upper storages.
5. Sewage network: the more modern the network is, the more needed water is.
6. Water supply system: the continuous system of supply consumes more water than
discontinuous system, while the verse.
7. Weather conditions: cold weather reduces the required consumption and the quantities
needed for the fire safety requirements.
8. People habits and traditions: Muslims for example, requires additional quantities of
water for ablutions and the needs of different purity. While the western depends on
bathing, and so on.
9. Counters: The accuracy and presence of the counters at the points of consumption
adjusts the consumption. It’s well known that in some cities, the amount of water
consumed per square meter is calculated, or in a manner other than the counters, which
leads to indifference and consumption of larger quantities of water.
11 Projection of nodes on maps:
The following tasks are shown in the attached maps:
Projection on nodes.
Projection of pipes between the nodes due to the elevation of the points.

25
After calculation subareas for each node, which may be contain domestic, school or mosque
demand, we begin the first step in design and analysis of the water network. Starting with
calculate the flow demand which the node should be covered. Design and analysis the water
network follows these procedures:
1- Calculation Qdemostic for each junction.
2- Calculation Qschool and Qmosque for each junction.
3- Tabulate the consumption table as the following:
Junc. No. Domestic School Mosque
Area Density # Pop. Q (L/d) # Pupil. Q (L/d) # Prayers Q (L/d)
4- Analysis the water network using WaterCAD.
As the design year is 2040, using WaterCAD to run the water network to make sure that the
selected diameters in the water network satisfy the velocity and pressure head conditions to
avoid velocities less than 0.3 m/sec which may lead to deposition of salt, sand and other
harmful materials in the pipes, also to avoid negative suction pressure in the pipes. The
velocity in the network should be limited between 0.3 to 3 m/sec, and the pressure head
should be limited between 25 to 70 m. water head.
The design of water network should be satisfy the current demand, which means also the
current velocities and pressure head should be locate within above condition. To ensure that,
we re-operate the water network using the current density and number of population to make
sure of velocities and pressure head.
12 Calculation Qdemostic for each junction: 1- Use Qdemostic = 150 L/Capita/day.
2- Calculate the domestic area for each junction.
3- Calculate the number of population for each junction from:
4- Notice that, the domestic area for each node also contain the green lands, services
and public utility.
5- Calculate Qdemostic for each junction from:
26
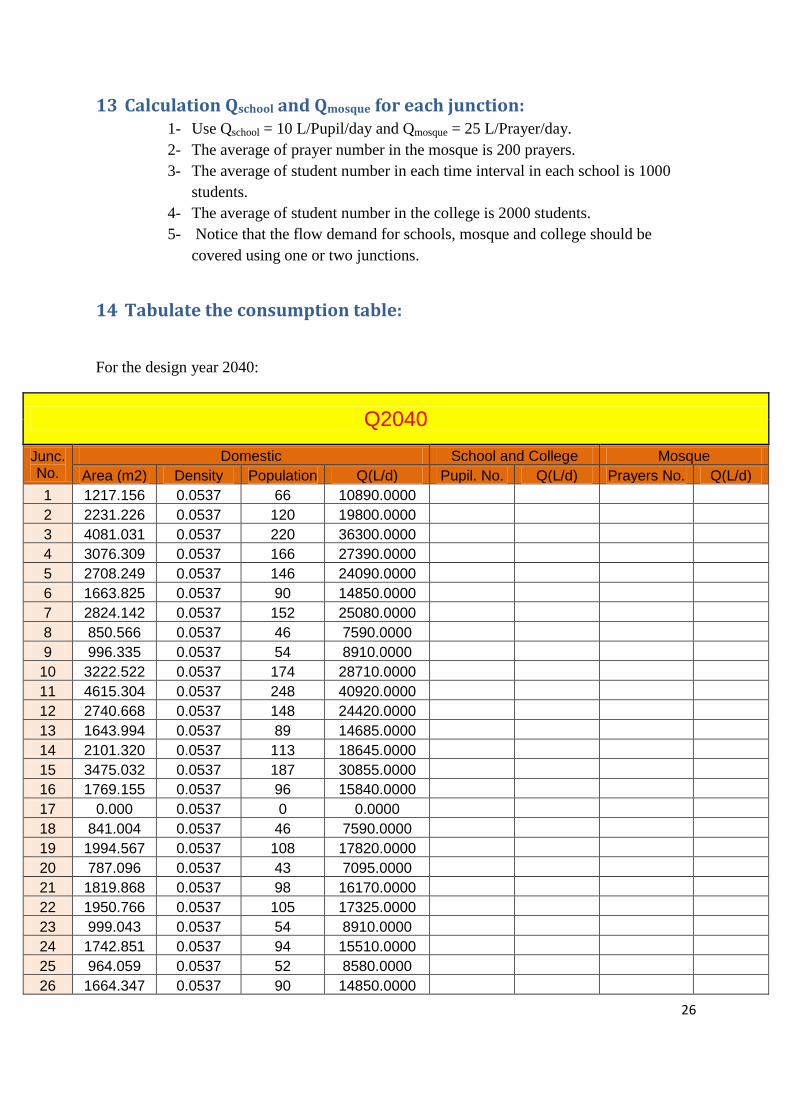
13 Calculation Qschool and Qmosque for each junction: 1- Use Qschool = 10 L/Pupil/day and Qmosque = 25 L/Prayer/day.
2- The average of prayer number in the mosque is 200 prayers.
3- The average of student number in each time interval in each school is 1000
students.
4- The average of student number in the college is 2000 students.
5- Notice that the flow demand for schools, mosque and college should be
covered using one or two junctions.
14 Tabulate the consumption table:
For the design year 2040:
Q2040
Junc. No.
Domestic School and College Mosque
Area (m2) Density Population Q(L/d) Pupil. No. Q(L/d) Prayers No. Q(L/d)
1 1217.156 0.0537 66 10890.0000
2 2231.226 0.0537 120 19800.0000
3 4081.031 0.0537 220 36300.0000
4 3076.309 0.0537 166 27390.0000
5 2708.249 0.0537 146 24090.0000
6 1663.825 0.0537 90 14850.0000
7 2824.142 0.0537 152 25080.0000
8 850.566 0.0537 46 7590.0000
9 996.335 0.0537 54 8910.0000
10 3222.522 0.0537 174 28710.0000
11 4615.304 0.0537 248 40920.0000
12 2740.668 0.0537 148 24420.0000
13 1643.994 0.0537 89 14685.0000
14 2101.320 0.0537 113 18645.0000
15 3475.032 0.0537 187 30855.0000
16 1769.155 0.0537 96 15840.0000
17 0.000 0.0537 0 0.0000
18 841.004 0.0537 46 7590.0000
19 1994.567 0.0537 108 17820.0000
20 787.096 0.0537 43 7095.0000
21 1819.868 0.0537 98 16170.0000
22 1950.766 0.0537 105 17325.0000
23 999.043 0.0537 54 8910.0000
24 1742.851 0.0537 94 15510.0000
25 964.059 0.0537 52 8580.0000
26 1664.347 0.0537 90 14850.0000
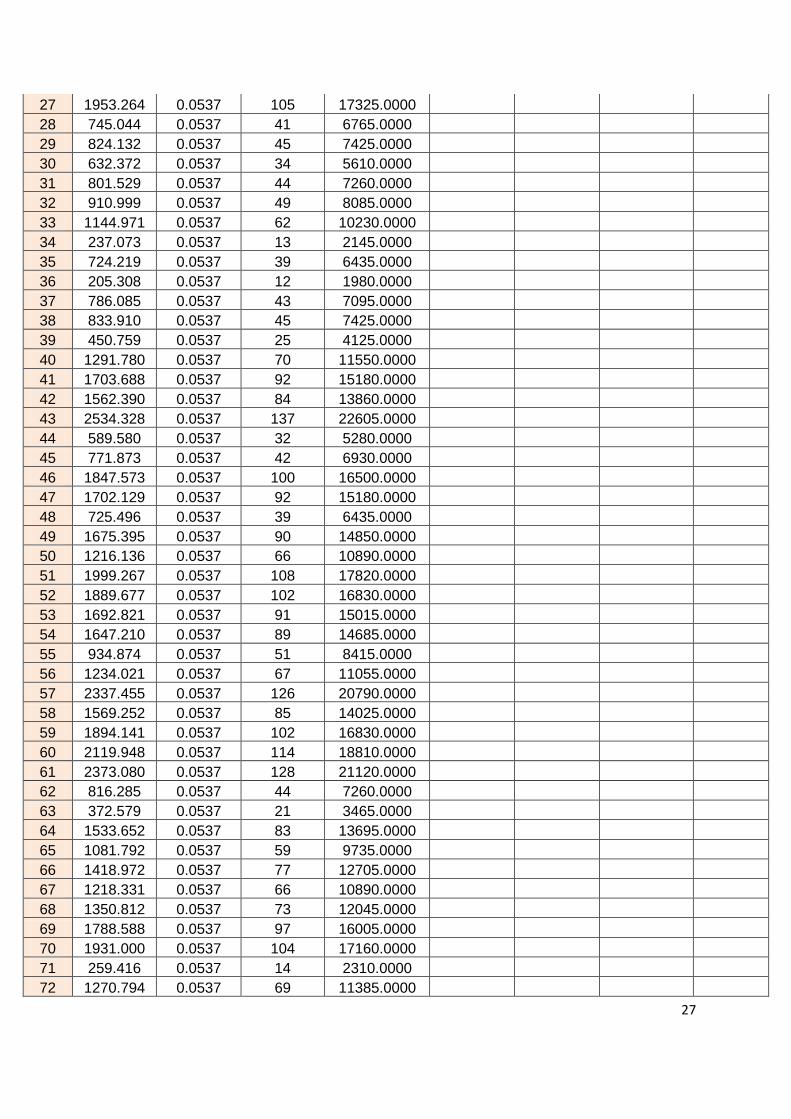
27
27 1953.264 0.0537 105 17325.0000
28 745.044 0.0537 41 6765.0000
29 824.132 0.0537 45 7425.0000
30 632.372 0.0537 34 5610.0000
31 801.529 0.0537 44 7260.0000
32 910.999 0.0537 49 8085.0000
33 1144.971 0.0537 62 10230.0000
34 237.073 0.0537 13 2145.0000
35 724.219 0.0537 39 6435.0000
36 205.308 0.0537 12 1980.0000
37 786.085 0.0537 43 7095.0000
38 833.910 0.0537 45 7425.0000
39 450.759 0.0537 25 4125.0000
40 1291.780 0.0537 70 11550.0000
41 1703.688 0.0537 92 15180.0000
42 1562.390 0.0537 84 13860.0000
43 2534.328 0.0537 137 22605.0000
44 589.580 0.0537 32 5280.0000
45 771.873 0.0537 42 6930.0000
46 1847.573 0.0537 100 16500.0000
47 1702.129 0.0537 92 15180.0000
48 725.496 0.0537 39 6435.0000
49 1675.395 0.0537 90 14850.0000
50 1216.136 0.0537 66 10890.0000
51 1999.267 0.0537 108 17820.0000
52 1889.677 0.0537 102 16830.0000
53 1692.821 0.0537 91 15015.0000
54 1647.210 0.0537 89 14685.0000
55 934.874 0.0537 51 8415.0000
56 1234.021 0.0537 67 11055.0000
57 2337.455 0.0537 126 20790.0000
58 1569.252 0.0537 85 14025.0000
59 1894.141 0.0537 102 16830.0000
60 2119.948 0.0537 114 18810.0000
61 2373.080 0.0537 128 21120.0000
62 816.285 0.0537 44 7260.0000
63 372.579 0.0537 21 3465.0000
64 1533.652 0.0537 83 13695.0000
65 1081.792 0.0537 59 9735.0000
66 1418.972 0.0537 77 12705.0000
67 1218.331 0.0537 66 10890.0000
68 1350.812 0.0537 73 12045.0000
69 1788.588 0.0537 97 16005.0000
70 1931.000 0.0537 104 17160.0000
71 259.416 0.0537 14 2310.0000
72 1270.794 0.0537 69 11385.0000

28
For the current year 2011:
Q2011
Junc. No.
Domestic School and College Mosque
Area (m2) Density Population Q(L/d) Pupil. No. Q(L/d) Prayers No. Q(L/d)
1 1217.156 0.0163 20 3300.0000
2 2231.226 0.0163 37 6105.0000
3 4081.031 0.0163 67 11055.0000
4 3076.309 0.0163 51 8415.0000
5 2708.249 0.0163 45 7425.0000
6 1663.825 0.0163 28 4620.0000
7 2824.142 0.0163 47 7755.0000
8 850.566 0.0163 14 2310.0000
9 996.335 0.0163 17 2805.0000
10 3222.522 0.0163 53 8745.0000
11 4615.304 0.0163 76 12540.0000
12 2740.668 0.0163 45 7425.0000
13 1643.994 0.0163 27 4455.0000
14 2101.320 0.0163 35 5775.0000
15 3475.032 0.0163 57 9405.0000
16 1769.155 0.0163 29 4785.0000
17 0.000 0.0163 0 0.0000
18 841.004 0.0163 14 2310.0000
19 1994.567 0.0163 33 5445.0000
20 787.096 0.0163 13 2145.0000
21 1819.868 0.0163 30 4950.0000
22 1950.766 0.0163 32 5280.0000
23 999.043 0.0163 17 2805.0000
24 1742.851 0.0163 29 4785.0000
25 964.059 0.0163 16 2640.0000
26 1664.347 0.0163 28 4620.0000
27 1953.264 0.0163 32 5280.0000
28 745.044 0.0163 13 2145.0000
29 824.132 0.0163 14 2310.0000
30 632.372 0.0163 11 1815.0000
31 801.529 0.0163 14 2310.0000
32 910.999 0.0163 15 2475.0000
33 1144.971 0.0163 19 3135.0000
34 237.073 0.0163 4 660.0000
35 724.219 0.0163 12 1980.0000
36 205.308 0.0163 4 660.0000
37 786.085 0.0163 13 2145.0000
38 833.910 0.0163 14 2310.0000
29
39 450.759 0.0163 8 1320.0000
40 1291.780 0.0163 22 3630.0000
41 1703.688 0.0163 28 4620.0000
42 1562.390 0.0163 26 4290.0000
43 2534.328 0.0163 42 6930.0000
44 589.580 0.0163 10 1650.0000
45 771.873 0.0163 13 2145.0000
46 1847.573 0.0163 31 5115.0000
47 1702.129 0.0163 28 4620.0000
48 725.496 0.0163 12 1980.0000
49 1675.395 0.0163 28 4620.0000
50 1216.136 0.0163 20 3300.0000
51 1999.267 0.0163 33 5445.0000
52 1889.677 0.0163 31 5115.0000
53 1692.821 0.0163 28 4620.0000
54 1647.210 0.0163 27 4455.0000
55 934.874 0.0163 16 2640.0000
56 1234.021 0.0163 21 3465.0000
57 2337.455 0.0163 39 6435.0000
58 1569.252 0.0163 26 4290.0000
59 1894.141 0.0163 31 5115.0000
60 2119.948 0.0163 35 5775.0000
61 2373.080 0.0163 39 6435.0000
62 816.285 0.0163 14 2310.0000
63 372.579 0.0163 7 1155.0000
64 1533.652 0.0163 25 4125.0000
65 1081.792 0.0163 18 2970.0000
66 1418.972 0.0163 24 3960.0000
67 1218.331 0.0163 20 3300.0000
68 1350.812 0.0163 23 3795.0000
69 1788.588 0.0163 30 4950.0000
70 1931.000 0.0163 32 5280.0000
71 259.416 0.0163 5 825.0000
72 1270.794 0.0163 21 3465.0000
15 Analysis the water network using WaterCAD: 1- Analysis the water network using WaterCAD to evaluate the sufficient diameter for
each pipe to produce acceptable values for both velocities and pressure head located
within the above limits.
2- Print all results you get from WaterCAD in the forms of tables and graphs.
3- Also add all required maps for the water network:
- The studied area with the current uses distribution.
- All water network elements (junctions, pipes, reservoir, tees …).

30
- Subareas distribution for each junction.
- WaterCAD results (velocities, pressure head, maps …).
16 References: Water Situation in the Gaza Strip/Year (2007-2008), Coastal Municipalities Water Utility
(CMWU).
Water in the Middle East and in North Africa – Resources , protection and management -
Fathi Zereini and Wolfgang Jaeschke (2004).
Fundamental of Hydraulics Engineering Systems, Robert J. Houghatlen, Ned H. C. Hwang.
University of Miami, 1996.
An interview with Mr. Ahmed Shaker from the Al-Sahel water Authority.

31