Islamic Republic of Afghanistan: Selected Issues and Statistical … · Islamic Republic of...
132
© 2006 International Monetary Fund March 2006 IMF Country Report No. 06/114 Islamic Republic of Afghanistan: Selected Issues and Statistical Appendix This Selected Issues paper and Statistical Appendix for the Islamic Republic of Afghanistan was prepared by a staff team of the International Monetary Fund as background documentation for the periodic consultation with the member country. It is based on the information available at the time it was completed on February 17, 2006. The views expressed in this document are those of the staff team and do not necessarily reflect the views of the government of the Islamic Republic of Afghanistan or the Executive Board of the IMF. The policy of publication of staff reports and other documents by the IMF allows for the deletion of market-sensitive information. To assist the IMF in evaluating the publication policy, reader comments are invited and may be sent by e-mail to [email protected] . Copies of this report are available to the public from International Monetary Fund ● Publication Services 700 19th Street, N.W. ● Washington, D.C. 20431 Telephone: (202) 623 7430 ● Telefax: (202) 623 7201 E-mail: [email protected] ● Internet: http://www.imf.org Price: $15.00 a copy International Monetary Fund Washington, D.C.
-
Upload
trinhhuong -
Category
Documents
-
view
230 -
download
0
Transcript of Islamic Republic of Afghanistan: Selected Issues and Statistical … · Islamic Republic of...
© 2006 International Monetary Fund March 2006
IMF Country Report No. 06/114
Islamic Republic of Afghanistan: Selected Issues and Statistical Appendix This Selected Issues paper and Statistical Appendix for the Islamic Republic of Afghanistan was prepared by a staff team of the International Monetary Fund as background documentation for the periodic consultation with the member country. It is based on the information available at the time it was completed on February 17, 2006. The views expressed in this document are those of the staff team and do not necessarily reflect the views of the government of the Islamic Republic of Afghanistan or the Executive Board of the IMF. The policy of publication of staff reports and other documents by the IMF allows for the deletion of market-sensitive information. To assist the IMF in evaluating the publication policy, reader comments are invited and may be sent by e-mail to [email protected].
Copies of this report are available to the public from
International Monetary Fund ● Publication Services 700 19th Street, N.W. ● Washington, D.C. 20431
Telephone: (202) 623 7430 ● Telefax: (202) 623 7201 E-mail: [email protected] ● Internet: http://www.imf.org
Price: $15.00 a copy
International Monetary Fund
Washington, D.C.

INTERNATIONAL MONETARY FUND
ISLAMIC REPUBLIC OF AFGHANISTAN
Selected Issues and Statistical Appendix
Prepared by Steven Symansky, Abdelrahmi Bessaha, Edouard Martin, Abhisek Banerjee (all MCD), and Theo Thomas (FAD)
Approved by the Middle East and Central Asia Department
February 17, 2006
Contents Page Map ............................................................................................................................................5 Overview....................................................................................................................................6 Selected Issues Papers I. Indicators of Afghanistan’s External Competitiveness..................................................7 A. Introduction...............................................................................................................7 B. Economic Indicators of External Competitiveness in Afghanistan ..........................9 C. Other Factors Influencing External Competitiveness .............................................13 D. External Competitiveness-Enhancing Measures.....................................................19 II. Rebuilding Domestic Revenue in Afghanistan............................................................24 A. Introduction and Overview of the Current Revenue System ..................................24 B. Revenue Policy and Administration........................................................................29 C. Setting Medium-Term Revenue Targets .................................................................36 III. Macroeconomic Impact of the Drug Economy and Counternarcotics Efforts ............44 A. Introduction and Summary......................................................................................44 B. The Macroeconomic Impact of Drug-Related Activities........................................44 C. The Government Counternarcotics Strategy ...........................................................56 D. Macroeconomic Impact of a Counternarcotics Campaign......................................59
- 2 -
Figures I.1. Price and Exchange Rate Developments, 2001–05 ...................................................... 9 I.2. Consumer Prices and Effective Exchange Rates, 2003–05 .........................................10 I.3. Relative Price of Nontradable to Tradable Goods, 2005–05 .......................................11 I.4. Wage-based Real Exchange Rates vis-à-vis Pakistani rupee, Iranian rial, 2001–05...12 I.5. Survey of Barriers to Business Development, 2004 ....................................................14 II.1. Structure of Revenue, 2004/05 ....................................................................................26 II.2. Percentage of Firms Citing Constraints as Major or Severe .......................................28 II.3. Medium-Term Revenue Forecast ................................................................................40 II.4. Revenue of Selected Post-Conflict Countries..............................................................40 III.1. World’s Opium Production..........................................................................................45 III.2. Opium Cultivation by Province, 2002–2005 ...............................................................58 Tables I.1. Relative Wage Levels, 2005 ........................................................................................13 I.2. Doing Business Survey, 2005......................................................................................15 I.3. Governance Indicators, 2000–04 .................................................................................16 I.4. Communications Infrastructure, 2001/02–2004/05 .....................................................17 I.5. Electricity Prices for Industrial Users, 2005 ................................................................18 I.6. Production and Demand for Electricity, 2001/02–2004/05 .........................................18 II.1. Central Government Revenues by Group ....................................................................25 II.2. Concentration of Domestic Tax Collections in Selected Countries.............................33 II.3. Revenue Scenarios .......................................................................................................39 III.1. Opium Production: Basic Indicators, 1986–2005........................................................45 III.2. Yields and Income per Hectare for Various Crops, 2005............................................46 III.3. Opium Production’s Potential Export Value, 2004–05 ...............................................47 III.4. Relative Size of Opium Production, 2002/03–2005/06 ...............................................48 III.5. Use of the Gross Disposable Income, 2002/03–2005/06.............................................54 III.6. Main Factors Influencing Farmers’ Decisions to Cultivate Opium, 2005...................59 III.7. Simulation of the Potential Macroeconomic Impact of an
Eradication Campaign, 2006–10............................................................................62 III.8. Simulation of the Potential Macroeconomic Impact of an
Interdiction Campaign, 2006–10 ...........................................................................64 III.9. Simulation of the Potential Macroeconomic Impact of a Counternarcotics Campaign
Combining Eradication and Interdiction, 2006–10................................................65 III.10. Simulation of the Potential Macroeconomic Impact of a Multi-Pronged
Counternarcotics Campaign, 2006–10...................................................................67
- 3 -
Statistical Appendix Tables 1. Basic Data, 2001/02–2005/06......................................................................................73 2. Gross Domestic Product at Current Prices, 2001/02–2005/06 ....................................74 3. Gross Domestic Product at Constant Prices, 2001/02–2005/06 ..................................75 4. Gross Domestic Product at Constant Prices (Annual Percentage Change), 2001/02–2005/06 ................................................................................................76 5. Sectoral Shares of Gross Domestic Product, 2001/02–2005/06 ..................................77 6. Savings-Investments Balances at Current Prices, 2002/03–2005/06...........................78 7. Opium Production and Prices, 1994–2005 ..................................................................79 8. Agricultural Crop Production, 2001/02–2005/06 ........................................................80 9. Land Use, 2001/02–2005/06........................................................................................81 10. Cultivated Land Area for Fruits and Vegetables, 2001/02–2005/06 ...........................82 11. Cultivated Land Area for Cereals and Others, 2001/02–2005/06................................83 12. Crop Yields, 2000/01–2005/06....................................................................................84 13. Cereal Balance Sheet, 2001/02–2005/06 .....................................................................85 14. Livestock, 2001/02–2005/06 .......................................................................................86 15. Agricultural Cooperatives, 2001/02–2005/06..............................................................87 16. Production and Consumption of Electricity, 2001/02–2005/06 ..................................88 17. Production and Imports of Cement, 2001/02–2005/06................................................89 18. Private Industrial Production, 2001/02–2005/06 .........................................................90 19. Main Industrial Organizations, 2001/02–2005/06 .......................................................91 20. Land Transportation, 2001/02–2005/06.......................................................................92 21. Air Transportation, 2001/02–2005/06 .........................................................................93 22. Number of Post Offices, 2001/02–2005/06 .................................................................94 23. Telephone Services, 2001/02–2005/06........................................................................95 24. Sectoral Distribution of Active Population, 2001/02–2005/06....................................96 25. Consumer Price Index for Kabul, January 2003–December 2005 ..............................97 26. National Consumer Price Index, 2004–05 ...................................................................98 27. General Government Employment, 2001/02–2005/06 ................................................99 28. Core Budget (in millions of Afghanis), 2003/04–2005/06 ........................................100 29. Core Budget (in percent of GDP), 2003/04–2005/06 ................................................101 30. Revenue and Expenditures by Provinces and Central Ministries, 2003/04–2005/06 ...........................................................................................102 31. Core Development Budget Expenditures, 2001/02–2005/06 ....................................103 32. External Development Budget Expenditures, 2001/02–2005/06...............................104 33. Monetary Program (Da Afghanistan Bank), 2003/04–2005/06.................................105 34. Monetary Survey, 2005/06.........................................................................................106 35. Number of Banks .......................................................................................................107 36. Balance Sheet of the Commercial Banks, September 30, 2005.................................108 37. Short-Term Capital Note Auctions, 2004–06........... .................................................109 38. Da Afghanistan Bank Foreign Currency Auctions, 2003/04–2005/06......................110 39. Balance of Payments, 2002/03–2005/06....................................................................111 40. Direction of Trade (In millions of U.S. dollars), 2001/02–2005/06 ..........................112 41. Direction of Trade (In percent of total), 2001/02–2005/06 .......................................113
- 4 -
42. Composition of Trade, 2001/02–2005/06 ..................................................................114 43. External Debt, 2004/05 ..............................................................................................115 44. Real and Nominal Effective Exchange Rates, 2002–05 ............................................116 Summary of Tax System, End-2005......................................................................................117 List of State-Owned Enterprises by Ministry, 2005 ..............................................................130
- 5 -
- 6 -
OVERVIEW This document consists of two parts: • The first part includes three issues papers. The first one reviews some indicators of Afghanistan’s external competitiveness. The second paper discusses the rebuilding of domestic revenue. The third one analyzes the macroeconomic impact of the drug economy and the counternarcotics efforts. • The second part of this document provides, whenever available, statistical information on the real, fiscal, monetary, and external sectors. It also contains a list of state-owned enterprises and an updated summary of the tax system as of end-December 2005. This information supplements the data contained in the staff report for the 2005 Article IV Consultation.
- 7 -
I. INDICATORS OF AFGHANISTAN’S EXTERNAL COMPETITIVENESS 1
A. Introduction
1. This paper attempts to provide a preliminary view on Afghanistan’s external competitiveness through a review of some macroeconomic, microeconomic, and institutional indicators. Data limitations make it difficult to conduct a thorough study of competitiveness. There is a lack of historical information on key macroeconomic variables; and recent data on domestic costs, national accounts, consumer and producer prices, terms of trade, foreign investment, and labor market developments are either unavailable or weak at best. Also, information on the business environment was, until recently, unavailable or incomplete.2
2. Notwithstanding data limitations, reviewing competitiveness issues is important in light of recent developments in the exchange market. The Afghani appreciated by about 20 percent in real effective terms over the 30 months to September 2005. This appreciation appears to be the result of “Dutch disease” stemming from drug- and aid-related inflows. Other factors affecting external competitiveness include structural rigidities, severe energy shortages, and a weak business and banking regulatory environment.
3. In the near term, external competitiveness might not be a pressing issue, as aid, in particular, has supported the economy since the fall of the Taliban. Nonetheless, it needs to be addressed over the medium and long term, particularly in light of the eventual dwindling of donor support and the need to diversify the export base and the sources of growth to place the economy on a sustainable growth path and find alternatives to opium-related activities. The government’s new interim national development strategy recognizes the importance of enhancing external competitiveness (Box I.1).3
1This paper was prepared by Messrs. Bessaha and Banerjee (MCD).
2A recent assessment of the investment climate in Afghanistan is provided in “The Investment Climate in Afghanistan: Exploiting Opportunities in an Uncertain Environment”, Finance and Private Sector Development Unit, South Asia Region, World Bank. December 2005.
3The Interim Afghanistan National Development Strategy (I-ANDS) was submitted to the donor community at the London International Donors’ Conference on January 31.
- 8 -
Exports
Iran Pakistan India Other
Box I.1. Trade Structure
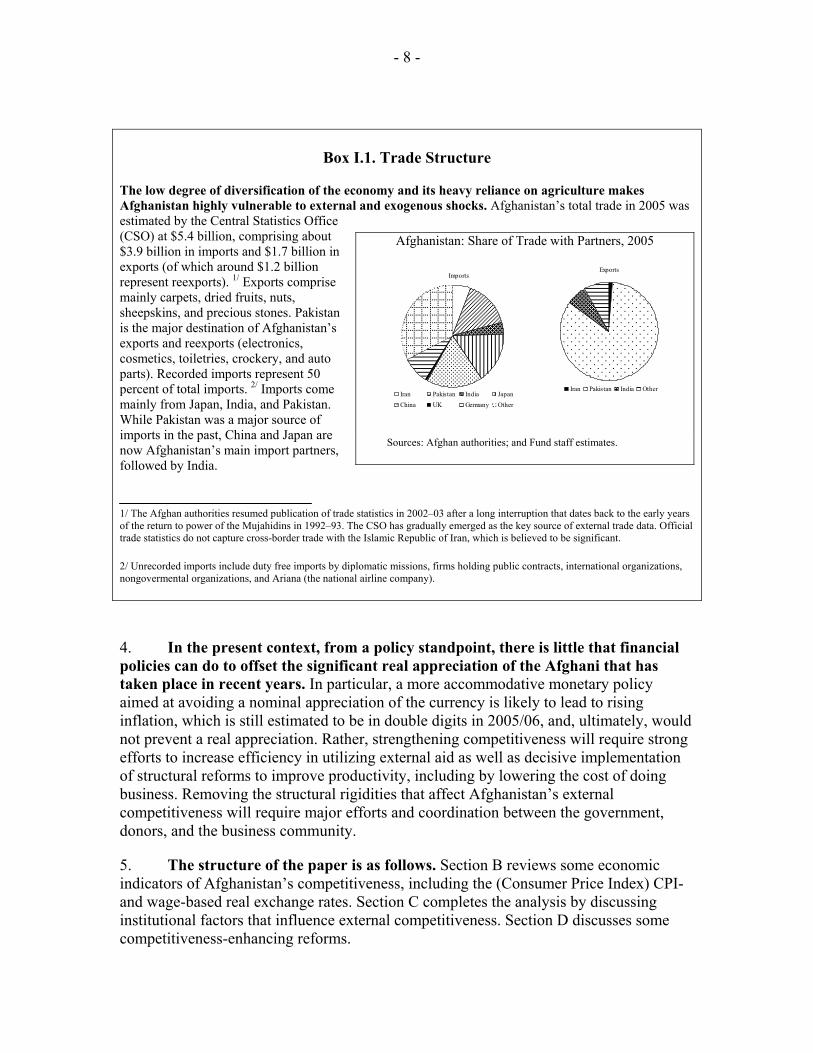
The low degree of diversification of the economy and its heavy reliance on agriculture makes Afghanistan highly vulnerable to external and exogenous shocks. Afghanistan’s total trade in 2005 was estimated by the Central Statistics Office (CSO) at $5.4 billion, comprising about $3.9 billion in imports and $1.7 billion in exports (of which around $1.2 billion represent reexports). 1/ Exports comprise mainly carpets, dried fruits, nuts, sheepskins, and precious stones. Pakistan is the major destination of Afghanistan’s exports and reexports (electronics, cosmetics, toiletries, crockery, and auto parts). Recorded imports represent 50 percent of total imports. 2/ Imports come mainly from Japan, India, and Pakistan. While Pakistan was a major source of imports in the past, China and Japan are now Afghanistan’s main import partners, followed by India.
1/ The Afghan authorities resumed publication of trade statistics in 2002–03 after a long interruption that dates back to the early years of the return to power of the Mujahidins in 1992–93. The CSO has gradually emerged as the key source of external trade data. Official trade statistics do not capture cross-border trade with the Islamic Republic of Iran, which is believed to be significant.
2/ Unrecorded imports include duty free imports by diplomatic missions, firms holding public contracts, international organizations, nongovermental organizations, and Ariana (the national airline company).
Afghanistan: Share of Trade with Partners, 2005
Imports
Iran Pakistan India JapanChina UK Germany Other
Sources: Afghan authorities; and Fund staff estimates.
4. In the present context, from a policy standpoint, there is little that financial policies can do to offset the significant real appreciation of the Afghani that has taken place in recent years. In particular, a more accommodative monetary policy aimed at avoiding a nominal appreciation of the currency is likely to lead to rising inflation, which is still estimated to be in double digits in 2005/06, and, ultimately, would not prevent a real appreciation. Rather, strengthening competitiveness will require strong efforts to increase efficiency in utilizing external aid as well as decisive implementation of structural reforms to improve productivity, including by lowering the cost of doing business. Removing the structural rigidities that affect Afghanistan’s external competitiveness will require major efforts and coordination between the government, donors, and the business community.
5. The structure of the paper is as follows. Section B reviews some economic indicators of Afghanistan’s competitiveness, including the (Consumer Price Index) CPI- and wage-based real exchange rates. Section C completes the analysis by discussing institutional factors that influence external competitiveness. Section D discusses some competitiveness-enhancing reforms.
- 9 -
B. Economic Indicators of External Competitiveness in Afghanistan
6. This section discusses Afghanistan’s international cost position through various economic and quantitative indicators.
Consumer Prices
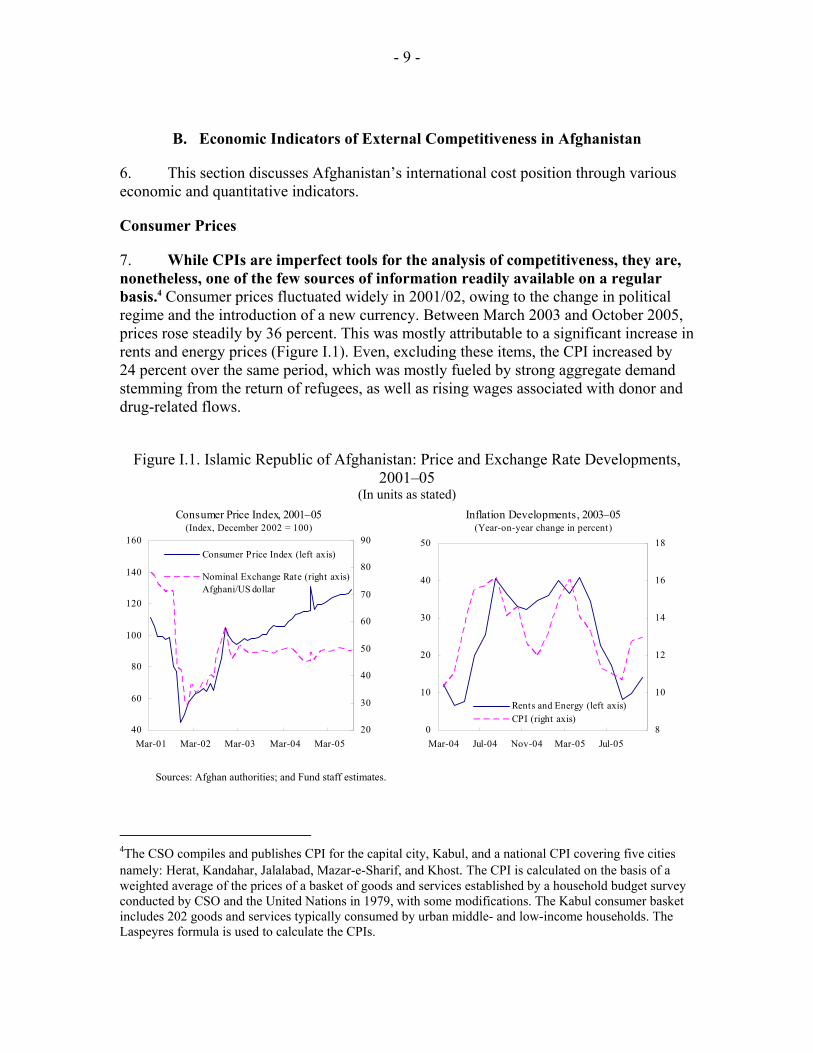
7. While CPIs are imperfect tools for the analysis of competitiveness, they are, nonetheless, one of the few sources of information readily available on a regular basis.4 Consumer prices fluctuated widely in 2001/02, owing to the change in political regime and the introduction of a new currency. Between March 2003 and October 2005, prices rose steadily by 36 percent. This was mostly attributable to a significant increase in rents and energy prices (Figure I.1). Even, excluding these items, the CPI increased by 24 percent over the same period, which was mostly fueled by strong aggregate demand stemming from the return of refugees, as well as rising wages associated with donor and drug-related flows.
Figure I.1. Islamic Republic of Afghanistan: Price and Exchange Rate Developments,
2001–05 (In units as stated)
40
60
80
100
120
140
160
Mar-01 Mar-02 Mar-03 Mar-04 Mar-0520
30
40
50
60
70
80
90Consumer Price Index (left axis)
Nominal Exchange Rate (right axis)Afghani/US dollar
Consumer Price Index, 2001–05(Index, December 2002 = 100)
0
10
20
30
40
50
Mar-04 Jul-04 Nov-04 Mar-05 Jul-058
10
12
14
16
18
Rents and Energy (left axis)CPI (right axis)
Inflation Developments, 2003–05(Year-on-year change in percent)
Sources: Afghan authorities; and Fund staff estimates.
4The CSO compiles and publishes CPI for the capital city, Kabul, and a national CPI covering five cities namely: Herat, Kandahar, Jalalabad, Mazar-e-Sharif, and Khost. The CPI is calculated on the basis of a weighted average of the prices of a basket of goods and services established by a household budget survey conducted by CSO and the United Nations in 1979, with some modifications. The Kabul consumer basket includes 202 goods and services typically consumed by urban middle- and low-income households. The Laspeyres formula is used to calculate the CPIs.
- 10 -
The CPI-Based Real Effective Exchange Rate
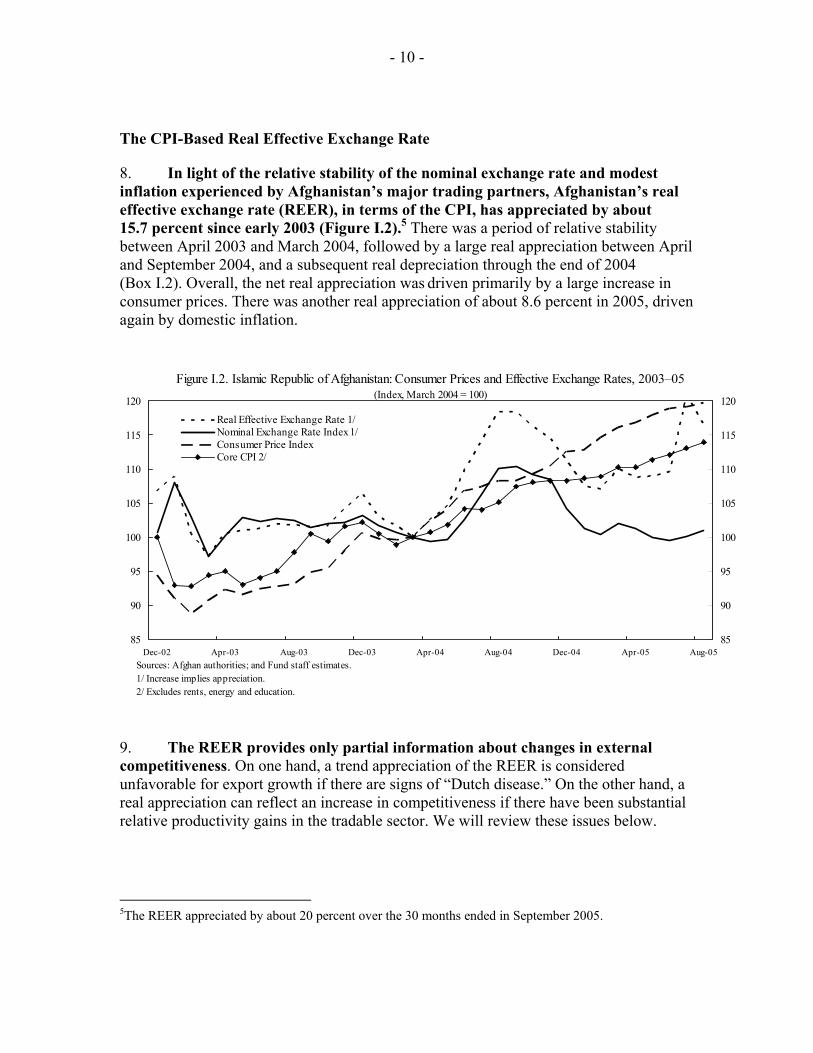
8. In light of the relative stability of the nominal exchange rate and modest inflation experienced by Afghanistan’s major trading partners, Afghanistan’s real effective exchange rate (REER), in terms of the CPI, has appreciated by about 15.7 percent since early 2003 (Figure I.2).5 There was a period of relative stability between April 2003 and March 2004, followed by a large real appreciation between April and September 2004, and a subsequent real depreciation through the end of 2004 (Box I.2). Overall, the net real appreciation was driven primarily by a large increase in consumer prices. There was another real appreciation of about 8.6 percent in 2005, driven again by domestic inflation.
85
90
95
100
105
110
115
120
Dec-02 Apr-03 Aug-03 Dec-03 Apr-04 Aug-04 Dec-04 Apr-05 Aug-0585
90
95
100
105
110
115
120
Real Effective Exchange Rate 1/Nominal Exchange Rate Index 1/Consumer Price IndexCore CPI 2/
Figure I.2. Islamic Republic of Afghanistan: Consumer Prices and Effective Exchange Rates, 2003–05(Index, March 2004 = 100)
Sources: Afghan authorities; and Fund staff estimates.1/ Increase implies appreciation.2/ Excludes rents, energy and education.
9. The REER provides only partial information about changes in external competitiveness. On one hand, a trend appreciation of the REER is considered unfavorable for export growth if there are signs of “Dutch disease.” On the other hand, a real appreciation can reflect an increase in competitiveness if there have been substantial relative productivity gains in the tradable sector. We will review these issues below.
5The REER appreciated by about 20 percent over the 30 months ended in September 2005.
- 11 -
Box I.2. The Exchange System
Currently, Afghanistan has a de facto unified exchange rate. The central bank, Da Afghanistan Bank (DAB), provides daily quotes for the official Afghani-U.S. dollar rate based on early morning quotations in the free market of money changers. The rate is used for all transactions, including those with the government. DAB exchange rates for other currencies are based on cross rates with the U.S. dollar. DAB uses the buying and selling rates from the free market rather than a fixed spread around a central rate. The spread between the two rates (for cash transactions) fluctuates within a range not exceeding 1 percent. DAB collects a small commission on travelers’ checks and international transfers. The current system is appropriate in view of the structural changes taking place in the economy.
The Relative Price of Nontradable to Tradable Goods
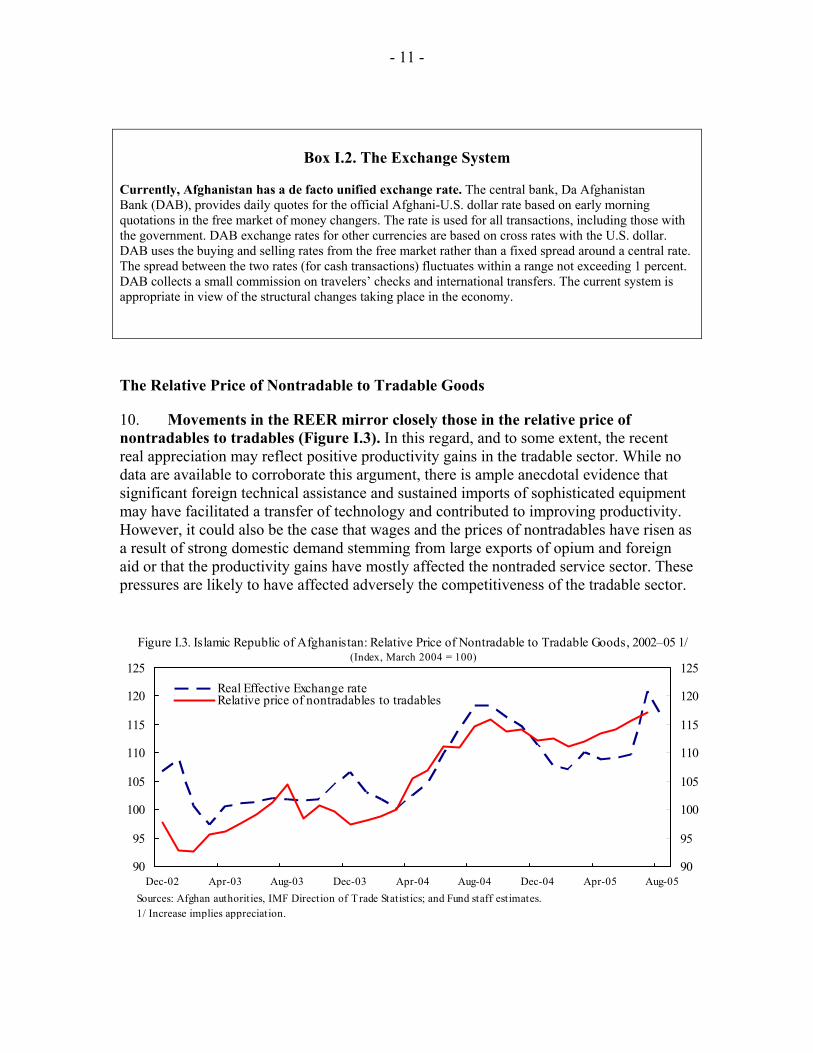
10. Movements in the REER mirror closely those in the relative price of nontradables to tradables (Figure I.3). In this regard, and to some extent, the recent real appreciation may reflect positive productivity gains in the tradable sector. While no data are available to corroborate this argument, there is ample anecdotal evidence that significant foreign technical assistance and sustained imports of sophisticated equipment may have facilitated a transfer of technology and contributed to improving productivity. However, it could also be the case that wages and the prices of nontradables have risen as a result of strong domestic demand stemming from large exports of opium and foreign aid or that the productivity gains have mostly affected the nontraded service sector. These pressures are likely to have affected adversely the competitiveness of the tradable sector.
90
95
100
105
110
115
120
125
Dec-02 Apr-03 Aug-03 Dec-03 Apr-04 Aug-04 Dec-04 Apr-05 Aug-0590
95
100
105
110
115
120
125Real Effective Exchange rateRelative price of nontradables to tradables
Figure I.3. Islamic Republic of Afghanistan: Relative Price of Nontradable to Tradable Goods, 2002–05 1/(Index, March 2004 = 100)
Sources: Afghan authorities, IMF Direction of Trade Statistics; and Fund staff estimates. 1/ Increase implies appreciation.
- 12 -
The Wage-Based Real Exchange Rate
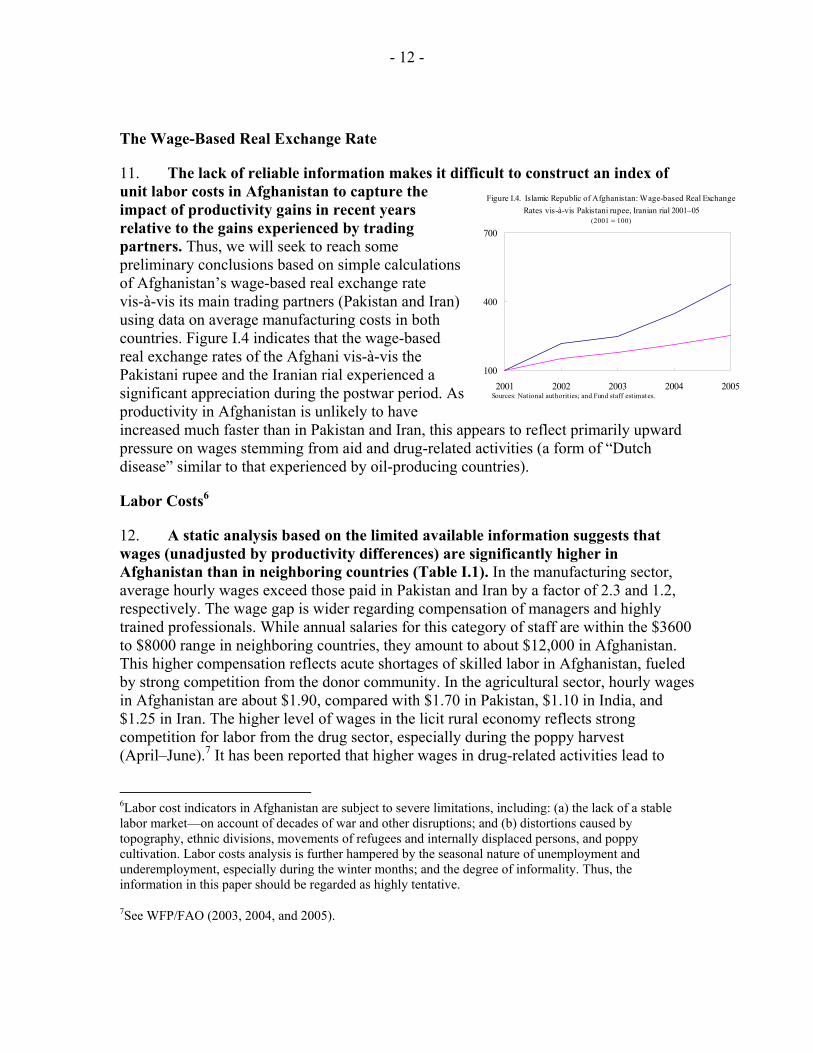
11. The lack of reliable information makes it difficult to construct an index of unit labor costs in Afghanistan to capture the impact of productivity gains in recent years relative to the gains experienced by trading partners. Thus, we will seek to reach some preliminary conclusions based on simple calculations of Afghanistan’s wage-based real exchange rate vis-à-vis its main trading partners (Pakistan and Iran) using data on average manufacturing costs in both countries. Figure I.4 indicates that the wage-based real exchange rates of the Afghani vis-à-vis the Pakistani rupee and the Iranian rial experienced a significant appreciation during the postwar period. As productivity in Afghanistan is unlikely to have increased much faster than in Pakistan and Iran, this appears to reflect primarily upward pressure on wages stemming from aid and drug-related activities (a form of “Dutch disease” similar to that experienced by oil-producing countries).
Labor Costs6
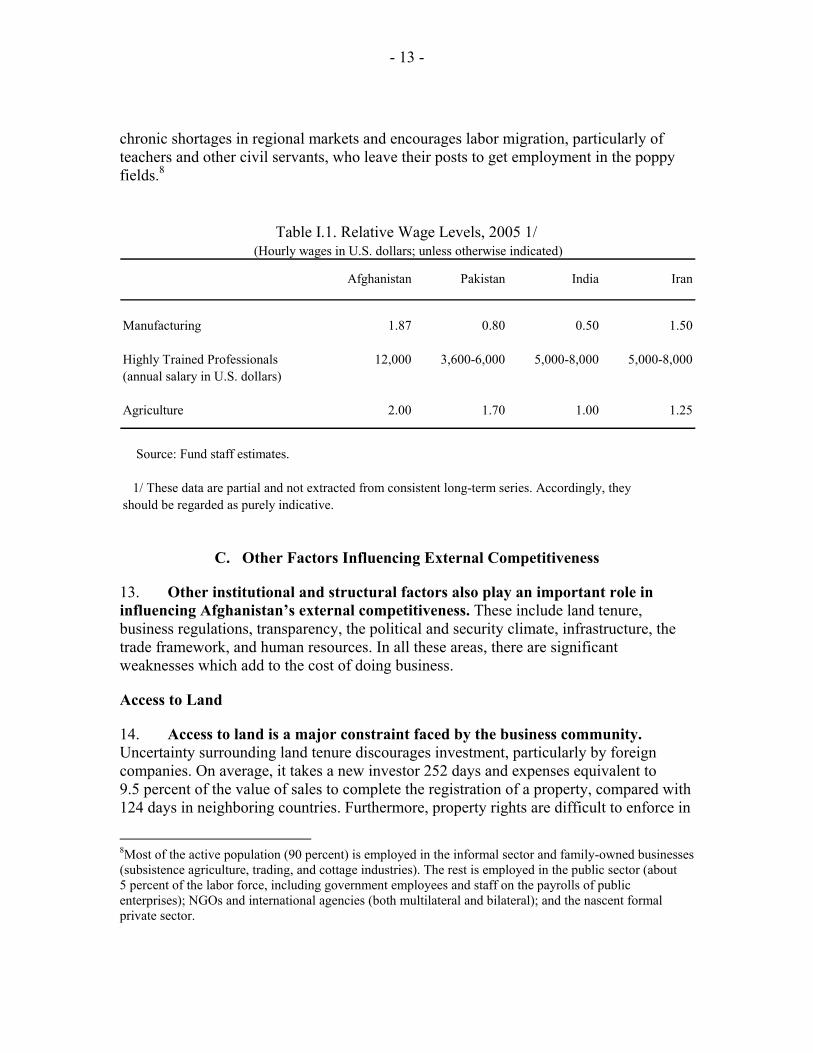
12. A static analysis based on the limited available information suggests that wages (unadjusted by productivity differences) are significantly higher in Afghanistan than in neighboring countries (Table I.1). In the manufacturing sector, average hourly wages exceed those paid in Pakistan and Iran by a factor of 2.3 and 1.2, respectively. The wage gap is wider regarding compensation of managers and highly trained professionals. While annual salaries for this category of staff are within the $3600 to $8000 range in neighboring countries, they amount to about $12,000 in Afghanistan. This higher compensation reflects acute shortages of skilled labor in Afghanistan, fueled by strong competition from the donor community. In the agricultural sector, hourly wages in Afghanistan are about $1.90, compared with $1.70 in Pakistan, $1.10 in India, and $1.25 in Iran. The higher level of wages in the licit rural economy reflects strong competition for labor from the drug sector, especially during the poppy harvest (April–June).7 It has been reported that higher wages in drug-related activities lead to
6Labor cost indicators in Afghanistan are subject to severe limitations, including: (a) the lack of a stable labor market—on account of decades of war and other disruptions; and (b) distortions caused by topography, ethnic divisions, movements of refugees and internally displaced persons, and poppy cultivation. Labor costs analysis is further hampered by the seasonal nature of unemployment and underemployment, especially during the winter months; and the degree of informality. Thus, the information in this paper should be regarded as highly tentative.
7See WFP/FAO (2003, 2004, and 2005).
100
400
700
2001 2002 2003 2004 2005
Figure I.4. Islamic Republic of Afghanistan: Wage-based Real Exchange Rates vis-à-vis Pakistani rupee, Iranian rial 2001–05
(2001 = 100)
Sources: National authorities; and Fund staff estimates.
- 13 -
chronic shortages in regional markets and encourages labor migration, particularly of teachers and other civil servants, who leave their posts to get employment in the poppy fields.8
Afghanistan Pakistan India Iran
Manufacturing 1.87 0.80 0.50 1.50
Highly Trained Professionals 12,000 3,600-6,000 5,000-8,000 5,000-8,000(annual salary in U.S. dollars)
Agriculture 2.00 1.70 1.00 1.25
Source: Fund staff estimates.
1/ These data are partial and not extracted from consistent long-term series. Accordingly, they should be regarded as purely indicative.
Table I.1. Relative Wage Levels, 2005 1/ (Hourly wages in U.S. dollars; unless otherwise indicated)
C. Other Factors Influencing External Competitiveness
13. Other institutional and structural factors also play an important role in influencing Afghanistan’s external competitiveness. These include land tenure, business regulations, transparency, the political and security climate, infrastructure, the trade framework, and human resources. In all these areas, there are significant weaknesses which add to the cost of doing business.
Access to Land
14. Access to land is a major constraint faced by the business community. Uncertainty surrounding land tenure discourages investment, particularly by foreign companies. On average, it takes a new investor 252 days and expenses equivalent to 9.5 percent of the value of sales to complete the registration of a property, compared with 124 days in neighboring countries. Furthermore, property rights are difficult to enforce in
8Most of the active population (90 percent) is employed in the informal sector and family-owned businesses (subsistence agriculture, trading, and cottage industries). The rest is employed in the public sector (about 5 percent of the labor force, including government employees and staff on the payrolls of public enterprises); NGOs and international agencies (both multilateral and bilateral); and the nascent formal private sector.
- 14 -
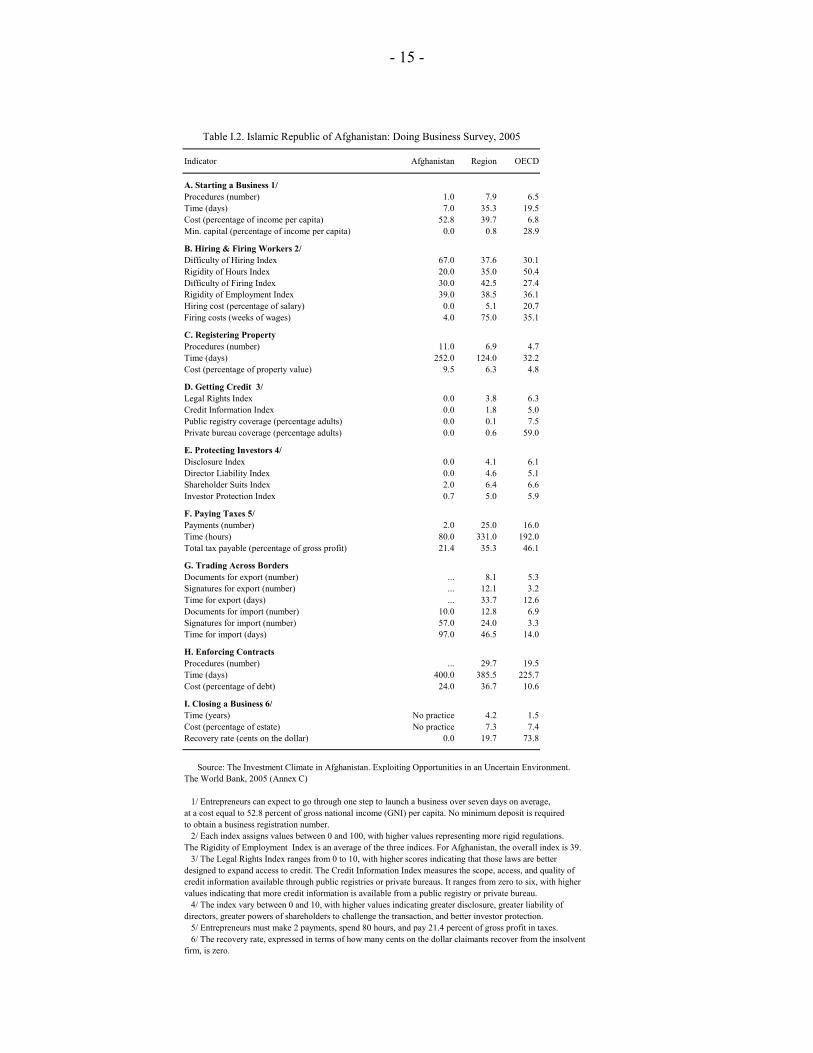
light of the lack of a clear land tenure system and an efficient and transparent judicial system. This uncertainty in land tenure acts as a powerful deterrent to access commercial credit as land cannot be used as collateral. Business Environment 15. In recent years, the Afghan authorities have taken a number of steps to improve the business environment, as evidenced by the simplification of procedures to open a business, and the adoption of a liberal legal framework for the labor market. However, these advances are overshadowed by continued rigidities in other key areas for business activity. A recent World Bank report ranks Afghanistan below regional averages in most measures of business friendliness. For example, the cost of starting a business in Afghanistan is estimated at 53 percent of gross national income per capita, compared with 40 percent on average, for the region (Table I.2). Similarly, 11 steps are required to register property, compared to 7 in neighboring countries. Access to credit is a major constraint due to uncertainties in land tenure, as indicated above. More importantly, the judicial system is inefficient and corrupt, and the time needed to enforce contracts is high by regional and international standards.
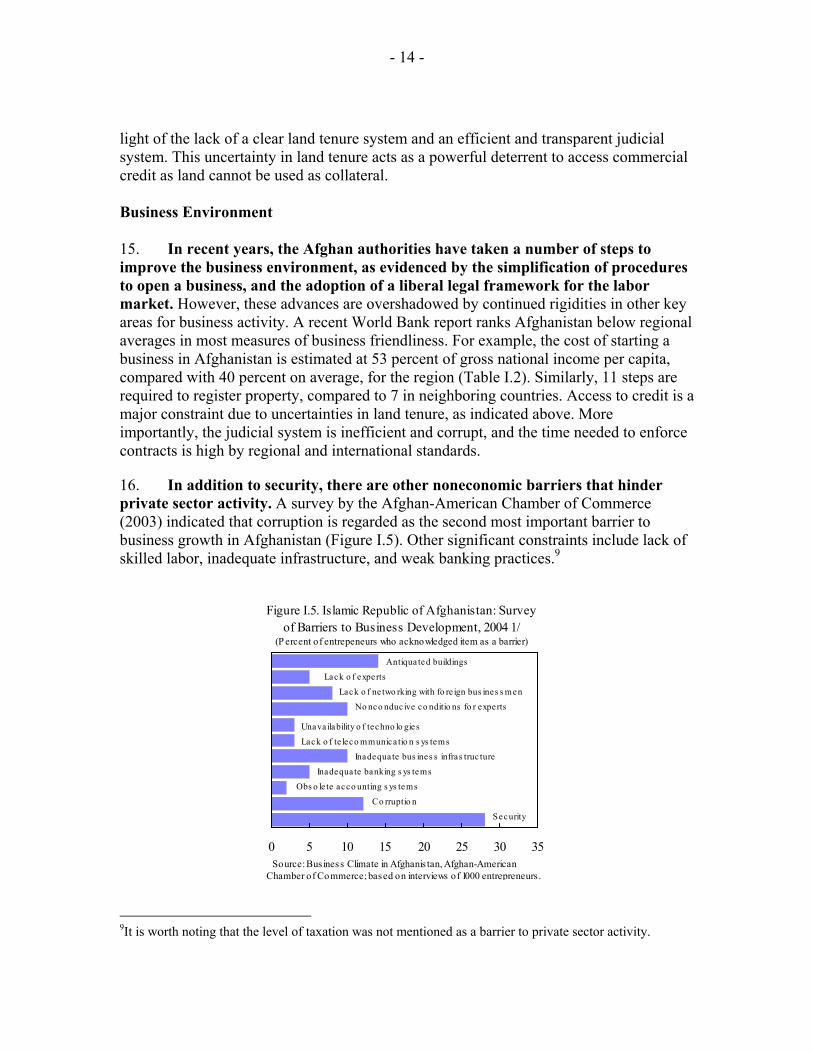
16. In addition to security, there are other noneconomic barriers that hinder private sector activity. A survey by the Afghan-American Chamber of Commerce (2003) indicated that corruption is regarded as the second most important barrier to business growth in Afghanistan (Figure I.5). Other significant constraints include lack of skilled labor, inadequate infrastructure, and weak banking practices.9
9It is worth noting that the level of taxation was not mentioned as a barrier to private sector activity.
0 5 10 15 20 25 30 35
Figure I.5. Islamic Republic of Afghanistan: Survey of Barriers to Business Development, 2004 1/
(P ercent of entrepeneurs who acknowledged item as a barrier)
Antiqua ted buildings
Security
Co rruptio n
Obs o le te acco unting s ys tems
Inadequa te banking s ys tems
Inadequa te bus ines s infras truc ture
Lack o f te leco mmunica tio n s ys tems
Unavailability o f techno lo gies
No nco nduc ive co nditio ns fo r experts
Lack o f ne two rking with fo re ign bus ines s men
Lack o f experts
Source: Business Climate in Afghanis tan, Afghan-American Chamber of Commerce; based on interviews of 1000 entrepreneurs .
- 15 -
Indicator Afghanistan Region OECD
A. Starting a Business 1/Procedures (number) 1.0 7.9 6.5Time (days) 7.0 35.3 19.5Cost (percentage of income per capita) 52.8 39.7 6.8Min. capital (percentage of income per capita) 0.0 0.8 28.9
B. Hiring & Firing Workers 2/Difficulty of Hiring Index 67.0 37.6 30.1Rigidity of Hours Index 20.0 35.0 50.4Difficulty of Firing Index 30.0 42.5 27.4Rigidity of Employment Index 39.0 38.5 36.1Hiring cost (percentage of salary) 0.0 5.1 20.7Firing costs (weeks of wages) 4.0 75.0 35.1
C. Registering PropertyProcedures (number) 11.0 6.9 4.7Time (days) 252.0 124.0 32.2Cost (percentage of property value) 9.5 6.3 4.8
D. Getting Credit 3/Legal Rights Index 0.0 3.8 6.3Credit Information Index 0.0 1.8 5.0Public registry coverage (percentage adults) 0.0 0.1 7.5Private bureau coverage (percentage adults) 0.0 0.6 59.0
E. Protecting Investors 4/Disclosure Index 0.0 4.1 6.1Director Liability Index 0.0 4.6 5.1Shareholder Suits Index 2.0 6.4 6.6Investor Protection Index 0.7 5.0 5.9
F. Paying Taxes 5/Payments (number) 2.0 25.0 16.0Time (hours) 80.0 331.0 192.0Total tax payable (percentage of gross profit) 21.4 35.3 46.1
G. Trading Across BordersDocuments for export (number) ... 8.1 5.3Signatures for export (number) ... 12.1 3.2Time for export (days) ... 33.7 12.6Documents for import (number) 10.0 12.8 6.9Signatures for import (number) 57.0 24.0 3.3Time for import (days) 97.0 46.5 14.0
H. Enforcing ContractsProcedures (number) ... 29.7 19.5Time (days) 400.0 385.5 225.7Cost (percentage of debt) 24.0 36.7 10.6
I. Closing a Business 6/Time (years) No practice 4.2 1.5Cost (percentage of estate) No practice 7.3 7.4Recovery rate (cents on the dollar) 0.0 19.7 73.8
Source: The Investment Climate in Afghanistan. Exploiting Opportunities in an Uncertain Environment. The World Bank, 2005 (Annex C)
1/ Entrepreneurs can expect to go through one step to launch a business over seven days on average, at a cost equal to 52.8 percent of gross national income (GNI) per capita. No minimum deposit is required to obtain a business registration number. 2/ Each index assigns values between 0 and 100, with higher values representing more rigid regulations. The Rigidity of Employment Index is an average of the three indices. For Afghanistan, the overall index is 39. 3/ The Legal Rights Index ranges from 0 to 10, with higher scores indicating that those laws are better designed to expand access to credit. The Credit Information Index measures the scope, access, and quality of credit information available through public registries or private bureaus. It ranges from zero to six, with higher values indicating that more credit information is available from a public registry or private bureau. 4/ The index vary between 0 and 10, with higher values indicating greater disclosure, greater liability ofdirectors, greater powers of shareholders to challenge the transaction, and better investor protection. 5/ Entrepreneurs must make 2 payments, spend 80 hours, and pay 21.4 percent of gross profit in taxes. 6/ The recovery rate, expressed in terms of how many cents on the dollar claimants recover from the insolventfirm, is zero.
Table I.2. Islamic Republic of Afghanistan: Doing Business Survey, 2005
- 16 -
Institutions and Transparency
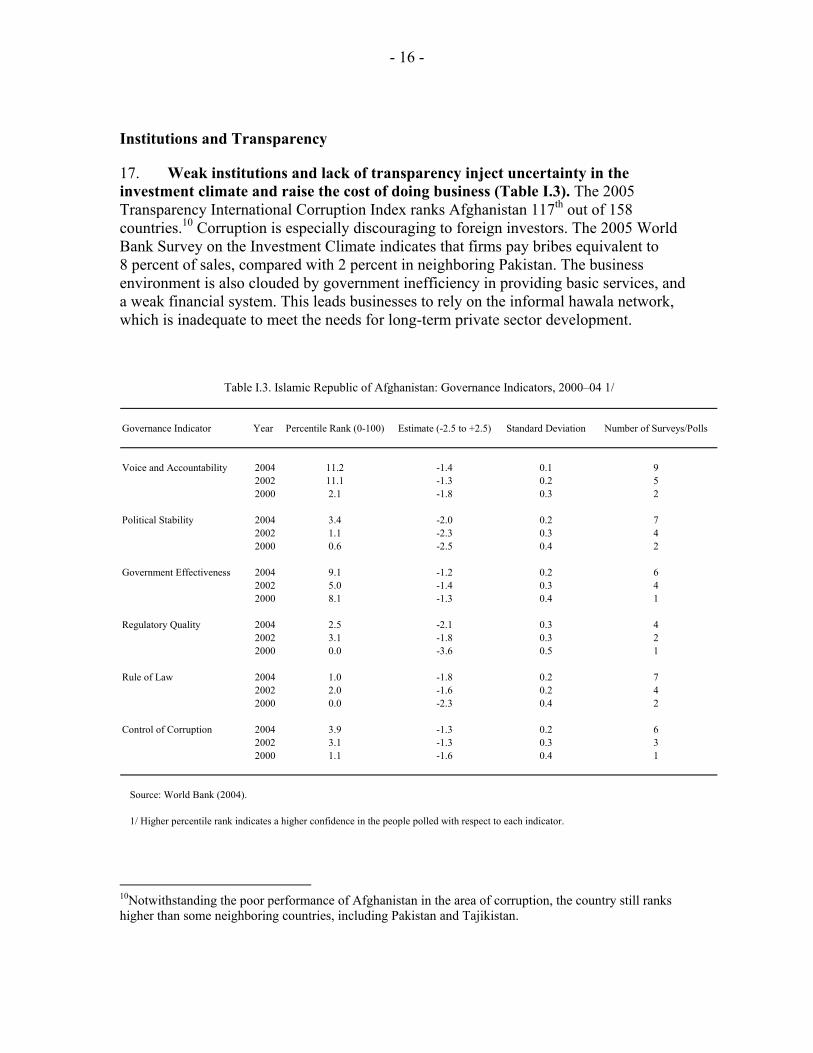
17. Weak institutions and lack of transparency inject uncertainty in the investment climate and raise the cost of doing business (Table I.3). The 2005 Transparency International Corruption Index ranks Afghanistan 117th out of 158 countries.10 Corruption is especially discouraging to foreign investors. The 2005 World Bank Survey on the Investment Climate indicates that firms pay bribes equivalent to 8 percent of sales, compared with 2 percent in neighboring Pakistan. The business environment is also clouded by government inefficiency in providing basic services, and a weak financial system. This leads businesses to rely on the informal hawala network, which is inadequate to meet the needs for long-term private sector development.
Governance Indicator Year Percentile Rank (0-100) Estimate (-2.5 to +2.5) Standard Deviation Number of Surveys/Polls
2004 11.2 -1.4 0.1 92002 11.1 -1.3 0.2 52000 2.1 -1.8 0.3 2
2004 3.4 -2.0 0.2 72002 1.1 -2.3 0.3 42000 0.6 -2.5 0.4 2
2004 9.1 -1.2 0.2 62002 5.0 -1.4 0.3 42000 8.1 -1.3 0.4 1
2004 2.5 -2.1 0.3 42002 3.1 -1.8 0.3 22000 0.0 -3.6 0.5 1
2004 1.0 -1.8 0.2 72002 2.0 -1.6 0.2 42000 0.0 -2.3 0.4 2
2004 3.9 -1.3 0.2 62002 3.1 -1.3 0.3 32000 1.1 -1.6 0.4 1
Source: World Bank (2004).
1/ Higher percentile rank indicates a higher confidence in the people polled with respect to each indicator.
Control of Corruption
Table I.3. Islamic Republic of Afghanistan: Governance Indicators, 2000–04 1/
Political Stability
Government Effectiveness
Regulatory Quality
Rule of Law
Voice and Accountability
10Notwithstanding the poor performance of Afghanistan in the area of corruption, the country still ranks higher than some neighboring countries, including Pakistan and Tajikistan.
- 17 -
Political and Security Environment
18. Political risks and security concerns are serious in Afghanistan. This makes it difficult to attract new investors. Over the past few months, there have been improvements in security, and the central government is gradually extending its control over the provinces. At the same time, the implementation of the Bonn Agreement has contributed to greater political stability, and the successful organization of presidential and legislative elections strengthened the institutional framework. Nonetheless, while security concerns do not fully prevent the entry of new businesses, they lead to more business spending. It is estimated that firms allocate 15 percent of their revenues to security infrastructure, compared with 2.2 percent in Pakistan and 1.9 percent in Uzbekistan (World Bank, 2005).
Infrastructure
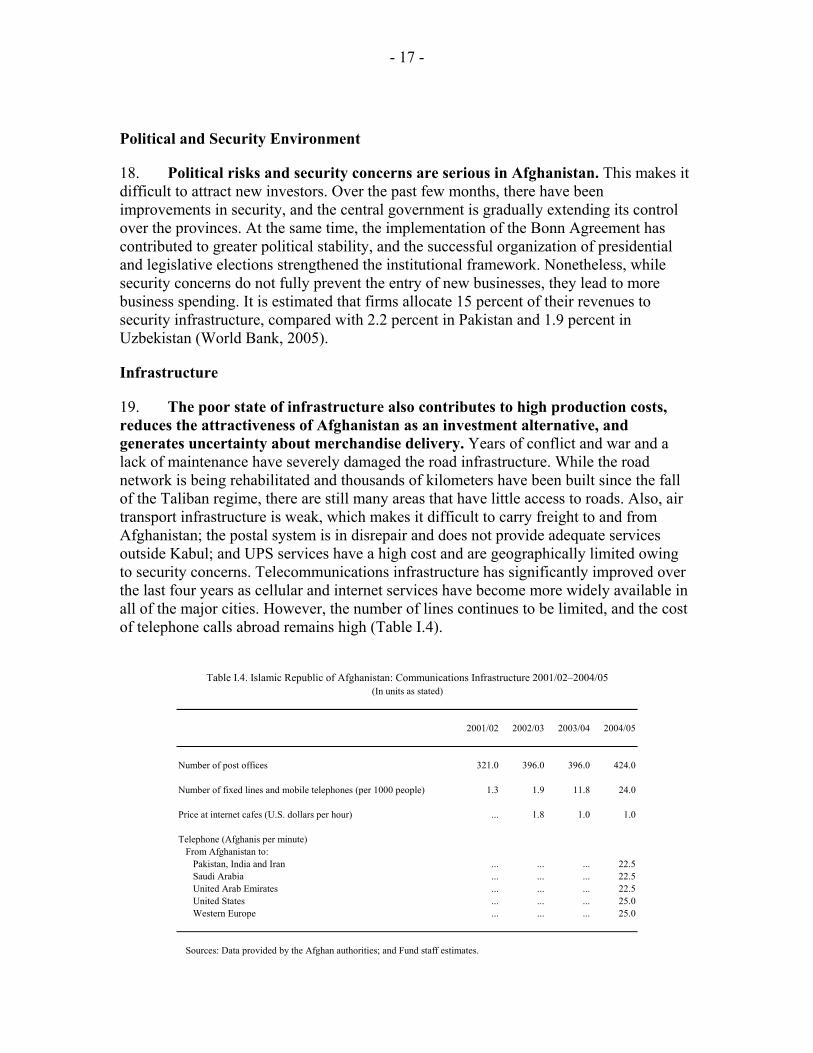
19. The poor state of infrastructure also contributes to high production costs, reduces the attractiveness of Afghanistan as an investment alternative, and generates uncertainty about merchandise delivery. Years of conflict and war and a lack of maintenance have severely damaged the road infrastructure. While the road network is being rehabilitated and thousands of kilometers have been built since the fall of the Taliban regime, there are still many areas that have little access to roads. Also, air transport infrastructure is weak, which makes it difficult to carry freight to and from Afghanistan; the postal system is in disrepair and does not provide adequate services outside Kabul; and UPS services have a high cost and are geographically limited owing to security concerns. Telecommunications infrastructure has significantly improved over the last four years as cellular and internet services have become more widely available in all of the major cities. However, the number of lines continues to be limited, and the cost of telephone calls abroad remains high (Table I.4).
2001/02 2002/03 2003/04 2004/05
Number of post offices 321.0 396.0 396.0 424.0
Number of fixed lines and mobile telephones (per 1000 people) 1.3 1.9 11.8 24.0
Price at internet cafes (U.S. dollars per hour) ... 1.8 1.0 1.0
Telephone (Afghanis per minute)From Afghanistan to:
Pakistan, India and Iran ... ... ... 22.5Saudi Arabia ... ... ... 22.5United Arab Emirates ... ... ... 22.5United States ... ... ... 25.0Western Europe ... ... ... 25.0
Sources: Data provided by the Afghan authorities; and Fund staff estimates.
Table I.4. Islamic Republic of Afghanistan: Communications Infrastructure 2001/02–2004/05(In units as stated)
- 18 -
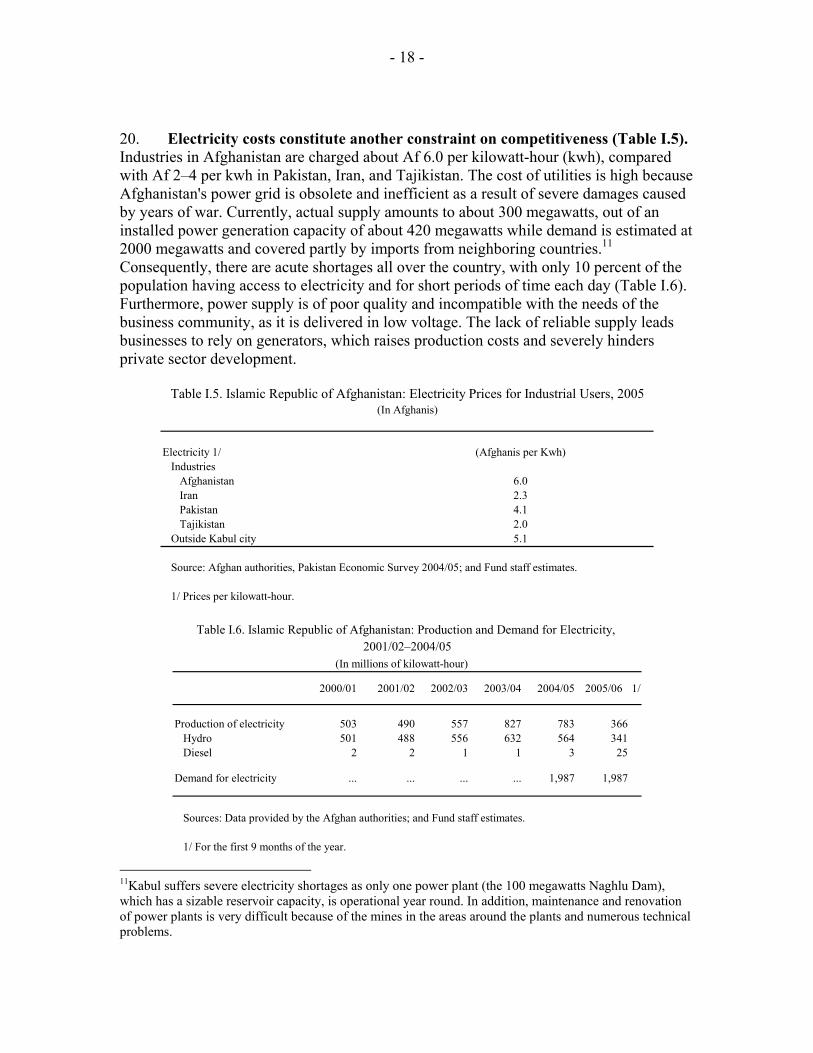
20. Electricity costs constitute another constraint on competitiveness (Table I.5). Industries in Afghanistan are charged about Af 6.0 per kilowatt-hour (kwh), compared with Af 2–4 per kwh in Pakistan, Iran, and Tajikistan. The cost of utilities is high because Afghanistan's power grid is obsolete and inefficient as a result of severe damages caused by years of war. Currently, actual supply amounts to about 300 megawatts, out of an installed power generation capacity of about 420 megawatts while demand is estimated at 2000 megawatts and covered partly by imports from neighboring countries.11 Consequently, there are acute shortages all over the country, with only 10 percent of the population having access to electricity and for short periods of time each day (Table I.6). Furthermore, power supply is of poor quality and incompatible with the needs of the business community, as it is delivered in low voltage. The lack of reliable supply leads businesses to rely on generators, which raises production costs and severely hinders private sector development.
Electricity 1/ (Afghanis per Kwh)Industries
Afghanistan 6.0Iran 2.3Pakistan 4.1Tajikistan 2.0
Outside Kabul city 5.1
1/ Prices per kilowatt-hour.
Source: Afghan authorities, Pakistan Economic Survey 2004/05; and Fund staff estimates.
Table I.5. Islamic Republic of Afghanistan: Electricity Prices for Industrial Users, 2005(In Afghanis)
2000/01 2001/02 2002/03 2003/04 2004/05 2005/06 1/
Production of electricity 503 490 557 827 783 366Hydro 501 488 556 632 564 341Diesel 2 2 1 1 3 25
Demand for electricity ... ... ... ... 1,987 1,987
Sources: Data provided by the Afghan authorities; and Fund staff estimates.
1/ For the first 9 months of the year.
Table I.6. Islamic Republic of Afghanistan: Production and Demand for Electricity,
(In millions of kilowatt-hour)2001/02–2004/05
11Kabul suffers severe electricity shortages as only one power plant (the 100 megawatts Naghlu Dam), which has a sizable reservoir capacity, is operational year round. In addition, maintenance and renovation of power plants is very difficult because of the mines in the areas around the plants and numerous technical problems.
- 19 -
Human Resources
21. Skilled labor is in shortage in Afghanistan. This is attributable to the protracted conflict, emigration of the country’s best trained people, and historical barriers to training women. This severely constrains firms from investing or expanding.
The Trade System
22. Although Afghanistan has made significant headway in facilitating trade, there are still a number of rigidities.12 Administrative barriers, ad hoc fees levied by local governments, cumbersome import and customs clearance procedures, weak standards and regulations, the absence of transparent competition policies, and limited progress on computerization continue to affect adversely the expansion of private sector activity. In addition, traders are faced with a lack of trade finance, cold storage facilities, and insurance.
D. External Competitiveness-Enhancing Measures
23. While the appreciation of the real exchange rate resulting from “Dutch disease” stemming from drug- and aid-related inflows is a significant factor, the relatively high production costs arising from rigid business practices, poor infrastructure, insufficient availability of power, and lack of transparency also weigh heavily on competitiveness.
24. The policy response to these issues does not lie in a change of the current stance of macroeconomic policy, which remains broadly appropriate. Fiscal policy should continue focusing on consolidation to reduce internal demand pressures and contain wage and price inflation. Foreign exchange intervention or a relaxation of monetary policy for the sole purpose of depreciating the exchange rate would likely prove counterproductive as it would lead to an increase in inflation and, ultimately, would not prevent a real appreciation.
25. Rather, productivity gains are central to improving Afghanistan’s competitiveness and will require comprehensive structural reforms and efficiency in utilizing external aid. In a context of close cooperation between policymakers and the business community, these reforms should seek to establish an enabling environment for private sector-led growth by further liberalizing the economy, promoting sound competition, and improving infrastructure. At the same time, better security conditions outside Kabul would help lower the cost of doing business and unlock investment opportunities.
12Beginning in 2004, the government introduced sweeping reforms to the tariff regime and customs administration. As a result, Afghanistan is one of the most open economies in the region. The IMF trade restrictiveness index ranks Afghanistan four on a scale of ten, significantly better than India (six), Pakistan (six), Iran (seven), and Uzbekistan (nine).
- 20 -
26. Some measures have already been put in place to enhance competitiveness, including a more simplified tax system, favorable labor practices, improved telecommunications, and an appropriate legal framework for corporatization. Nonetheless, as indicated in the I-ANDS, there is still significant scope for improvement, notably in the following areas:
• Further liberalizing the economy. This entails, in particular, a significant reduction of the government’s role in productive activities. In this regard, the authorities should accelerate the implementation of their plans for divesting the state-owned enterprises slated for privatization and liquidation. It will also be important to complete an inventory of the various public entities and government agencies engaged in commercial activities. The establishment of a sound underlying regulatory framework would be crucial for reaping the full efficiency and competitive gains from privatization.
• Creating adequate conditions for private sector activity. The cost of doing business can be brought down significantly through bold actions aimed at streamlining procedures for entry, further simplifying the tax system, improving contract enforcement, and enhancing transparency of government operations.
• Building a modern and resilient banking system. This requires the elimination of the current administrative and legal hurdles impeding the development of the banking sector. In this connection, the authorities should work closely with the donor, business, and banking communities to prioritize the enactment of a core group of laws, including legislation on secure transactions, business organizations and negotiable instruments, and they should also seek to improve tenure laws and regulations.
• Strengthening labor and factor market flexibility. The authorities should explore options to further strengthen labor market flexibility, including by harmonizing the current legislation. Opportunities to improve productivity through education, on-the-job training, skill upgrading, and dissemination of new knowledge and techniques should also be explored, as the lack of skilled staff significantly hinders investors in moving into activities with higher value added. At the same time, the authorities should put together a labor market information system to facilitate labor mobility.
• Strengthening the agricultural sector and building infrastructure networks. There is potential for expanding exports of agricultural goods and developing a new rural industry, one of the sectors identified by the authorities as having potential for diversification. However, this requires improved access to roads, availability of energy at a lower cost, and the development of transportation networks, and warehousing facilities. The authorities should continue to work closely with the donor community to address these issues.
• Strengthening the institutional framework and administrative processes underlying the trade regime. The authorities must work diligently to accelerate the computerization of customs, the establishment of a legal framework for sound
- 21 -
competition, and the introduction of standards and regulations consistent with international codes and agreements to facilitate an expansion of trade. At the same time, preparatory work should be stepped up to start discussions for World Trade Organization (WTO) membership. The latter would provide more predictability in trade relations with other countries, as well as access to the WTO dispute settlement apparatus and technical assistance.
• Improving the organization and management of export firms. Most of these firms are family-owned and managed by family members and associates. The lack of professionalism hinders expansion and results in poor organization and low productivity. Addressing this issue requires hiring professional managers and skilled labor, and putting in place modern organization methods.
• Enhancing regional cooperation. Afghanistan is a hub between Central and South Asia and the Middle and Far East. The reconstruction effort under way has been instrumental in expanding trade at the regional level. The authorities should continue to take advantage of the country’s location to boost trade and transit activities with neighboring countries. Membership in regional organizations would allow Afghanistan to benefit from economies of scale and lower costs of production.
- 22 -
References
Afghan-American Chamber of Commerce, 2003, “Business Climate in Afghanistan,”
Kabul. Afghanistan, Ministry of Agriculture, 2005, “Agriculture Prospects Report,”
Management and Policy Unit of the Ministry of Agriculture, Kabul, Islamic Republic of Afghanistan.
Agenor, Pierre-Richard, 1995, “Competitiveness and External Trade Performance of the
French Manufacturing Industry,” IMF Working Paper No. 95/137 (Washington: International Monetary Fund).
Balassa, Bela, 1964, “The Purchasing-Power-Parity Doctrine: A Reappraisal,”
Journal of Political Economy, Vol. 72. No 6, December, pp. 584-596. Guerguil, Martine and Martin Daniel Kaufman, 1998, “Competitiveness and the
Evolution of the Real Exchange Rate in Chile,” IMF Working Paper No. 98/58 (Washington: International Monetary Fund).
International Monetary Fund, 2005, “Staff Report for the 2005 Article IV Consultation
with Pakistan and Ex Post Assessment of Longer-Term Program Engagement,” IMF Country Report No. 05/408, Washington, DC
Maletta, Hector, 2003, “Seasonal Changes in Wage and Food Prices in Afghanistan,”
Management and Policy Unit of the Ministry of Agriculture, Kabul, Islamic Republic of Afghanistan.
Marsh, Ian W. and Stephen P. Tokarick, (1994), “Competitiveness Indicators: A
Theoretical and Empirical Assessment,” IMF Working Paper No. 94/29 (Washington: International Monetary Fund).
Miyajima, Ken, 2005, “Real Exchange Rate in Growing Economies: How Strong Is the
Role of the Nontradables Sector?,” IMF Working Paper No. 05/233 (Washington: International Monetary Fund).
Oomes, Nienke, 2005, “Maintaining Competitiveness Under Equilibrium Real
Appreciation: The Case of Slovakia,” IMF Working Paper No. 05/65 (Washington: International Monetary Fund).
Paiva, Claudio, 2001, “Competitiveness and the Equilibrium Real Exchange Rate in
Costa Rica,” IMF Working Paper No. 01/23 (Washington: International Monetary Fund).
- 23 -
Samuelson, Paul, 1964, “Theoretical notes on trade problems,” Review of Economics and Statistics 46: 145–154.
Turner, Philip and Van’ t Dack, Jozef, 1993, “Measuring International Price and Cost
Competitiveness,” Bank for International Settlements. Turner, Anthony G. and Golub, S. Stephen, 1997, “Towards a System of Multilateral
Unit Labor Cost-Based Competitiveness Indicators for Advanced, Developing, and Transition Countries,” IMF Working Paper No. 97/151 (Washington: International Monetary Fund).
Transparency International (2004), “Corruption Perceptions Index,” online database
available at http://www.transparency.org/cpi/2004/cpi2004.en.html#cpi2004 World Bank (2005), “Doing Business 2005,” online database available at
http://rru.worldbank.org/DoingBusiness —— (2005), “The investment Climate in Afghanistan: Exploiting Opportunities in an
Uncertain Environment,” Finance and Private Sector Development Unit, South Asia Region. Washington, DC, December 2005
Zanello, Alessandro and Dominique Desruelle, 1997, “A Primer on IMF’s Information
Notices System,” IMF Working Paper No. 97/71 (Washington: International Monetary Fund).
- 24 -
II. REBUILDING DOMESTIC REVENUE IN AFGHANISTAN 1
A. Introduction and Overview of the Current Revenue System
1. Sustaining the rapid growth of revenue is critical to achieving fiscal sustainability. With revenue excluding grants expected to reach 5.3 percent of non-opium GDP in 2005/06, including 3.6 percent of GDP in tax and customs revenue, Afghanistan has one of the lowest rates of collection in the world. Nonetheless, this rate represents a significant improvement (a 185 percent increase in U.S. dollar terms) from 2002/03, when domestic revenue totaled 3.2 percent of GDP. The task of rebuilding revenue is complicated by the collapse in formal economic activity and administrative capacity in the aftermath of Afghanistan’s prolonged conflict.
2. The government’s objective is to mobilize sufficient revenue to cover a large share of public expenditures. In 2004/05, domestic revenues amounted to less than half of core budget operating expenditures (predominantly employee compensation) and an estimated 28 percent of total recurrent expenditures, including items currently in the external budget (essentially off-budget), such as the Afghan National Army. The benchmark in the Interim Afghanistan National Development Strategy (I-ANDS) discussed with donors in January 2006, is to raise domestic revenue to at least 8 percent of GDP by 2010/11. This would cover the whole of the operating budget (as currently defined) and an estimated 58 percent of total recurrent expenditures. Box I.1 of the staff report provides a fuller discussion of this benchmark.
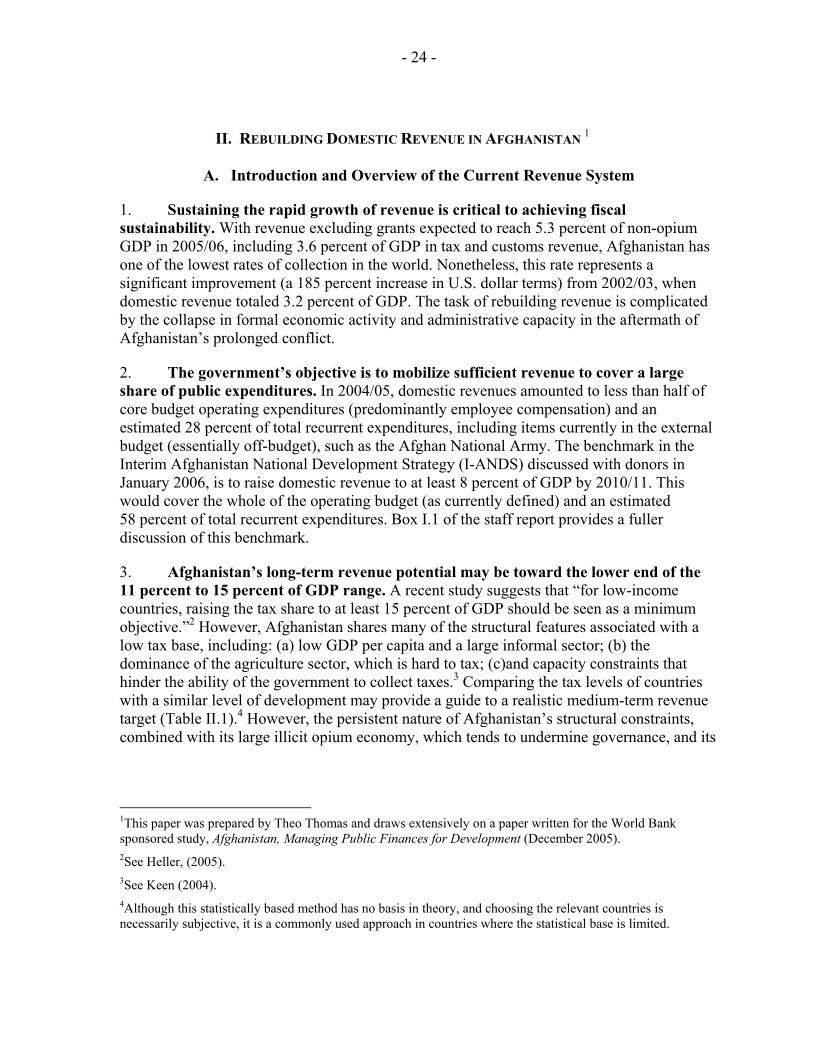
3. Afghanistan’s long-term revenue potential may be toward the lower end of the 11 percent to 15 percent of GDP range. A recent study suggests that “for low-income countries, raising the tax share to at least 15 percent of GDP should be seen as a minimum objective.”2 However, Afghanistan shares many of the structural features associated with a low tax base, including: (a) low GDP per capita and a large informal sector; (b) the dominance of the agriculture sector, which is hard to tax; (c)and capacity constraints that hinder the ability of the government to collect taxes.3 Comparing the tax levels of countries with a similar level of development may provide a guide to a realistic medium-term revenue target (Table II.1).4 However, the persistent nature of Afghanistan’s structural constraints, combined with its large illicit opium economy, which tends to undermine governance, and its
1This paper was prepared by Theo Thomas and draws extensively on a paper written for the World Bank sponsored study, Afghanistan, Managing Public Finances for Development (December 2005). 2See Heller, (2005). 3See Keen (2004). 4Although this statistically based method has no basis in theory, and choosing the relevant countries is necessarily subjective, it is a commonly used approach in countries where the statistical base is limited.
- 25 -
Cou
ntry
/reg
ion
GD
P Pe
r Cap
ita
(US$
) 1/
Tota
l R
even
ueTo
tal t
ax
Rev
enue
Tota
lC
orpo
rate
Pers
onal
Tota
lG
ener
al S
ales
, Tu
rnov
er o
r VA
TEx
cise
sTr
ade
Oth
er
Afg
hani
stan
(200
4/05
est
.)23
34.
53.
40.
30.
20.
10.
40.
2na
2.
50.
1
Sub-
Saha
ran
Afr
ica
765
19.7
15.9
3.9
1.9
1.3
7.9
5.5
2.2
1.9
2.2
Asi
a an
d Pa
cific
1,44
716
.613
.24.
62.
92.
05.
32.
71.
92.
11.
2Lo
w-in
com
e co
untri
es...
18.0
14.9
3.9
21.
95.
93.
52.
03.
71.
4Lo
w- m
iddl
e in
com
e co
untri
es...
21.8
15.8
3.8
1.8
2.1
6.3
4.8
2.1
3.6
2.1
Non
-OEC
D a
vera
ge
......
15.2
4.5
2.1
2.2
10.1
4.9
23.
1...
Sele
cted
cou
ntri
es a
vera
ge
17.4
14.3
4.7
3.0
1.4
6.3
3.2
2.0
1.9
1.6
Pa
kist
an
420
16.4
12.4
3.0
2.7
0.5
4.7
2.3
2.4
3.6
1.2
Ir
an1,
700
20.5
8.6
3.3
2.2
1.1
1.8
0.1
1.4
3.2
0.3
In
dia
470
18.5
14.3
2.8
1.5
1.2
8.1
0.0
3.2
2.6
0.8
K
azak
hsta
n1,
520
22.3
18.4
5.4
1.7
2.0
6.2
4.0
0.5
0.6
6.2
K
yrgy
z R
epub
lic29
019
.115
.03.
21.
11.
511
.15.
42.
10.
70.
0
Aze
rbai
jan
710
20.5
19.4
5.0
1.9
1.5
8.2
3.4
1.5
1.5
4.7
U
gand
a24
011
.510
.71.
8...
...4.
81.
23.
71.
82.
3
Rw
anda
...10
.49.
32.
7...
...5.
0...
...1.
6...
Sour
ce:
Gov
ernm
ent F
inan
ce S
tatis
tics (
IMF)
Figu
res r
efer
to c
ount
ry a
vera
ges f
or 1
997-
2001
, whe
re d
ata
are
avai
labl
e.1/
Cou
ntry
dat
a re
fer t
o G
NI p
er c
apita
(Wor
ld B
ank)
Tab
le II
.1. C
entr
al G
over
nmen
t Rev
enue
s by
Gro
up(in
per
cent
of G
DP)
Tax
es o
n In
com
e Pr
ofits
and
Cap
ital
Gai
nsD
omes
tic T
axes
on
Goo
ds a
nd S
ervi
ces
- 26 -
historical record of low tax collection—in the 1970s revenue was around 7 percent of GDP—reinforce the view that the country’s tax potential is likely to be toward the lower end of the revenue-to-GDP ratio in other developing countries.5
4. The current revenue policy broadly reflects Fund recommendations, but a large gap between actual revenue and estimated tax potential suggests that Afghanistan needs to drastically improve its tax administration. In Afghanistan, enforcement mechanisms are weak and compliance rates extremely low. International experience suggests that the larger the tax gap, the more radical the required administration reforms.6 With a tax gap of more than 40 percent, Afghanistan should adopt a comprehensive reform strategy involving a complete revamping of tax administration to obtain significant improvements in compliance.
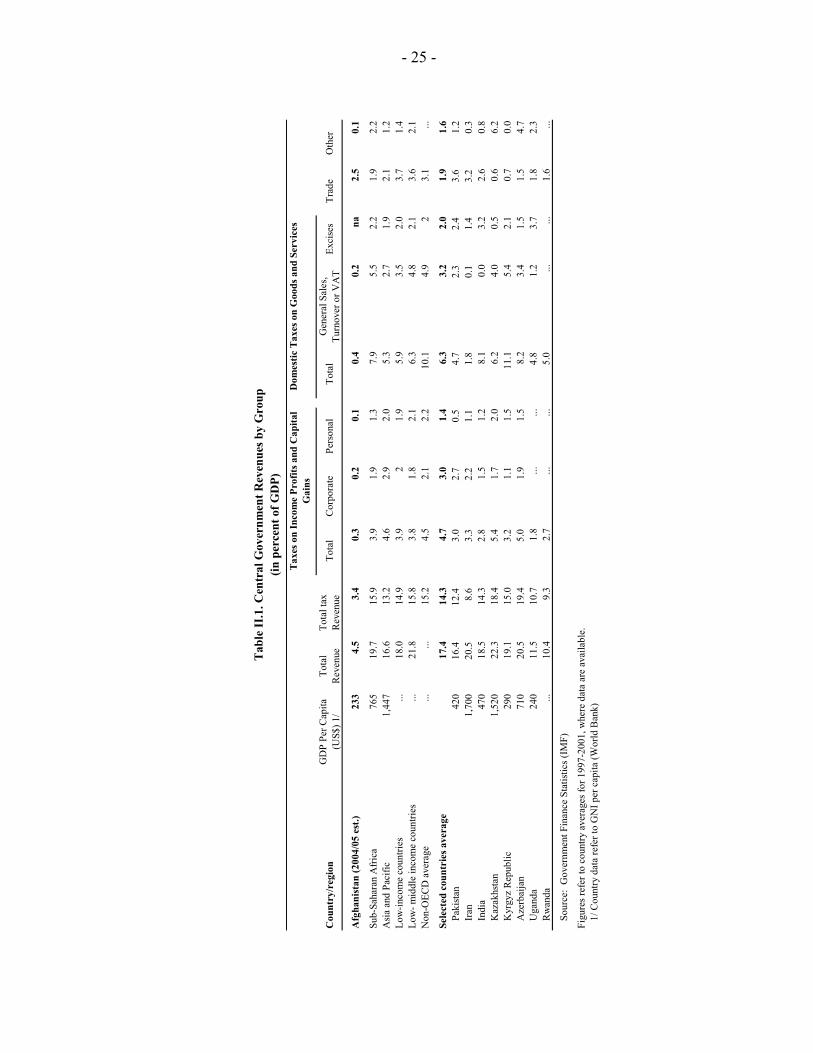
5. Revenue is concentrated in a small number of taxes. As in many less developed and particularly post-conflict economies, import duties constitute the main source of revenue, comprising over 50 percent of total receipts (Figure II.1), because they are relatively easy to monitor and collect. This pattern is not significantly different from that of the mid-1970s, when around 78 percent of tax revenue was derived from trade taxes.7 Box II.1 summarizes the major sources of revenue in Afghanistan.
5See World Bank report, “Afghanistan: The Journey to Economic Development”, March 17, 1978.
6See Baer and Silvani’s (1997) review of tax administration reforms.
7See World Bank report, “Afghanistan: The Journey to Economic Development,” March 17, 1978.
Figure II.1. Structure of Revenue, 2004/05 (In percent of total revenue excluding grants)
Other non tax
revenue5%
Other taxes2%
Administrative fees and charges
20%
Domestic taxes on goods and services
9%
Taxes on income and profits 8%
International trade taxes56%
- 27 -
Box II.1. Summary of Major Sources of Revenue in Afghanistan Appendix I details the current structure of taxation, which can be summarized as follows:
Customs duties constitute the largest source of revenue in Afghanistan, as in many developing countries, largely because they are relatively simple to administer. While domestic taxes tend to grow in importance as countries develop, with consumption-based taxes eventually taking on the primary revenue raising role, they are more difficult to administer and their development constitutes a long-term objective for Afghanistan. In the interim, the average import tariff rates should be kept relatively low, in line with the main trading partners, and with a limited dispersion to reduce arbitrary and excessive effective rates of protection, as well as to minimize incentives for corruption. Recent reforms to Afghanistan’s tariff schedule, in 2004, are in line with these principles.
Export taxes should generally be avoided, since they tend to cause a shift in resources away from the export sector toward less efficient uses, thus compromising growth objectives. Recent tax reforms in Afghanistan have significantly lowered the tax rates for exporters. Following the introduction of the new tariff regime, the Business Receipts Tax (BRT) rate for importers and exporters was set at 0 percent. In addition, the fixed tax on importers and exporters was lowered to 0.5 percent for 2004/05.
Income Taxes should ideally be levied on a global basis and on all forms of income. The corporate and top personal tax rates have been aligned at 20 percent, which is relatively low by international standards. To improve compliance, new collection enforcement powers and penalty provisions were approved in 2005 along with the restoration of the wage withholding tax. The level of personal income tax exemption has been set to effectively remove most civil servants from taxation (which should ensure a progressive system). However, tax brackets need to be regularly reviewed, particularly when inflation is high, in order to maintain the desired link to relative incomes.
Sales taxes should be simple to administer and broad-based on final domestic consumption. Afghanistan currently has a complex and cascading system based on turnover (BRT) and numerous presumptive (fixed) taxes for smaller traders, which is far from ideal. While a single rate value-added-tax (VAT), with crediting provisions and zero-rating of exports, is one of the most efficient taxes, it is administratively too complex to implement at this time. Over the medium-term, Afghanistan should expand the current system toward a more broad-based consumption tax that avoids cascading.
Excise taxes. There are currently no excise taxes in Afghanistan, but they are being considered in the 2006/07 budget for items such as tobacco, fuel and vehicles.
6. There are a large number of small “nuisance” taxes. With around 90 different active taxes—half of which generated less than $21,000 in 2004/05—it is highly likely that the administrative costs of some of them outweigh their revenue gains. The income tax law, which has been in force since 1964, provides for a variety of taxes, usually referred to as fixed taxes, including presumptive taxes on small businesses as well as the cascading turnover tax known as the BRT. The law also identifies 170 tax categories of business establishments. Although some of these taxes serve a useful purpose of broadening the tax base to small businesses and the BRT may form the basis of a future consumption tax, removing many of the smaller nuisance taxes and simplifying the tax collection system is
- 28 -
likely to be cost-effective and should help promote the private sector activities. The revised income tax law approved in 2005, changed the income component of the law, but did not address the smaller nuisance taxes.
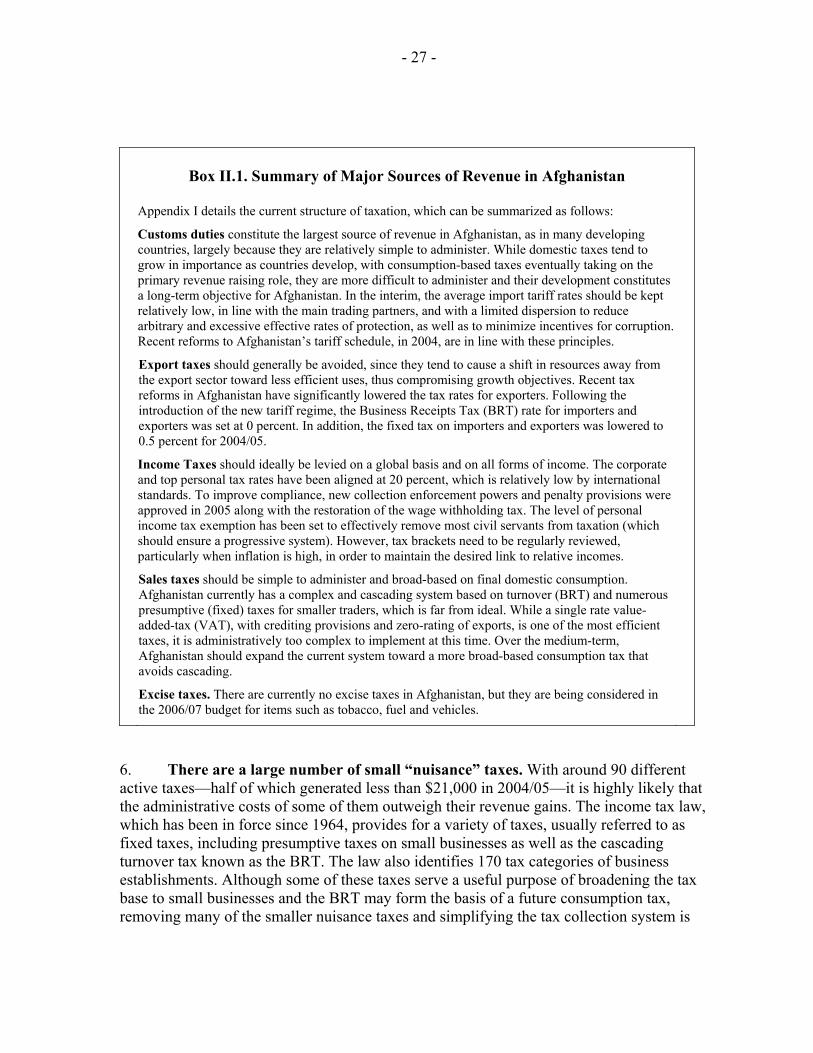
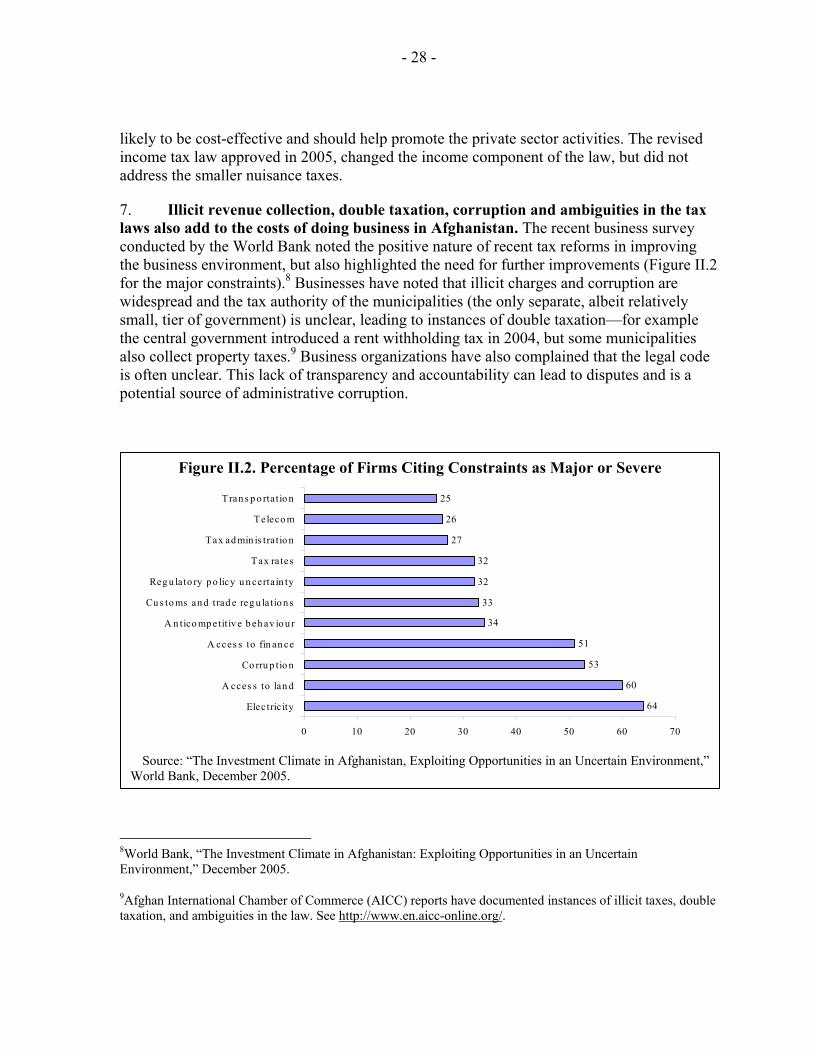
7. Illicit revenue collection, double taxation, corruption and ambiguities in the tax laws also add to the costs of doing business in Afghanistan. The recent business survey conducted by the World Bank noted the positive nature of recent tax reforms in improving the business environment, but also highlighted the need for further improvements (Figure II.2 for the major constraints).8 Businesses have noted that illicit charges and corruption are widespread and the tax authority of the municipalities (the only separate, albeit relatively small, tier of government) is unclear, leading to instances of double taxation—for example the central government introduced a rent withholding tax in 2004, but some municipalities also collect property taxes.9 Business organizations have also complained that the legal code is often unclear. This lack of transparency and accountability can lead to disputes and is a potential source of administrative corruption.
8World Bank, “The Investment Climate in Afghanistan: Exploiting Opportunities in an Uncertain Environment,” December 2005.
9Afghan International Chamber of Commerce (AICC) reports have documented instances of illicit taxes, double taxation, and ambiguities in the law. See http://www.en.aicc-online.org/.
Figure II.2. Percentage of Firms Citing Constraints as Major or Severe
64
60
53
51
34
33
32
32
27
26
25
0 10 20 30 40 50 60 70
Electric ity
A cces s to lan d
Co rru p tio n
A cces s to fin an ce
A n tico mp etit iv e b eh av io u r
Cu s to ms an d trad e reg u la tio n s
Reg u lato ry p o licy u n certain ty
Tax ra tes
Tax ad min is tratio n
Teleco m
Tran s p o rtatio n
Source: “The Investment Climate in Afghanistan, Exploiting Opportunities in an Uncertain Environment,”
World Bank, December 2005.
- 29 -
B. Revenue Policy and Administration
8. The ideal tax system is designed to raise revenue required to achieve a sustainable fiscal position while being fair, transparent, and minimizing distortions.10 In order to help promote a vibrant private sector, the tax system should; (a) minimize interference with individual consumption, saving and investment decisions; (b) be relatively simple, transparent, and rules-based to encourage compliance with the limited available capacity and discourage corruption; and (c) be stable and predictable to reduce the economic costs of uncertainty.
9. There is often a trade-off between short-term revenue mobilization needs and economic efficiency. Given the limited options and administrative capacity available for generating revenues, post-conflict countries often have to implement taxes that are less desirable from an efficiency standpoint, or move only gradually in restructuring the distortionary taxes already in place. For example, in most post-conflict countries, revenue mobilization relies heavily on import duties and on collecting sales and excise taxes only at the border, especially when there are relatively few major border control points. There are even cases where export taxes have been implemented because of the inability to collect at the production stage or implement an income tax, and when the product is largely exported.11 While taxing imported goods may not be ideal from an efficiency point of view, it can be argued that, with limited domestic production, imports account for a very high proportion of consumption and that the system can form the basis of an eventual move towards a more standard and efficient consumption tax.
10. Afghanistan has adopted some of the lowest trade and corporate tax rates in the region. Reforms introduced in 2004 rationalized the former 25 tariff bands, ranging from 7 percent to 150 percent, to 6 bands with a top rate of 16 percent and an average tariff of around 4 percent (see staff report for the 2004 Article IV consultation, IMF Country Report No. 05/33). The corporate income tax rate was also reduced from 25 percent to 20 percent of net taxable income, and in 2004 generous depreciation and loss carry forward provisions replaced an inefficient system of tax holidays and exemptions (see below). Cross-country comparisons are difficult, but corporate tax rates in Pakistan range from 35 percent to 50 percent, the Islamic Republic of Iran charges a flat rate of 25 percent, the rate in China is 30 percent and the rate in India is 36.8 percent for domestic companies, with a more complex schedule for foreign companies.
11. Future reforms of the tax system need to take into account the country’s limited administrative and technical capacity. Any proposal needs to balance the need for additional revenue against the objective of developing a vibrant private sector. Consequently, 10See Tanzi and Zee, 2001.
11Export taxes were introduced in Liberia, Tajikistan, and Timor-Leste after their conflicts. They were viewed as temporary, to be phased out as other sources of income became available. See Gupta, (2005).
- 30 -
the authorities are considering proposals for a more uniform tariff structure, removing taxes on exports, introducing a set of selected excises, and moving towards a broad-based tax on final consumption. In the interim, the cascading Business Receipt Tax (BRT) will have to be maintained, as it constitutes around 70 percent of sales tax receipts, but ideally it should be at relatively low rates to minimize distortions (although with little domestic production and few large firms, the degree of cascading is relatively limited). These proposals are broadly in line with those of private sector groups, who also emphasize the need for further simplification of the tax system and a reduction in the number of nuisance taxes and cumbersome procedures.
12. Revenue administration reform is crucial for effective tax policy implementation. In designing Afghanistan’s strategy for revenue mobilization, consideration should be given to the very weak state of institutions and the extremely limited capacity of the administration to implement policies after the end of the conflict—as reflected in the large tax gap. Tax policy needs to provide a suitably modern framework within which tax administration can be built. Experience suggests the following guiding principles for administrative reform: 12
• reduce the complexity of the tax system by reducing the number of taxes, harmonizing rates, removing exemptions, and eliminating elicit charges and double taxation;
• encourage taxpayers’ voluntary compliance with new, simplified self-assessment procedures, and improve taxpayer education;
• differentiate taxpayers by their revenue potential, including through the creation of a Large Taxpayer Office (LTO) and risk management strategies; and
• ensure effective management of the reform.
13. The customs and tax authorities have adopted five-year reform plans through 2007 and 2008, respectively. The revenue-raising function is located within the Ministry of Finance (MoF). Responsibilities are divided between the Afghanistan Customs Department (ACD) and the General Presidency of Revenue (GPR), both of which report to a Deputy Minister. The ACD is historically a more distinct administrative entity, with functions that include collection and the management of a customs service. The GPR has traditionally been in charge of domestic taxation policy, with the provincial Treasury offices (Mustofiats) collecting the taxes. The ACD and GPR reform plans have been designed and are being implemented with the support of considerable external technical assistance.
14. Efforts to include the private sector and donors in the revenue modernization program should contribute to enhancing implementation. Many of the policy and administrative reforms adopted in 2004 and early 2005 were implemented with limited 12From Baer and Silvani (1997) and Gupta, (2005).
- 31 -
consultation with the private sector. This occasionally resulted in confusion and uncertainty over specific policies and taxes—for example, the revised tariff schedule introduced in January 2004 had to be temporarily suspended and revised owing to the opposition from the business community. The dialogue has since improved, and in November 2005 the MoF and the Afghanistan Investment Support Agency (AISA) jointly hosted a conference to discuss tax policy and administrative reforms with the business community and donors. Joint government-business working groups were formed to prepare proposals for priority reforms, such as the simplification of the tax structure and the introduction of a consumption tax to replace the BRT. The MoF is also producing taxpayer education guides and public rulings to enhance transparency.
15. Customs administration reform will continue to dominate the revenue mobilization effort over the medium term. During 2004, the ACD implemented measures to: (a)simplify the tariff system, including the use of market exchange rates for import valuation and the transfer of responsibility for customs valuations from the Ministry of Commerce (MoC) to the MoF; (b)introduce simplified customs clearance documentation and procedures, including a monitoring system for duty exempt imports, notably aid-related; and (c)establish an effective system of customs brokers to facilitate a speedier and more robust transit process (the brokerage system is designed to expedite the clearance process but needs to be carefully supervised to ensure that it does not create additional administrative barriers). A modern customs code was promulgated, after some delay, in March 2005.
16. Ongoing reforms in the customs area include: (a) new regulations and procedures to implement the new customs code should be completed in 2006 produced; (b) customs infrastructure will continue to be upgraded throughout the country, supported by USAID, the World Bank and the European Commission (new facilities have already been completed at the major customs posts near the Pakistan and Iran borders); (c) a computerized recording and management system (Automated System for Customs Data, [ASYCUDA]) will be gradually introduced over the next few years (starting with key border posts in 2006/07); (d) human capacity in the central and regional customs offices will be reorganized and rebuilt, which should reduce corruption; and (e) mobile customs teams and customs police were introduced in 2005 to ensure effective enforcement, combined with an effort to reduce a plethora of reported illegal charges.
17. Implementation of these measures will be gradual because of the severe physical and human capacity constraints. The World Bank’s Doing Business 2005 survey noted a number of impediments to trade, including the use by customs officials of wide discretion in implementing valuation and inspection procedures, which leads to delays and corruption. Despite a welcome reduction in illicit charges and road blocks, the survey reported that it takes 11 days for imported goods to clear customs (without a bribe), a period slightly longer than in Pakistan, and considerably longer than in other neighboring countries. Nonetheless, substantial progress is being made to simplify customs administration and make the process more transparent. This complements the efforts being made to create a well equipped and professional customs service, which are being supported by a number of donors.
- 32 -
18. Developing a broader tax base will take time; in the short term the focus will be on the larger taxpayers. Tax reforms have had to be selective as the administrative apparatus in the provincial Mustofiats was even weaker than that of customs. The decision was taken to create a central LTO to focus scarce resources on the most effective revenue sources and overcome the lack of capacity (see below). A tax reform package was approved by the President in June 2004, which included the reintroduction of a wage withholding tax; the introduction of a BRT tax on selected ‘high-value’ services, such as restaurants and hotels; a reduction in the corporate tax rate from 25 percent to 20 percent; and a new rent withholding tax.13 In 2004, a Taxpayer Identification Number (TIN) was introduced which has been progressively rolled out to the major provincial centers.
19. The implementation of the tax reform package and the consolidation of tax legislation was severely delayed. The amendments to the income tax law, which included the tax package and addressed the excessive use of tax holidays, exemptions and special agreements, were eventually promulgated in June 2005, having been delayed by the backlog of new laws. A new income tax law, which includes provisions to strengthen administration under the GPR, introduces enforcement powers and includes provisions for the taxation of minerals, was eventually approved in November 2005. While a new comprehensive income tax code is being developed, delays in promulgating the previous reforms created considerable uncertainty amongst both taxpayers and the administration, reportedly hindering collections over the past 18 months. To enhance transparency, the government has established a program to improve the guidance provided to the private sector (including some discussion forums) and to tax administrators. A tax manual should be published in 2006/07.
20. The focus on large taxpayers is likely to significantly enhance revenues. Many countries have found that a small number of taxpayers (perhaps 5 percent) may account for 75 percent or more of the total tax collection (Table II.2). This approach has been adopted in many post-conflict countries (e.g. Albania, Kosovo, Liberia, Serbia and Montenegro, Timor-Leste, and West Bank and Gaza). In Afghanistan, the case for establishing a dedicated LTO to monitor, audit, and enforce collection for large taxpayers is heightened by the low level of compliance and extremely weak administrative capacity.
21. LTOs can help to pioneer administration reforms by piloting new systems and procedures. Afghanistan established a LTO in 2004 using transparent criteria to select the largest taxpayers (see Box II.2). However, a fully functional LTO requires a high degree of preparation and training to build capacity and establish more efficient procedures. The LTO needs to develop specialist capacity in tax auditing and to reorient its own business practices to facilitate voluntary compliance with new procedures like self-assessment, using enforcement mechanisms only when necessary. To take advantage of the latest reforms and the enhanced professionalism of the LTO staff, many large businesses are expected to deal increasingly with the LTO and to move away from the Mustofiats, where knowledge and capacity to apply the new laws is limited and corruption is reportedly endemic.
13See Appendix I for details of the specific taxes.
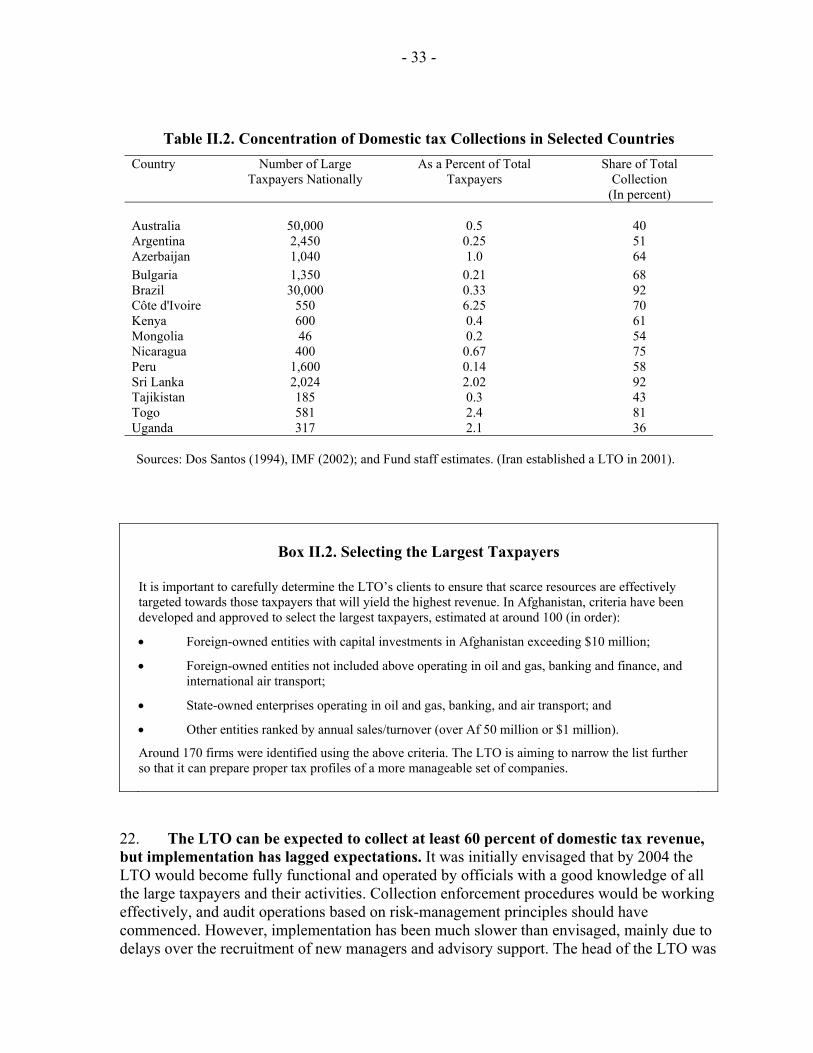
- 33 -
Table II.2. Concentration of Domestic tax Collections in Selected Countries Country Number of Large
Taxpayers Nationally As a Percent of Total
Taxpayers Share of Total
Collection (In percent)
Australia
50,000
0.5
40
Argentina 2,450 0.25 51 Azerbaijan 1,040 1.0 64 Bulgaria 1,350 0.21 68 Brazil 30,000 0.33 92 Côte d'Ivoire 550 6.25 70 Kenya 600 0.4 61 Mongolia 46 0.2 54 Nicaragua 400 0.67 75 Peru 1,600 0.14 58 Sri Lanka 2,024 2.02 92 Tajikistan 185 0.3 43 Togo 581 2.4 81 Uganda 317 2.1 36
Sources: Dos Santos (1994), IMF (2002); and Fund staff estimates. (Iran established a LTO in 2001).
Box II.2. Selecting the Largest Taxpayers
It is important to carefully determine the LTO’s clients to ensure that scarce resources are effectively targeted towards those taxpayers that will yield the highest revenue. In Afghanistan, criteria have been developed and approved to select the largest taxpayers, estimated at around 100 (in order):
• Foreign-owned entities with capital investments in Afghanistan exceeding $10 million;
• Foreign-owned entities not included above operating in oil and gas, banking and finance, and international air transport;
• State-owned enterprises operating in oil and gas, banking, and air transport; and
• Other entities ranked by annual sales/turnover (over Af 50 million or $1 million).
Around 170 firms were identified using the above criteria. The LTO is aiming to narrow the list further so that it can prepare proper tax profiles of a more manageable set of companies.
22. The LTO can be expected to collect at least 60 percent of domestic tax revenue, but implementation has lagged expectations. It was initially envisaged that by 2004 the LTO would become fully functional and operated by officials with a good knowledge of all the large taxpayers and their activities. Collection enforcement procedures would be working effectively, and audit operations based on risk-management principles should have commenced. However, implementation has been much slower than envisaged, mainly due to delays over the recruitment of new managers and advisory support. The head of the LTO was
- 34 -
eventually appointed in 2005, but taxpayer profiles are still being compiled for some important clients, such as the airlines. It is important that the LTO now focuses on introducing the more significant reforms, such as self-assessment and tax audit, which will facilitate better compliance from its core clients.
23. Moving to a broad-based consumption tax would remove some of the more serious deficiencies of the current indirect tax system. The current weaknesses of the BRT include: (a) a narrow tax base leading to low revenue yield; (b) serious potential cascading (albeit at generally low rates with few steps)14 and (c) disincentives to export. The authorities are considering proposals to address these problems over the medium term by moving toward a broad-based sales tax at the manufacturing level, perhaps within 3–5 years, as an intermediate step before adopting something like a value-added tax (VAT). A working group with private sector representatives has been formed by the MoF to develop proposals for the introduction of a consumption based tax.
24. A broad-based consumption tax is hampered by capacity constraints. The VAT, which is imposed by governments in more than 100 countries around the world, is the most common form of consumption tax. The basic characteristics of a VAT are that all persons or businesses that are engaged in the supply of taxable goods and services throughout the production and marketing chain are required to register for the VAT and charge VAT on all taxable sales. However, introduction of a VAT represents a radical reform of the tax system and is constrained by the non-existence or low level of record keeping and accounting, in addition to severe administrative capacity constraints. Thus a retail level VAT will need to part of a longer-term strategy.
25. A single-stage sales tax at the manufacturing level may be a simpler option and could be operated in conjunction with taxes on selected services and excises. The phased extension of the recently introduced taxes on selected services could pave the way for the development of a broader-based consumption tax, as administrative capacity permits. A manufacturing sales tax is applied at the point where goods are first sold in the case of domestically produced goods, and at the point of customs clearance, in the case of imported goods. A single tax rate applicable to all goods would be simpler to administer and would not distort relative prices. A single-stage manufacturers sales tax has been employed in many countries, particularly in the earlier stages of their tax development, and can be expanded to further trade levels with a minimum of disruption.
Taxation and Investment Incentives
26. In 2002, the government introduced a new investment incentive law containing a number of generous tax provisions. The law allowed for tax holidays (both for income and business receipts taxes) for qualified investments by both domestic and foreign investors, for periods ranging from four to eight years from the date of licensing, or three to seven years 14 Tax cascading occurs when the tax at one stage of production or distribution is included, at a later stage, in the price on which further tax is imposed.
- 35 -
from the start of production, whichever came first. Almost 6,000 licenses were granted by the MoC, without much scrutiny, before approvals were centralized in Kabul under a new organization, the AISA, a corporation under the control of the MoC. The main concerns raised by these tax incentives included:
• By exempting profits irrespective of their amount, tax holidays tend to benefit investors expecting a high rate of return, who probably would have invested even if the absence of incentives;
• Tax holidays provide strong incentives for tax avoidance, as taxed enterprises could enter into economic relationships with exempt ones to shift their profits to the latter through transfer pricing. The duration of tax holidays is also prone to abuse;
• Time-bound tax holidays tend to attract, if they have any impact at all, short-run projects, which are typically less beneficial to the economy and could even be a disincentive to long-term investment in the absence of loss-carry forward provisions. In the case of Afghanistan, over 40 percent of tax holidays granted before mid-2004 were reportedly awarded to construction companies, which should not benefit from such incentives.
• The revenue cost to the budget is seldom transparent, unless enterprises are required to file proper tax returns and the aggregate fiscal “loss” is calculated. Conservative estimates published by the MoF put the revenue loss resulting from the exemptions and concessions granted prior to July 2004 at $14.6 million in 2003/04, equivalent to 6 percent of revenue, and at $30.2 million from 2002–04.
27. The system of tax holidays and exemptions was replaced in 2005 with less distortionary investment incentives. In addition to the aforementioned concerns, it was acknowledged that revenue measures are best consolidated within the appropriate tax laws. The Income Tax Law was amended in 2005 to provide two types of tax incentives: accelerated depreciation; and unlimited loss carry-forward. Since merely accelerating the depreciation of an asset does not increase the total allowable nominal depreciation beyond its original cost, little distortion in favor of short-lived assets is generated. Neither is there much incentive for an enterprise to engage in profit shifting noted above. Companies were allowed to retain the tax holidays granted before June 2004 under the previous law if they could prove that they had fully complied with all the related regulatory requirements. However, few, if any, companies had filed their annual accounts, as required by the corporate law, which nullified their right to retain such privileges.
Tax Treatment of the Petroleum and Mining Sectors
28. Mineral exploitation is a potentially significant source of revenue. A World Bank study suggests that the gross annual market value of extracted solid minerals could increase from an estimated current level of $60 million to $253 million per annum within a 4–5 year time horizon. At that point the sector could generate value added of $108 million and annual
- 36 -
royalties and other taxes of around $18 million.15 For this to occur, significant reform measures are required, such as the establishment of a legal and regulatory environment, in addition to significant public and private sector investment. Modern minerals and hydrocarbon laws are being prepared with international assistance. However, in both mining and oil and gas, the government will not receive income tax revenue for a significant period of time after the initial investment is made, as it will take firms time to accumulate taxable income. Royalties will be the first revenue stream, although these could also be reduced if the government retains ownership of the enterprises, as some officials have recently indicated.
29. A pipeline through Afghanistan, carrying natural gas from Eastern Turkmenistan to Pakistan and beyond, could generate significant revenue and employment. International oil and gas companies explored the feasibility of the Turkmenistan-Pakistan route in the 1990s, but interest waned subsequently with the discovery of new gas reserves in Pakistan and security concerns. However, as conditions in Afghanistan stabilize, interest in constructing the pipeline has reappeared. As a transit country, the fiscal side of a pipeline agreement might include: (a) payment of a transit fee (estimated anywhere between $100–$300 million annually), (b) taxation of profits from the pipeline, and (c) possible benefits in kind. However, completion of this project is highly uncertain, and even in the best circumstances, is likely to be several years away.
Land Taxes
30. Agricultural taxes were traditionally collected at the district and local levels, and were reportedly a major source of revenue. However, they have been suspended in most provinces for several years, initially due to the drought. Any attempt to reinstate them is likely to be severely hampered by the security situation, the large opium trade, and widespread poverty. Nonetheless, given the importance of agriculture to the economy, the authorities are reviewing the feasibility and desirability of reintroducing land taxes as part of the 2006/07 budget, although the revenue to be generated initially is likely to be small.
C. Setting Medium-Term Revenue Targets
31. The priority for the government is to fund its growing operating budget. In order to maintain aggregate fiscal discipline, the government has committed not to use central bank financing for the budget, that is, to follow a no-overdraft rule, nor to fund recurrent costs with external borrowing, even at highly concessional terms.16 Operating expenditures are therefore constrained by the availability of revenue, including grants. Given the large weight
15For a detailed review of the mining sector see “Transitional Islamic State of Afghanistan: Mining as a Source of Growth,” World Bank Report No. 28231-AF, March 2004.
16There is currently no government domestic debt market, which adds another limitation to fiscal financing.
- 37 -
of salaries and wages in total operating budget expenditures (around 67 percent), the medium-term funding requirements are likely to be largely driven by public administration reform.
32. The I-ANDS targets a revenue ratio of at least 8 percent of GDP by 2010/11. The revenue targets set out in the Medium-term Fiscal Framework (MTFF) presented to Cabinet in November 2005 together with the midyear budget review, are consistent with covering a growing proportion of total recurrent expenditures, up from 28 percent in 2004/05 to 53 percent by 2010/11 (See Box 1 in the Staff Report for the 2005 Article IV Consultation and Sixth Review Under the Staff-Monitored Program). The civil service wage bill, which excludes items such as the Afghan National Army, should be fully covered by domestic revenue from 2006/07. For the foreseeable future, capital spending and significant recurrent costs would be entirely funded by external assistance.
33. In the context of a rapidly changing environment, domestic revenue projections are subject to a high degree of uncertainty, even under unchanged policy assumptions. The weak statistical base, in particular for economic variables critical to revenue projections (e.g., national accounts and the structure of dutiable imports or domestic taxpayers), is problematic. Moreover, additional uncertainty is created by the large structural shifts associated with macroeconomic stabilization and restructuring—such as security, control over provincial transfers, the impact of the counter-narcotics strategies and significant tax policy reforms.
34. Achieving the government’s ambitious revenue targets requires robust economic growth and strong implementation of revenue policy and administrative reforms. If GDP falls below projections, but recurrent costs grow in real terms as envisaged in the I-ANDS, the proportion of recurrent expenditures covered by domestic revenues will be lower than targeted, prolonging the time to achieve some measure of sustainability. The projections presented below follow broadly the same methodology used by the MoF, and are driven by four elements:
• Economic growth and inflation: The tax base is expected to grow in line with nominal GDP growth, or for import duties, in line with the growth in dutiable imports. These variables are sensitive to exogenous factors, such as prolonged drought, and could also be negatively affected in the short term by an opium eradication campaign. Nontax revenues are assumed to grow with nominal GDP, with the potential exception of over-flight fees.17 Hence little growth, relative to GDP, is expected in administrative fees.
• Customs and tax policy reforms: The government enacted a sweeping reform of trade taxes in 2004 and has partially implemented a wide range of tax reforms, such as the rental tax, wage withholding, and the airport departure fee, and so forth, aimed
17Afghanistan currently receives around $16 million per year as overflight fees. With some additional investment in the sector and more air traffic these fees, could increase.
- 38 -
at mobilizing revenue (see above). Even though these reforms are already applicable, the complete implementation of these measures takes time as procedures and administrative capacity need to be developed.
• Customs administration reforms: Measures to improve customs administration have been set out above. They focus on improving enforcement and compliance, including rebuilding of physical and human capacity, general computerization (ASYCUDA), the progressive recovery of customs functions from other agencies (e.g., valuation of goods), and the introduction of a simplified customs declaration form.
• Tax administration reforms: Measures to improve tax administration (also discussed above) focus on enforcement and compliance. Important developments include the establishment of a LTO and the restructuring of the headquarters and provincial tax organizations.
35. Alternative scenarios are used to illustrate the implications of different reform paths. The underlying macroeconomic assumptions are similar for each scenario, with real GDP growing at around 10 percent a year over the first four years, before declining to around 7.5 percent a year thereafter. Inflation is assumed to fall from 10 percent per annum to 5 percent, with the nominal exchange rate remaining stable. The alternative scenarios include the following changes to key assumptions:
• Scenario 1 (low-case) assumes no further tax policy reforms. This scenario is based on the current reforms—there is a gradual implementation of the wage withholding tax, selected services taxes (including a roll-out outside Kabul), and the airport departure fee. Compliance rates improve by around 10 percent per annum over the first five years and by 5 percent per annum during the remainder of the projection period. The improvement in compliance rates may seem high, but the starting point is extremely low (compliance is largely voluntary) and this improvement appears modest relative to changes over the last few years and for other post-conflict countries. No additional major policy reforms are assumed to be implemented.
• Scenario 2 (baseline) assumes the implementation of the five-year customs and tax administration reforms. Under this scenario, the government introduces the additional reform measures outlined in the MTFF, including: a tariff rationalization that increases the average tariff, an excise tax that could eventually realize around 1 percent of GDP, road tolls and land taxes.18 The improvements in compliance rates are slightly higher than in scenario 1, assuming that the performance of the customs
18The MoF assumes that the average tariff would double in 2006/07, with the full impact passed on to revenues. However, given the disruption the last tariff reform caused, in 2004, and the scope for avoidance, full pass through is unlikely. The baseline assumes that only 50 percent of the tariff is realized.
- 39 -
administration and the LTO is better. Specifically, the scenario assumes improvements of 10–15 percent per annum over the first six years and 5 percent per annum for the remainder of the projection period.
• Scenario 3 (high-case) assumes slightly accelerated implementation of the five-year customs and tax administration reforms, together with some additional revenue measures. Under this scenario, the improvements in compliance rates are slightly higher than in scenario 2, owing to a stronger performance by the Customs administration and the LTO (improvements of 20 percent per annum over the first four years and 5 percent per annum during the remainder of the projection period). Further to the policy reforms discussed in scenario 2, there is a gradual move toward a consumption tax, and toward the end of the projection period, royalties from the mineral sector and the gas pipeline gradually come on stream.
• The government’s MTFF scenario. This scenario was presented in the midyear budget review and includes several policy measures to be proposed for 2006/07, including a rationalization of customs tariffs that increases the average tariff (while maintaining the current bands) and almost doubles customs revenues. The tax policy measures introduced in 2005/06, and mentioned in scenario 1, are assumed to increase revenues by at least 5 percent per annum. Compliance rates increase by 5 percent in the first year and 10 percent a year thereafter.
36. The revenue ratios for each scenario are shown as a percentage of GDP in Figure II.3 and Table II.3. These ratios provide useful benchmarks for assessing Afghanistan’s possible revenue performance, depending on the progress made with the customs and tax reforms.
Table II.3. Revenue Scenarios 2003/04 2004/05 2005/06 2006/07 2007/08 2008/09 2009/10 2010/11 2011/12 2012/13 2013/14 2014/15 2015/16
Est Est Proj Proj Proj Proj Proj Proj Proj Proj Proj Proj Proj
MTFF operating budget assumptions Compensation to employees 6.5 6.6 5.9 5.6 5.7 5.8 5.5 Total 9.8 9.4 10.0 8.9 8.9 8.9 8.7 Revenues 4.5 4.5 5.3 6.8 7.0 7.6 8.6
Staff revenue projectionsScenario 1 - low-case 5.3 5.5 6.0 6.4 6.6 6.8 6.9 6.9 6.9 7.0 7.0Scenario 2 - baseline 5.3 6.1 6.8 7.6 7.9 8.3 8.5 8.9 9.2 9.6 10.0Scenario 3 - high-case 5.3 6.9 7.8 9.2 10.2 11.0 12.0 12.4 12.9 13.2 13.4
Sources: Afghan authorities (MTFF); and Fund staff estimates.
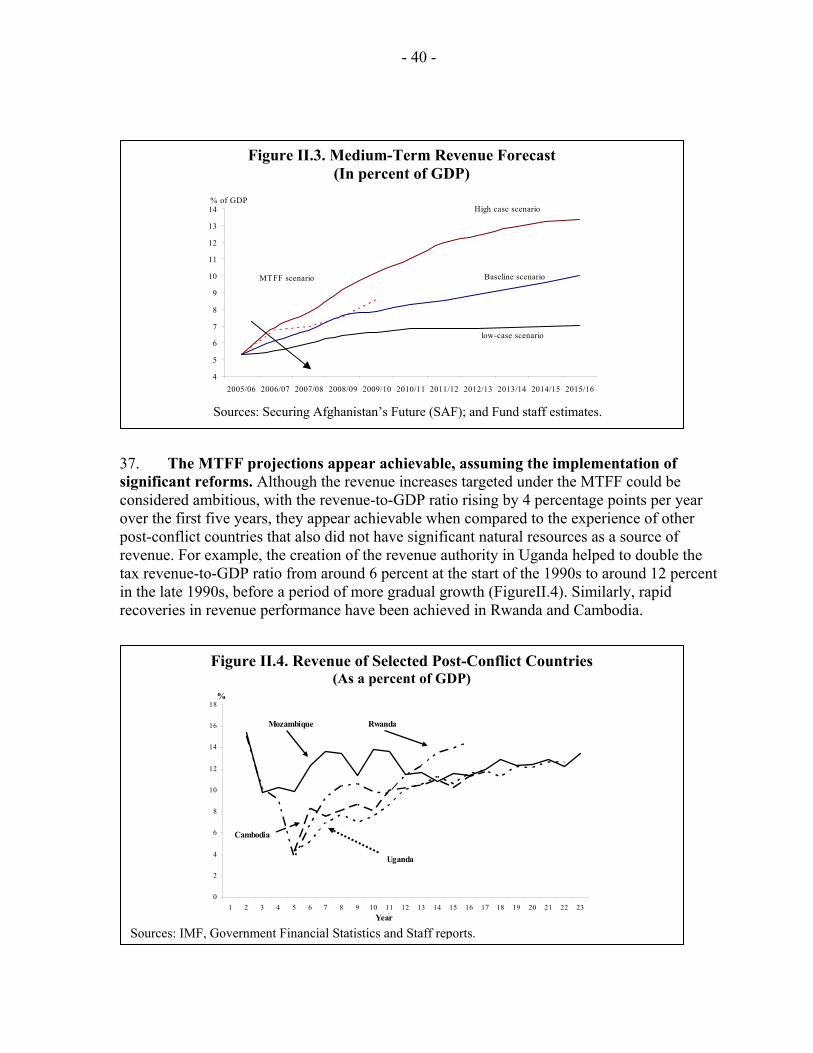
- 40 -
37. The MTFF projections appear achievable, assuming the implementation of significant reforms. Although the revenue increases targeted under the MTFF could be considered ambitious, with the revenue-to-GDP ratio rising by 4 percentage points per year over the first five years, they appear achievable when compared to the experience of other post-conflict countries that also did not have significant natural resources as a source of revenue. For example, the creation of the revenue authority in Uganda helped to double the tax revenue-to-GDP ratio from around 6 percent at the start of the 1990s to around 12 percent in the late 1990s, before a period of more gradual growth (FigureII.4). Similarly, rapid recoveries in revenue performance have been achieved in Rwanda and Cambodia.
Figure II.4. Revenue of Selected Post-Conflict Countries (As a percent of GDP)
0
2
4
6
8
10
12
14
16
18
1 2 3 4 5 6 7 8 9 10 11 12 13 14 15 16 17 18 19 20 21 22 23
RwandaMozambique
Uganda
Cambodia
%
Year Sources: IMF, Government Financial Statistics and Staff reports.
Figure II.3. Medium-Term Revenue Forecast (In percent of GDP)
4
5
6
7
8
9
10
11
12
13
14
2005/06 2006/07 2007/08 2008/09 2009/10 2010/11 2011/12 2012/13 2013/14 2014/15 2015/16
% of GDP
low-case scenario
Baseline scenario
High case scenario
MTFF scenario
Sources: Securing Afghanistan’s Future (SAF); and Fund staff estimates.
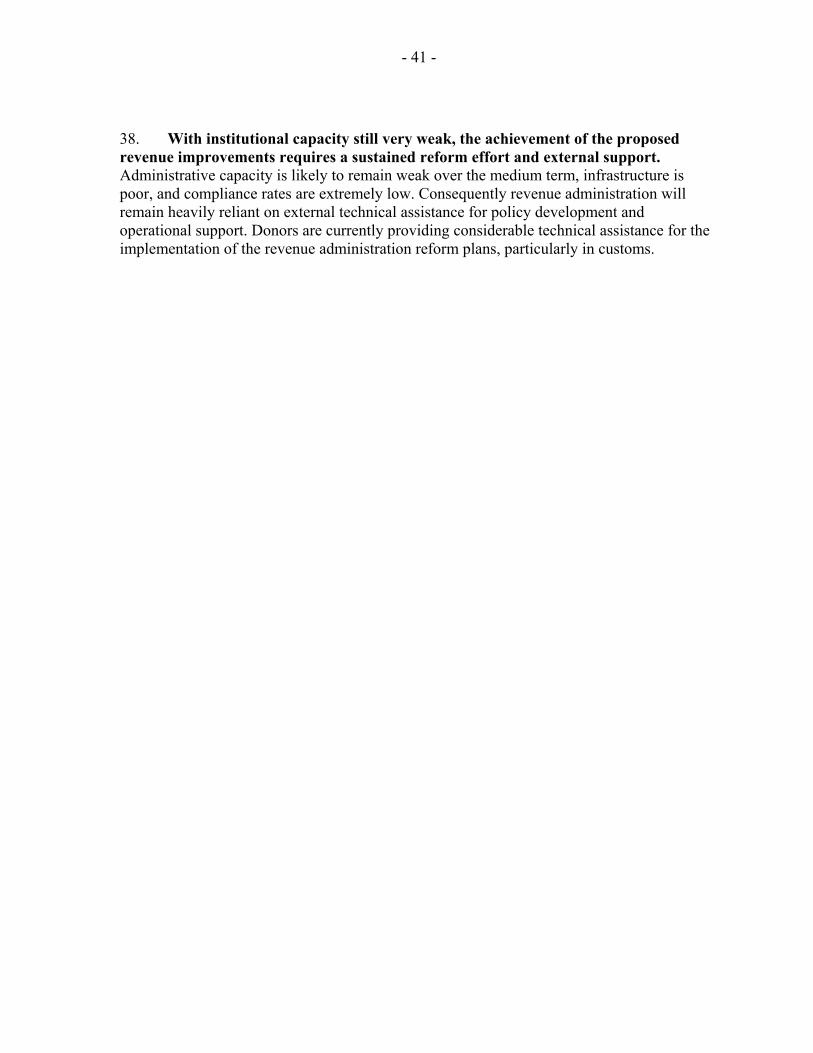
- 41 -
38. With institutional capacity still very weak, the achievement of the proposed revenue improvements requires a sustained reform effort and external support. Administrative capacity is likely to remain weak over the medium term, infrastructure is poor, and compliance rates are extremely low. Consequently revenue administration will remain heavily reliant on external technical assistance for policy development and operational support. Donors are currently providing considerable technical assistance for the implementation of the revenue administration reform plans, particularly in customs.
- 42 -
References
Afghan-American Chamber of Commerce (AACC) and Afghan International Chamber of Commerce (AICC) joint conference, 2005, “Reflections and Recommendations on Tax Policy: Impact on Investment in Afghanistan,” Conference Report, Washington, D.C., January.
Boadway, R.; Chua, D.; and Flatters, F., 1995, “Investment Incentives and the Corporate Income Tax in Malaysia,” in A. Shah (Ed.), Fiscal Incentives for Investment and Innovation (New York: Oxford University Press), pp. 341–373.
Baer, Katherine and Silvani, Carlos, 1997, “Designing a Tax Administration Reform Strategy: Experience and Guidelines,” IMF Working Paper 97/30 (Washington: International Monetary Fund).
——, and others, 2002, “Improving Large Taxpayers’ Compliance: A review of Country Experience,” IMF Occasional Paper No. 215, (Washington: International Monetary Fund).
Dos Santos, Paulo, 1994, “Administration of Large Taxpayers,” Fiscal Affairs Department (unpublished); Washington: International Monetary Fund.
Estache, A. and Gaspar, V., 1995, “Why Tax Incentives do not Promote Investment in Brazil,” in Shah (Ed.), Fiscal Incentives for Investment and Innovation (New York: Oxford University Press) , pp. 309–40.
Gupta, Sanjeev; and others, 2005, “Rebuilding Fiscal Institutions in Post-conflict Countries,” IMF Occasional Paper No. 247 (Washington: International Monetary Fund).
Heller, Peter S., 2005, “Understanding Fiscal Space,” IMF Policy Discussion Paper No. 05/4, (Washington: International Monetary Fund).
Keen, Michael, in Gupta, Sanjeev and others, 2004, “Helping Countries Develop: The Role of Fiscal Policy” (Washington: International Monetary Fund).
Mintz, J.M. and Tsiopoulos, T., 1995, “Corporate Income Taxation and Foreign Direct Investment in Central and Eastern Europe,” in Shah (Ed.), Fiscal Incentives for Investment ad Innovation (New York: Oxford University Press).
OECD, 1995, Taxation and Foreign Direct Investment: The Experience of the Economies in Transition (Paris: OECD).
Tanzi, Vito and Zee, Howell 2001, “Tax Policy for Developing Countries,” IMF Economic Issues No. 27 (Washington: International Monetary Fund).
- 43 -
Shah, Anwar, Shah (ed), 1995, “Fiscal Incentives for Investment and Innovation” (New York: Oxford University Press).
World Bank, 2004, “Transitional Islamic State of Afghanistan: Mining as a Source of Growth,” report No. 28231-AF, March (Washington: World Bank).
——, 1978, “Afghanistan: The Journey to Economic Development”, report No. 17777a-AF, March (unpublished).
——, 2005, “The Investment Climate in Afghanistan: Exploiting Opportunities in an Uncertain Environment,” December (Washington: World Bank).
Zee, H., Stotsky, J., and Ley, E., 2002, “Tax Incentives for Business Investment: A Primer for Policy Makers in Developing Countries,” IMF World Development, Vol. 30, No. 9, (Washington: International Monetary Fund), pp. 1497–1516.
- 44 -
III. MACROECONOMIC IMPACT OF THE DRUG ECONOMY AND COUNTERNARCOTICS EFFORTS1
We must destroy poppy before it destroys us.
President Hamid Karzai
A. Introduction and Summary
1. The authorities and the donor community’s counternarcotics efforts have had a limited impact so far on Afghanistan’s opium production, which has remained at historically high levels over the last few years. However, owing to the sustained growth of the licit sector, the size of the opium sector relative to the rest of the economy has declined significantly. Nevertheless, the opium sector remains Afghanistan’s largest source of export earnings (although unrecorded) and a major source of revenue in the rural areas. The scheduled intensification of the counternarcotics efforts will therefore have a substantial economic and social impact. To explore this impact, a simple macroeconomic model was developed. While, given the uncertainty surrounding the economic behavior as well as the value of a number of economic variables, the results have essentially an illustrative value, this model seeks to capture, in an integrated way, the key economic transmission channels. The model suggests that even through interdiction and eradication have very different economic effects, the impact of counternarcotics efforts on the real sector will be less pronounced to the extent that a large part of the decline in income could fall on traffickers, who have a lower propensity to consume. Similarly, both the high level of drug-related capital outflows and the large import content associated with drug-related spending could moderate the effect on the balance of payments. The fiscal impact would also be somewhat limited. Nevertheless, in view of the potential social impact of both eradication and interdiction, a gradual approach to the elimination of opium production, allowing the authorities to put in place the necessary sustainable income generation programs in support of the eradication and interdiction campaigns, appears warranted.
B. The Macroeconomic Impact of Drug-Related Activities
The drug sector in Afghanistan
2. Afghanistan remains, by far, the world’s largest opium producer. Over the last 15 years, Afghanistan’s opium production has increased steadily, from 1,570 tons in 1990 to 4,100 tons in 2004 (Table III.1). The main disruption to this increase corresponded to the production ban enacted by the Taliban in 2001, which was successful, at least temporarily, in reducing production (but less so in reducing exports due to the existence of large inventories). As the increase in production in Afghanistan coincided with a drop in
1Prepared by Edouard Martin and Steven Symansky.
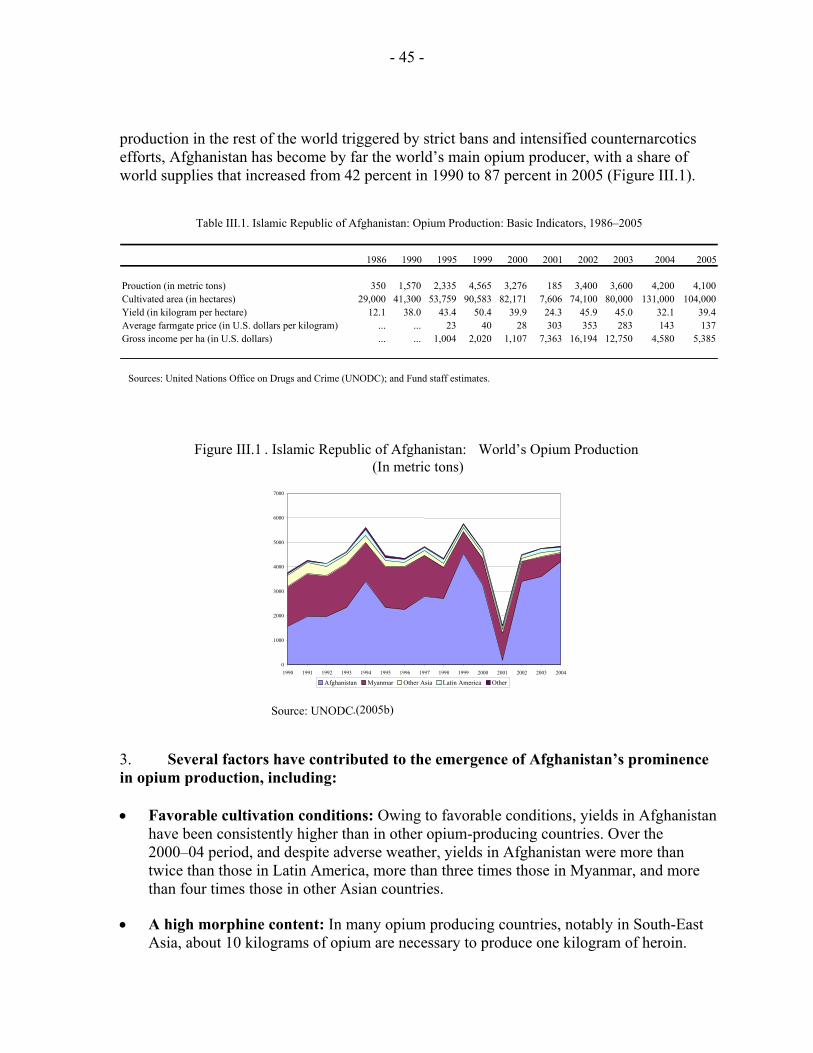
- 45 -
production in the rest of the world triggered by strict bans and intensified counternarcotics efforts, Afghanistan has become by far the world’s main opium producer, with a share of world supplies that increased from 42 percent in 1990 to 87 percent in 2005 (Figure III.1).
Prouction (in metric tons) 350 1,570 2,335 4,565 3,276 185 3,400 3,600 4,200 4,100Cultivated area (in hectares) 29,000 41,300 53,759 90,583 82,171 7,606 74,100 80,000 131,000 104,000Yield (in kilogram per hectare) 12.1 38.0 43.4 50.4 39.9 24.3 45.9 45.0 32.1 39.4Average farmgate price (in U.S. dollars per kilogram) ... ... 23 40 28 303 353 283 143 137Gross income per ha (in U.S. dollars) ... ... 1,004 2,020 1,107 7,363 16,194 12,750 4,580 5,385
Sources: United Nations Office on Drugs and Crime (UNODC); and Fund staff estimates.
Table III.1. Islamic Republic of Afghanistan: Opium Production: Basic Indicators, 1986–2005
2002 2003 2004 20051986 1990 1995 1999 2000 2001
3. Several factors have contributed to the emergence of Afghanistan’s prominence in opium production, including: • Favorable cultivation conditions: Owing to favorable conditions, yields in Afghanistan
have been consistently higher than in other opium-producing countries. Over the 2000–04 period, and despite adverse weather, yields in Afghanistan were more than twice than those in Latin America, more than three times those in Myanmar, and more than four times those in other Asian countries.
• A high morphine content: In many opium producing countries, notably in South-East Asia, about 10 kilograms of opium are necessary to produce one kilogram of heroin.
Figure III.1 . Islamic Republic of Afghanistan: World’s Opium Production (In metric tons)
0 1000 2000 3000 4000 5000 6000 7000
1990 1991 1992 1993 1994 1995 1996 1997 1998 1999 2000 2001 2002 2003 2004
Afghanistan Myanmar Other Asia Latin America Other
Source: UNODC .(2005b)
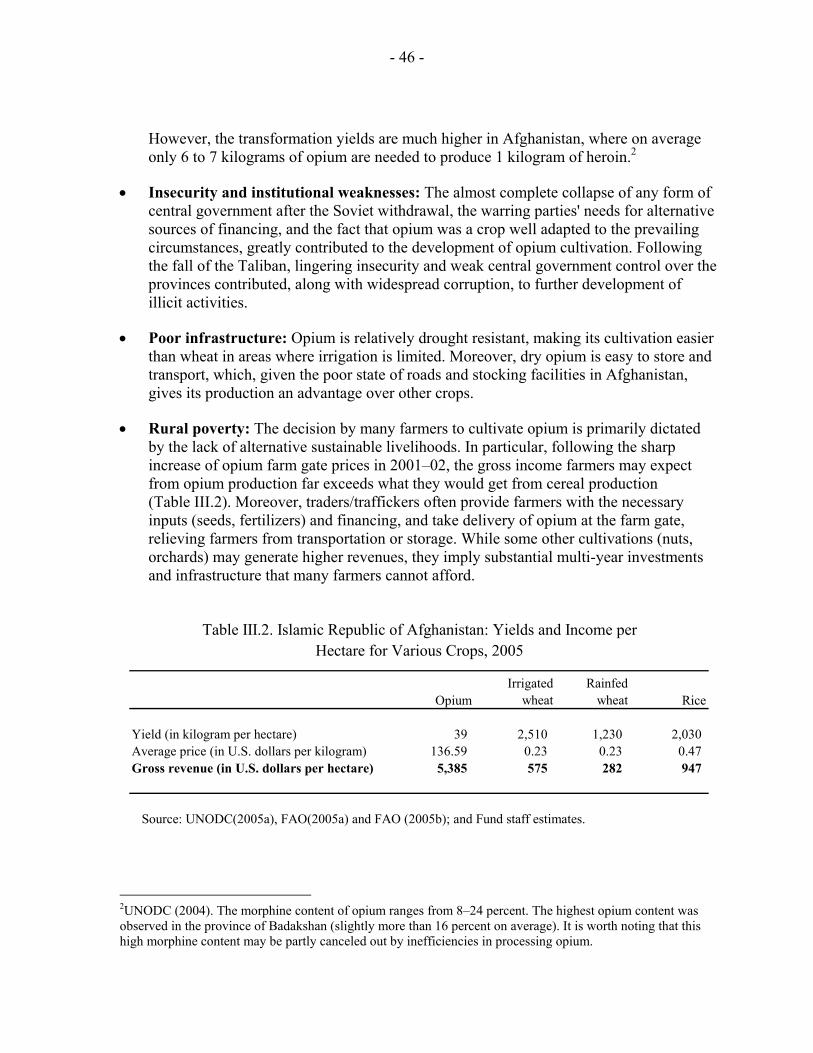
- 46 -
However, the transformation yields are much higher in Afghanistan, where on average only 6 to 7 kilograms of opium are needed to produce 1 kilogram of heroin.2
• Insecurity and institutional weaknesses: The almost complete collapse of any form of central government after the Soviet withdrawal, the warring parties' needs for alternative sources of financing, and the fact that opium was a crop well adapted to the prevailing circumstances, greatly contributed to the development of opium cultivation. Following the fall of the Taliban, lingering insecurity and weak central government control over the provinces contributed, along with widespread corruption, to further development of illicit activities.
• Poor infrastructure: Opium is relatively drought resistant, making its cultivation easier than wheat in areas where irrigation is limited. Moreover, dry opium is easy to store and transport, which, given the poor state of roads and stocking facilities in Afghanistan, gives its production an advantage over other crops.
• Rural poverty: The decision by many farmers to cultivate opium is primarily dictated by the lack of alternative sustainable livelihoods. In particular, following the sharp increase of opium farm gate prices in 2001–02, the gross income farmers may expect from opium production far exceeds what they would get from cereal production (Table III.2). Moreover, traders/traffickers often provide farmers with the necessary inputs (seeds, fertilizers) and financing, and take delivery of opium at the farm gate, relieving farmers from transportation or storage. While some other cultivations (nuts, orchards) may generate higher revenues, they imply substantial multi-year investments and infrastructure that many farmers cannot afford.
OpiumIrrigated
wheatRainfed
wheat Rice
Yield (in kilogram per hectare) 39 2,510 1,230 2,030 Average price (in U.S. dollars per kilogram) 136.59 0.23 0.23 0.47 Gross revenue (in U.S. dollars per hectare) 5,385 575 282 947
Source: UNODC(2005a), FAO(2005a) and FAO (2005b); and Fund staff estimates.
Table III.2. Islamic Republic of Afghanistan: Yields and Income perHectare for Various Crops, 2005
2UNODC (2004). The morphine content of opium ranges from 8–24 percent. The highest opium content was observed in the province of Badakshan (slightly more than 16 percent on average). It is worth noting that this high morphine content may be partly canceled out by inefficiencies in processing opium.
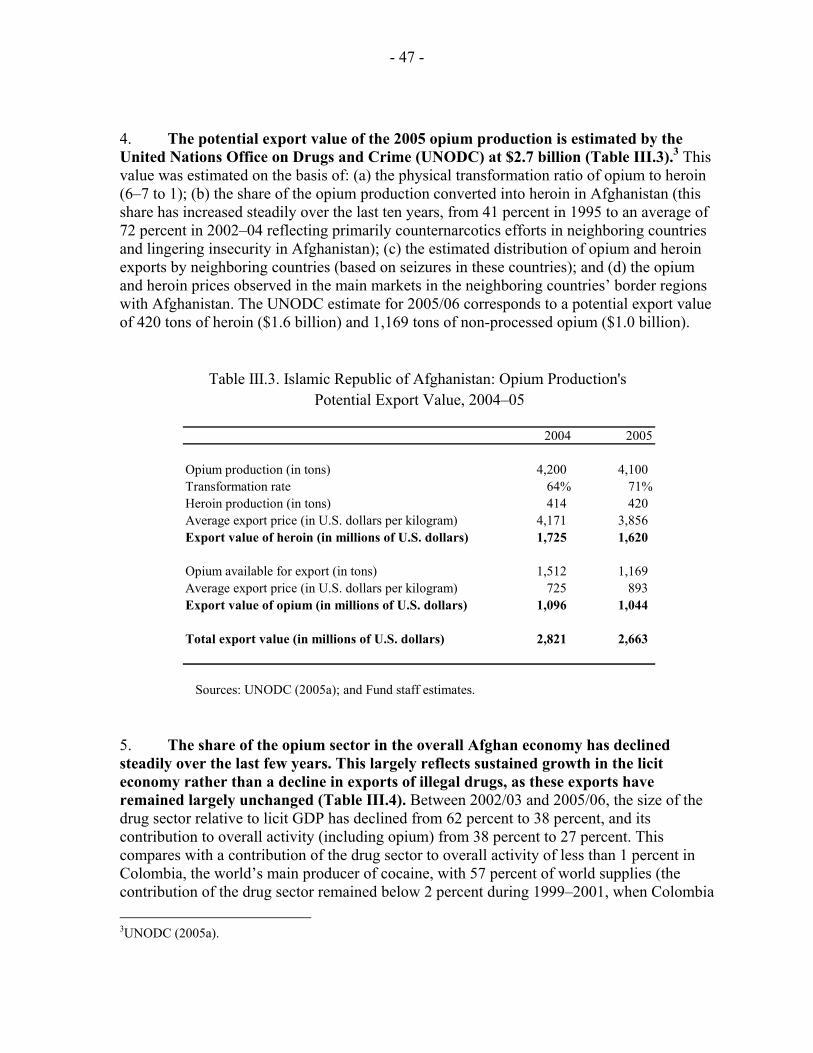
- 47 -
4. The potential export value of the 2005 opium production is estimated by the United Nations Office on Drugs and Crime (UNODC) at $2.7 billion (Table III.3).3 This value was estimated on the basis of: (a) the physical transformation ratio of opium to heroin (6–7 to 1); (b) the share of the opium production converted into heroin in Afghanistan (this share has increased steadily over the last ten years, from 41 percent in 1995 to an average of 72 percent in 2002–04 reflecting primarily counternarcotics efforts in neighboring countries and lingering insecurity in Afghanistan); (c) the estimated distribution of opium and heroin exports by neighboring countries (based on seizures in these countries); and (d) the opium and heroin prices observed in the main markets in the neighboring countries’ border regions with Afghanistan. The UNODC estimate for 2005/06 corresponds to a potential export value of 420 tons of heroin ($1.6 billion) and 1,169 tons of non-processed opium ($1.0 billion).
2004 2005
Opium production (in tons) 4,200 4,100 Transformation rate 64% 71%Heroin production (in tons) 414 420 Average export price (in U.S. dollars per kilogram) 4,171 3,856 Export value of heroin (in millions of U.S. dollars) 1,725 1,620
Opium available for export (in tons) 1,512 1,169 Average export price (in U.S. dollars per kilogram) 725 893 Export value of opium (in millions of U.S. dollars) 1,096 1,044
Total export value (in millions of U.S. dollars) 2,821 2,663
Sources: UNODC (2005a); and Fund staff estimates.
Table III.3. Islamic Republic of Afghanistan: Opium Production's Potential Export Value, 2004–05
5. The share of the opium sector in the overall Afghan economy has declined steadily over the last few years. This largely reflects sustained growth in the licit economy rather than a decline in exports of illegal drugs, as these exports have remained largely unchanged (Table III.4). Between 2002/03 and 2005/06, the size of the drug sector relative to licit GDP has declined from 62 percent to 38 percent, and its contribution to overall activity (including opium) from 38 percent to 27 percent. This compares with a contribution of the drug sector to overall activity of less than 1 percent in Colombia, the world’s main producer of cocaine, with 57 percent of world supplies (the contribution of the drug sector remained below 2 percent during 1999–2001, when Colombia 3UNODC (2005a).
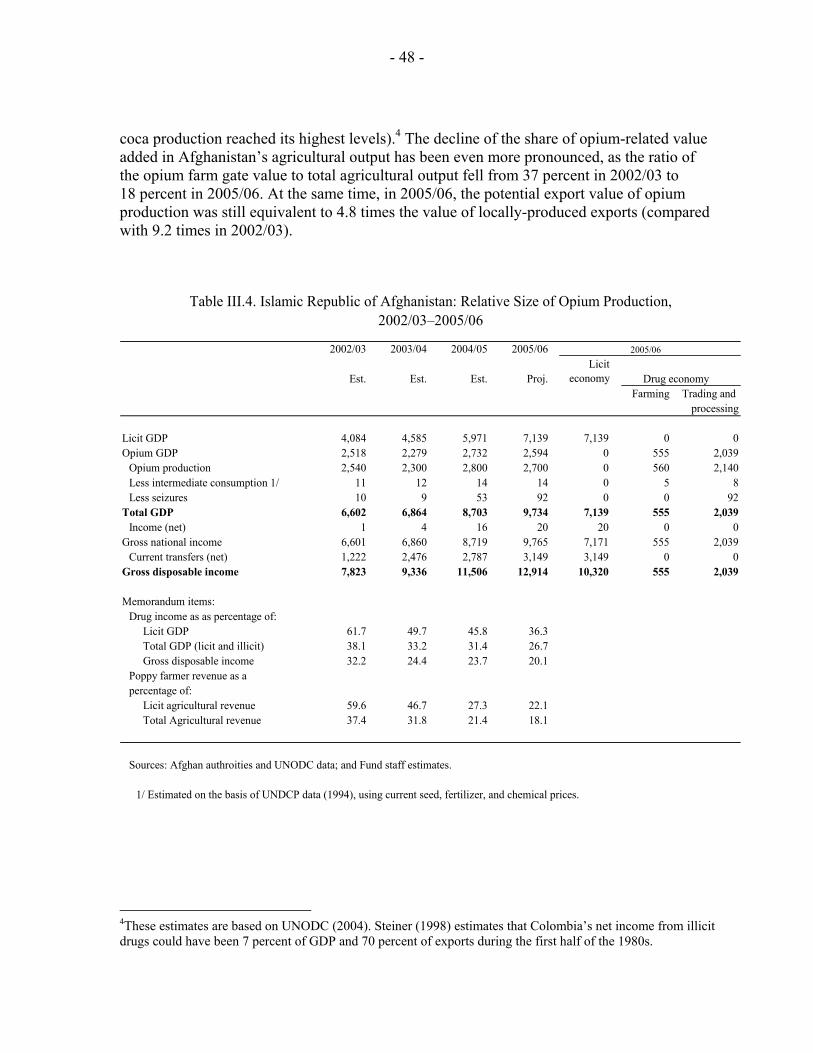
- 48 -
coca production reached its highest levels).4 The decline of the share of opium-related value added in Afghanistan’s agricultural output has been even more pronounced, as the ratio of the opium farm gate value to total agricultural output fell from 37 percent in 2002/03 to 18 percent in 2005/06. At the same time, in 2005/06, the potential export value of opium production was still equivalent to 4.8 times the value of locally-produced exports (compared with 9.2 times in 2002/03).
2002/03 2003/04 2004/05 2005/06
Est. Est. Est. Proj.Licit
economyFarming Trading and
processing
Licit GDP 4,084 4,585 5,971 7,139 7,139 0 0Opium GDP 2,518 2,279 2,732 2,594 0 555 2,039
Opium production 2,540 2,300 2,800 2,700 0 560 2,140Less intermediate consumption 1/ 11 12 14 14 0 5 8Less seizures 10 9 53 92 0 0 92
Total GDP 6,602 6,864 8,703 9,734 7,139 555 2,039Income (net) 1 4 16 20 20 0 0
Gross national income 6,601 6,860 8,719 9,765 7,171 555 2,039Current transfers (net) 1,222 2,476 2,787 3,149 3,149 0 0
Gross disposable income 7,823 9,336 11,506 12,914 10,320 555 2,039
Memorandum items:Drug income as as percentage of:
Licit GDP 61.7 49.7 45.8 36.3Total GDP (licit and illicit) 38.1 33.2 31.4 26.7Gross disposable income 32.2 24.4 23.7 20.1
Poppy farmer revenue as a percentage of:
Licit agricultural revenue 59.6 46.7 27.3 22.1Total Agricultural revenue 37.4 31.8 21.4 18.1
Sources: Afghan authroities and UNODC data; and Fund staff estimates.
1/ Estimated on the basis of UNDCP data (1994), using current seed, fertilizer, and chemical prices.
Table III.4. Islamic Republic of Afghanistan: Relative Size of Opium Production,
2005/06
Drug economy
2002/03–2005/06
4These estimates are based on UNODC (2004). Steiner (1998) estimates that Colombia’s net income from illicit drugs could have been 7 percent of GDP and 70 percent of exports during the first half of the 1980s.
- 49 -
Gross income distribution
Value added
6. Intermediate consumption is quite limited at the farm level. 5 While production factor costs (family labor, hiring of daily workers, rental of tractors and/or of land) may be substantial, intermediate consumption, which comprise expenditure on seeds, fertilizers and pesticides is generally considered marginal. A microeconomic study of Pakistan’s opiate industry in the early 1990s concluded that these costs amounted to about 4 percent of the opium farm gate value.6 The intermediate consumption in Afghanistan is currently likely to be substantially lower, at about 1–2 percent of farm gate value, owing to the sharp increase in opium prices, which was only marginally offset by rising seed and fertilizer prices.7
7. In addition to these costs, however, many farmers have to service opium-related debts. In the absence of savings and other sources of financing, many farmers resort to borrowing, primarily from shopkeepers, traders, and relatives, to finance their intermediate consumption (seeds and fertilizers) and the hiring of production factors (such as day workers and tractors). Typically, the most common form of credit is the salaam, an advance on a fixed amount of expected future agricultural production, which is typically contracted at the beginning of the cultivation season and paid back, through the delivery of opium, after the harvest.8 Even if these advances are usually reimbursed within a few months, shortly after the harvest, their costs can be substantial: the amount of the advance is typically equivalent to half of the current market value. The fact that salaam credits are reimbursed through the delivery of opium protects farmers against the risks related to a possible decline in farm gate prices during the duration of the credit (while limiting potential upside gains). The latest UNODC survey (UNODC, 2005a) indicates that, due likely to the high farm gate prices observed since 2001, the average amount of outstanding loans for opium-cultivating farmers has stabilized over the last two years at around $700 per farmer. High farm gate prices, along with increased caution by lenders in the face of intensified counternarcotics efforts, also contributed to a significant decline in the number of farmers contracting new loans, from 47 percent in 2003 to 33 percent in 2005.
5Intermediate consumption corresponds to the value of the goods and services consumed or used up as inputs in the production process, including raw materials and various other operating expenses.
6United Nations Drug Control Program (UNDCP, 1994).
7Mansfield (2006) estimates these costs at $120 per hectare, equivalent to 2 percent of farm gate prices. It is likely that, in terms of farmer’s income, the intermediate consumption was largely offset by the revenue stemming from the sale of by-products.
8Cash loans appear to have taken over in many areas due to fear over eradication and crop failure.
- 50 -
8. Intermediate consumption also appears quite limited at the trafficker level. As mentioned above, in 2002–04, about 72 percent of Afghanistan’s opium production is estimated to have been transformed into heroin in Afghanistan before being exported. The transformation process requires the use of substantial amounts of chemicals (such as acetic anhydride, ammonium chloride, acetone, sodium carbonate, and hydrochloric acid). While in Pakistan in the early 1990s, these chemicals could amount to about 7–8 percent of the heroin price,9 the sharp increase of heroin export prices over the last ten years has resulted in a sharp drop in the costs of these chemicals relative to heroin export receipts. In the case of Afghanistan, which produces primarily the brown, low quality, type of heroin, these costs are estimated to be equivalent to only 1–2 percent of the export price of heroin.
Actual income
9. The income generated by drug-related activities is likely to be significantly lower than the potential export value reported by UNODC. This potential value corresponds to the potential value of opium production (partly transformed in heroin), assuming it is fully sold in the markets neighboring Afghanistan. It is considered to be a good proxy for the potential revenue accruing to Afghans, as individual Afghan groups appear to be involved in opium production, conversion, and trade within Afghanistan and the immediate neighboring countries, but do not appear to participate in international drug trafficking operations.10 However, the actual income accrued by Afghan farmers and traffickers differ from this potential value due to seizures by counternarcotics enforcement agencies and the change in inventories.
10. Inventories are considered to be substantial, as illustrated by the fact that the sharp fall in production in 2001, at a time when Afghanistan was already contributing 37 percent of the world opium production, did not translate into major market disruptions.11 While farm gate prices increased more than tenfold between 2000 and 2002, border prices increased by a bit less than three times. Following their depletion in 2001, these stocks are assumed to have increased sharply over the last few years. This has contributed, along with the decline in production in the rest of the world, to the stabilization of export prices at high levels despite bumper crops. Under the gross assumption that Afghanistan’s opium exports have increased regularly over the last ten years, the build-up in stocks could amount to 400 tons this year ($260 million at export prices), bringing stocks to a level equivalent to more than 6 months of actual exports.12
9UNDCP (1994).
10UNODC (2005), p. 120a.
11Raw opium is a durable good, which is more durable than processed opiates and does not lose value, as its loss of weight in the drying process is compensated by its higher price compared with “wet” opium.
12These estimates are based on the assumption that opium exports have increased regularly over the last ten years and that inventories amounted to 15 months of exports prior to the ban enacted by the Taliban in 2001.
(continued)
- 51 -
11. After increasing sharply, following the ban enacted by the Taliban, the share of revenue accruing to farmers has declined substantially. Reflecting a substantial drop in farm gate prices, this revenue, which had increased sharply in 2001–02, declined from $1,020 million (44 percent of the potential export value) in 2003, to $560 million (21 percent of the potential export value) in 2005. As the number of farmers involved in opium production increased from 264,000 to 309,000 over the same period, the decline in the gross revenue per farmer was even sharper, from $3,864 in 2003 to $1,812 in 2005. It is worth noting that a significant share of the revenue accrued by the farmers must be used to cover factor costs and pay security. While intermediate consumption is very limited, labor costs are substantial as opium is a highly labor intensive crop, with cultivation and harvesting labor needs for an hectare estimated at about 350 and 200 person days, respectively (two to three times greater than those for wheat). Hence, in 2003, UNODC estimated that on average, the farmers retained slightly more than half of the gross revenue they accrued from opium production, with the rest spent on production factor costs (15 to 20 percent of gross revenue) and on taxes and other levies, including bribes and payments to local commanders (25 to 30 percent of gross revenue). Overall, farmers’ net income derived from opium production represented about two thirds of their total income, as it was supplemented by additional income generated through cereal and livestock production and off-farm labor.
12. The remaining income is divided between the different actors involved in the trading of opium from the farm gate to Afghanistan’s borders.13 While the farm gate buyers are the most numerous among these actors, they are believed to receive a relatively small part of domestic trade revenue (i.e. drug export value minus farm gate value), owing to intense competition that limits the profit margin linked to these activities. Likewise, the share of domestic trade revenue accruing to shop owners in the regional opium bazaars and to clandestine laboratories appears relatively small. The main part of domestic trade revenue is believed to accrue to a limited number of bulk buyers and large-scale specialist traders who buy opium throughout the year and organize shipping to border areas or directly abroad, and incur large risks. To reduce these risks, a significant part of their revenue is spent on “security providers”, including warlords’ militias. Contrary to the Colombian drug traffickers, these bulk buyers and specialist traders do not appear to be organized in cartels.
Macroeconomic impact
13. While the potential export value of opium attracts most attention, it is only one among many factors defining the macroeconomic impact of the opium economy on the Afghan economy as a whole. The impact on the real sector will in particular depend on which share of this export value actually enters the economy, how this share is divided between the different actors, and how these different actors allocate their income between consumption, investment, and savings. The drug economy, which is excluded from reported
These estimates may be conservative as some experts consider that after four years of high production the stocks have likely returned to their pre-2001 level and amount to at least one year of exports.
13See IMF (2003) and Byrd et al. (2004).
- 52 -
GDP, adds to the demand for domestic products through the demand it generates. Although not recorded in official balance of payments data, it also has a net positive impact on the balance of payments.
Consumption/savings
14. Farmers consume a large part of their earnings, largely on domestic goods. For many farmers, opium is the main cash crop, in contrast with other crops which are cultivated primarily to meet subsistence requirements. Given the limited financial investment opportunities for savings, it is generally assumed that farmers spend almost all of their income. Therefore, opium-related income contributes primarily to increasing consumption, in particular of non-subsistence goods, including imported goods. This assumption appears validated by field studies, such as Mansfield (2004), who estimated that in Nangarhar and Langhman expenditures of the households involved in opium-related activities were, on average, equivalent to their net income. According to this study, most of the farmers’ consumption consisted of essential items, such as food, fuel, and health costs, while a small portion, which increased markedly with the farmer’s income, consisted of “non-essential” items, such as cars, televisions, motorbikes, and generators. There were some disparities among farmers, with those cultivating more than 75 percent of their land saving up to one third of their income, while the others were dissaving. A small part of spending corresponds to investment, either in productive assets (e.g., tractors) or housing, that is generally included in the official national accounts data.
15. In the absence of reliable data, it is generally assumed that processors and traffickers save a large part of their income.14 Benefiting from substantially higher revenue than the opium farmers, the actors involved in opium trade are likely to have a lower propensity to consume.15 While secure processing and transport of opium and heroin require investments in arms, laboratories, and vehicles, these capital expenditures are likely to be small relative to the trading revenue of opium trade, leaving processors and traffickers with substantial resources to invest in other productive or financial assets, either domestic or foreign. Domestically, opium-financed investment may have contributed to the boom in construction observed in Kabul and other major cities, including those, such as Kandahar, located in the main opium-producing areas, although this claim is disputed by some experts. Some of the traffickers’ income is also believed to be recycled in formal and informal activities, such as trade/smuggling. Investments abroad are facilitated by the informal financial sector in Afghanistan: the money-changers (hawaladars) provide low-cost, largely unregulated, and efficient transfer services to other countries. It is also likely that some, if not a large percentage, of the opium export receipts never enter Afghanistan, as the foreign buyers directly transfer the money to the traffickers’ offshore accounts. This, along with the
14This is consistent with the findings of UNDCP (1994) in the case of Pakistan. 15Some of the opium receipts accrued to traders/traffickers are redistributed to security and transport providers, who are likely to have a higher propensity to consume. Even if this contributes to increasing the share of traffickers/traders’ opium receipts which are consumed, this share remains lower for the farmers.
- 53 -
illicit nature of the opium trade, the absence of any reliable data on money changer transactions, and the uncertainty about the various actors’ propensities to consume, invest and import, make an accurate estimation of the shares of opium trade allocated to consumption, and productive and financial investments extremely difficult and speculative.16 Table III.5, which breaks down Afghanistan’s gross disposable income (including opium) into these different uses, aims to illustrate, through broad estimates based on staff assumptions, the macroeconomic impact of the drug economy.
Dutch disease
16. Opium-related demand causes, along with aid-related inflows, Dutch disease. There are two channels. First, by increasing the demand for domestic goods and services, the drug economy contributes to an increase in consumer and asset prices. This spending effect is particularly marked for nontradable goods and services, such as rents, as their supply, contrary to that of tradable goods, cannot adjust directly through an increase in imports. As noted above, it also explains in part, along with aid-related inflows, the increase in real estate prices observed in Afghanistan’s major cities. Secondly, by increasing the demand for production factors, the drug economy also contributes to an increase in their rates of remuneration, thereby raising the production costs of other sectors. Given the labor-intensive nature of opium production, this effect translates primarily into an increase in wages. Overall, these factors explain in part the significant appreciation of the real exchange rate over the last few years and contribute, along with other factors such as poor infrastructure and limited human capital, to the limited competitiveness of Afghanistan’s tradable sector.17 It is worth noting that while donor aid inflows, through the demand for goods and labor they induce, also contribute to Dutch disease; their impact on the competitiveness of the licit economy is partly offset by the associated increase in productivity.
17. Drug-related activities also hinder investment. Owing to its labor-intensive nature, the drug economy does not crowd out investment in other sectors. On the contrary, it may contribute marginally to the financing of these activities, such as trade and construction. However, the drug economy affects investment primarily through is negative impact on Afghanistan’s investment climate. This negative impact manifests itself mainly through lingering insecurity; the sustained growth of informal activities; very high levels of corruption, particularly at the provincial and district levels (either directly through participation, or indirectly through “taxation”); and weaker provincial governments.
16Fund staff had some contacts with donors’ agencies specialized in fighting money laundering and the financing of illicit activities, and with some money changers based in Kabul. While instructive in terms of the financial processes involved, these contacts confirmed the impractibility of gathering reliable data on opium-related financial flows. 17See accompanying selected issues paper “Indicators of Afghanistan’s External Competitiveness.”
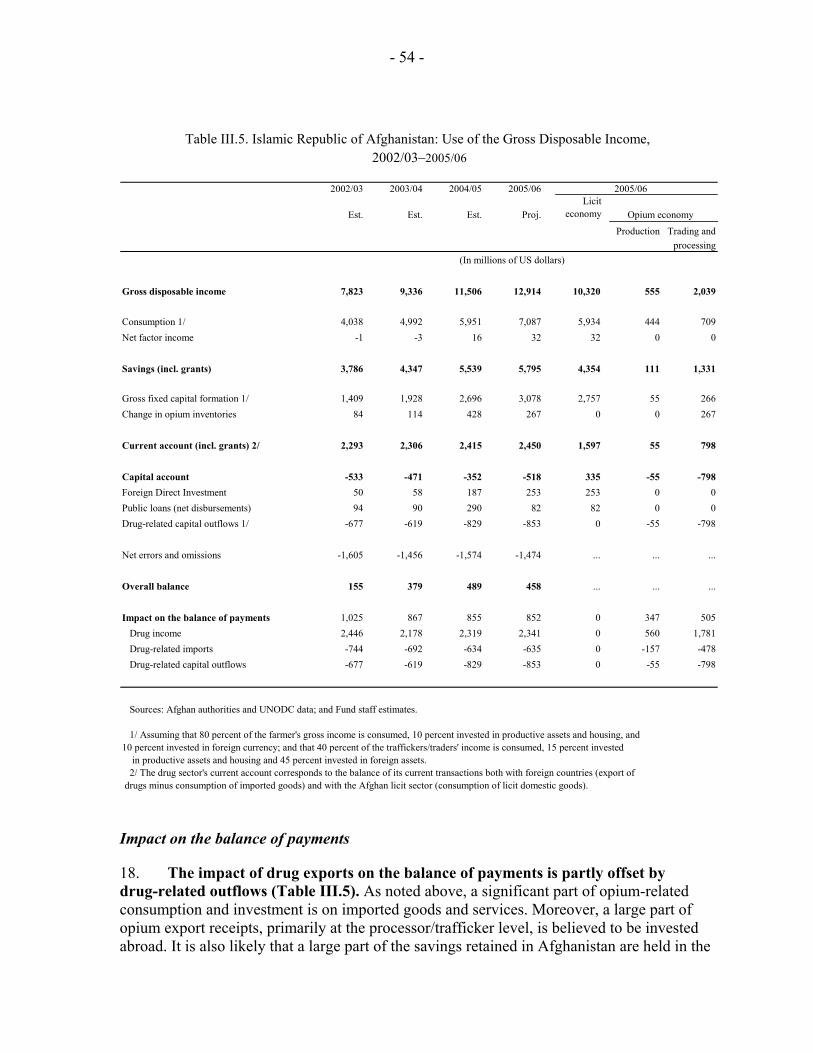
- 54 -
2002/03 2003/04 2004/05 2005/06
Est. Est. Est. Proj.Licit
economy
Production Trading andprocessing
Gross disposable income 7,823 9,336 11,506 12,914 10,320 555 2,039
Consumption 1/ 4,038 4,992 5,951 7,087 5,934 444 709Net factor income -1 -3 16 32 32 0 0
Savings (incl. grants) 3,786 4,347 5,539 5,795 4,354 111 1,331
Gross fixed capital formation 1/ 1,409 1,928 2,696 3,078 2,757 55 266Change in opium inventories 84 114 428 267 0 0 267
53 65 60 60Current account (incl. grants) 2/ 2,293 2,306 2,415 2,450 1,597 55 798
Capital account -533 -471 -352 -518 335 -55 -798Foreign Direct Investment 50 58 187 253 253 0 0Public loans (net disbursements) 94 90 290 82 82 0 0Drug-related capital outflows 1/ -677 -619 -829 -853 0 -55 -798
Net errors and omissions -1,605 -1,456 -1,574 -1,474 ... ... ...
Overall balance 155 379 489 458 ... ... ...
Impact on the balance of payments 1,025 867 855 852 0 347 505Drug income 2,446 2,178 2,319 2,341 0 560 1,781Drug-related imports -744 -692 -634 -635 0 -157 -478Drug-related capital outflows -677 -619 -829 -853 0 -55 -798
Sources: Afghan authorities and UNODC data; and Fund staff estimates.
1/ Assuming that 80 percent of the farmer's gross income is consumed, 10 percent invested in productive assets and housing, and 10 percent invested in foreign currency; and that 40 percent of the traffickers/traders' income is consumed, 15 percent invested
in productive assets and housing and 45 percent invested in foreign assets. 2/ The drug sector's current account corresponds to the balance of its current transactions both with foreign countries (export of
drugs minus consumption of imported goods) and with the Afghan licit sector (consumption of licit domestic goods).
Table III.5. Islamic Republic of Afghanistan: Use of the Gross Disposable Income,
(In millions of US dollars)
2005/06
Opium economy
2002/03–2005/06
Impact on the balance of payments
18. The impact of drug exports on the balance of payments is partly offset by drug-related outflows (Table III.5). As noted above, a significant part of opium-related consumption and investment is on imported goods and services. Moreover, a large part of opium export receipts, primarily at the processor/trafficker level, is believed to be invested abroad. It is also likely that a large part of the savings retained in Afghanistan are held in the
- 55 -
form of foreign-denominated assets, as evidenced by the high degree of financial dollarization (in U.S. dollars, but also in Pakistani rupees and Iranian rials) of the Afghan economy. This limits even further the impact of the drug economy on the balance of payments and the central bank’s international reserves. Taken together, these factors could be equivalent to about two thirds of opium export receipts. 19. Drug-related flows affecting the change in Da Afghanistan Bank’s international reserves are not explicitly reported in the balance of payments. As currently constructed, the balance of payments does not report the main flows directly related to drug activities, such as opium and opiate exports, or the capital outflows corresponding to the investment of the corresponding revenue in foreign assets (including the export receipts that do not enter the country). Other activities, however, such as imports of vehicles by traffickers or food by opium farmers, which are currently statistically indistinguishable from equivalent nondrug-related flows, tend to be captured by the officially recorded trade data or, possibly, as “unrecorded imports” which are estimated and included in the official trade data. While the drug revenue financing these imports is not recorded, the imported goods purchased through illicit income are mostly captured in balance of payments data. Thus, an implicit discrepancy stems from the fact that while substantial drug-related net inflows (i.e. opium exports minus drug-related capital outflows) are not recorded in the current presentation of the balance of payments, this does not translate into substantial positive errors and omissions. 20. The fact that as currently constructed the official balance of payment does not have a large statistical discrepancy is potentially worrisome and points to an underestimation of the net outflows. This apparent absence of a discrepancy is not surprising given that the evaluation of some components of Afghanistan’s balance of payments rests critically on informed guesses rather than on reliable statistical estimates. This is particularly the case for: inward and outward smuggling (excluding the drug trade); aid-related outflows (e.g., the share of aid-financed wages invested abroad); and drug-related outflows. The non-reporting of the drug-related outflows may therefore be largely offset in the current presentation of the balance of payments by an underestimation of the licit trade deficit and/or an underestimation of capital outflows. From a national accounts point of view, the former would likely be largely counterbalanced by an underestimation of private consumption, which, in the absence of any reliable household expenditure data, is estimated as a residual. Table III. 5 attempts at integrating the drug-related flows in the official balance of payments. By doing so, it makes explicit the aforementioned discrepancy. Fiscal impact
21. The positive impact the opium economy may have on fiscal revenue is marginal compared to its cost in terms of government spending. Owing to their illicit nature, most of the drug-related activities (such as production, processing, trade, and security) are not directly taxed. The primary impact of the drug economy on fiscal revenue results, therefore, from the indirect taxation of consumption and imports financed by drug-related inflows. Given the current structure of government revenue, this impact is likely to stem essentially from the duties levied on imports. Even under the assumption that the effective taxation of
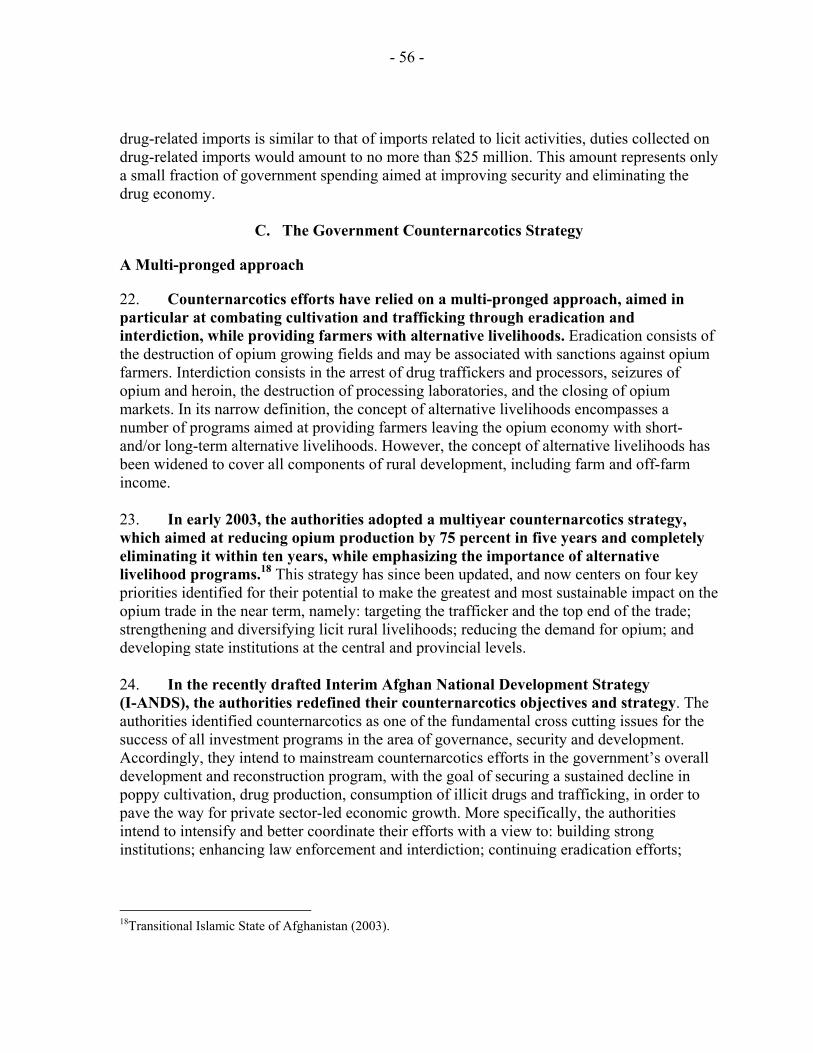
- 56 -
drug-related imports is similar to that of imports related to licit activities, duties collected on drug-related imports would amount to no more than $25 million. This amount represents only a small fraction of government spending aimed at improving security and eliminating the drug economy.
C. The Government Counternarcotics Strategy
A Multi-pronged approach
22. Counternarcotics efforts have relied on a multi-pronged approach, aimed in particular at combating cultivation and trafficking through eradication and interdiction, while providing farmers with alternative livelihoods. Eradication consists of the destruction of opium growing fields and may be associated with sanctions against opium farmers. Interdiction consists in the arrest of drug traffickers and processors, seizures of opium and heroin, the destruction of processing laboratories, and the closing of opium markets. In its narrow definition, the concept of alternative livelihoods encompasses a number of programs aimed at providing farmers leaving the opium economy with short- and/or long-term alternative livelihoods. However, the concept of alternative livelihoods has been widened to cover all components of rural development, including farm and off-farm income. 23. In early 2003, the authorities adopted a multiyear counternarcotics strategy, which aimed at reducing opium production by 75 percent in five years and completely eliminating it within ten years, while emphasizing the importance of alternative livelihood programs.18 This strategy has since been updated, and now centers on four key priorities identified for their potential to make the greatest and most sustainable impact on the opium trade in the near term, namely: targeting the trafficker and the top end of the trade; strengthening and diversifying licit rural livelihoods; reducing the demand for opium; and developing state institutions at the central and provincial levels. 24. In the recently drafted Interim Afghan National Development Strategy (I-ANDS), the authorities redefined their counternarcotics objectives and strategy. The authorities identified counternarcotics as one of the fundamental cross cutting issues for the success of all investment programs in the area of governance, security and development. Accordingly, they intend to mainstream counternarcotics efforts in the government’s overall development and reconstruction program, with the goal of securing a sustained decline in poppy cultivation, drug production, consumption of illicit drugs and trafficking, in order to pave the way for private sector-led economic growth. More specifically, the authorities intend to intensify and better coordinate their efforts with a view to: building strong institutions; enhancing law enforcement and interdiction; continuing eradication efforts;
18Transitional Islamic State of Afghanistan (2003).
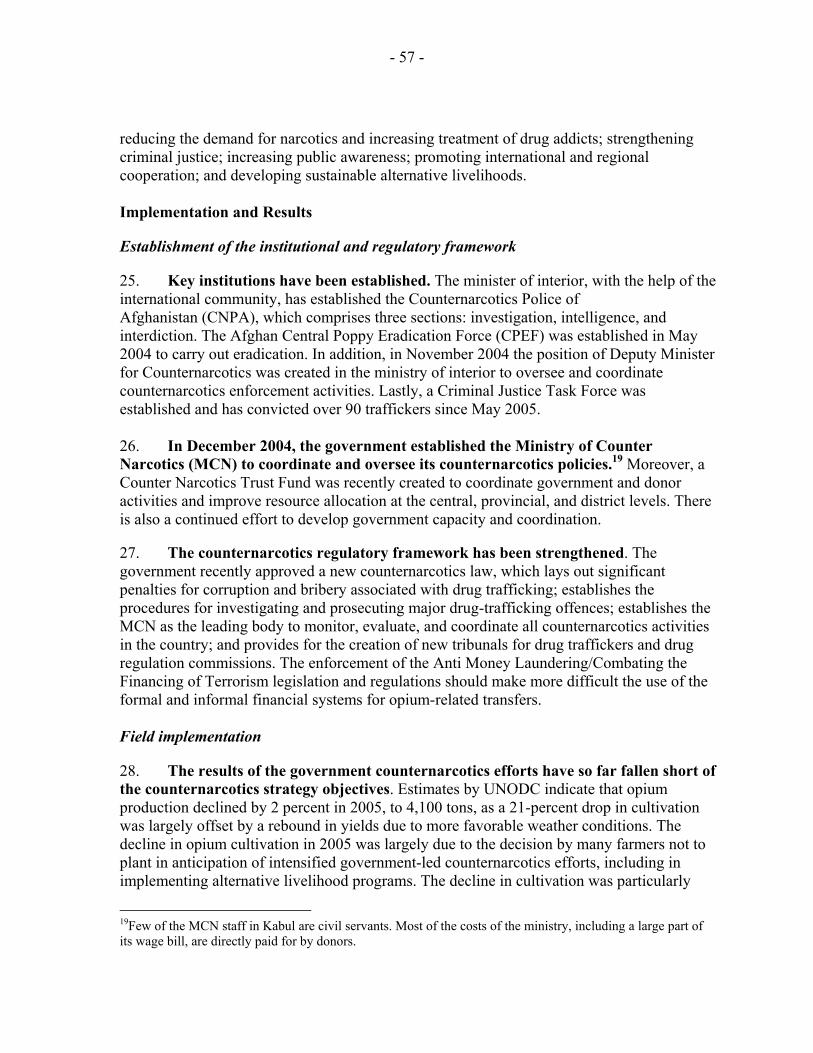
- 57 -
reducing the demand for narcotics and increasing treatment of drug addicts; strengthening criminal justice; increasing public awareness; promoting international and regional cooperation; and developing sustainable alternative livelihoods. Implementation and Results
Establishment of the institutional and regulatory framework
25. Key institutions have been established. The minister of interior, with the help of the international community, has established the Counternarcotics Police of Afghanistan (CNPA), which comprises three sections: investigation, intelligence, and interdiction. The Afghan Central Poppy Eradication Force (CPEF) was established in May 2004 to carry out eradication. In addition, in November 2004 the position of Deputy Minister for Counternarcotics was created in the ministry of interior to oversee and coordinate counternarcotics enforcement activities. Lastly, a Criminal Justice Task Force was established and has convicted over 90 traffickers since May 2005. 26. In December 2004, the government established the Ministry of Counter Narcotics (MCN) to coordinate and oversee its counternarcotics policies.19 Moreover, a Counter Narcotics Trust Fund was recently created to coordinate government and donor activities and improve resource allocation at the central, provincial, and district levels. There is also a continued effort to develop government capacity and coordination. 27. The counternarcotics regulatory framework has been strengthened. The government recently approved a new counternarcotics law, which lays out significant penalties for corruption and bribery associated with drug trafficking; establishes the procedures for investigating and prosecuting major drug-trafficking offences; establishes the MCN as the leading body to monitor, evaluate, and coordinate all counternarcotics activities in the country; and provides for the creation of new tribunals for drug traffickers and drug regulation commissions. The enforcement of the Anti Money Laundering/Combating the Financing of Terrorism legislation and regulations should make more difficult the use of the formal and informal financial systems for opium-related transfers. Field implementation
28. The results of the government counternarcotics efforts have so far fallen short of the counternarcotics strategy objectives. Estimates by UNODC indicate that opium production declined by 2 percent in 2005, to 4,100 tons, as a 21-percent drop in cultivation was largely offset by a rebound in yields due to more favorable weather conditions. The decline in opium cultivation in 2005 was largely due to the decision by many farmers not to plant in anticipation of intensified government-led counternarcotics efforts, including in implementing alternative livelihood programs. The decline in cultivation was particularly
19Few of the MCN staff in Kabul are civil servants. Most of the costs of the ministry, including a large part of its wage bill, are directly paid for by donors.
- 58 -
marked in the five highest producing provinces, which accounted for 68 percent of production in 2004, and where production declined by 53 percent. Cultivation in the other provinces increased by 48 percent, reflecting in part the ability of the drug economy to relocate in response to the counternarcotics efforts (Figure III.2). Reflecting a slight decline in prices, export and farm gate values declined by 4 percent and 7 percent, respectively, to $2.7 billion and $560 million. Although efforts so far have not had the desired degree of success, it is likely the expansion of the drug economy over the last few years would have been more vigorous without them.
29. Interdiction increased sharply in 2004–05, albeit from a low base. In 2005, 86.6 tons of opium and 7.7 tons of heroin were seized, corresponding overall to about 3.4 percent of opium production. This compares with seizures equivalent to 0.4 percent of production in 2002 and 2003.20 The sharp increase in 2005 reflected a strengthening of the Afghan Special Narcotics Force (ASNF) assigned to interdiction, as well as greater activity and effectiveness by the counternarcotics police. Law enforcement organizations, including the ASNF under the office of the president, the CNPA, and customs have been authorized to carry out operations to counter the physical trafficking of drugs. 30. Eradication amounted to 5,100 hectares in 2005, equivalent to about 5 percent of cultivated areas. Some 4,000 hectares were eradicated by the provincial authorities, the majority of which were in Nangarhar (46 percent) and Hilmand (26 percent). In addition, 1,100 hectares were eradicated by the central government agencies (CPEF and Afghan National Police). This latter figure was lower than targeted, owing in part to an exceptionally 20UNODC (2005b).
Figure III.2. Islamic Republic of Afghanistan: Opium Cultivation by Province, 2002–2005
(In hectares)
0
10000
20000
30000
40000
50000
60000
70000
Badakshan Hilmand Nangarhar Uruzgan Ghor Other provinces 2002 2003 2004 2005 Sources: UNODC (2005a); and Fund staff estimates.
- 59 -
harsh winter, which delayed CPEF’s operations; strong opposition from local farmers; and limited cooperation from local authorities. Eradication worked more efficiently as a deterrent to planting, as it contributed significantly to “voluntary eradication” (the decision by many farmers not to plant because their production could be eradicated) (Table III.6). A new system (including a central Eradication Planning and Monitoring Cell within the MCN) has been established to help governors and the Afghan Eradication Force to plan, execute, and monitor eradication efforts.
Table III.6. Islamic Republic of Afghanistan: Main Factors Influencing Farmers’
Decisions to Cultivate Opium, 2005
Source: UNODC (2005a). 31. Further progress in the implementation of alternative livelihood programs is needed. Owing to capacity and security constraints, the implementation of alternative livelihoods programs, as with most other development expenditures, has been lagging behind projected plans and budget estimates. Moreover, so far, a large number of interventions labeled as alternative livelihood interventions have been of a short-term nature, focused on a single sector (such as micro-finance and infrastructure), and insufficiently coordinated geographically and between donors.
D. Macroeconomic Impact of a Counternarcotics Campaign
32. The macroeconomic effects of a counternarcotics campaign will depend on the campaign’s policies, as different policies create different incentives/disincentives for farmers and traffickers. For instance, eradication tends to raise farm gate prices due to lower production, while interdiction tends to lower farm gate prices by reducing the demand of traffickers. Moreover, the development of sustainable alternative livelihoods is key to convincing farmers to quit, or not to return to opium production. In addition to the distributional differences between traffickers and farmers, the impact of counternarcotics efforts will vary substantially among provinces.
33. To simulate the possible macroeconomic impact of the opium economy and counternarcotics efforts, a simple macroeconomic model was developed. This model,
Main reasons for reducing opium cultivation Main reasons for increasing opium cultivationor not cultivating opium Fear of eradication 34.8% Higher sale price 25.8%Fear of imprisonment 19.7% Personal consumption 20.6%Forbidden by Islam 15.7% High cost of wedding 15.7%Poppy ban 15.3% Higher demand 14.5%Lower opium prices 4.9% Expected compensation for eradication 7.3%Less demand 4.7% "Salaam" 5.6%Higher input costs 2.8% Low cost of inputs 5.6%No more "salaam" 1.6% Sufficient water 2.8%
- 60 -
which is based in part on the Corden and Neary model of Dutch disease, seeks to capture the key transmissions channels described above (see Annex I). Given the uncertainty surrounding various economic relationships and the value of a number of economic variables, the model aims primarily at illustrating, through normative simulations, the potential economic impact of different counternarcotics strategies. The simulations are discussed in this section.
34. A successful counternarcotics campaign could adversely affect licit GDP growth, the balance of payments, and government revenue. Based on the transmission channels described earlier, a decline in drug income would, at least temporarily, lead to a slowdown in real growth in the non-drug economy and a deterioration of the balance of payments, putting downward pressure on the real exchange rate.21 The relative magnitude of the shock to GDP would be less pronounced to the extent that the burden falls on traffickers, owing to their lower propensity to consume. On the external side, the large capital outflows and large import content associated with drug revenue suggest that the impact on the balance of payments would be substantially less than the total decline in drug revenue. The slowdown in growth and the decline in imports will in turn have an adverse effect on government revenue. However, it is likely that this loss of revenue would be more than offset by savings on security and enforcement spending.
Long-term impact: reducing Dutch disease
35. In the long run, the reallocation of resources to the non-drug sector will allow higher growth in the licit economy. In macroeconomic terms, the elimination of the drug economy has some similarities with a drop in oil revenue in an oil-producing country, with the decline in the risk-adjusted profitability of opium production leading to a shift of capital and labor toward the non-drug economy. At the same time, the loss of income resulting from the elimination of the opium economy will contribute to a reduction in aggregate demand. 36. Over time, the increase in opium production costs will affect the relative comparative advantage of Afghanistan in opium. Thus, in view of its relatively high rate of return, opium production is likely to move, at least partly, to other countries. The drop in Afghan opium production will then translate directly into a decline in opium export receipts. Moreover, the reallocation of labor to the licit economy, combined with a decline in aggregate demand, will contribute to a depreciation of the real exchange rate and an improvement of the non-drug trade balance, stemming from lower domestic demand and a higher supply of tradable items. The elimination of opium-related activities should also contribute to improving the business environment, and thereby to increasing domestic and foreign investment.
21However, the more inelastic the world demand for opium, the greater the possibility that the short-term impact on drug-related income might actually be positive.
- 61 -
Short-term and medium-term impact
37. The short- and medium-term effects of the government’s counternarcotics efforts will differ substantially according to the strategy implemented. The effects of eradication and interdiction are discussed below. Eradication
38. In the short term, eradication will lead to a reallocation of opium-related income from traffickers to farmers (Table III.7). The primary impact of eradication is a decline in opium supply at the farm gate stemming from the decision by farmers not to plant due to a higher risk premium and direct impact of eradication. This decline may be partly offset by the drawdown of inventories, which, together with the increase in border prices, would limit somewhat, the decline in overall export revenue.22 Given the observed low elasticity of the traffickers’ demand for opium to farm gate prices, the allocation of revenue among the different actors would change markedly, as the higher farm gate prices resulting from lower supply would increase the share of revenue accruing to non-eradicated farmers, to the detriment of traders/traffickers. The potential social impact of a successful eradication campaign would, however, be substantial for the farmers that ceased to produce opium, either involuntarily (direct eradication) or by choice (voluntary eradication), as they would experience a sharp drop in income. The loss of income would be particularly acute for the farmers whose production has been directly eradicated, as most of them have to reimburse debts contracted to finance their new production of opium. The reallocation of opium revenue in favor of non-eradicated farmers, who have a higher propensity to consume than traffickers, could limit the impact of eradication on aggregate demand, or even result in an increase in aggregate demand.23 Lastly, the decline in labor demand in the drug sector could put downward pressure on wages in the non-drug sector, affecting positively its competitiveness.
39. In the medium term, the increase in farm gate prices may partly offset the impact of eradication on opium production. As the scope for a drawdown of inventories fades, there will be a significant increase in farm gate prices. This increase could induce some farmers to return to opium cultivation, even in the face of a higher risk premium, especially if the eradication campaign is not accompanied by sustainable alternative livelihood programs. While export prices may increase, the overall drug revenue is likely to decline, squeezing further the share of revenue accruing to traders/traffickers.24 Although the 22Given its current share of world opium supply, Afghanistan can be considered, in the short-term, as a price-setter on the international opium market. In the medium- to long-term, given the opium industry’s ability to relocate in response to changes in costs or counternarcotics policies, Afghanistan would become a price-taker.
23Considering the traders/traffickers’ high propensity to invest, some sectors, such as construction and trade could, however, face substantially lower demand. 24To avoid such a decline in their income, the traffickers might try to discourage the government’s eradication efforts, thereby triggering a deterioration of the security situation.
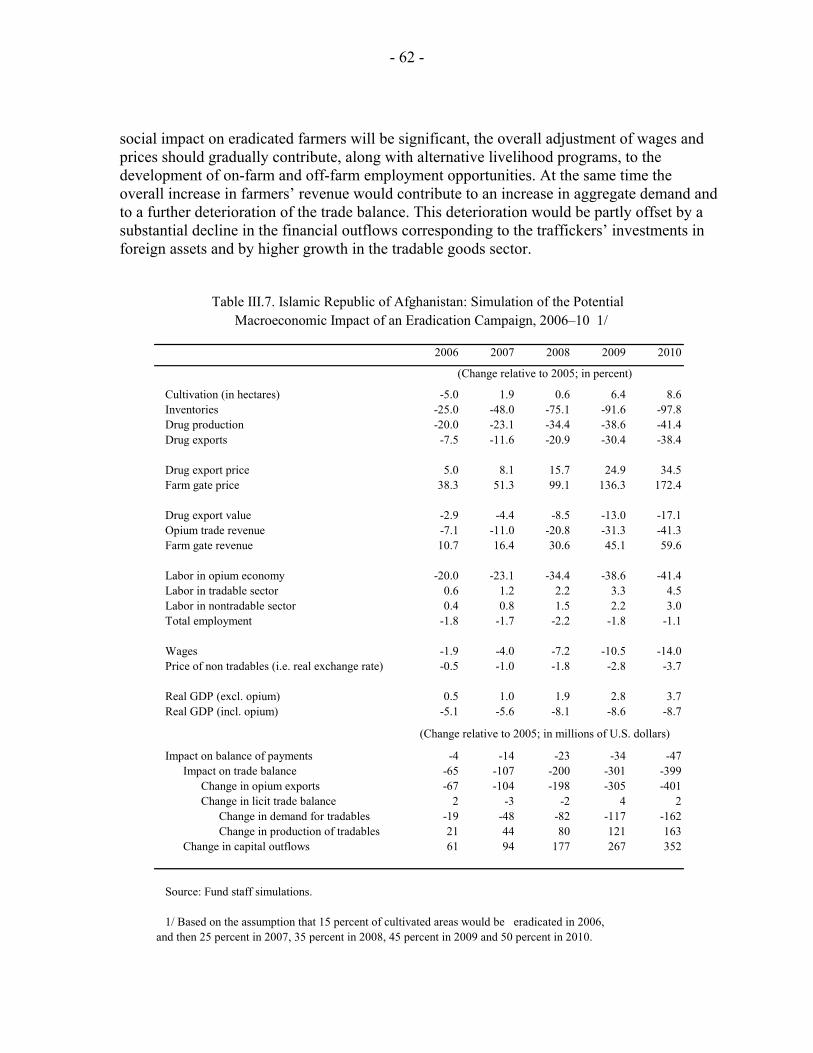
- 62 -
social impact on eradicated farmers will be significant, the overall adjustment of wages and prices should gradually contribute, along with alternative livelihood programs, to the development of on-farm and off-farm employment opportunities. At the same time the overall increase in farmers’ revenue would contribute to an increase in aggregate demand and to a further deterioration of the trade balance. This deterioration would be partly offset by a substantial decline in the financial outflows corresponding to the traffickers’ investments in foreign assets and by higher growth in the tradable goods sector.
2006 2007 2008 2009 2010
Cultivation (in hectares) -5.0 1.9 0.6 6.4 8.6Inventories -25.0 -48.0 -75.1 -91.6 -97.8Drug production -20.0 -23.1 -34.4 -38.6 -41.4Drug exports -7.5 -11.6 -20.9 -30.4 -38.4
Drug export price 5.0 8.1 15.7 24.9 34.5Farm gate price 38.3 51.3 99.1 136.3 172.4
Drug export value -2.9 -4.4 -8.5 -13.0 -17.1Opium trade revenue -7.1 -11.0 -20.8 -31.3 -41.3Farm gate revenue 10.7 16.4 30.6 45.1 59.6
Labor in opium economy -20.0 -23.1 -34.4 -38.6 -41.4Labor in tradable sector 0.6 1.2 2.2 3.3 4.5Labor in nontradable sector 0.4 0.8 1.5 2.2 3.0Total employment -1.8 -1.7 -2.2 -1.8 -1.1
Wages -1.9 -4.0 -7.2 -10.5 -14.0Price of non tradables (i.e. real exchange rate) -0.5 -1.0 -1.8 -2.8 -3.7
Real GDP (excl. opium) 0.5 1.0 1.9 2.8 3.7Real GDP (incl. opium) -5.1 -5.6 -8.1 -8.6 -8.7
Impact on balance of payments -4 -14 -23 -34 -47Impact on trade balance -65 -107 -200 -301 -399
Change in opium exports -67 -104 -198 -305 -401Change in licit trade balance 2 -3 -2 4 2
Change in demand for tradables -19 -48 -82 -117 -162Change in production of tradables 21 44 80 121 163
Change in capital outflows 61 94 177 267 352
Source: Fund staff simulations.
1/ Based on the assumption that 15 percent of cultivated areas would be eradicated in 2006, and then 25 percent in 2007, 35 percent in 2008, 45 percent in 2009 and 50 percent in 2010.
(Change relative to 2005; in percent)
(Change relative to 2005; in millions of U.S. dollars)
Table III.7. Islamic Republic of Afghanistan: Simulation of the Potential Macroeconomic Impact of an Eradication Campaign, 2006–10 1/
- 63 -
Interdiction
40. Although targeted to traffickers, interdiction would also affect opium farmers through lower farm gate prices (Table III.8). By increasing the risk premium associated with opium trading activities and bringing to an end the activities of some traffickers, interdiction would contribute to a reduction of both demand at the farm gate and supply at the border. Overall, the traffickers able to continue their operations would benefit from higher border prices and see their revenue increase, especially if they dispose of inventories. On the contrary, the decline in demand at the farm gate would lead to a reduction in farmers’ income.
41. The interdiction campaign should lead to a substantial improvement of the balance of payments. The decline in the farmers’ income should result in a substantial reduction of aggregate demand, including for traded goods. Moreover, the decline in labor costs relative to the price of tradable goods should boost investment and production in the tradable goods sector. Overall, the resulting improvement in the licit trade balance would largely offset the deterioration of the illicit balance of payments stemming from the reduction of opium exports and the increase in opium-related outflows associated with the higher income obtained by traffickers.25 Policy response
A multi-pronged approach
42. The successful implementation of the eradication and interdiction campaign is predicated on the authorities’ making a serious effort to address corruption. Corruption has been a major factor in explaining the limited success of the counternarcotics efforts thus far. The intensification of counternarcotics efforts could temporarily exacerbate the problem, as traffickers will be likely to use all means to oppose these efforts. Addressing this problem will require a strong political commitment from the government. 43. Sustainable income generation programs must be put in place to support the eradication and interdiction campaigns. The counternarcotics enforcement efforts will have a substantial social impact on some (eradication) or all (interdiction) opium-cultivating farmers. In particular, a campaign based solely on eradication and interdiction would result in a significant increase in unemployment (Table III.9). While the farmers may in the
25The threat of seizure could induce even further capital flight by encouraging some traffickers to move their existing assets abroad to protect them from increased scrutiny. This capital flight is, however, likely to be limited, as most of the traffickers’ assets are either foreign assets or real estate, which might prove somewhat illiquid.
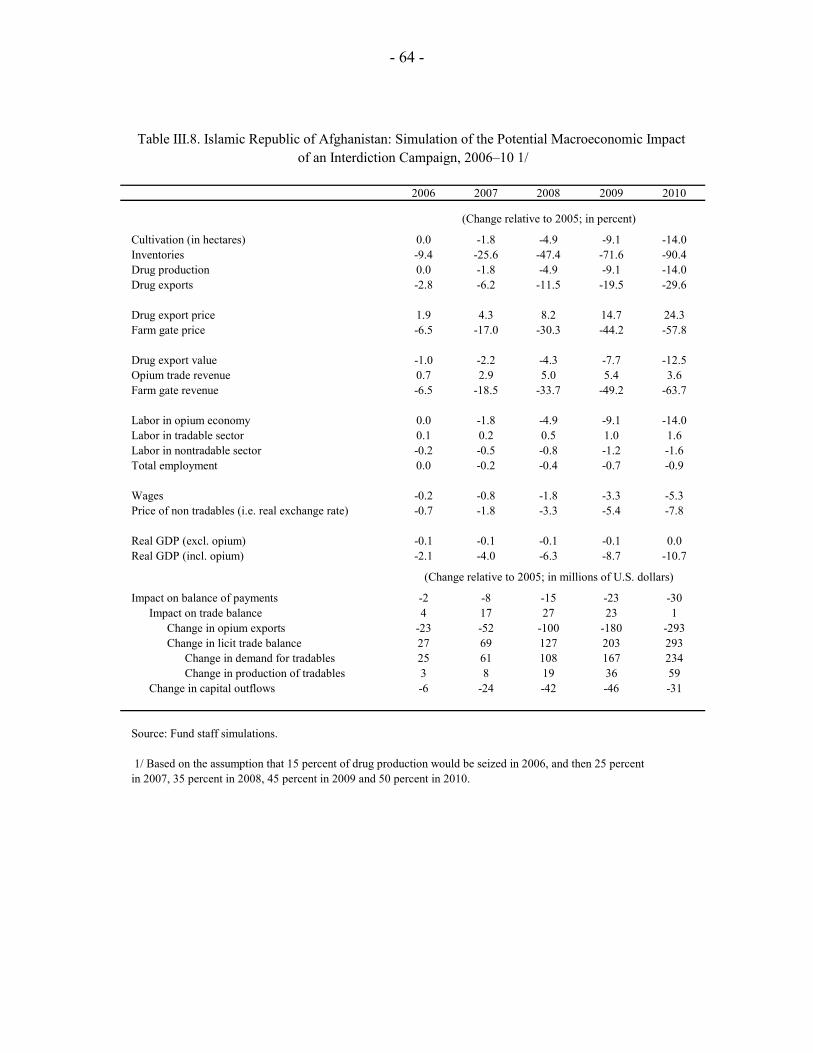
- 64 -
2006 2007 2008 2009 2010
Cultivation (in hectares) 0.0 -1.8 -4.9 -9.1 -14.0Inventories -9.4 -25.6 -47.4 -71.6 -90.4Drug production 0.0 -1.8 -4.9 -9.1 -14.0Drug exports -2.8 -6.2 -11.5 -19.5 -29.6
Drug export price 1.9 4.3 8.2 14.7 24.3Farm gate price -6.5 -17.0 -30.3 -44.2 -57.8
Drug export value -1.0 -2.2 -4.3 -7.7 -12.5Opium trade revenue 0.7 2.9 5.0 5.4 3.6Farm gate revenue -6.5 -18.5 -33.7 -49.2 -63.7
Labor in opium economy 0.0 -1.8 -4.9 -9.1 -14.0Labor in tradable sector 0.1 0.2 0.5 1.0 1.6Labor in nontradable sector -0.2 -0.5 -0.8 -1.2 -1.6Total employment 0.0 -0.2 -0.4 -0.7 -0.9
Wages -0.2 -0.8 -1.8 -3.3 -5.3Price of non tradables (i.e. real exchange rate) -0.7 -1.8 -3.3 -5.4 -7.8
Real GDP (excl. opium) -0.1 -0.1 -0.1 -0.1 0.0Real GDP (incl. opium) -2.1 -4.0 -6.3 -8.7 -10.7
Impact on balance of payments -2 -8 -15 -23 -30Impact on trade balance 4 17 27 23 1
Change in opium exports -23 -52 -100 -180 -293Change in licit trade balance 27 69 127 203 293
Change in demand for tradables 25 61 108 167 234Change in production of tradables 3 8 19 36 59
Change in capital outflows -6 -24 -42 -46 -31
Source: Fund staff simulations.
1/ Based on the assumption that 15 percent of drug production would be seized in 2006, and then 25 percent in 2007, 35 percent in 2008, 45 percent in 2009 and 50 percent in 2010.
(Change relative to 2005; in percent)
(Change relative to 2005; in millions of U.S. dollars)
Table III.8. Islamic Republic of Afghanistan: Simulation of the Potential Macroeconomic Impact of an Interdiction Campaign, 2006–10 1/
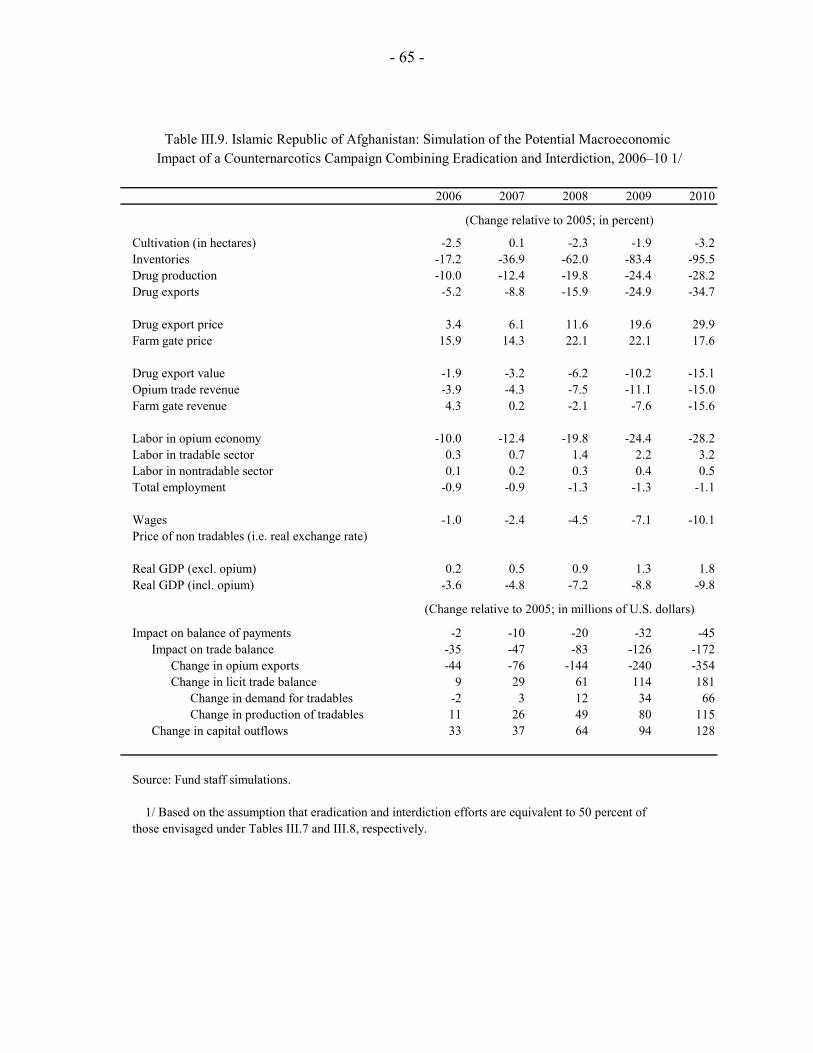
- 65 -
2006 2007 2008 2009 2010
Cultivation (in hectares) -2.5 0.1 -2.3 -1.9 -3.2Inventories -17.2 -36.9 -62.0 -83.4 -95.5Drug production -10.0 -12.4 -19.8 -24.4 -28.2Drug exports -5.2 -8.8 -15.9 -24.9 -34.7
Drug export price 3.4 6.1 11.6 19.6 29.9Farm gate price 15.9 14.3 22.1 22.1 17.6
Drug export value -1.9 -3.2 -6.2 -10.2 -15.1Opium trade revenue -3.9 -4.3 -7.5 -11.1 -15.0Farm gate revenue 4.3 0.2 -2.1 -7.6 -15.6
Labor in opium economy -10.0 -12.4 -19.8 -24.4 -28.2Labor in tradable sector 0.3 0.7 1.4 2.2 3.2Labor in nontradable sector 0.1 0.2 0.3 0.4 0.5Total employment -0.9 -0.9 -1.3 -1.3 -1.1
Wages -1.0 -2.4 -4.5 -7.1 -10.1Price of non tradables (i.e. real exchange rate)
Real GDP (excl. opium) 0.2 0.5 0.9 1.3 1.8Real GDP (incl. opium) -3.6 -4.8 -7.2 -8.8 -9.8
Impact on balance of payments -2 -10 -20 -32 -45Impact on trade balance -35 -47 -83 -126 -172
Change in opium exports -44 -76 -144 -240 -354Change in licit trade balance 9 29 61 114 181
Change in demand for tradables -2 3 12 34 66Change in production of tradables 11 26 49 80 115
Change in capital outflows 33 37 64 94 128
Source: Fund staff simulations.
1/ Based on the assumption that eradication and interdiction efforts are equivalent to 50 percent of those envisaged under Tables III.7 and III.8, respectively.
(Change relative to 2005; in percent)
(Change relative to 2005; in millions of U.S. dollars)
Table III.9. Islamic Republic of Afghanistan: Simulation of the Potential Macroeconomic Impact of a Counternarcotics Campaign Combining Eradication and Interdiction, 2006–10 1/
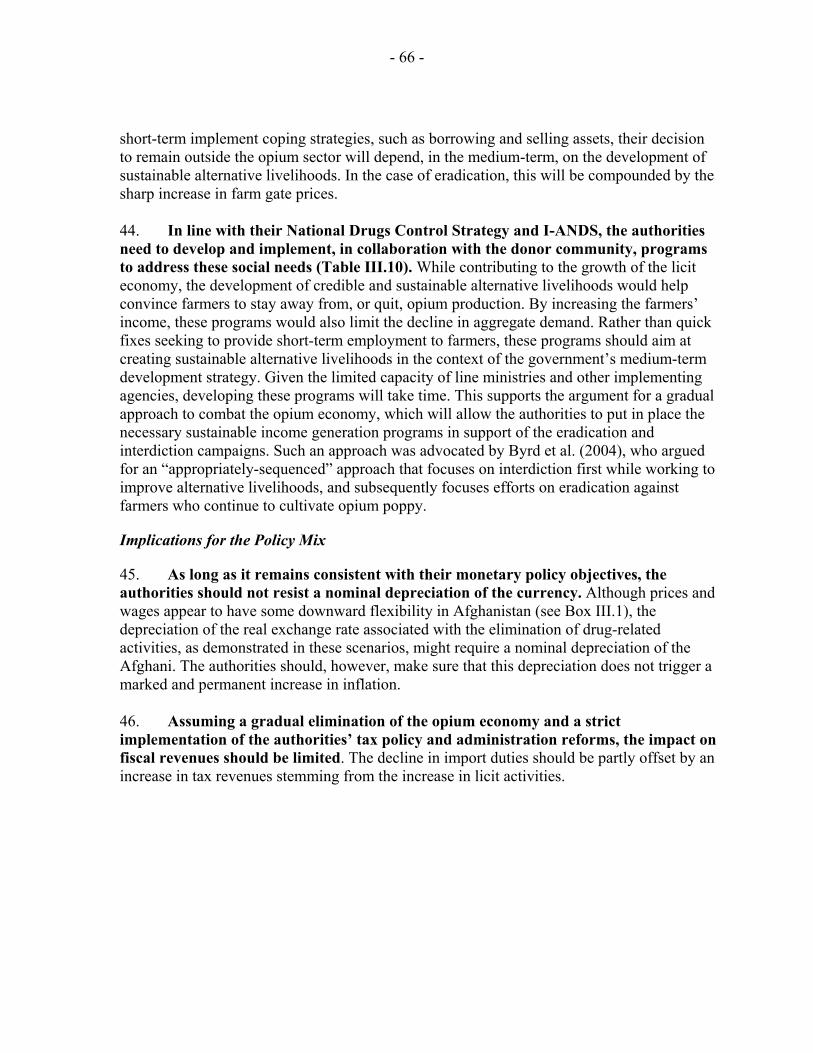
- 66 -
short-term implement coping strategies, such as borrowing and selling assets, their decision to remain outside the opium sector will depend, in the medium-term, on the development of sustainable alternative livelihoods. In the case of eradication, this will be compounded by the sharp increase in farm gate prices. 44. In line with their National Drugs Control Strategy and I-ANDS, the authorities need to develop and implement, in collaboration with the donor community, programs to address these social needs (Table III.10). While contributing to the growth of the licit economy, the development of credible and sustainable alternative livelihoods would help convince farmers to stay away from, or quit, opium production. By increasing the farmers’ income, these programs would also limit the decline in aggregate demand. Rather than quick fixes seeking to provide short-term employment to farmers, these programs should aim at creating sustainable alternative livelihoods in the context of the government’s medium-term development strategy. Given the limited capacity of line ministries and other implementing agencies, developing these programs will take time. This supports the argument for a gradual approach to combat the opium economy, which will allow the authorities to put in place the necessary sustainable income generation programs in support of the eradication and interdiction campaigns. Such an approach was advocated by Byrd et al. (2004), who argued for an “appropriately-sequenced” approach that focuses on interdiction first while working to improve alternative livelihoods, and subsequently focuses efforts on eradication against farmers who continue to cultivate opium poppy.
Implications for the Policy Mix
45. As long as it remains consistent with their monetary policy objectives, the authorities should not resist a nominal depreciation of the currency. Although prices and wages appear to have some downward flexibility in Afghanistan (see Box III.1), the depreciation of the real exchange rate associated with the elimination of drug-related activities, as demonstrated in these scenarios, might require a nominal depreciation of the Afghani. The authorities should, however, make sure that this depreciation does not trigger a marked and permanent increase in inflation. 46. Assuming a gradual elimination of the opium economy and a strict implementation of the authorities’ tax policy and administration reforms, the impact on fiscal revenues should be limited. The decline in import duties should be partly offset by an increase in tax revenues stemming from the increase in licit activities.
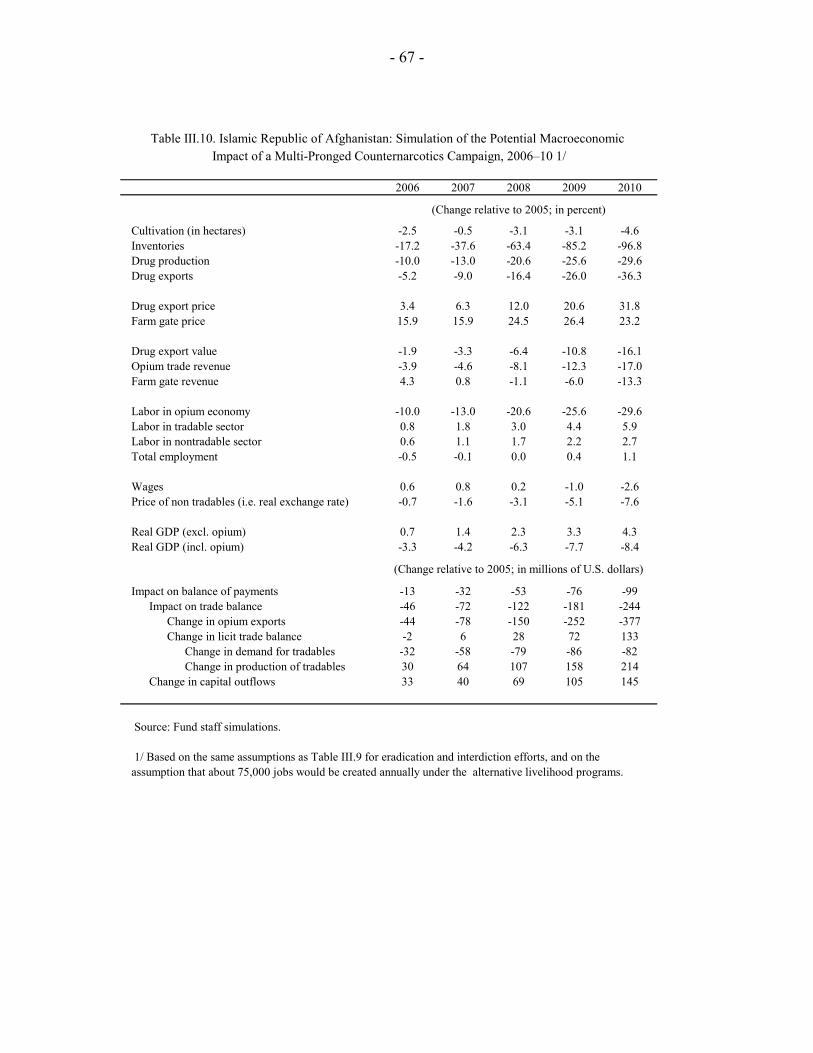
- 67 -
2006 2007 2008 2009 2010
Cultivation (in hectares) -2.5 -0.5 -3.1 -3.1 -4.6Inventories -17.2 -37.6 -63.4 -85.2 -96.8Drug production -10.0 -13.0 -20.6 -25.6 -29.6Drug exports -5.2 -9.0 -16.4 -26.0 -36.3
Drug export price 3.4 6.3 12.0 20.6 31.8Farm gate price 15.9 15.9 24.5 26.4 23.2
Drug export value -1.9 -3.3 -6.4 -10.8 -16.1Opium trade revenue -3.9 -4.6 -8.1 -12.3 -17.0Farm gate revenue 4.3 0.8 -1.1 -6.0 -13.3
Labor in opium economy -10.0 -13.0 -20.6 -25.6 -29.6Labor in tradable sector 0.8 1.8 3.0 4.4 5.9Labor in nontradable sector 0.6 1.1 1.7 2.2 2.7Total employment -0.5 -0.1 0.0 0.4 1.1
Wages 0.6 0.8 0.2 -1.0 -2.6Price of non tradables (i.e. real exchange rate) -0.7 -1.6 -3.1 -5.1 -7.6
Real GDP (excl. opium) 0.7 1.4 2.3 3.3 4.3Real GDP (incl. opium) -3.3 -4.2 -6.3 -7.7 -8.4
Impact on balance of payments -13 -32 -53 -76 -99Impact on trade balance -46 -72 -122 -181 -244
Change in opium exports -44 -78 -150 -252 -377Change in licit trade balance -2 6 28 72 133
Change in demand for tradables -32 -58 -79 -86 -82Change in production of tradables 30 64 107 158 214
Change in capital outflows 33 40 69 105 145
Source: Fund staff simulations.
1/ Based on the same assumptions as Table III.9 for eradication and interdiction efforts, and on the assumption that about 75,000 jobs would be created annually under the alternative livelihood programs.
(Change relative to 2005; in percent)
(Change relative to 2005; in millions of U.S. dollars)
Table III.10. Islamic Republic of Afghanistan: Simulation of the Potential Macroeconomic Impact of a Multi-Pronged Counternarcotics Campaign, 2006–10 1/
- 68 -
Box III.1: Impact of the Counternarcotics Campaign in Nangarhar1
Combining moral suasion and eradication, the counternarcotics campaign was highly successful in reducing opium cultivation in the Nangarhar province. While Nangarhar was the largest opium producer in 2004,1/ opium cultivation in the province declined by 96 percent, from 28,213 hectares in 2004 and to 1,093 hectares in 2005. Although eradication contributed directly with only 1,860 hectares, this sharp decline reflected mainly the decision of many farmers not to plant, owing primarily to fear of eradication or imprisonment, to the ban imposed by the authorities, and to relatively low farm gate prices (especially relative to wheat, whose prices had increased following the poor 2004 crop). The decline in opium cultivation was more pronounced than in the other provinces owing to the local authorities’ strong involvement in the counternarcotics campaign, with particular emphasis on prevention. Informed by the provincial governor that they would be held responsible for the level of opium poppy cultivation in the areas under their responsibility, district administrators and security chiefs called tribal elders and the shura members from each village to the district centre and informed them that they should not cultivate poppy.2/ These admonitions were accompanied by promises of development assistance.
The sharp decline in production had a substantial social and economic impact. While slightly offset by a rebound in yields, opium production declined by about 95 percent. This translated into a sharp decline in farmers’ income, as the cash income from opium was only partly replaced by revenue from alternative crops. Moreover, as most farmers shifted to wheat cultivation (areas planted with wheat increased from 36,000 to 51,000 hectares), which is much less labor intensive than opium, the demand for hired labor fell sharply. The consequent decline in aggregate demand (see below) from farmers and other drug industry actors led to a sharp reduction in activity in other sectors, in particular construction. In response to the lower demand for labor and goods, wages and prices declined significantly, and some skilled workers moved to other provinces.
Many farmers had to rely on short-term coping strategies. The income loss attributable to the reduction in opium production was only partly offset by the revenue stemming from alternative crops and work opportunities, including by alternative livelihood programs. While this revenue was in some cases complemented by the sale of assets (primarily livestock) and, less often, by some borrowing, most farmers had to reduce consumption substantially, including for food and health expenditures.
In the absence of credible alternatives, many farmers might return to opium production in 2006. Most of the coping strategies implemented by the farmers, such as the sale of assets or borrowing to finance subsistence consumption, are not sustainable. Moreover, contrary to vineyards or orchards, which require multi-year investments, the planting of wheat does not entail sunken costs, which implies that returning to opium production would not be costly. Finally, most farmers consider that the opportunities provided by the alternative livelihood programs are largely insufficient and fall short of the authorities’ promises. In this context, faced with the need to replenish their assets, service their debts and fund their spending, many farmers may choose to produce opium in 2006. Preventing such a backlash will depend crucially on the continued involvement of the local and central authorities by contributing to the development of credible and sustainable alternative sources of revenue.
1 Based on the estimates of UNODC (2005a) and the findings of Mansfield (2005). 2 While cultivated areas were slightly higher in the Hilmand province, in Nangarhar higher yields translated into higher production.
- 69 - ANNEX I
Model of the Macroeconomic Impact of the Opium Economy A model was developed to simulate the possible macroeconomic impact of the opium economy and counternarcotics efforts. This model is based in part on the Corden and Neary model of Dutch disease. There are three sectors, namely nontradable (NT), tradable (T) and a booming third sector, which in the case of Afghanistan is the opium sector (D). The production of opium is totally exported, and labor is perfectly mobile between all three sectors.1 To be able to model the impact of different forms of counternarcotics efforts (eradication, interdiction, alternative livelihoods, prevention) on the licit economy, the drug sector was further divided between farmers and traffickers. Given its large share in the world supply of opium, Afghanistan is not considered a price taker on the opium market (i.e. the opium export price depends on the Afghan supply). The model is dynamic, allowing opium price developments to affect the farmer’s decision to cultivate in the following year. As in the Corden and Neary model, the opium economy influences the licit sector equilibrium through: (a) a resource movement which induces a reallocation of labor between sectors; and (b) a spending effect corresponding to the impact of change in opium-related income on the demand for tradables and nontradables. The traded good is the numeraire. Exogenous variables:
rpi: risk premium for traffickers, increasing function of interdiction efforts; rpe: risk premium for farmers, increasing function of eradication efforts; alt: incentives related to the development of alternative livelihood programs; eradication: opium directly eradicated; interdiction: opium seized; Yield: opium yield. Endogenous variables:
PD: opium price at the border (in terms of tradables); YD: opium supply by the traders/traffickers; Inv: opium inventories, which are assumed to be held by traders and traffickers; DD: Demand for opium outside Afghanistan; PFG: opium farm gate price(in terms of tradables); Cult: opium cultivation; Yfg: opium supply at the farm gate; Dfg: Demand for opium by the traffickers/traders (at the farm gate); w: wage rate; Y: real GDP, including opium income staying in Afghanistan; L: total employment;
1Corden et al. (1982).
- 70 - ANNEX I
LT, LNT: labor in tradable and nontradable sectors, respectively; PNT: price of the nontradables (in terms of tradables—can be interpreted as the real exchange rate); 1. The opium sector Equilibrium at the border
• The demand for opium declines with the opium export price:2 )P(D DD
−
; • The supply of opium at the border by traffickers increases with the opium export price and declines with the farm gate price and the risk premium (which is related to
interdiction efforts): );P,P(Y FGDD
−−+
irp ; • The propensity of traffickers to deplete their inventories will depend on the level of current prices compared to average historical prices: )∆
+
DP( Inv ; • The opium market equilibrium of the at the border reads: on interdicti -InvYD DD ∆+= . Equilibrium at the farm gate
• The demand for opium by traffickers is equivalent to the amount they want to supply:
DiFGDFG Y)rp;P,P(D =−−−
; • Cultivation rises with increases in farm gate prices and declines with the premium related to eradication efforts and with wages: );w,P(C FG
−−+
erpult ; • The supply of opium at the farm gate increases with the cultivation and the yield, and declines with direct eradication. neradicatioYieldult −= *CYfg ;
• The opium market equilibrium at the farm gate reads: fgY=FGD .
2. The licit economy (tradables and nontradables) Tradable sector • The demand for labor in the nontradable sector is an increasing function of
nontradable prices and a declining function of wages: )w,P(L NT
−+
NT • The production of nontradables is an increasing function of labor employed in the sector:
)L(Y NT
+
NT • The demand for nontradables, which are consumed domestically, declines with nontradable prices and increases with the real income: ),(D NT
−+
NTPY • The equilibrium in the nontradable sector reads: NTNT YD =
2While overall demand may be somewhat inelastic, Afghanistan is competing with other providers.
- 71 - ANNEX I
Tradable sector • The demand for labor in the tradable sector is a declining function of wages:3 )w(L
−
T • The production of tradables is an increasing function of labor employed in the sector:
)L(Y T
+
T • The domestic demand for nontradables increases with the real income, corrected for the share of the traffickers’ revenue staying abroad: )(DT
+Y
3. Overall equilibrium The completion of the model comes from the equilibrium of the labor market. • It is assumed that, in the absence of alternative livelihoods, the farmers/workers leaving the drug sector will be likely to experience unemployment for some time.
),...)2(),1(,( −∆−∆∆∆++−
DDD LLLL • The equilibrium on the labor market reads: LDNTT =++ LLL
3The tradable good is used as the numeraire, which implies that is price is constantly equal to 1.
- 72 -
References
Byrd, William and Christopher Ward, 2004: “Afghanistan’s Opium Drug Economy,” World Bank, Report No. SASPR-5, December 2004.
Corden, W. Max and J. Peter Neary, 1982: “Booming Sector and De-Industrialization in a Small Open Economy,” The Economic Journal, Vol. 92, pp. 825–48, December 1982.
FAO (2005a). “Afghanistan. Agricultural Prospects Report (June/July 2005),” August 2005.
—— (2005b). “Afghanistan. Agricultural Prospects Report (August/September 2005),” October 2005.
Grace, Jo and Adam Pain, 2004: “Rethinking Rural Livelihoods in Afghanistan,” Afghanistan Research and Evaluation Unit, Synthesis Paper Series, July 2004.
IMF Country Report No. 03/299, 2003 “The Poppy Dimension in the Afghan Economy,” Annex II.1, September 2003.
Mansfield, David, 2004: “Understanding Rural Livelihoods and Addressing the Causes of Opium Poppy Cultivation in Nangarhar and Laghman, Eastern Afghanistan,” Project for Alternative Livelihoods in Eastern Afghanistan, internal document No. 2, December 2004.
——, 2005: “Pariah or Poverty? The Opium Ban in the Province of Nangarhar” in the 2004/05 “Growing Season and its Impact on Rural Livelihood Strategies,” Project for Alternative Livelihoods in Eastern Afghanistan, internal document No. 11, June 2005.
——, 2006: “Economical With the Truth: The Limits of Price and Profitability in both Explaining Opium Poppy Cultivation in Afghanistan and in Designing Effective Responses,” In A. Pain and J. Sutton (eds), forthcoming.
Steiner, Roberto, 1998: “Colombia’s Income from the Drug Trade,” World Development, Vol. 26, No. 6, pp. 1013–31, June 1998.
Transitional Islamic State of Afghanistan (2003). “5-year Strategy (1381–86) for Tackling Illicit Drug Problems in Afghanistan,” May 18, 2003.
UNDCP, (1994). “The Illicit Opiate Industry of Pakistan,” Draft study, 1994.
UNODC, (2004). “Colombia, Coca Cultivation Survey for 2003,” June 2004.
—— (2005a). “Afghanistan, Opium Survey 2005,” November 2005.
—— (2005b). “World Drug Report, 2005,” June 2005.
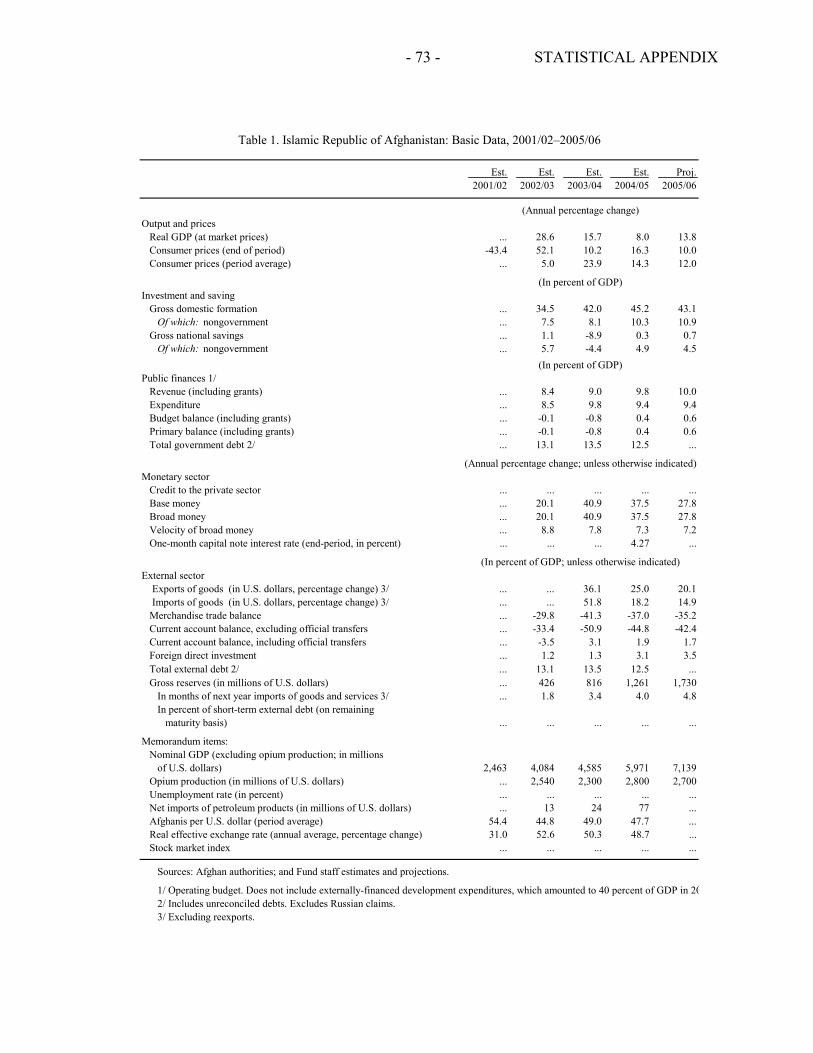
- 73 - STATISTICAL APPENDIX
Est. Est. Est. Est. Proj.2001/02 2002/03 2003/04 2004/05 2005/06
Output and pricesReal GDP (at market prices) ... 28.6 15.7 8.0 13.8Consumer prices (end of period) -43.4 52.1 10.2 16.3 10.0Consumer prices (period average) ... 5.0 23.9 14.3 12.0
Investment and savingGross domestic formation ... 34.5 42.0 45.2 43.1
Of which: nongovernment ... 7.5 8.1 10.3 10.9 Gross national savings ... 1.1 -8.9 0.3 0.7 Of which: nongovernment ... 5.7 -4.4 4.9 4.5
Public finances 1/Revenue (including grants) ... 8.4 9.0 9.8 10.0Expenditure ... 8.5 9.8 9.4 9.4Budget balance (including grants) ... -0.1 -0.8 0.4 0.6Primary balance (including grants) ... -0.1 -0.8 0.4 0.6Total government debt 2/ ... 13.1 13.5 12.5 ...
Monetary sector Credit to the private sector ... ... ... ... ...
Base money ... 20.1 40.9 37.5 27.8Broad money ... 20.1 40.9 37.5 27.8Velocity of broad money ... 8.8 7.8 7.3 7.2One-month capital note interest rate (end-period, in percent) ... ... ... 4.27 ...
External sector Exports of goods (in U.S. dollars, percentage change) 3/ ... ... 36.1 25.0 20.1 Imports of goods (in U.S. dollars, percentage change) 3/ ... ... 51.8 18.2 14.9
Merchandise trade balance ... -29.8 -41.3 -37.0 -35.2Current account balance, excluding official transfers ... -33.4 -50.9 -44.8 -42.4Current account balance, including official transfers ... -3.5 3.1 1.9 1.7Foreign direct investment ... 1.2 1.3 3.1 3.5Total external debt 2/ ... 13.1 13.5 12.5 ...Gross reserves (in millions of U.S. dollars) ... 426 816 1,261 1,730
In months of next year imports of goods and services 3/ ... 1.8 3.4 4.0 4.8In percent of short-term external debt (on remaining
maturity basis) ... ... ... ... ...
Memorandum items:Nominal GDP (excluding opium production; in millions
of U.S. dollars) 2,463 4,084 4,585 5,971 7,139Opium production (in millions of U.S. dollars) ... 2,540 2,300 2,800 2,700
Unemployment rate (in percent) ... ... ... ... ...Net imports of petroleum products (in millions of U.S. dollars) ... 13 24 77 ...Afghanis per U.S. dollar (period average) 54.4 44.8 49.0 47.7 ...Real effective exchange rate (annual average, percentage change) 31.0 52.6 50.3 48.7 ...Stock market index ... ... ... ... ...
Sources: Afghan authorities; and Fund staff estimates and projections.
1/ Operating budget. Does not include externally-financed development expenditures, which amounted to 40 percent of GDP in 202/ Includes unreconciled debts. Excludes Russian claims.3/ Excluding reexports.
Table 1. Islamic Republic of Afghanistan: Basic Data, 2001/02–2005/06
(In percent of GDP)
(Annual percentage change; unless otherwise indicated)
(In percent of GDP; unless otherwise indicated)
(Annual percentage change)
(In percent of GDP)
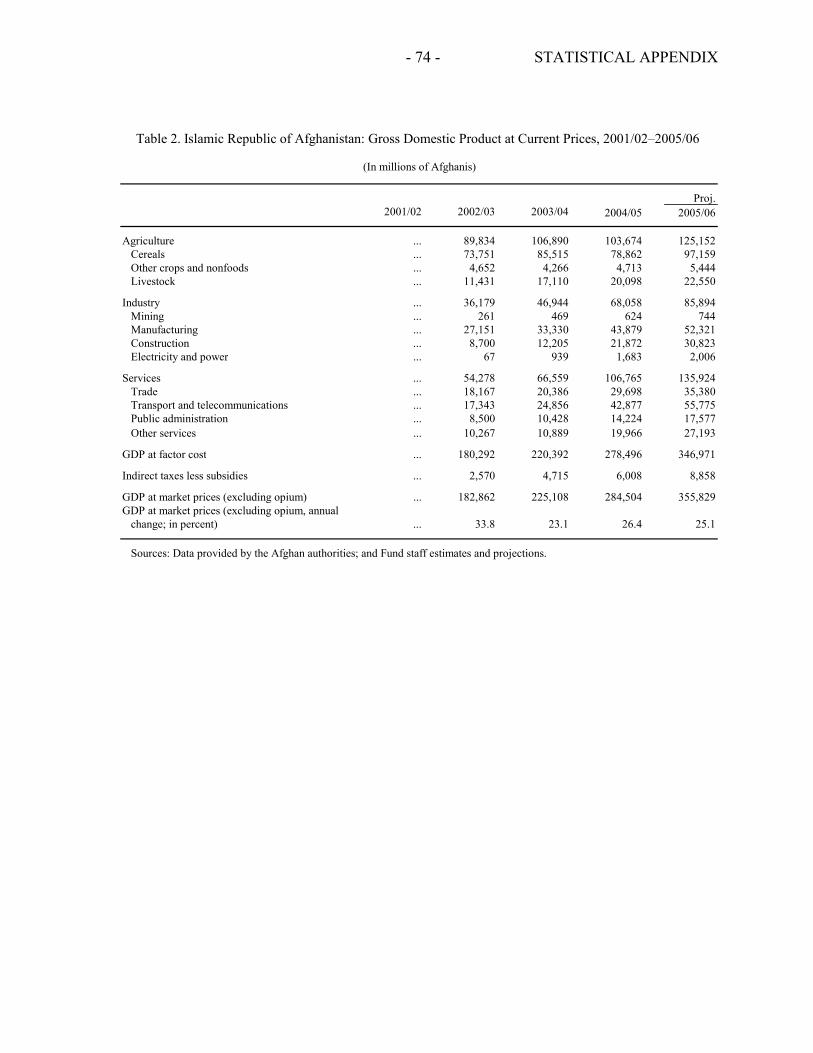
- 74 - STATISTICAL APPENDIX
Proj.2001/02 2002/03 2003/04 2004/05 2005/06
Agriculture ... 89,834 106,890 103,674 125,152Cereals ... 73,751 85,515 78,862 97,159Other crops and nonfoods ... 4,652 4,266 4,713 5,444Livestock ... 11,431 17,110 20,098 22,550
Industry ... 36,179 46,944 68,058 85,894Mining ... 261 469 624 744Manufacturing ... 27,151 33,330 43,879 52,321Construction ... 8,700 12,205 21,872 30,823Electricity and power ... 67 939 1,683 2,006
Services ... 54,278 66,559 106,765 135,924Trade ... 18,167 20,386 29,698 35,380Transport and telecommunications ... 17,343 24,856 42,877 55,775Public administration ... 8,500 10,428 14,224 17,577Other services ... 10,267 10,889 19,966 27,193
GDP at factor cost ... 180,292 220,392 278,496 346,971
Indirect taxes less subsidies ... 2,570 4,715 6,008 8,858
GDP at market prices (excluding opium) ... 182,862 225,108 284,504 355,829GDP at market prices (excluding opium, annual
change; in percent) ... 33.8 23.1 26.4 25.1
Sources: Data provided by the Afghan authorities; and Fund staff estimates and projections.
(In millions of Afghanis)
Table 2. Islamic Republic of Afghanistan: Gross Domestic Product at Current Prices, 2001/02–2005/06
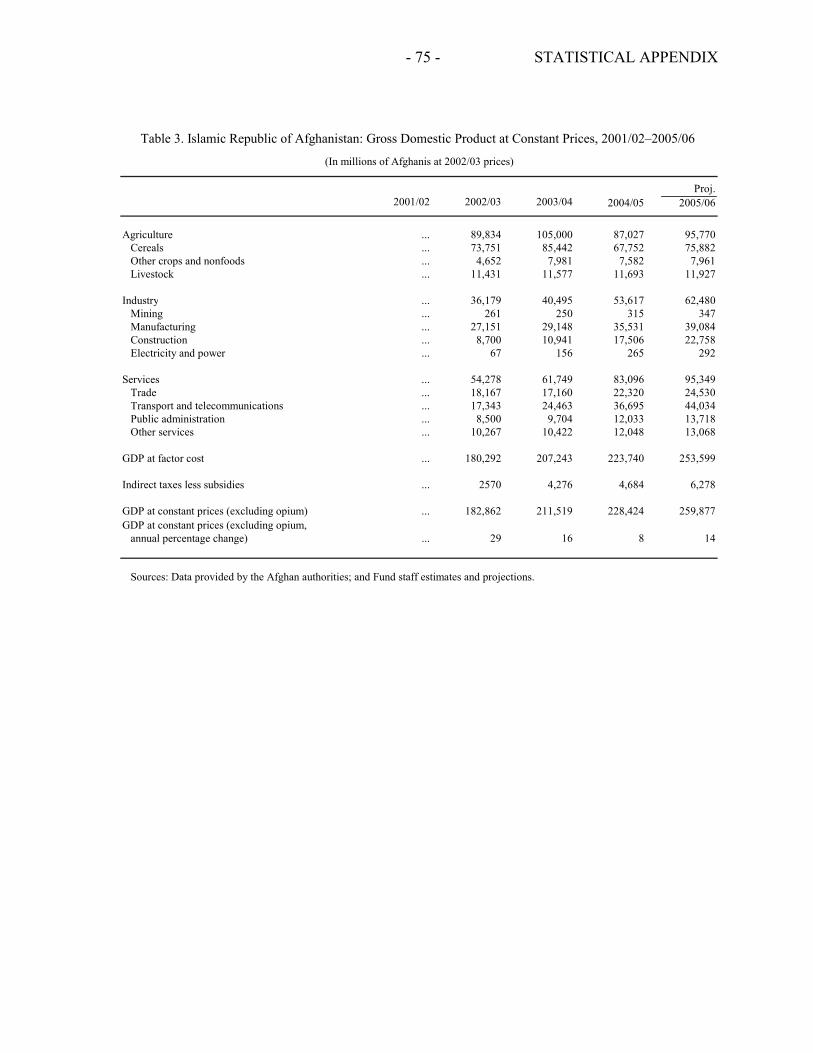
- 75 - STATISTICAL APPENDIX
Proj.2001/02 2002/03 2003/04 2004/05 2005/06
Agriculture ... 89,834 105,000 87,027 95,770Cereals ... 73,751 85,442 67,752 75,882Other crops and nonfoods ... 4,652 7,981 7,582 7,961Livestock ... 11,431 11,577 11,693 11,927
Industry ... 36,179 40,495 53,617 62,480Mining ... 261 250 315 347Manufacturing ... 27,151 29,148 35,531 39,084Construction ... 8,700 10,941 17,506 22,758Electricity and power ... 67 156 265 292
Services ... 54,278 61,749 83,096 95,349Trade ... 18,167 17,160 22,320 24,530Transport and telecommunications ... 17,343 24,463 36,695 44,034Public administration ... 8,500 9,704 12,033 13,718Other services ... 10,267 10,422 12,048 13,068
GDP at factor cost ... 180,292 207,243 223,740 253,599
Indirect taxes less subsidies ... 2570 4,276 4,684 6,278
GDP at constant prices (excluding opium) ... 182,862 211,519 228,424 259,877GDP at constant prices (excluding opium,
annual percentage change) ... 29 16 8 14
Sources: Data provided by the Afghan authorities; and Fund staff estimates and projections.
Table 3. Islamic Republic of Afghanistan: Gross Domestic Product at Constant Prices, 2001/02–2005/06
(In millions of Afghanis at 2002/03 prices)
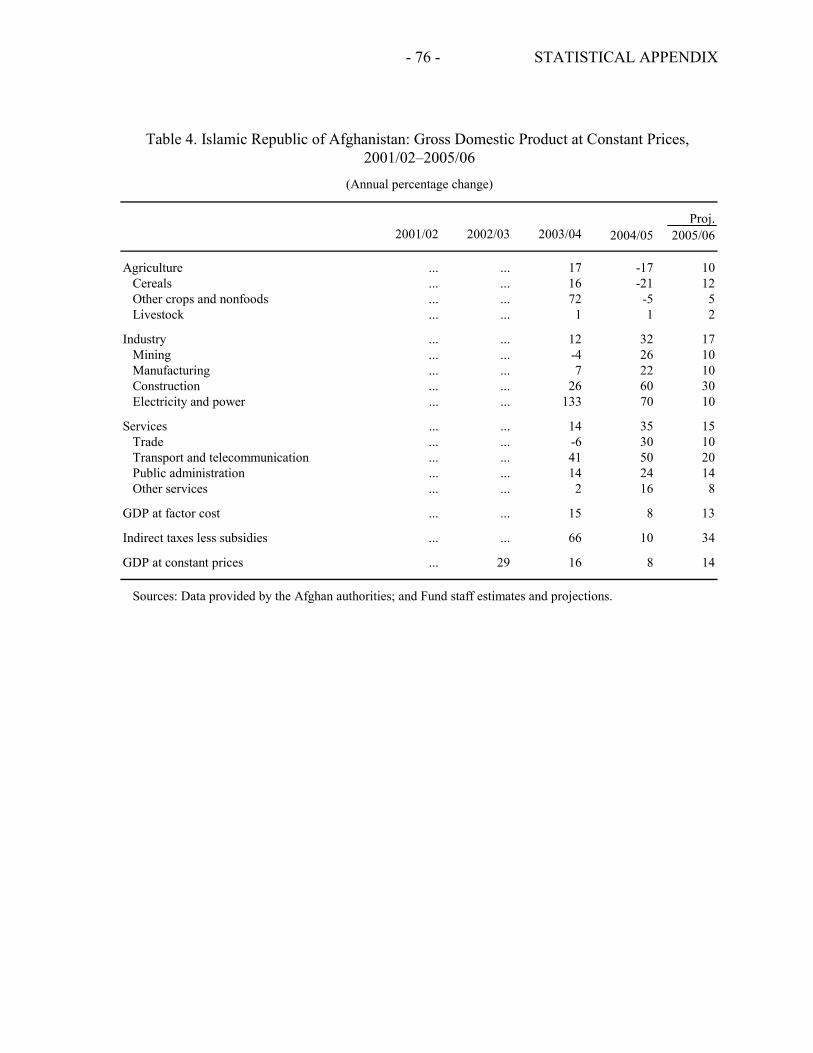
- 76 - STATISTICAL APPENDIX
Proj.2001/02 2002/03 2003/04 2004/05 2005/06
Agriculture ... ... 17 -17 10Cereals ... ... 16 -21 12Other crops and nonfoods ... ... 72 -5 5Livestock ... ... 1 1 2
Industry ... ... 12 32 17Mining ... ... -4 26 10Manufacturing ... ... 7 22 10Construction ... ... 26 60 30Electricity and power ... ... 133 70 10
Services ... ... 14 35 15Trade ... ... -6 30 10Transport and telecommunication ... ... 41 50 20Public administration ... ... 14 24 14Other services ... ... 2 16 8
GDP at factor cost ... ... 15 8 13
Indirect taxes less subsidies ... ... 66 10 34
GDP at constant prices ... 29 16 8 14
Sources: Data provided by the Afghan authorities; and Fund staff estimates and projections.
(Annual percentage change)
2001/02–2005/06Table 4. Islamic Republic of Afghanistan: Gross Domestic Product at Constant Prices,
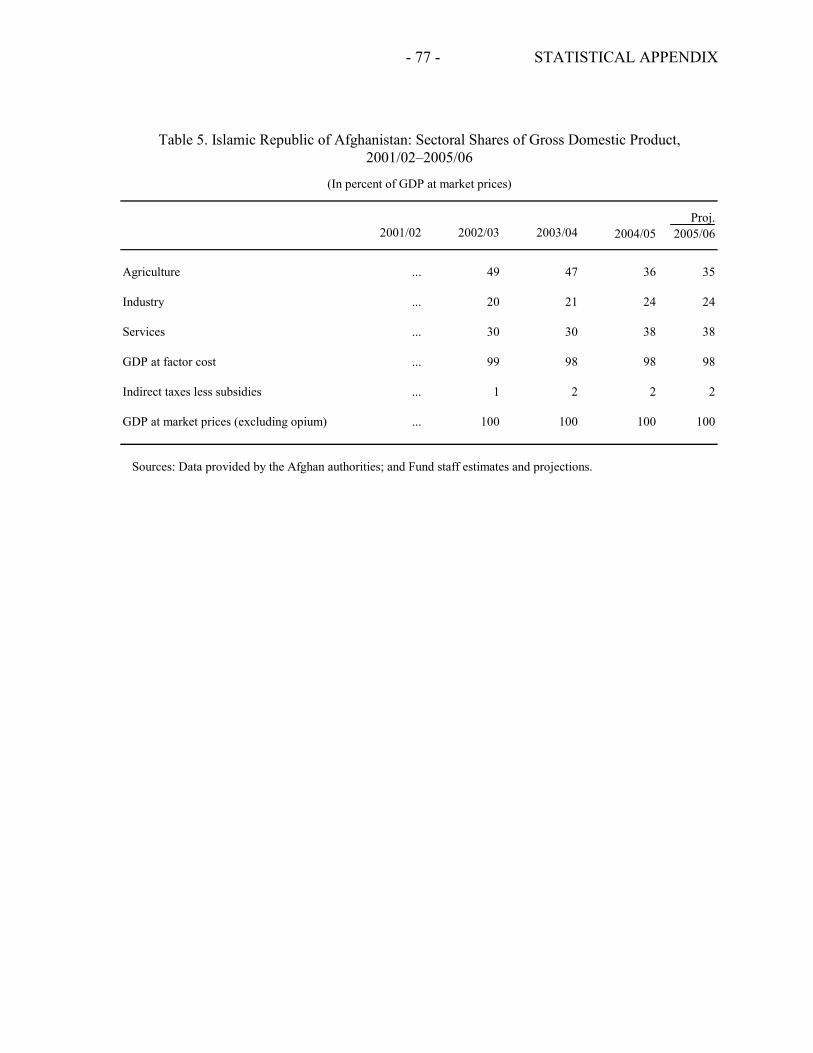
- 77 - STATISTICAL APPENDIX
Proj.2001/02 2002/03 2003/04 2004/05 2005/06
Agriculture ... 49 47 36 35
Industry ... 20 21 24 24
Services ... 30 30 38 38
GDP at factor cost ... 99 98 98 98
Indirect taxes less subsidies ... 1 2 2 2
GDP at market prices (excluding opium) ... 100 100 100 100
Sources: Data provided by the Afghan authorities; and Fund staff estimates and projections.
(In percent of GDP at market prices)
2001/02–2005/06Table 5. Islamic Republic of Afghanistan: Sectoral Shares of Gross Domestic Product,
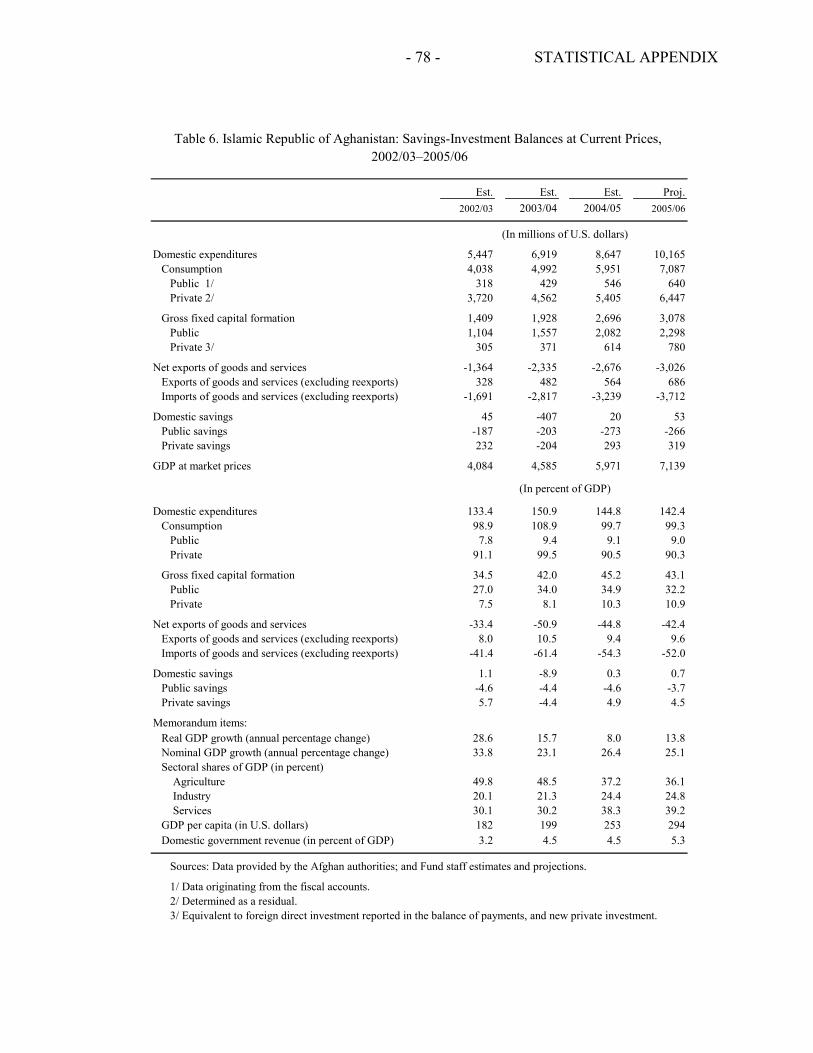
- 78 - STATISTICAL APPENDIX
Est. Est. Est. Proj.2002/03 2005/06
Domestic expenditures 5,447 6,919 8,647 10,165Consumption 4,038 4,992 5,951 7,087
Public 1/ 318 429 546 640Private 2/ 3,720 4,562 5,405 6,447
Gross fixed capital formation 1,409 1,928 2,696 3,078Public 1,104 1,557 2,082 2,298Private 3/ 305 371 614 780
Net exports of goods and services -1,364 -2,335 -2,676 -3,026Exports of goods and services (excluding reexports) 328 482 564 686Imports of goods and services (excluding reexports) -1,691 -2,817 -3,239 -3,712
Domestic savings 45 -407 20 53Public savings -187 -203 -273 -266Private savings 232 -204 293 319
GDP at market prices 4,084 4,585 5,971 7,139
Domestic expenditures 133.4 150.9 144.8 142.4Consumption 98.9 108.9 99.7 99.3
Public 7.8 9.4 9.1 9.0Private 91.1 99.5 90.5 90.3
Gross fixed capital formation 34.5 42.0 45.2 43.1Public 27.0 34.0 34.9 32.2Private 7.5 8.1 10.3 10.9
Net exports of goods and services -33.4 -50.9 -44.8 -42.4Exports of goods and services (excluding reexports) 8.0 10.5 9.4 9.6Imports of goods and services (excluding reexports) -41.4 -61.4 -54.3 -52.0
Domestic savings 1.1 -8.9 0.3 0.7Public savings -4.6 -4.4 -4.6 -3.7Private savings 5.7 -4.4 4.9 4.5
Memorandum items:Real GDP growth (annual percentage change) 28.6 15.7 8.0 13.8Nominal GDP growth (annual percentage change) 33.8 23.1 26.4 25.1Sectoral shares of GDP (in percent)
Agriculture 49.8 48.5 37.2 36.1 Industry 20.1 21.3 24.4 24.8 Services 30.1 30.2 38.3 39.2
GDP per capita (in U.S. dollars) 182 199 253 294Domestic government revenue (in percent of GDP) 3.2 4.5 4.5 5.3
Sources: Data provided by the Afghan authorities; and Fund staff estimates and projections.100.0 100.0 100.0 100.01/ Data originating from the fiscal accounts.2/ Determined as a residual. 3/ Equivalent to foreign direct investment reported in the balance of payments, and new private investment.
2002/03–2005/06
(In millions of U.S. dollars)
(In percent of GDP)
Table 6. Islamic Republic of Aghanistan: Savings-Investment Balances at Current Prices,
2003/04 2004/05
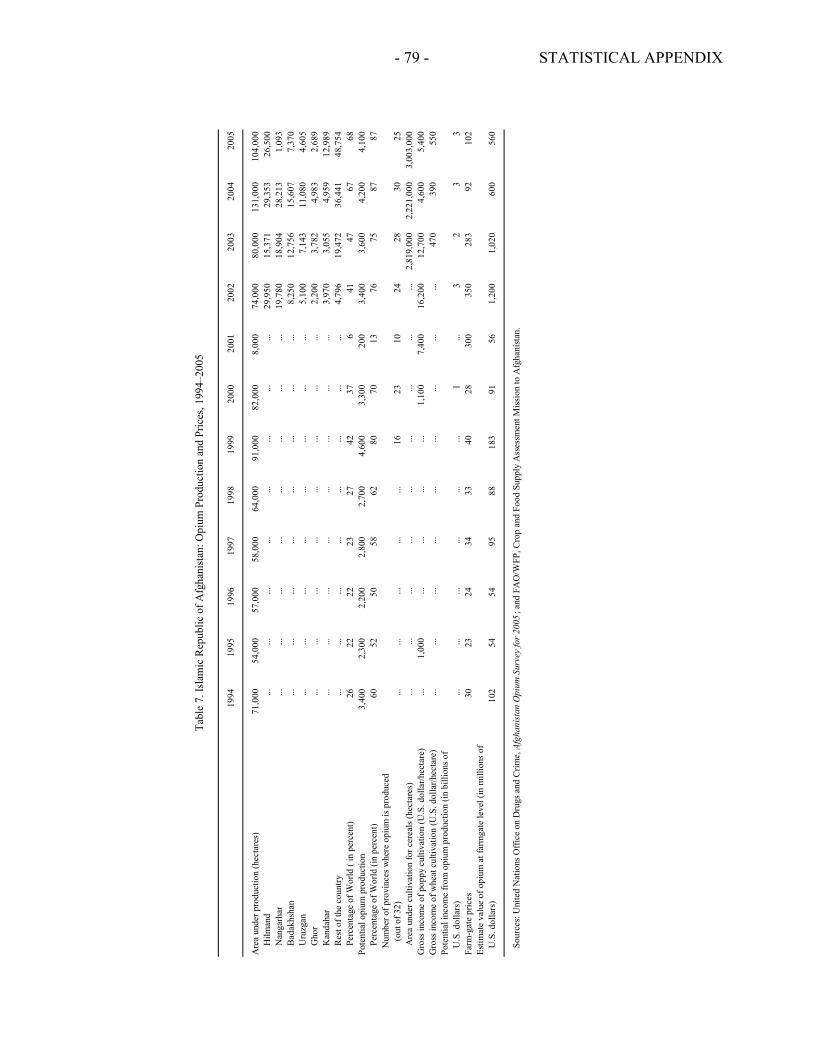
- 79 - STATISTICAL APPENDIX
1994
1995
1996
1997
1998
1999
2000
2001
2002
2003
2004
2005
Are
a un
der p
rodu
ctio
n (h
ecta
res)
71,0
0054
,000
57,0
0058
,000
64,0
0091
,000
82,0
008,
000
74,0
0080
,000
131,
000
104,
000
Hilm
and
...
......
......
......
...29
,950
15,3
7129
,353
26,5
00 N
anga
rhar
...
......
......
......
...19
,780
18,9
0428
,213
1,09
3 B
adak
hsha
n
......
......
......
......
8,25
012
,756
15,6
077,
370
Uru
zgan
...
......
......
......
...5,
100
7,14
311
,080
4,60
5 G
hor
......
......
......
......
2,20
03,
782
4,98
32,
689
Kan
daha
r ...
......
......
......
...3,
970
3,05
54,
959
12,9
89 R
est o
f the
cou
ntry
...
......
......
......
...4,
796
19,4
7236
,441
48,7
54 P
erce
ntag
e of
Wor
ld (
in p
erce
nt)
2622
2223
2742
376
4147
6768
Pote
ntia
l opi
um p
rodu
ctio
n3,
400
2,30
02,
200
2,80
02,
700
4,60
03,
300
200
3,40
03,
600
4,20
04,
100
Per
cent
age
of W
orld
(in
perc
ent)
6052
5058
6280
7013
7675
8787
Num
ber o
f pro
vinc
es w
here
opi
um is
pro
duce
d (o
ut o
f 32)
......
......
...16
2310
2428
3025
Are
a un
der c
ultiv
atio
n fo
r cer
eals
(hec
tare
s)...
......
......
......
......
2,81
9,00
02,
221,
000
3,00
3,00
0G
ross
inco
me
of p
oppy
cul
tivat
ion
(U.S
. dol
lar/h
ecta
re)
...1,
000
......
......
1,10
07,
400
16,2
0012
,700
4,60
05,
400
Gro
ss in
com
e of
whe
at c
ultiv
atio
n (U
.S. d
olla
r/hec
tare
)...
......
......
......
......
470
390
550
Pote
ntia
l inc
ome
from
opi
um p
rodu
ctio
n (in
bill
ions
of
U.S
. dol
lars
)...
......
......
...1
...3
23
3Fa
rm-g
ate
pric
es30
2324
3433
4028
300
350
283
9210
2Es
timat
e va
lue
of o
pium
at f
arm
gate
leve
l (in
mill
ions
of
U.S
. dol
lars
)10
254
5495
8818
391
561,
200
1,02
060
056
0
Sour
ces:
Uni
ted
Nat
ions
Offi
ce o
n D
rugs
and
Crim
e, A
fgha
nist
an O
pium
Sur
vey
for 2
005
; and
FA
O/W
FP, C
rop
and
Food
Sup
ply
Ass
essm
ent M
issio
n to
Afg
hani
stan.
Tabl
e 7.
Isla
mic
Rep
ublic
of A
fgha
nist
an: O
pium
Pro
duct
ion
and
Pric
es, 1
994–
2005
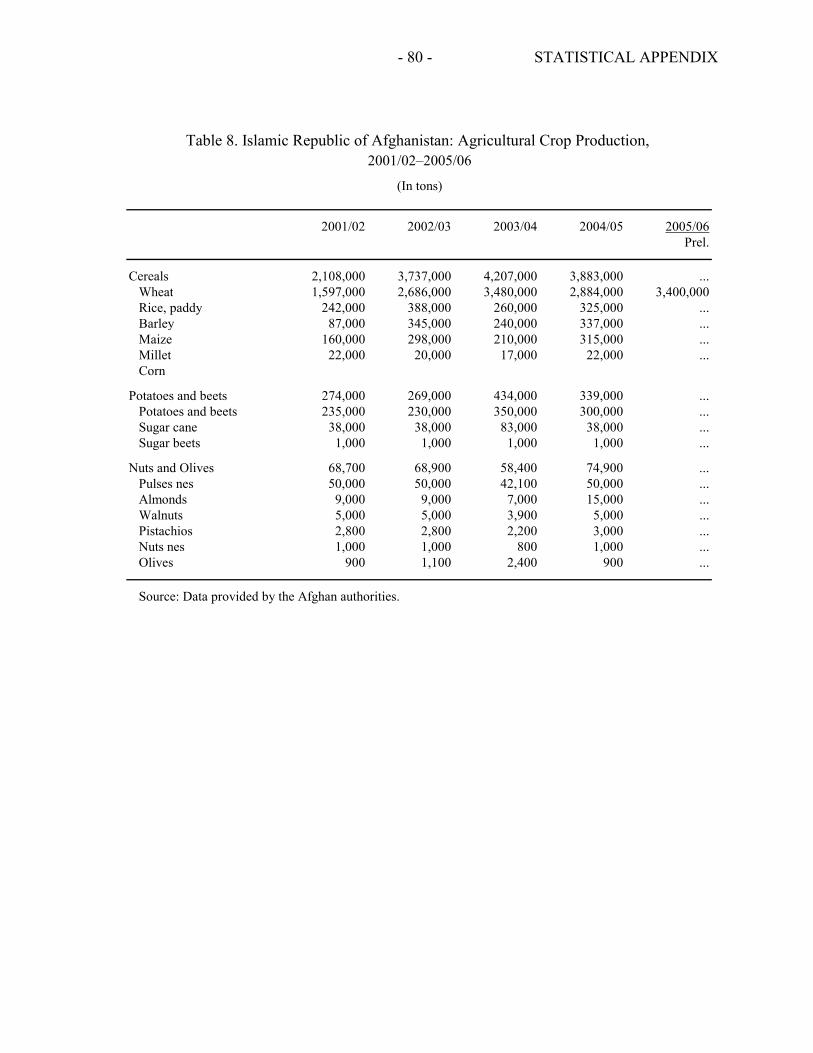
- 80 - STATISTICAL APPENDIX
2001/02 2002/03 2003/04 2004/05 2005/06Prel.
Cereals 2,108,000 3,737,000 4,207,000 3,883,000 ...Wheat 1,597,000 2,686,000 3,480,000 2,884,000 3,400,000Rice, paddy 242,000 388,000 260,000 325,000 ...Barley 87,000 345,000 240,000 337,000 ...Maize 160,000 298,000 210,000 315,000 ...Millet 22,000 20,000 17,000 22,000 ...Corn
Potatoes and beets 274,000 269,000 434,000 339,000 ...Potatoes and beets 235,000 230,000 350,000 300,000 ...Sugar cane 38,000 38,000 83,000 38,000 ...Sugar beets 1,000 1,000 1,000 1,000 ...
Nuts and Olives 68,700 68,900 58,400 74,900 ...Pulses nes 50,000 50,000 42,100 50,000 ...Almonds 9,000 9,000 7,000 15,000 ...Walnuts 5,000 5,000 3,900 5,000 ...Pistachios 2,800 2,800 2,200 3,000 ...Nuts nes 1,000 1,000 800 1,000 ...Olives 900 1,100 2,400 900 ...
Source: Data provided by the Afghan authorities.
(In tons)
Table 8. Islamic Republic of Afghanistan: Agricultural Crop Production, 2001/02–2005/06
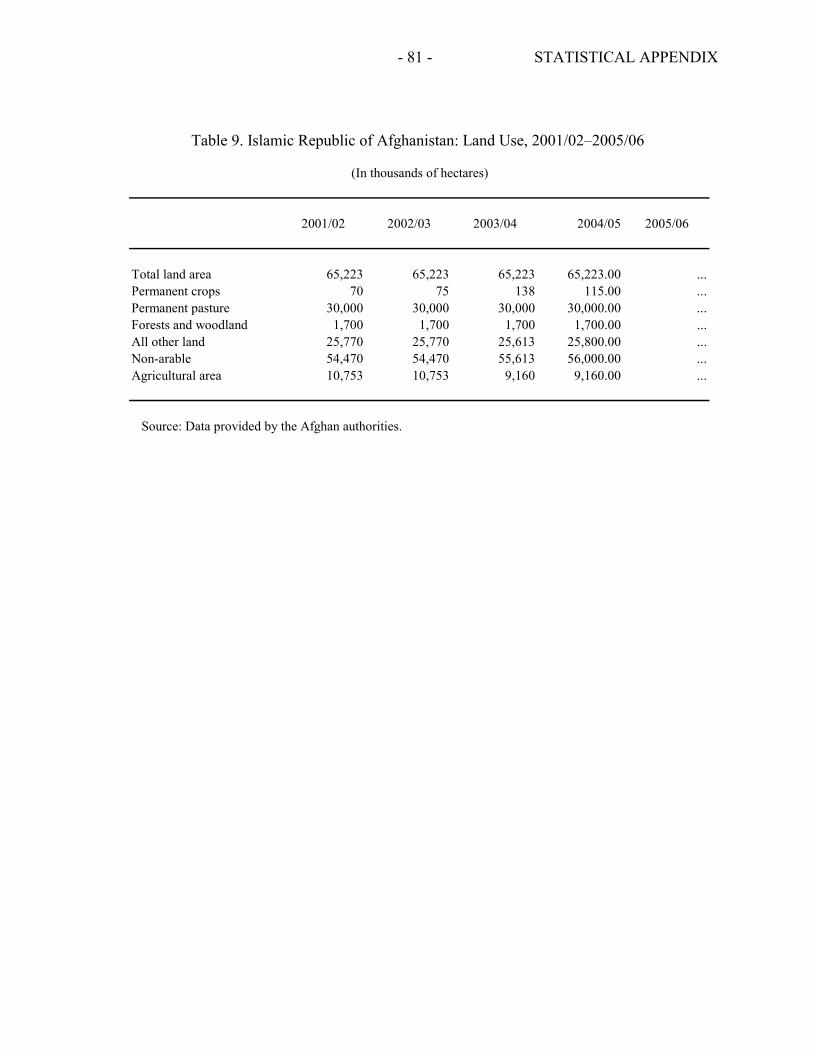
- 81 - STATISTICAL APPENDIX
2001/02 2002/03 2003/04 2004/05 2005/06
Total land area 65,223 65,223 65,223 65,223.00 ...Permanent crops 70 75 138 115.00 ...Permanent pasture 30,000 30,000 30,000 30,000.00 ...Forests and woodland 1,700 1,700 1,700 1,700.00 ...All other land 25,770 25,770 25,613 25,800.00 ...Non-arable 54,470 54,470 55,613 56,000.00 ...Agricultural area 10,753 10,753 9,160 9,160.00 ...
Source: Data provided by the Afghan authorities.
(In thousands of hectares)
Table 9. Islamic Republic of Afghanistan: Land Use, 2001/02–2005/06
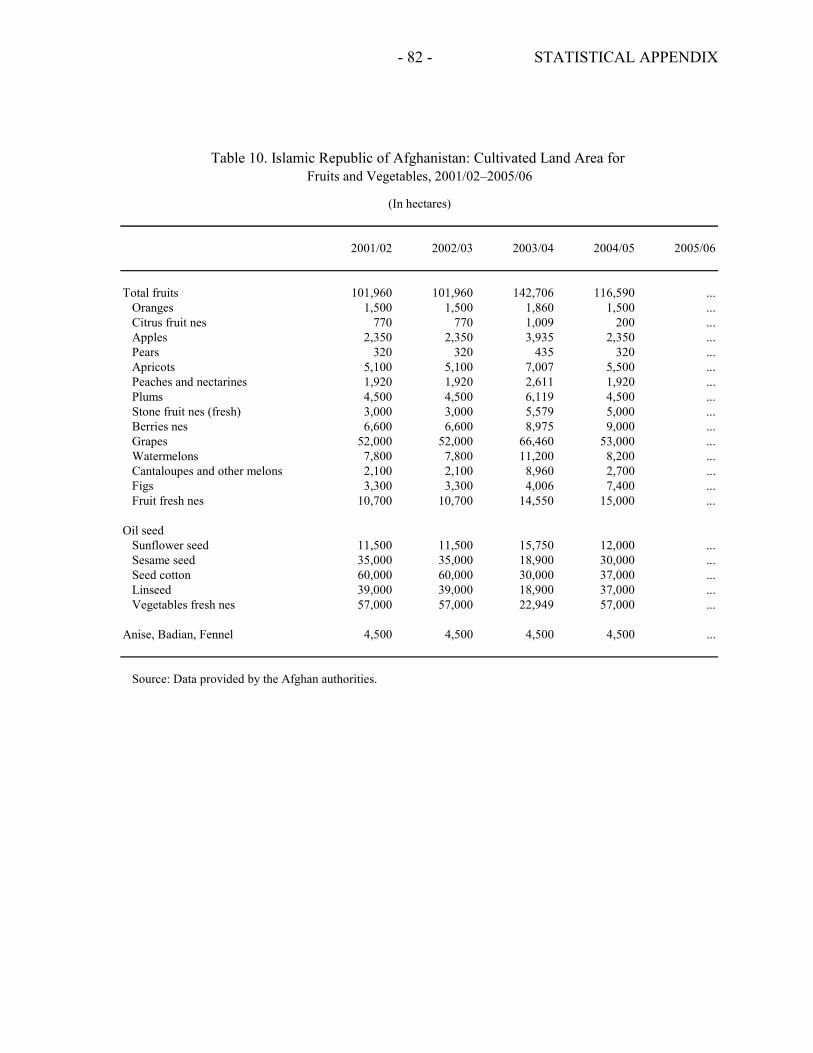
- 82 - STATISTICAL APPENDIX
2001/02 2002/03 2003/04 2004/05 2005/06
Total fruits 101,960 101,960 142,706 116,590 ...Oranges 1,500 1,500 1,860 1,500 ...Citrus fruit nes 770 770 1,009 200 ...Apples 2,350 2,350 3,935 2,350 ...Pears 320 320 435 320 ...Apricots 5,100 5,100 7,007 5,500 ...Peaches and nectarines 1,920 1,920 2,611 1,920 ...Plums 4,500 4,500 6,119 4,500 ...Stone fruit nes (fresh) 3,000 3,000 5,579 5,000 ...Berries nes 6,600 6,600 8,975 9,000 ...Grapes 52,000 52,000 66,460 53,000 ...Watermelons 7,800 7,800 11,200 8,200 ...Cantaloupes and other melons 2,100 2,100 8,960 2,700 ...Figs 3,300 3,300 4,006 7,400 ...Fruit fresh nes 10,700 10,700 14,550 15,000 ...
Oil seedSunflower seed 11,500 11,500 15,750 12,000 ...Sesame seed 35,000 35,000 18,900 30,000 ...Seed cotton 60,000 60,000 30,000 37,000 ...Linseed 39,000 39,000 18,900 37,000 ...Vegetables fresh nes 57,000 57,000 22,949 57,000 ...
Anise, Badian, Fennel 4,500 4,500 4,500 4,500 ...
Source: Data provided by the Afghan authorities.
(In hectares)
Fruits and Vegetables, 2001/02–2005/06Table 10. Islamic Republic of Afghanistan: Cultivated Land Area for
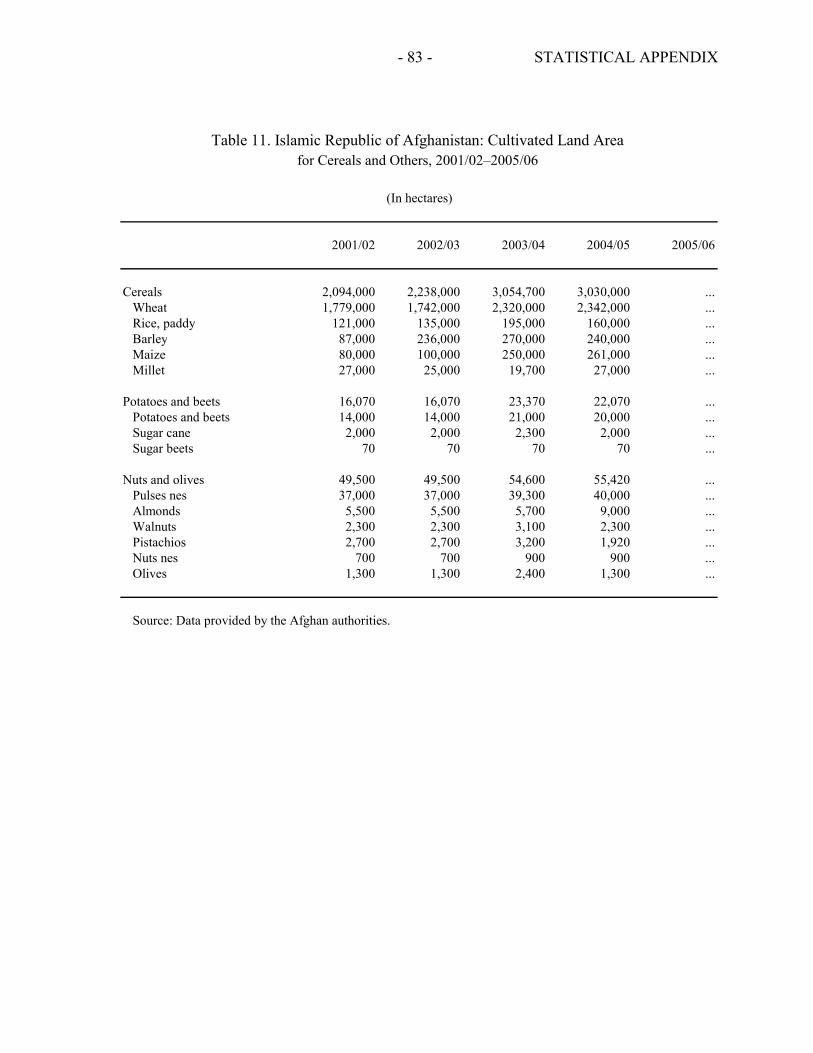
- 83 - STATISTICAL APPENDIX
2001/02 2002/03 2003/04 2004/05 2005/06
Cereals 2,094,000 2,238,000 3,054,700 3,030,000 ...Wheat 1,779,000 1,742,000 2,320,000 2,342,000 ...Rice, paddy 121,000 135,000 195,000 160,000 ...Barley 87,000 236,000 270,000 240,000 ...Maize 80,000 100,000 250,000 261,000 ...Millet 27,000 25,000 19,700 27,000 ...
Potatoes and beets 16,070 16,070 23,370 22,070 ...Potatoes and beets 14,000 14,000 21,000 20,000 ...Sugar cane 2,000 2,000 2,300 2,000 ...Sugar beets 70 70 70 70 ...
Nuts and olives 49,500 49,500 54,600 55,420 ...Pulses nes 37,000 37,000 39,300 40,000 ...Almonds 5,500 5,500 5,700 9,000 ...Walnuts 2,300 2,300 3,100 2,300 ...Pistachios 2,700 2,700 3,200 1,920 ...Nuts nes 700 700 900 900 ...Olives 1,300 1,300 2,400 1,300 ...
Source: Data provided by the Afghan authorities.
(In hectares)
for Cereals and Others, 2001/02–2005/06 Table 11. Islamic Republic of Afghanistan: Cultivated Land Area
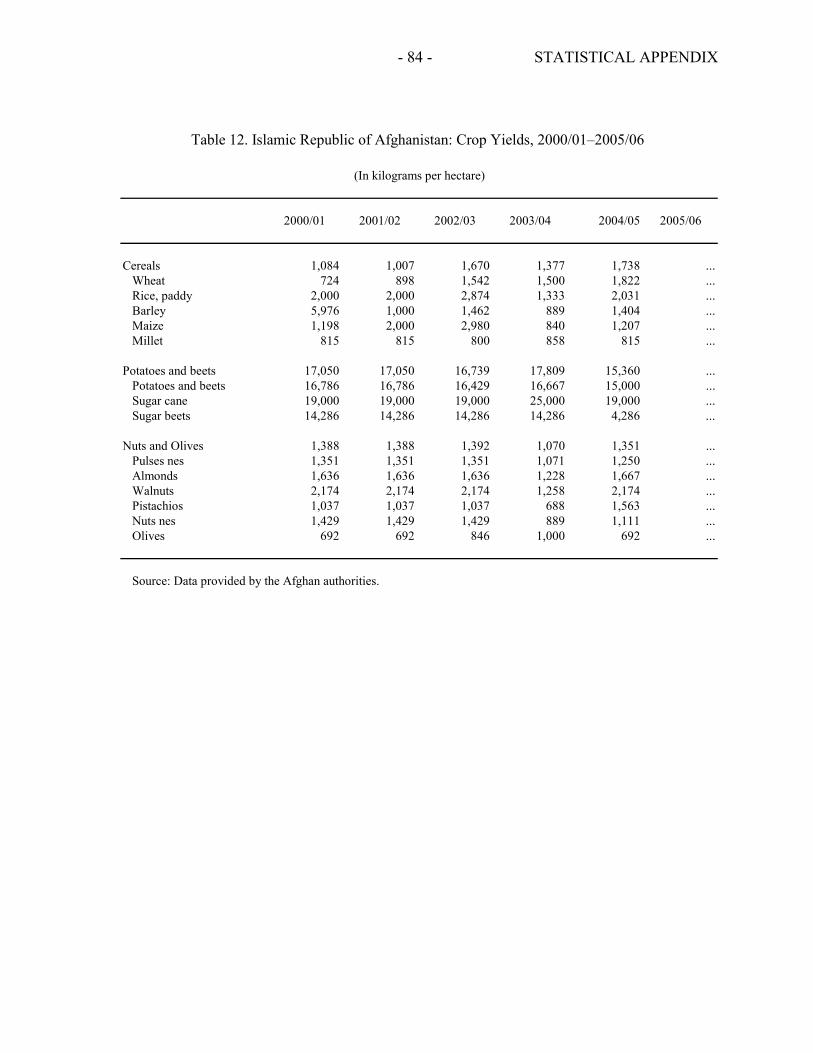
- 84 - STATISTICAL APPENDIX
2000/01 2001/02 2002/03 2003/04 2004/05 2005/06
Cereals 1,084 1,007 1,670 1,377 1,738 ...Wheat 724 898 1,542 1,500 1,822 ...Rice, paddy 2,000 2,000 2,874 1,333 2,031 ...Barley 5,976 1,000 1,462 889 1,404 ...Maize 1,198 2,000 2,980 840 1,207 ...Millet 815 815 800 858 815 ...
Potatoes and beets 17,050 17,050 16,739 17,809 15,360 ...Potatoes and beets 16,786 16,786 16,429 16,667 15,000 ...Sugar cane 19,000 19,000 19,000 25,000 19,000 ...Sugar beets 14,286 14,286 14,286 14,286 4,286 ...
Nuts and Olives 1,388 1,388 1,392 1,070 1,351 ...Pulses nes 1,351 1,351 1,351 1,071 1,250 ...Almonds 1,636 1,636 1,636 1,228 1,667 ...Walnuts 2,174 2,174 2,174 1,258 2,174 ...Pistachios 1,037 1,037 1,037 688 1,563 ...Nuts nes 1,429 1,429 1,429 889 1,111 ...Olives 692 692 846 1,000 692 ...
Source: Data provided by the Afghan authorities.
(In kilograms per hectare)
Table 12. Islamic Republic of Afghanistan: Crop Yields, 2000/01–2005/06
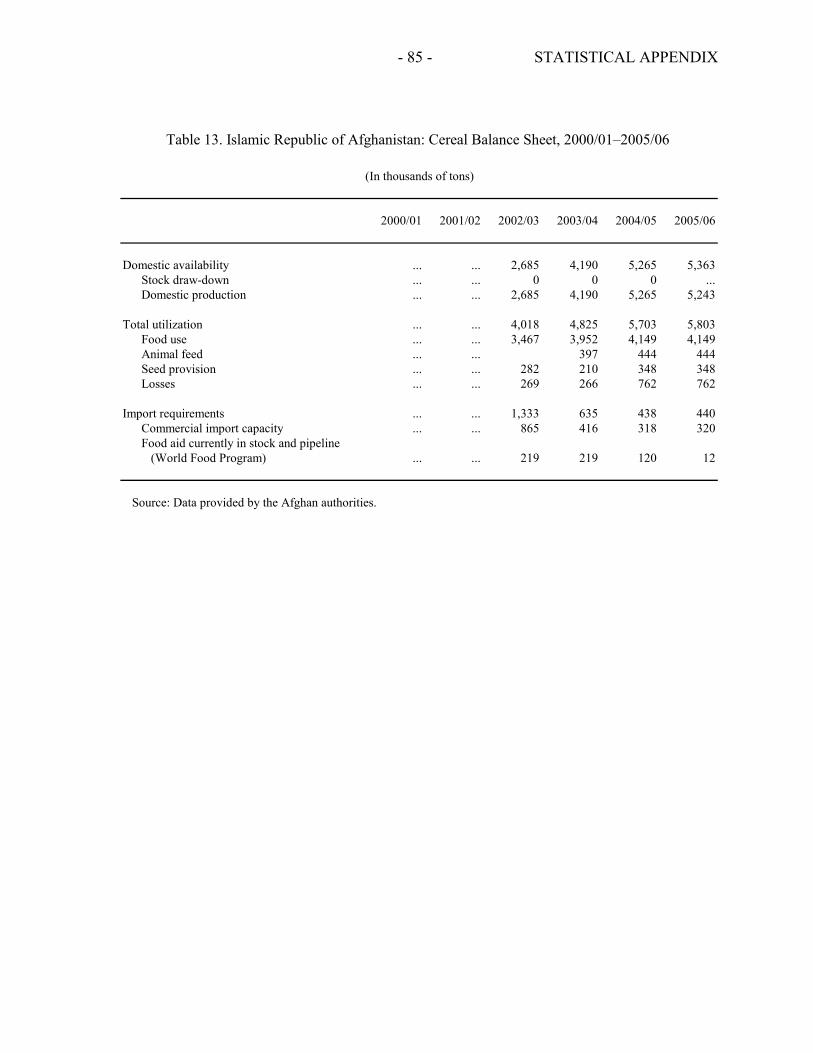
- 85 - STATISTICAL APPENDIX
2000/01 2001/02 2002/03 2003/04 2004/05 2005/06
Domestic availability ... ... 2,685 4,190 5,265 5,363Stock draw-down ... ... 0 0 0 ...Domestic production ... ... 2,685 4,190 5,265 5,243
Total utilization ... ... 4,018 4,825 5,703 5,803Food use ... ... 3,467 3,952 4,149 4,149Animal feed ... ... 397 444 444Seed provision ... ... 282 210 348 348Losses ... ... 269 266 762 762
Import requirements ... ... 1,333 635 438 440Commercial import capacity ... ... 865 416 318 320Food aid currently in stock and pipeline
(World Food Program) ... ... 219 219 120 12
Source: Data provided by the Afghan authorities.
(In thousands of tons)
Table 13. Islamic Republic of Afghanistan: Cereal Balance Sheet, 2000/01–2005/06
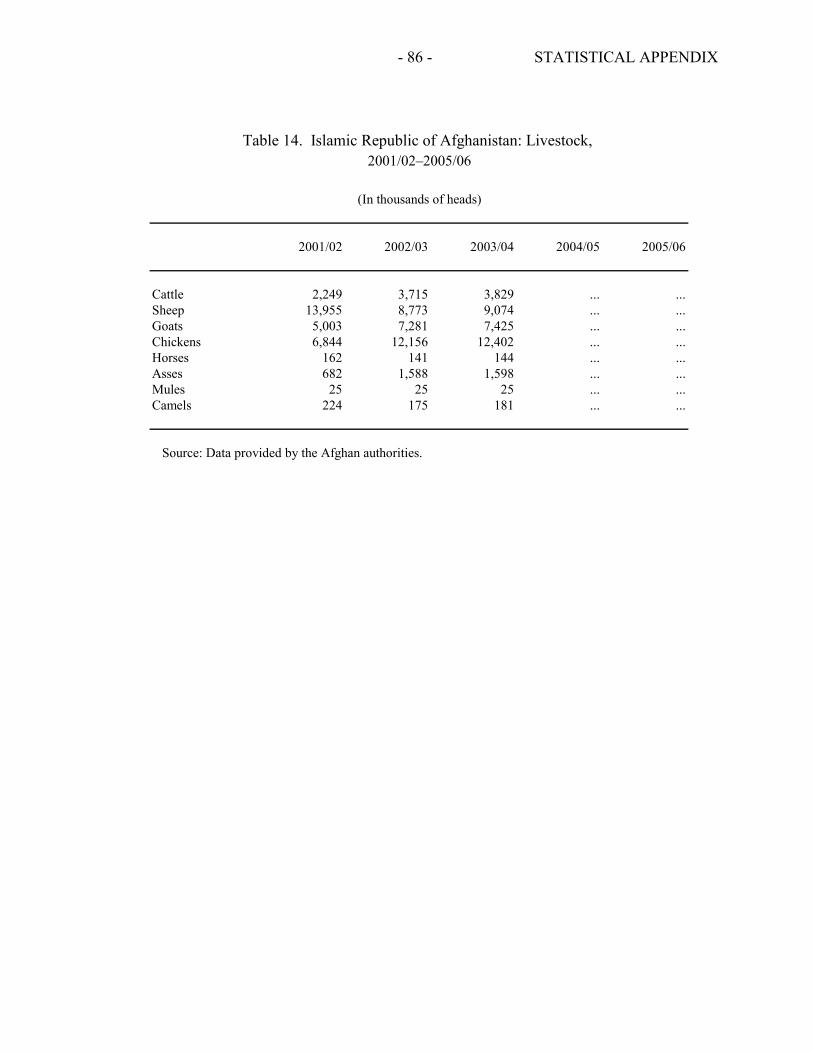
- 86 - STATISTICAL APPENDIX
2001/02 2002/03 2003/04 2004/05 2005/06
Cattle 2,249 3,715 3,829 ... ...Sheep 13,955 8,773 9,074 ... ...Goats 5,003 7,281 7,425 ... ...Chickens 6,844 12,156 12,402 ... ...Horses 162 141 144 ... ...Asses 682 1,588 1,598 ... ...Mules 25 25 25 ... ...Camels 224 175 181 ... ...
Source: Data provided by the Afghan authorities.
(In thousands of heads)
Table 14. Islamic Republic of Afghanistan: Livestock, 2001/02–2005/06
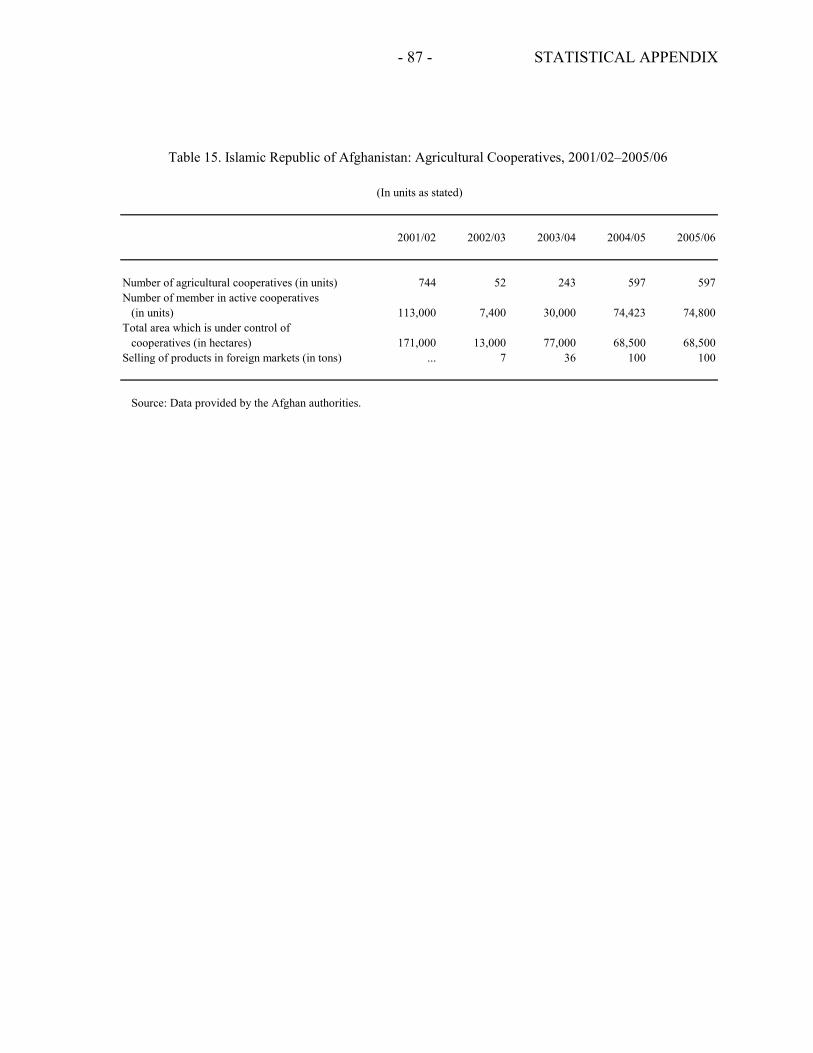
- 87 - STATISTICAL APPENDIX
2001/02 2002/03 2003/04 2004/05 2005/06
Number of agricultural cooperatives (in units) 744 52 243 597 597Number of member in active cooperatives
(in units) 113,000 7,400 30,000 74,423 74,800Total area which is under control of
cooperatives (in hectares) 171,000 13,000 77,000 68,500 68,500Selling of products in foreign markets (in tons) ... 7 36 100 100
Source: Data provided by the Afghan authorities.
(In units as stated)
Table 15. Islamic Republic of Afghanistan: Agricultural Cooperatives, 2001/02–2005/06
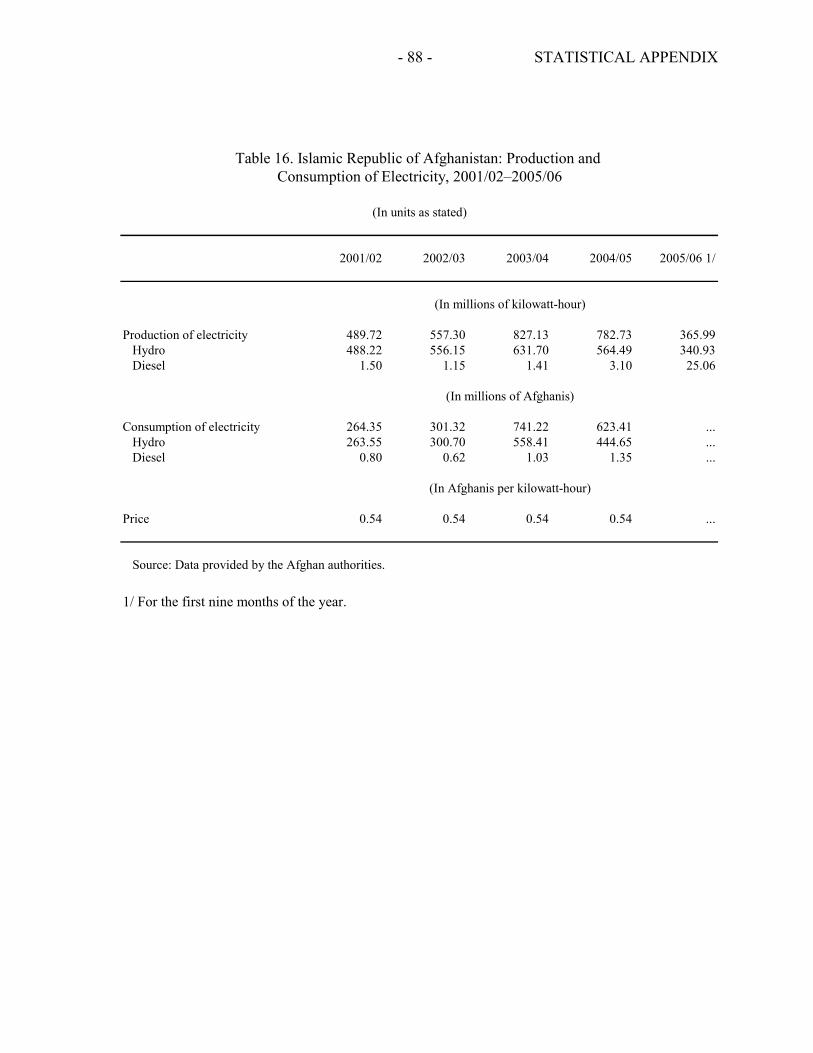
- 88 - STATISTICAL APPENDIX
2001/02 2002/03 2003/04 2004/05 2005/06 1/
Production of electricity 489.72 557.30 827.13 782.73 365.99Hydro 488.22 556.15 631.70 564.49 340.93Diesel 1.50 1.15 1.41 3.10 25.06
Consumption of electricity 264.35 301.32 741.22 623.41 ...Hydro 263.55 300.70 558.41 444.65 ...Diesel 0.80 0.62 1.03 1.35 ...
Price 0.54 0.54 0.54 0.54 ...
Source: Data provided by the Afghan authorities.
1/ For the first nine months of the year.
(In units as stated)
Consumption of Electricity, 2001/02–2005/06Table 16. Islamic Republic of Afghanistan: Production and
(In Afghanis per kilowatt-hour)
(In millions of Afghanis)
(In millions of kilowatt-hour)
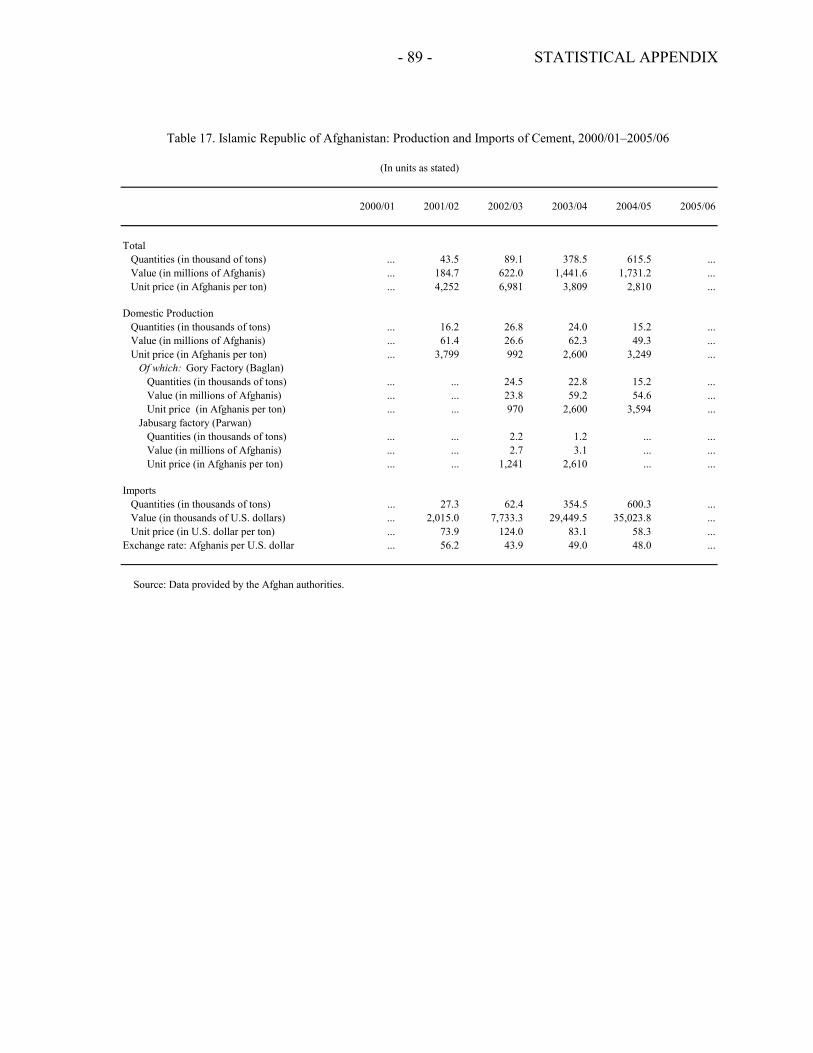
- 89 - STATISTICAL APPENDIX
2000/01 2001/02 2002/03 2003/04 2004/05 2005/06
Total Quantities (in thousand of tons) ... 43.5 89.1 378.5 615.5 ... Value (in millions of Afghanis) ... 184.7 622.0 1,441.6 1,731.2 ... Unit price (in Afghanis per ton) ... 4,252 6,981 3,809 2,810 ...
Domestic Production Quantities (in thousands of tons) ... 16.2 26.8 24.0 15.2 ... Value (in millions of Afghanis) ... 61.4 26.6 62.3 49.3 ... Unit price (in Afghanis per ton) ... 3,799 992 2,600 3,249 ... Of which: Gory Factory (Baglan) Quantities (in thousands of tons) ... ... 24.5 22.8 15.2 ... Value (in millions of Afghanis) ... ... 23.8 59.2 54.6 ... Unit price (in Afghanis per ton) ... ... 970 2,600 3,594 ... Jabusarg factory (Parwan) Quantities (in thousands of tons) ... ... 2.2 1.2 ... ... Value (in millions of Afghanis) ... ... 2.7 3.1 ... ... Unit price (in Afghanis per ton) ... ... 1,241 2,610 ... ...
Imports Quantities (in thousands of tons) ... 27.3 62.4 354.5 600.3 ... Value (in thousands of U.S. dollars) ... 2,015.0 7,733.3 29,449.5 35,023.8 ... Unit price (in U.S. dollar per ton) ... 73.9 124.0 83.1 58.3 ...Exchange rate: Afghanis per U.S. dollar ... 56.2 43.9 49.0 48.0 ...
Source: Data provided by the Afghan authorities.
(In units as stated)
Table 17. Islamic Republic of Afghanistan: Production and Imports of Cement, 2000/01–2005/06
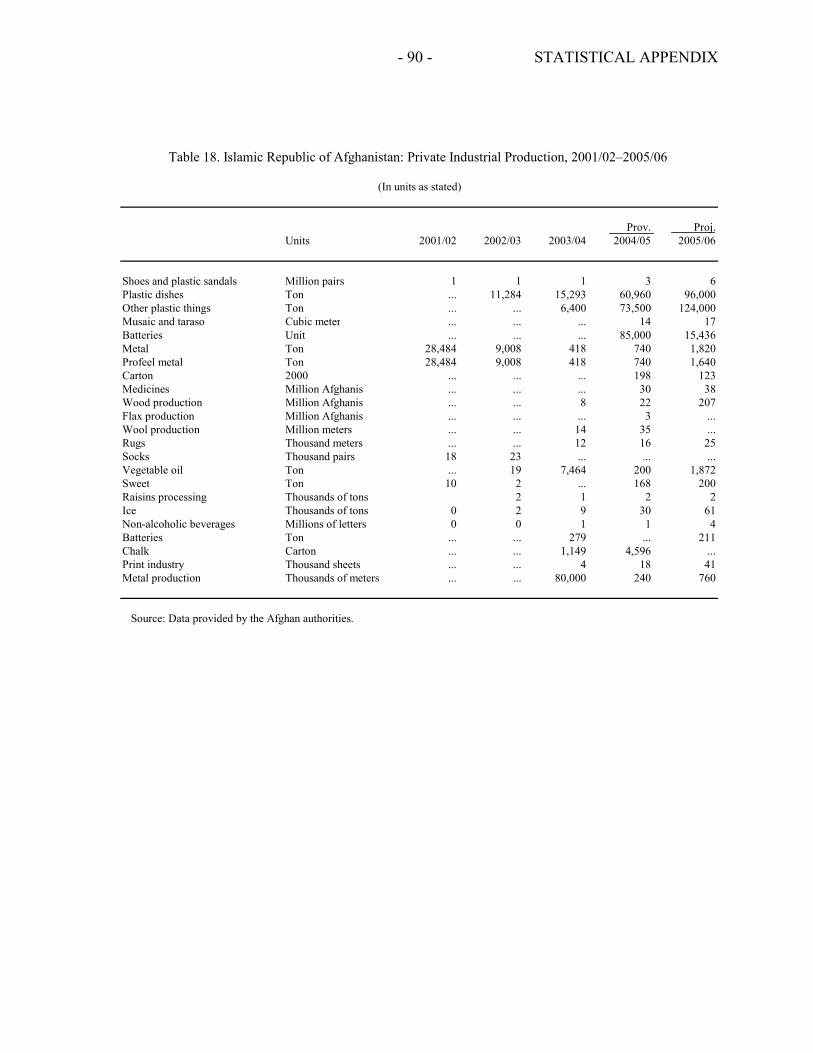
- 90 - STATISTICAL APPENDIX
Prov. Proj.Units 2001/02 2002/03 2003/04 2004/05 2005/06
Shoes and plastic sandals Million pairs 1 1 1 3 6Plastic dishes Ton ... 11,284 15,293 60,960 96,000Other plastic things Ton ... ... 6,400 73,500 124,000Musaic and taraso Cubic meter ... ... ... 14 17Batteries Unit ... ... ... 85,000 15,436Metal Ton 28,484 9,008 418 740 1,820Profeel metal Ton 28,484 9,008 418 740 1,640Carton 2000 ... ... ... 198 123Medicines Million Afghanis ... ... ... 30 38Wood production Million Afghanis ... ... 8 22 207Flax production Million Afghanis ... ... ... 3 ...Wool production Million meters ... ... 14 35 ...Rugs Thousand meters ... ... 12 16 25Socks Thousand pairs 18 23 ... ... ...Vegetable oil Ton ... 19 7,464 200 1,872Sweet Ton 10 2 ... 168 200Raisins processing Thousands of tons 2 1 2 2Ice Thousands of tons 0 2 9 30 61Non-alcoholic beverages Millions of letters 0 0 1 1 4Batteries Ton ... ... 279 ... 211Chalk Carton ... ... 1,149 4,596 ...Print industry Thousand sheets ... ... 4 18 41Metal production Thousands of meters ... ... 80,000 240 760
Source: Data provided by the Afghan authorities.
(In units as stated)
Table 18. Islamic Republic of Afghanistan: Private Industrial Production, 2001/02–2005/06
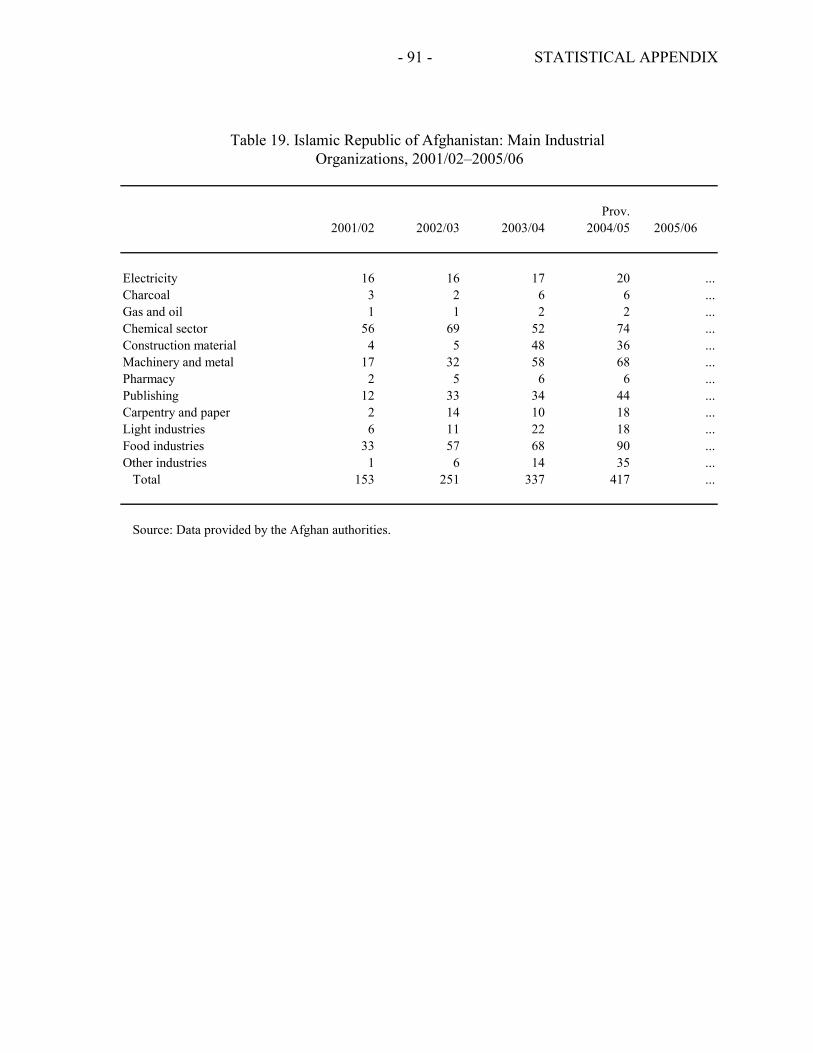
- 91 - STATISTICAL APPENDIX
Prov.2001/02 2002/03 2003/04 2004/05 2005/06
Electricity 16 16 17 20 ...Charcoal 3 2 6 6 ...Gas and oil 1 1 2 2 ...Chemical sector 56 69 52 74 ...Construction material 4 5 48 36 ...Machinery and metal 17 32 58 68 ...Pharmacy 2 5 6 6 ...Publishing 12 33 34 44 ...Carpentry and paper 2 14 10 18 ...Light industries 6 11 22 18 ...Food industries 33 57 68 90 ...Other industries 1 6 14 35 ... Total 153 251 337 417 ...
Source: Data provided by the Afghan authorities.
Organizations, 2001/02–2005/06Table 19. Islamic Republic of Afghanistan: Main Industrial
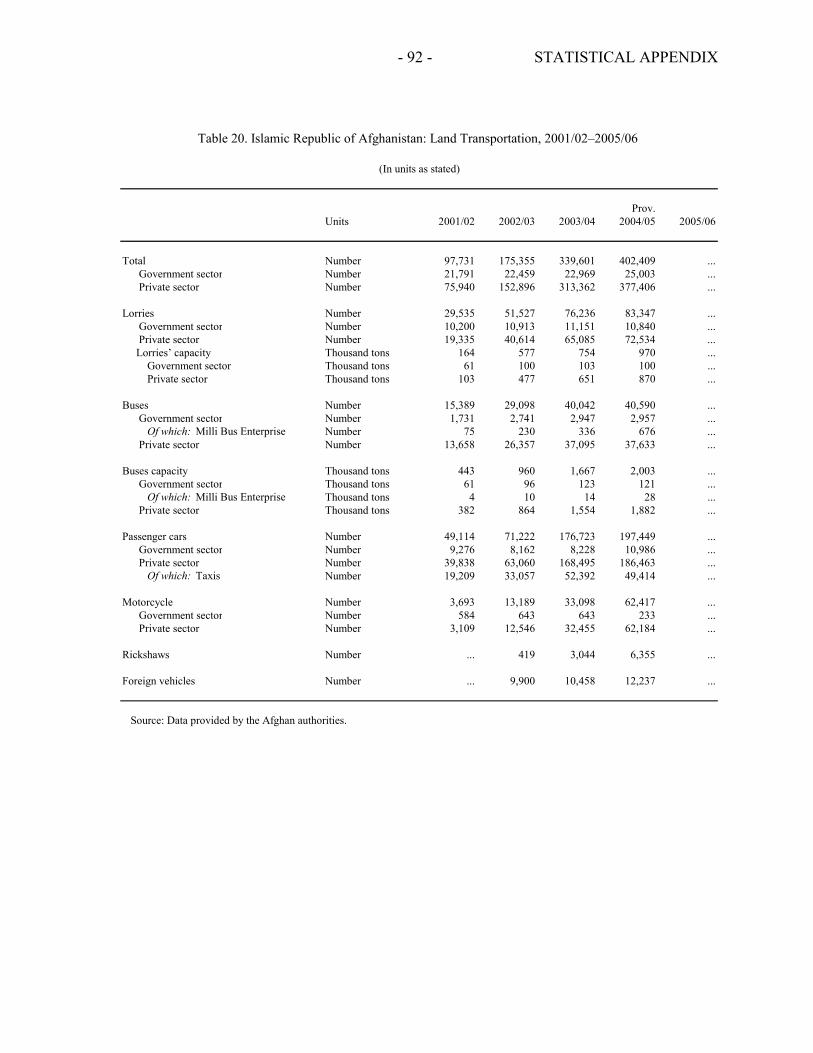
- 92 - STATISTICAL APPENDIX
Prov.Units 2001/02 2002/03 2003/04 2004/05 2005/06
Total Number 97,731 175,355 339,601 402,409 ...Government sector Number 21,791 22,459 22,969 25,003 ...Private sector Number 75,940 152,896 313,362 377,406 ...
Lorries Number 29,535 51,527 76,236 83,347 ...Government sector Number 10,200 10,913 11,151 10,840 ...Private sector Number 19,335 40,614 65,085 72,534 ...
Lorries’ capacity Thousand tons 164 577 754 970 ...Government sector Thousand tons 61 100 103 100 ...Private sector Thousand tons 103 477 651 870 ...
Buses Number 15,389 29,098 40,042 40,590 ...Government sector Number 1,731 2,741 2,947 2,957 ...
Of which: Milli Bus Enterprise Number 75 230 336 676 ...Private sector Number 13,658 26,357 37,095 37,633 ...
Buses capacity Thousand tons 443 960 1,667 2,003 ...Government sector Thousand tons 61 96 123 121 ...
Of which: Milli Bus Enterprise Thousand tons 4 10 14 28 ...Private sector Thousand tons 382 864 1,554 1,882 ...
Passenger cars Number 49,114 71,222 176,723 197,449 ...Government sector Number 9,276 8,162 8,228 10,986 ...Private sector Number 39,838 63,060 168,495 186,463 ...
Of which: Taxis Number 19,209 33,057 52,392 49,414 ...
Motorcycle Number 3,693 13,189 33,098 62,417 ...Government sector Number 584 643 643 233 ...Private sector Number 3,109 12,546 32,455 62,184 ...
Rickshaws Number ... 419 3,044 6,355 ...
Foreign vehicles Number ... 9,900 10,458 12,237 ...
Source: Data provided by the Afghan authorities.
(In units as stated)
Table 20. Islamic Republic of Afghanistan: Land Transportation, 2001/02–2005/06
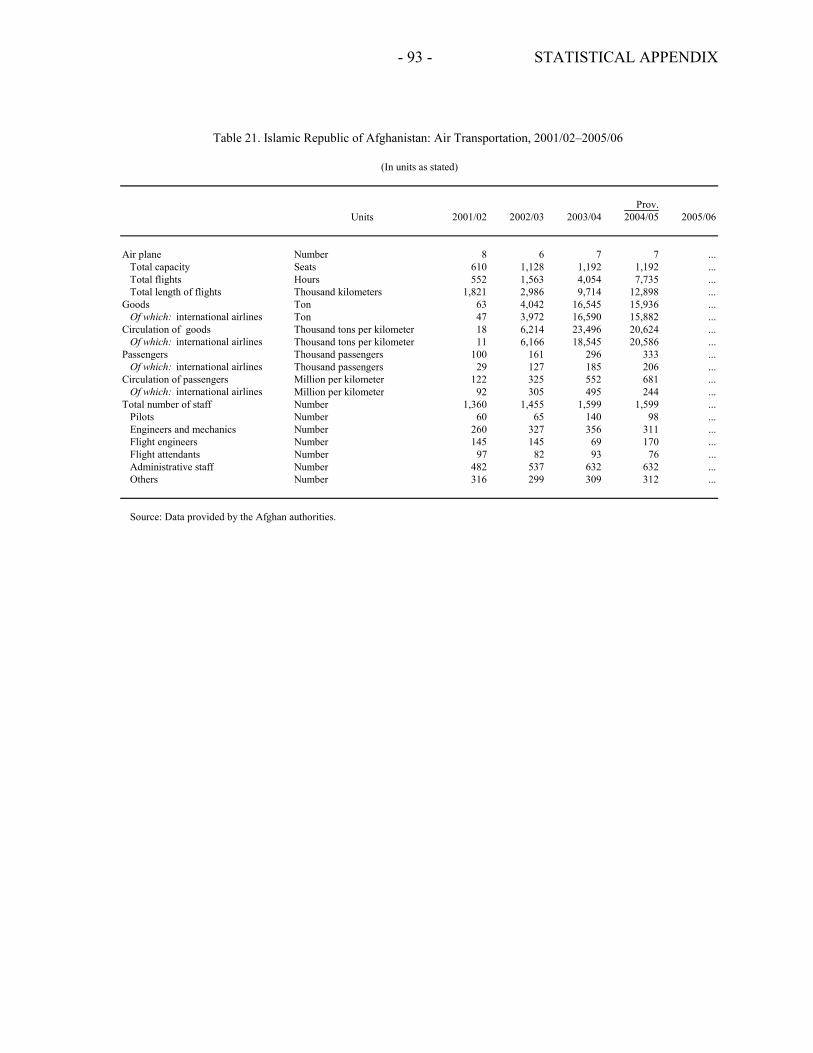
- 93 - STATISTICAL APPENDIX
Prov.Units 2001/02 2002/03 2003/04 2004/05 2005/06
Air plane Number 8 6 7 7 ...Total capacity Seats 610 1,128 1,192 1,192 ...Total flights Hours 552 1,563 4,054 7,735 ...Total length of flights Thousand kilometers 1,821 2,986 9,714 12,898 ...
Goods Ton 63 4,042 16,545 15,936 ...Of which: international airlines Ton 47 3,972 16,590 15,882 ...
Circulation of goods Thousand tons per kilometer 18 6,214 23,496 20,624 ...Of which: international airlines Thousand tons per kilometer 11 6,166 18,545 20,586 ...
Passengers Thousand passengers 100 161 296 333 ...Of which: international airlines Thousand passengers 29 127 185 206 ...
Circulation of passengers Million per kilometer 122 325 552 681 ...Of which: international airlines Million per kilometer 92 305 495 244 ...
Total number of staff Number 1,360 1,455 1,599 1,599 ...Pilots Number 60 65 140 98 ...Engineers and mechanics Number 260 327 356 311 ...Flight engineers Number 145 145 69 170 ...Flight attendants Number 97 82 93 76 ...Administrative staff Number 482 537 632 632 ...Others Number 316 299 309 312 ...
Source: Data provided by the Afghan authorities.
(In units as stated)
Table 21. Islamic Republic of Afghanistan: Air Transportation, 2001/02–2005/06
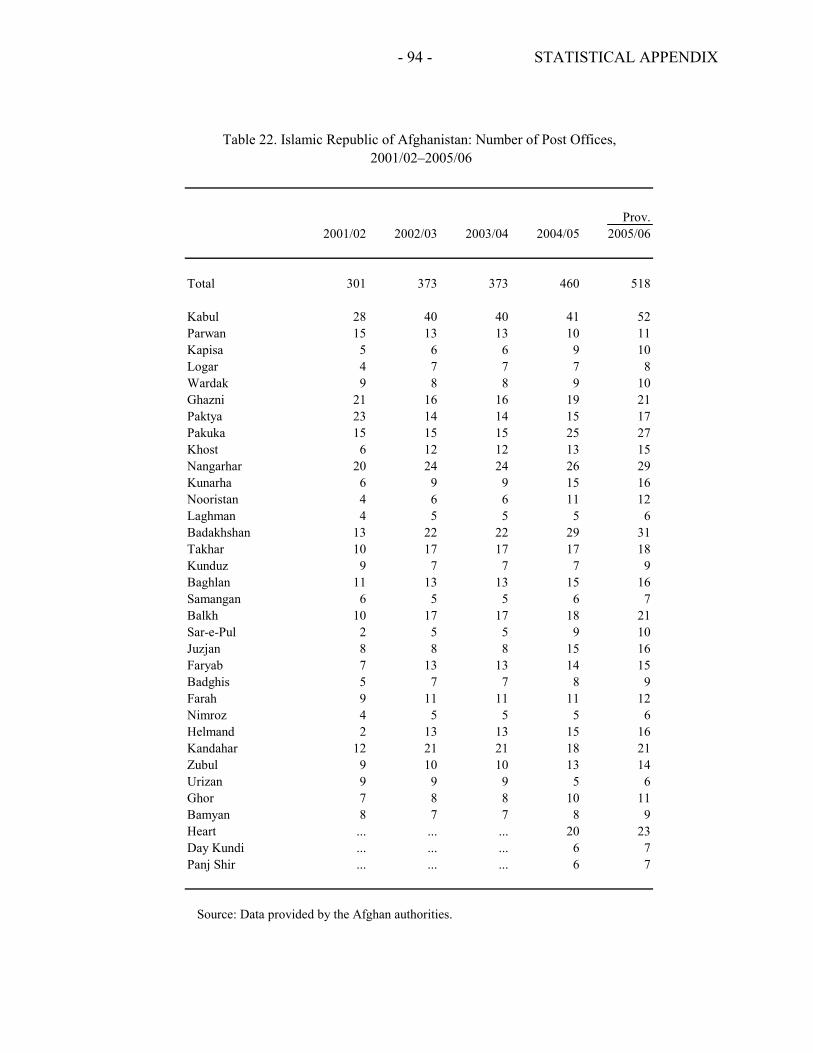
- 94 - STATISTICAL APPENDIX
Prov.2001/02 2002/03 2003/04 2004/05 2005/06
Total 301 373 373 460 518
Kabul 28 40 40 41 52Parwan 15 13 13 10 11Kapisa 5 6 6 9 10Logar 4 7 7 7 8Wardak 9 8 8 9 10Ghazni 21 16 16 19 21Paktya 23 14 14 15 17Pakuka 15 15 15 25 27Khost 6 12 12 13 15Nangarhar 20 24 24 26 29Kunarha 6 9 9 15 16Nooristan 4 6 6 11 12Laghman 4 5 5 5 6Badakhshan 13 22 22 29 31Takhar 10 17 17 17 18Kunduz 9 7 7 7 9Baghlan 11 13 13 15 16Samangan 6 5 5 6 7Balkh 10 17 17 18 21Sar-e-Pul 2 5 5 9 10Juzjan 8 8 8 15 16Faryab 7 13 13 14 15Badghis 5 7 7 8 9Farah 9 11 11 11 12Nimroz 4 5 5 5 6Helmand 2 13 13 15 16Kandahar 12 21 21 18 21Zubul 9 10 10 13 14Urizan 9 9 9 5 6Ghor 7 8 8 10 11Bamyan 8 7 7 8 9Heart ... ... ... 20 23Day Kundi ... ... ... 6 7Panj Shir ... ... ... 6 7
Source: Data provided by the Afghan authorities.
2001/02–2005/06Table 22. Islamic Republic of Afghanistan: Number of Post Offices,
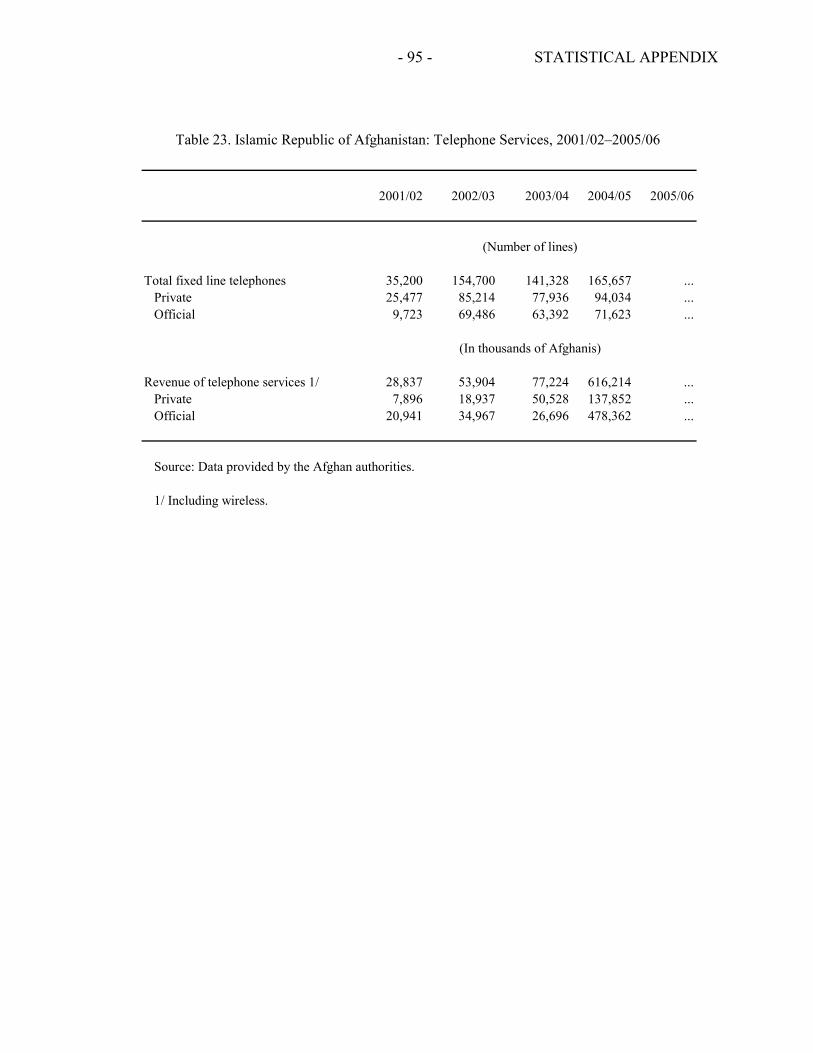
- 95 - STATISTICAL APPENDIX
2001/02 2002/03 2003/04 2004/05 2005/06
Total fixed line telephones 35,200 154,700 141,328 165,657 ...Private 25,477 85,214 77,936 94,034 ...Official 9,723 69,486 63,392 71,623 ...
Revenue of telephone services 1/ 28,837 53,904 77,224 616,214 ...Private 7,896 18,937 50,528 137,852 ...Official 20,941 34,967 26,696 478,362 ...
Source: Data provided by the Afghan authorities.
1/ Including wireless.
Table 23. Islamic Republic of Afghanistan: Telephone Services, 2001/02–2005/06
(In thousands of Afghanis)
(Number of lines)
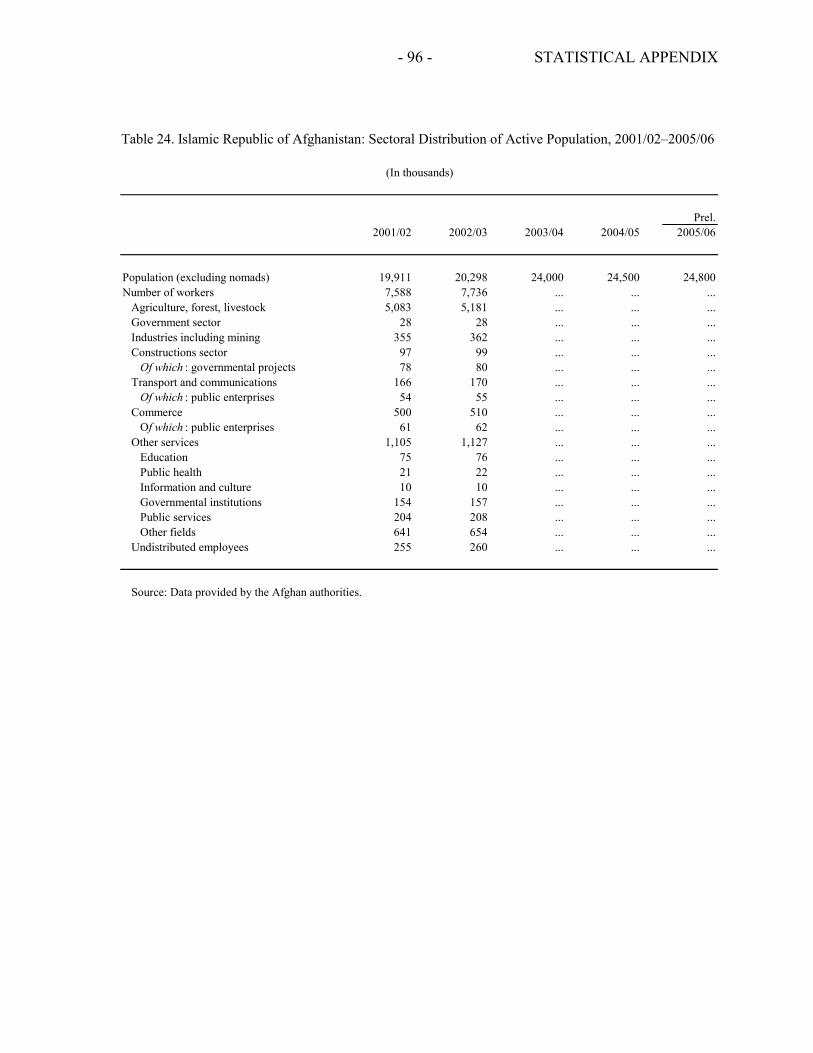
- 96 - STATISTICAL APPENDIX
Prel.2001/02 2002/03 2003/04 2004/05 2005/06
Population (excluding nomads) 19,911 20,298 24,000 24,500 24,800Number of workers 7,588 7,736 ... ... ...
Agriculture, forest, livestock 5,083 5,181 ... ... ...Government sector 28 28 ... ... ...Industries including mining 355 362 ... ... ...Constructions sector 97 99 ... ... ... Of which : governmental projects 78 80 ... ... ...Transport and communications 166 170 ... ... ... Of which : public enterprises 54 55 ... ... ...Commerce 500 510 ... ... ... Of which : public enterprises 61 62 ... ... ...Other services 1,105 1,127 ... ... ...
Education 75 76 ... ... ...Public health 21 22 ... ... ...Information and culture 10 10 ... ... ...Governmental institutions 154 157 ... ... ...Public services 204 208 ... ... ...Other fields 641 654 ... ... ...
Undistributed employees 255 260 ... ... ...
Source: Data provided by the Afghan authorities.
(In thousands)
Table 24. Islamic Republic of Afghanistan: Sectoral Distribution of Active Population, 2001/02–2005/06
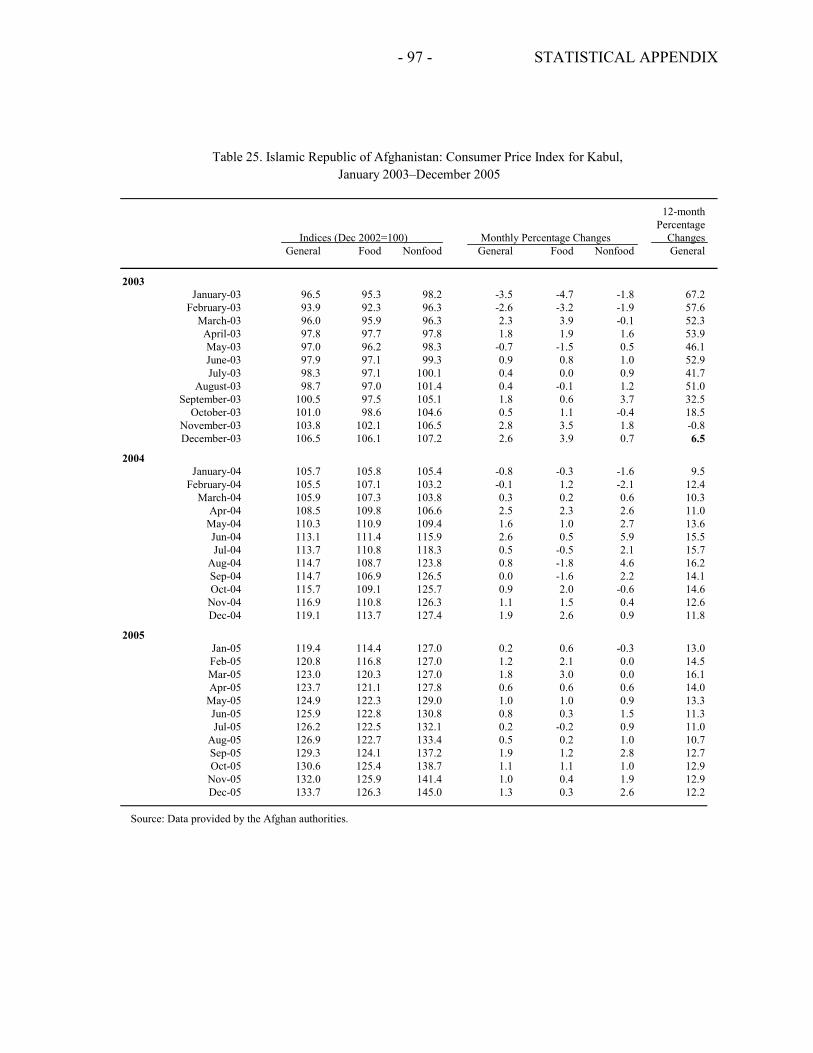
- 97 - STATISTICAL APPENDIX
12-monthPercentage
ChangesGeneral Food Nonfood General Food Nonfood General
2003January-03 96.5 95.3 98.2 -3.5 -4.7 -1.8 67.2
February-03 93.9 92.3 96.3 -2.6 -3.2 -1.9 57.6March-03 96.0 95.9 96.3 2.3 3.9 -0.1 52.3
April-03 97.8 97.7 97.8 1.8 1.9 1.6 53.9May-03 97.0 96.2 98.3 -0.7 -1.5 0.5 46.1June-03 97.9 97.1 99.3 0.9 0.8 1.0 52.9July-03 98.3 97.1 100.1 0.4 0.0 0.9 41.7
August-03 98.7 97.0 101.4 0.4 -0.1 1.2 51.0September-03 100.5 97.5 105.1 1.8 0.6 3.7 32.5
October-03 101.0 98.6 104.6 0.5 1.1 -0.4 18.5November-03 103.8 102.1 106.5 2.8 3.5 1.8 -0.8December-03 106.5 106.1 107.2 2.6 3.9 0.7 6.5
2004January-04 105.7 105.8 105.4 -0.8 -0.3 -1.6 9.5
February-04 105.5 107.1 103.2 -0.1 1.2 -2.1 12.4March-04 105.9 107.3 103.8 0.3 0.2 0.6 10.3
Apr-04 108.5 109.8 106.6 2.5 2.3 2.6 11.0May-04 110.3 110.9 109.4 1.6 1.0 2.7 13.6Jun-04 113.1 111.4 115.9 2.6 0.5 5.9 15.5Jul-04 113.7 110.8 118.3 0.5 -0.5 2.1 15.7
Aug-04 114.7 108.7 123.8 0.8 -1.8 4.6 16.2Sep-04 114.7 106.9 126.5 0.0 -1.6 2.2 14.1Oct-04 115.7 109.1 125.7 0.9 2.0 -0.6 14.6
Nov-04 116.9 110.8 126.3 1.1 1.5 0.4 12.6Dec-04 119.1 113.7 127.4 1.9 2.6 0.9 11.8
2005Jan-05 119.4 114.4 127.0 0.2 0.6 -0.3 13.0Feb-05 120.8 116.8 127.0 1.2 2.1 0.0 14.5Mar-05 123.0 120.3 127.0 1.8 3.0 0.0 16.1Apr-05 123.7 121.1 127.8 0.6 0.6 0.6 14.0
May-05 124.9 122.3 129.0 1.0 1.0 0.9 13.3Jun-05 125.9 122.8 130.8 0.8 0.3 1.5 11.3Jul-05 126.2 122.5 132.1 0.2 -0.2 0.9 11.0
Aug-05 126.9 122.7 133.4 0.5 0.2 1.0 10.7Sep-05 129.3 124.1 137.2 1.9 1.2 2.8 12.7Oct-05 130.6 125.4 138.7 1.1 1.1 1.0 12.9
Nov-05 132.0 125.9 141.4 1.0 0.4 1.9 12.9Dec-05 133.7 126.3 145.0 1.3 0.3 2.6 12.2
Source: Data provided by the Afghan authorities.
Table 25. Islamic Republic of Afghanistan: Consumer Price Index for Kabul,
Indices (Dec 2002=100) Monthly Percentage Changes
January 2003–December 2005
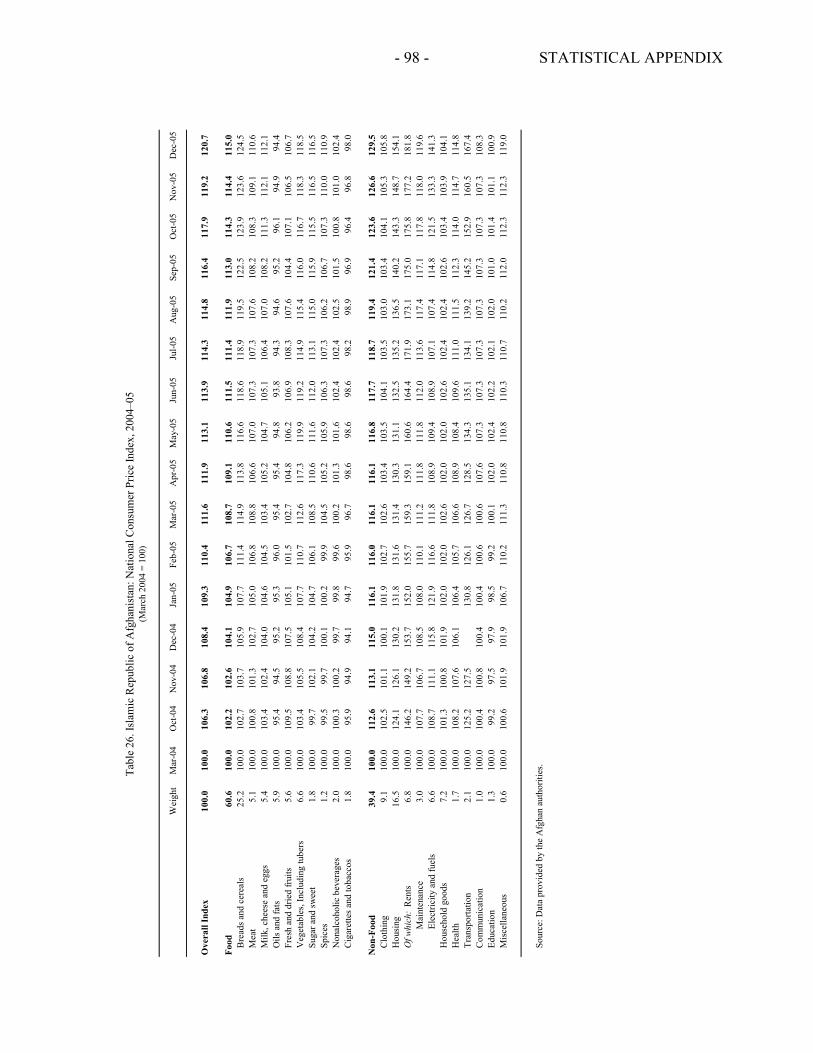
- 98 - STATISTICAL APPENDIX
Wei
ght
Mar
-04
Oct
-04
Nov
-04
Dec
-04
Jan-
05Fe
b-05
Mar
-05
Apr
-05
May
-05
Jun-
05Ju
l-05
Aug
-05
Sep-
05O
ct-0
5N
ov-0
5D
ec-0
5
Ove
rall
Inde
x10
0.0
100.
0
10
6.3
106.
8
10
8.4
109.
3
11
0.4
111.
6
11
1.9
113.
1
11
3.9
114.
3
11
4.8
116.
4
11
7.9
119.
2
12
0.7
Food
60.6
10
0.0
102.
2
10
2.6
104.
1
10
4.9
106.
7
10
8.7
109.
1
11
0.6
111.
5
11
1.4
111.
9
11
3.0
114.
3
11
4.4
115.
0
B
read
s and
cer
eals
25.2
10
0.0
102.
7
10
3.7
105.
9
10
7.7
111.
4
11
4.9
113.
8
11
6.6
118.
6
11
8.9
119.
5
12
2.5
123.
9
12
3.6
124.
5
M
eat
5.1
10
0.0
100.
8
10
1.3
102.
7
10
5.0
106.
8
10
8.8
106.
6
10
7.0
107.
3
10
7.3
107.
6
10
8.2
108.
3
10
9.1
110.
6
M
ilk, c
hees
e an
d eg
gs5.
4
100.
0
10
3.4
102.
4
10
4.0
104.
6
10
4.5
103.
4
10
5.2
104.
7
10
5.1
106.
4
10
7.0
108.
2
11
1.3
112.
1
11
2.1
Oils
and
fats
5.9
10
0.0
95.4
94
.5
95.2
95
.3
96.0
95
.4
95.4
94
.8
93.8
94
.3
94.6
95
.2
96.1
94
.9
94.4
Fr
esh
and
drie
d fr
uits
5.6
10
0.0
109.
5
10
8.8
107.
5
10
5.1
101.
5
10
2.7
104.
8
10
6.2
106.
9
10
8.3
107.
6
10
4.4
107.
1
10
6.5
106.
7
V
eget
able
s, In
clud
ing
tube
rs6.
6
100.
0
10
3.4
105.
5
10
8.4
107.
7
11
0.7
112.
6
11
7.3
119.
9
11
9.2
114.
9
11
5.4
116.
0
11
6.7
118.
3
11
8.5
Suga
r and
swee
t1.
8
100.
0
99
.7
102.
1
10
4.2
104.
7
10
6.1
108.
5
11
0.6
111.
6
11
2.0
113.
1
11
5.0
115.
9
11
5.5
116.
5
11
6.5
Spic
es1.
2
100.
0
99
.5
99.7
10
0.1
100.
2
99
.9
104.
5
10
5.2
105.
9
10
6.3
107.
3
10
6.2
106.
7
10
7.3
110.
0
11
0.9
Non
alco
holic
bev
erag
es2.
0
100.
0
10
0.3
100.
2
99
.7
99.8
99
.6
100.
2
10
1.3
101.
6
10
2.4
102.
4
10
2.5
101.
5
10
0.8
101.
0
10
2.4
Cig
aret
tes a
nd to
bacc
os1.
8
100.
0
95
.9
94.9
94
.1
94.7
95
.9
96.7
98
.6
98.6
98
.6
98.2
98
.9
96.9
96
.4
96.8
98
.0
Non
-Foo
d39
.4
100.
0
11
2.6
113.
1
11
5.0
116.
1
11
6.0
116.
1
11
6.1
116.
8
11
7.7
118.
7
11
9.4
121.
4
12
3.6
126.
6
12
9.5
Clo
thin
g9.
1
100.
0
10
2.5
101.
1
10
0.1
101.
9
10
2.7
102.
6
10
3.4
103.
5
10
4.1
103.
5
10
3.0
103.
4
10
4.1
105.
3
10
5.8
Hou
sing
16.5
10
0.0
124.
1
12
6.1
130.
2
13
1.8
131.
6
13
1.4
130.
3
13
1.1
132.
5
13
5.2
136.
5
14
0.2
143.
3
14
8.7
154.
1
O
f whi
ch:
Ren
ts6.
8
100.
0
14
6.2
149.
2
15
3.7
152.
0
15
5.7
159.
3
15
9.1
160.
6
16
4.4
171.
9
17
3.1
175.
0
17
5.8
177.
2
18
1.8
Mai
nten
ance
3.0
10
0.0
107.
7
10
6.7
108.
5
10
8.0
110.
1
11
1.2
111.
8
11
1.8
112.
0
11
3.6
117.
4
11
7.1
117.
8
11
8.0
119.
6
E
lect
ricity
and
fuel
s6.
6
100.
0
10
8.7
111.
1
11
5.8
121.
9
11
6.6
111.
8
10
8.9
109.
4
10
8.9
107.
1
10
7.4
114.
8
12
1.5
133.
3
14
1.3
Hou
seho
ld g
oods
7.2
10
0.0
101.
3
10
0.8
101.
9
10
2.0
102.
0
10
2.6
102.
0
10
2.0
102.
6
10
2.4
102.
4
10
2.6
103.
4
10
3.9
104.
1
H
ealth
1.7
10
0.0
108.
2
10
7.6
106.
1
10
6.4
105.
7
10
6.6
108.
9
10
8.4
109.
6
11
1.0
111.
5
11
2.3
114.
0
11
4.7
114.
8
Tr
ansp
orta
tion
2.1
10
0.0
125.
2
12
7.5
130.
8
12
6.1
126.
7
12
8.5
134.
3
13
5.1
134.
1
13
9.2
145.
2
15
2.9
160.
5
16
7.4
Com
mun
icat
ion
1.0
10
0.0
100.
4
10
0.8
100.
4
10
0.4
100.
6
10
0.6
107.
6
10
7.3
107.
3
10
7.3
107.
3
10
7.3
107.
3
10
7.3
108.
3
Ed
ucat
ion
1.3
10
0.0
99.2
97
.5
97.9
98
.5
99.2
10
0.1
102.
0
10
2.4
102.
2
10
2.1
102.
0
10
1.0
101.
4
10
1.1
100.
9
M
isce
llane
ous
0.6
10
0.0
100.
6
10
1.9
101.
9
10
6.7
110.
2
11
1.3
110.
8
11
0.8
110.
3
11
0.7
110.
2
11
2.0
112.
3
11
2.3
119.
0
So
urce
: Dat
a pr
ovid
ed b
y th
e A
fgha
n au
thor
ities
.
(Mar
ch 2
004
= 10
0)Ta
ble
26. I
slam
ic R
epub
lic o
f Afg
hani
stan
: Nat
iona
l Con
sum
er P
rice
Inde
x, 2
004–
05
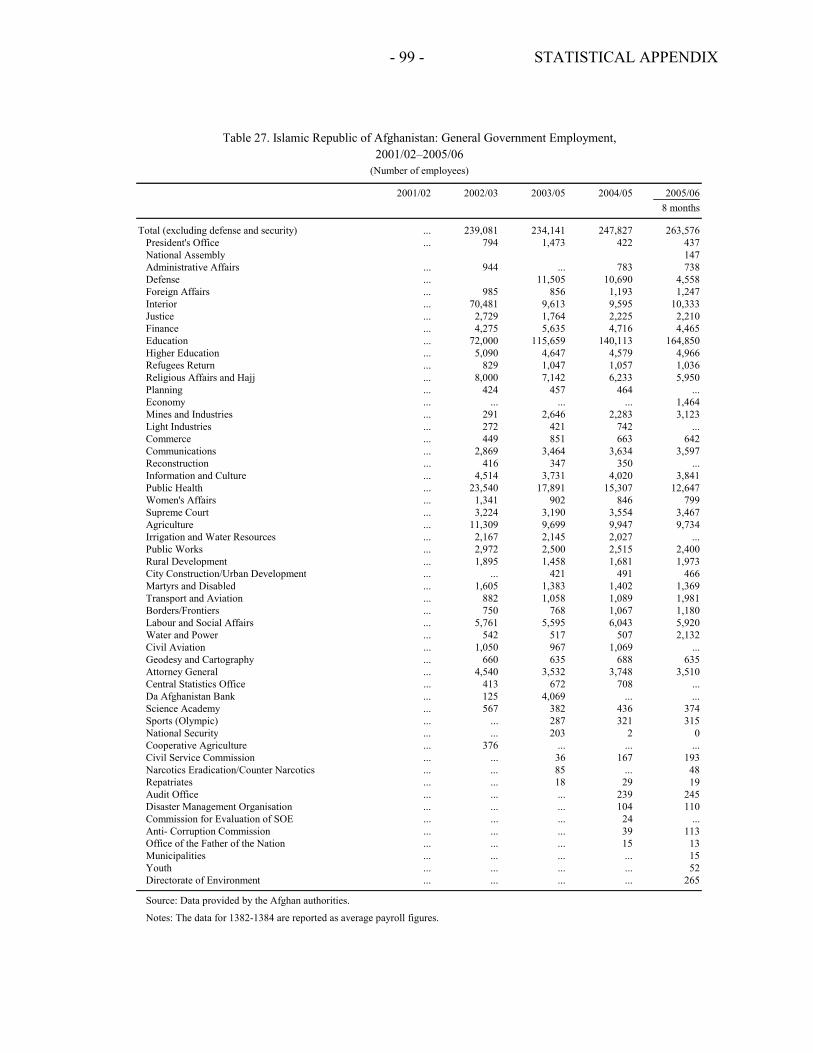
- 99 - STATISTICAL APPENDIX
2001/02 2002/03 2003/05 2004/05 2005/068 months
Total (excluding defense and security) ... 239,081 234,141 247,827 263,576President's Office ... 794 1,473 422 437National Assembly 147Administrative Affairs ... 944 ... 783 738Defense ... 11,505 10,690 4,558Foreign Affairs ... 985 856 1,193 1,247Interior ... 70,481 9,613 9,595 10,333Justice ... 2,729 1,764 2,225 2,210Finance ... 4,275 5,635 4,716 4,465Education ... 72,000 115,659 140,113 164,850Higher Education ... 5,090 4,647 4,579 4,966Refugees Return ... 829 1,047 1,057 1,036Religious Affairs and Hajj ... 8,000 7,142 6,233 5,950Planning ... 424 457 464 ...Economy ... ... ... ... 1,464Mines and Industries ... 291 2,646 2,283 3,123Light Industries ... 272 421 742 ...Commerce ... 449 851 663 642Communications ... 2,869 3,464 3,634 3,597Reconstruction ... 416 347 350 ...Information and Culture ... 4,514 3,731 4,020 3,841Public Health ... 23,540 17,891 15,307 12,647Women's Affairs ... 1,341 902 846 799Supreme Court ... 3,224 3,190 3,554 3,467Agriculture ... 11,309 9,699 9,947 9,734Irrigation and Water Resources ... 2,167 2,145 2,027 ...Public Works ... 2,972 2,500 2,515 2,400Rural Development ... 1,895 1,458 1,681 1,973City Construction/Urban Development ... ... 421 491 466Martyrs and Disabled ... 1,605 1,383 1,402 1,369Transport and Aviation ... 882 1,058 1,089 1,981Borders/Frontiers ... 750 768 1,067 1,180Labour and Social Affairs ... 5,761 5,595 6,043 5,920Water and Power ... 542 517 507 2,132Civil Aviation ... 1,050 967 1,069 ...Geodesy and Cartography ... 660 635 688 635Attorney General ... 4,540 3,532 3,748 3,510Central Statistics Office ... 413 672 708 ...Da Afghanistan Bank ... 125 4,069 ... ...Science Academy ... 567 382 436 374Sports (Olympic) ... ... 287 321 315National Security ... ... 203 2 0Cooperative Agriculture ... 376 ... ... ...Civil Service Commission ... ... 36 167 193Narcotics Eradication/Counter Narcotics ... ... 85 ... 48Repatriates ... ... 18 29 19Audit Office ... ... ... 239 245Disaster Management Organisation ... ... ... 104 110Commission for Evaluation of SOE ... ... ... 24 ...Anti- Corruption Commission ... ... ... 39 113Office of the Father of the Nation ... ... ... 15 13Municipalities ... ... ... ... 15Youth ... ... ... ... 52Directorate of Environment ... ... ... ... 265
Source: Data provided by the Afghan authorities.
Notes: The data for 1382-1384 are reported as average payroll figures.
(Number of employees)2001/02–2005/06
Table 27. Islamic Republic of Afghanistan: General Government Employment,
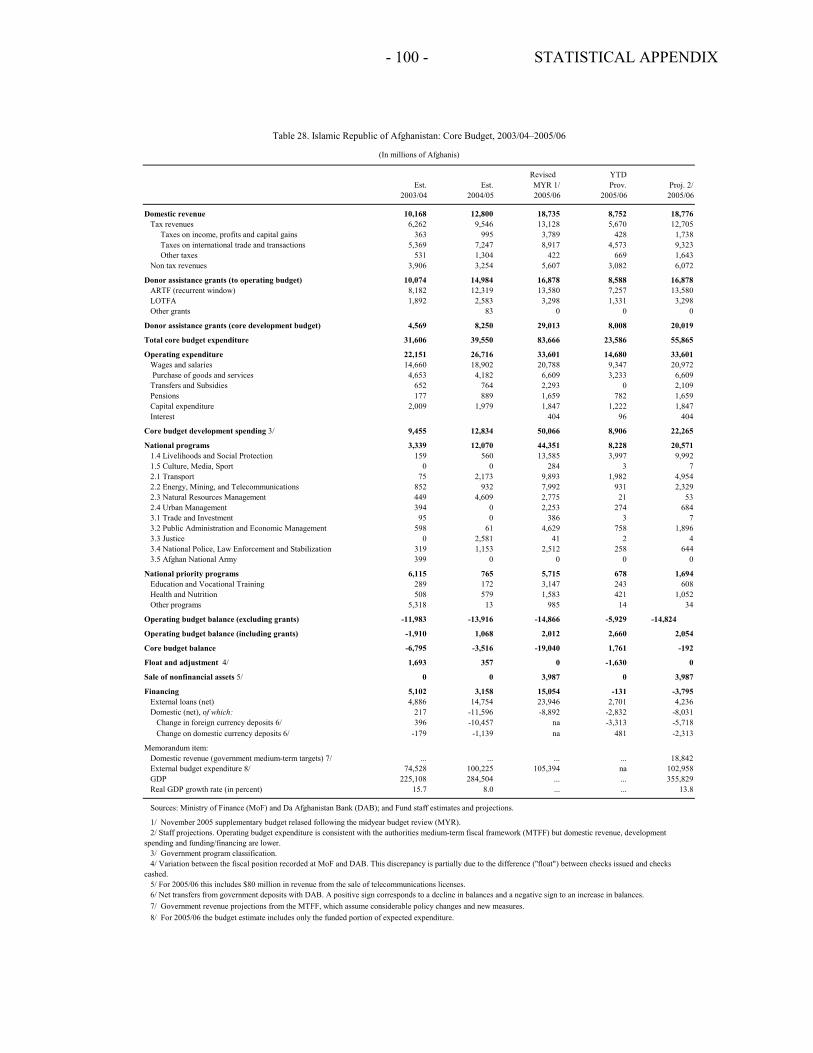
- 100 - STATISTICAL APPENDIX
Revised YTDEst. Est. MYR 1/ Prov. Proj. 2/
2003/04 2004/05 2005/06 2005/06 2005/06
Domestic revenue 10,168 12,800 18,735 8,752 18,776Tax revenues 6,262 9,546 13,128 5,670 12,705 Taxes on income, profits and capital gains 363 995 3,789 428 1,738 Taxes on international trade and transactions 5,369 7,247 8,917 4,573 9,323 Other taxes 531 1,304 422 669 1,643Non tax revenues 3,906 3,254 5,607 3,082 6,072
Donor assistance grants (to operating budget) 10,074 14,984 16,878 8,588 16,878ARTF (recurrent window) 8,182 12,319 13,580 7,257 13,580LOTFA 1,892 2,583 3,298 1,331 3,298Other grants 83 0 0 0
Donor assistance grants (core development budget) 4,569 8,250 29,013 8,008 20,019
Total core budget expenditure 31,606 39,550 83,666 23,586 55,865
Operating expenditure 22,151 26,716 33,601 14,680 33,601Wages and salaries 14,660 18,902 20,788 9,347 20,972 Purchase of goods and services 4,653 4,182 6,609 3,233 6,609Transfers and Subsidies 652 764 2,293 0 2,109Pensions 177 889 1,659 782 1,659Capital expenditure 2,009 1,979 1,847 1,222 1,847Interest 404 96 404
Core budget development spending 3/ 9,455 12,834 50,066 8,906 22,265
National programs 3,339 12,070 44,351 8,228 20,5711.4 Livelihoods and Social Protection 159 560 13,585 3,997 9,9921.5 Culture, Media, Sport 0 0 284 3 72.1 Transport 75 2,173 9,893 1,982 4,9542.2 Energy, Mining, and Telecommunications 852 932 7,992 931 2,3292.3 Natural Resources Management 449 4,609 2,775 21 532.4 Urban Management 394 0 2,253 274 6843.1 Trade and Investment 95 0 386 3 73.2 Public Administration and Economic Management 598 61 4,629 758 1,8963.3 Justice 0 2,581 41 2 43.4 National Police, Law Enforcement and Stabilization 319 1,153 2,512 258 6443.5 Afghan National Army 399 0 0 0 0
National priority programs 6,115 765 5,715 678 1,694Education and Vocational Training 289 172 3,147 243 608Health and Nutrition 508 579 1,583 421 1,052Other programs 5,318 13 985 14 34
Operating budget balance (excluding grants) -11,983 -13,916 -14,866 -5,929 -14,824
Operating budget balance (including grants) -1,910 1,068 2,012 2,660 2,054
Core budget balance -6,795 -3,516 -19,040 1,761 -192
Float and adjustment 4/ 1,693 357 0 -1,630 0
Sale of nonfinancial assets 5/ 0 0 3,987 0 3,987
Financing 5,102 3,158 15,054 -131 -3,795 External loans (net) 4,886 14,754 23,946 2,701 4,236 Domestic (net), of which: 217 -11,596 -8,892 -2,832 -8,031
Change in foreign currency deposits 6/ 396 -10,457 na -3,313 -5,718Change on domestic currency deposits 6/ -179 -1,139 na 481 -2,313
Memorandum item:Domestic revenue (government medium-term targets) 7/ ... ... ... ... 18,842External budget expenditure 8/ 74,528 100,225 105,394 na 102,958GDP 225,108 284,504 ... ... 355,829Real GDP growth rate (in percent) 15.7 8.0 ... ... 13.8
Sources: Ministry of Finance (MoF) and Da Afghanistan Bank (DAB); and Fund staff estimates and projections.
1/ November 2005 supplementary budget relased following the midyear budget review (MYR).2/ Staff projections. Operating budget expenditure is consistent with the authorities medium-term fiscal framework (MTFF) but domestic revenue, development
spending and funding/financing are lower.3/ Government program classification. 4/ Variation between the fiscal position recorded at MoF and DAB. This discrepancy is partially due to the difference (''float") between checks issued and checks
cashed. 5/ For 2005/06 this includes $80 million in revenue from the sale of telecommunications licenses.6/ Net transfers from government deposits with DAB. A positive sign corresponds to a decline in balances and a negative sign to an increase in balances.7/ Government revenue projections from the MTFF, which assume considerable policy changes and new measures.8/ For 2005/06 the budget estimate includes only the funded portion of expected expenditure.
Table 28. Islamic Republic of Afghanistan: Core Budget, 2003/04–2005/06
(In millions of Afghanis)
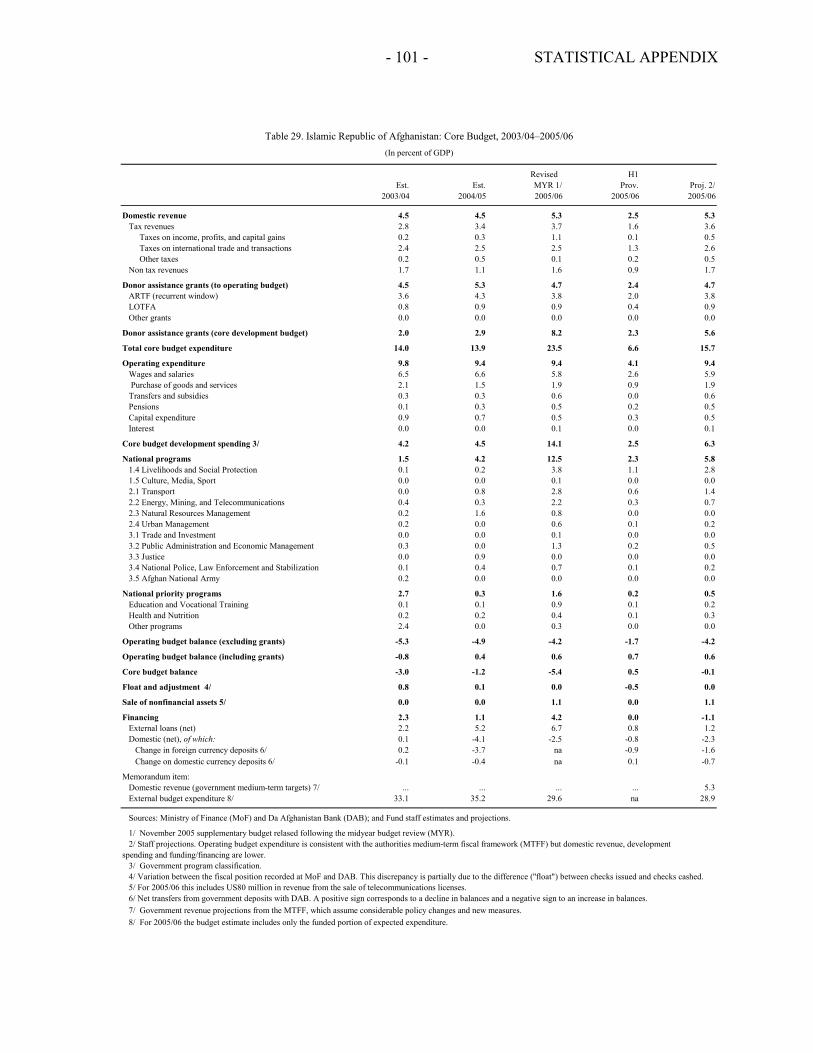
- 101 - STATISTICAL APPENDIX
Revised H1Est. Est. MYR 1/ Prov. Proj. 2/
2003/04 2004/05 2005/06 2005/06 2005/06
Domestic revenue 4.5 4.5 5.3 2.5 5.3Tax revenues 2.8 3.4 3.7 1.6 3.6 Taxes on income, profits, and capital gains 0.2 0.3 1.1 0.1 0.5 Taxes on international trade and transactions 2.4 2.5 2.5 1.3 2.6 Other taxes 0.2 0.5 0.1 0.2 0.5Non tax revenues 1.7 1.1 1.6 0.9 1.7
Donor assistance grants (to operating budget) 4.5 5.3 4.7 2.4 4.7ARTF (recurrent window) 3.6 4.3 3.8 2.0 3.8LOTFA 0.8 0.9 0.9 0.4 0.9Other grants 0.0 0.0 0.0 0.0 0.0
Donor assistance grants (core development budget) 2.0 2.9 8.2 2.3 5.6
Total core budget expenditure 14.0 13.9 23.5 6.6 15.7
Operating expenditure 9.8 9.4 9.4 4.1 9.4Wages and salaries 6.5 6.6 5.8 2.6 5.9 Purchase of goods and services 2.1 1.5 1.9 0.9 1.9Transfers and subsidies 0.3 0.3 0.6 0.0 0.6Pensions 0.1 0.3 0.5 0.2 0.5Capital expenditure 0.9 0.7 0.5 0.3 0.5Interest 0.0 0.0 0.1 0.0 0.1
Core budget development spending 3/ 4.2 4.5 14.1 2.5 6.3
National programs 1.5 4.2 12.5 2.3 5.81.4 Livelihoods and Social Protection 0.1 0.2 3.8 1.1 2.81.5 Culture, Media, Sport 0.0 0.0 0.1 0.0 0.02.1 Transport 0.0 0.8 2.8 0.6 1.42.2 Energy, Mining, and Telecommunications 0.4 0.3 2.2 0.3 0.72.3 Natural Resources Management 0.2 1.6 0.8 0.0 0.02.4 Urban Management 0.2 0.0 0.6 0.1 0.23.1 Trade and Investment 0.0 0.0 0.1 0.0 0.03.2 Public Administration and Economic Management 0.3 0.0 1.3 0.2 0.53.3 Justice 0.0 0.9 0.0 0.0 0.03.4 National Police, Law Enforcement and Stabilization 0.1 0.4 0.7 0.1 0.23.5 Afghan National Army 0.2 0.0 0.0 0.0 0.0
National priority programs 2.7 0.3 1.6 0.2 0.5Education and Vocational Training 0.1 0.1 0.9 0.1 0.2Health and Nutrition 0.2 0.2 0.4 0.1 0.3Other programs 2.4 0.0 0.3 0.0 0.0
Operating budget balance (excluding grants) -5.3 -4.9 -4.2 -1.7 -4.2
Operating budget balance (including grants) -0.8 0.4 0.6 0.7 0.6
Core budget balance -3.0 -1.2 -5.4 0.5 -0.1
Float and adjustment 4/ 0.8 0.1 0.0 -0.5 0.0
Sale of nonfinancial assets 5/ 0.0 0.0 1.1 0.0 1.1
Financing 2.3 1.1 4.2 0.0 -1.1 External loans (net) 2.2 5.2 6.7 0.8 1.2 Domestic (net), of which: 0.1 -4.1 -2.5 -0.8 -2.3
Change in foreign currency deposits 6/ 0.2 -3.7 na -0.9 -1.6Change on domestic currency deposits 6/ -0.1 -0.4 na 0.1 -0.7
Memorandum item:Domestic revenue (government medium-term targets) 7/ ... ... ... ... 5.3External budget expenditure 8/ 33.1 35.2 29.6 na 28.9
Sources: Ministry of Finance (MoF) and Da Afghanistan Bank (DAB); and Fund staff estimates and projections.
1/ November 2005 supplementary budget relased following the midyear budget review (MYR).2/ Staff projections. Operating budget expenditure is consistent with the authorities medium-term fiscal framework (MTFF) but domestic revenue, development
spending and funding/financing are lower.3/ Government program classification. 4/ Variation between the fiscal position recorded at MoF and DAB. This discrepancy is partially due to the difference (''float") between checks issued and checks cashed. 5/ For 2005/06 this includes US80 million in revenue from the sale of telecommunications licenses.6/ Net transfers from government deposits with DAB. A positive sign corresponds to a decline in balances and a negative sign to an increase in balances.7/ Government revenue projections from the MTFF, which assume considerable policy changes and new measures.8/ For 2005/06 the budget estimate includes only the funded portion of expected expenditure.
Table 29. Islamic Republic of Afghanistan: Core Budget, 2003/04–2005/06(In percent of GDP)
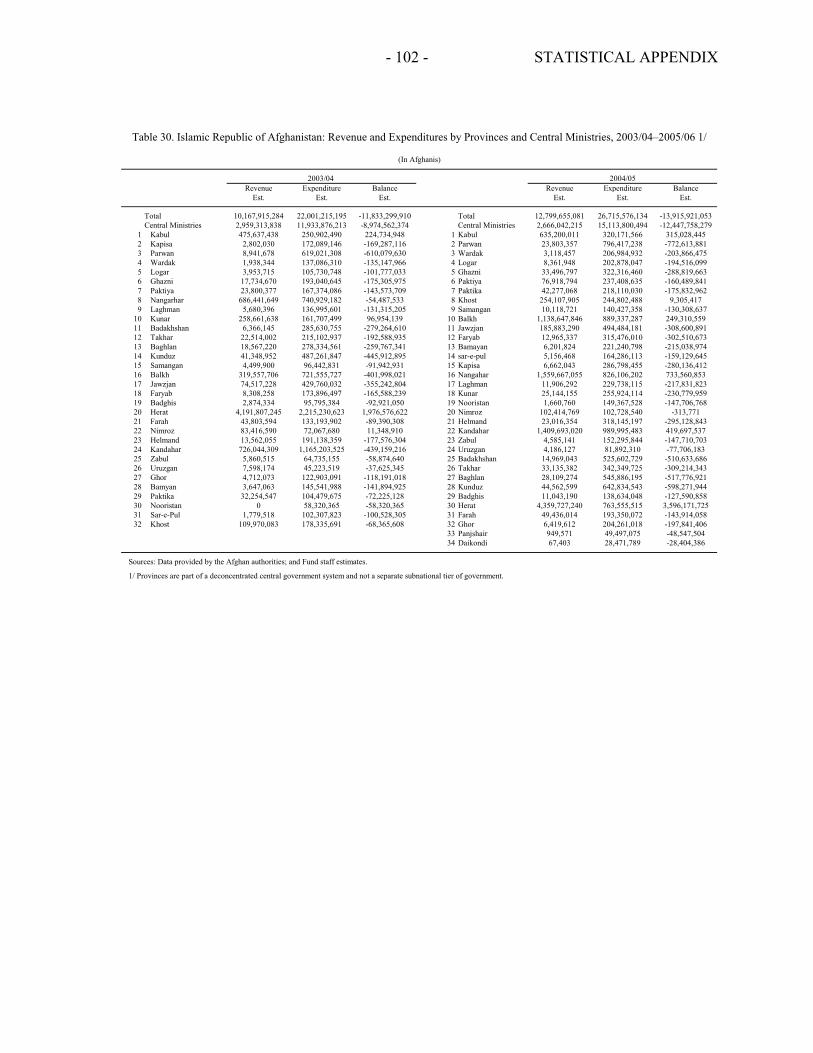
- 102 - STATISTICAL APPENDIX
Revenue Expenditure Balance Revenue Expenditure Balance Est. Est. Est. Est. Est. Est.
Total 10,167,915,284 22,001,215,195 -11,833,299,910 Total 12,799,655,081 26,715,576,134 -13,915,921,053Central Ministries 2,959,313,838 11,933,876,213 -8,974,562,374 Central Ministries 2,666,042,215 15,113,800,494 -12,447,758,279
1 Kabul 475,637,438 250,902,490 224,734,948 1 Kabul 635,200,011 320,171,566 315,028,4452 Kapisa 2,802,030 172,089,146 -169,287,116 2 Parwan 23,803,357 796,417,238 -772,613,8813 Parwan 8,941,678 619,021,308 -610,079,630 3 Wardak 3,118,457 206,984,932 -203,866,4754 Wardak 1,938,344 137,086,310 -135,147,966 4 Logar 8,361,948 202,878,047 -194,516,0995 Logar 3,953,715 105,730,748 -101,777,033 5 Ghazni 33,496,797 322,316,460 -288,819,6636 Ghazni 17,734,670 193,040,645 -175,305,975 6 Paktiya 76,918,794 237,408,635 -160,489,8417 Paktiya 23,800,377 167,374,086 -143,573,709 7 Paktika 42,277,068 218,110,030 -175,832,9628 Nangarhar 686,441,649 740,929,182 -54,487,533 8 Khost 254,107,905 244,802,488 9,305,4179 Laghman 5,680,396 136,995,601 -131,315,205 9 Samangan 10,118,721 140,427,358 -130,308,637
10 Kunar 258,661,638 161,707,499 96,954,139 10 Balkh 1,138,647,846 889,337,287 249,310,55911 Badakhshan 6,366,145 285,630,755 -279,264,610 11 Jawzjan 185,883,290 494,484,181 -308,600,89112 Takhar 22,514,002 215,102,937 -192,588,935 12 Faryab 12,965,337 315,476,010 -302,510,67313 Baghlan 18,567,220 278,334,561 -259,767,341 13 Bamayan 6,201,824 221,240,798 -215,038,97414 Kunduz 41,348,952 487,261,847 -445,912,895 14 sar-e-pul 5,156,468 164,286,113 -159,129,64515 Samangan 4,499,900 96,442,831 -91,942,931 15 Kapisa 6,662,043 286,798,455 -280,136,41216 Balkh 319,557,706 721,555,727 -401,998,021 16 Nangahar 1,559,667,055 826,106,202 733,560,85317 Jawzjan 74,517,228 429,760,032 -355,242,804 17 Laghman 11,906,292 229,738,115 -217,831,82318 Faryab 8,308,258 173,896,497 -165,588,239 18 Kunar 25,144,155 255,924,114 -230,779,95919 Badghis 2,874,334 95,795,384 -92,921,050 19 Nooristan 1,660,760 149,367,528 -147,706,76820 Herat 4,191,807,245 2,215,230,623 1,976,576,622 20 Nimroz 102,414,769 102,728,540 -313,77121 Farah 43,803,594 133,193,902 -89,390,308 21 Helmand 23,016,354 318,145,197 -295,128,84322 Nimroz 83,416,590 72,067,680 11,348,910 22 Kandahar 1,409,693,020 989,995,483 419,697,53723 Helmand 13,562,055 191,138,359 -177,576,304 23 Zabul 4,585,141 152,295,844 -147,710,70324 Kandahar 726,044,309 1,165,203,525 -439,159,216 24 Uruzgan 4,186,127 81,892,310 -77,706,18325 Zabul 5,860,515 64,735,155 -58,874,640 25 Badakhshan 14,969,043 525,602,729 -510,633,68626 Uruzgan 7,598,174 45,223,519 -37,625,345 26 Takhar 33,135,382 342,349,725 -309,214,34327 Ghor 4,712,073 122,903,091 -118,191,018 27 Baghlan 28,109,274 545,886,195 -517,776,92128 Bamyan 3,647,063 145,541,988 -141,894,925 28 Kunduz 44,562,599 642,834,543 -598,271,94429 Paktika 32,254,547 104,479,675 -72,225,128 29 Badghis 11,043,190 138,634,048 -127,590,85830 Nooristan 0 58,320,365 -58,320,365 30 Herat 4,359,727,240 763,555,515 3,596,171,72531 Sar-e-Pul 1,779,518 102,307,823 -100,528,305 31 Farah 49,436,014 193,350,072 -143,914,05832 Khost 109,970,083 178,335,691 -68,365,608 32 Ghor 6,419,612 204,261,018 -197,841,406
33 Panjshair 949,571 49,497,075 -48,547,50434 Daikondi 67,403 28,471,789 -28,404,386
Sources: Data provided by the Afghan authorities; and Fund staff estimates.
1/ Provinces are part of a deconcentrated central government system and not a separate subnational tier of government.
(In Afghanis)
Table 30. Islamic Republic of Afghanistan: Revenue and Expenditures by Provinces and Central Ministries, 2003/04–2005/06 1/
2003/04 2004/05
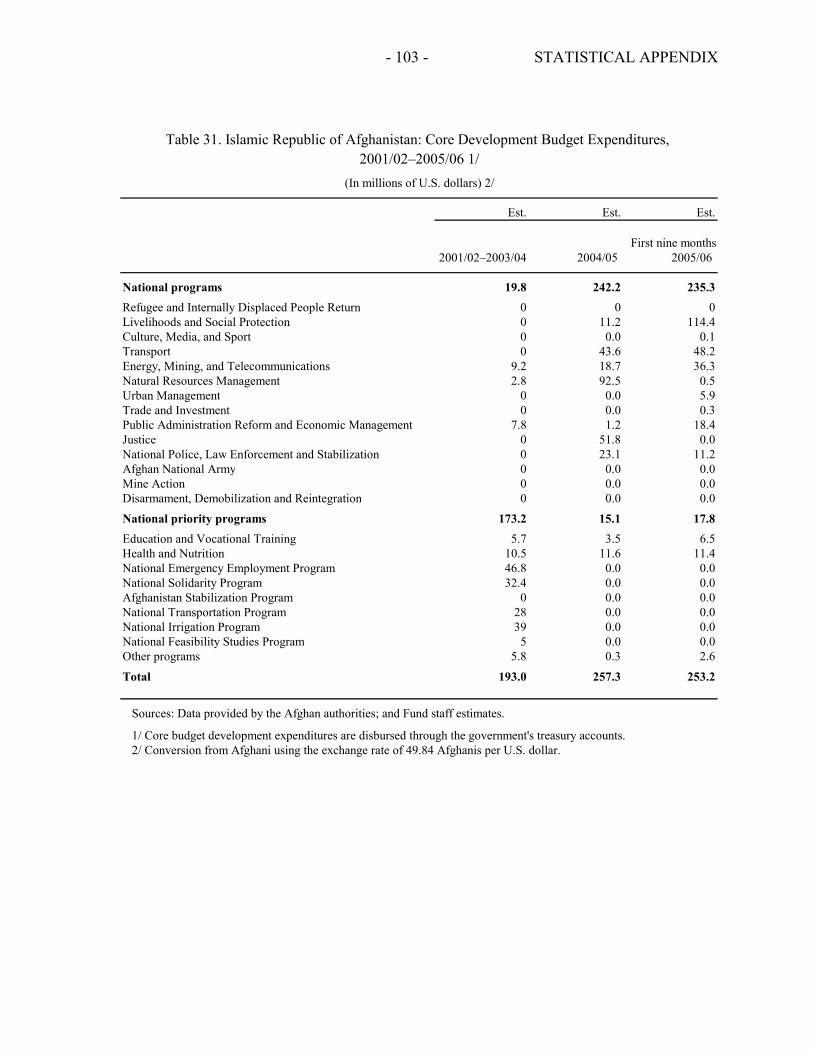
- 103 - STATISTICAL APPENDIX
Est. Est. Est.
First nine months2001/02–2003/04 2004/05 2005/06
National programs 19.8 242.2 235.3Refugee and Internally Displaced People Return 0 0 0Livelihoods and Social Protection 0 11.2 114.4Culture, Media, and Sport 0 0.0 0.1Transport 0 43.6 48.2Energy, Mining, and Telecommunications 9.2 18.7 36.3Natural Resources Management 2.8 92.5 0.5Urban Management 0 0.0 5.9Trade and Investment 0 0.0 0.3Public Administration Reform and Economic Management 7.8 1.2 18.4Justice 0 51.8 0.0National Police, Law Enforcement and Stabilization 0 23.1 11.2Afghan National Army 0 0.0 0.0Mine Action 0 0.0 0.0Disarmament, Demobilization and Reintegration 0 0.0 0.0
National priority programs 173.2 15.1 17.8Education and Vocational Training 5.7 3.5 6.5Health and Nutrition 10.5 11.6 11.4National Emergency Employment Program 46.8 0.0 0.0National Solidarity Program 32.4 0.0 0.0Afghanistan Stabilization Program 0 0.0 0.0National Transportation Program 28 0.0 0.0National Irrigation Program 39 0.0 0.0National Feasibility Studies Program 5 0.0 0.0Other programs 5.8 0.3 2.6
Total 193.0 257.3 253.2
Sources: Data provided by the Afghan authorities; and Fund staff estimates.
1/ Core budget development expenditures are disbursed through the government's treasury accounts. 2/ Conversion from Afghani using the exchange rate of 49.84 Afghanis per U.S. dollar.
Table 31. Islamic Republic of Afghanistan: Core Development Budget Expenditures, 2001/02–2005/06 1/
(In millions of U.S. dollars) 2/
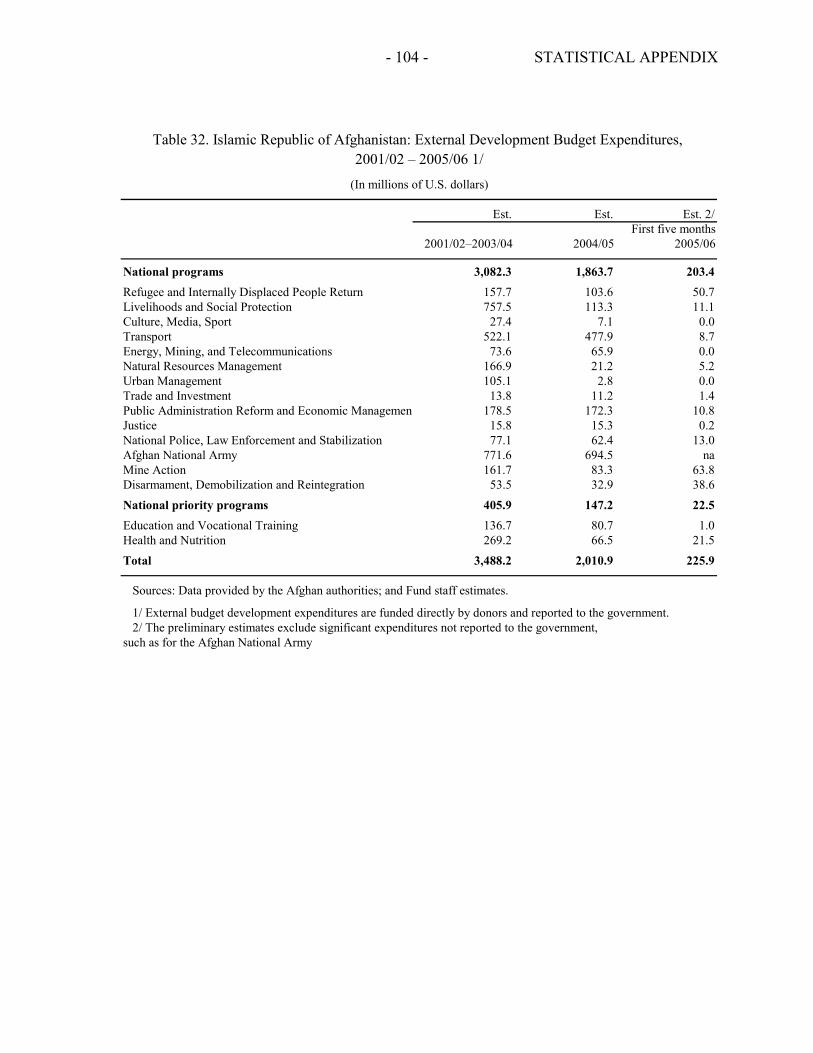
- 104 - STATISTICAL APPENDIX
Est. Est. Est. 2/First five months
2001/02–2003/04 2004/05 2005/06
National programs 3,082.3 1,863.7 203.4Refugee and Internally Displaced People Return 157.7 103.6 50.7Livelihoods and Social Protection 757.5 113.3 11.1Culture, Media, Sport 27.4 7.1 0.0Transport 522.1 477.9 8.7Energy, Mining, and Telecommunications 73.6 65.9 0.0Natural Resources Management 166.9 21.2 5.2Urban Management 105.1 2.8 0.0Trade and Investment 13.8 11.2 1.4Public Administration Reform and Economic Managemen 178.5 172.3 10.8Justice 15.8 15.3 0.2National Police, Law Enforcement and Stabilization 77.1 62.4 13.0Afghan National Army 771.6 694.5 naMine Action 161.7 83.3 63.8Disarmament, Demobilization and Reintegration 53.5 32.9 38.6
National priority programs 405.9 147.2 22.5Education and Vocational Training 136.7 80.7 1.0Health and Nutrition 269.2 66.5 21.5
Total 3,488.2 2,010.9 225.9
Sources: Data provided by the Afghan authorities; and Fund staff estimates.
1/ External budget development expenditures are funded directly by donors and reported to the government. 2/ The preliminary estimates exclude significant expenditures not reported to the government,such as for the Afghan National Army
Table 32. Islamic Republic of Afghanistan: External Development Budget Expenditures, 2001/02 – 2005/06 1/
(In millions of U.S. dollars)
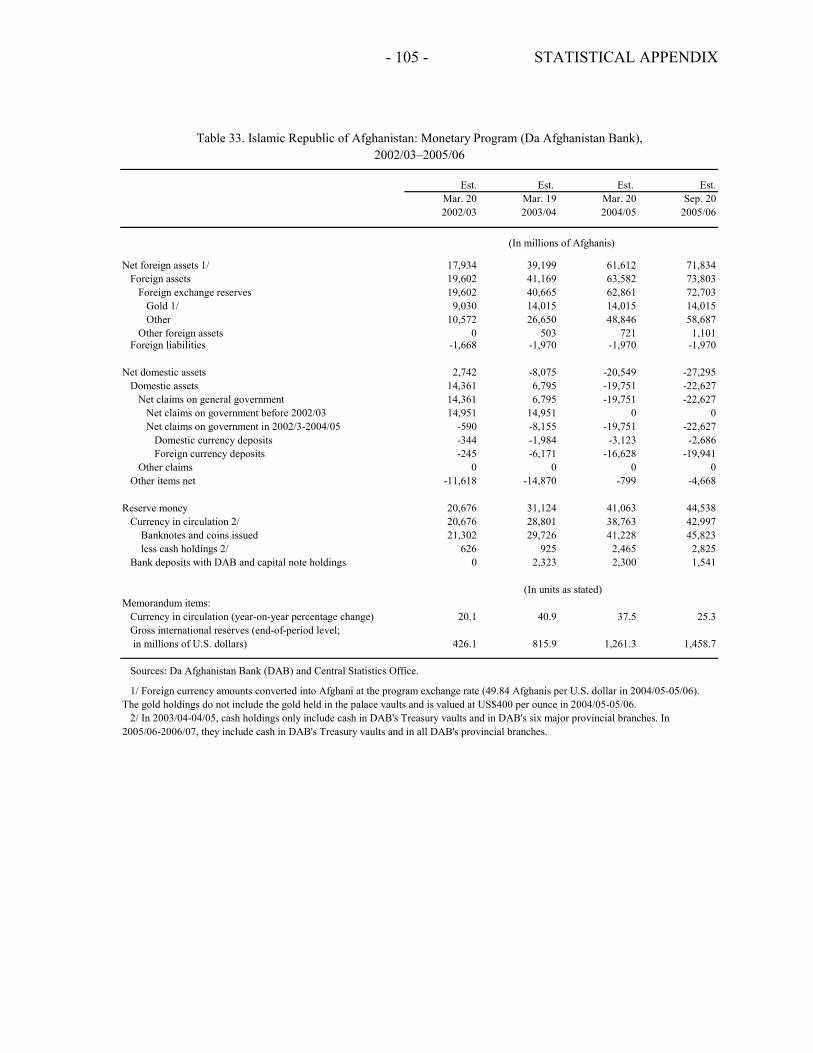
- 105 - STATISTICAL APPENDIX
Est. Est. Est. Mar. 20 Mar. 19 Mar. 20 Sep. 202002/03 2003/04 2004/05 2005/06
Net foreign assets 1/ 17,934 39,199 61,612 71,834Foreign assets 19,602 41,169 63,582 73,803
Foreign exchange reserves 19,602 40,665 62,861 72,703Gold 1/ 9,030 14,015 14,015 14,015Other 10,572 26,650 48,846 58,687
Other foreign assets 0 503 721 1,101Foreign liabilities -1,668 -1,970 -1,970 -1,970
Net domestic assets 2,742 -8,075 -20,549 -27,295Domestic assets 14,361 6,795 -19,751 -22,627
Net claims on general government 14,361 6,795 -19,751 -22,627Net claims on government before 2002/03 14,951 14,951 0 0Net claims on government in 2002/3-2004/05 -590 -8,155 -19,751 -22,627
Domestic currency deposits -344 -1,984 -3,123 -2,686Foreign currency deposits -245 -6,171 -16,628 -19,941
Other claims 0 0 0 0Other items net -11,618 -14,870 -799 -4,668
Reserve money 20,676 31,124 41,063 44,538Currency in circulation 2/ 20,676 28,801 38,763 42,997 Banknotes and coins issued 21,302 29,726 41,228 45,823 less cash holdings 2/ 626 925 2,465 2,825Bank deposits with DAB and capital note holdings 0 2,323 2,300 1,541
Memorandum items:Currency in circulation (year-on-year percentage change) 20.1 40.9 37.5 25.3Gross international reserves (end-of-period level; in millions of U.S. dollars) 426.1 815.9 1,261.3 1,458.7
Sources: Da Afghanistan Bank (DAB) and Central Statistics Office.
1/ Foreign currency amounts converted into Afghani at the program exchange rate (49.84 Afghanis per U.S. dollar in 2004/05-05/06).The gold holdings do not include the gold held in the palace vaults and is valued at US$400 per ounce in 2004/05-05/06.
2/ In 2003/04-04/05, cash holdings only include cash in DAB's Treasury vaults and in DAB's six major provincial branches. In2005/06-2006/07, they include cash in DAB's Treasury vaults and in all DAB's provincial branches.
Est.
2002/03–2005/06
(In millions of Afghanis)
(In units as stated)
Table 33. Islamic Republic of Afghanistan: Monetary Program (Da Afghanistan Bank),
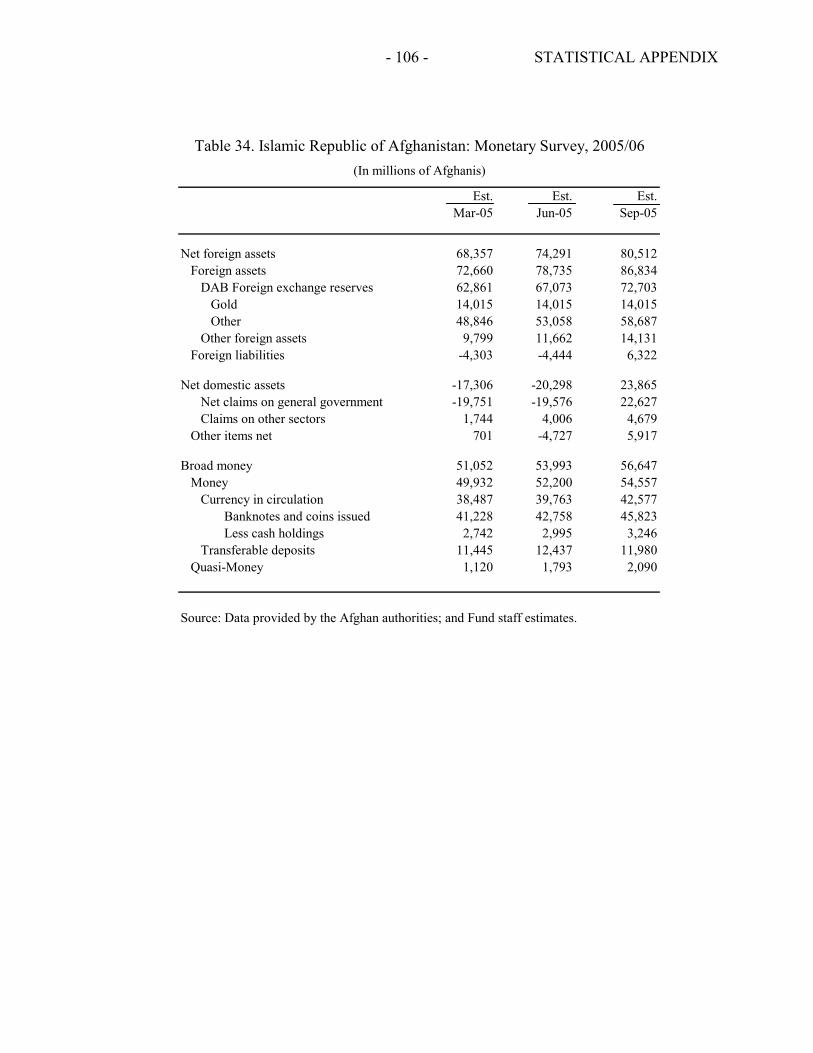
- 106 - STATISTICAL APPENDIX
Est. Est. Est.Mar-05 Jun-05 Sep-05
Net foreign assets 68,357 74,291 80,512Foreign assets 72,660 78,735 86,834
DAB Foreign exchange reserves 62,861 67,073 72,703Gold 14,015 14,015 14,015Other 48,846 53,058 58,687
Other foreign assets 9,799 11,662 14,131Foreign liabilities -4,303 -4,444 6,322
Net domestic assets -17,306 -20,298 23,865Net claims on general government -19,751 -19,576 22,627Claims on other sectors 1,744 4,006 4,679
Other items net 701 -4,727 5,917
Broad money 51,052 53,993 56,647Money 49,932 52,200 54,557
Currency in circulation 38,487 39,763 42,577 Banknotes and coins issued 41,228 42,758 45,823 Less cash holdings 2,742 2,995 3,246
Transferable deposits 11,445 12,437 11,980Quasi-Money 1,120 1,793 2,090
Source: Data provided by the Afghan authorities; and Fund staff estimates.
Table 34. Islamic Republic of Afghanistan: Monetary Survey, 2005/06(In millions of Afghanis)
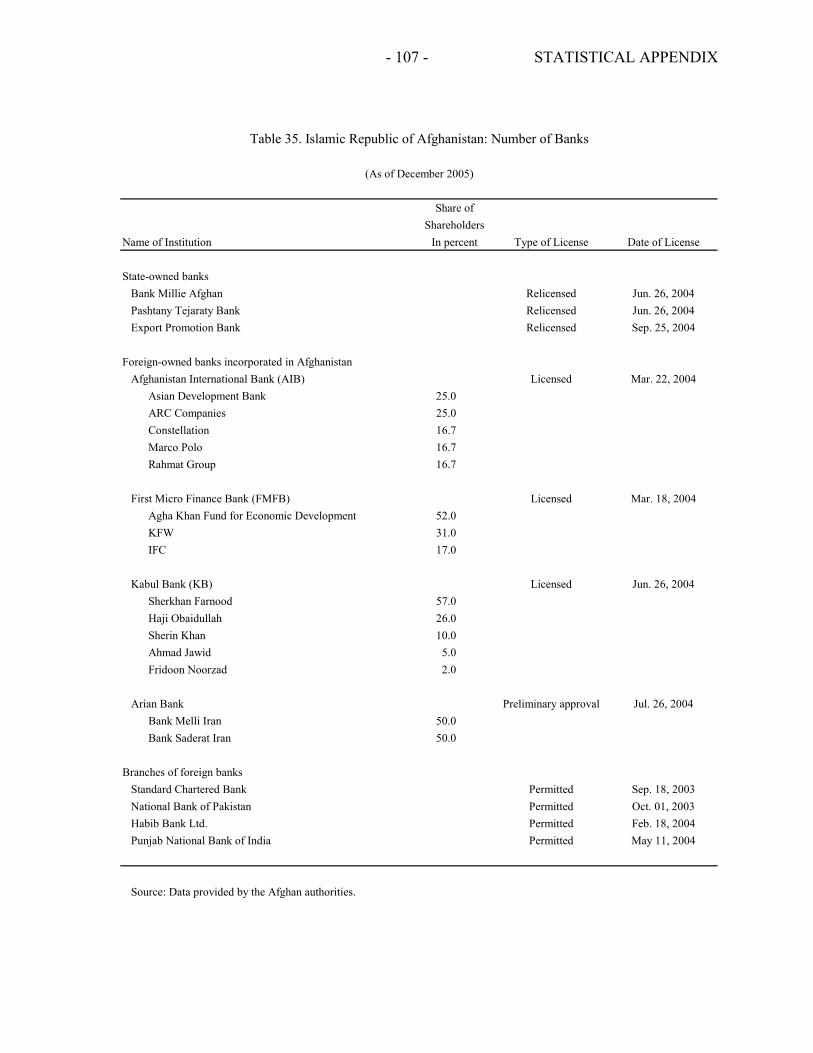
- 107 - STATISTICAL APPENDIX
Share ofShareholders
Name of Institution In percent Type of License Date of License
State-owned banksBank Millie Afghan Relicensed Jun. 26, 2004Pashtany Tejaraty Bank Relicensed Jun. 26, 2004Export Promotion Bank Relicensed Sep. 25, 2004
Foreign-owned banks incorporated in AfghanistanAfghanistan International Bank (AIB) Licensed Mar. 22, 2004
Asian Development Bank 25.0 ARC Companies 25.0 Constellation 16.7 Marco Polo 16.7 Rahmat Group 16.7
First Micro Finance Bank (FMFB) Licensed Mar. 18, 2004 Agha Khan Fund for Economic Development 52.0 KFW 31.0 IFC 17.0
Kabul Bank (KB) Licensed Jun. 26, 2004 Sherkhan Farnood 57.0 Haji Obaidullah 26.0 Sherin Khan 10.0 Ahmad Jawid 5.0 Fridoon Noorzad 2.0
Arian Bank Preliminary approval Jul. 26, 2004 Bank Melli Iran 50.0 Bank Saderat Iran 50.0
Branches of foreign banksStandard Chartered Bank Permitted Sep. 18, 2003National Bank of Pakistan Permitted Oct. 01, 2003Habib Bank Ltd. Permitted Feb. 18, 2004Punjab National Bank of India Permitted May 11, 2004
Source: Data provided by the Afghan authorities.
Table 35. Islamic Republic of Afghanistan: Number of Banks
(As of December 2005)
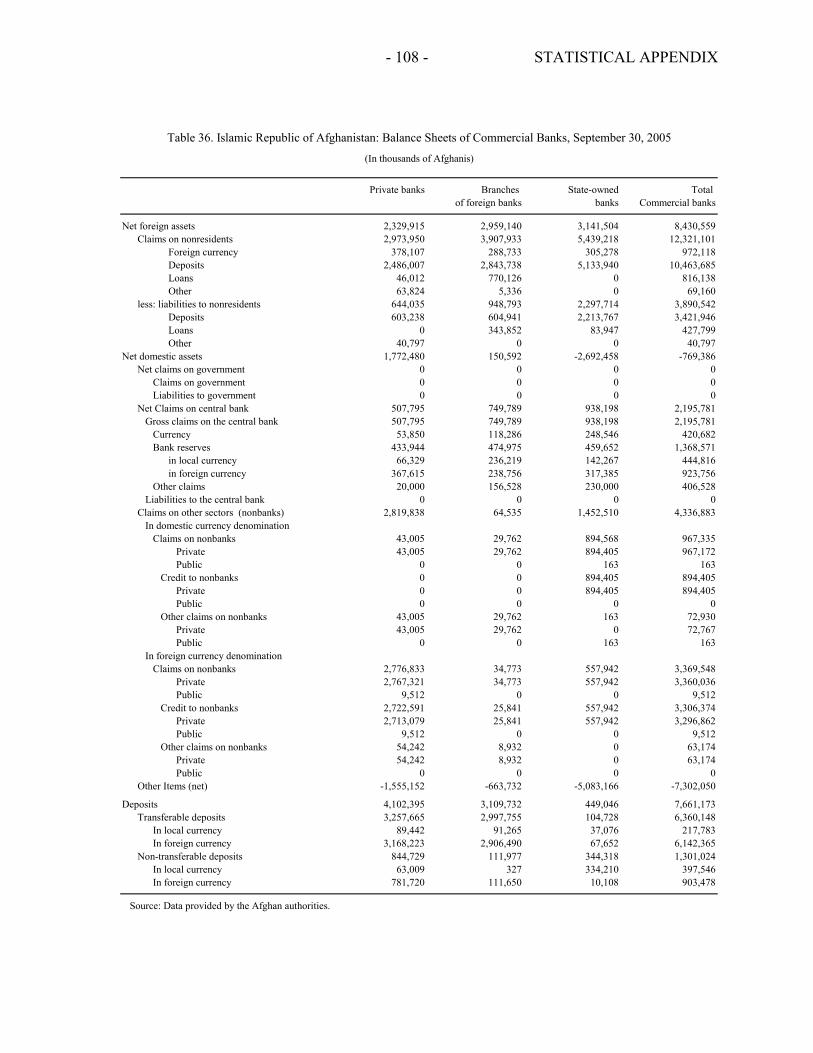
- 108 - STATISTICAL APPENDIX
Private banks Branches State-owned Total of foreign banks banks Commercial banks
Net foreign assets 2,329,915 2,959,140 3,141,504 8,430,559Claims on nonresidents 2,973,950 3,907,933 5,439,218 12,321,101
Foreign currency 378,107 288,733 305,278 972,118Deposits 2,486,007 2,843,738 5,133,940 10,463,685Loans 46,012 770,126 0 816,138Other 63,824 5,336 0 69,160
less: liabilities to nonresidents 644,035 948,793 2,297,714 3,890,542Deposits 603,238 604,941 2,213,767 3,421,946Loans 0 343,852 83,947 427,799Other 40,797 0 0 40,797
Net domestic assets 1,772,480 150,592 -2,692,458 -769,386Net claims on government 0 0 0 0
Claims on government 0 0 0 0Liabilities to government 0 0 0 0
Net Claims on central bank 507,795 749,789 938,198 2,195,781Gross claims on the central bank 507,795 749,789 938,198 2,195,781
Currency 53,850 118,286 248,546 420,682Bank reserves 433,944 474,975 459,652 1,368,571
in local currency 66,329 236,219 142,267 444,816in foreign currency 367,615 238,756 317,385 923,756
Other claims 20,000 156,528 230,000 406,528Liabilities to the central bank 0 0 0 0
Claims on other sectors (nonbanks) 2,819,838 64,535 1,452,510 4,336,883In domestic currency denomination
Claims on nonbanks 43,005 29,762 894,568 967,335Private 43,005 29,762 894,405 967,172Public 0 0 163 163
Credit to nonbanks 0 0 894,405 894,405Private 0 0 894,405 894,405Public 0 0 0 0
Other claims on nonbanks 43,005 29,762 163 72,930Private 43,005 29,762 0 72,767Public 0 0 163 163
In foreign currency denominationClaims on nonbanks 2,776,833 34,773 557,942 3,369,548
Private 2,767,321 34,773 557,942 3,360,036Public 9,512 0 0 9,512
Credit to nonbanks 2,722,591 25,841 557,942 3,306,374Private 2,713,079 25,841 557,942 3,296,862Public 9,512 0 0 9,512
Other claims on nonbanks 54,242 8,932 0 63,174Private 54,242 8,932 0 63,174Public 0 0 0 0
Other Items (net) -1,555,152 -663,732 -5,083,166 -7,302,050
Deposits 4,102,395 3,109,732 449,046 7,661,173Transferable deposits 3,257,665 2,997,755 104,728 6,360,148
In local currency 89,442 91,265 37,076 217,783In foreign currency 3,168,223 2,906,490 67,652 6,142,365
Non-transferable deposits 844,729 111,977 344,318 1,301,024In local currency 63,009 327 334,210 397,546In foreign currency 781,720 111,650 10,108 903,478
Source: Data provided by the Afghan authorities.
Table 36. Islamic Republic of Afghanistan: Balance Sheets of Commercial Banks, September 30, 2005
(In thousands of Afghanis)
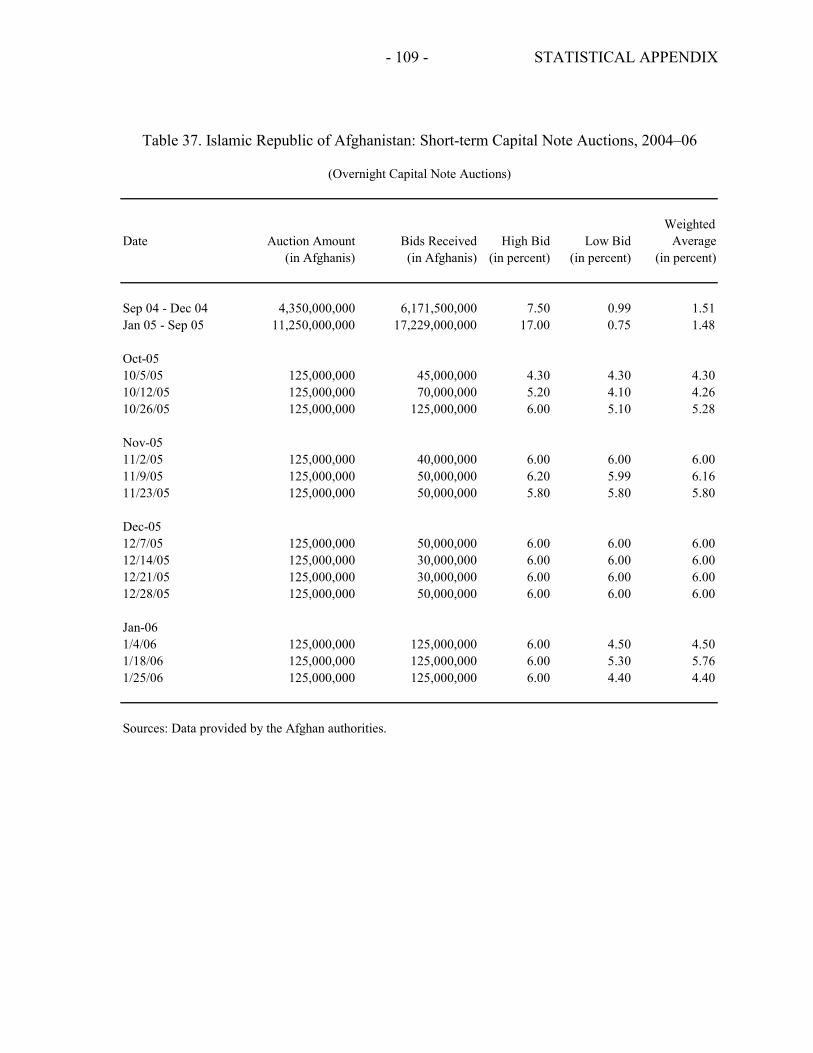
- 109 - STATISTICAL APPENDIX
WeightedDate Auction Amount Bids Received High Bid Low Bid Average
(in Afghanis) (in Afghanis) (in percent) (in percent) (in percent)
Sep 04 - Dec 04 4,350,000,000 6,171,500,000 7.50 0.99 1.51Jan 05 - Sep 05 11,250,000,000 17,229,000,000 17.00 0.75 1.48
Oct-0510/5/05 125,000,000 45,000,000 4.30 4.30 4.3010/12/05 125,000,000 70,000,000 5.20 4.10 4.2610/26/05 125,000,000 125,000,000 6.00 5.10 5.28
Nov-0511/2/05 125,000,000 40,000,000 6.00 6.00 6.0011/9/05 125,000,000 50,000,000 6.20 5.99 6.1611/23/05 125,000,000 50,000,000 5.80 5.80 5.80
Dec-0512/7/05 125,000,000 50,000,000 6.00 6.00 6.0012/14/05 125,000,000 30,000,000 6.00 6.00 6.0012/21/05 125,000,000 30,000,000 6.00 6.00 6.0012/28/05 125,000,000 50,000,000 6.00 6.00 6.00
Jan-061/4/06 125,000,000 125,000,000 6.00 4.50 4.501/18/06 125,000,000 125,000,000 6.00 5.30 5.761/25/06 125,000,000 125,000,000 6.00 4.40 4.40
Sources: Data provided by the Afghan authorities.
Table 37. Islamic Republic of Afghanistan: Short-term Capital Note Auctions, 2004–06
(Overnight Capital Note Auctions)
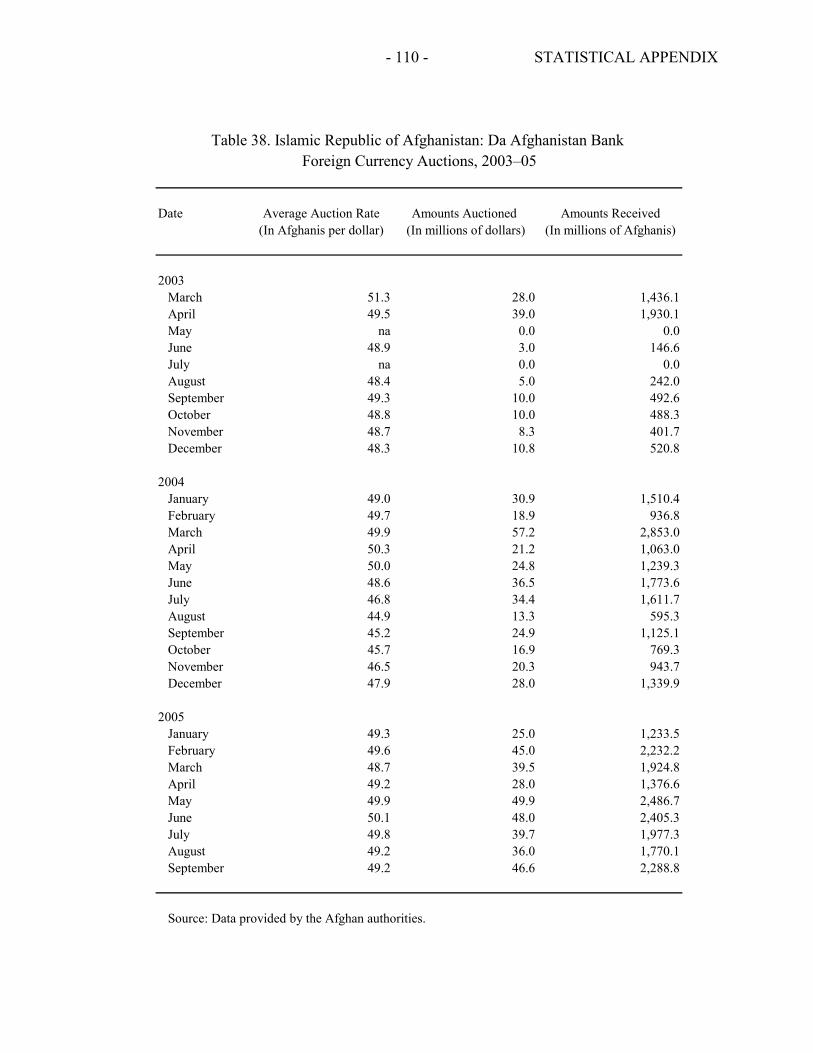
- 110 - STATISTICAL APPENDIX
Date Average Auction Rate Amounts Auctioned Amounts Received(In Afghanis per dollar) (In millions of dollars) (In millions of Afghanis)
2003 March 51.3 28.0 1,436.1 April 49.5 39.0 1,930.1 May na 0.0 0.0 June 48.9 3.0 146.6 July na 0.0 0.0 August 48.4 5.0 242.0 September 49.3 10.0 492.6 October 48.8 10.0 488.3 November 48.7 8.3 401.7 December 48.3 10.8 520.8
2004 January 49.0 30.9 1,510.4 February 49.7 18.9 936.8 March 49.9 57.2 2,853.0 April 50.3 21.2 1,063.0 May 50.0 24.8 1,239.3 June 48.6 36.5 1,773.6 July 46.8 34.4 1,611.7 August 44.9 13.3 595.3 September 45.2 24.9 1,125.1 October 45.7 16.9 769.3 November 46.5 20.3 943.7 December 47.9 28.0 1,339.9
2005 January 49.3 25.0 1,233.5 February 49.6 45.0 2,232.2 March 48.7 39.5 1,924.8 April 49.2 28.0 1,376.6 May 49.9 49.9 2,486.7 June 50.1 48.0 2,405.3 July 49.8 39.7 1,977.3 August 49.2 36.0 1,770.1 September 49.2 46.6 2,288.8
Source: Data provided by the Afghan authorities.
Foreign Currency Auctions, 2003–05Table 38. Islamic Republic of Afghanistan: Da Afghanistan Bank
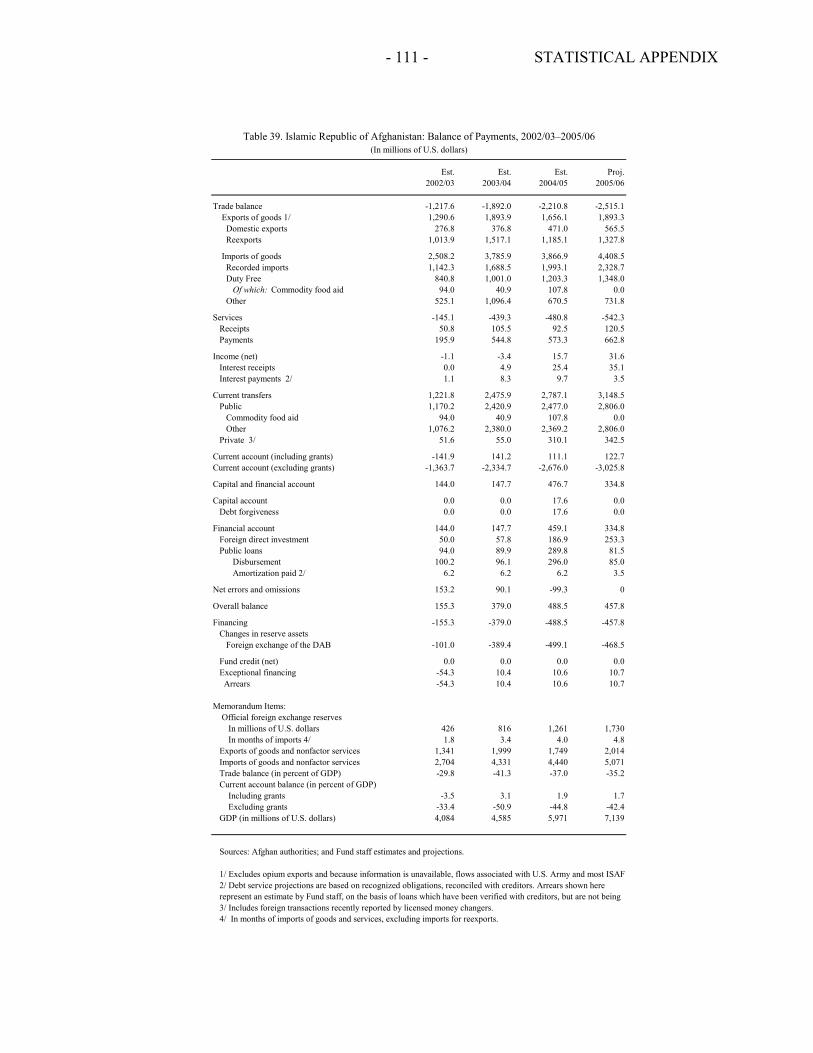
- 111 - STATISTICAL APPENDIX
Est. Est. Est. Proj.2002/03 2003/04 2005/06
Trade balance -1,217.6 -1,892.0 -2,210.8 -2,515.1 Exports of goods 1/ 1,290.6 1,893.9 1,656.1 1,893.3
Domestic exports 276.8 376.8 471.0 565.5Reexports 1,013.9 1,517.1 1,185.1 1,327.8
Imports of goods 2,508.2 3,785.9 3,866.9 4,408.5Recorded imports 1,142.3 1,688.5 1,993.1 2,328.7Duty Free 840.8 1,001.0 1,203.3 1,348.0
Of which: Commodity food aid 94.0 40.9 107.8 0.0Other 525.1 1,096.4 670.5 731.8
Services -145.1 -439.3 -480.8 -542.3Receipts 50.8 105.5 92.5 120.5Payments 195.9 544.8 573.3 662.8
Income (net) -1.1 -3.4 15.7 31.6Interest receipts 0.0 4.9 25.4 35.1Interest payments 2/ 1.1 8.3 9.7 3.5
Current transfers 1,221.8 2,475.9 2,787.1 3,148.5Public 1,170.2 2,420.9 2,477.0 2,806.0
Commodity food aid 94.0 40.9 107.8 0.0Other 1,076.2 2,380.0 2,369.2 2,806.0
Private 3/ 51.6 55.0 310.1 342.5
Current account (including grants) -141.9 141.2 111.1 122.7Current account (excluding grants) -1,363.7 -2,334.7 -2,676.0 -3,025.8
Capital and financial account 144.0 147.7 476.7 334.8
Capital account 0.0 0.0 17.6 0.0Debt forgiveness 0.0 0.0 17.6 0.0
Financial account 144.0 147.7 459.1 334.8Foreign direct investment 50.0 57.8 186.9 253.3Public loans 94.0 89.9 289.8 81.5
Disbursement 100.2 96.1 296.0 85.0 Amortization paid 2/ 6.2 6.2 6.2 3.5
Net errors and omissions 153.2 90.1 -99.3 0
Overall balance 155.3 379.0 488.5 457.8
Financing -155.3 -379.0 -488.5 -457.8Changes in reserve assets
Foreign exchange of the DAB -101.0 -389.4 -499.1 -468.5
Fund credit (net) 0.0 0.0 0.0 0.0Exceptional financing -54.3 10.4 10.6 10.7 Arrears -54.3 10.4 10.6 10.7
Memorandum Items: Official foreign exchange reserves In millions of U.S. dollars 426 816 1,261 1,730 In months of imports 4/ 1.8 3.4 4.0 4.8Exports of goods and nonfactor services 1,341 1,999 1,749 2,014Imports of goods and nonfactor services 2,704 4,331 4,440 5,071Trade balance (in percent of GDP) -29.8 -41.3 -37.0 -35.2Current account balance (in percent of GDP) Including grants -3.5 3.1 1.9 1.7 Excluding grants -33.4 -50.9 -44.8 -42.4GDP (in millions of U.S. dollars) 4,084 4,585 5,971 7,139
Sources: Afghan authorities; and Fund staff estimates and projections.
1/ Excludes opium exports and because information is unavailable, flows associated with U.S. Army and most ISAF
4/ In months of imports of goods and services, excluding imports for reexports.
2/ Debt service projections are based on recognized obligations, reconciled with creditors. Arrears shown here represent an estimate by Fund staff, on the basis of loans which have been verified with creditors, but are not being 3/ Includes foreign transactions recently reported by licensed money changers.
Table 39. Islamic Republic of Afghanistan: Balance of Payments, 2002/03–2005/06
2004/05
(In millions of U.S. dollars)
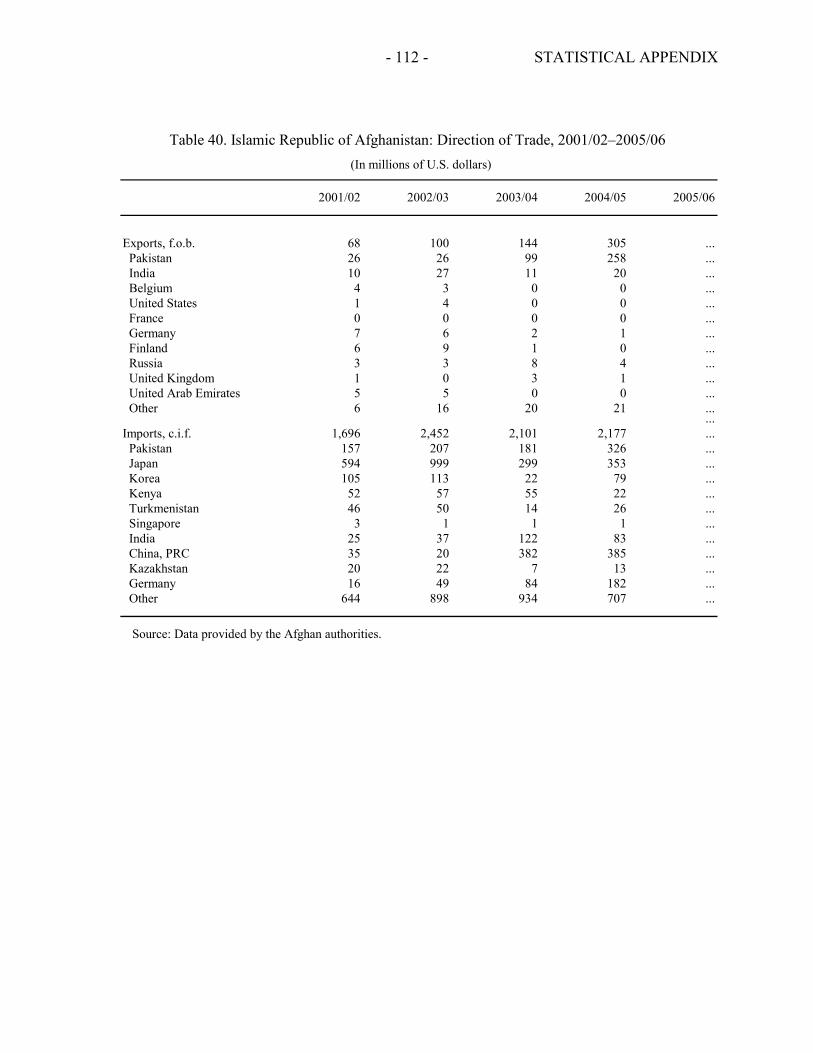
- 112 - STATISTICAL APPENDIX
2001/02 2002/03 2003/04 2004/05 2005/06
Exports, f.o.b. 68 100 144 305 ... Pakistan 26 26 99 258 ... India 10 27 11 20 ... Belgium 4 3 0 0 ... United States 1 4 0 0 ... France 0 0 0 0 ... Germany 7 6 2 1 ... Finland 6 9 1 0 ... Russia 3 3 8 4 ... United Kingdom 1 0 3 1 ... United Arab Emirates 5 5 0 0 ... Other 6 16 20 21 ...
...Imports, c.i.f. 1,696 2,452 2,101 2,177 ... Pakistan 157 207 181 326 ... Japan 594 999 299 353 ... Korea 105 113 22 79 ... Kenya 52 57 55 22 ... Turkmenistan 46 50 14 26 ... Singapore 3 1 1 1 ... India 25 37 122 83 ... China, PRC 35 20 382 385 ... Kazakhstan 20 22 7 13 ... Germany 16 49 84 182 ... Other 644 898 934 707 ...
Source: Data provided by the Afghan authorities.
(In millions of U.S. dollars)
Table 40. Islamic Republic of Afghanistan: Direction of Trade, 2001/02–2005/06
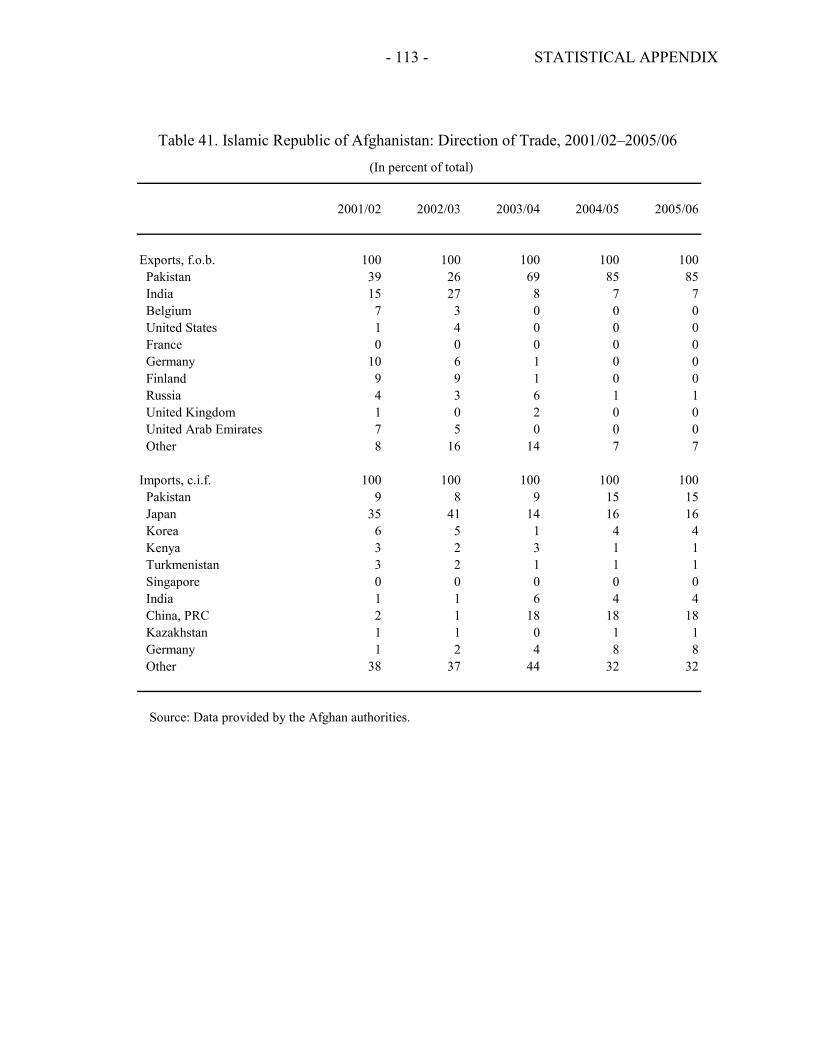
- 113 - STATISTICAL APPENDIX
2001/02 2002/03 2003/04 2004/05 2005/06
Exports, f.o.b. 100 100 100 100 100 Pakistan 39 26 69 85 85 India 15 27 8 7 7 Belgium 7 3 0 0 0 United States 1 4 0 0 0 France 0 0 0 0 0 Germany 10 6 1 0 0 Finland 9 9 1 0 0 Russia 4 3 6 1 1 United Kingdom 1 0 2 0 0 United Arab Emirates 7 5 0 0 0 Other 8 16 14 7 7
Imports, c.i.f. 100 100 100 100 100 Pakistan 9 8 9 15 15 Japan 35 41 14 16 16 Korea 6 5 1 4 4 Kenya 3 2 3 1 1 Turkmenistan 3 2 1 1 1 Singapore 0 0 0 0 0 India 1 1 6 4 4 China, PRC 2 1 18 18 18 Kazakhstan 1 1 0 1 1 Germany 1 2 4 8 8 Other 38 37 44 32 32
Source: Data provided by the Afghan authorities.
(In percent of total)
Table 41. Islamic Republic of Afghanistan: Direction of Trade, 2001/02–2005/06
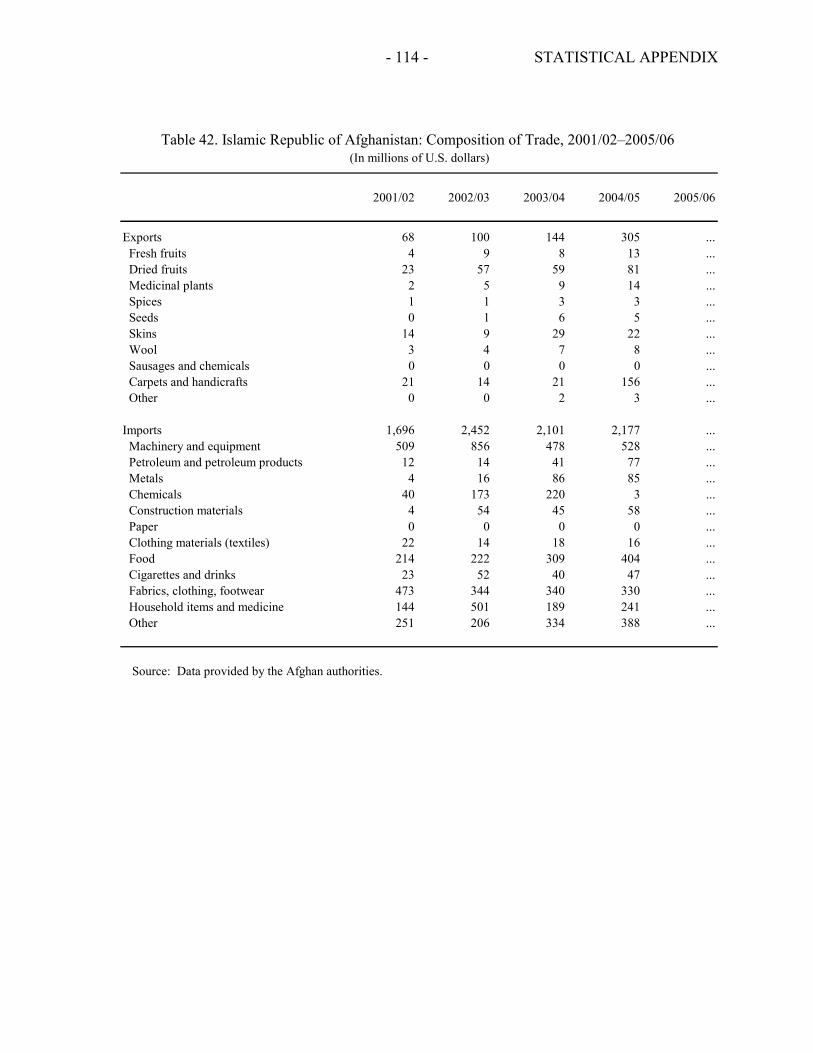
- 114 - STATISTICAL APPENDIX
2001/02 2002/03 2003/04 2004/05 2005/06
Exports 68 100 144 305 ... Fresh fruits 4 9 8 13 ... Dried fruits 23 57 59 81 ... Medicinal plants 2 5 9 14 ... Spices 1 1 3 3 ... Seeds 0 1 6 5 ... Skins 14 9 29 22 ... Wool 3 4 7 8 ... Sausages and chemicals 0 0 0 0 ... Carpets and handicrafts 21 14 21 156 ... Other 0 0 2 3 ...
Imports 1,696 2,452 2,101 2,177 ... Machinery and equipment 509 856 478 528 ... Petroleum and petroleum products 12 14 41 77 ... Metals 4 16 86 85 ... Chemicals 40 173 220 3 ... Construction materials 4 54 45 58 ... Paper 0 0 0 0 ... Clothing materials (textiles) 22 14 18 16 ... Food 214 222 309 404 ... Cigarettes and drinks 23 52 40 47 ... Fabrics, clothing, footwear 473 344 340 330 ... Household items and medicine 144 501 189 241 ... Other 251 206 334 388 ...
Source: Data provided by the Afghan authorities.
Table 42. Islamic Republic of Afghanistan: Composition of Trade, 2001/02–2005/06 (In millions of U.S. dollars)
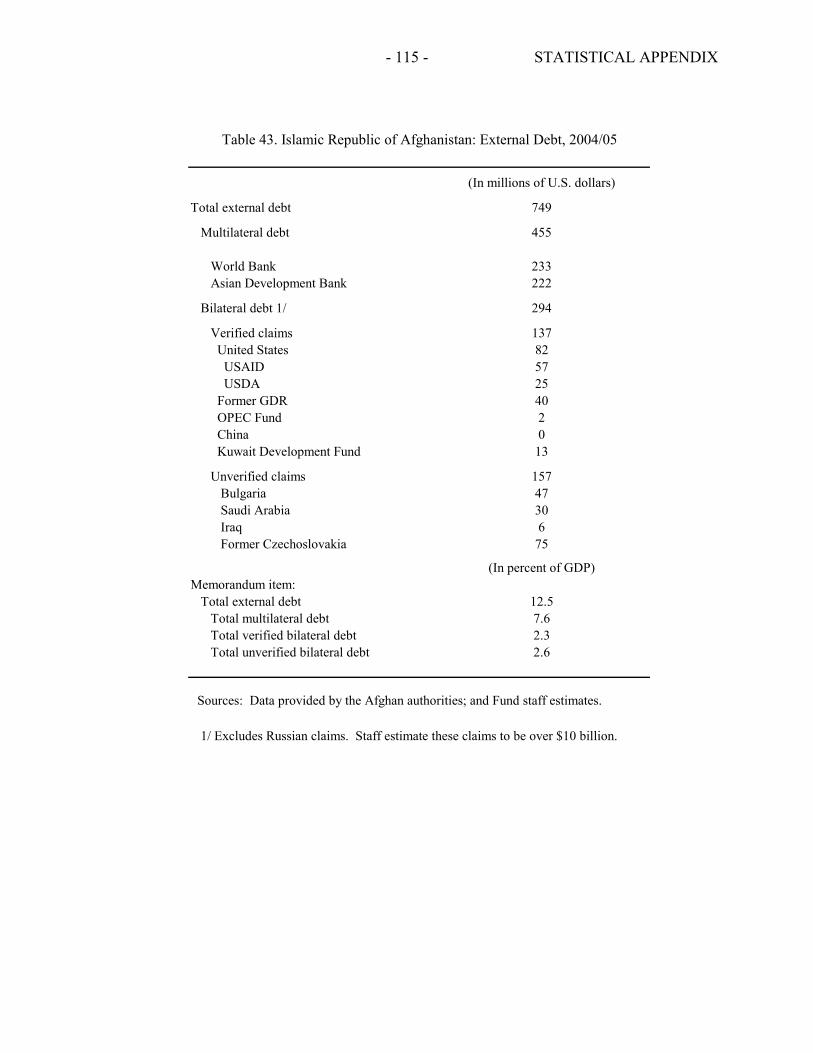
- 115 - STATISTICAL APPENDIX
(In millions of U.S. dollars)
Total external debt 749
Multilateral debt 455
World Bank 233Asian Development Bank 222
Bilateral debt 1/ 294
Verified claims 137 United States 82 USAID 57 USDA 25 Former GDR 40 OPEC Fund 2 China 0 Kuwait Development Fund 13
Unverified claims 157Bulgaria 47Saudi Arabia 30Iraq 6Former Czechoslovakia 75
(In percent of GDP)Memorandum item: Total external debt 12.5
Total multilateral debt 7.6 Total verified bilateral debt 2.3 Total unverified bilateral debt 2.6
Sources: Data provided by the Afghan authorities; and Fund staff estimates.
1/ Excludes Russian claims. Staff estimate these claims to be over $10 billion.
Table 43. Islamic Republic of Afghanistan: External Debt, 2004/05
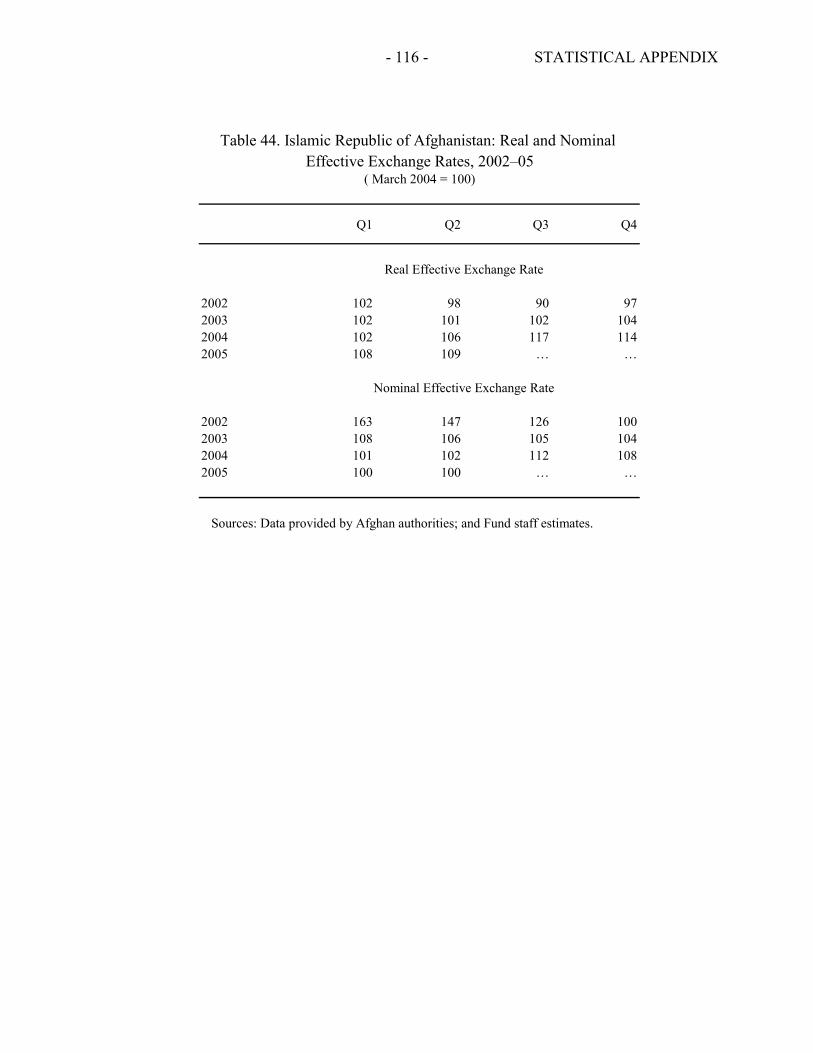
- 116 - STATISTICAL APPENDIX
Q1 Q2 Q3 Q4
2002 102 98 90 972003 102 101 102 1042004 102 106 117 1142005 108 109 … …
2002 163 147 126 1002003 108 106 105 1042004 101 102 112 1082005 100 100 … …
Sources: Data provided by Afghan authorities; and Fund staff estimates.
Nominal Effective Exchange Rate
Table 44. Islamic Republic of Afghanistan: Real and Nominal Effective Exchange Rates, 2002–05
( March 2004 = 100)
Real Effective Exchange Rate
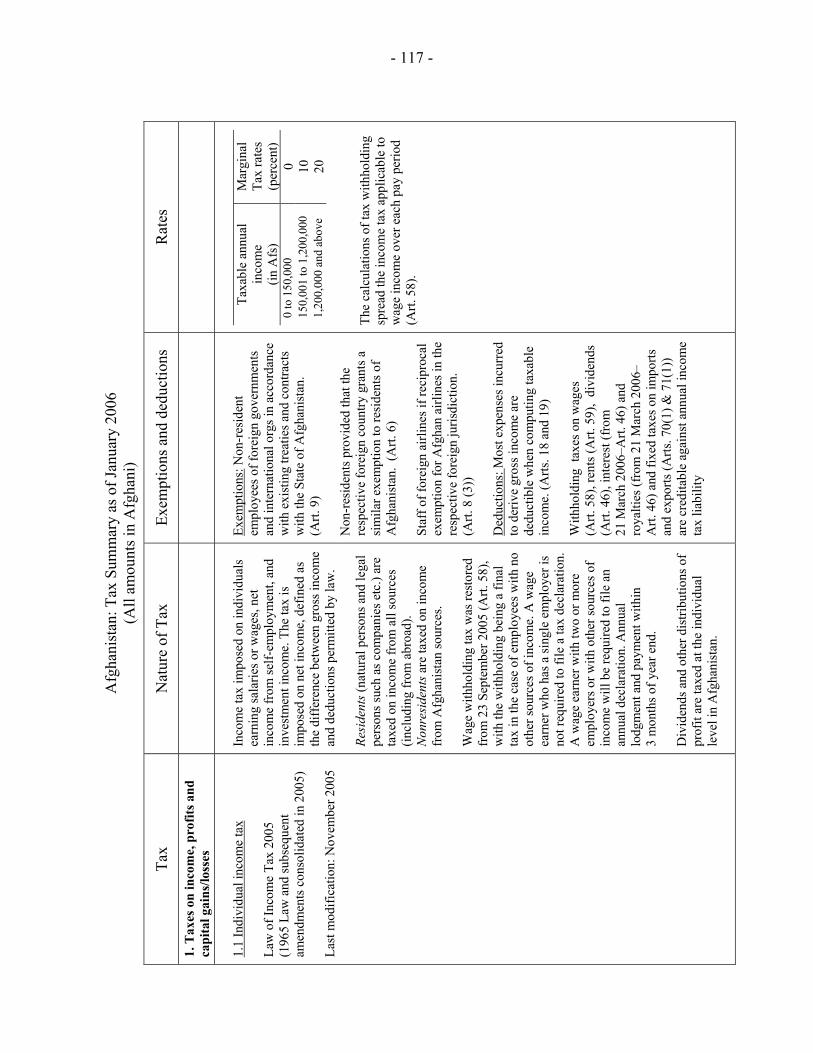
- 117 -
Afg
hani
stan
: Tax
Sum
mar
y as
of J
anua
ry 2
006
(All
amou
nts i
n A
fgha
ni)
Tax
Nat
ure
of T
ax
Exem
ptio
ns a
nd d
educ
tions
R
ates
1. T
axes
on
inco
me,
pro
fits a
nd
capi
tal g
ains
/loss
es
1.1
Indi
vidu
al in
com
e ta
x La
w o
f Inc
ome
Tax
2005
(1
965
Law
and
subs
eque
nt
amen
dmen
ts c
onso
lidat
ed in
200
5)
Last
mod
ifica
tion:
Nov
embe
r 200
5
Inco
me
tax
impo
sed
on in
divi
dual
s ea
rnin
g sa
larie
s or w
ages
, net
in
com
e fr
om se
lf-em
ploy
men
t, an
d in
vest
men
t inc
ome.
The
tax
is
impo
sed
on n
et in
com
e, d
efin
ed a
s th
e di
ffer
ence
bet
wee
n gr
oss i
ncom
e an
d de
duct
ions
per
mitt
ed b
y la
w.
Resi
dent
s (na
tura
l per
sons
and
lega
l pe
rson
s suc
h as
com
pani
es e
tc.)
are
taxe
d on
inco
me
from
all
sour
ces
(incl
udin
g fr
om a
broa
d).
Non
resi
dent
s are
taxe
d on
inco
me
from
Afg
hani
stan
sour
ces.
Wag
e w
ithho
ldin
g ta
x w
as re
store
d fr
om 2
3 Se
ptem
ber 2
005
(Art.
58)
, w
ith th
e w
ithho
ldin
g be
ing
a fin
al
tax
in th
e ca
se o
f em
ploy
ees w
ith n
o ot
her s
ourc
es o
f inc
ome.
A w
age
earn
er w
ho h
as a
sing
le e
mpl
oyer
is
not r
equi
red
to fi
le a
tax
decl
arat
ion.
A
wag
e ea
rner
with
two
or m
ore
empl
oyer
s or w
ith o
ther
sour
ces o
f in
com
e w
ill b
e re
quire
d to
file
an
annu
al d
ecla
ratio
n. A
nnua
l lo
dgm
ent a
nd p
aym
ent w
ithin
3
mon
ths o
f yea
r end
. D
ivid
ends
and
oth
er d
istri
butio
ns o
f pr
ofit
are
taxe
d at
the
indi
vidu
al
leve
l in
Afg
hani
stan
.
Exem
ptio
ns: N
on-r
esid
ent
empl
oyee
s of f
orei
gn g
over
nmen
ts
and
inte
rnat
iona
l org
s in
acco
rdan
ce
with
exi
stin
g tre
atie
s and
con
tract
s w
ith th
e St
ate
of A
fgha
nist
an.
(Art.
9)
Non
-res
iden
ts p
rovi
ded
that
the
resp
ectiv
e fo
reig
n co
untry
gra
nts a
si
mila
r exe
mpt
ion
to re
side
nts o
f A
fgha
nist
an.
(Art.
6)
Staf
f of f
orei
gn a
irlin
es if
reci
proc
al
exem
ptio
n fo
r Afg
han
airli
nes i
n th
e re
spec
tive
fore
ign
juris
dict
ion.
(A
rt. 8
(3))
D
educ
tions
: Mos
t exp
ense
s inc
urre
d to
der
ive
gros
s inc
ome
are
dedu
ctib
le w
hen
com
putin
g ta
xabl
e in
com
e. (A
rts. 1
8 an
d 19
) W
ithho
ldin
g ta
xes o
n w
ages
(A
rt. 5
8), r
ents
(Art.
59)
, di
vide
nds
(Art.
46)
, int
eres
t (fr
om
21 M
arch
200
6–A
rt. 4
6) a
nd
roya
lties
(fro
m 2
1 M
arch
200
6–A
rt. 4
6) a
nd fi
xed
taxe
s on
impo
rts
and
expo
rts (A
rts. 7
0(1)
& 7
1(1)
) ar
e cr
edita
ble
agai
nst a
nnua
l inc
ome
tax
liabi
lity
Ta
xabl
e an
nual
in
com
e (in
Afs
)
Mar
gina
l Ta
x ra
tes
(per
cent
) 0
to 1
50,0
00
0 15
0,00
1 to
1,2
00,0
00
10
1,20
0,00
0 an
d ab
ove
20
The
calc
ulat
ions
of t
ax w
ithho
ldin
g sp
read
the
inco
me
tax
appl
icab
le to
w
age
inco
me
over
eac
h pa
y pe
riod
(Art.
58)
.
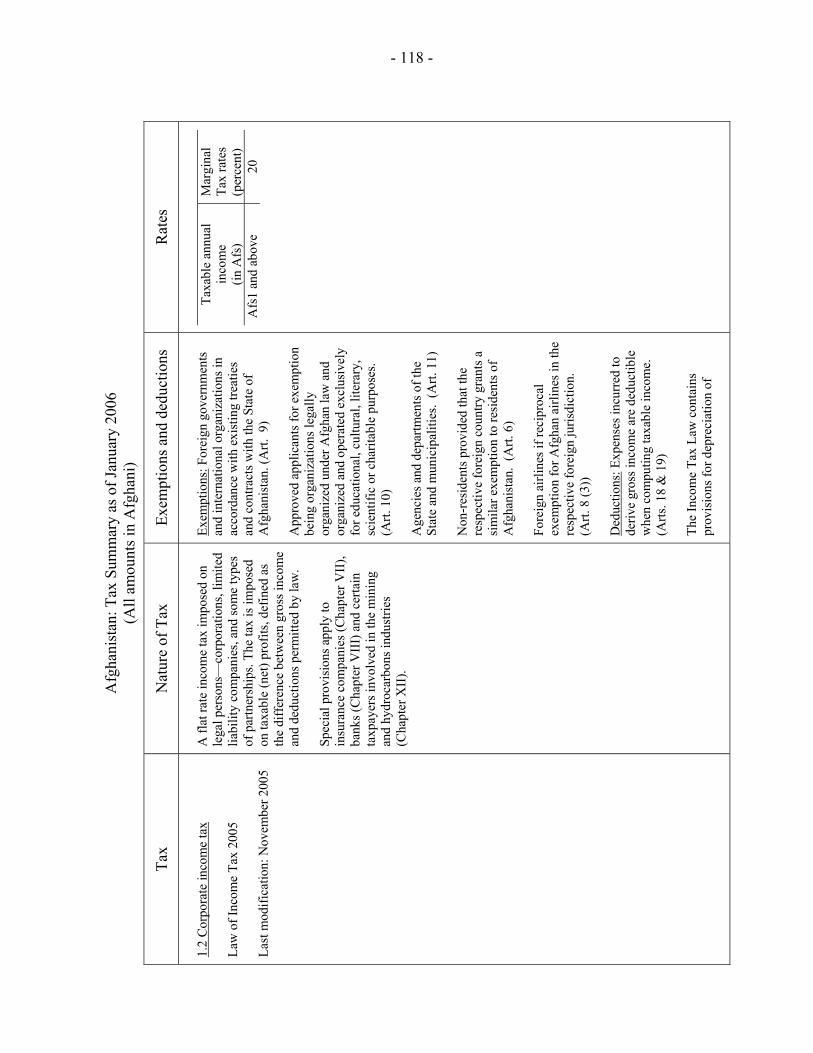
- 118 -
Afg
hani
stan
: Tax
Sum
mar
y as
of J
anua
ry 2
006
(All
amou
nts i
n A
fgha
ni)
Tax
Nat
ure
of T
ax
Exem
ptio
ns a
nd d
educ
tions
R
ates
1.
2 C
orpo
rate
inco
me
tax
Law
of I
ncom
e Ta
x 20
05
Last
mod
ifica
tion:
Nov
embe
r 200
5
A fl
at ra
te in
com
e ta
x im
pose
d on
le
gal p
erso
ns—
corp
orat
ions
, lim
ited
liabi
lity
com
pani
es, a
nd so
me
type
s of
par
tner
ship
s. Th
e ta
x is
impo
sed
on ta
xabl
e (n
et) p
rofit
s, de
fined
as
the
diff
eren
ce b
etw
een
gros
s inc
ome
and
dedu
ctio
ns p
erm
itted
by
law
. Sp
ecia
l pro
visi
ons a
pply
to
insu
ranc
e co
mpa
nies
(Cha
pter
VII
), ba
nks (
Cha
pter
VII
I) a
nd c
erta
in
taxp
ayer
s inv
olve
d in
the
min
ing
and
hydr
ocar
bons
indu
strie
s (C
hapt
er X
II).
Exem
ptio
ns: F
orei
gn g
over
nmen
ts
and
inte
rnat
iona
l org
aniz
atio
ns in
ac
cord
ance
with
exi
stin
g tre
atie
s an
d co
ntra
cts w
ith th
e St
ate
of
Afg
hani
stan
. (A
rt. 9
) A
ppro
ved
appl
ican
ts fo
r exe
mpt
ion
bein
g or
gani
zatio
ns le
gally
or
gani
zed
unde
r Afg
han
law
and
or
gani
zed
and
oper
ated
exc
lusi
vely
fo
r edu
catio
nal,
cultu
ral,
liter
ary,
sc
ient
ific
or c
harit
able
pur
pose
s.
(Art.
10)
A
genc
ies a
nd d
epar
tmen
ts o
f the
St
ate
and
mun
icip
aliti
es.
(Art.
11)
N
on-r
esid
ents
pro
vide
d th
at th
e re
spec
tive
fore
ign
coun
try g
rant
s a
sim
ilar e
xem
ptio
n to
resi
dent
s of
Afg
hani
stan
. (A
rt. 6
) Fo
reig
n ai
rline
s if r
ecip
roca
l ex
empt
ion
for A
fgha
n ai
rline
s in
the
resp
ectiv
e fo
reig
n ju
risdi
ctio
n.
(Art.
8 (3
))
Ded
uctio
ns: E
xpen
ses i
ncur
red
to
deriv
e gr
oss i
ncom
e ar
e de
duct
ible
w
hen
com
putin
g ta
xabl
e in
com
e.
(Arts
. 18
& 1
9)
The
Inco
me
Tax
Law
con
tain
s pr
ovis
ions
for d
epre
ciat
ion
of
Ta
xabl
e an
nual
in
com
e (in
Afs
)
Mar
gina
l Ta
x ra
tes
(per
cent
) A
fs1
and
abov
e 20
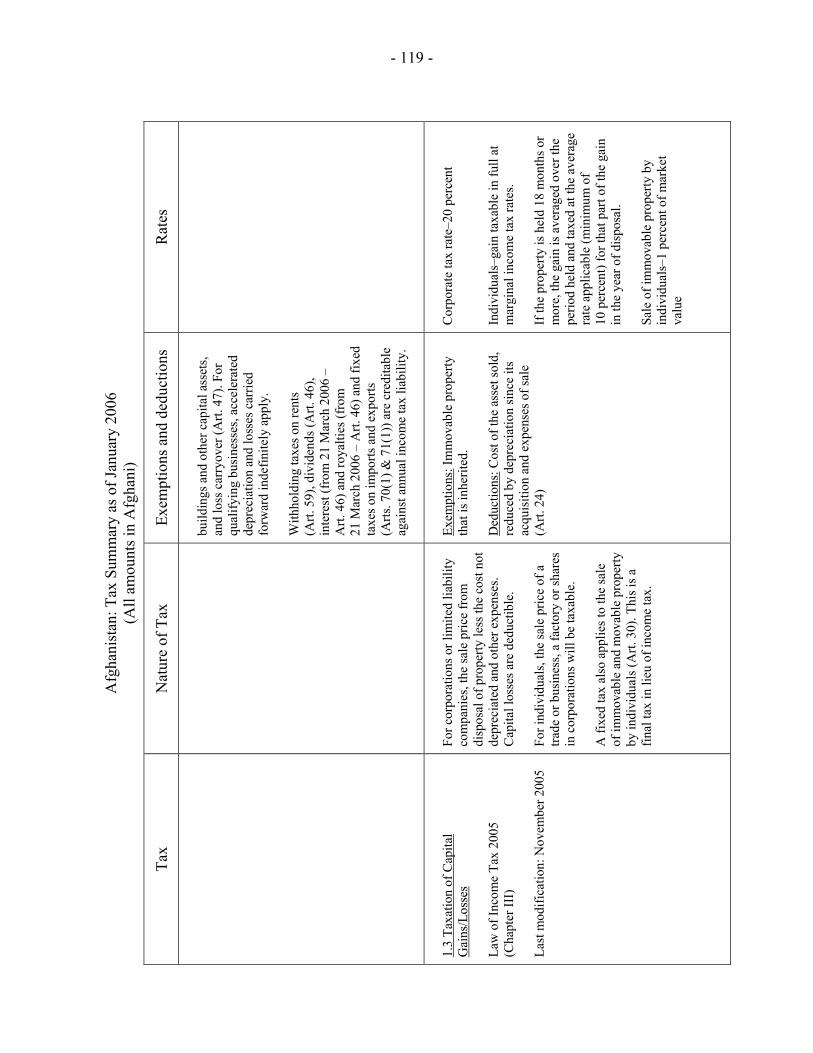
- 119 -
Afg
hani
stan
: Tax
Sum
mar
y as
of J
anua
ry 2
006
(All
amou
nts i
n A
fgha
ni)
Tax
Nat
ure
of T
ax
Exem
ptio
ns a
nd d
educ
tions
R
ates
bu
ildin
gs a
nd o
ther
cap
ital a
sset
s, an
d lo
ss c
arry
over
(Art.
47)
. For
qu
alify
ing
busi
ness
es, a
ccel
erat
ed
depr
ecia
tion
and
loss
es c
arrie
d fo
rwar
d in
defin
itely
app
ly.
With
hold
ing
taxe
s on
rent
s (A
rt. 5
9), d
ivid
ends
(Art.
46)
, in
tere
st (f
rom
21
Mar
ch 2
006
– A
rt. 4
6) a
nd ro
yalti
es (f
rom
21
Mar
ch 2
006
– A
rt. 4
6) a
nd fi
xed
taxe
s on
impo
rts a
nd e
xpor
ts
(Arts
. 70(
1) &
71(
1)) a
re c
redi
tabl
e ag
ains
t ann
ual i
ncom
e ta
x lia
bilit
y.
1.
3 Ta
xatio
n of
Cap
ital
Gai
ns/L
osse
s La
w o
f Inc
ome
Tax
2005
(C
hapt
er II
I)
Last
mod
ifica
tion:
Nov
embe
r 200
5
For c
orpo
ratio
ns o
r lim
ited
liabi
lity
com
pani
es, t
he sa
le p
rice
from
di
spos
al o
f pro
perty
less
the
cost
not
de
prec
iate
d an
d ot
her e
xpen
ses.
C
apita
l los
ses a
re d
educ
tible
. Fo
r ind
ivid
uals
, the
sale
pric
e of
a
trade
or b
usin
ess,
a fa
ctor
y or
shar
es
in c
orpo
ratio
ns w
ill b
e ta
xabl
e.
A fi
xed
tax
also
app
lies t
o th
e sa
le
of im
mov
able
and
mov
able
pro
perty
by
indi
vidu
als (
Art.
30)
. Thi
s is a
fin
al ta
x in
lieu
of i
ncom
e ta
x.
Exem
ptio
ns: I
mm
ovab
le p
rope
rty
that
is in
herit
ed.
D
educ
tions
: Cos
t of t
he a
sset
sold
, re
duce
d by
dep
reci
atio
n si
nce
its
acqu
isiti
on a
nd e
xpen
ses o
f sal
e (A
rt. 2
4)
Cor
pora
te ta
x ra
te–2
0 pe
rcen
t
Indi
vidu
als–
gain
taxa
ble
in fu
ll at
m
argi
nal i
ncom
e ta
x ra
tes.
If
the
prop
erty
is h
eld
18 m
onth
s or
mor
e, th
e ga
in is
ave
rage
d ov
er th
e pe
riod
held
and
taxe
d at
the
aver
age
rate
app
licab
le (m
inim
um o
f 10
per
cent
) for
that
par
t of t
he g
ain
in th
e ye
ar o
f dis
posa
l. Sa
le o
f im
mov
able
pro
perty
by
indi
vidu
als–
1 pe
rcen
t of m
arke
t va
lue
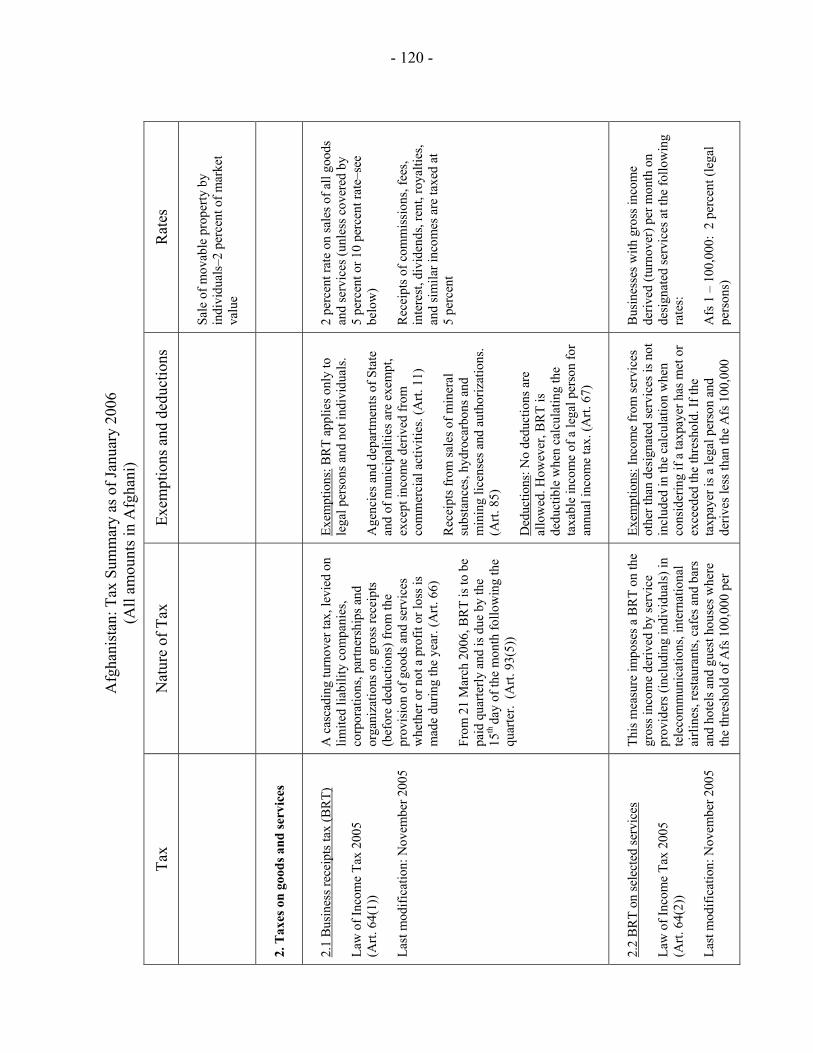
- 120 -
Afg
hani
stan
: Tax
Sum
mar
y as
of J
anua
ry 2
006
(All
amou
nts i
n A
fgha
ni)
Tax
Nat
ure
of T
ax
Exem
ptio
ns a
nd d
educ
tions
R
ates
Sa
le o
f mov
able
pro
perty
by
indi
vidu
als–
2 pe
rcen
t of m
arke
t va
lue
2.
Tax
es o
n go
ods a
nd se
rvic
es
2.1
Bus
ines
s rec
eipt
s tax
(BR
T)
Law
of I
ncom
e Ta
x 20
05
(Art.
64(
1))
Last
mod
ifica
tion:
Nov
embe
r 200
5
A c
asca
ding
turn
over
tax,
levi
ed o
n lim
ited
liabi
lity
com
pani
es,
corp
orat
ions
, par
tner
ship
s and
or
gani
zatio
ns o
n gr
oss r
ecei
pts
(bef
ore
dedu
ctio
ns) f
rom
the
prov
isio
n of
goo
ds a
nd se
rvic
es
whe
ther
or n
ot a
pro
fit o
r los
s is
mad
e du
ring
the
year
. (A
rt. 6
6)
From
21
Mar
ch 2
006,
BR
T is
to b
e pa
id q
uarte
rly a
nd is
due
by
the
15th
day
of th
e m
onth
follo
win
g th
e qu
arte
r. (A
rt. 9
3(5)
)
Exem
ptio
ns: B
RT
appl
ies o
nly
to
lega
l per
sons
and
not
indi
vidu
als.
Age
ncie
s and
dep
artm
ents
of S
tate
an
d of
mun
icip
aliti
es a
re e
xem
pt,
exce
pt in
com
e de
rived
from
co
mm
erci
al a
ctiv
ities
. (A
rt. 1
1)
Rec
eipt
s fro
m sa
les o
f min
eral
su
bsta
nces
, hyd
roca
rbon
s and
m
inin
g lic
ense
s and
aut
horiz
atio
ns.
(Art.
85)
D
educ
tions
: No
dedu
ctio
ns a
re
allo
wed
. How
ever
, BR
T is
de
duct
ible
whe
n ca
lcul
atin
g th
e ta
xabl
e in
com
e of
a le
gal p
erso
n fo
r an
nual
inco
me
tax.
(Art.
67)
2 pe
rcen
t rat
e on
sale
s of a
ll go
ods
and
serv
ices
(unl
ess c
over
ed b
y 5
perc
ent o
r 10
perc
ent r
ate–
see
belo
w)
Rec
eipt
s of c
omm
issi
ons,
fees
, in
tere
st, d
ivid
ends
, ren
t, ro
yalti
es,
and
sim
ilar i
ncom
es a
re ta
xed
at
5 pe
rcen
t
2.2
BR
T on
sele
cted
serv
ices
La
w o
f Inc
ome
Tax
2005
(A
rt. 6
4(2)
) La
st m
odifi
catio
n: N
ovem
ber 2
005
This
mea
sure
impo
ses a
BR
T on
the
gros
s inc
ome
deriv
ed b
y se
rvic
e pr
ovid
ers (
incl
udin
g in
divi
dual
s) in
te
leco
mm
unic
atio
ns, i
nter
natio
nal
airli
nes,
rest
aura
nts,
cafe
s and
bar
s an
d ho
tels
and
gue
st h
ouse
s whe
re
the
thre
shol
d of
Afs
100
,000
per
Exem
ptio
ns: I
ncom
e fr
om se
rvic
es
othe
r tha
n de
sign
ated
serv
ices
is n
ot
incl
uded
in th
e ca
lcul
atio
n w
hen
cons
ider
ing
if a
taxp
ayer
has
met
or
exce
eded
the
thre
shol
d. If
the
taxp
ayer
is a
lega
l per
son
and
deriv
es le
ss th
an th
e A
fs 1
00,0
00
Bus
ines
ses w
ith g
ross
inco
me
deriv
ed (t
urno
ver)
per
mon
th o
n de
sign
ated
serv
ices
at t
he fo
llow
ing
rate
s:
Afs
1 –
100
,000
: 2
perc
ent (
lega
l pe
rson
s)
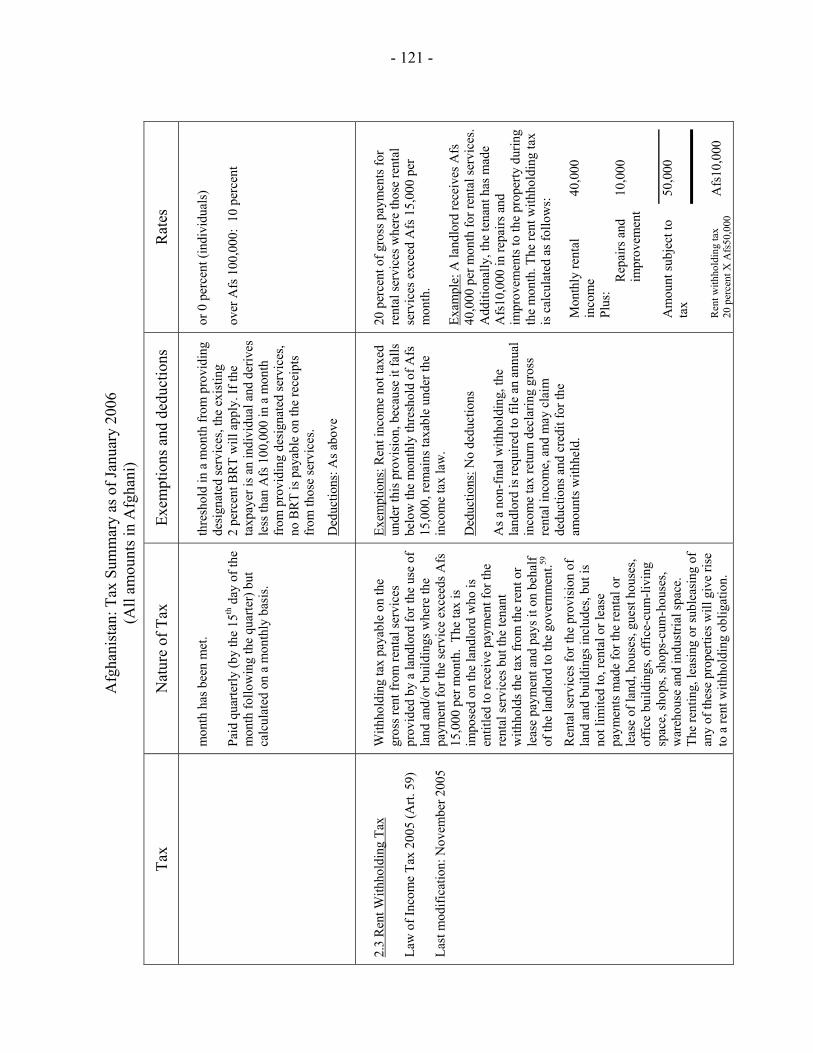
- 121 -
Afg
hani
stan
: Tax
Sum
mar
y as
of J
anua
ry 2
006
(All
amou
nts i
n A
fgha
ni)
Tax
Nat
ure
of T
ax
Exem
ptio
ns a
nd d
educ
tions
R
ates
m
onth
has
bee
n m
et.
Paid
qua
rterly
(by
the
15th
day
of t
he
mon
th fo
llow
ing
the
quar
ter)
but
ca
lcul
ated
on
a m
onth
ly b
asis
.
thre
shol
d in
a m
onth
from
pro
vidi
ng
desi
gnat
ed se
rvic
es, t
he e
xist
ing
2 pe
rcen
t BR
T w
ill a
pply
. If t
he
taxp
ayer
is a
n in
divi
dual
and
der
ives
le
ss th
an A
fs 1
00,0
00 in
a m
onth
fr
om p
rovi
ding
des
igna
ted
serv
ices
, no
BR
T is
pay
able
on
the
rece
ipts
fr
om th
ose
serv
ices
.
Ded
uctio
ns: A
s abo
ve
or 0
per
cent
(ind
ivid
uals
) ov
er A
fs 1
00,0
00:
10 p
erce
nt
2.3
Ren
t With
hold
ing
Tax
Law
of I
ncom
e Ta
x 20
05 (A
rt. 5
9)
Last
mod
ifica
tion:
Nov
embe
r 200
5
With
hold
ing
tax
paya
ble
on th
e gr
oss r
ent f
rom
rent
al se
rvic
es
prov
ided
by
a la
ndlo
rd fo
r the
use
of
land
and
/or b
uild
ings
whe
re th
e pa
ymen
t for
the
serv
ice
exce
eds A
fs
15,0
00 p
er m
onth
. Th
e ta
x is
im
pose
d on
the
land
lord
who
is
entit
led
to re
ceiv
e pa
ymen
t for
the
rent
al se
rvic
es b
ut th
e te
nant
w
ithho
lds t
he ta
x fr
om th
e re
nt o
r le
ase
paym
ent a
nd p
ays i
t on
beha
lf of
the
land
lord
to th
e go
vern
men
t.59
Ren
tal s
ervi
ces f
or th
e pr
ovis
ion
of
land
and
bui
ldin
gs in
clud
es, b
ut is
no
t lim
ited
to, r
enta
l or l
ease
pa
ymen
ts m
ade
for t
he re
ntal
or
leas
e of
land
, hou
ses,
gues
t hou
ses,
offic
e bu
ildin
gs, o
ffic
e-cu
m-li
ving
sp
ace,
shop
s, sh
ops-
cum
-hou
ses,
war
ehou
se a
nd in
dust
rial s
pace
. Th
e re
ntin
g, le
asin
g or
subl
easi
ng o
f an
y of
thes
e pr
oper
ties w
ill g
ive
rise
to a
rent
with
hold
ing
oblig
atio
n.
Exem
ptio
ns: R
ent i
ncom
e no
t tax
ed
unde
r thi
s pro
visi
on, b
ecau
se it
falls
be
low
the
mon
thly
thre
shol
d of
Afs
15
,000
, rem
ains
taxa
ble
unde
r the
in
com
e ta
x la
w.
Ded
uctio
ns: N
o de
duct
ions
A
s a n
on-f
inal
with
hold
ing,
the
land
lord
is re
quire
d to
file
an
annu
al
inco
me
tax
retu
rn d
ecla
ring
gros
s re
ntal
inco
me,
and
may
cla
im
dedu
ctio
ns a
nd c
redi
t for
the
amou
nts w
ithhe
ld.
20 p
erce
nt o
f gro
ss p
aym
ents
for
rent
al se
rvic
es w
here
thos
e re
ntal
se
rvic
es e
xcee
d A
fs 1
5,00
0 pe
r m
onth
.
Exam
ple:
A la
ndlo
rd re
ceiv
es A
fs
40,0
00 p
er m
onth
for r
enta
l ser
vice
s. A
dditi
onal
ly, t
he te
nant
has
mad
e A
fs10
,000
in re
pairs
and
im
prov
emen
ts to
the
prop
erty
dur
ing
the
mon
th. T
he re
nt w
ithho
ldin
g ta
x is
cal
cula
ted
as fo
llow
s:
Mon
thly
rent
al
inco
me
40,0
00
Plus
:
Rep
airs
and
im
prov
emen
t 10
,000
Am
ount
subj
ect t
o ta
x
50,0
00
Ren
t with
hold
ing
tax
20 p
erce
nt X
Afs
50,0
00
Afs
10,0
00
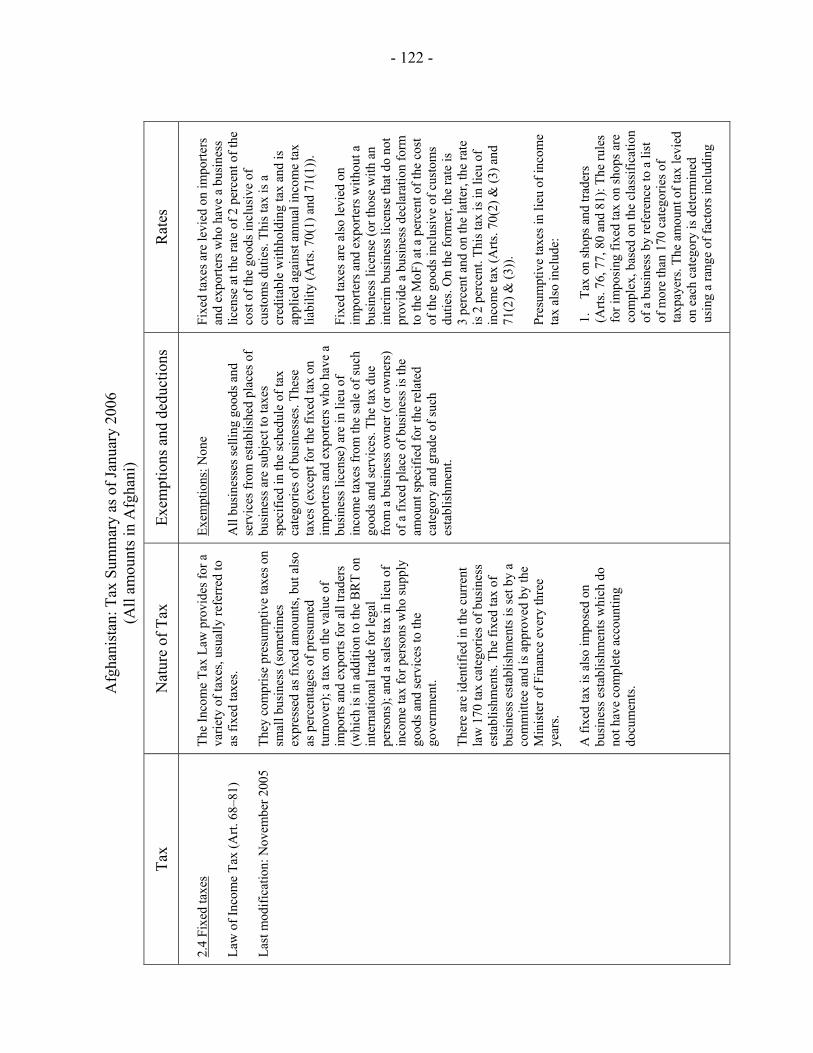
- 122 -
Afg
hani
stan
: Tax
Sum
mar
y as
of J
anua
ry 2
006
(All
amou
nts i
n A
fgha
ni)
Tax
Nat
ure
of T
ax
Exem
ptio
ns a
nd d
educ
tions
R
ates
2.
4 Fi
xed
taxe
s La
w o
f Inc
ome
Tax
(Art.
68–
81)
Last
mod
ifica
tion:
Nov
embe
r 200
5
The
Inco
me
Tax
Law
pro
vide
s for
a
varie
ty o
f tax
es, u
sual
ly re
ferr
ed to
as
fixe
d ta
xes.
Th
ey c
ompr
ise
pres
umpt
ive
taxe
s on
smal
l bus
ines
s (so
met
imes
ex
pres
sed
as fi
xed
amou
nts,
but a
lso
as p
erce
ntag
es o
f pre
sum
ed
turn
over
); a
tax
on th
e va
lue
of
impo
rts a
nd e
xpor
ts fo
r all
trade
rs
(whi
ch is
in a
dditi
on to
the
BR
T on
in
tern
atio
nal t
rade
for l
egal
pe
rson
s); a
nd a
sale
s tax
in li
eu o
f in
com
e ta
x fo
r per
sons
who
supp
ly
good
s and
serv
ices
to th
e go
vern
men
t. Th
ere
are
iden
tifie
d in
the
curr
ent
law
170
tax
cate
gorie
s of b
usin
ess
esta
blis
hmen
ts. T
he fi
xed
tax
of
busi
ness
est
ablis
hmen
ts is
set b
y a
com
mitt
ee a
nd is
app
rove
d by
the
Min
iste
r of F
inan
ce e
very
thre
e ye
ars.
A
fixe
d ta
x is
als
o im
pose
d on
bu
sine
ss e
stab
lishm
ents
whi
ch d
o no
t hav
e co
mpl
ete
acco
untin
g do
cum
ents
.
Exem
ptio
ns: N
one
All
busi
ness
es se
lling
goo
ds a
nd
serv
ices
from
est
ablis
hed
plac
es o
f bu
sine
ss a
re su
bjec
t to
taxe
s sp
ecifi
ed in
the
sche
dule
of t
ax
cate
gorie
s of b
usin
esse
s. Th
ese
taxe
s (ex
cept
for t
he fi
xed
tax
on
impo
rters
and
exp
orte
rs w
ho h
ave
a bu
sine
ss li
cens
e) a
re in
lieu
of
inco
me
taxe
s fro
m th
e sa
le o
f suc
h go
ods a
nd se
rvic
es. T
he ta
x du
e fr
om a
bus
ines
s ow
ner (
or o
wne
rs)
of a
fixe
d pl
ace
of b
usin
ess i
s the
am
ount
spec
ified
for t
he re
late
d ca
tego
ry a
nd g
rade
of s
uch
esta
blis
hmen
t.
Fixe
d ta
xes a
re le
vied
on
impo
rters
an
d ex
porte
rs w
ho h
ave
a bu
sine
ss
licen
se a
t the
rate
of 2
per
cent
of t
he
cost
of t
he g
oods
incl
usiv
e of
cu
stom
s dut
ies.
This
tax
is a
cr
edita
ble
with
hold
ing
tax
and
is
appl
ied
agai
nst a
nnua
l inc
ome
tax
liabi
lity
(Arts
. 70(
1) a
nd 7
1(1)
). Fi
xed
taxe
s are
als
o le
vied
on
impo
rters
and
exp
orte
rs w
ithou
t a
busin
ess l
icen
se (o
r tho
se w
ith a
n in
terim
bus
ines
s lic
ense
that
do
not
prov
ide
a bu
sine
ss d
ecla
ratio
n fo
rm
to th
e M
oF) a
t a p
erce
nt o
f the
cos
t of
the
good
s inc
lusi
ve o
f cus
tom
s du
ties.
On
the
form
er, t
he ra
te is
3
perc
ent a
nd o
n th
e la
tter,
the
rate
is
2 p
erce
nt. T
his t
ax is
in li
eu o
f in
com
e ta
x (A
rts. 7
0(2)
& (3
) and
71
(2) &
(3))
. Pr
esum
ptiv
e ta
xes i
n lie
u of
inco
me
tax
also
incl
ude:
1.
Ta
x on
shop
s and
trad
ers
(Arts
. 76,
77,
80
and
81):
The
rule
s fo
r im
posi
ng fi
xed
tax
on sh
ops a
re
com
plex
, bas
ed o
n th
e cl
assi
ficat
ion
of a
bus
ines
s by
refe
renc
e to
a li
st
of m
ore
than
170
cat
egor
ies o
f ta
xpay
ers.
The
amou
nt o
f tax
levi
ed
on e
ach
cate
gory
is d
eter
min
ed
usin
g a
rang
e of
fact
ors i
nclu
ding
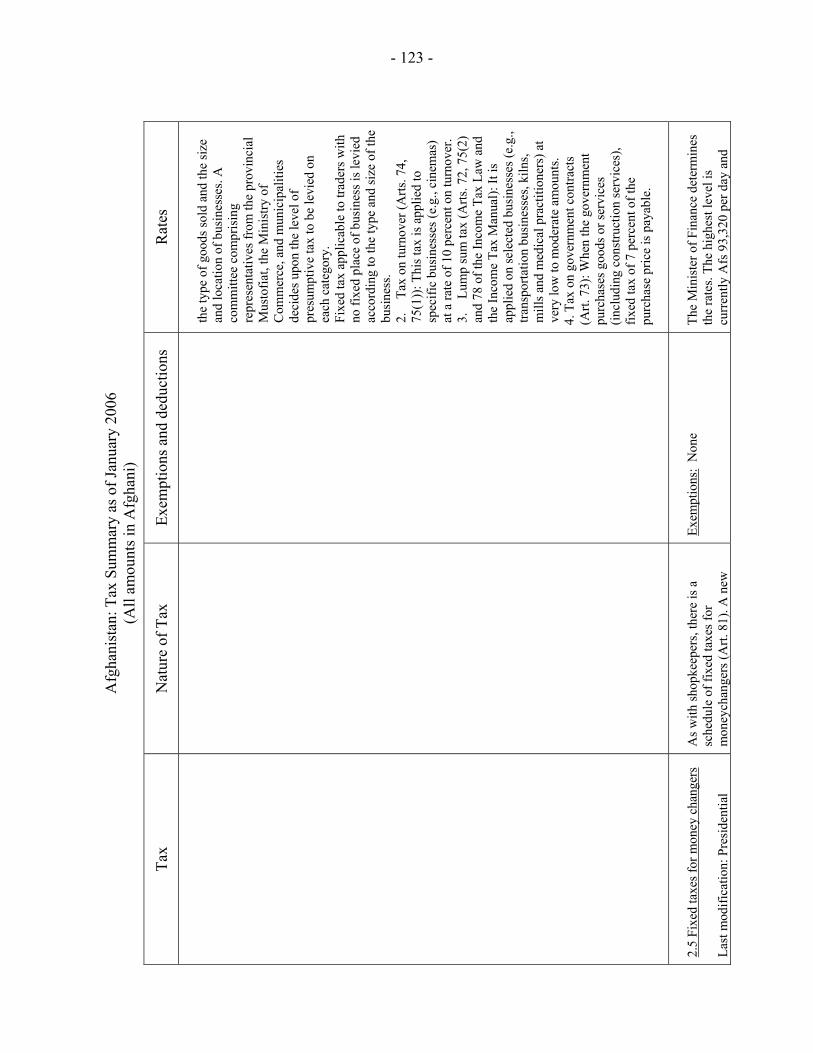
- 123 -
Afg
hani
stan
: Tax
Sum
mar
y as
of J
anua
ry 2
006
(All
amou
nts i
n A
fgha
ni)
Tax
Nat
ure
of T
ax
Exem
ptio
ns a
nd d
educ
tions
R
ates
th
e ty
pe o
f goo
ds so
ld a
nd th
e si
ze
and
loca
tion
of b
usin
esse
s. A
co
mm
ittee
com
pris
ing
repr
esen
tativ
es fr
om th
e pr
ovin
cial
M
usto
fiat,
the
Min
istry
of
Com
mer
ce, a
nd m
unic
ipal
ities
de
cide
s upo
n th
e le
vel o
f pr
esum
ptiv
e ta
x to
be
levi
ed o
n ea
ch c
ateg
ory.
Fi
xed
tax
appl
icab
le to
trad
ers w
ith
no fi
xed
plac
e of
bus
ines
s is l
evie
d ac
cord
ing
to th
e ty
pe a
nd si
ze o
f the
bu
sine
ss.
2.
Tax
on tu
rnov
er (A
rts. 7
4,
75(1
)): T
his t
ax is
app
lied
to
spec
ific
busi
ness
es (e
.g.,
cine
mas
) at
a ra
te o
f 10
perc
ent o
n tu
rnov
er.
3.
Lum
p su
m ta
x (A
rts. 7
2, 7
5(2)
an
d 78
of t
he In
com
e Ta
x La
w a
nd
the
Inco
me
Tax
Man
ual):
It is
ap
plie
d on
sele
cted
bus
ines
ses (
e.g.
, tra
nspo
rtatio
n bu
sines
ses,
kiln
s, m
ills a
nd m
edic
al p
ract
ition
ers)
at
very
low
to m
oder
ate
amou
nts.
4. T
ax o
n go
vern
men
t con
tract
s (A
rt. 7
3): W
hen
the
gove
rnm
ent
purc
hase
s goo
ds o
r ser
vice
s (in
clud
ing
cons
truct
ion
serv
ices
), fix
ed ta
x of
7 p
erce
nt o
f the
pu
rcha
se p
rice
is p
ayab
le.
2.
5 Fi
xed
taxe
s for
mon
ey c
hang
ers
Last
mod
ifica
tion:
Pre
side
ntia
l
As w
ith sh
opke
eper
s, th
ere
is a
sc
hedu
le o
f fix
ed ta
xes f
or
mon
eych
ange
rs (A
rt. 8
1). A
new
Exem
ptio
ns:
Non
e
The
Min
iste
r of F
inan
ce d
eter
min
es
the
rate
s. Th
e hi
ghes
t lev
el is
cu
rren
tly A
fs 9
3,32
0 pe
r day
and
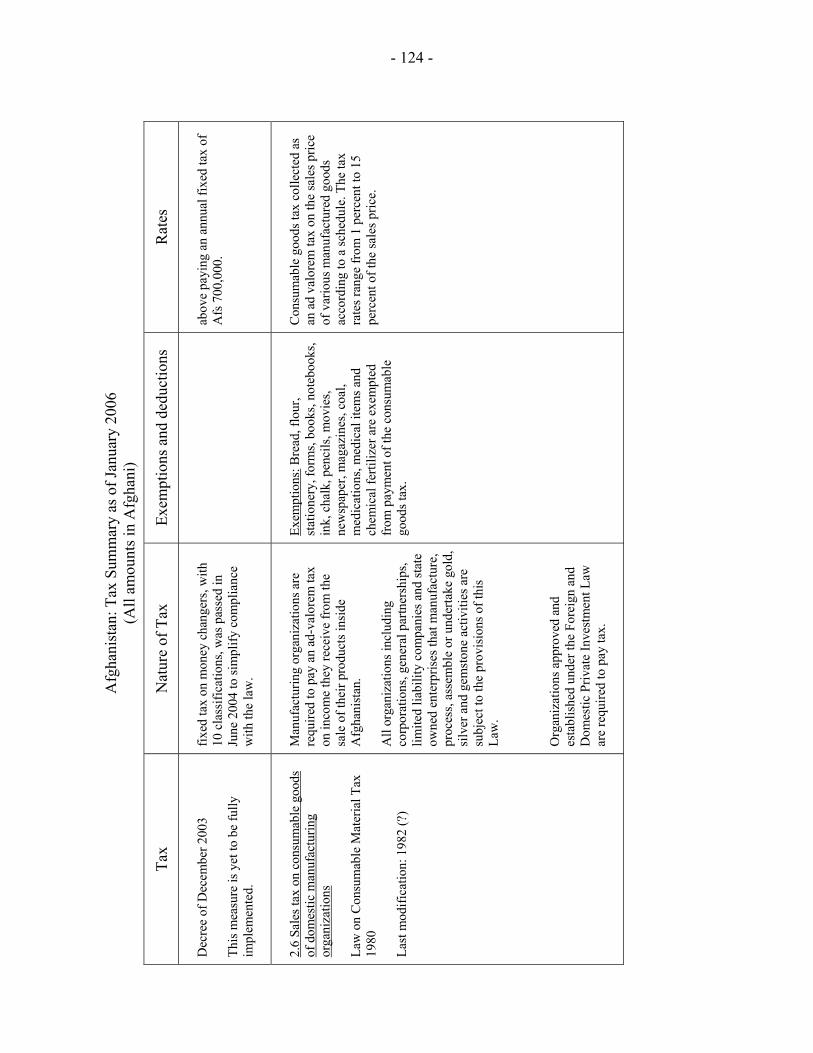
- 124 -
Afg
hani
stan
: Tax
Sum
mar
y as
of J
anua
ry 2
006
(All
amou
nts i
n A
fgha
ni)
Tax
Nat
ure
of T
ax
Exem
ptio
ns a
nd d
educ
tions
R
ates
D
ecre
e of
Dec
embe
r 200
3 Th
is m
easu
re is
yet
to b
e fu
lly
impl
emen
ted.
fixed
tax
on m
oney
cha
nger
s, w
ith
10 c
lass
ifica
tions
, was
pas
sed
in
June
200
4 to
sim
plify
com
plia
nce
with
the
law
.
abov
e pa
ying
an
annu
al fi
xed
tax
of
Afs
700
,000
.
2.6
Sale
s tax
on
cons
umab
le g
oods
of
dom
estic
man
ufac
turin
g or
gani
zatio
ns
Law
on
Con
sum
able
Mat
eria
l Tax
19
80
Last
mod
ifica
tion:
198
2 (?
)
Man
ufac
turin
g or
gani
zatio
ns a
re
requ
ired
to p
ay a
n ad
-val
orem
tax
on in
com
e th
ey re
ceiv
e fr
om th
e sa
le o
f the
ir pr
oduc
ts in
side
A
fgha
nist
an.
All
orga
niza
tions
incl
udin
g co
rpor
atio
ns, g
ener
al p
artn
ersh
ips,
limite
d lia
bilit
y co
mpa
nies
and
stat
e ow
ned
ente
rpris
es th
at m
anuf
actu
re,
proc
ess,
asse
mbl
e or
und
erta
ke g
old,
si
lver
and
gem
ston
e ac
tiviti
es a
re
subj
ect t
o th
e pr
ovis
ions
of t
his
Law
. O
rgan
izat
ions
app
rove
d an
d es
tabl
ishe
d un
der t
he F
orei
gn a
nd
Dom
estic
Priv
ate
Inve
stm
ent L
aw
are
requ
ired
to p
ay ta
x.
Exem
ptio
ns: B
read
, flo
ur,
stat
ione
ry, f
orm
s, bo
oks,
note
book
s, in
k, c
halk
, pen
cils
, mov
ies,
new
spap
er, m
agaz
ines
, coa
l, m
edic
atio
ns, m
edic
al it
ems a
nd
chem
ical
ferti
lizer
are
exe
mpt
ed
from
pay
men
t of t
he c
onsu
mab
le
good
s tax
.
Con
sum
able
goo
ds ta
x co
llect
ed a
s an
ad
valo
rem
tax
on th
e sa
les p
rice
of v
ario
us m
anuf
actu
red
good
s ac
cord
ing
to a
sche
dule
. The
tax
rate
s ran
ge fr
om 1
per
cent
to 1
5 pe
rcen
t of t
he sa
les p
rice.
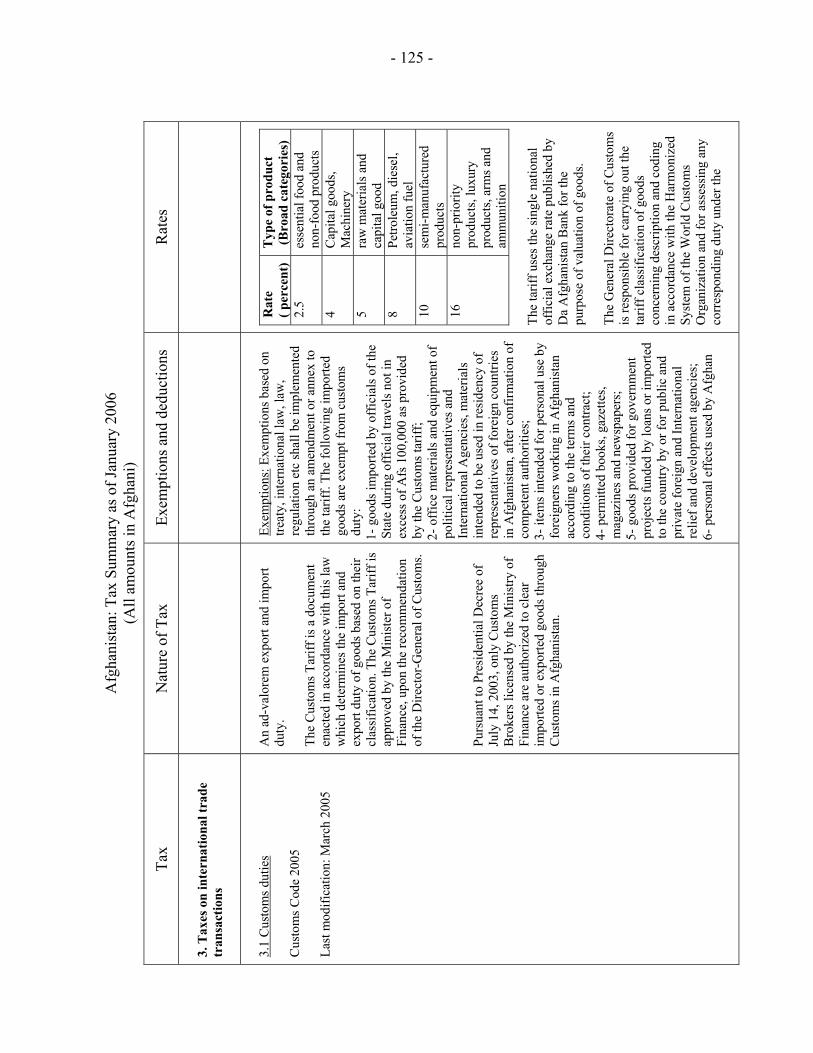
- 125 -
Afg
hani
stan
: Tax
Sum
mar
y as
of J
anua
ry 2
006
(All
amou
nts i
n A
fgha
ni)
Tax
Nat
ure
of T
ax
Exem
ptio
ns a
nd d
educ
tions
R
ates
3.
Tax
es o
n in
tern
atio
nal t
rade
tr
ansa
ctio
ns
3.1
Cus
tom
s dut
ies
Cus
tom
s Cod
e 20
05
Last
mod
ifica
tion:
Mar
ch 2
005
An
ad-v
alor
em e
xpor
t and
impo
rt du
ty.
The
Cus
tom
s Tar
iff is
a d
ocum
ent
enac
ted
in a
ccor
danc
e w
ith th
is la
w
whi
ch d
eter
min
es th
e im
port
and
expo
rt du
ty o
f goo
ds b
ased
on
thei
r cl
assi
ficat
ion.
The
Cus
tom
s Tar
iff is
ap
prov
ed b
y th
e M
inis
ter o
f Fi
nanc
e, u
pon
the
reco
mm
enda
tion
of th
e D
irect
or-G
ener
al o
f Cus
tom
s. Pu
rsua
nt to
Pre
side
ntia
l Dec
ree
of
July
14,
200
3, o
nly
Cus
tom
s B
roke
rs li
cens
ed b
y th
e M
inis
try o
f Fi
nanc
e ar
e au
thor
ized
to c
lear
im
porte
d or
exp
orte
d go
ods t
hrou
gh
Cus
tom
s in
Afg
hani
stan
.
Exem
ptio
ns: E
xem
ptio
ns b
ased
on
treat
y, in
tern
atio
nal l
aw, l
aw,
regu
latio
n et
c sh
all b
e im
plem
ente
d th
roug
h an
am
endm
ent o
r ann
ex to
th
e ta
riff.
The
follo
win
g im
porte
d go
ods a
re e
xem
pt fr
om c
usto
ms
duty
: 1-
goo
ds im
porte
d by
off
icia
ls o
f the
St
ate
durin
g of
ficia
l tra
vels
not
in
exce
ss o
f Afs
100
,000
as p
rovi
ded
by th
e C
usto
ms t
ariff
; 2-
off
ice
mat
eria
ls a
nd e
quip
men
t of
polit
ical
repr
esen
tativ
es a
nd
Inte
rnat
iona
l Age
ncie
s, m
ater
ials
in
tend
ed to
be
used
in re
side
ncy
of
repr
esen
tativ
es o
f for
eign
cou
ntrie
s in
Afg
hani
stan
, afte
r con
firm
atio
n of
co
mpe
tent
aut
horit
ies;
3- it
ems i
nten
ded
for p
erso
nal u
se b
y fo
reig
ners
wor
king
in A
fgha
nist
an
acco
rdin
g to
the
term
s and
co
nditi
ons o
f the
ir co
ntra
ct;
4- p
erm
itted
boo
ks, g
azet
tes,
mag
azin
es a
nd n
ewsp
aper
s;
5- g
oods
pro
vide
d fo
r gov
ernm
ent
proj
ects
fund
ed b
y lo
ans o
r im
porte
d to
the
coun
try b
y or
for p
ublic
and
pr
ivat
e fo
reig
n an
d In
tern
atio
nal
relie
f and
dev
elop
men
t age
ncie
s;
6- p
erso
nal e
ffec
ts us
ed b
y A
fgha
n
Rat
e ( p
erce
nt)
Typ
e of
pro
duct
(B
road
cat
egor
ies)
2.
5 es
sent
ial f
ood
and
non-
food
pro
duct
s 4
Cap
ital g
oods
, M
achi
nery
5
raw
mat
eria
ls a
nd
capi
tal g
ood
8 Pe
trole
um, d
iese
l, av
iatio
n fu
el
10
sem
i-man
ufac
ture
d pr
oduc
ts
16
non-
prio
rity
prod
ucts
, lux
ury
prod
ucts
, arm
s and
am
mun
ition
Th
e ta
riff u
ses t
he si
ngle
nat
iona
l of
ficia
l exc
hang
e ra
te p
ublis
hed
by
Da
Afg
hani
stan
Ban
k fo
r the
pu
rpos
e of
val
uatio
n of
goo
ds.
The
Gen
eral
Dire
ctor
ate
of C
usto
ms
is re
spon
sibl
e fo
r car
ryin
g ou
t the
ta
riff c
lass
ifica
tion
of g
oods
co
ncer
ning
des
crip
tion
and
codi
ng
in a
ccor
danc
e w
ith th
e H
arm
oniz
ed
Syst
em o
f the
Wor
ld C
usto
ms
Org
aniz
atio
n an
d fo
r ass
essi
ng a
ny
corr
espo
ndin
g du
ty u
nder
the
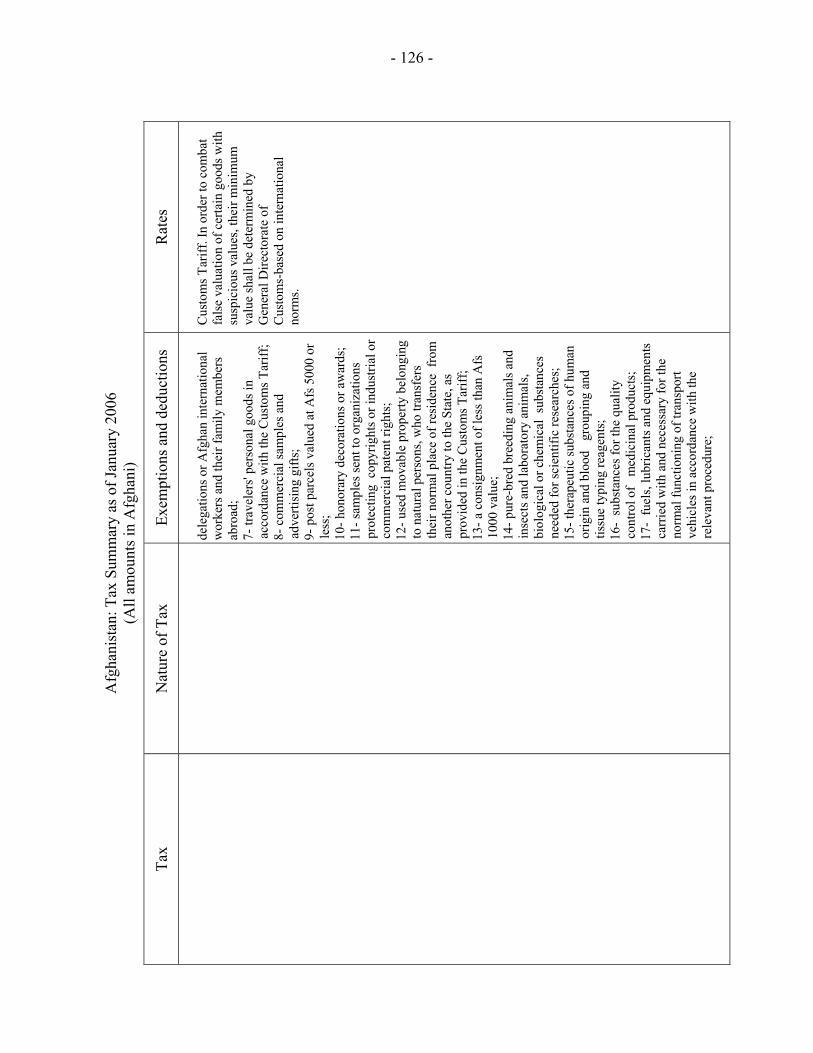
- 126 -
Afg
hani
stan
: Tax
Sum
mar
y as
of J
anua
ry 2
006
(All
amou
nts i
n A
fgha
ni)
Tax
Nat
ure
of T
ax
Exem
ptio
ns a
nd d
educ
tions
R
ates
de
lega
tions
or A
fgha
n in
tern
atio
nal
wor
kers
and
thei
r fam
ily m
embe
rs
abro
ad;
7- tr
avel
ers'
pers
onal
goo
ds in
ac
cord
ance
with
the
Cus
tom
s Tar
iff;
8-
com
mer
cial
sam
ples
and
ad
verti
sing
gift
s;
9- p
ost p
arce
ls v
alue
d at
Afs
500
0 or
le
ss;
10- h
onor
ary
deco
ratio
ns o
r aw
ards
; 11
- sam
ples
sent
to o
rgan
izat
ions
pr
otec
ting
cop
yrig
hts o
r ind
ustri
al o
r co
mm
erci
al p
aten
t rig
hts;
12
- use
d m
ovab
le p
rope
rty b
elon
ging
to
nat
ural
per
sons
, who
tran
sfer
s th
eir n
orm
al p
lace
of r
esid
ence
fro
m
anot
her c
ount
ry to
the
Stat
e, a
s pr
ovid
ed in
the
Cus
tom
s Tar
iff;
13- a
con
sign
men
t of l
ess t
han
Afs
10
00 v
alue
; 14
- pur
e-br
ed b
reed
ing
anim
als a
nd
inse
cts a
nd la
bora
tory
ani
mal
s, bi
olog
ical
or c
hem
ical
sub
stan
ces
need
ed fo
r sci
entif
ic re
sear
ches
; 15
- the
rape
utic
subs
tanc
es o
f hum
an
orig
in a
nd b
lood
gr
oupi
ng a
nd
tissu
e ty
ping
reag
ents
; 16
- su
bsta
nces
for t
he q
ualit
y co
ntro
l of
med
icin
al p
rodu
cts;
17
- fu
els,
lubr
ican
ts a
nd e
quip
men
ts
carr
ied
with
and
nec
essa
ry fo
r the
no
rmal
func
tioni
ng o
f tra
nspo
rt ve
hicl
es in
acc
orda
nce
with
the
rele
vant
pro
cedu
re;
Cus
tom
s Tar
iff. I
n or
der t
o co
mba
t fa
lse
valu
atio
n of
cer
tain
goo
ds w
ith
susp
icio
us v
alue
s, th
eir m
inim
um
valu
e sh
all b
e de
term
ined
by
Gen
eral
Dire
ctor
ate
of
Cus
tom
s-ba
sed
on in
tern
atio
nal
norm
s.
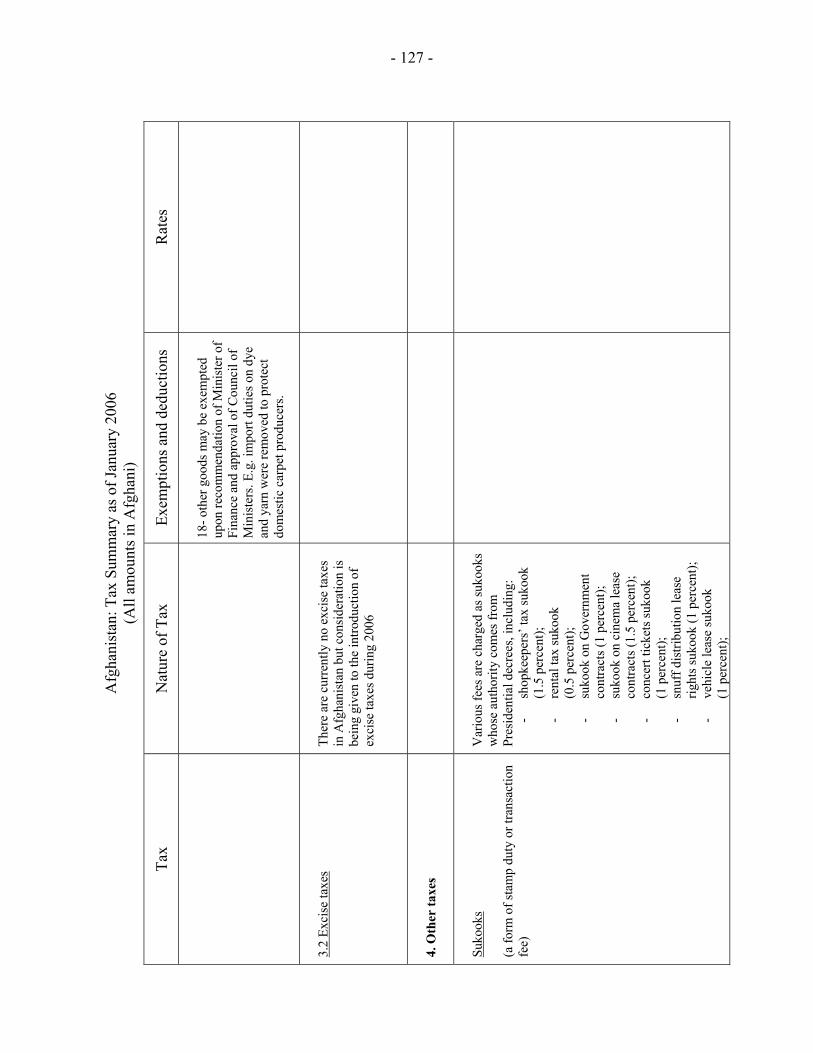
- 127 -
Afg
hani
stan
: Tax
Sum
mar
y as
of J
anua
ry 2
006
(All
amou
nts i
n A
fgha
ni)
Tax
Nat
ure
of T
ax
Exem
ptio
ns a
nd d
educ
tions
R
ates
18
- oth
er g
oods
may
be
exem
pted
up
on re
com
men
datio
n of
Min
iste
r of
Fina
nce
and
appr
oval
of C
ounc
il of
M
inis
ters
. E.g
. im
port
dutie
s on
dye
and
yarn
wer
e re
mov
ed to
pro
tect
do
mes
tic c
arpe
t pro
duce
rs.
3.2
Exci
se ta
xes
Ther
e ar
e cu
rren
tly n
o ex
cise
taxe
s in
Afg
hani
stan
but
con
side
ratio
n is
be
ing
give
n to
the
intro
duct
ion
of
exci
se ta
xes d
urin
g 20
06
4. O
ther
taxe
s
Suko
oks
(a fo
rm o
f sta
mp
duty
or t
rans
actio
n fe
e)
Var
ious
fees
are
cha
rged
as s
ukoo
ks
who
se a
utho
rity
com
es fr
om
Pres
iden
tial d
ecre
es, i
nclu
ding
: -
shop
keep
ers’
tax
suko
ok
(1.5
per
cent
); -
rent
al ta
x su
kook
(0
.5 p
erce
nt);
- su
kook
on
Gov
ernm
ent
cont
ract
s (1
perc
ent);
-
suko
ok o
n ci
nem
a le
ase
cont
ract
s (1.
5 pe
rcen
t);
- co
ncer
t tic
kets
suko
ok
(1 p
erce
nt);
- sn
uff d
istri
butio
n le
ase
right
s suk
ook
(1 p
erce
nt);
- ve
hicl
e le
ase
suko
ok
(1 p
erce
nt);
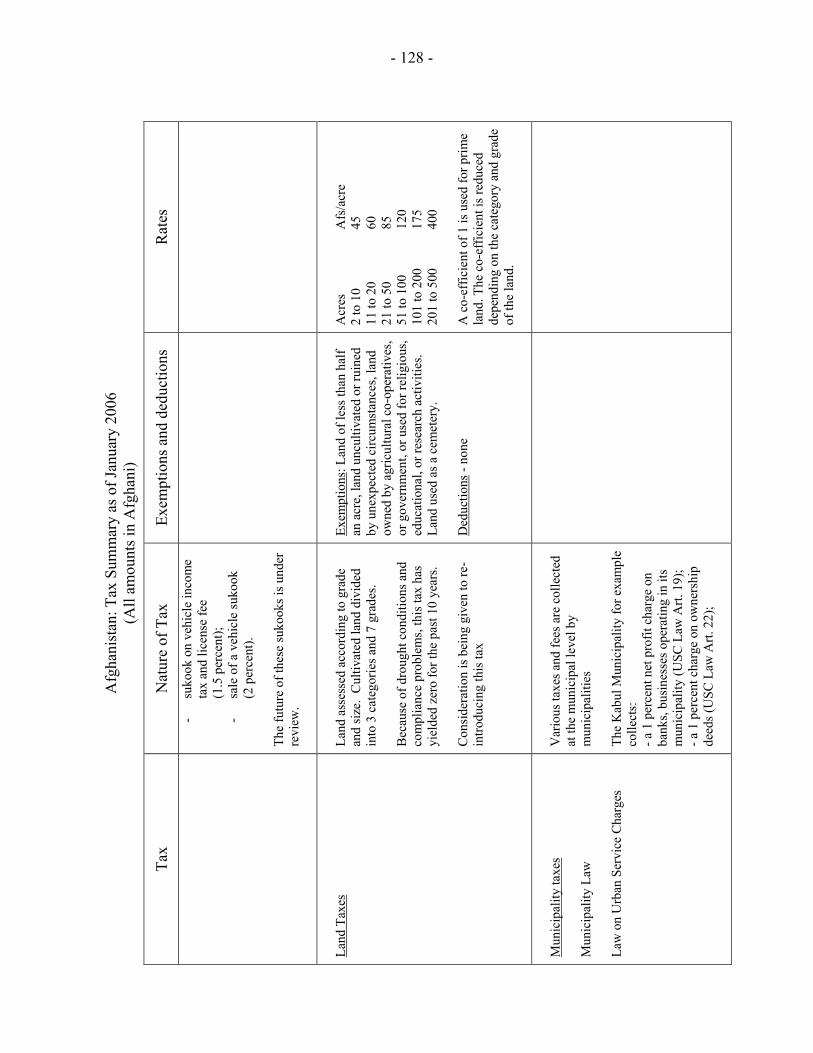
- 128 -
Afg
hani
stan
: Tax
Sum
mar
y as
of J
anua
ry 2
006
(All
amou
nts i
n A
fgha
ni)
Tax
Nat
ure
of T
ax
Exem
ptio
ns a
nd d
educ
tions
R
ates
-
suko
ok o
n ve
hicl
e in
com
e ta
x an
d lic
ense
fee
(1.5
per
cent
); -
sale
of a
veh
icle
suko
ok
(2 p
erce
nt).
The
futu
re o
f the
se su
kook
s is u
nder
re
view
.
Land
Tax
es
Land
ass
esse
d ac
cord
ing
to g
rade
an
d si
ze.
Cul
tivat
ed la
nd d
ivid
ed
into
3 c
ateg
orie
s and
7 g
rade
s. B
ecau
se o
f dro
ught
con
ditio
ns a
nd
com
plia
nce
prob
lem
s, th
is ta
x ha
s yi
elde
d ze
ro fo
r the
pas
t 10
year
s.
Con
side
ratio
n is
bei
ng g
iven
to re
-in
trodu
cing
this
tax
Exem
ptio
ns: L
and
of le
ss th
an h
alf
an a
cre,
land
unc
ultiv
ated
or r
uine
d by
une
xpec
ted
circ
umst
ance
s, la
nd
owne
d by
agr
icul
tura
l co-
oper
ativ
es,
or g
over
nmen
t, or
use
d fo
r rel
igio
us,
educ
atio
nal,
or re
sear
ch a
ctiv
ities
. La
nd u
sed
as a
cem
eter
y.
Ded
uctio
ns -
none
Acr
es
A
fs/a
cre
2 to
10
45
11
to 2
0
60
21 to
50
85
51
to 1
00
120
101
to 2
00
175
201
to 5
00
400
A c
o-ef
ficie
nt o
f 1 is
use
d fo
r prim
e la
nd. T
he c
o-ef
ficie
nt is
redu
ced
depe
ndin
g on
the
cate
gory
and
gra
de
of th
e la
nd.
M
unic
ipal
ity ta
xes
Mun
icip
ality
Law
La
w o
n U
rban
Ser
vice
Cha
rges
Var
ious
taxe
s and
fees
are
col
lect
ed
at th
e m
unic
ipal
leve
l by
mun
icip
aliti
es
The
Kab
ul M
unic
ipal
ity fo
r exa
mpl
e co
llect
s:
- a 1
per
cent
net
pro
fit c
harg
e on
ba
nks,
busi
ness
es o
pera
ting
in it
s m
unic
ipal
ity (U
SC L
aw A
rt. 1
9);
- a 1
per
cent
cha
rge
on o
wne
rshi
p de
eds (
USC
Law
Art.
22)
;
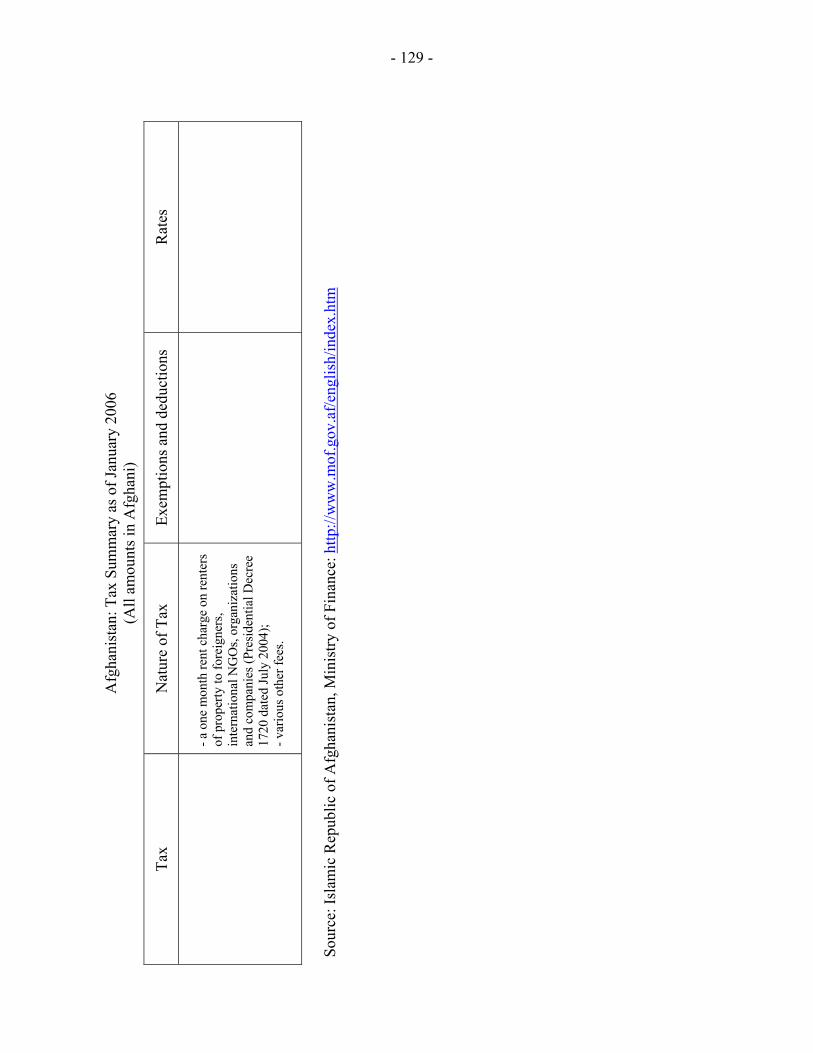
- 129 -
Afg
hani
stan
: Tax
Sum
mar
y as
of J
anua
ry 2
006
(All
amou
nts i
n A
fgha
ni)
Tax
Nat
ure
of T
ax
Exem
ptio
ns a
nd d
educ
tions
R
ates
- a
one
mon
th re
nt c
harg
e on
rent
ers
of p
rope
rty to
fore
igne
rs,
inte
rnat
iona
l NG
Os,
orga
niza
tions
an
d co
mpa
nies
(Pre
side
ntia
l Dec
ree
1720
dat
ed Ju
ly 2
004)
; - v
ario
us o
ther
fees
.
Sour
ce: I
slam
ic R
epub
lic o
f Afg
hani
stan
, Min
istry
of F
inan
ce: h
ttp://
ww
w.m
of.g
ov.a
f/eng
lish/
inde
x.ht
m
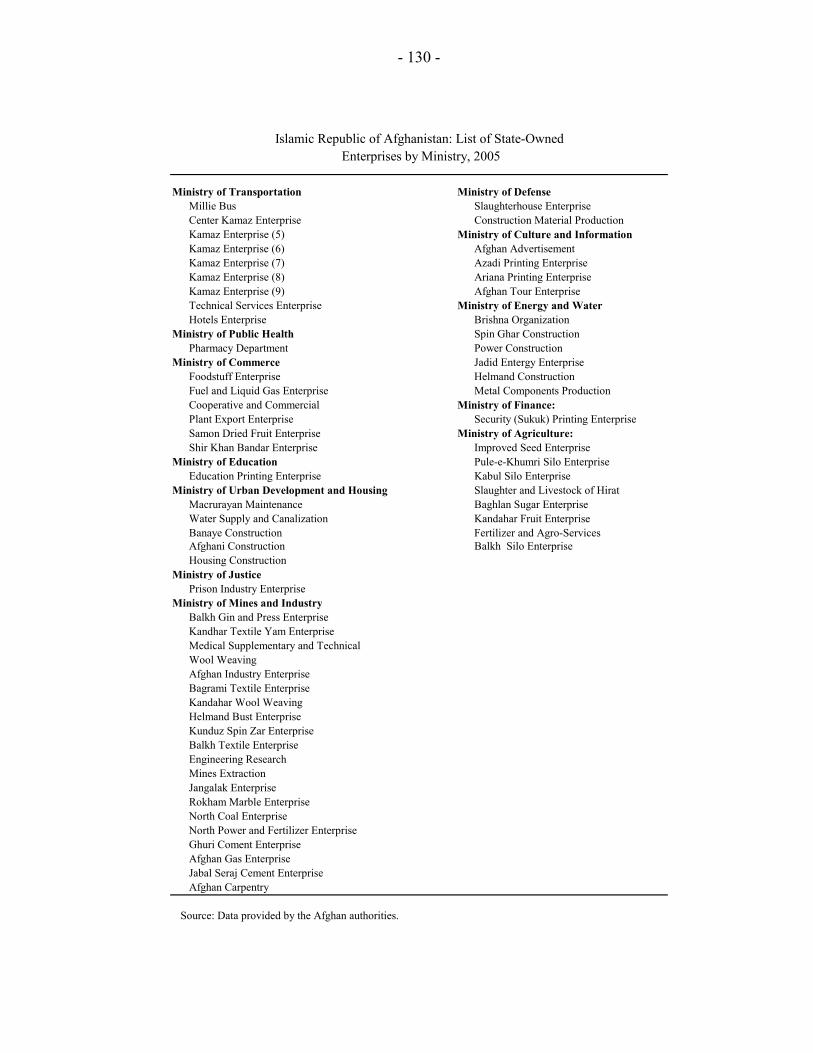
- 130 -
Islamic Republic of Afghanistan: List of State-Owned Enterprises by Ministry, 2005
Ministry of Transportation Ministry of DefenseMillie Bus Slaughterhouse EnterpriseCenter Kamaz Enterprise Construction Material ProductionKamaz Enterprise (5) Ministry of Culture and InformationKamaz Enterprise (6) Afghan AdvertisementKamaz Enterprise (7) Azadi Printing EnterpriseKamaz Enterprise (8) Ariana Printing EnterpriseKamaz Enterprise (9) Afghan Tour EnterpriseTechnical Services Enterprise Ministry of Energy and WaterHotels Enterprise Brishna Organization
Ministry of Public Health Spin Ghar ConstructionPharmacy Department Power Construction
Ministry of Commerce Jadid Entergy EnterpriseFoodstuff Enterprise Helmand ConstructionFuel and Liquid Gas Enterprise Metal Components ProductionCooperative and Commercial Ministry of Finance:Plant Export Enterprise Security (Sukuk) Printing EnterpriseSamon Dried Fruit Enterprise Ministry of Agriculture:Shir Khan Bandar Enterprise Improved Seed Enterprise
Ministry of Education Pule-e-Khumri Silo EnterpriseEducation Printing Enterprise Kabul Silo Enterprise
Ministry of Urban Development and Housing Slaughter and Livestock of HiratMacrurayan Maintenance Baghlan Sugar EnterpriseWater Supply and Canalization Kandahar Fruit EnterpriseBanaye Construction Fertilizer and Agro-ServicesAfghani Construction Balkh Silo EnterpriseHousing Construction
Ministry of JusticePrison Industry Enterprise
Ministry of Mines and IndustryBalkh Gin and Press EnterpriseKandhar Textile Yam EnterpriseMedical Supplementary and TechnicalWool WeavingAfghan Industry EnterpriseBagrami Textile EnterpriseKandahar Wool WeavingHelmand Bust EnterpriseKunduz Spin Zar EnterpriseBalkh Textile EnterpriseEngineering ResearchMines ExtractionJangalak EnterpriseRokham Marble EnterpriseNorth Coal EnterpriseNorth Power and Fertilizer EnterpriseGhuri Coment EnterpriseAfghan Gas EnterpriseJabal Seraj Cement EnterpriseAfghan Carpentry
Source: Data provided by the Afghan authorities.