ISLAM, THE UNITED STATES AND MULTIPLE IDENTITIES
98
ISLAM, THE UNITED STATES AND MULTIPLE IDENTITIES: AN ANALYSIS OF DETERMINANTS OF MUSLIM PUBLIC OPINION OF THE UNITED STATES AND ITS IMPLICATIONS FOR U.S. PUBLIC DIPLOMACY A Thesis submitted to the Faculty of the Graduate School of Arts and Sciences of Georgetown University in partial fulfillment of the requirements for the degree of Master of Public Policy By Jessica Arin Brown, M.B.A Washington, DC April 15 th , 2010
Transcript of ISLAM, THE UNITED STATES AND MULTIPLE IDENTITIES
ISLAM, THE UNITED STATES AND MULTIPLE IDENTITIES:
AN ANALYSIS OF DETERMINANTS OF MUSLIM PUBLIC OPINION OF THE UNITED STATES AND ITS
IMPLICATIONS FOR U.S. PUBLIC DIPLOMACY
A Thesis
submitted to the Faculty of the
Graduate School of Arts and Sciences
of Georgetown University
in partial fulfillment of the requirements for the
degree of
Master of Public Policy
By
Jessica Arin Brown, M.B.A
Washington, DC
April 15th, 2010

ii
ISLAM, THE UNITED STATES AND MULTIPLE IDENTITIES:
AN ANALYSIS OF DETERMINANTS OF MUSLIM PUBLIC OPINION OF THE UNITED STATES AND ITS
IMPLICATIONS FOR U.S. PUBLIC DIPLOMACY
Jessica Arin Brown, M.B.A.
Thesis Advisor : Robert Bednarzik, Ph.D.
ABSTRACT
After September 11th, 2001, much of the international relations discourse has focused on
analyses of Muslim communities. Researchers have hoped to answer Fareed Zakaria’s question “why do
they hate us?” Samuel Huntington explains this phenomenon through a “clash of civilizations” between
the West and the East. But is this focus on religion appropriate? Or are there other, more nuanced
explanations for why communities abroad might think ill of the United States? The answer to this
question has serious implications for United States public diplomacy, which aims to understand, inform,
influence and engage citizens abroad to help further U.S. foreign policy goals. Using public opinion data
from the 2007 Pew Global Attitudes survey the following analysis measures relationships between
religion, culture and foreign opinions of the United States. To challenge the notion that religion has
primary explanatory power over perceptions of the United States, this study will utilize three different
theories of organizing the world’s culture—namely Samuel Huntington’s, Geert Hofstede’s and Inglehart
Welzel’s—to identify other factors which help to predict foreign perceptions of the United States.
Initial findings support the notion that Muslims as a group tend to have less favorable opinions of the
United States. However, those factors which demonstrate positive and negative views towards the
United States are consistent whether the full sample or a sub-sample of Muslim respondents, indicating
religion alone cannot explain favorable opinions towards the United States. This study suggests that
public diplomacy programming should not have a singular focus on shifting positive or negative views of
the United States, but should help to promote core American values of media openness, free and fair
government, strong education, active business and entertainment communities and democracy.

iii
Policies should aim to create educated, informed citizens both at home and abroad who can engage
respectfully in debates which capitalize on the “multiple identities” approach theorized by Amartya Sen.

iv
ACKNOWLEDGEMENTS
The research and writing of this thesis would not have been possible without the moral support and
guidance of numerous friends and colleagues. I am forever indebted to Professor Bruce Gregory for his kindness and support in reading early drafts of this paper. Special thanks to Dr. Chris Toppe, my adopted
thesis advisor, who was always willing to lend a hand. To all of my colleagues in the Bureau of Public Diplomacy and Public Affairs: thank you for your patience and interest in this endeavor. Through
countless off-hand conversations you have contributed to the development of this thesis in your own way. To Aimee Fullman--thank you for your guidance and humor, from conception to birth. And finally,
to Bobby B: we made it through alive. Thank you for your enduring patience.
Extra special thanks to my parents for making this Master’s degree possible.
With the utmost of gratitude,
Jessica Arin Brown, M.B.A.

v
TABLE OF CONTENTS
Title Page ....................................................................................................................................................................................... i
Abstract ....................................................................................................................................................................................... iv
Acknowledgements ................................................................................................................................................................ iv
Table of Contents ....................................................................................................................................................................... v
Introduction ................................................................................................................................................................................ 1
Background ................................................................................................................................................................................. 3
Muslim Communities ........................................................................................................................................................ 3
History of Public Opinion towards the U.S. .............................................................................................................. 4
History of Public Diplomacy ........................................................................................................................................... 5
Culture ..................................................................................................................................................................................... 7
Literature Review................................................................................................................................................................... 11
Religion ................................................................................................................................................................................. 12
Media ..................................................................................................................................................................................... 12
Policy ...................................................................................................................................................................................... 13
Country-Level Control Factors .................................................................................................................................... 14
Individual-Level Control Factors................................................................................................................................ 15
Gaps in Literature ............................................................................................................................................................. 16
Hypothesis ................................................................................................................................................................................ 17
Database .................................................................................................................................................................................... 18
Analysis ...................................................................................................................................................................................... 20
Methodology ............................................................................................................................................................................. 28
Model I: Religion .............................................................................................................................................................. 37
Model II: Huntington ....................................................................................................................................................... 37
Model III: Hofstede ........................................................................................................................................................... 38
Model IV: Ingelhart/ Welzel ......................................................................................................................................... 40
vi
Regression Results ................................................................................................................................................................. 41
Summary .............................................................................................................................................................................. 41
Media ................................................................................................................................................................................. 41
Policy ................................................................................................................................................................................. 42
Scapegoat ........................................................................................................................................................................ 42
Culture .............................................................................................................................................................................. 43
Control .............................................................................................................................................................................. 43
Model I: Religion ............................................................................................................................................................... 44
Model II: Huntington ....................................................................................................................................................... 44
Model III: Hofstede ........................................................................................................................................................... 45
Model IV: Inglehart/ Welzel ......................................................................................................................................... 46
Regression Results: Muslim Dependent Variable ............................................................................................... 54
Media ................................................................................................................................................................................. 54
Policy ................................................................................................................................................................................. 55
Scapegoat ........................................................................................................................................................................ 55
Culture .............................................................................................................................................................................. 56
Controls ............................................................................................................................................................................ 56
Policy Implications ................................................................................................................................................................ 62
Conclusion ................................................................................................................................................................................. 65
APPENDIX .................................................................................................................................................................................. 66
References ................................................................................................................................................................................. 90

1
INTRODUCTION
The events of September 11th, 2001 demonstrated that the nature of governance and warfare
are changing. Attacks, committed by a network of sub-state actors, shattered our conception of the
modern world order. In the aftermath of these attacks, fueled on by rhetoric of a “war on terrorism”
and a “war of ideas,” there has been considerable scholarship seeking to answer the question: “Why do
they hate us?” (Zakaria, 2002; Esposito & Mogadeh, 2008). Since this point and the U.S.’ subsequent
counter-attacks on nations perceived to hold these groups in Afghanistan, Iraq and Pakistan, there has
emerged an immense amount of scholarship tracking foreign public opinion of the United States. The
Pew Global Attitudes Project, Gallup World Poll and Zogby International have devoted millions of dollars
of research in attempts to get to the root of Anti-Americanism abroad.
In efforts to reach those groups which have a negative view of the United States, the State
Department has amplified its efforts to reach out to communities abroad through public diplomacy, or
PD, an approach which former President Bush, as numerous predecessors, called “winning hearts and
minds.” In 2008, nearly $1 billion was spent on State Department funded U.S. public diplomacy abroad
to achieve this goal (Graham, 2008). Encompassing everything from the Department of Defense’s
“strategic communication” to the more “soft power” approaches of education and cultural exchanges
lauded by the term’s theoretical father Joseph Nye, the Department of State’s public diplomacy
activities since 9/11 have been subject to extensive criticism. Independent reports ranging from
historians (Nick Cull), bloggers (John Brown), government agencies (Government Accountability Office,
Congressional Research Service) and other affiliates (the Defense Science Board, U.S. Advisory
Commission on PD, etc.) have called for greater accountability and effectiveness in program delivery.

2
Hailing from a private-sector background, the newest Under Secretary for Public Diplomacy and Public
Affairs Judith McHale has reiterated this rhetoric in her focus on accountability, benchmarking of
progress and “return on investment” for public diplomacy.
In order to answer the call of these independent reports, and to effectively reach out to those
groups with the most negative opinion of the United States, we must accurately diagnose which
elements have the greatest influence on their opinions. This, in turn, will allow us to be more strategic
and focused in our public diplomacy efforts to these communities.
Notably, the Gallup World Poll’s ground-breaking 2007 survey of Muslims in 47-countries
throughout the world show that former President Bush’s “war on terror” was really perceived as a “war
on Islam” amongst predominantly Muslim communities. Although in early policy speeches former
President Bush was careful to distinguish everyday Muslims from the Islamic radicals, Islamo-fascists and
militant Jihadists, this nuanced spectrum was lost in the “us vs. them” rhetoric of the axis of evil and the
global war on terror. (Bush, 2005) This simplified interpretation of the Bush administration’s intentions,
by both domestic and foreign audiences, only seemed to support Samuel Huntington’s 1993 “Clash of
Civilizations” article which theorized the future of modern conflict would be played out between
ambiguous, largely religion-based “cultures” throughout the world.
Polls dating back to 2002 suggest that the perception of America abroad has to do with a lot
more than just our policies. In G.F. K. Roper’s recent Nation Brand Index, which measures a country’s
global reputation, the U.S. jumped 7 places to the number one most recognized nation brand—the most
dramatic change the study has ever seen. The founder of the index, Simon Anholt commented: “The
results suggest that the new U.S. administration has been well received abroad and the American
electorate's decision to vote in President Obama has given the United States the status of the world's
most admired country." (PR Newswire, 2009) President Obama’s recent selection as a Nobel Prize

3
Laureate—with arguably little peace-building work beyond multi-lateral rhetoric—further suggests
there’s more to opinion than just religion.
If that’s the case—than is the primary focus on religion appropriate? As Amartya Sen theorizes,
can we categorize populations based on polarized “singular identities” when the true nature of the
world is much more messy? (Sen, Identity and Violence: The Illusion of Destiny, 2006) Should the
United States be focusing its public diplomacy efforts on a multiplicity of factors? In essence, what
factors are at the root of negative perceptions of the United States?
This paper, building on Tuggle’s 2005 paper on the same topic, will delve into those factors
which are believed to explain public opinion towards the United States. They include media
consumption, “scapegoating” or mis-placed dissatisfaction, policy alignment with the United States,
culture, religion, and other demographic “control” variables.
BACKGROUND
MUSLIM COMMUNITIES
Given that scholarship on public opinion includes analysis of both Muslim and Arab
communities, it is worthwhile to clarify these terms for the purposes of this paper. In total, the world is
composed of roughly 1.5 billion people practitioners of Islam, spanning the globe. The majority of
these, “Muslim Communities,” or those countries which we define as having greater than 10 percent of
their populations who practice Islam, spans 58 countries in the Middle East, Africa, and South and
Central Asia. (Government Accountability Office, 2006) For a complete list of these countries, please
see Appendix A.
While Islam is a faith, “Arab” is an ethnicity, comprising those individuals who share a national
history, culture and language. As with any definition of ethnicity, these boundaries are not clear-cut.

4
The most conservative definitions define Arabs as semetic-speaking (including Arabic, Amharic, Tiginrya
or Hebrew) and originating from the Arabian peninsula, between southwest Asia and Africa—although
Arabs may or may not speak Arabic, and may or may not practice Islam. (Wikipedia) This paper will
utilize religion as a variable for analysis.
HISTORY OF PUBLIC OPINION TOWARDS THE U.S.
Following September 11th, there have been numerous public opinion polls conducted on
perceptions of the United States from predominantly Muslim countries, representing a complex mix of
opinions. On both individual and country-level analyses of predominantly Muslim countries, there is
consistency amongst the major international polling companies (Zogby, Gallup and Pew) regarding the
overall negative view of the Muslim World towards the United States; however differences in opinion
arise regarding the causes of these negative perceptions. A number of the studies by Zogby’s annual
Arab Public Opinion Survey and Pew’s Global Attitudes surveys cite distinctions in Muslim public opinion
between American policies –such as support for Israel and the inability to help the Israeli/Palestinian
conflict—and American values—such as our education system, scientific achievement, form of
government and popular culture.
Tessler (2003) argued that “religion and culture are not fostering antipathy to Western norms
and institutions, and [sic] anti-Americanism is for the most part a response to perceptions and
judgments regarding U.S. foreign policy.”
Gallup’s Poll of the Islamic World cites the spread of Western values as having a predominantly
negative impact on Muslim World opinions of the United States. (Gallup Poll Editorial Staff, 2002) In
particular some of the sources of this discontent are attributed to cultural and lifestyle values, such as
sex, alcohol, vulgarity and inappropriate dress. The majority of Muslim countries polled found that
"economic, social, and cultural modernity" was “predominantly or totally in conflict with local traditional

5
value systems.” Gallup’s findings reinforce the idea of an underlying culture clash between the United
States and the Muslim World.
Friedman, Zakaria, Hollander and Rubin argue that much of the discontent with America comes
from scape-goating—arguing that those with little power over their own circumstances are apt to blame
the United States because of our international visibility and economic strength. (Tuggle, 2005)
It is worthwhile noting that the validity of using public opinion as an indicator for the
effectiveness of public diplomacy has been taken into question. Holsti, 1992 and Johnson, 2006
amongst others argue that public opinion is subject to a number of different factors such as policies
between countries and the economics of the host-country. Ultimately, we cannot attribute positive
shifts in public opinion to effective public diplomacy, nor blame public diplomacy for negative trends in
opinion. Despite these limitations, public opinion polling remains one of the most widely used—and
publicly accessible—metrics available for evaluating the effectiveness of United States public diplomacy,
and will be utilized as the key metric for evaluation in this study.
HISTORY OF PUBLIC DIPLOMACY
Alternatively described as “the promotion of national interest by informing, engaging, and
influencing people around the world,” (Djerjian, 2003) and “U.S. government attempts to influence
foreign citizen’s views of the United States towards a positive view” (Heiman, 2007), public diplomacy
(or PD) comprises a wealth of different initiatives employed by governments to communicate with
foreign publics.
The practice of public diplomacy has been around for a long time, yet has only recently existed
in its current incarnation. Radio broadcast, on some accounts the first evidence of “modern” public
diplomacy, dates back to the 1st World War. Yet the term itself was not used until 1965 to describe “the

6
process by which international actors seek to accomplish the goals of their foreign policy by engaging
with foreign publics.” (Cowan & Arsenault, 2008)
Public Diplomacy’ activities range in both its format and the time-frame to reach its objective
ends. In its strictest definition, public diplomacy activities range from broadcast and media campaigns,
to op-eds, media placements and translations, and to education and cultural exchange programs. Within
the United States, the core of these activities is housed within the U.S. Department of State, and falls
within the mandate of the Under Secretary for Public Diplomacy and Public Affairs. Below the Under-
Secretary, three bureaus--Public Affairs (PA), International Information Programs (IIP), and Education&
Cultural Affairs (ECA)--carry out the main activities of public diplomacy for audiences abroad. In
addition, the Broadcasting Board of Governors, an agency with a separate funding mechanism and
board from the Department of State, carries out broadcast campaigns to audiences abroad. (State
Department, 2009) Modern public diplomacy definitions trend towards a “whole of government”
approach, recognizing the influence of the Department of Defense’s strategic communications activities,
USAID’s development activities, and a slew of other agencies and actors which engage in interactions
with foreign actors and audiences.
Before 1999, public diplomacy was housed in a separate agency called the United States
Information Agency (USIA), formed in the aftermath of the 2nd World War, and utilized most extensively
during the cold war with the Soviet Union. Following the fall of the Berlin wall America’s focus once
again turned inward and public diplomacy slowly began losing an urgent purpose to exist. Funding for
public diplomacy slowly began to diminish until finally in 1998, under the Foreign Affair Reform and
Restructuring Act, USIA was dismantled and folded into the State Department. (Graham, 2008)
Today, public diplomacy remains a highly relevant, if misunderstood and often criticized aspect
of the U.S. Government’s activities. Given that 2009 marks the 10 year anniversary of “consolidation”

7
into the State Department, there has been a flurry of articles, reports and blogs reminiscing about the
good old days of USIA, and calling the Department to account to be more effective.
These papers, in addition to their occasional reminiscing of the good old days, have a decidedly
private-sector approach to PD. This ethic has been reiterated in requests for greater accountability,
benchmarking of progress and “return on investment” from recent Government Accountability Office
(GAO) and Defense Science Board Task Force reports tasked with oversight of public diplomacy. (GAO,
2006, 2009; Defense Science Board Task Force, 2008) The current Under Secretary of State Judith
McHale, as former CEO of Discovery International, has taken this ethic to the next level through a data
and results driven approach to public diplomacy and an ambitious global strategic framework process
for the whole of PD. (Office of the Under Secretary for Public Diplomacy and Public Affairs, 2010)
This more private-sector approach has emerged within PD as a whole. One example is Anholt-
GfK Roper’s recent “Nation Branding Index” which measures each country’s “brand” on six areas:
exports, governance, cultural heritage, people, tourism and investment & immigration. The group also
offers courses aimed at nations hoping to improve their ‘brand images’ abroad. (The Anholt-GfK Roper
Nation Brands Index, 2009). The literature on international marketing is now being extended to public
diplomacy, a sort of “international public relations.” These papers overwhelmingly argue for a greater
culturally context driven approach to public diplomacy. (Sha, 2006) (Burmann, Zeplin, & Riley, 2009)
(Yun S. H.-N., 2008) This paper aims to expand on this increasingly culture-focused approach to PD by
elaborating on pre-existing scholarship of the sources of public opinion—arguably, the “brand value” of
a nation—to reflect this push towards culturally-tailored approaches to PD.
CULTURE

8
Culture is a very imprecise catch-all phrase which can be used to define nationality, ethnicity,
linguistic groups, or the “collective programming which distinguishes the members of one category of
people from another.” (Hofstede, 1998) Schneider & Barsoux, in their book Managing Across Cultures,
theorize culture as multiple, concurrent identities visualized as overlapping concentric circles including
national/ regional, industry, company, professional, or functional elements. Geert Hofstede, one of the
more prominent cultural theorists, defines culture as “the interactive aggregate of common
characteristics that influence a human group’s response to their environment.” (as cited in Yun, 2008)
There are numerous theories on culture which are used in the study of public diplomacy, public
opinion and international affairs. This paper will explore three different approaches to “mapping” the
cultures of the world, namely Huntington’s “Clash of Civilizations,” Hofstede’s Cultural Indicators, and
the World Values Survey’s Inglehart-Welzel Cultural Indicators.
Samuel Huntington’s 1993 article “The Clash of Civilizations” has been one of the most cited and
often used since September 11th. Based on the fundamental idea that the world is organized into eight
distinct cultures, based loosely around religion, his original theory posited:
“The great divisions among humankind and the dominating source of conflict will be cultural. Nation states will remain the most powerful actors in world affairs, but the principal conflicts of global politics will occur between nations and groups of different civilizations. The clash of civilizations will be the battle lines of the future.”
Although Huntington’s article sparked a lively debate when it was released in the 1990’s, the
article gained prominence yet again following September 11th when it was cited as a sort of foreboding
premonition of the conflict between Islam and the West. Criticism of Huntington’s eight theorized
cultures--including Western, Islamic, Sino-Confucian, African, Hindu, Slavic-Orthodox, Latin American
and Japanese--abounds. (See Appendix A for a map of the world using Huntington’s indicators).
Challengers argue that his theory is overly simplistic, static, and paints a homogenous picture of nation-
states that does not reflect the dynamic nature of modern societies under the forces of globalization.
9
(Said, 2001) Sen eloquently argues that it is precisely this type of monochromatic, overly simplistic
description of individuals which provides an enabling environment for the world’s most horrific
sectarian violence. The true nature of people is based on multiple identities; when we recognize and
understand the multiplicity of human identities, we make vast inroads into preventing the types of
conflict that Huntington warns about. (Sen, 2006)
Huntington responded to these charges by updating his theory, arguing that “obviously, changes
and adaptations have occurred as a result of economic development, industrialization, the huge wave of
immigrants that have come to this country, economic crisis, depression and world wars. But the core of
American beliefs has remained the same.” (Ali & Huntington, 2007)
Regardless, Huntington’s theory remains one of the most often cited in literature on
international relations and for this reason will be utilized in this study. To serve as a challenge to the
premise that his map of cultures are largely religion-based, and to fill a hole in Tuggle’s original 2005
study, the model used in this paper will employ religion as an important explanatory variable as a
potential predictor of favorability towards the United States.
Geert Hofstede’s cultural indicators are another widely used mechanism for distinguishing
among groups. Whereas Huntington’s indicators occupy the “religious” sphere in Schneider and
Barsoux’s theory, Hofstede’s theory might occupy the “functional” sphere. In 1984 Hofstede 'mapped'
the world's cultures into discrete categories by surveying business people at IBM in multiple countries.
Hofstede categorized the world into four distinct categories, namely individualism (or the feelings of
allegiance to one’s self and one’s immediate family—opposed to collectivist cultures which are more
clan like and provides protection for permanent loyalty), power distance (or the extent to which the less
powerful accept inequality as normal), uncertainty avoidance (referring to feelings towards unclear and
undefined circumstances) and masculinity (referring to clearly defined gender roles—as opposed to

10
“femininity” which allows for greater equality of roles between men and women). (Hofstede, The
Cultural Relativity of the Quality of Life Concept, 1998)
Critics of Hofstede argue that his indicators are not based on representative samples (IBM
employees are not representative of the full range of personalities in a culture) and thus are not
externally valid. (Jones, 2007; Carbaugh, 2007) Others have taken issue with the static nature of his
indicators, and his overgeneralization of regions of the world. For example, he has only one set of
indicators for the “Arab World” including the countries of Egypt, Kuwait and Lebanon, another for “East
Africa” and one more for “West Africa.” (ITIM International, 2009)
Hofstede defends his indicators by arguing that given his full sample was taken from IBM, any
effects associated with being an IBM employee are cancelled out through the cross-national survey, and
only the prominent cultural traits emerge. Hofstede also admits: “obviously, cultures do change over
time. However, although cultures change, their differences remain remarkably stable” (Hofstede, 1998,
p.154-155)
Inglehart & Welzel ‘s cultural indicators from the World Values Survey–herein I/W—and the
Cultural Cognitive Systems Analysis from Applied Futures Inc, represent two other existing approaches
to measuring culture in the public and private sphere. I/W’s cultural indicators differ in their
approach—which categorizes the world into two topics along a continuum: (1) survival versus self-
expression (which measures a shift from economic and physical security to one of subjective well-being,
self-expression and quality of life) and (2) traditional versus secular/ rational (measuring societies where
religion, family ties and deference to authority play a primary function, versus the opposite in “rational”
societies ) These two indicators have been shown to explain 70 percent of the variability in the cultures
of the world. (Inglehart, 2009)
There are numerous other theories which help “map” the cultures of the world, however due to
the lack of publicly available information on these indicators, the study at hand will utilize the three

11
afore-mentioned measures of culture, namely Huntington, Hofstede and Inglehart/ Welzel.
Nevertheless, a few of these alternative theories are worthy of mention.
Edward T. Hall has been another influential player in the literature on culture and public
diplomacy alike. His three key indicators measure differences in context, time and space across cultures
of the world. Hall distinguishes between high context and low context cultures based upon the types of
norms and mores, or “rules” that govern a society. A high context culture will have many implicit rules
which are focused more on non-verbal communication and nuance—prime environments for
“relational” public diplomacy like exchanges—while low-context cultures use more explicit, verbal
cultural cues which are particularly well-attuned for information campaigns. (Zaharna, 2007) The time
variable refers to whether individuals perform one task at a time (monochronic) or are multi-taskers
(polychronic). Space refers to expectations surrounding personal space and ownership, divided into
high and low territoriality. Although Hall, like Huntington, Hofstede, and I/W does make generalizations
of cultures based on nationality, he is also quick to indicate that national-level values are
generalizations. (Straker, 2006)
The Cultural Cognitive Systems Analysis (CCAS), a private-sector initiative taken on by Applied
Futures Inc., is distinct from the aforementioned models in its individual-level approach to measuring
culture. Although still at the pilot stage of its development, the CCAS aims to delve down into “root
causes” of action, digging beyond behavior and attitudes down to motivations and intentions. While the
CCAS has multiple potential applications, it is currently being marketed for Information Operations or
Psychological Operations. (MacNulty, 2009)
LITERATURE REVIEW
12
In the extensive literature on the factors which influence international public opinion a number
of key themes and potential causes emerge. They include religion, media, policy, women’s rights and
domestic conditions. The literature includes both country-level surveys and analyses geared towards
specific regions and groups.
RELIGION
A major theme which emerges in the literature is the influence of religion, and religiosity, on
opinions towards the United States. Studies have found that those individuals who are strongly
religious, whether hailing from the United States, the Middle East, or elsewhere tend to have more
stereotypical views of people from other societies. This so called “faith factor” (Baumgartner, 2008)
accounts for Evangelical Christian support of the U.S. war in Iraq, as well as negative perceptions of the
United States amongst highly-religious Muslims abroad. (Chiozza2004) Acevedo (2008) pushes deeper
into this claim through his study of intensity of religion, so-called “fatalism,” in his findings that religion
alone is not an adequate predictor of fatalism, but is filtered through a broader set of individual-level
factors such as demographics and socio-economic status.
Although the rhetoric of the Bush Administration might imply that all Muslims are against the
United States, Chiozza, 2004, and numerous studies from the Gallup Poll of the Muslim World (2006)
amongst others insist a direct relationship cannot be drawn between practitioners of Islam and negative
opinion towards the United States. These studies point to deeper factors such as policy alignment with
the United States, contentment with their own domestic conditions and socio-economic factors to have
much stronger predicative power over favorability towards the United States.
MEDIA

13
The type of media used, in particular television, has often been cited as having correlations with
favorability towards the United States. One of the more famous examples of the purported impact of
opinion on Muslim Communities is the so called “Al-Jazeera Effect.” The Muslim World equivalent of the
“CNN Effect,” the so-called “nexus of media power and foreign policy where television’s instantly
transmitted images fire public opinions, demanding instant responses from government officials,
shaping and reshaping foreign policy at the whim of electrons.” (Strobel, 1996) Television is the most
widely used form of media in the Middle East— and television viewership in the Middle East has a
strong correlation with anti-American views. (Nisbet, Nisbet, & Scheufele, 2004) But it’s the format, not
the source which matters. It is only the degree, not the direction of correlation which changed when an
individual’s news source included Western news sources such as CNN. (Nisbet, 2004, p.31). In the
United States, television has a similarly strong impact on negative opinions of the Muslim World and
Islam, although prime-time television was found to improve negative perceptions of the United States
amongst Muslim respondents. (Nisbet C. , 2005)
Tuggle (2005) expands on this argument to find that Internet use has explanatory power over
negative opinions towards the United States to an even larger degree. He found this to be particularly
true in Islamic, Confucian and Western societies. Although his study does not expound on the potential
cause of this trend, one possible explanation from Chiozza (2004) is that “information from the new
media in particular helps diffuse positive views about America as a society and political system, at the
same time information, both through images and written words, leads to the formation of more
negative view about American policies.” (p. 37). In other words, the Internet allows for greater access to
information, which leads to a more nuanced perception of the United States.
POLICY
14
Throughout the literature on public opinion polling, a distinction is made between favorability
towards the United States and favorability towards Americans. This distinction is meant to highlight the
difference between the American public and America’s policies. (Tessler, 2003) In particular, opinions
towards U.S. policy decisions in Iraq, Afghanistan and Palestine have strong predicative power over
unfavorability towards the United States. (Furia & Lucas, 2006) Tuggle’s paper found that “when the
United States addresses the global issue of most concern to an individual, that individual is more likely
to have a favorable opinion of the United States.” (Tuggle, 2005, p.29) Furia & Lucas say it succinctly:
“we find no evidence that ordinary Arabs resent countries for what they ‘are,’ and considerable
evidence that they resent them for what they ‘do.’” (Furia & Lucas, 2006)
COUNTRY-LEVEL CONTROL FACTORS
Another key theme which emerges from the literature is the impact of domestic conditions on
favorability towards the United States. This concept, referred to as “scapegoating,” is based on the idea
that those countries with less than desirable domestic circumstances are more likely to have negative
perceptions towards the United States. Correlations between view of the United States and economic
variables, such as GDP/ capita and low income were found in separate studies—those with higher socio-
economic states were found to be more favorable towards the United States. (Tuggle, 2005) (Heiman,
2007) (Carlson & Nelson, 2008)
Numerous studies on public opinion attempt to identify economic or political linkages between
countries which might have an impact on public opinion. For example, trade levels, foreign aid and a
proxy for alliances have been used in multiple studies. (Carlson, 2008; Heiman, 2004) Results from
these studies have been inconclusive and varied; Heiman finds relationships between trade levels and
perceptions of the United States which are statistically significant yet substantively irrelevant, while
Carlson’s study of Asia only finds a relationship between foreign aid and trade on public opinion in the
15
case of Afghanistan. Trade issues have been excluded from this study due to the lack of compelling
evidence from the literature of strong linkages between trade or economic ties and perceptions of the
United States.
INDIVIDUAL-LEVEL CONTROL FACTORS
Beyond religion and media-use, numerous studies delve into individual-level factors which have
potential explanatory power over favorability towards the United States. Studies tend to include
gender, age, education, socio-economic status, contentment with local government and individual
values.
Interestingly, women and those who support more independent women are found to be more
favorable towards the United States. (Tuggle, 2005; Carlson, 2008; Nisbet, 2004) Heiman & Ozer have
found that societies with large numbers of women in government tend to be more favorable towards
the United States. (Heiman, 2007)
Tuggle (2005) found no impact of age on opinion towards the United States, while other studies
suggest that younger respondents tend to be more favorable towards the United States. (Carlson, 2008
& Chiozza, 2004). Interestingly, and contrary to intuition, in numerous global and regional studies higher
levels of education were found to be correlated with more negative opinions of the United States. In
contrast, individuals from higher socio-economic statuses were found to have more positive views of the
United States. (Carlson, 2008; Chiozza, 2004; Tuggle, 2005)
Political factors such as higher trust or satisfaction in local government and freedom were also
found to be positively correlated with favorability towards the United States in some studies (Tuggle,
2005 & Heiman, 2007). However, this was irrelevant in a study focusing on Asia. (Carlson & Nelson,
2008) Other studies point to admiration for American democracy as a predictor of favorabilty towards
the United States. (Chiozza2004)

16
GAPS IN LITERATURE
One key area missing from the literature on public opinion and public diplomacy is a narrower
focus by country or region. Given the events of September 11th and the United States strategic focus on
the Muslim World, extensive literature exists delving into the causes of public opinion within this sub-
section of the World. There is also an expanding literature on European and Asian public opinion of the
United States. However, studies on Africa and Latin America are noticeably absent. Similarly, few
attempts have been made to identify a “profile” on the global scale of the type of individual who views
the United States unfavorably. Numerous studies identify isolated elements which contribute to
perceptions of the United States, yet few delve into interactions within countries or within regions to
create a profile of those who tend to not like the United States.
In addition, there is little research done on new models of measuring public diplomacy
effectiveness beyond public opinion polls. More should be done to identify new mechanisms for
tracking the effectiveness of specific public diplomacy initiatives to ensure that money is being spent
efficiently and programs are having their intended impacts.
Amidst recent literature of public diplomacy, there is much dicussion of a shift in communication
models from the top-down approach of elite-driven opinion trickling down to the masses, to include a
bottom-up approach defined by the opinions of the often younger, less educated and more media-
driven masses. Although methods for capturing the shifts in opinion amongst these more dispersed,
mediated models of public diplomacy are developing, there have been few studies which do so in a
concerted, strategic way. Groups like Morningside Analytics are pioneering mechanisms for tracking
topics discussed in on-line fora, and Social Network Analysis is an emerging field which aims to create
“maps” of networks of digital users. While these are both exciting advancements towards capturing the
“ground-up” element of public diplomacy; we have yet to discover a mechanism for pairing the two
theories of public diplomacy change to create a more holistic picture of effectiveness.

17
On the culture front, few studies have attempted to cross-reference Huntington’s and
Hofstede’s indicators with other cultural maps. Much more can be done to pull in other analyses and
categorizations of the world.
Also missing from the literature is any time-series, global analyses of shifts in public opinion.
Whereas such analyses have been performed successfully in specific regions or in specific target groups
(the Gallup Poll of the Muslim World pioneered in this area) there have been no studies which have
used regression analyses to analyze shifts in opinion over time. This study will attempt to make the first
step in this direction by expanding upon Tuggle’s analysis of the 2002 Pew Global Attitudes study using
updated survey data from 2007. In addition, this study will delve deeper into the Pew Global Attitudes
sample to analyze responses across three different “cultural maps” in efforts to identify which cultural
traits are correlated with favorable and unfavorable opinions towards the United States. Finally, the
study will dig deeper into the sub-sample of Muslim respondents to develop a more nuanced
understanding to Fareed Zakaria’s question “why do they hate us.”
HYPOTHESIS
This study will attempt to answer the question: does religion have predicative power over
favorable views towards the United States? If not religion, do other cultural “maps” of the world help to
explain favorable views towards the United States? In efforts to challenge the perception held by
Huntington and others that there exists a “culture clash” between the United States and Muslim
populations abroad, this study will pay particular attention to the religion of Islam, and those cultural
traits in each of the three cultural “maps” outlined above which are most commonly associated with
Muslim communities. A devil’s advocate approach will be adopted; the religion of Islam and those
cultural traits which are related to Muslim communities will be correlated with negative favorability
ratings towards the United States.

18
Religion:
Hypothesis 1 = Muslim respondents will have lower opinions of the United States.
Culture:
Hypothesis 2 = Huntington’s “Islam” indicator will have an inverse relationship with favorability towards
the United States.
Hypothesis 3 = Hofstede’s cultural indicators of Power Distance, Masculinity and Independence will have
inverse relationships with opinion of the United States.
Hypothesis 4 = Ingelhart/ Welzel’s indicators of survival tendencies and traditional values will have
inverse relationships with opinion of the United States.
DATABASE
The data for this study derive from the 2007 Pew Global Attitudes 47-nation survey. It is the
most extensive, recent and public database of public opinion that Pew has published. The survey uses
much of the 2002 Global Attitudes survey questions, providing the opportunity for comparison with
earlier results. The data include 45,239 individual observations with some over-sampling of Muslim
populations in urban areas. In Bolivia, Brazil, China, India, Ivory Coast, Pakistan, South Africa, and
Venezuela the sample was predominantly urban and not necessarily representative of the entire
population of these countries. The survey’s primary questions were measured using a step-wise scale
of opinions, known as the Likert scale, which allow for variation in intensity of perceptions. Some
questions in this survey were asked only in developing countries, in Africa, or in the Middle East. Due to
political sensitivities in China, questions regarding an individual’s perceptions of democracy or happiness
with their current situation life situation were not asked.
In addition, this study will draw on data from four national-level sources for the culture and
individual-level explanatory variables. Measures of freedom are taken from Freedom Houses’s 2007

19
“Freedom in the World” Survey and will be based on their categorization of free, partly free and not
free. See Exhibit 1 in the Appendix for a listing of countries that fit within the “Partially Free” and “Not
Free” categories.
Cultural data will be derived from various locations. (Please see Exhibit 2 in the Appendix for a
summary of the Cultural Indicators utilized in this study.) Huntington’s cultural map is derived from his
original “Clash of Civilizations” 1993 essay and from Fox’s 2002 analysis entitled “Ethnic Minorities and
the Clash of Civilizations.” Because no set list of countries fit into each of Huntington’s eight indicators,
some extrapolation of his theory is necessary. Where information was unavailable, countries were
coded according to predominant religious affiliation, based on Fox’s 2002 paper. Graph 1 represents the
distribution of countries in each of Huntington’s cultural indicators in the Pew data set. For a visual
representation of Huntington’s cultural map, see Exhibit 4 in the Appendix.
1 1 24 4
7
11
17
02468
1012141618
Number of Countries in Pew
2007 Data Set
Huntington's Cultural Categories
Graph 1: Number of Countries in Pew 2007 Data Set by Huntington's Cultural Categories
Data on Geert Hofstede’s cultural indicators were taken directly from his website
http://www.geert-hofstede.com/ The indicators are based on multiple surveys of IBM employees in
various countries from 1980-2008. His indicators are along five dimensions, weighted on a scale of 1-100

20
including: Individualism, Power Distance, Uncertainty Avoidance, Masculine/ Feminine/ and Long-Term
Orientation. The latter category, Long-Term Orientation, was only recently added to his list of
indicators, not all countries include this measurement. In addition, some indicators were provided on
the regional level, not the national level. For purposes of this study, each country in a region will have
the same score. For example, countries which Hofstede collapsed into the “Arab World”, including
Kuwait, Lebanon and Libya, will receive the same score. It is important to note that there are eight
countries in the Pew study without a Hofstede score. For this reason, in the regression analysis using
Hofstede’s indicators, the sample size will be smaller.
Finally, Inglehart/ Welzel’s (I/W) cultural indicators are drawn from the World Values Survey
website—40 of the I/W scores overlap with the Pew data-set. Inglehart & Welzel take a dynamic view of
culture and thus have collected survey data for many countries between 1981 and 2006. Based on the
assumption that this “cultural drift,” while important, is not significant, the scores for each country have
been averaged across the five years of the study where data are available. Given the broad date ranges
and changes in government over this time-period, some countries are listed both in terms of former
names (Czechoslovakia) and current names (Czech Republic and Slovakia). Where necessary, values
have been averaged across logical boundaries. For a summary of the Pew countries with missing cultural
data, please see Exhibit 3 in the Appendix.
ANALYSIS
The primary research question for this analysis is: what relationship do religion and
other “Muslim” cultural traits have with favorable opinions towards the United States? This
study will utilize a binary--or dual response--dependent variable to measure individual
respondents’ favorable or unfavorable opinions towards the United States.

21
In the original survey, favorability towards the United States was measured on a four-
level scale, ranging from Very Favorable, Somewhat Favorable, Somewhat Unfavorable to Very
Unfavorable. For ease of computation in the analysis, the primary dependent variable for this
study, favorability towards the United States, was collapsed into two categories, favorable and
unfavorable. See Exhibits 5 & 6 in the Appendix for a visual representation of this.
Through preliminary analysis of the data set used for this study, a number of interesting
trends emerge. Preliminary cross tabulations of the frequency of favorable or unfavorable
opinions by Huntington’s cultural categories demonstrates that Confucian, Islamic and
Slavic/Orthodox cultures have high percentages of individuals responding unfavorably towards
the United States. In contrast, Huntington’s “Africa” culture demonstrated the highest
percentage of favorable responses towards the United States. Graph 2 represents the full set of
trends.

22
If we turn to one of Hofstede’s five cultural indicators, power distance, we see less of an
obvious trend. Power distance, which measures the extent to which the less powerful accept
inequality as normal, is measured on a scale from 1-100. For ease of analysis, the power
distance value has been separated into three categories—high, medium and low, based on the
frequency distribution in the sample.1 As we can see in Graph 3, across all countries in the
sample, there is not a dramatic distinction in opinions towards the United States whether the
acceptance of inequality is low, medium or high. Although there does not appear to be much
variation amongst the categories presented here, it may be interesting to look for any trends
when these categories are further disaggregated by country.
1 In other words—each category has 1/3 of the sample scores. Due to the distribution of scores in the sample on the power distance scale, “low” scores range from 1-55, “medium” scores range from 56-70, and “high” scores range from 71-104.

23
Turning to the final cultural category under analysis for this study, Inglehart Welzel,
similar results to Hofstede’s appear. Graph 4 measures favorability towards the United States
by Ingelhart Welzel’s “traditional/rational” value, which measures a development shift from
economic and physical security to one of subjective well-being, self-expression and quality of
life. Like the power distance variable, for ease of analysis the traditional/rational variable has
separated into low, medium and high values based on the distribution of scores within the
sample. Similar to Hofstede’s indicator, there does not appear to be much of a relationship
between traditional/rational values and favorability towards the United States.
24
Finally, an examination of religion illustrates an interesting set of trends with favorability
towards the United States. Due to coding challenges inherent in the survey design2, the religion
variable was collapsed into eight categories based on the largest groups of religions in the
world.3 Graph 5 represents these trends graphically. It is important to note, as previously
mentioned, that the Pew Global Attitudes 2007 study represents an over-sampling of Muslims
in major western cities.4 In addition, the religion question was not asked in China. In order to
account for opinions towards the United States in that country, every respondent in China was
coded into a “Chinese” religion category.
With these limitations in mind, we notice a trend of unfavorable opinion towards the
United States amongst those respondents belonging to the Muslim faith, those respondents
from China, and those who claim no religion. Although this rudimentary analysis may support
the idea that individuals of the Muslim faith have more negative perceptions of the United
States, the literature demonstrates that this fact is more nuanced when we account for other
important factors such as education, frequency of prayer and type of media exposure. (Chiozza,
2004)
One variable present in the Pew data set which measures this nuanced “intensity” of
religion is frequency of prayer. Table 6 represents the percentage of individual respondents, by
2 In the Pew Global Attitudes 2007 study, the question pertaining to the respondent’s religion was coded differently for every country in the sample. For a complete list of how religion categories were collapsed, see Exhibit 7 in the Appendix. 3 Most numerous religions in the world from the CIA World Factbook. 4 This over-sampling is remedied by a “weight” variable which is included in the regression models, and re-sets samples to reflect and accurate sample of Muslims based on the country’s broader population.
25
religion, who pray more than once per day.5 Although at first glance it appears that Muslims
and Hindus experience the greatest “intensity” of religion with majorities of each group praying
at least once per day, the reader is reminded that in many faiths praying multiple times per day
is part of their cultural expression. In Islam, prayer—or salat—is one of the five pillars of faith;
in which prayer five times daily at sunrise, mid-day, afternoon, sunset and evening is thought to
have been mandated by God and is an essential part of the practice for those hoping to live a
“good and responsible life according to Islam.” (Religion Facts, 2009) Moreover, in many
predominantly Muslim countries, prayer is very much a public practice where “the public call to
prayer from the mosques sets the rhythm of the day for the entire population.” (BBC Religion,
2009) For these reasons, even those who might consider themselves less religious would rank
high on Pew’s measure of religiosity. Similarly, for strict adherents of Hinduism, ritual prayers
to deieties are performed three times daily. (BBC Religion, 2005) For these reasons, this metric
for “intensity” of religion is imperfect at best, and unfairly biased towards those of Hindu and
Muslim faiths at worst. The reader is cautioned to treat these results as preliminary.
5 Possible responses for this question ranged from multiple times per day to never pray. The variable was coded into a binary response based upon the frequency distribution of responses; 44 percent of total respondents reported praying more than once/day.

26
Moving on to the control variables for use in this analysis—the literature points to
media use as a common source of explanatory power over opinions towards the United States.
Initial cross-tabulations between opinion of the United States and primary news source

27
demonstrate that respondents who cite radio as their primary news source in the Pew data set
tend to have more favorable perceptions of the United States. However, although not as
obvious, together radio, magazines and T.V. are the primary sources of information for those
with moderate views of the United States. Please see Graph 7 for further elaboration.
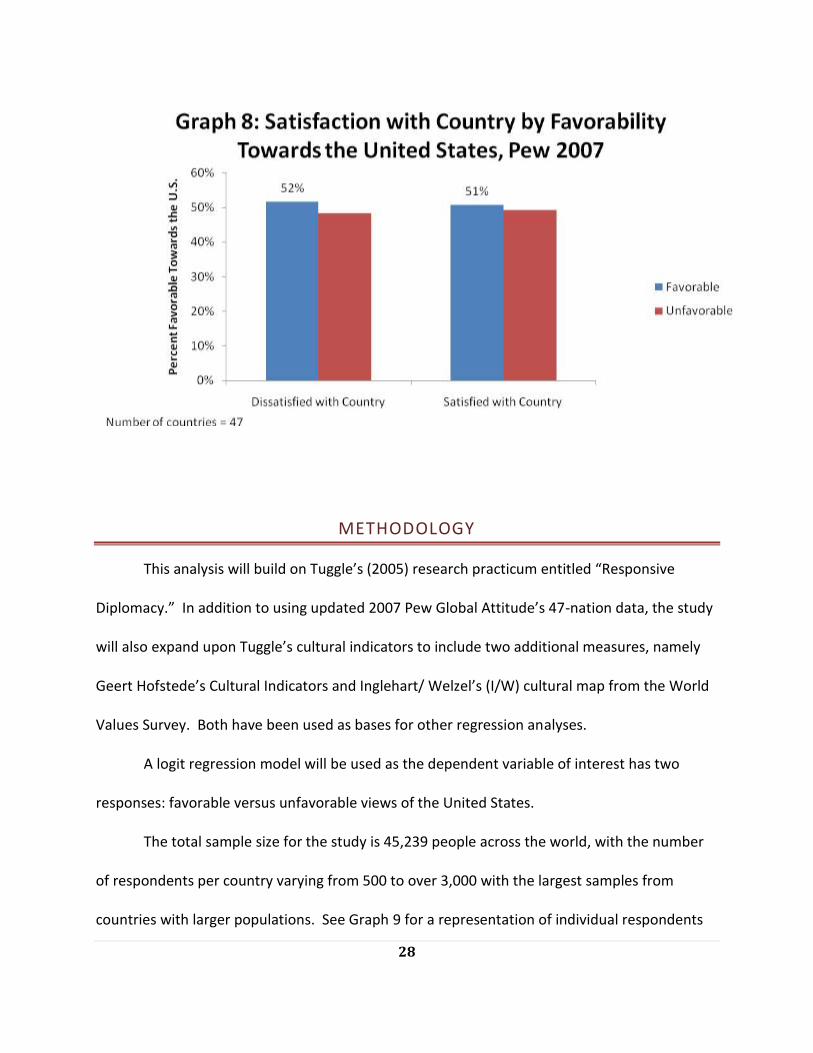
Recall that scapegoating in this context is defined as blaming an outsider for your own
negative domestic situation. Surprisingly, the share of favorable and unfavorable responses
were roughly the same for those individuals claiming to be “satisfied” or “dissatisfied” with
their government. (See Graph 8) In contrast, Tuggle (2005) found that dissatisfaction with one’s
government was statistically correlated with negative perceptions of the United States. It will
be interesting to see whether Tuggle’s finding will be replicated in the regression analysis for
this study.
28
METHODOLOGY
This analysis will build on Tuggle’s (2005) research practicum entitled “Responsive
Diplomacy.” In addition to using updated 2007 Pew Global Attitude’s 47-nation data, the study
will also expand upon Tuggle’s cultural indicators to include two additional measures, namely
Geert Hofstede’s Cultural Indicators and Inglehart/ Welzel’s (I/W) cultural map from the World
Values Survey. Both have been used as bases for other regression analyses.
A logit regression model will be used as the dependent variable of interest has two
responses: favorable versus unfavorable views of the United States.
The total sample size for the study is 45,239 people across the world, with the number
of respondents per country varying from 500 to over 3,000 with the largest samples from
countries with larger populations. See Graph 9 for a representation of individual respondents

29
per country.
0
500
1000
1500
2000
2500
3000
3500
Nu
mb
er
of
Re
spo
nd
en
ts p
er
Co
un
try
Selection of Countries from Pew Data Set
Graph 9: Number of Respondents per Country Pew Global Attitudes Data Set 2007
Although all of the variables in the Pew data set are captured at the individual level, the culture
and Freedom House variables are captured at the country level. In order to not bias regression
results due to the unequal sample of certain country-level variables, a weight will be utilized to
equalize the responses from each country. In other words, the weight will serve to put greater
emphasis on those countries with fewer responses (like Bulgaria), and less emphasis on those
countries with greater responses (like China) so that all countries are analyzed as if the number
of responses per country were equal.
This study will examine the relationship between opinion of the United States and four
key independent variables —religion and three cultural indicators (Huntington, Hofstede and
30
Inglehart/Welzel). The study will distinguish between those reporting favorable views from
those reporting unfavorable views.
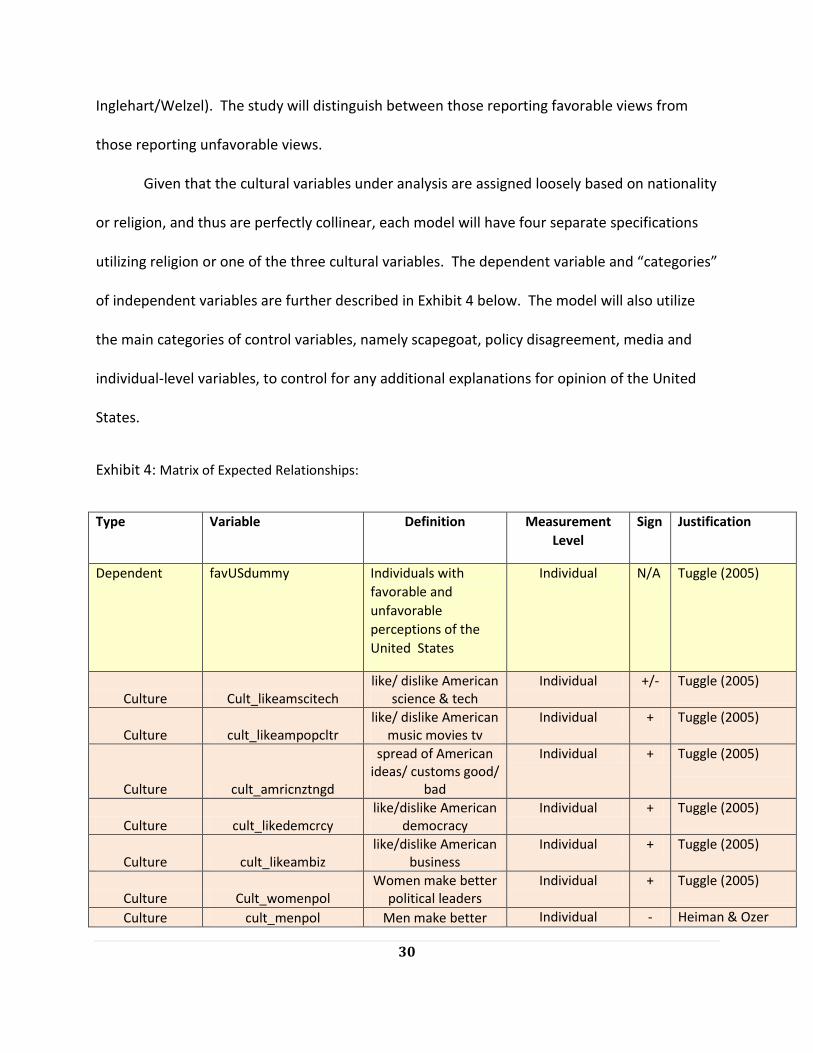
Given that the cultural variables under analysis are assigned loosely based on nationality
or religion, and thus are perfectly collinear, each model will have four separate specifications
utilizing religion or one of the three cultural variables. The dependent variable and “categories”
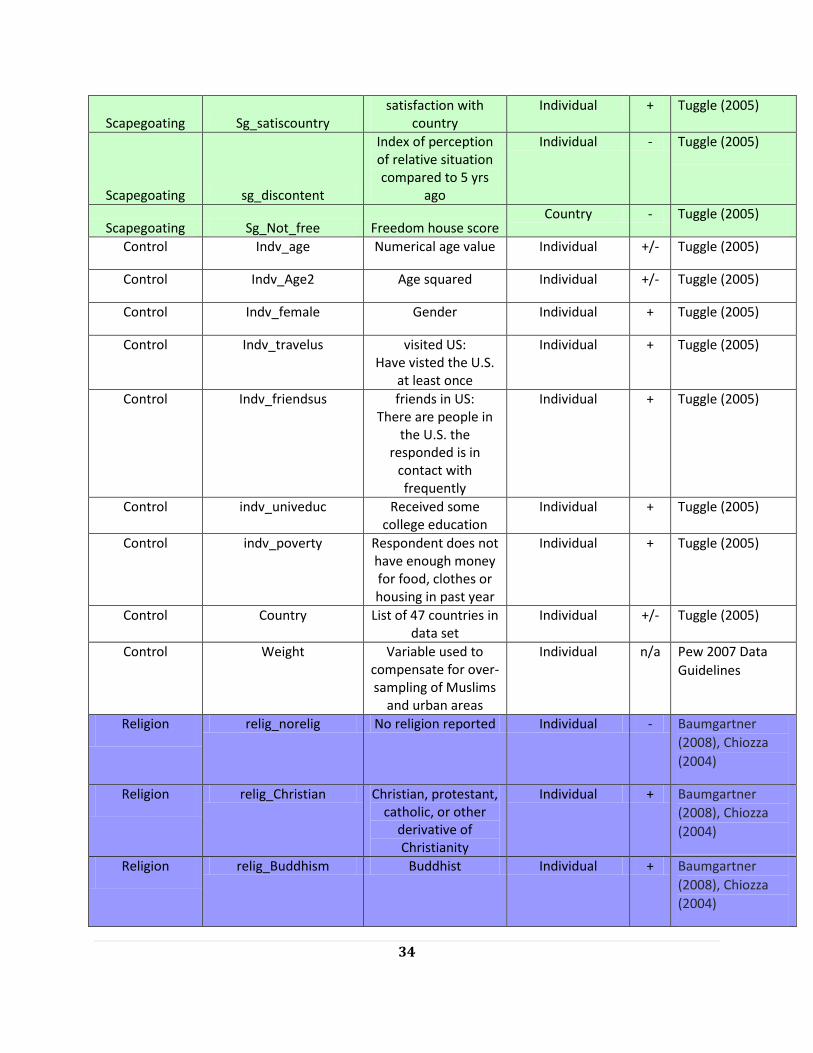
of independent variables are further described in Exhibit 4 below. The model will also utilize
the main categories of control variables, namely scapegoat, policy disagreement, media and
individual-level variables, to control for any additional explanations for opinion of the United
States.
Exhibit 4: Matrix of Expected Relationships:
Type Variable Definition Measurement
Level
Sign Justification
Dependent favUSdummy Individuals with
favorable and
unfavorable
perceptions of the
United States
Individual N/A Tuggle (2005)
Culture Cult_likeamscitech like/ dislike American
science & tech Individual +/- Tuggle (2005)
Culture cult_likeampopcltr like/ dislike American
music movies tv Individual + Tuggle (2005)
Culture cult_amricnztngd
spread of American ideas/ customs good/
bad
Individual + Tuggle (2005)
Culture cult_likedemcrcy like/dislike American
democracy Individual + Tuggle (2005)
Culture cult_likeambiz like/dislike American
business Individual + Tuggle (2005)
Culture Cult_womenpol Women make better
political leaders Individual + Tuggle (2005)
Culture cult_menpol Men make better Individual - Heiman & Ozer

31
political leaders (2005)
Culture cult_women_menpol
Women and men make equally good
political leaders
Individual + Heiman & Ozer
(2005)
Culture Cult_wommarr
The woman should choose who she
marries
Individual + Tuggle (2005)
Culture cult_fammarr
The family should choose who a
woman marries
Individual - Tuggle (2005)
Culture cult_bothmarr
Both a woman and her family should choose who she
marries
Individual + Tuggle (2005)
Culture succoutcntrl
success circumstances outside of our
control
Individual - Tuggle (2005)
Huntington Hunt_afr
Huntington’s Cultural Indicator—Non-Muslim African
countries
Country + Tuggle (2005)
Huntington
Hunt_hindu
Huntington’s Cultural Indicator—Hindu countries (India,
Bangladesh)
Country +/- * Hindu left out of
Tuggle’s 2005
study
Huntington
Hunt_islam
Huntingtons’ cultural indicator—Muslim countries (Middle East, Central Asia,
North Africa)
Country - Tuggle, 2005,
Huntington
Hunt_japan Huntingtons’ cultural
indicator—Japan
Country + * Japan left out of
Tuggle’s 2005
study
Huntington
Hunt_latin
Huntingtons’ cultural indicator—Latin
American countries
Country +/- Tuggle (2005); Fox
(2002)
Huntington
Hunt_sinic
Huntingtons’ cultural indicator—
Sino/Confucian countries
(South Korea, China, Taiwan)
Country +/- Tuggle (2005); Fox
(2002)
Huntington Hunt_slavic
Huntington’s cultural indicator—
Country + Tuggle (2005); Fox

32
Slavic/Orthodox (Former Soviet Bloc)
(2002)
Huntington
Hunt_western
Huntington’s cultural indicator—Western
(U.S., Canada, Australia, New Zealand, West.
Europe)
Country + Tuggle (2005); Fox
(2002)
Inglehart/Welzel Iw_tradrat
Ingelhart/ Welzel Traditional/ Rational:
measures a shift from economic and physical security to one of subjective well-being, self-expression and quality of life
Country + Welzel & Inglehart
(2002)
Inglehart/Welzel Iw_survself
Ingelhart/ Welzel Survival/ Self:
those countries where religion plays
a primary importance
Country - Welzel & Inglehart
(2002)
Hofstede Hof_Pdi
Hofstede: Power Distance
the extent to which the less powerful
accept inequality as normal
Country + Heiman & Ozer
(2004)
Hofstede
Hof_Lto
Hofstede: Long-Term Orientation
Country - Heiman & Ozer
(2004)
Hofstede
Hof_mas
Hofstede: Masculinity Index referring to clearly
defined gender roles—as opposed to
“femininity” which allows for greater equality of roles
between men and women
Country - Heiman & Ozer
(2004)
Hofstede
Hof_Idv
Hofstede: Individualism
feelings of allegiance to one’s self and one’s immediate
Country + Heiman & Ozer
(2004)

33
family—opposed to collectivist cultures
which are more clan like and provides
protection for permanent loyalty
Hofstede
Hof_uai
Hofstede: Uncertainty Avoidance
referring to feelings towards unclear and
undefined circumstances
Country - Heiman & Ozer
(2004)
Media Med_news1tv
TV primary media used
Individual +/ Tuggle (2005)
Media med_news1paper
Newspaper primary media used
Individual +/ Tuggle (2005)
Media med_news1radio
Radio primary media used
Individual +/ Tuggle (2005)
Media med_news1mag
Magazine primary media used
Individual +/ Tuggle (2005)
Media med_news1internet
Internet primary media used
Individual +/ Tuggle (2005)
Media med_news1other primary media used:
other Individual +/- Tuggle (2005)
Policy Disagreements Pol_prowarterror
favor or oppose US led fight against
terror
Individual + Tuggle (2005)
Policy Disagreements Pol_staycourseiraq
keep military troops in Iraq
Individual + Tuggle (2005)
Policy Disagreements Pol_staycourseafg
keep military troops in Afghanistan
Individual + Tuggle (2005)
Policy Disagreements Pol_nuclear
Nuclear issues greatest threat to the
world
Individual +/- Tuggle (2005)
Policy Disagreements Pol_enviro
Environmental issues greatest threat to the
world
Individual +/- Tuggle (2005)
Scapegoating Sg_satisinc satisfaction with
household income Individual + Tuggle (2005)
Scapegoating Sg_Satisfam satisfaction with
family life Individual + Tuggle (2005)
Scapegoating Sg_Satisjob satisfaction with job Individual + Tuggle (2005)
Scapegoating sg_succoutcntrl Success is outside of
our control Individual + Tuggle (2005)
34
Scapegoating Sg_satiscountry satisfaction with
country Individual + Tuggle (2005)
Scapegoating sg_discontent
Index of perception of relative situation compared to 5 yrs
ago
Individual - Tuggle (2005)
Scapegoating Sg_Not_free Freedom house score Country - Tuggle (2005)
Control Indv_age Numerical age value Individual +/- Tuggle (2005)
Control Indv_Age2 Age squared Individual +/- Tuggle (2005)
Control Indv_female Gender Individual + Tuggle (2005)
Control Indv_travelus visited US: Have visted the U.S.
at least once
Individual + Tuggle (2005)
Control Indv_friendsus friends in US: There are people in
the U.S. the responded is in
contact with frequently
Individual + Tuggle (2005)
Control indv_univeduc Received some college education
Individual + Tuggle (2005)
Control indv_poverty Respondent does not have enough money for food, clothes or housing in past year
Individual + Tuggle (2005)
Control Country List of 47 countries in data set
Individual +/- Tuggle (2005)
Control Weight Variable used to compensate for over-sampling of Muslims
and urban areas
Individual n/a Pew 2007 Data
Guidelines
Religion relig_norelig No religion reported Individual - Baumgartner
(2008), Chiozza
(2004)
Religion relig_Christian Christian, protestant, catholic, or other
derivative of Christianity
Individual + Baumgartner
(2008), Chiozza
(2004)
Religion relig_Buddhism Buddhist Individual + Baumgartner
(2008), Chiozza
(2004)

35
Religion relig_Other Religion not included on list
Individual + Baumgartner
(2008), Chiozza
(2004)
Religion Relig_Muslim Muslim Individual - Baumgartner
(2008), Chiozza
(2004)
Religion relig_Hindu Hindu Individual + Baumgartner
(2008), Chiozza
(2004)
Religion Indvi_religiosity_dummy Prays More than once/day
Individual - Baumgartner
(2008), Chiozza
(2004)
In total, this analysis employs four key hypotheses measuring the effect of different cultural
indicators on favorability towards the United States. Each of the four hypotheses utilize the same
dependent variable of favorability towards the United States, and the same core groups of independent
variables including media, policy, scapegoat, culture (broadly defined) and individual-level controls such
as age and gender. Correlation matrices for each of the hypotheses are included in Exhibit 8 in the
Appendix. It is important to note that in initial regressions, there were a large number of variables with
missing observations. For example, the “friends in the U.S.” variable has 30,020 observations missing
out of 45,239 responses. In order to ensure these smaller sample sizes were representative of the larger
45,000 observations across all regressions, a simple frequency analysis was conducted to identify
percentages of certain key independent variables. They were similar across each of the Models. See
Exhibit 6 for a full list of these variables.
Exhibit 6: Ensuring Consistency in Frequencies of Key Independent Variables between Full Sample and Smaller Samples
Key Variables Full Pew
2007 Observations
Hypothesis I:
Religion
Hypothesis II:
Huntington
Hypothesis III:
Hofstede
Hypothesis IV:
I/W
# 45,239 6,808 7,121 7260 4,756

36
Observations MEDIA: Internet
Primary News Source
4% 4% 3% 2% 3%
POLICY: Favor US Anti-
Terrorism 44% 46% 46% 52% 45%
CULTURE: Likes
American Democracy
45% 51% 52% 55% 51%
CULTURE: Satisfied with
Country 38% 31% 31% 39% 34%
CONTROL: In Poverty
20% 20% 20% 25% 20%
CONTROL: Some
University Education
26% 31% 31% 23% 29%
CONTROL: Female
51% 45% 45% 47% 47%
RELIGION: Muslim
31% 48% 48% 27% 46%
HUNTINGTON: Muslim
35% n/a 62% n/a n/a
HOFSTEDE: Individualism
Mean: 41.9 n/a n/a Mean:31.6 n/a
I/W: Survival/ Self
Mean: -1.66 n/a n/a n/a Mean: -.368
The smaller sample sizes for each hypothesis did not vary significantly from the larger sample.
The instances where the frequencies of key independent variables in the smaller sample did vary more
than 10 percentage points from the larger sample are highlighted in yellow in the above table. Notably,
the frequency of Muslim respondents in Models I, II and IV are significantly greater than in the larger
sample. This fact might be explained by the oversampling of Muslim respondents in the Pew Global
Attitudes 2007 study, as previously mentioned. In order to counteract this fact, the corrective “weight”
variable was utilized in each regression in order to normalize the frequencies of Muslim respondents
from each country.

37
MODEL I: RELIGION6
Specification 1: Muslim respondents will have lower opinions of the United States
Specification 2: Results of key Independent Variables on Individual-Level Muslim Religion will be no
different on the Muslim sub-sample
Specification 1: Dependent Variable: Favorability Towards the US Indicator: dep_favusdummy =
Media = med_news1paper med_news1radio med_news1mag med_news1internet med_news1other Policy = pol_nuclear pol_enviro pol_staycourseiraq pol_staycourseafg pol_prowarterror Scapegoat = sg_not_free sg_satiscountry sg_employ sg_discontent Culture = cult_amricnztngd cult_likedemcrcy cult_likeambiz cult_likeampopcltr cult_likeamscitech cult_menpol cult_women_menpol cult_fammarr cult_bothmarr Control = indv_female indv_age indv_travelus indv_friendsus indv_poverty indv_univeduc weight Religion = relig_norelig relig_Christian relig_Buddhism relig_Hindu relig_Other
Specification 2: Dependent Variable: Favorability Towards the US Indicator:
*Run on sub-sample where relig_Islam = 1*
dep_favusdummy =
Media = med_news1paper med_news1radio med_news1mag med_news1internet med_news1other Policy = pol_nuclear pol_enviro pol_staycourseiraq pol_staycourseafg pol_prowarterror Scapegoat = sg_not_free sg_satiscountry sg_employ sg_discontent Culture = cult_amricnztngd cult_likedemcrcy cult_likeambiz cult_likeampopcltr cult_likeamscitech cult_menpol cult_women_menpol cult_fammarr cult_bothmarr Control = indv_female indv_age indv_travelus indv_friendsus indv_poverty indv_univeduc weight
MODEL II: HUNTINGTON
Specification I: Huntington’s “Islam” indicator will have an inverse relationship with favorability towards
the United States
6 Models 1 & 2 were also run on the Muslim sub-samples, to dig deeper into individual-level and country-level Muslim views of the United States.

38
Specification II: Results of Key Independent Variables on Country-Level Muslim Religion Sub-sample
(Huntington) will be no different than larger population
Specification 1: Dependent Variable: Favorability Towards the US Indicator dep_favusdummy =
Media = med_news1paper med_news1radio med_news1mag med_news1internet
med_news1other Policy = pol_nuclear pol_enviro pol_staycourseiraq pol_staycourseafg
pol_prowarterror
Scapegoat = sg_satiscountry sg_employ sg_discontent
Culture = cult_amricnztngd cult_likedemcrcy cult_likeambiz cult_likeampopcltr
cult_likeamscitech cult_menpol cult_women_menpol cult_fammarr cult_bothmarr
Control = indv_female indv_age indv_travelus indv_friendsus indv_poverty indv_univeduc
weight
Huntingon = hunt_western hunt_slavic hunt_sinic hunt_latin hunt_japan hunt_hindu hunt_afr
*The “Not Free” Variable was excluded from this model due to Collinearity*
Specification 2: Dependent Variable: Favorability Towards the US Indicator
*Run on sub-sample where hunt_Muslim = 1*
dep_favusdummy =
Media = med_news1paper med_news1radio med_news1mag med_news1internet
med_news1other Policy = pol_nuclear pol_enviro pol_staycourseiraq pol_staycourseafg
pol_prowarterror
Scapegoat = sg_not_free sg_satiscountry sg_employ sg_discontent
Culture = cult_amricnztngd cult_likedemcrcy cult_likeambiz cult_likeampopcltr
cult_likeamscitech cult_menpol cult_women_menpol cult_fammarr cult_bothmarr
Control = indv_female indv_age indv_travelus indv_friendsus indv_poverty indv_univeduc
weight
MODEL III: HOFSTEDE7
7 Initial regressions on Model III demonstrated poor model diagnostics. Upon analysis, few respondents with data available on Hofstede’s indicators provided an answer to the “friends in the US” variable and the variable

39
Model III: Hofstede’s cultural indicators of Power Distance, Masculinity and Independence will have
inverse relationships with opinion of the United States.
Dependent Variable: Favorability Towards the US Indicator
dep_favusdummy =
Media = med_news1paper med_news1radio med_news1mag med_news1internet
med_news1other Policy = pol_nuclear pol_enviro pol_staycourseiraq pol_staycourseafg
pol_prowarterror
Scapegoat = sg_not_free sg_satiscountry sg_employ sg_discontent
Culture = cult_amricnztngd cult_likedemcrcy cult_likeambiz cult_likeampopcltr
cult_likeamscitech cult_menpol cult_women_menpol cult_fammarr cult_bothmarr
Control = indv_female indv_age indv_travelus (indv_friendsus) indv_poverty indv_age2
indv_univeduc weight
Hofstede = hof_pdi hof_idv hof_mas hof_uai hof_lto
was removed. The removal of this variable does pose questions of bias as having friends in the United States would logically improve an individual’s perception of the country.

40
MODEL IV: INGELHART/ WELZEL
MODEL IV: Ingelhart/ Welzel's Cultural Variable on Favorability Towards the United States
Dependent Variable: Favorability Towards the US Indicator
dep_favusdummy =
Media = med_news1paper med_news1radio med_news1mag med_news1internet med_news1other Policy = pol_nuclear pol_enviro pol_staycourseiraq pol_staycourseafg pol_prowarterror Scapegoat = sg_not_free sg_satiscountry sg_employ sg_discontent Culture = cult_amricnztngd cult_likedemcrcy cult_likeambiz cult_likeampopcltr cult_likeamscitech cult_menpol cult_women_menpol cult_fammarr cult_bothmarr Control = indv_female indv_age indv_travelus indv_friendsus indv_poverty indv_univeduc weight Ingelhart/Welzel= iw_tradrat_values iw_survself_values
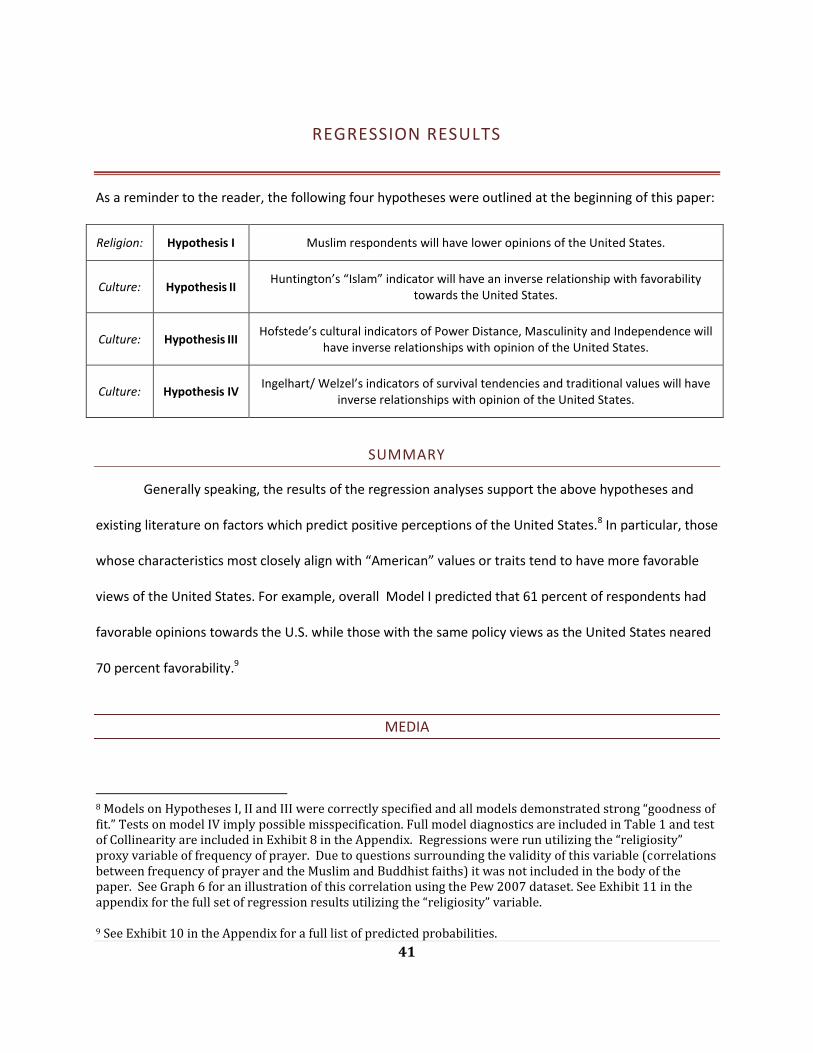
41
REGRESSION RESULTS
As a reminder to the reader, the following four hypotheses were outlined at the beginning of this paper:
Religion: Hypothesis I Muslim respondents will have lower opinions of the United States.
Culture: Hypothesis II Huntington’s “Islam” indicator will have an inverse relationship with favorability
towards the United States.
Culture: Hypothesis III Hofstede’s cultural indicators of Power Distance, Masculinity and Independence will
have inverse relationships with opinion of the United States.
Culture: Hypothesis IV Ingelhart/ Welzel’s indicators of survival tendencies and traditional values will have
inverse relationships with opinion of the United States.
SUMMARY
Generally speaking, the results of the regression analyses support the above hypotheses and
existing literature on factors which predict positive perceptions of the United States.8 In particular, those
whose characteristics most closely align with “American” values or traits tend to have more favorable
views of the United States. For example, overall Model I predicted that 61 percent of respondents had
favorable opinions towards the U.S. while those with the same policy views as the United States neared
70 percent favorability.9
MEDIA
8 Models on Hypotheses I, II and III were correctly specified and all models demonstrated strong “goodness of fit.” Tests on model IV imply possible misspecification. Full model diagnostics are included in Table 1 and test of Collinearity are included in Exhibit 8 in the Appendix. Regressions were run utilizing the “religiosity” proxy variable of frequency of prayer. Due to questions surrounding the validity of this variable (correlations between frequency of prayer and the Muslim and Buddhist faiths) it was not included in the body of the paper. See Graph 6 for an illustration of this correlation using the Pew 2007 dataset. See Exhibit 11 in the appendix for the full set of regression results utilizing the “religiosity” variable. 9 See Exhibit 10 in the Appendix for a full list of predicted probabilities.

42
The media variables were significant across the board, save for Model III with Hofstede’s cultural
indicators. Newspapers, television and the internet consistently showed the most significant explanatory
power over favorability towards the United States. Surprisingly, all of the media variables listed as
significant (newspapers, tv, magazines and the internet) were associated with more negative opinions
towards the United States. Those who listed newspapers and the internet as primary news sources had
the strongest predicative power over negative opinions towards the United States; and those who utilize
the internet as their primary news source were five percentage points less likely to have favorable
opinions towards the United States than their newspaper-reading counterparts. This supports both
Chiozza’s and Tuggle’s earlier findings.
POLICY
All of the policy variables showed significance across the board, save for those who listed nuclear non-
proliferation and the environment as policy priorities. The significance of these latter two categories
varied from model to model. As with Tuggle’s study, those respondents who indicated the environment
is a policy priority tended to be less favorable towards the United States, perhaps reflecting the United
State’s reluctance to sign-on to agreements which set international emission standards like the Kyoto
Protocol. There was a strong positive relationship between those who agreed with the U.S. war on
terror and those with positive perceptions of the United States— 70 percent of those agreeing with
counter-terrorism efforts demonstrated positive perceptions of the United States, compared to 52% of
those who indicated the environment as a policy priority.
SCAPEGOAT
Freedom Houses’ “not free” indicator was found to be a significant determinant of negative opinions
towards the United States across the board. Slightly less than half of those respondents from “not free”

43
countries had a positive view of the United States. These findings support Tuggle’s hypothesis of mis-
placed ill-will towards the United States due to domestic dissatisfaction. In the only model without the
“not free” variable—Hofstede’s—the satisfaction with one’s country variable becomes significant and
positive. This is a departure from Tuggle’s findings where all of the “scapegoating” set of variables were
found to be significant.
CULTURE
Not surprisingly, those who like various aspects of American culture are found to have positive and
significant predicative power over favorability towards the United States. This does not come as much
of a surprise; it logically follows that those who like American movies, democracy, or science and
technology would also have favorable views of the U.S. Amongst those who feel globalization is having
a positive impact on the world, 64 percent cite favorable opinions towards the United States. In another
departure from the literature (Tuggle, Carlson & Nisbet), the majority of the variables which pertain to
the role of women in society were found to be insignificant. However, those who feel it is both the
woman and her family’s role to choose whom a woman marries were found to have more negative
opinions towards the U.S.
CONTROL
The individual “control” variables which demonstrated the most significance included women, those
with friends in the United States and those with a University education. As in Chiozza, 2004, women and
those with friends in the U.S. are found to have more positive views of the United States; as
respondents increase in age and have “university –level education” they tend to have more negative
views of the United States. Although initially contrary to logic, Chiozza argued the University
conundrum might be explained by the fact that University-education leads to greater access to

44
information and depth of thought, leading to more nuanced perceptions of the United States. The age
variable supports Chiozza’s and Carlson’s results, however in order to fully understand the “age effect”
on favorable opinions towards the United States, categories of age ranges would need to be included in
the model. The next section will delve into the variables of interest in each separate model.
MODEL I: RELIGION
Each of the religion variables in the model demonstrated explanatory power over favorable
opinions towards the United States. Moreover, each religion reported more favorable opinions towards
the United States than those who self-identified as Muslims. The predicted probability a Muslim
respondent favored the United States was only 45 percent, compared to an average of 61 percent for
the full model. This mirrors the results presented in the literature. In the model, Buddhist, Christian and
Hindu respondents demonstrated the highest predicted probability of favorability towards the United
States.10
MODEL II: HUNTINGTON
As with Model I, all of Huntington’s cultural variables demonstrate explanatory power over
favorable opinions towards the United States.11 Reflecting the literature and the initial hypothesis,
respondents who belong to Huntington’s Muslim “culture” demonstrate less favorable views of the
United States compared to other “cultures” in the sample. As with Hypothesis I, the Hindu “culture”
demonstrated the strongest predicative power over favorability towards the United States; the model
predicts 73 percent of Hindu respondents will have favorable opinions towards the United States,
holding all else constant. This differs dramatically from the 61 percent average for the model.
10 The Jewish religion and respondents from China were dropped from the model due to collinearity. 11Both the Japanese and “Sinic” (Chinese) cultures were dropped from the model due to collinearity.

45
The reader is reminded that Huntington’s cultural values are assigned on a country-level basis
and are largely religion based; thus this model contains an inherent control for variations in religion by
country.
MODEL III: HOFSTEDE12
As the previous two models, the full set of Hofstede variables were found to have some
predicative power over favorable opinions towards the United States. Those cultural traits found to be
most consistent with “Arab” cultures in Hofstede’s theory have more negative views of the United
States. Specifically, those countries with a tendency to accept inequality as normal had 54 percent
favorable opinions of the United States and those who dislike uncertainty tended to have less favorable
views towards the United States; only 44 percent of the sample had favorable opinions. Interestingly, as
can be seen from Chart 10 below, on Hofstede’s cultural indicators high scores on indicators in “Arab”
cultures tend to be low scores in the United States. Those indicators where the polarity between the
U.S. and “Arab” countries is most extreme (power distance, uncertainty avoidance and individualism)
are also those indicators which are correlated with negative perceptions of the United States. The
cultural trait with the closest scores between the United States and the “Arab World” –Masculinity—is
also the trait which is associated with positive opinions towards the United States. As many as 93
12 The Hofstede regression resulted in a dramatic decrease in observations from roughly 7,000 for Hypothesis I to roughly 2,000 for Hypothesis III. Moreover, the full set of media variables, scapegoat variables and nearly all of the individual-level variables become insignificant in the model, demonstrating potential model misspecification. In an analysis of potential causes for this dramatic discrepancy, the variable “friends in the US” was identified as having a significant number of missing observations. A similar regression was run without the “friends in the US” variable and the model diagnostics improved significantly. Both of the Hofstede regressions with and without the “friends in the US” variable are presented in Exhibit 9 in the Appendix. When the “friends in the US” variable is removed from Hypothesis III, the sample size increases to nearly 6,000 and the coefficients on independent variables much more closely mirror that of the previous two regressions. The absence of this variable may present issues of omitted variable bias, in particular as having friends in the United States would understandably have some predicative power over favorable opinions of the United States. However, when this variable is dropped from the model all of Hofstede’s variables become statistically significant and model diagnostics remain at relatively the same level.

46
percent of those respondents who support equity in gender roles have favorable opinions towards the
United States.
Although we cannot make any suppositions regarding causality, this finding demonstrates that
those countries with cultural values more similar to the United States tend to be more favorable to the
United States.
A final element of interest is that the full set of media variables become insignificant in
Hofstede’s model, save for the “internet as primary news source” variable. This phenomenon might be
explained if Hofstede’s indicators account for some other hidden element—such as social class or
physical location in an urban/rural setting—which has some correlation to media consumption.
MODEL IV: INGLEHART/ WELZEL
Both of Ingelhart & Welzel’s indicators of Survival/Self and Traditional/Rational demonstrate
explanatory power over favorability towards the United States in the model. Both indicators vary on a

47
scale from -2 to 2; as numbers increase from a negative to positive sign, this reflects a more “self-
oriented” subjective quality -of-life-oriented existence, and a greater acceptance of secular/rational
values which break from tradition on family roles, deference to authority and perceptions of divorce,
abortion, euthanasia and suicide. Graph 11 below compares the values on each scale between
predominantly Muslim countries and the United States.
Given the findings in the other models, one would expect that those countries with scores which
mimic those of the United States (in this case traditional/rational) would hold more positive views
towards the United States; and those countries with scores which diverge from the United States (in this
case survival/self) would be associated with a negative view towards the United States.
Surprisingly, the regression results suggest that countries which score higher on both the
survival/self values and the traditional/rational variables are more likely to have favorable opinions of
the United States. This final point diverges from the trend and creates an interesting point for analysis.
According to I/W’s categorization, as groups move more towards a “rational” “self-orientation” and
48
away from a focus on immediate survival needs of economic and physical security and traditional roles
of family, marriage and the parent/ child relationship, they will tend to have more favorable opinions
towards the United States. Although American culture is found to be “traditional” on the
Ingelhart/Welzel scale, it is clear that the value of “rationality” or others perceptions of American values
of “rationality” are associated with positive opinions towards the United States.

49
Table 1: Regression Results of Four Hypotheses on Favorability Towards the United States
Variable Type Variable List (1) (2) (3) (4) Religion Huntington Hofstede Ingelhart/Welzel
Dependent Favorability
Towards U.S.
Media med_news1pape
r 0.653*** 0.650*** 0.902 0.645**
(0.083) (0.080) (0.117) (0.094)
Media med_news1tv 0.634*** 0.652*** 0.867 0.685*** (0.055) (0.057) (0.078) (0.073)
Media med_news1mag 0.356* 0.342* 1.366 0.363* (0.146) (0.153) (0.680) (0.157)
Media med_news1inter
net 0.496*** 0.507*** 0.569* 0.515**
(0.082) (0.084) (0.137) (0.112)
Media med_news1other 0.349* 0.404 1.464 0.740 (0.172) (0.188) (0.832) (0.399)
Policy pol_enviro 0.912 0.771*** 0.992 0.833* (0.059) (0.053) (0.073) (0.066)
Policy pol_staycourseir
aq 0.749*** 1.720*** 1.253** 1.973***
(0.052) (0.207) (0.097) (0.290)
Policy pol_staycourseaf
g 1.716*** 1.411** 1.533*** 1.457**
(0.206) (0.162) (0.189) (0.200)
Policy pol_prowarterror 1.450** 3.003*** 1.306* 2.945*** (0.167) (0.198) (0.152) (0.234)

50
Policy pol_nuclear 2.785*** 0.904 2.114*** 0.855* (0.190) (0.057) (0.156) (0.067)
Scapegoat sg_not_free 0.659*** 0.707*** 0.416*** (0.062) (0.067) (0.056)
Scapegoat sg_satiscountry 1.114 1.040 1.517*** 1.005 (0.075) (0.068) (0.111) (0.078)
Scapegoat sg_employ 1.025 1.064 1.026 1.185* (0.072) (0.073) (0.074) (0.097)
Scapegoat sg_discontent 0.964 1.009 1.019 1.007 (0.060) (0.061) (0.067) (0.073)
Culture cult_likedemcrcy 2.576*** 1.823*** 1.875*** 1.835*** (0.198) (0.123) (0.160) (0.152)
Culture cult_likeambiz 1.842*** 1.527*** 1.739*** 1.769*** (0.126) (0.104) (0.138) (0.149)
Culture cult_likeampopcl
tr 1.523*** 1.261*** 1.465*** 0.984
(0.106) (0.082) (0.114) (0.079)
Culture cult_likeamscitec
h 1.160* 1.490*** 1.763*** 1.417***
(0.078) (0.127) (0.145) (0.141)
Culture cult_amricnztngd 1.444*** 2.925*** 1.518*** 2.359*** (0.125) (0.221) (0.128) (0.221)
Culture cult_menpol 0.975 0.912 0.971 1.359* (0.108) (0.099) (0.116) (0.197)
Culture cult_women_me
npol 0.940 0.998 1.117 1.197

51
(0.100) (0.104) (0.123) (0.164)
Culture cult_fammarr 0.938 0.825 0.801* 1.010 (0.093) (0.081) (0.089) (0.125)
Culture cult_bothmarr 0.904 0.818** 0.766** 0.925 (0.067) (0.059) (0.065) (0.084)
Control indv_female 1.221** 1.265*** 1.344*** 1.376*** (0.081) (0.082) (0.096) (0.109)
Control indv_age 0.983 0.986 0.984 0.994 (0.010) (0.010) (0.010) (0.012)
Control indv_travelus 1.149 1.208 1.243 1.268 (0.129) (0.131) (0.287) (0.176)
Control indv_friendsus 1.391*** 1.424*** 1.547*** (0.088) (0.088) (0.119)
Control indv_poverty 0.879 0.903 1.193* 1.041 (0.071) (0.070) (0.092) (0.102)
Control indv_age2 1.000 1.000 1.000 1.000 (0.000) (0.000) (0.000) (0.000)
Control indv_univeduc 0.815** 0.842** 1.088 0.981 (0.056) (0.056) (0.094) (0.081)
Control weight 0.894 0.877* 1.449** 0.995 (0.052) (0.051) (0.189) (0.141) 0.902
Religion relig_norelig 1.761** (0.328)
Religion relig_Christian 2.244*** (0.159)

52
Religion relig_Buddhism 3.650*
(1.891)
Religion relig_Hindu 2.128*** (0.474)
Religion relig_Other 1.329 (0.282)
Huntington hunt_western 1.815** (0.386)
Huntington hunt_slavic 1.873* (0.512)
Huntington hunt_latin 1.251* (0.110)
Huntington hunt_hindu 2.037** (0.443)
Huntington hunt_afr 1.640*** (0.206)
Hofstede hof_pdi 0.917*** (0.014)
Hofstede hof_idv 0.971*** (0.008)
Hofstede hof_mas 1.116*** (0.021)
Hofstede hof_uai 0.968*** (0.004)
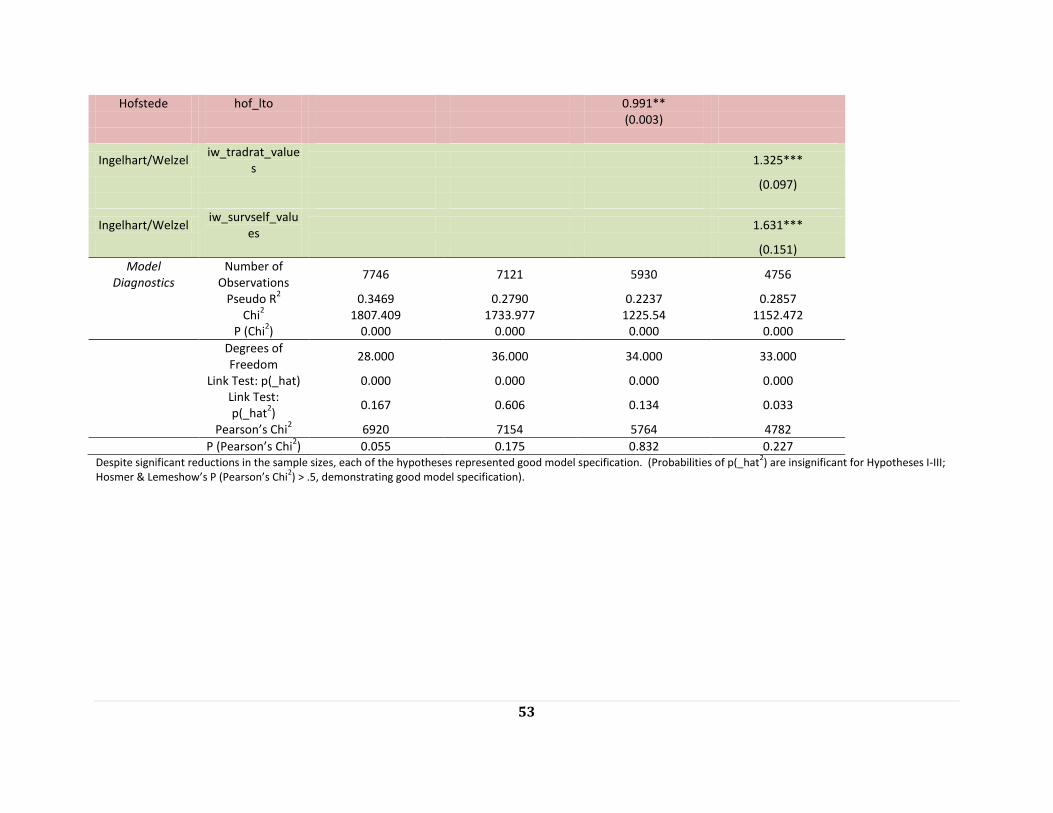
53
Hofstede hof_lto 0.991** (0.003)
Ingelhart/Welzel iw_tradrat_value
s 1.325***
(0.097)
Ingelhart/Welzel iw_survself_valu
es 1.631***
(0.151)
Model Diagnostics
Number of Observations
7746 7121 5930 4756
Pseudo R2 0.3469 0.2790 0.2237 0.2857
Chi2 1807.409 1733.977 1225.54 1152.472
P (Chi2) 0.000 0.000 0.000 0.000
Degrees of Freedom
28.000 36.000 34.000 33.000
Link Test: p(_hat) 0.000 0.000 0.000 0.000
Link Test: p(_hat
2)
0.167 0.606 0.134 0.033
Pearson’s Chi2 6920 7154 5764 4782
P (Pearson’s Chi2) 0.055 0.175 0.832 0.227
Despite significant reductions in the sample sizes, each of the hypotheses represented good model specification. (Probabilities of p(_hat2) are insignificant for Hypotheses I-III;
Hosmer & Lemeshow’s P (Pearson’s Chi2) > .5, demonstrating good model specification).

54
REGRESSION RESULTS: MUSLIM DEPENDENT VARIABLE
The earlier results confirmed the existing literature on the relationship between religion and
favorability towards the United States; individuals of the Muslim faith tend to have more negative views
towards the United States than other religious groups. To dig deeper into this finding, two additional
regressions were run using solely the “Muslim” sub-population utilizing alternatively the self-reported
religion category, and Huntington’s country-level “Islam” category. This analysis hopes to question
whether among Muslim communities, there are definitive characteristics or behaviors that can shed
light on the sources of negative opinions towards the United States.
The results for the sub-sample of Muslim respondents largely mirrored the results from the full
sample from the survey. However, regressions run on the sub-sample demonstrated more pronounced
results across the variables of interest. For example, while in the full sample, those who support the war
on terror are 13 percentage points more likely than the average to have positive views of the United
States, in the self-reported Muslim sub-sample, those who favor the war on terror are 35 percent points
more likely than the average respondent to have favorable views of the United States.13 One might
conclude that it is not the Muslim religion itself which is the root of negative perceptions of the United
States, but a multitude of other factors.
MEDIA
Those respondents who indicated television, magazines or the internet as a primary news
source were found to have statistically different and negative opinions towards the United States. TV
viewers had the strongest relationship with negative perceptions of the United States, a finding which
supports the pre-existing literature on media consumption in Muslim communities. (Nisbet, Nisbet, &
13 See Exhibit 10 in the appendix for a full list of predicted probabilities.

55
Scheufele, 2004) Interestingly, only 13 percent of those self-reported Muslims who rely on magazines as
their primary source of information had positive perceptions of the United States, compared to 40
percent in the full-sample.
POLICY
In the analysis utilizing only Muslims, nearly all of the policy variables were found to have strong
explanatory power over favorability towards the United States. As before, those who agree with the
general war on terror and wars in Iraq/ Afghanistan are found to have more positive views of the U.S.
and those who felt the environment is a policy priority were associated with more negative views of the
United States. Only 25 percent of those who feel the environment is the most important policy issue
have favorable views of the United States. In contrast to the broader group, the nuclear non-
proliferation variable becomes insignificant suggesting no relationship between those who think nuclear
disarmament is a priority and those who have positive views towards the United States.
SCAPEGOAT
As with the full sample, those countries listed as “not free” on Freedom House’s scale again are
associated with negative opinions towards the United States; supporting Tuggle’s hypothesis of
misplaced dissatisfaction. Only 22 percent of Muslim respondents in the sample from countries listed as
“not free” have favorable perceptions of the United States. As with the full-sample, those who are
employed, and those discontent with their present situation were not found to have any relationship
with opinions towards the United States.

56
CULTURE
Again, those Muslim respondents who like various aspects of American culture were found to have more
positive perceptions of the United States. Those who felt it was good that American ideas and culture
are spreading to their country had the strongest predicative power over favorable opinions towards the
United States. Although the variables pertaining to women’s role in society were again insignificant, it’s
worthwhile noting that those who felt women make better political leaders and those who feel the
woman should choose whom she marries was found to have a positive relationship with favorable views
of the United States.
CONTROLS
As with the full sample, women and those with friends in the United States were found to have more
positive views of the United States, and those with university education were found to have negative
opinions of the U.S. Only 26 percent of Muslim respondents with University education in the sample had
positive views of the United States. As people increase with age, they tend to have more negative views
towards the United States.

57
Table 2: Regression Results of Four Hypotheses on Favorability Towards the United States Utilizing Muslim Sub-Sample (1) (2) Variable Type Variable Name Model I: Religion Model II: Huntington
Dependent Favorability Towards the US Indicator Muslim (Individual Level)
Muslim (Country-Level)
Media Primary News Source Newspaper 0.839 0.719* (-0.96) (-2.01) Media Primary News Source TV 0.618*** 0.646*** (-4.07) (-3.99) Media Primary News Source Magazines 0.179* 0.240** (-2.34) (-2.80) Media Primary News Source Internet 0.403*** 0.503** (-3.45) (-3.05) Media Primary News Source Other 0.179 0.328 (-1.93) (-1.79) Policy Nuclear Weapons Policy Priority 0.960 0.941 (-0.43) (-0.74) Policy Environment Policy Priority 0.636*** 0.613*** (-4.18) (-5.11) Policy Keep Troops in Iraq 1.651** 1.606** (3.11) (3.14) Policy Keep Troops in Afghanistan 1.721*** 1.564** (3.41) (3.05) Policy Favor US-led efforts to fight terrorism 3.629*** 3.860*** (12.93) (15.08) Scapegoat Not Free Freedom House Scale 0.542*** 0.642*** (-4.55) (-4.18)
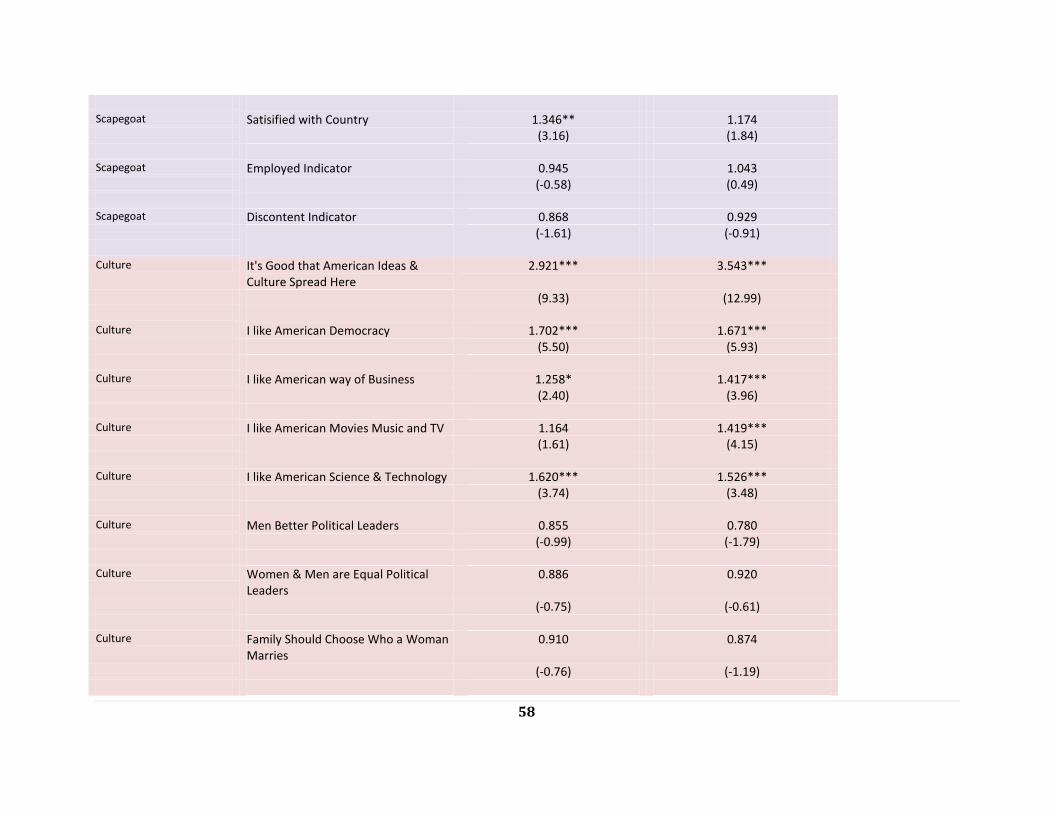
58
Scapegoat Satisified with Country 1.346** 1.174 (3.16) (1.84) Scapegoat Employed Indicator 0.945 1.043 (-0.58) (0.49) Scapegoat Discontent Indicator 0.868 0.929 (-1.61) (-0.91) Culture It's Good that American Ideas &
Culture Spread Here 2.921*** 3.543***
(9.33) (12.99) Culture I like American Democracy 1.702*** 1.671*** (5.50) (5.93) Culture I like American way of Business 1.258* 1.417*** (2.40) (3.96) Culture I like American Movies Music and TV 1.164 1.419*** (1.61) (4.15) Culture I like American Science & Technology 1.620*** 1.526*** (3.74) (3.48) Culture Men Better Political Leaders 0.855 0.780 (-0.99) (-1.79) Culture Women & Men are Equal Political
Leaders 0.886 0.920
(-0.75) (-0.61) Culture Family Should Choose Who a Woman
Marries 0.910 0.874
(-0.76) (-1.19)
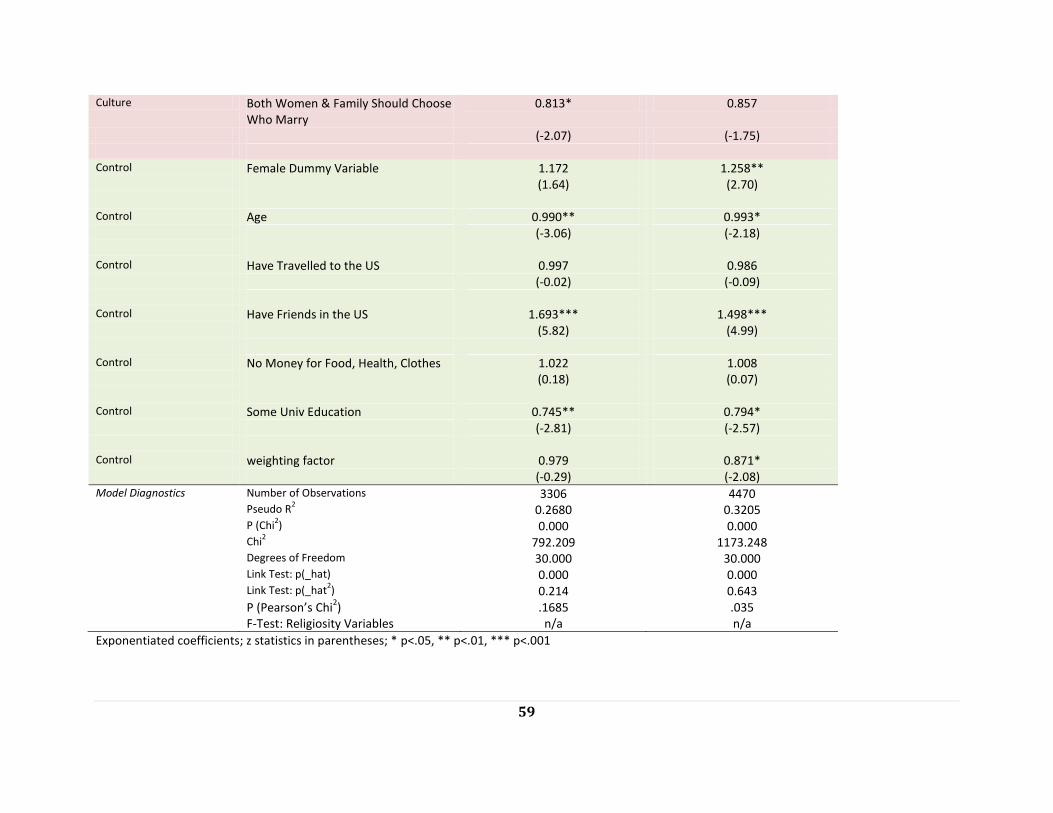
59
Culture Both Women & Family Should Choose Who Marry
0.813* 0.857
(-2.07) (-1.75) Control Female Dummy Variable 1.172 1.258** (1.64) (2.70) Control Age 0.990** 0.993* (-3.06) (-2.18) Control Have Travelled to the US 0.997 0.986 (-0.02) (-0.09) Control Have Friends in the US 1.693*** 1.498*** (5.82) (4.99) Control No Money for Food, Health, Clothes 1.022 1.008 (0.18) (0.07) Control Some Univ Education 0.745** 0.794* (-2.81) (-2.57) Control weighting factor 0.979 0.871* (-0.29) (-2.08) Model Diagnostics Number of Observations 3306 4470 Pseudo R
2 0.2680 0.3205
P (Chi2) 0.000 0.000
Chi2 792.209 1173.248
Degrees of Freedom 30.000 30.000 Link Test: p(_hat) 0.000 0.000 Link Test: p(_hat
2) 0.214 0.643
P (Pearson’s Chi2) .1685 .035
F-Test: Religiosity Variables n/a n/a
Exponentiated coefficients; z statistics in parentheses; * p<.05, ** p<.01, *** p<.001

60
Table 3: Summary of Findings from Regression Analyses
Variable Type Variable Name
Affect on Perceptions of
the United States
Strength of Finding*
Affect on Perceptions of the United States
(Muslim Communities)
Strength of Finding*
Media Newspapers
Primary Media Source
Negative Low n/a Low
Media T.V. Primary
Media Source Negative Medium Negative Low
Media Internet Primary
Media Source Negative Low Negative Low
Media Magazines
Primary News Source
Negative Low Negative Low
Policy Keep Troops in
Iraq Positive Low Positive Low
Policy Keep Troops in
Afghanistan Positive Low Positive Low
Policy Support War on
Terror Positive Very High Positive Very High
Policy Environment is Policy Priority
Negative Low Negative Low
Scapegoat “Not Free” Negative Low Negative Low
Culture
Spread of American Ideas and Culture is
Good
Positive Very High Positive Very High
Culture Like American
Democracy Positive High Positive Low
Culture Like American
Business Positive Medium Positive Low
Culture Like American TV/ Movies
Positive Low Positive Low
Culture Like American S&T
Positive Low Positive Low
Control Women Positive Low Positive Low

61
Control Have Friends in
the U.S. Positive Medium Positive Medium
Control Age Negative Low Negative Low
Control Some University Negative Low Negative Low
Religion Muslim Negative n/a
Huntington Muslim Negative n/a
Hofstede Power Distance
(Inequity) Negative Medium
Hofstede Individualism
(Self-or Family Oriented)
Negative Low
Hofstede Masculinity
(Equal Gender Roles)
Positive Medium
Hofstede Uncertainty Avoidance
Negative Medium
Hofstede Long-Term Orientation
Negative Low
Ingelhart/Welzel Move towards “rationality”
Positive Low
Ingelhart/Welzel Move towards
“self-orientation” Positive Medium
*Strength of finding is based on the size of the t-value.
62
POLICY IMPLICATIONS
The core results from this study support pre-existing literature that Muslim respondents tend to
have more negative perceptions of the United States. The results also support Tuggle’s prior analysis
that the form of media consumption, policy preferences, domestic conditions and other individual-level
factors have predicative power over favorability towards the United States. Finally, this study expanded
upon Tuggle’s analysis and found that cultural factors thought to be associated with Muslim
communities are associated with negative perceptions of the United States. Additionally, those
individuals with cultural values most similar to the United States tended to have the most favorable
opinions towards the U.S.
There are a few key take-aways which emerge from the previous analysis. First and foremost,
the reader is reminded that all definitions of culture, including those described in this study, are
inherently subjective. Definitions of culture provide useful simplifications of reality for analysis yet are
inherently faulty. The cultural factors utilized in this study were designated at the macro, national-level
and fail to represent the multitude of layers of variation and difference which constitute any nationality.
Defining a group by one indicator alone is an inherently dangerous prospect. For the reader and policy-
maker alike, it is important to play close attention to how culture is defined, and recognize these
limitations in any findings.
Secondly, although Muslims as a group, whether defined by religion or culture, tend to have
more negative perceptions of the United States, other factors which explain favorability towards the
United States are consistent from the full-sample to the sub-sample. This fact suggests that the profile
of those who are discontent with the United States is the same across the board, despite religion.
This finding suggests that our public diplomacy programming should not be altered in any way for
Muslim communities.
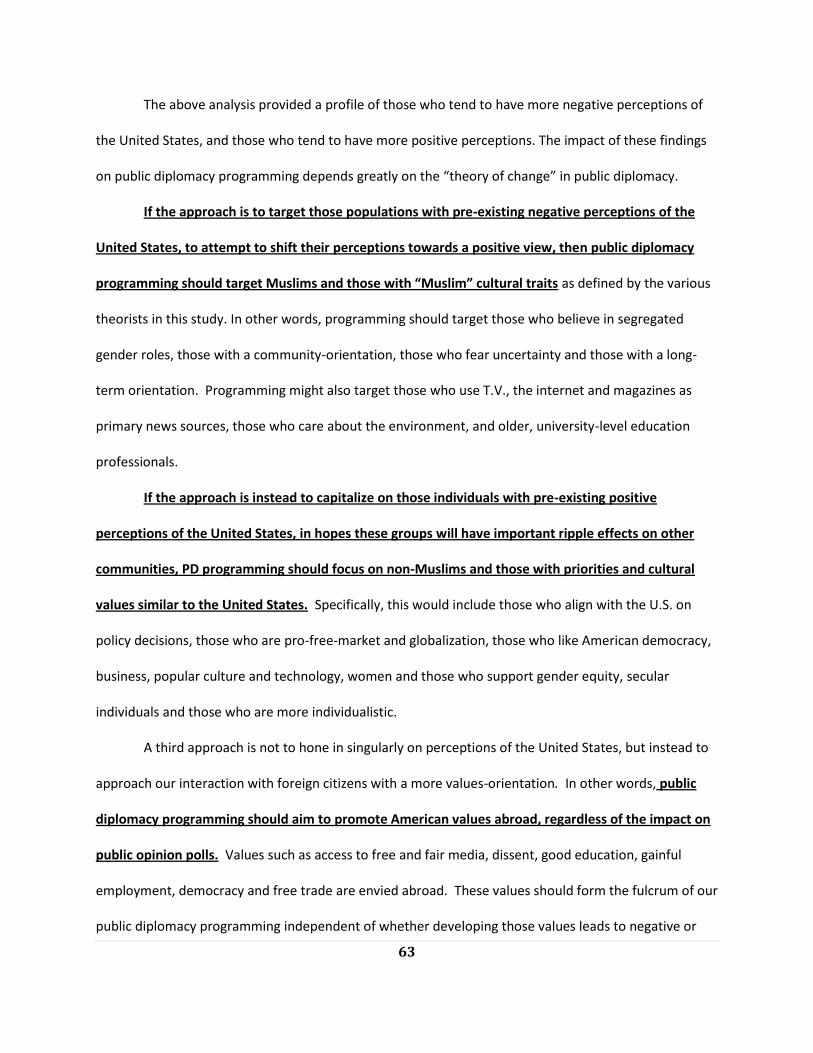
63
The above analysis provided a profile of those who tend to have more negative perceptions of
the United States, and those who tend to have more positive perceptions. The impact of these findings
on public diplomacy programming depends greatly on the “theory of change” in public diplomacy.
If the approach is to target those populations with pre-existing negative perceptions of the
United States, to attempt to shift their perceptions towards a positive view, then public diplomacy
programming should target Muslims and those with “Muslim” cultural traits as defined by the various
theorists in this study. In other words, programming should target those who believe in segregated
gender roles, those with a community-orientation, those who fear uncertainty and those with a long-
term orientation. Programming might also target those who use T.V., the internet and magazines as
primary news sources, those who care about the environment, and older, university-level education
professionals.
If the approach is instead to capitalize on those individuals with pre-existing positive
perceptions of the United States, in hopes these groups will have important ripple effects on other
communities, PD programming should focus on non-Muslims and those with priorities and cultural
values similar to the United States. Specifically, this would include those who align with the U.S. on
policy decisions, those who are pro-free-market and globalization, those who like American democracy,
business, popular culture and technology, women and those who support gender equity, secular
individuals and those who are more individualistic.
A third approach is not to hone in singularly on perceptions of the United States, but instead to
approach our interaction with foreign citizens with a more values-orientation. In other words, public
diplomacy programming should aim to promote American values abroad, regardless of the impact on
public opinion polls. Values such as access to free and fair media, dissent, good education, gainful
employment, democracy and free trade are envied abroad. These values should form the fulcrum of our
public diplomacy programming independent of whether developing those values leads to negative or

64
positive perceptions of the United States. The goal of public diplomacy should then be to foster
environments and agency to develop informed, intelligent citizens abroad, who can engage in reasoned,
rational debates on those points of dissention. It is precisely this type of exercise which may prevent the
types of “clashes of civilizations” which Huntington prophesized.
Secretary Clinton’s recent visit to Pakistan in October 2009 demonstrates the power of this sort
of open, values-based approach to public diplomacy. During a “townterview” 14 with local Pakistani
journalists in which Secretary Clinton fielded questions directly from the audience, media outlets
demonstrated more positive commentary after the Secretary allowed herself to be publicly criticized,
demonstrating the American value of dissent. Public diplomacy programming should mirror the best-
practices of this experience, and aim to forfeit some of the control of opinion in order to gain respect
and trust abroad.
To this end, much more emphasis should be placed on finding appropriate measures, outside
of public opinion polls, to quantify the effectiveness of public diplomacy programs. The deficit of other
measures for tracking public diplomacy effectiveness only perpetuates the mind-set that our goal should
be to make foreign audiences improve their perceptions of the United States.
14 A townhall/ interview style conversation favored by the Obama Administration.

65
CONCLUSION
In the previous analysis, Huntington’s “Clash of Civilizations” approach towards Muslim
communities in international politics was challenged, as well as the notion of singular identities that his
theory perpetuates. Through a logit regression analysis utilizing the Pew 2007 Global Attitudes Project,
the impact of the media, domestic conditions, policy preferences, culture, religion and various cultural
attributes were analyzed. To put it simply, those who are “most like us” also “like us most.” The results
generally supported pre-existing literature that Muslim communities tend to have less favorable views
towards the United States; the analyses utilizing cultural attributes also supported the notion that those
countries with “Muslim” cultural traits tend to be less favorable towards the United States. But these
cultural traits are inherently faulty top-down constructs, which fail to capture the extensive variability
from individual to individual within a country. Religion alone is not a sufficient determinant of negative
opinions towards the United States; a host of other factors including type of media consumed, whether
the environment is a policy priority, the level of domestic “freedom,” age and education level all were
associated with negative perceptions of the United States.
Given these results, United States public diplomacy programs should not target Muslim
communities, but should aim to foster those values which America heralds, including media openness,
free and fair government, strong education, active business and entertainment communities and
democracy. Policies should aim to create educated, informed citizens both at home and abroad who
can engage respectfully in debates which capitalize on the “multiple identities” approach theorized by
Amartya Sen.

66
APPENDIX
Exhibit 1: List of Pew 2007 Countries by Freedom House Rating
Partially Free (n= 15) Kenya Tanzania Bangladesh Ethiopia Jordan Kuwait Lebanon Malaysia Morocco Nigeria Palestine Turkey Uganda Bolivia Venezuela
Not Free (N=5) Egypt Ivory Coast Pakistan China Russia

67
Exhibit 2: “Summary of Cultural Indicators”
Measure of Culture
Type of Measurement
# of Observations Overlap w/
Pew
Culture is Static or
Dynamic?
Year Surveyed
Key Indicators
Huntington Nominal 47 Static 1993 African, Islamic, Hindu, Japanese, Sino/Confucian, Slavic/Orthodox and Western
Hofstede Scale
39 Static 1980, 1983,
Individualism, Power Distance, Uncertainty Avoidance, Masculine/ Feminine/ Long-Term Orientation
Inglehart/Welzel Nominal & Scale
40 Dynamic 1981, 1990, 1995, 2000, 2006
Traditional, Rational, Survival, Self-Expression
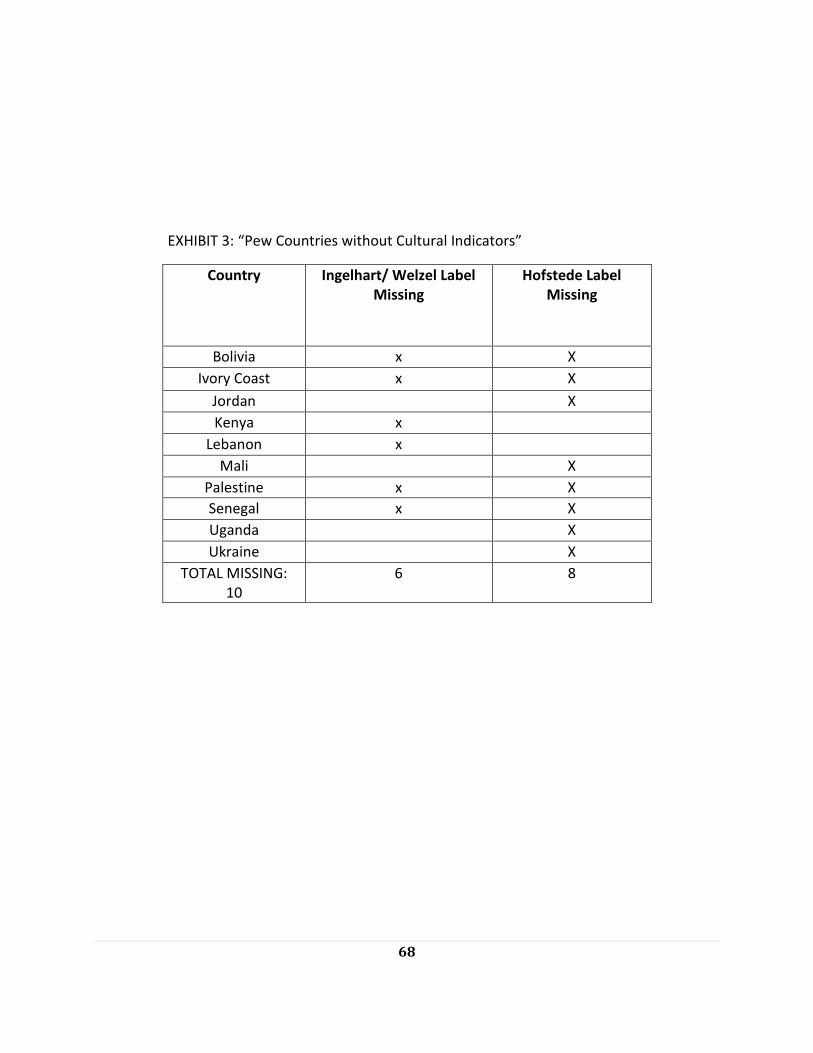
68
EXHIBIT 3: “Pew Countries without Cultural Indicators”
Country Ingelhart/ Welzel Label Missing
Hofstede Label Missing
Bolivia x X
Ivory Coast x X
Jordan X
Kenya x
Lebanon x
Mali X
Palestine x X
Senegal x X
Uganda X
Ukraine X
TOTAL MISSING: 10
6 8
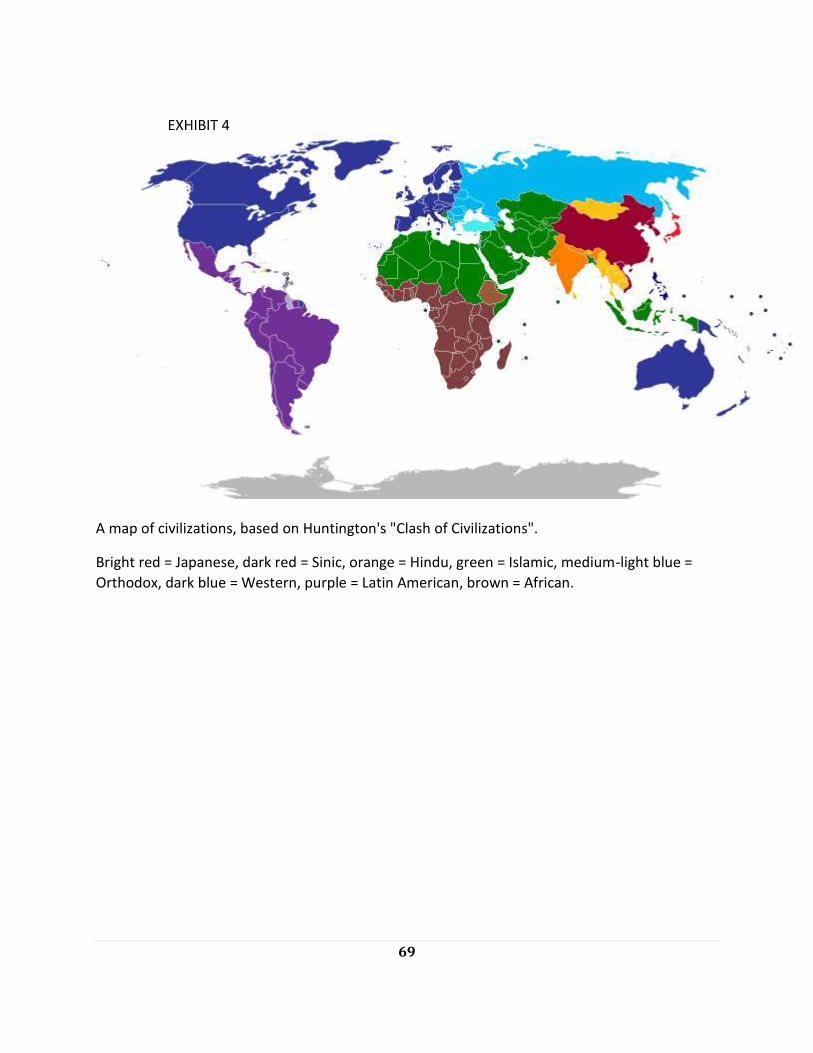
69
EXHIBIT 4
A map of civilizations, based on Huntington's "Clash of Civilizations".
Bright red = Japanese, dark red = Sinic, orange = Hindu, green = Islamic, medium-light blue =
Orthodox, dark blue = Western, purple = Latin American, brown = African.

70
Exhibit 6: New Favorability Variable FavUSDummy Using Collapsed Categories

71
Exhibit 7: Religion Variables Re-coded
Christianity:
Jehovah’s Witness
Protestant
Catholic
Adventist
Orthodox
Mormon
Pentecostal
Presbyterian
Czech Unity of Brethren
Chinese:
All respondents from China
Other:
Afro-Brazilian
Sikh
Hindu
Wiccan
Scientologist
Animist
Shinto
Zionist

72
Exhibit 8: Regression Model Diagnostics; Hypothesis I-IV
I. Hypothesis I: Religion
Variable VIF Square
Root VIF Tolerance
R-Squared
med_news1paper 1.46 1.21 0.6846 0.3154
med_news1tv 1.66 1.29 0.6027 0.3973
med_news1mag 1.03 1.01 0.9745 0.0255
med_news1internet 1.26 1.12 0.7949 0.2051
med_news1other 1.03 1.01 0.9742 0.0258
pol_nuclear 1.08 1.04 0.923 0.077
pol_enviro 1.13 1.06 0.8863 0.1137
pol_staycourseiraq 2.7 1.64 0.3704 0.6296
pol_staycourseafg 2.7 1.64 0.37 0.63
pol_prowarterror 1.45 1.21 0.6877 0.3123
sg_not_free 1.07 1.04 0.9329 0.0671
sg_satiscountry 1.04 1.02 0.9619 0.0381
sg_employ 1.17 1.08 0.8511 0.1489
sg_discontent 1.04 1.02 0.9637 0.0363
cult_amricnztngd 1.43 1.2 0.6993 0.3007
cult_likedemcrcy 1.55 1.24 0.6456 0.3544
cult_likeambiz 1.45 1.2 0.6917 0.3083
cult_likeampopcltr 1.34 1.16 0.7462 0.2538
cult_likeamscitech 1.23 1.11 0.8145 0.1855
cult_menpol 3.11 1.76 0.3218 0.6782
cult_women_menpol 3.03 1.74 0.3303 0.6697
cult_fammarr 1.19 1.09 0.842 0.158
cult_bothmarr 1.15 1.07 0.8706 0.1294
indv_female 1.17 1.08 0.8513 0.1487
indv_age 1.1 1.05 0.9065 0.0935
indv_travelus 1.1 1.05 0.9104 0.0896
indv_friendsus 1.1 1.05 0.9099 0.0901
indv_poverty 1.06 1.03 0.943 0.057
indv_univeduc 1.14 1.07 0.8773 0.1227
weight 1.04 1.02 0.9644 0.0356
relig_norelig 1.1 1.05 0.9106 0.0894
relig_Christian 1.46 1.21 0.6846 0.3154
relig_Buddhism 1.02 1.01 0.9852 0.0148
relig_Hindu 1.1 1.05 0.9126 0.0874
relig_Other 1.05 1.03 0.9514 0.0486
Mean VIF 1.39

73

74
Hypothesis II: Huntington
Variable VIF Square Root VIF
Tolerance R-Squared
med_news1paper 1.5 1.22 0.6675 0.3325
med_news1tv 1.76 1.33 0.569 0.431
med_news1mag 1.03 1.01 0.975 0.025
med_news1internet 1.28 1.13 0.7783 0.2217
med_news1other 1.03 1.01 0.9735 0.0265
pol_nuclear 1.09 1.05 0.9137 0.0863
pol_enviro 1.18 1.09 0.8493 0.1507
pol_staycourseiraq 2.74 1.65 0.3656 0.6344
pol_staycourseafg 2.75 1.66 0.3636 0.6364
pol_prowarterror 1.43 1.2 0.6985 0.3015
sg_not_free 1.15 1.07 0.8705 0.1295
sg_satiscountry 1.05 1.02 0.9554 0.0446
sg_employ 1.16 1.08 0.8588 0.1412
sg_discontent 1.04 1.02 0.9588 0.0412
cult_amricnztngd 1.41 1.19 0.7069 0.2931
cult_likedemcrcy 1.57 1.25 0.6364 0.3636
cult_likeambiz 1.48 1.21 0.6777 0.3223
cult_likeampopcltr 1.34 1.16 0.7474 0.2526
cult_likeamscitech 1.25 1.12 0.8031 0.1969
cult_menpol 3.11 1.76 0.3211 0.6789
cult_women_menpol 3.05 1.75 0.3278 0.6722
cult_fammarr 1.18 1.08 0.8497 0.1503
cult_bothmarr 1.15 1.07 0.8675 0.1325
indv_female 1.18 1.09 0.8477 0.1523

75
indv_age 1.12 1.06 0.8938 0.1062
indv_travelus 1.11 1.05 0.8999 0.1001
indv_friendsus 1.12 1.06 0.8942 0.1058
indv_poverty 1.07 1.03 0.9368 0.0632
indv_univeduc 1.15 1.07 0.8714 0.1286
weight 1.03 1.02 0.9672 0.0328
hunt_western 1.08 1.04 0.9269 0.0731
hunt_slavic 1.08 1.04 0.9302 0.0698
hunt_latin 1.49 1.22 0.6708 0.3292
hunt_hindu 1.1 1.05 0.9125 0.0875
hunt_afr 1.19 1.09 0.8371 0.1629
Mean VIF 1.41

76
II. Hypothesis III: Hofstede
Variable VIF Square Root VIF
Tolerance R-Squared
dep_favusdummy 1.42 1.19 0.7066 0.2934
med_news1paper 1.57 1.25 0.6378 0.3622
med_news1tv 1.82 1.35 0.5482 0.4518
med_news1mag 1.04 1.02 0.9578 0.0422
med_news1internet 1.36 1.17 0.735 0.265
pol_nuclear 1.13 1.06 0.8826 0.1174
pol_enviro 1.26 1.12 0.7908 0.2092
pol_staycourseiraq 3.27 1.81 0.3058 0.6942
pol_staycourseafg 3.24 1.8 0.3088 0.6912
pol_prowarterror 1.51 1.23 0.6602 0.3398
sg_satiscountry 1.21 1.1 0.8247 0.1753
sg_employ 1.17 1.08 0.8564 0.1436
sg_discontent 1.06 1.03 0.9429 0.0571
cult_amricnztngd 1.46 1.21 0.6839 0.3161
cult_likedemcrcy 1.76 1.33 0.5686 0.4314
cult_likeambiz 1.66 1.29 0.6038 0.3962
cult_likeampopcltr 1.49 1.22 0.6704 0.3296
cult_likeamscitech 1.23 1.11 0.8154 0.1846
cult_menpol 3.06 1.75 0.3268 0.6732
cult_women_menpol 2.91 1.71 0.3435 0.6565
cult_fammarr 1.4 1.18 0.7157 0.2843
cult_bothmarr 1.37 1.17 0.73 0.27
indv_female 1.21 1.1 0.8286 0.1714
indv_age 1.19 1.09 0.8389 0.1611
indv_travelus 1.06 1.03 0.9418 0.0582
indv_poverty 1.07 1.03 0.9366 0.0634
indv_univeduc 1.25 1.12 0.7997 0.2003
indv_friendsus 1.13 1.06 0.8866 0.1134
weight 1.18 1.08 0.8496 0.1504
hof_pdi 8.94 2.99 0.1119 0.8881
hof_idv 9.3 3.05 0.1075 0.8925
hof_mas 14.59 3.82 0.0686 0.9314
hof_uai 2.93 1.71 0.3413 0.6587
hof_lto 2.39 1.54 0.4191 0.5809
Mean VIF 2.46

77
III. Hypothesis IV: Ingelhart/ Welzel
Variable VIF Square Root VIF
Tolerance R-
Squared
med_news1paper 1.55 1.25 0.6446 0.3554
med_news1tv 1.76 1.33 0.5691 0.4309
med_news1mag 1.04 1.02 0.9649 0.0351
med_news1internet 1.27 1.13 0.7876 0.2124
med_news1other 1.02 1.01 0.9783 0.0217
pol_nuclear 1.08 1.04 0.9244 0.0756
pol_enviro 1.13 1.06 0.8834 0.1166
pol_staycourseiraq 2.76 1.66 0.3623 0.6377
pol_staycourseafg 2.72 1.65 0.3677 0.6323
pol_prowarterror 1.4 1.18 0.7149 0.2851
sg_not_free 1.25 1.12 0.7991 0.2009
sg_satiscountry 1.07 1.03 0.9366 0.0634
sg_employ 1.17 1.08 0.8517 0.1483
sg_discontent 1.03 1.02 0.9678 0.0322
cult_amricnztngd 1.42 1.19 0.7064 0.2936
cult_likedemcrcy 1.57 1.25 0.6373 0.3627
cult_likeambiz 1.49 1.22 0.6695 0.3305
cult_likeampopcltr 1.36 1.17 0.7366 0.2634
cult_likeamscitech 1.26 1.12 0.7951 0.2049
cult_menpol 3.48 1.86 0.2877 0.7123
cult_women_menpol 3.4 1.84 0.294 0.706
cult_fammarr 1.28 1.13 0.7816 0.2184
cult_bothmarr 1.15 1.07 0.8661 0.1339
indv_female 1.2 1.09 0.8355 0.1645
indv_age 1.12 1.06 0.8925 0.1075
indv_travelus 1.13 1.06 0.8831 0.1169
indv_friendsus 1.18 1.09 0.8492 0.1508
indv_poverty 1.06 1.03 0.9434 0.0566
indv_univeduc 1.11 1.05 0.8991 0.1009
weight 1.03 1.01 0.9747 0.0253
iw_tradrat_values 1.29 1.14 0.7728 0.2272
iw_survself_values 1.51 1.23 0.6631 0.3369
Mean VIF 1.48

78
Exhibit 9: Model III Regressions: Hofstede With and Without Friends in the U.S. Variable Type Variable List (3a) (3b)
Hofstede Hofstede w/o Friends
U.S.
Dependent Favorability
Towards U.S.
Media med_news1pape
r 0.639 0.902
(0.165) (0.117)
Media med_news1tv 0.642* 0.867 (0.117) (0.078)
Media med_news1mag 0.412 1.366 (0.401) (0.680)
Media med_news1inter
net 0.511 0.569*
(0.189) (0.137)
Media med_news1other 1.464 (0.832)
Policy pol_enviro 1.226 0.992 (0.203) (0.073)
Policy pol_staycourseir
aq 2.446*** 1.253**
(0.661) (0.097)
Policy pol_staycourseaf
g 1.322 1.533***
(0.321) (0.189)
Policy pol_prowarterror 2.208*** 1.306* (0.328) (0.152)
Policy pol_nuclear 1.138 2.114*** (0.167) (0.156)
Scapegoat sg_not_free
Scapegoat sg_satiscountry 1.249 1.517*** (0.190) (0.111)
Scapegoat sg_employ 1.075 1.026 (0.160) (0.074)
Scapegoat sg_discontent 1.048 1.019
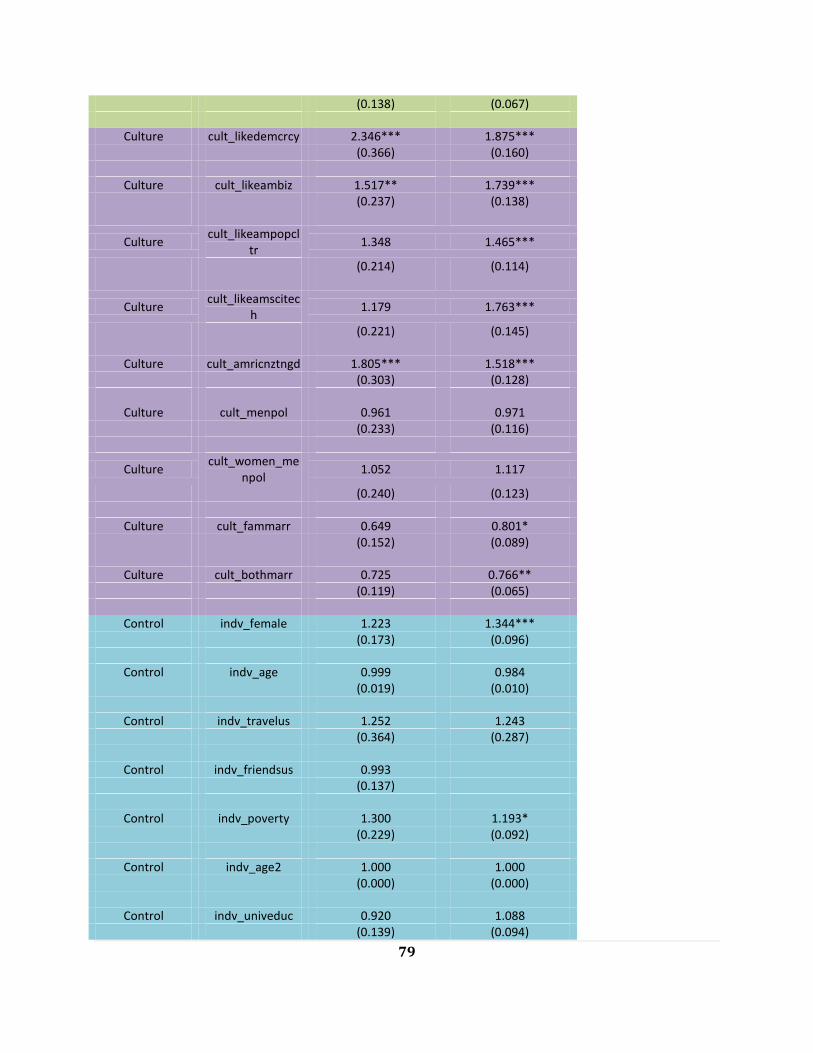
79
(0.138) (0.067)
Culture cult_likedemcrcy 2.346*** 1.875*** (0.366) (0.160)
Culture cult_likeambiz 1.517** 1.739*** (0.237) (0.138)
Culture cult_likeampopcl
tr 1.348 1.465***
(0.214) (0.114)
Culture cult_likeamscitec
h 1.179 1.763***
(0.221) (0.145)
Culture cult_amricnztngd 1.805*** 1.518*** (0.303) (0.128)
Culture cult_menpol 0.961 0.971 (0.233) (0.116)
Culture cult_women_me
npol 1.052 1.117
(0.240) (0.123)
Culture cult_fammarr 0.649 0.801* (0.152) (0.089)
Culture cult_bothmarr 0.725 0.766** (0.119) (0.065)
Control indv_female 1.223 1.344*** (0.173) (0.096)
Control indv_age 0.999 0.984 (0.019) (0.010)
Control indv_travelus 1.252 1.243 (0.364) (0.287)
Control indv_friendsus 0.993 (0.137)
Control indv_poverty 1.300 1.193* (0.229) (0.092)
Control indv_age2 1.000 1.000 (0.000) (0.000)
Control indv_univeduc 0.920 1.088 (0.139) (0.094)
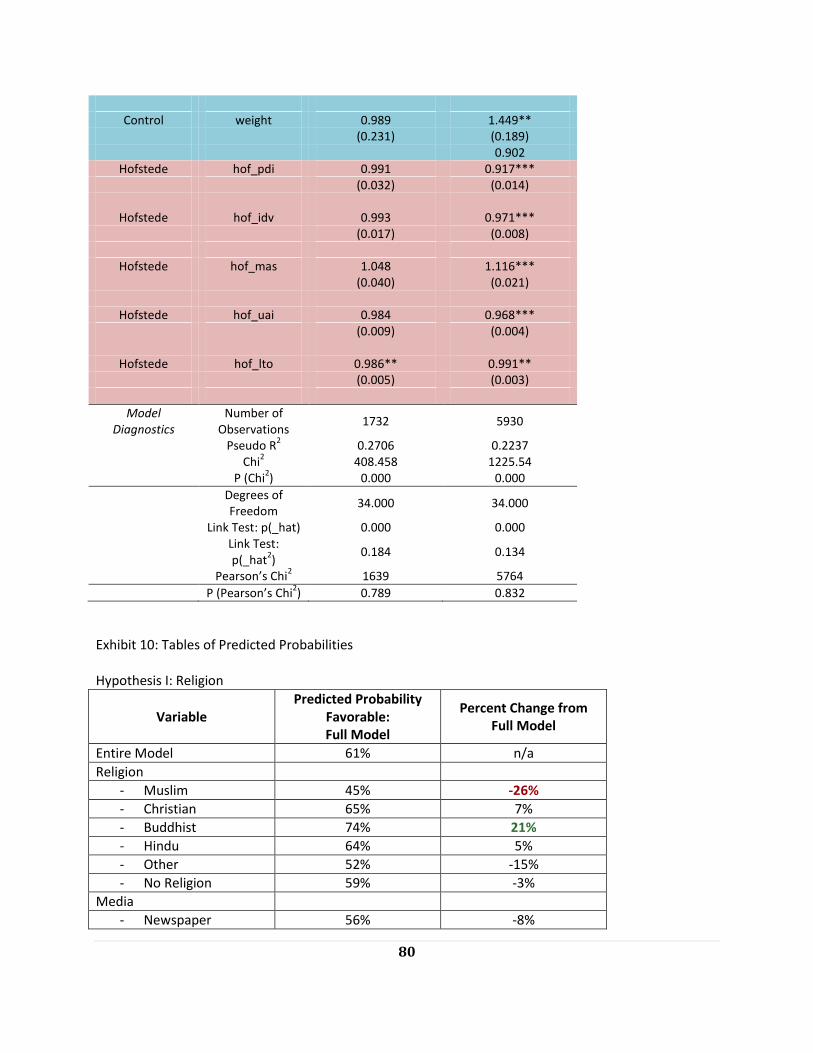
80
Control weight 0.989 1.449**
(0.231) (0.189) 0.902
Hofstede hof_pdi 0.991 0.917*** (0.032) (0.014)
Hofstede hof_idv 0.993 0.971*** (0.017) (0.008)
Hofstede hof_mas 1.048 1.116*** (0.040) (0.021)
Hofstede hof_uai 0.984 0.968*** (0.009) (0.004)
Hofstede hof_lto 0.986** 0.991** (0.005) (0.003)
Model Diagnostics
Number of Observations
1732 5930
Pseudo R2 0.2706 0.2237
Chi2 408.458 1225.54
P (Chi2) 0.000 0.000
Degrees of Freedom
34.000 34.000
Link Test: p(_hat) 0.000 0.000
Link Test: p(_hat
2)
0.184 0.134
Pearson’s Chi2 1639 5764
P (Pearson’s Chi2) 0.789 0.832
Exhibit 10: Tables of Predicted Probabilities Hypothesis I: Religion
Variable Predicted Probability
Favorable: Full Model
Percent Change from Full Model
Entire Model 61% n/a
Religion
- Muslim 45% -26%
- Christian 65% 7%
- Buddhist 74% 21%
- Hindu 64% 5%
- Other 52% -15%
- No Religion 59% -3%
Media
- Newspaper 56% -8%

81
- Television 55% -10%
- Magazines 41% -33%
- Internet 49% -20%
- Radio 66% 8%
- Other 41% -33%
Policy Priority
- Nuclear Non-Prolif 55% -10%
- Environment 52% -15%
- Pro War Iraq 66% 8%
- Pro War Afghanistan 63% 3%
- Pro War Terror 69% 13%
Scapegoat
- “Not Free” 48% -21%
- Satisfied w/ Country 58% -5%
- Employed 56% -8%
- Discontent w/ present situation
56% -8%
Culture
- Globalization Good 64% 5%
- Like American Democracy
56% -8%
- Like American Business
53% -13%
- Like American TV/Movies
49% -20%
- Like American S & T 50% -18%
- Women Good Political Leaders
57% -7%
- Men Good Political Leaders
56% -8%
- Women & Men Good Leaders
55% -10%
- Woman Should Choose who Marries
57% -7%
- Family Should Choose who Marries
55% -10%
- Both Woman & Family Should Choose who Marries
54% -11%
Control
- In Poverty 53% -13%
- Traveled to the US 59% -3%
- Female 50% -18%
- Age 56% -8%
- Friends in US 52% -15%

82
- Some University 44%
Hypothesis II: Huntington
Variable Predicted Probability
Entire Model 61.0%
Huntington
- Muslim 57.7%
- Western 71.1%
- Slavic/Orthodox 71.7%
- Latin American 63.1%
- Hindu 73.5%
- African 68.9%
Control
- Female 61.3%
- Woman Chooses Who she Marries
60.4%
- Family Chooses 55.6%
- Both Choose 55.5%
Hypothesis III: Hofstede
Variable Mean Low High
Entire Model 72.6%
Hofstede
- Power Distance 84.4% 57.4%
- Individualism 78.8% 53.6%
- Masculinity 52.6% 93.0%
- Uncertainty Avoidance
81.5% 43.5%
- Long-Term Orientation
76.4% 67.2%
Hypothesis IV: Ingelhart/ Welzel
Variable Predicted Probability Low High
Entire Model 59.0%
Ingelhart/ Welzel
- Traditional/Rational 53.6% 73.2%
- Survival/Self 43.8% 67.6%

83
Predicted Probabilities: Muslim Religion & Culture Sub-Sample
Variable
Predicted Probability Favorable:
Self-Reported Muslims
Percent Point Change from
Full Model
Predicted Probability Favorable:
Huntington’s Muslims
Percent Point Change from
Full Model
Muslim Sub-Sample 40% 58%
Media
- Newspaper 37% 8% 48% -17%
- Television 30% -25% 46% -21%
- Magazines 13% -68% 25% -57%
- Internet 22% -45% 40% -31%
- Radio 41% 2% 57% -2%
- Other 14% -65% 32% -45%
Policy Priority
- Nuclear Non-Prolif 31% -23% 47% -19%
- Environment 25% -38% 39% -33%
- Pro War Iraq 41% 2% 57% -2%
- Pro War Afghanistan
42% 5% 56% -3%
- Pro War Terror 54% 35% 68% 17%
Scapegoat
- “Not Free” 22% -45% 39% -33%
- Satisfied w/ Country
35% -13% 50% -14%
- Employed 31% -23% 48% -17%
- Discontent w/ present situation
30% -25% 47% -19%
Culture
- Globalization Good
51% 28% 69% 19%
- Like American Democracy
38% -5% 54% -7%
- Like American Business
33% -18% 51% -12%
- Like American TV/Movies
32% -20% 52% -10%
- Like American S & T
33% -18% 49% -16%
- Women Good Political Leaders
30% -25% 51% -12%
- Men Good Political Leaders
30% -25% 44% -24%
- Women & Men Good Leaders
30% -25% 49% -16%

84
- Woman Should Choose who Marries
32% -20% 49% -16%
- Family Should Choose who Marries
30% -25% 45% -22%
- Both Woman & Family Should Choose who Marries
28% -30% 45% -22%
Control
- In Poverty 31% -23% 47% -19%
- Traveled to the US 30% -25% 47% -19%
- Female 32% -20% 50% -14%
- Age 38% -5% 52% -10%
- Friends in US 37% -8% 52% -10%
- Some University 26% -35% 42% -28%

85
Exhibit 11: Regression Results of Four Hypotheses on Favorability Towards the United States Utilizing “Religiosity” Variable
Variable Type Variable LIst (1) (2) (3) (4) Religion Huntington Hofstede Ingelhart/Welzel
Dependent Favorability Towards the US Indicator
Media Primary News Source Newspaper
0.554*** 0.601** 0.767 0.571**
(-3.36) (-3.00) (-1.68) (-2.90)
Media Primary News Source TV 0.704** 0.811 0.888 0.799 (-2.69) (-1.59) (-0.95) (-1.45)
Media Primary News Source Magazines
0.917 0.867 1.151 0.758
(-0.12) (-0.18) (0.26) (-0.35)
Media Primary News Source Internet
0.578* 0.620* 0.537* 0.553*
(-2.46) (-2.18) (-2.45) (-2.37)
Media Primary News Source Other 1.061 1.750 1.735 1.604 (0.10) (0.98) (0.51) (0.77)
Policy Nuclear Weapons Policy Priority
0.890 0.889 1.007 0.828
(-1.25) (-1.31) (0.08) (-1.81)
Policy Environment Policy Priority 0.888 0.928 1.293** 0.983 (-1.24) (-0.80) (2.80) (-0.16)
Policy Keep Troops in Iraq 1.763** 1.767** 1.246 1.954** (3.08) (3.09) (1.64) (3.14)
Policy Keep Troops in Afghanistan 1.237 1.115 1.221 1.168

86
(1.25) (0.64) (1.55) (0.79)
Policy Favor US-led efforts to fight terrorism
2.101*** 2.203*** 1.788*** 2.208***
(7.66) (8.51) (6.74) (7.30)
Scapegoat Not Free Freedom House Scale
0.920 0.710 0.281***
(-0.53) (-1.92) (-3.81)
Scapegoat Satisified with Country 0.936 0.920 1.427*** 0.922 (-0.67) (-0.89) (4.07) (-0.74)
Scapegoat Employed Indicator 1.162 1.145 1.008 1.274* (1.59) (1.49) (0.09) (2.32)
Scapegoat Discontent Indicator 1.070 1.135 1.122 1.089 (0.75) (1.47) (1.43) (0.86)
Culture It's Good that American Ideas & Culture Spread Here
2.034*** 1.983*** 1.593*** 1.960***
(6.63) (6.50) (4.64) (5.33)
Culture I like American Democracy 2.064*** 1.968*** 1.850*** 2.091*** (6.93) (6.69) (6.37) (6.29)
Culture I like American way of Business
1.951*** 1.868*** 1.422*** 1.800***
(6.41) (6.20) (3.64) (5.05)
Culture I like American Movies Music and TV
1.101 1.142 1.565*** 1.094
(0.96) (1.35) (4.65) (0.80)
Culture I like American Science & Technology
1.363** 1.426** 1.556*** 1.404**
(2.59) (3.07) (4.37) (2.68)

87
Culture Men Better Political Leaders 1.090 1.070 1.151 1.630*
(0.52) (0.42) (0.98) (2.53)
Culture Women & Men are Equal Political Leaders
0.940 1.012 1.092 1.303
(-0.43) (0.09) (0.73) (1.57)
Culture Family Should Choose Who a Woman Marries
1.018 0.896 1.294 0.724
(0.09) (-0.56) (1.61) (-1.42)
Culture Both Women & Family Should Choose Who Marry
1.112 0.998 1.084 0.855
(0.89) (-0.02) (0.73) (-1.14)
Control Female Dummy Variable 1.186 1.248* 1.307** 1.416** (1.81) (2.41) (3.01) (3.22)
Control Age 0.991** 0.992** 0.990*** 0.994 (-2.88) (-2.75) (-3.39) (-1.71)
Control Have Travelled to the US 1.423* 1.538** 1.238 1.649** (2.18) (2.82) (0.80) (2.93)
Control Have Friends in the US 1.133 1.215* 1.189 (1.38) (2.20) (1.66)
Control No Money for Food, Health, Clothes
0.797* 0.806* 1.322** 0.818
(-2.12) (-2.12) (2.77) (-1.66)
Control Some Univ Education 0.877 0.892 1.155 0.921 (-1.36) (-1.23) (1.44) (-0.75)
Control weighting factor 0.696** 0.732* 1.216 0.944 (-2.68) (-2.21) (1.37) (-0.35)

88
Religiosity Prays At Least Once/ Day 1.320** 1.356*** 1.370*** 1.149
(3.03) (3.40) (3.34) (1.35)
Religion No Religion 1.591 (1.51)
Religion Christian 1.801* (2.31)
Religion Buddhist 2.989 (1.87)
Religion Hindu 1.531 (1.29)
Religion Other 1.078 (0.23)
Huntington Western 0.919 (-0.35)
Huntington Slavic/Orthodox 0.785 (-0.87)
Huntington Latin American 0.564*** (-4.07)
Huntington Hindu 0.772 (-1.09)
Huntington African 0.810 (-1.27)
Hofstede Power Distance 0.999 (-0.04)

89
Hofstede Individualism 1.017 (0.90)
Hofstede Masculinity 0.995 (-0.13)
Hofstede Uncertainty Avoidance 0.988* (-1.98)
Hofstede Long Term Orientation 0.973*** (-6.54)
I/W Trad/Rat_Values 0.775* (-2.33)
I/W Surv/Self_Values 0.642* (-2.56)
Model Diagnostics Observations 3539 3849 4392 2746 r2_p 0.2393 0.2545 0.2267 0.2606 Likelihood Ratio Chi2 1033.45 1207.68 1177.62 917.61 P(chi2) 0.000 0.000 0.000 0.000 df_m 36.000 36.000 34.000 33.000 Link test p(_hat) 0.000 0.000 0.000 0.000 Link test p(_hat2) 0.590 0.857 0.003 0.802 P(Pearson’s chi2) .4239 .4498 .9465 .2348 F-Test Religiosity variables .0024 .0007 .0008 0.1773

90
REFERENCES
Acevedo, G. (2008). Islamic Fatalism and the Clash of Civilizations: An appriasal of a contentious and
dubious theory. Social Forces , 1711-1731.
Baumgartner, J. &. (2008). A Clash of Civilizations: The influence of religion on public opinion of U.S.
foreign policy in the Middle East. Political Research Quarterly , 171-179.
BBC Religion. (2005, September 27). Hinduism: Worship. Retrieved April 10, 2010, from BBC Religion:
http://www.bbc.co.uk/religion/religions/hinduism/worship/worship.shtml
BBC Religion. (2009, September 8). Islam:Salat: Daily Prayers. Retrieved April 10, 2010, from BBC
Religion: http://www.bbc.co.uk/religion/religions/islam/practices/salat.shtml
Burmann, C., Zeplin, S., & Riley, N. (2009). Key Determinants of Internal Brand Management Success: An
Exploratory Empirical Analysis. Brand Management , 264-284.
Bush, G.W. (2005, October 6). President Discusses War on Terror at National Endowment for
Democracy. Washington, DC, United States.
Carlson, M., & Nelson, T. (2008). Anti-Americanism in Asia? Factors Shaping international perceptons of
American influence. International Relations of the Asia Pacific , 303-324.
Chiozza, G. (2004). Love and Hate: Anti-Americanism in the Islamic World. New York: Department of
Politics, New York University.
Cowan, G., & Arsenault, A. (2008). Moving from Monologue to Dialogue to Collaboration: The Three
Layers of Public Diplomacy. Annals of the American Academy of Political and Social Science , 10-30.
Djerjian, E. (2003). Changing Minds and Winning Peace: A New Strategic Direction for U.S. Public
Diplomacy. Washington, DC: U.S. House of Representatives.
Dutta-Bergman. (2006). U.S. Public Diplomacy in the Middle East: A Critical Cultural Approach. Journal of
Communication Inquiry , 102-124.
Furia, P., & Lucas, R. (2006). Determinants of Arab Public Opinion on Foreign Relations. International
Studies Quarterly , 585-605.
Gallup Poll Editorial Staff. (2002, March 12). Poll of the Islamic World: Perceptions of Western Culture.
Retrieved October 1, 2009, from Gallup: http://www.gallup.com/poll/5458/Poll-Islamic-World-
Perceptions-Western-Culture.aspx
Goldsmith, B. &. (2008, August 1). Spinning the Globe? U.S. Public Diplomacy and Foreign Public
Opinion. Working Paper . Sydney, Australia.
Government Accountability Office. (2006). State Department Efforts to Engage Muslim Audiences Lack
Certain Communication Elements and Face Significant Challenges. Washington, DC: GAO.

91
Graham, S. E. (2008). US public diplomacy in the Asia Pacific. Place Branding and Public Diplomacy , 336-
356.
Heiman, B. &. (2007). The Failure of U.S. Public Diplomacy: Structural and Institutional Elements.
Working Paper . San Francisco, California, United States: San Francisco State University.
Hofstede, G. (1998). Cultural Consequences on the Quality of Life Concept. In G. Weaver, Culture,
Communication and Conflict (pp. 148-158). Needham Heights, MA: Simon & Schuster.
Hofstede, G. (1998). The Cultural Relativity of the Quality of Life Concept. In G. Weaver, Culture,
Communication and Conflict: readings in intercultural relations (pp. 148-158). Needham Heights: Simon
& Schuster Publishing.
Inglehart, R. (2009). Ingelhart Welzel Cultural Map of the World. Retrieved October 5, 2009, from World
Values Survey: http://www.worldvaluessurvey.org/
ITIM International. (2009). Geert Hofstede Cultural Indicators. Retrieved October 2009, from ITIM
International: http://www.geert-hofstede.com/
Kiernan, P. (2007, March 2nd). Middle East Opinion: Iran Fears Aren't Hitting the Arab Streets. Retrieved
October 1, 2009, from Zogby International: http://www.zogby.com/SoundBites/readclips.cfm?ID=14570
MacNulty, C. (2009, October 13th). Co-Founder Applied Futures Incorporated. (J. Brown, Interviewer)
Nisbet, C. (2005). Shaping the Islamic Threat: The Influence of ideology, religiosity and media use on U.S.
public opinion toward Islam and Muslim Americans. (pp. 1-5). Department of Communication, Indiana
University.
Nisbet, E., Nisbet, M., & Scheufele, D. &. (2004). Public Diplomacy, Television News and Muslim Opinion.
Press & Politics , 11-37.
Office of the Under Secretary for Public Diplomacy and Public Affairs. (2010, February 26th). Public
Diplomacy: Strengthening U.S. Engagement with the World. Retrieved March 22, 2010, from USC Public
Diplomacy: http://uscpublicdiplomacy.org/pdfs/PD_US_World_Engagement.pdf
Religion Facts. (2009). Salat: Prayer. Retrieved April 10, 2010, from Religion Facts:
http://www.religionfacts.com/islam/practices/salat-prayer.htm
Schneider, S., & Barsoux, J.-L. (2003). Managing Across Cultures. Edinburg, Harlow, Essex: Prentice Hall.
Sen, A. (2006). Identity and Violence: The Illusion of Destiny. Norton.
Sha, B.-L. (2006). Cultural Identity in the Segmentation of Publics: An Emerging Theory of Intercultural
Public Relations. Journal of Public Relations Research , 45-65.
State Department. (2009). Under Secretary for Public Diplomacy and Public Affairs. Retrieved October
1st, 2009, from State.gov: http://www.state.gov/r/index.htm
92
Straker, D. (2006, July 2nd). Hall's Cultural Factors. Retrieved October 15, 2009, from Changing Minds:
http://changingminds.org/explanations/culture/hall_culture.htm
Strobel, W. P. (1996, May). The CNN Effect. Retrieved May 2009, from American Journalism Review:
http://www.ajr.org
Tessler, M. (2003). Arab and Muslim Political Attitudes: Stereotypes and Evidence from Survey Research.
International Studies Perspectives , 175-181.
The Anholt-GfK Roper Nation Brands Index. (2009). Retrieved October 2009, from GfK Custom Research
North America: http://www.gfkamerica.com/practice_areas/roper_pam/nbi_index/index.en.html/
Tuggle, R. (2005). Responsive Diplomacy. Washington, DC: Georgetown University Thesis Practicum.
University of Maryland/ Zogby International. (2009, May 19). 2009 Annual Arab Public Opinion Survey.
Washington, DC, United States.
Yun, S. H.-N. (2008). Soft Power: From Ethnic Attraction to National Attraction in Sociological Globalism.
International Journal of Intercultural Relations , 565-577.
Yun, S.-H. (2008). Cultural Consequences on Excellence in Public Diplomacy. Journal of Public Relations
Research , 207-230.
Zaharna, R. (2007). The Soft Power Differential: Network Communication and Mass Communication in
Public Diplomacy. The Hague Journal of Diplomacy , 213-228.


![[Burke] Relationships Among Multiple Identities(Bookos.org)](https://static.fdocuments.net/doc/165x107/577cc4fa1a28aba7119ae51f/burke-relationships-among-multiple-identitiesbookosorg.jpg)